dear author, please, note that changes made to the html...
TRANSCRIPT
Dear Author, Please, note that changes made to the HTML content will be added to the article before publication, but are not reflected in this PDF. Note also that this file should not be used for submitting corrections.
Our reference: YJEMA 4776 P-authorquery-v9
AUTHOR QUERY FORM
Journal: YJEMA
Article Number: 4776
Please e-mail your responses and any corrections to:
E-mail: [email protected]
Dear Author,
Please check your proof carefully and mark all corrections at the appropriate place in the proof (e.g., by using on-screen
annotation in the PDF file) or compile them in a separate list. Note: if you opt to annotate the file with software other than
Adobe Reader then please also highlight the appropriate place in the PDF file. To ensure fast publication of your paper please
return your corrections within 48 hours.
For correction or revision of any artwork, please consult http://www.elsevier.com/artworkinstructions.
Any queries or remarks that have arisen during the processing of your manuscript are listed below and highlighted by flags in
the proof.
Location
in articleQuery / Remark: Click on the Q link to find the query’s location in text
Please insert your reply or correction at the corresponding line in the proof
Q1 The country name has been inserted for the affiliation a. Please check, and correct if necessary.
Q2 Ref(s). Spalding, 2012; Aboudh, 2002 are cited in the text but not provided in the reference list. Please
provide it/them in the reference list or delete these citations from the text.
Q3 The citations ‘Emerton, 2012; Tychsen, Geertz-hansen, & Schjøth (2008)’ have been changed to match the
author name/date in the reference list. Please check here and in subsequent occurrences, and correct if
necessary.
Q4 Please check the hierarchy of the headings and sub-headings.
Q5 Please provide the grant number for ‘Department for International Development; Economic and Social
Research Council; Natural Environment Research Council; UK Department for International
Development; Netherlands Directorate-General for International Cooperation’ if any.
Q6 Uncited references: This section comprises references that occur in the reference list but not in the body of
the text. Please position each reference in the text or, alternatively, delete it. Any reference not dealt with
will be retained in this section. Thank you.
Q7 Please confirm that given names and surnames have been identified correctly.
Q8 Your article is registered as a regular item and is being processed for inclusion in a regular issue of the
journal. If this is NOT correct and your article belongs to a Special Issue/Collection please contact
[email protected] immediately prior to returning your corrections.
Q9 Supplied figure 4 has depiction of more than four colours. We have done our best to differentiate between
colours in the grayscale converted image. Please check.
(continued on next page)

Please check this box or indicate
your approval if you have no
corrections to make to the PDF file ,
Thank you for your assistance.

Highlights
� We use economic valuation to measure the value of mangrove forests in southern Kenya.� Multiple stakeholders helped develop Climate Compatible Development (CCD) scenarios.� These were compared with Business as Usual (BAU) using GIS based risk mapping.� There is a net present value >US$20 million in adoption of CCD rather than BAU.� CCD provides an integrative framework for discussion of coastal management.
Contents lists available at ScienceDirect
Journal of Environmental Management
journal homepage: www.elsevier .com/locate/ jenvman
http://dx.doi.org/10.1016/j.jenvman.2015.04.0180301-4797/© 2015 Published by Elsevier Ltd.
Journal of Environmental Management xxx (2015) 1
1234
56789
1011121314151617
YJEMA4776_grabs ■ 11 April 2015 ■ 1/1
Please cite this article in press as: Huxham, M., et al., Applying Climate Compatible Development and economic valuation to coastalmanagement: A case study of Kenya's mangrove forests, Journal of Environmental Management (2015), http://dx.doi.org/10.1016/j.jenvman.2015.04.018
Applying Climate Compatible Development and economic valuation tocoastal management: A case study of Kenya's mangrove forestsQ8
Q7 Mark Huxham a, *, Lucy Emerton b, James Kairo c, Fridah Munyi c, Hassan Abdirizak c,Tabitha Muriuki c, Fiona Nunan d, Robert A. Briers a
a School of Life, Sport and Social Sciences, Edinburgh Napier University, Edinburgh, Scotland EH11 4BN, UKQ1b Environmental Management Group, 15 Havelock Road, Colombo 5, Sri Lankac Kenya Marine and Fisheries Research Institute, PO Box 81651, Mombasa, Kenyad International Development Department, University of Birmingham, Edgbaston, Birmingham B15 2TT, UK
a r t i c l e i n f o
Article history:Received 18 January 2015Received in revised form28 March 2015Accepted 10 April 2015Available online xxx
Keywords:Climate Compatible DevelopmentEconomic valuationMangroveEcosystem serviceCoastal management
a b s t r a c t
Mangrove forests are under global pressure. Habitat destruction and degradation persist despite long-standing recognition of the important ecological functions of mangroves. Hence new approaches areneeded to help stakeholders and policy-makers achieve sound management that is informed by the bestscience. Here we explore how the new policy concept of Climate Compatible Development (CCD) can beapplied to achieve better outcomes. We use economic valuation approaches to combine socio-economicdata, projections of forest cover based on quantitative risk mapping and storyline scenario buildingexercises to articulate the economic consequences of plausible alternative future scenarios for themangrove forests of the South Kenya coast, as a case study of relevance to many other areas. Using datafrom 645 household surveys, 10 focus groups and 74 interviews conducted across four mangrove sites,and combining these with information on fish catches taken at three landing sites, a mangrove carbontrading project and published data allowed us to make a thorough (although still partial) economicvaluation of the forests. This gave a current value of the South Coast mangroves of USD 6.5 million, orUSD 1166 ha�1, with 59% of this value on average derived from regulating services. Quantitative riskmapping, projecting recent trends over the next twenty years, suggests a 43% loss of forest cover overthat time with 100% loss at the most vulnerable sites. Much of the forest lost between 1992 and 2012 hasnot been replaced by high value alternative land uses hence restoration of these areas is feasible and maynot involve large opportunity costs. We invited thirty eight stakeholders to develop plausible storylinescenarios reflecting Business as Usual (BAU) and CCD e which emphasises sustainable forest conser-vation and management e in twenty years time, drawing on local and regional expert knowledge ofrelevant policy, social trends and cultures. Combining these scenarios with the quantitative projectionsand economic baseline allowed the modelling of likely value added and costs avoided under the CCDscenario. This suggests a net present value of more than US$20 million of adoption of CCD rather thanBAU. This work adds to the economic evidence for mangrove conservation and helps to underline theimportance of new real and emerging markets, such as for REDD þ projects, in making this case forcarbon-rich coastal habitats. It demonstrates a policy tool e CCD e that can be used to engage stake-holders and help to co-ordinate policy across different sectors towards mangrove conservation.
© 2015 Published by Elsevier Ltd.
1. Introduction
Mangroves are the only woody plants to grow in the intertidalzone. They occur throughout tropical and subtropical latitudes
where they may form extensive forests, particularly in shelteredbays and deltas. Their global extent, approximately 138,000 km2
(Giri et al., 2011), is shrinking by around 0.7% per year, but thisfigure underestimates the problem since it applies only to completeremoval of the forest and does not capture forest degradation.Causes of mangrove decline include shrimp aquaculture, conver-sion for tourism and coastal infrastructure, commercial extractionof timber and extensive but persistent extraction of wood for fuel
* Corresponding author.E-mail address: [email protected] (M. Huxham).
Contents lists available at ScienceDirect
Journal of Environmental Management
journal homepage: www.elsevier .com/locate/ jenvman
http://dx.doi.org/10.1016/j.jenvman.2015.04.0180301-4797/© 2015 Published by Elsevier Ltd.
Journal of Environmental Management xxx (2015) 1e14
123456789101112131415161718192021222324252627282930313233343536373839404142434445464748495051525354
555657585960616263646566676869707172737475767778798081828384858687888990919293949596979899
100101102103104105106107108109110111112113114115116117118119
YJEMA4776_proof ■ 11 April 2015 ■ 1/14
Please cite this article in press as: Huxham, M., et al., Applying Climate Compatible Development and economic valuation to coastalmanagement: A case study of Kenya's mangrove forests, Journal of Environmental Management (2015), http://dx.doi.org/10.1016/j.jenvman.2015.04.018

and building materials. Climate change, and in particular sea levelrise, is likely to exacerbate these impacts over the next century(Gilman et al., 2008).
Many studies have documented the impressive array ofecosystem services provided by mangroves. These include provi-sioning (such as fish, timber and medicines), cultural (such asspiritual sites and tourist attractions) and regulating (such as coastalprotection and carbon sequestration). The continued destruction ofthe forests, despite their well-documented ecological value, hasbecome a cause celebre amongst conservationists and is used toillustrate irrational or short-term planning (in for example theMillennium Ecosystem Assessment: Watson et al., 2005). It is oftenargued that undervaluation, in particular, remains a persistentproblem; that the benefits associated with mangrove ecosystemservices (and conversely, the economic costs associated with theirdegradation and loss) have long tended to be omitted from theeconomic calculations that are used to inform coastal developmentdecisions (Emerton, 2006). In consequence, markets and prices failto adequately reflect ecosystemservice values, and so theyare rarelyconsidered when resource management decisions are made. Theeffects of undervaluation are also manifested at the policy level:there is a long history of economic policies which aim to stimulateproduction and growth having also hastened the process ofmangrove degradation and loss. Examples include the generous taxbreaks, import duty exemptions, export credits and preferentialloans offered to shrimp farming inmanycountries (Primavera,1997;Bailly and Willmann, 2001). The net result is that it frequently re-mains more profitable for people to engage in economic activitiesthat degrade mangroves e even if the costs and losses that arise forother groups, or to society in general, outweigh the immediate gainsto the land or resource user who is causing the damage (Spalding,2012)Q2 . At worst, in the absence of information about ecosystemvalues, substantialmisallocation of resources has occurred and goneunrecognized, and immense economic costs and ecological damagehave been incurred (James, 1991).
In response a growing literature exploring the economic value ofmangrove ecosystem services has emerged over the last two de-cades or so (see for example, Barbier et al., 2011; Dixon, 1989;Conservation International, 2008; TEEB, 2012; Wattage, 2011;UNEP-WCMC, 2011). Such studies often contain impressive fig-ures; for example Barbier et al. (2011) cite values for coastal pro-tection in Thailand in excess of US$10,000 ha�1 yr�1, 1 ha ofMexican mangroves may contribute US$37,000 yr�1 to the value oflocal fisheries (Aburto-Oropeza et al., 2008), and mangroves inBenut, Johor State in Malaysia have been estimated to generatenon-use values of almost $7500 ha�1 yr�1emore than five times asmuch as the combined value of their provisioning and regulatingservices (Bann, 1999). The authors of such work hope that byexpressing these values in monetary terms they will change howdecisions are made about land use and conservation in favour oflong-term sustainability of mangroves.
Critics of such ‘market environmentalism’ warn that it mayimply a dangerously simplistic view of ecosystems (by, for example,separating out functions and services that in reality are synergistic),reinforce existing social inequalities, detract from the ethical ormoral arguments for conserving wild nature and encourage theintrusion of market norms and psychology into inappropriatespheres of life (Kosoy and Corbera, 2010). Several authors alsocontend that there remains little evidence that providing monetaryestimates of ecosystem values has actually resulted in improvedconservation (King, 1998). Despite such concerns, we think valua-tion offers an important opportunity to improve the efficiency,equity and sustainability of land and resource management de-cisions. This is particularly true provided that uncertainties areexplicitly acknowledged, care is taken to consider the underlying
power structures that support different decisions and for goods andservices that already have clearly understood market values for thepoor but that may not have been fully assessed inways accessible topolicy makers.
However, the continued destruction of mangroves, despite theapparently compelling case made by scientific research and valu-ation studies for their conservation, points to other limitations tothe idea that a simple lack of information drives damaging changes.One missing component may be active engagement with policymakers and other stakeholders during and after the research;without this academic studies may be ignored entirely, or seen asabstruse or irrelevant. Coastal scientists are aware of the pressingneed for this engagement; a recent study identifying researchpriorities amongst scientists working in the coastal zone placed abetter understanding of policy, legal and institutional arrange-ments and how these inter-relate with management as the topglobal priority (Rudd and Lawton, 2013). A related problem is one ofcontext. Whilst it might be instructive to see estimates of totaleconomic value for an ecosystem these need to be contextualised,for example by showing how much value could be lost underdifferent scenarios, in order for them to have obvious traction. Atthe same time, while there is clearly a need to demonstrate andcommunicate the value of coastal andmarine ecosystem services todecision-makers, if better and more informed choices are to bemade between different land, resource and investment options(Agardy et al., 2005; Brown et al., 2008; UNEP-WCMC, 2011),valuation is not an end in itself. However high the value ofmangrove ecosystems is demonstrated to be in theory, this haslittle meaning unless it actually translates into shifts in real-worldpolicy and practice, and changes the economic opportunities, pricesandmarkets that land and resource users face as they go about theirday-to-day business (Emerton, 2006, 2013) Q3. Hence there needs tobe explicit consideration of the policy landscape and a concern forplausible solutions; ‘plausibility’ here being informed by thestakeholders who could bring about change and by ways in whichtheoretical values might translate into actual conservation andmanagement cash.
There are many examples in international policy of calls for in-tegrated management of estuarine, coastal and marine habitats,with regards to their use, conservation, restoration and in climatechangemitigation and adaptation (e.g. the Convention on BiologicalDiversity (CBD), the Ramsar Convention on Wetlands (Ramsar) andUNEP Global Programme of Action for the Protection of the MarineEnvironment from Landbased Activities (GPA-Marine)). The limitedsuccess of these policies when applied to mangroves illustrates thefailure of policy makers to effect new economic opportunities thatsupport local conservation, but developments in climate changepolicymay open newways to link global concerns with local action.The United Nations International Strategy for Disaster Reduction(ISDR) explicitly links ecosystem conservation with a reduction inrisk factors exacerbated by climate change, implying the need toinvest national risk reduction funding into ecosystemmanagement.The United Nations Framework Convention on Climate Change(UNFCCC 1992, Article 4 (d)) now supports opportunities for forestconservation, principally through the Reduced Emissions fromDeforestation and forest Degradation þ (REDDþ) and NationallyAppropriate Mitigation Actions (NAMAs) of the Durban Platform.Coupled with the growing recognition of the importance of coastalecosystems as globally significant sinks for carbon (so-called BlueCarbon) and the emerging global market for carbon offsets, thesedevelopments provide newways of linking theoretical values of twoecosystem services (risk reduction and carbon storage)with incomefor local people (Grimsditch, 2011); they help make conservationscenarios plausible.
Here we illustrate how an economic valuation approach can be
M. Huxham et al. / Journal of Environmental Management xxx (2015) 1e142
1234567891011121314151617181920212223242526272829303132333435363738394041424344454647484950515253545556575859606162636465
66676869707172737475767778798081828384858687888990919293949596979899
100101102103104105106107108109110111112113114115116117118119120121122123124125126127128129130
YJEMA4776_proof ■ 11 April 2015 ■ 2/14
Please cite this article in press as: Huxham, M., et al., Applying Climate Compatible Development and economic valuation to coastalmanagement: A case study of Kenya's mangrove forests, Journal of Environmental Management (2015), http://dx.doi.org/10.1016/j.jenvman.2015.04.018
applied within the policy context of Climate Compatible Develop-ment (CCD). CCD is a recent concept that aims for ‘triple wins’ inplanning; change that enhances adaptation to current and antici-pated climate change impacts, whilst also mitigating the produc-tion of greenhouse gases and leading to increases in humanwelfare(Mitchell and Maxwell, 2010). It is part of a growing internationalfocus on developing more integrated approaches to coping withclimate change and avoiding ‘maladaptation’, in which short termplanning creates greater future problems. Such an approach mayseem simultaneously obvious and utopian; if it can be done thenwhy is it not always adopted? In fact there are many instances ofpolicy options that could achieve CCD but that are not routinelyapplied, for example agro-ecological approaches leading to reducedcosts, enhanced yields, better resilience and increased carbonstorage (Pretty et al., 2006). Hence there are parallels here withusing economic valuation as a tool for conservation and develop-ment planning; simply identifying apparently irrational policy ordamaging trends is not enough to effect change without theinvolvement of multiple stakeholders. Many of the most importantservices provided by mangroves, such as coastal protection andcarbon sequestration, are of direct relevance to CCD implying thatwholesale loss of mangrove forests will rarely reflect a climatecompatible policy direction. Using economic valuation to illustratethe benefits of a CCD scenario that is developed with key stake-holders is a new way to help conceptualise and communicate thevalue of mangroves.
The present paper considers the current and future value of themangrove forests of southern Kenya. Case studies at a range of siteshave demonstrated the importance of these forests to local people,in particular through the provision of services such as fuelwood andbuilding timber (e.g. Abuodha and Kairo, 2001; R€onnb€ack et al.,2007). However recent trends in the country reflect the globalpicture of mangrove removal and degradation. Total mangrovecoverage in Kenya was 45,590 ha in 2010, which represented a lossof 18% of cover over the previous 25 years (Kirui et al., 2013).Quantitative risk mapping shows that most loss is associated withhigh population density and accessibility of the forests, hence forestloss is most pronounced in the southern coastline where popula-tion is highest and infrastructure most developed (Rideout et al.,2013). Simple extrapolation of these trends suggests a bleak
future for mangroves in southern Kenya with concomitant impactson the local and regional ecosystem services that they supply.
Our aim in the current paper was to use Kenyan mangroves as acase study in developing CCD processes of use more generally incoastal management, and thus to contribute to global debate andpractice on CCD and on valuing ‘Blue Carbon’ and other coastalecosystem services. We aimed to do this whilst informing planningand policy making in Kenya itself, and did so through the followingfour steps:
1) Conducting a comprehensive and up-to-date socio-economicanalysis of the current value of mangrove forest services inKwale District, southern Kenya.
2) Developing quantitative projections predicting mangrovecoverage in the area in twenty years' time based on currenttrends and drivers.
3) Articulating the economic consequences of mangroveecosystem change, in particular the value-added and costs-avoided that are associated with sustainable land and resourcemanagement approaches.
4) Using this information to inform a discussion with key stake-holders over Climate Compatible Development options for theKenyan mangrove sector and to compare Business as Usual(BAU) and CCD scenarios developed collaboratively and costedto illustrate the benefits of CCD.
2. Methods
2.1. Study area and site descriptions
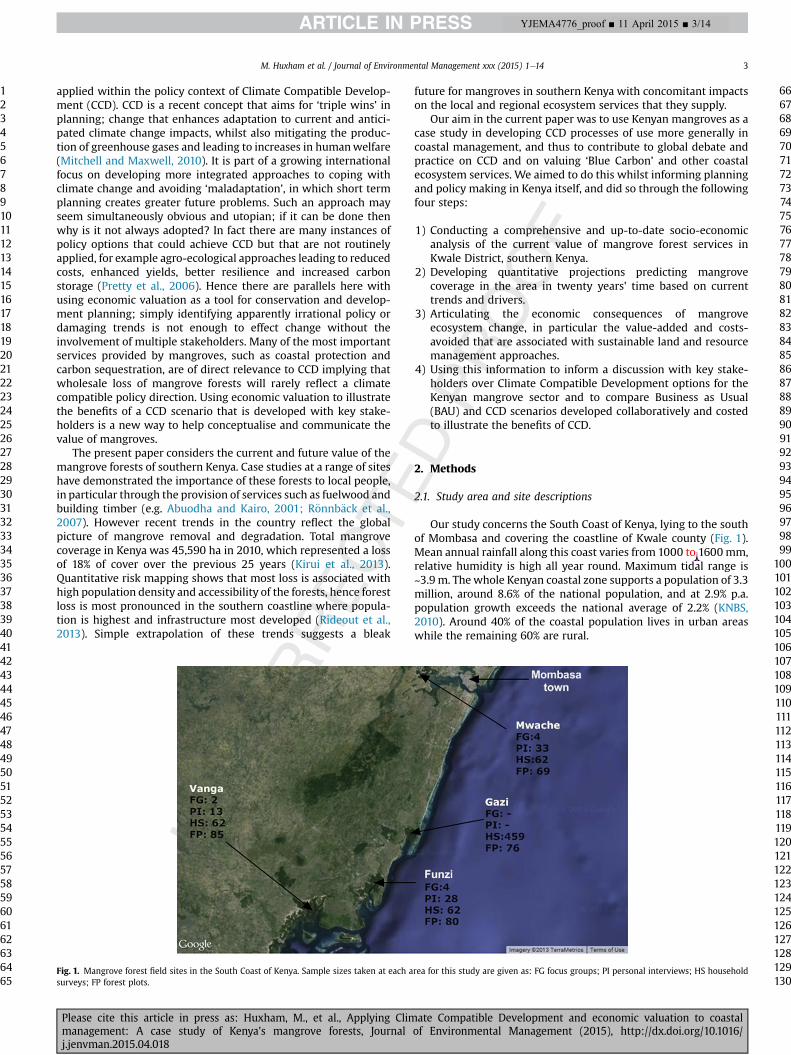
Our study concerns the South Coast of Kenya, lying to the southof Mombasa and covering the coastline of Kwale county (Fig. 1).Mean annual rainfall along this coast varies from 1000 to 1600mm,relative humidity is high all year round. Maximum tidal range is~3.9 m. Thewhole Kenyan coastal zone supports a population of 3.3million, around 8.6% of the national population, and at 2.9% p.a.population growth exceeds the national average of 2.2% (KNBS,2010). Around 40% of the coastal population lives in urban areaswhile the remaining 60% are rural.
Fig. 1. Mangrove forest field sites in the South Coast of Kenya. Sample sizes taken at each area for this study are given as: FG focus groups; PI personal interviews; HS householdsurveys; FP forest plots.
M. Huxham et al. / Journal of Environmental Management xxx (2015) 1e14 3
1234567891011121314151617181920212223242526272829303132333435363738394041424344454647484950515253545556575859606162636465
66676869707172737475767778798081828384858687888990919293949596979899
100101102103104105106107108109110111112113114115116117118119120121122123124125126127128129130
YJEMA4776_proof ■ 11 April 2015 ■ 3/14
Please cite this article in press as: Huxham, M., et al., Applying Climate Compatible Development and economic valuation to coastalmanagement: A case study of Kenya's mangrove forests, Journal of Environmental Management (2015), http://dx.doi.org/10.1016/j.jenvman.2015.04.018

All the nine mangrove species found in East Africa occur inKenya, with Rhizophora mucronata, Avicennia marina and Ceriopstagal the dominant species at most sites. The South Coast includesfour main mangrove areas, Mwache (04�3.010S, 39.06�38.060E),Gazi (4� 250- 4� 270 S, 39� 500 E), Funzi (4�310-4�350S/39o230-39�270E) and Vanga (4�390- 4�400S/39�140-39�170E). These forestsrange in size from 592 to 2351 ha and all coexist with contiguoussettlements, generally clustered into villages but including scat-tered homes and farmsteads (Table 1). The many extractive uses ofthese forests include exploitation for timber, wood-fuel and herbalmedicines with some clearing for fish ponds, prawn farms, salt pansand port developments. Although no comprehensive forest survey,including all these sites, has been published there is abundant ev-idence to suggest that all these forests are heavily impacted anddegraded by human use (e.g. Abuodha and Kairo, 2001; Dahdouh-Guebas et al., 2004; Mohamed et al., 2008), with resulting on-goingdeclines in total forest area (Kirui et al., 2013).
2.2. Socio-economic and forest status analyses
The bulk of the mangrove valuation literature refers to Asia andthe Americas; there remain relatively few applications in Africancountries (see for example McNally et al. 2011; De Wet, 2004).There are very few previous studies fromKenya, although two focuson one of our sites, Gazi (Kairo et al., 2009; UNEP, 2011). Here weuse the previous work from Kenya and augment it with extensivenew biological and socio-economic field data.
Forest structure data were compiled for 310 ten � ten m forestplots, covering a total of 3.1 ha (Table 1). In each plot the species,diameter at breast height (dbh) and height of trees were recordedalong with indications of human impact (such as stumps, cutbranches and pole quality). As one integrated measure of foresthealth, above ground dry weight for forest plots was calculatedusing an allometric equation derived from work at Gazi Bay(Pamoja, 2011):
LN Biomass ¼ �2:29711ððLNdbhÞ � 2:54528ÞTotal areas of each forest were derived from recent satellite
imagery (Kirui et al., 2013).After negotiating access to villages through the appropriate local
chairmen and elders socio-economic data were collected usingthree survey methods: household questionnaires, key informantinterviews and focus groups. An interview schedule with 31questions, covering income and employment, membership of localcivic groups and use and collection of mangrove services, for familyuse or for sale, was piloted and then completed by local peopleselected by approaching households at random in each site. Semi-structured interviews were conducted with key informants,including village heads and opinion leaders, traders of mangrovegoods, licensees for mangrove wood cutting, Kenya Forest Serviceofficials and crab and prawn collectors. Interviews were informedby 7e12 questions which differed depending on the interviewee,with questions for collectors and traders focussing on rates andvalue of harvest and those for village heads and officials onnumbers of traders/collectors and governance issues. All interviewswere recorded by hand and transcribed.
Focus groups were held separately for men and women, withpeople from community organisations, such as Beach ManagementUnits and local conservation groups invited to attend. They took30e50 min and were guided by a series of questions on who usesthe mangroves and how, how access to the mangrove resources isgoverned, what local customs there are regarding mangrove use,any changes in mangrove status that have been noticed over theyears and how well mangroves are managed. Notes were taken byhand during each focus group and transcribed shortly afterwards.
All ecosystem services provided by mangroves to local peoplethat were identified by respondents to the surveys were included inthe valuation exercise. Following the Millennium EcosystemAssessment (Watson et al., 2005) we classified services into provi-sioning, cultural/aesthetic, regulating and supporting categories.Survey dataprovidedquantitative results only for services in thefirsttwoof these categories. Relevant regulating services andappropriateeconomic values for these were identified from the literature,including papers on local forests by members of the current team(e.g. Huxhamet al., 2004;Huxhamet al., 2007; Kairo et al., 2008) andfrom the technical specifications developed for Mikoko Pamoja, amangrove carbon offsetting scheme based at Gazi (Pamoja, 2011).
Village heads were asked to provide demographic data for eacharea, and these were augmented by literature and where necessaryby direct surveys of the number of households; although popula-tion data are available from KNBS (2010) these can date rapidlygiven high rates of population growth and local migration.
2.3. Valuation methods
Here we provide an overview of the methods used; moredetailed information is available from Emerton (2014) and Huxham(2013). Figures are expressed as net values, the costs of harvesting,producing or using ecosystem services are deducted, and at con-stant, 2014 prices.
2.3.1. Direct provisioning servicesMonetary values for all of these services were estimated at each
site by multiplying the volume per year produced or extracted bythe relevantmarket price, taken as the sale (for traders) or purchase(for consumers) price at the site. Data were obtained from house-hold surveys and interviews with licenced cutters. Whereverpossible, harvest and production costs were subtracted so as toyield net values (for example fees payable to the Kenyan govern-ment for collection of timber and crabs and costs of fisheries gearmaintenance and replacement were subtracted). Time was nottaken as a cost apart from where salaries were paid (e.g. by a li-cenced pole trader employing cutters). Some products are extrac-ted without licence or illegally. These values are more difficult toestimate because they do not appear in official records, and usersare often reticent to disclose details of their activities. For thisreason, a combination of methods was used to calculate unlicensedor illegal values, including extrapolating data obtained from legalusers to a larger population. For example timber for building polescan be extracted from all the study sites under licence from theKenyan Government and the values of this legally harvested woodwere calculated following interviewees with licensees and profes-sional cutters. However this grossly underestimates thewood valuesince it does not account for illegal extraction. The present surveysrecorded widespread acknowledgement of illegal extraction, as hasprevious relevant work (R€onnb€ack et al., 2007) and personalobservation. Hence households were asked about collection anduse of mangrove timber, and where mangrove timber was notrecorded as either being bought from a licenced trader or havingbeen collected by a household member who was themselves anemployee of a licenced cutter its value was recorded as additional
Table 1Forest size and populations at study sites.
Site Mangroves (ha) Number of households
Gazi Bay 592 498Mwache/Mikindani 808 594Bodo/Funzi 1815 500Vanga 2351 2074
M. Huxham et al. / Journal of Environmental Management xxx (2015) 1e144
1234567891011121314151617181920212223242526272829303132333435363738394041424344454647484950515253545556575859606162636465
66676869707172737475767778798081828384858687888990919293949596979899
100101102103104105106107108109110111112113114115116117118119120121122123124125126127128129130
YJEMA4776_proof ■ 11 April 2015 ■ 4/14
Please cite this article in press as: Huxham, M., et al., Applying Climate Compatible Development and economic valuation to coastalmanagement: A case study of Kenya's mangrove forests, Journal of Environmental Management (2015), http://dx.doi.org/10.1016/j.jenvman.2015.04.018

to that for legal sales.
2.3.2. Indirect provisioning services e fisheriesMangroves provide nursery habitat for a wide range of fish spe-
cies, many of which contribute to artisanal and commercial fisheriesonce they reach adult size (Mumbyet al., 2004). There is therefore nocontention over the importance ofmangroves tofisheries in general;however there are many estimates in the literature of the extent ofthemangrove contribution to fisheries, ranging from 5 to 100%. Thisvariation reflects in part genuine differences between species andsites, but also reflects the methodological challenges in linkingnursery sites with adult fish stocks and the paucity of relevant datafor most field sites. Where no local evidence exists, projects oftentake an average value or choose one that seems appropriate for theconditions at the focal site. Fortunately, and unusually, there are anumber of studies in Gazi and of sites nearby of direct relevance tothis question. Kimani et al. (1996) recorded 128 teleost species inGazi Bay during 12 months of sampling; many of these species,caught directly adjacent to the mangroves, are likely to be depen-dent upon them, although since sampling in this study did not occurinside the mangroves this remains an inference. Three subsequentstudies (Crona and R€onnb€ack, 2007; Huxham et al., 2008, 2004)demonstrated that a range of juvenile fishwere indeed entering intothe mangrove habitat itself, and in some cases travelling long dis-tances from the seaward fringe (Huxham et al., 2008); there was astrong overlap with the species and families found in othermangrove sites in the region (e.g. Lugendo et al., 2007). Finally,Huxham et al. (2007) used stable isotope techniques to demonstratethat adult fish, caught offshore, had spent some of their juvenileyears in mangrove habitats. Hence a strong body of evidence existsfor mangrove dependence of a range of teleost species at Gazi. Here,we classified a species or group as ‘mangrove dependent’ if it hasbeen recorded as a juvenile in mangrove habitat at our sites. Usingthis criterion an average 39% of the value of fish caught offshorecame from mangrove dependent species.
Commercial catches of coastal species along the south coast arelanded and traded at five major administrative landing sites: Diani,Msambweni, Shimoni, Majoreni and Vanga. Records of weights andidentities of all species landed are recorded by the KenyanDepartment of Fisheries. We collected landing data from all thesesites for 2012. Based on their proximity to mangrove forests, weallocated catches from the Vanga and Majoreni landing sites to theVanga forest, Shimoni landing site to Funzi and Msambweni land-ing site to Gazi. There is no administrative landing site (and henceno official landing records) in the Mwache area; estimates of fish-eries values from that forest are taken from direct interviews withlocal fishers. Net values were calculated after removing annualcosts; these were calculated using information obtained in in-terviews with fishers at the landing sites on costs of salaries, li-cences, fuel, gear and boat maintenance and replacement. Costsaveraged 30% of income.
2.3.3. Regulating services e carbon sequestrationGazi Bay hosts the Mikoko Pamoja project, a recently validated
community-based forest conservation programme funded by car-bon credits (see Pamoja (2011) and www.eafpes.org for more in-formation). This makes it the best place in Africa to estimate theeconomic value of carbon sequestration. Carbon benefits can becategorised in two ways: a) the additional carbon sequesteredannually by the existing forest and any new forest area, and b) thecarbon emissions avoided by maintaining forest cover and quality.The second benefit is much larger than the first, but also moreuncertain. Avoided emissions are potentially enormous if all thecarbon present in the ecosystem is considered, but even totalremoval of the trees does not always imply loss of all the above-
ground carbon (since wood products may retain the carbon) orthe below-ground carbon (since some soil carbon is likely to remainun-oxidised). Whilst mature mangrove forests may continue tosequester carbon for hundreds to thousands of years, avoided lossesof stored carbon should be priced only until depletion. Here wecombine the two values since our time horizon is only 20 years.
Mature mangrove forests continue to sequester carbon in threeways: 1) Above-ground, by new growth of branches and trunks. 2)Below-ground, through new growth of roots. 3) In and on thesediment, through root exudates (carbon that is ‘leaked’ fromroots), autochthonous production (that is, plant material such asleaves that grow in the forest and become buried) and the trappingof sediments and organic material from outside the forest. MikokoPamoja measurements used a conservative estimate of 4.5 t Cha�1 yr�1 for 1. A (conservative) estimate of 0.3 for root:shoot ratios(based on work at the site; Tamooh et al. (2008)) implies an addi-tional 1.35 t C ha�1 yr�1 for root growth. Assuming a conservative1 t C ha�1 yr�1 for sediment trapping (less than the global average:Alongi, 2014) gives total average sequestration is 6.85 t C ha�1 yr�1.
Recent experimental work using small-scale forest cutting hasshown rates of carbon losses of 4.85 t C ha�1 yr�1 from sedimentfollowing forest removal (Lang'at et al., 2014). We use this value asan estimate of annual avoided emissions. This conservatively as-sumes that all above-ground carbon, contained in harvested wood,is not released into the atmosphere and that these small experi-mental cuts are representative of larger areas. Based on realisticcurrent market values for the voluntary carbon market we took theprice of 1 tonne of CO2 as US$10, and used these values derivedfrom Gazi for all the forest sites. Estimated costs were subtractedfrom annual income to give net values; they were calculated basedon the start-up and running costs incurred for Mikoko Pamoja,excluding the value of volunteer time.
2.3.4. Regulating services e protection from coastal erosion andstorm surges
In most mangrove valuation studies coastal protection gener-ates the largest single contribution to total economic value, becauseof mangroves' demonstrated ability to protect shorelines againstgradual erosion and storm events and because of the high cost of‘hard engineering’ alternatives (e.g Barbier et al., 2008). Thisecosystem service is likely to become more important with climatechange, as coastal areas come under greater pressure from humanpopulations and rising sea levels; mangroves have the ability toadapt to at least modest levels of sea level rise through sedimentaccretion and surface elevation.
Many valuation studies make large (and in some cases unreal-istic) estimates of the value of mangrove coastal protection ser-vices, applying a high per hectare figure even where there is littlesettlement or infrastructure in place, and only a minor likelihood of“best practice” coastal protection or remediation measures beingactually implemented. The figures used here equate to a combinedaverage of just under US$ 500 ha�1 yr�1. It should be noted that this(deliberately) represents a fairly conservative estimate in compar-ison to those yielded from other studies carried out in the widerIndian Ocean region: IUCN (2006) and Ranasinghe and Kallesoe(2006) for example find average values of between US$3300e9500 on the east coast of Sri Lanka, Das (2007) stipulates afigure of more than US$8500 in India, and Sathirathai (1998) andSathirathai and Barbier (2001) suggests values of betweenUS$3000e4000 in southern Thailand.
2.3.4.1. Coastal erosion. The beach to the south of Gazi village suf-fered removal of mangroves for commercial purposes some fortyyears ago, and the denuded areas have not recovered (Kirui et al.,2008). This degradation has resulted in obvious coastal erosion
M. Huxham et al. / Journal of Environmental Management xxx (2015) 1e14 5
1234567891011121314151617181920212223242526272829303132333435363738394041424344454647484950515253545556575859606162636465
66676869707172737475767778798081828384858687888990919293949596979899
100101102103104105106107108109110111112113114115116117118119120121122123124125126127128129130
YJEMA4776_proof ■ 11 April 2015 ■ 5/14
Please cite this article in press as: Huxham, M., et al., Applying Climate Compatible Development and economic valuation to coastalmanagement: A case study of Kenya's mangrove forests, Journal of Environmental Management (2015), http://dx.doi.org/10.1016/j.jenvman.2015.04.018

and the longshore movement of sand (Dahdouh-Guebas et al.,2004). Hence this beach allows a locally relevant measure ofcoastal erosion following mangrove removal, although it does notprovide a perfect opportunistic ‘experiment’ since a narrow ~50 mstrip of mangrove remains along the beach which undoubtedlycontinues to provide protection. Because of this, estimates of theprotective value of mangroves here are likely to be conservative.
Average rates of shoreline retreat along the degraded beach overthe past 11 years were measured using satellite imagery, to providean estimate of rates of shoreline loss after mangrove removal.Mitigative and avertive expenditure are used, looking at the cost ofestablishing and maintaining coastal defence structures such asgroynes, breakwaters, revetments and sand replenishment thatwould be required to restore eroded coastal areas and continue toprotect them in the future to an equivalent level should well-functioning mangroves have been in place. As no up-to-date fig-ures were available for the Kenyan or East African Coast, cost datawere transferred from a recent study carried out in a site in SriLanka which displays similar biophysical, ecological and socio-economic conditions to the Southern Kenyan coast (in De Meland Weerathunge, 2011; Emerton, 2013). The transferred valueswere adjusted using appropriate CPI deflators and Gross DomesticProduct Purchasing Power Parity (GDP PPP) conversion rates toaccount for real price differences over time and between Sri Lankaand Kenya. The resulting annualised figure of US$ 20.81 m�1 yr�1
was applied to the length of mangrove protected coastline,measured using satellite imagery, at each site.
2.3.4.2. Storm surge protection. Some areas on the southerncoastline have invested in seawalls to protect property against theimpacts of high seas and storm surges; these include Bamburi andVanga (Aboudh, 2002; UNEP, 2011). The Vanga seawall cost US$952per metre to build (UNEP, 2011). Adding 1% maintenance costs peryear gives a locally relevant replacement cost for storm protectionservices from mangroves. Tychsen et al. (2008) modelled the im-pacts of a tsunami on the south coast and found that mangrovesafforded protection 300 m inland. Using satellite imagery weidentified all areas on the coast that included housing or buildingswithin 300 m of the coastline and that were situated behindmangrove stands of at least 100 m thickness. We used replacementcosts for building seawalls in these areas as a measure of the stormsurge protection value of mangroves (hence we included onlyprotection value for high value land with visible buildings).
2.3.5. Cultural servicesEstimates for the market values of tourism, education and
research and ritual consultation were made using a mix of pub-lished sources (UNEP, 2011) and interview data. Data were mostcomprehensive and reliable from Gazi, with the relevant estimatesfor tourism and education/research taken from this site and appliedto the other sites based on interview data and estimates from thoseareas on the numbers of visitors. Traditional religious practices inthe area involve the consultation of shaman in mangrove shrineswhich includes payments and offerings needed for intercessionwith spirits. Estimates of average market values for these wereobtained through interviews and applied to sites on the basis of theestimated number of appropriate shrines.
2.4. Developing storyline scenarios
We adapted the methods described by Rounsevell and Metzger(2010) to develop qualitative storyline scenarios for the southerncoast mangrove forests by 2033. The purpose of this exercise was todraw on the expertise of relevant regional stakeholders, from awide range of backgrounds, to construct plausible scenarios.
Engagement with these partners at this stage was also part of alonger term effort to ensure our science was rooted in relevant localconcerns and was understood by local users. Regional stakeholderswere invited to participate in a facilitated process in November2013. Thirty eight participants drawn from relevant governmentdepartments (including the Kenya Forest Service, National Envi-ronmental Management Agency, Kenya Marine and FisheriesResearch Institute and Kenya Wildlife Service), NGOs, communitybodies and academia worked in four separate and independentgroups through a five step process. This first identified the statedescriptors (such as forest area and quality) and drivers (the causesof change in these descriptors). The second ranked these drivers interms of perceived importance and degree of uncertainty aroundthem. Third and fourth steps involved producing descriptive nar-ratives of business-as-usual (BAU) and Climate Compatible Devel-opment (CCD) scenarios, based on the key drivers and what wereagreed as plausible interpretations by the group participants.Groups then described the main winners and losers under each ofthe two scenarios. At the end of this process the results from thefour independent groups were collated and two synthesis scenariosdeveloped and circulated for approval between all participants.
2.5. Projections of forest change
In order to allow quantitative valuations of the scenarios wemodelled forest cover in 20 years time (i.e. for 2033) informed bythe qualitative scenarios. The BAU modelling made two key as-sumptions. First that national rates of mangrove forest loss recor-ded over the past 20 years by Kirui et al. (2013) would continue (at0.7% per annum). Second, that the risk factors identified asimportant predictors of forest loss in the last two decades byRideout et al. (2013), including population density and proximity ofroads, would continue to influence the relative risks to forests.Rideout et al. (2013) validated a qualitative risk model that classi-fied remaining forest areas into one of five risk categories. Applyingthis model we selectively removed forests in the highest riskcategory (5) first, followed by areas at lower risk, until the antici-pated total national forest loss was achieved. The rank order inwhich forest pixels in lower risk categories were lost depended ontheir distance from areas of forest identified in the next higher riskcategory; hence those pixels in category 4 that were contiguouswith category 5 areas were the first to be lost. Under this proceduretotal forest loss was assumed a priori but the distribution of this losswas determined by the risk factors, resulting in very different ratesof loss between forests areas.
To inform the forest scenarios under CCD we used the satelliteimages described in Kirui et al. (2013) to identify all those areas ateach of our sites from which mangroves have been lost in the last20 years. We then used Google Earth to estimate the proportion ofthese areas that were occupied by productive alternative land uses,such as new buildings, agricultural land or coconut plantations, andtherefore the proportion that were apparently left as bare, unpro-ductive land. Because most incremental forest loss in the area hasbeen driven by small scale cutting for timber and firewood suchareas are common; whilst they often do not regenerate naturally,new mangrove forest can be established through active restorationprojects (Kirui et al., 2008). Hence we classified such areas asavailable for restoration under CCD.
3. Results
3.1. Current forest status and quality
Analysis of the new forest structural data taken across the southcoast supports previous work from individual sites that the forests
M. Huxham et al. / Journal of Environmental Management xxx (2015) 1e146
1234567891011121314151617181920212223242526272829303132333435363738394041424344454647484950515253545556575859606162636465
66676869707172737475767778798081828384858687888990919293949596979899
100101102103104105106107108109110111112113114115116117118119120121122123124125126127128129130
YJEMA4776_proof ■ 11 April 2015 ■ 6/14
Please cite this article in press as: Huxham, M., et al., Applying Climate Compatible Development and economic valuation to coastalmanagement: A case study of Kenya's mangrove forests, Journal of Environmental Management (2015), http://dx.doi.org/10.1016/j.jenvman.2015.04.018

are degraded and heavily impacted by human activity. One mea-sure of forest health is aboveground biomass. Median values werelowest at Gazi and highest at Mwache (Table 2). Most sites showeda marked right skew in biomass frequency distributions, with a fewhigh value and many low value plots; this is reflected in generallylarge standard deviations and differences between mean and me-dian values (Table 2). Structural data from forests near Lamu, in the
north of the country, were analysed as a comparison. Forests in thisarea have suffered the lowest rates of loss over the past twentyyears, have the lowest risk ratings and generally show the smallesthuman impacts (Cohen et al., 2013; Rideout et al., 2013); hence theyare the closest available approximation to pristine ‘control’ sites inKenya. Median biomass at Gazi is less than 50% that at Lamu.Another index of forest quality is provided by the proportion of tree
Table 2Measures of forest quality at the four study sites along with reference comparisons.Mean and median plot dry weights are in tonnes ha�1. ‘Form 1’ are the highestquality, straight poles (no data were available for Gazi). Reference data for plotbiomass are from Lamu, in the north of Kenya, and for poles are from a protectedplantation near the Gazi forest (Kairo et al., 2009).
Site Mean (SD) plot biomass Median plot biomass % poles form 1
Gazi 81 (57) 71 e
Mwache 128 (102) 112 8Funzi 121 (102) 87 0.4Vanga 204 (230) 106 12Reference 165 (66) 159 86
Table 3Summary of value estimates in 2014 USD yr�1.
Gazi Vanga Funzi Mwache All sites Mean (USD/ha)
Provisioning Services Timber, fuelwood & honey 49,801 289,378 761,179 47,757 1,148,115 206Capture fisheries (finfish) 123,378 253,826 186,956 44,796 608,956 109Capture fisheries (crustaceans) 55,466 310,541 82,525 267,664 716,196 129
Regulating Services Protection against coastal erosion 195,161 827,770 496,234 677,335 2,196,500 395Protection against extreme weather events 40,045 15,725 63,175 73,561 192,506 35Carbon sequestration 100,115 656,126 409,897 231,159 1,397,297 251
Cultural Services Tourism, education & research 124,512 49,183 37,970 16,903 228,568 41Total 688,478 2,402,549 2,037,936 1,359,177 6,488,139 1166Mean value (USD/ha) 1163 1022 1123 1682 1166
Fig. 2. Summary of value estimates in 2014 USD yr�1.
Table 4Involvement of women in collection of provisioning services (% of harvesters whoare women) and uses of each service (% of harvests used by collecting household,sold within villages or sold to traders conducting business outside). Data are fromthe totals for all sites.
Provisioningservice
Own use Villagetrade
Tradersbeyond village
Women
Timber 86 8 6 27Fuel Wood 79 21 e 96Wild Finfish 36 24 40 14Wild Crustaceans 37 3 59 35Honey 42 56 2 48
M. Huxham et al. / Journal of Environmental Management xxx (2015) 1e14 7
1234567891011121314151617181920212223242526272829303132333435363738394041424344454647484950515253545556575859606162636465
66676869707172737475767778798081828384858687888990919293949596979899
100101102103104105106107108109110111112113114115116117118119120121122123124125126127128129130
YJEMA4776_proof ■ 11 April 2015 ■ 7/14
Please cite this article in press as: Huxham, M., et al., Applying Climate Compatible Development and economic valuation to coastalmanagement: A case study of Kenya's mangrove forests, Journal of Environmental Management (2015), http://dx.doi.org/10.1016/j.jenvman.2015.04.018

trunks that are of the highest quality form; straight and suitable forbuilding timber. These are the poles which are most prized bycutters since they attract the highest market prices. Only 0.4% ofsurveyed trees at Funzi were of this form, compared with 86% oftrees in an 18 year old protected plantation near to the natural Gaziforest.
3.2. The economic baseline
We randomly sampled around 18% of all households in ourstudy areas (Fig. 1; Table 1) with saturation of topics in the surveysand focus groups suggesting we had achieved a representativesample. There were five provisioning services used by local people;in addition, three regulating and three cultural/aesthetic serviceswere identified and valued, giving a total value of just under US$ 6.5million or some US$1166 ha�1 yr�1 (Table 3). This list is notexhaustive. It certainly excludes some important regulating (suchas the filtration of sediment and nutrients fromwater, which helpsprotect coral reefs) and cultural (such as existence value of biodi-versity) services that were impossible to value here. It may alsoexclude other services of which we are simply ignorant. It is to behoped that as better data become available, these estimates can beexpanded and improved.
As has already been noted for studies carried out in other partsof the world, values are dominated by the damages and costsavoided associated with regulating services (Fig. 2). These accountfor around a half or more of total value in all four of our sites. Directincome (from wood and non-wood products and fisheries) com-prises just under a third, overall, and is particularly important inFunzi (mainly due to the relatively high value of forest productsharvested there).
Simply assessing the size of different types of values, withoutconsidering their distribution between users, may do nothing toillustrate the importance of services to marginal and poor groups.As one way to illustrate this, we investigated those services of most
relevance to women and considered who was collecting provi-sioning services and where these services were used, as an indi-cation of the relative values of services for local people. For examplewhilst fuel wood represented a relatively small proportion of totalvalue at all the sites it is a very important service for local women;96% of fuel wood collectors were women and 79% of the totalharvest was used directly by those collecting, rather than for sale.This contrasts with, for example, crustaceans that are collectedmostly bymen and used to generate income through sale to traders(Table 4).
3.3. CCD and BAU storyline scenarios
The key drivers of change identified by the four expert stake-holder groups are shown in Fig. 3. Although each group of eightworked independently there was considerable agreement on themost important drivers: population growth, poverty, governanceand urbanisation were all ranked highly.
Taking these rankings storyline scenarios under BAU and CCDwere collectively developed and agreed, in an iterative process overthree days, between all groups (Box 1 and 2). These scenarios wereused to inform the economic modelling, with data on assumed landuse change coming from the risk modelling.
Fig. 3. Ranked drivers of change in the mangrove sector in South Coast Kenya, over a 20 year projected period. The figure summarises the discussions of four independentstakeholder groups, of eight people each. Four different fonts are used for the conclusions of each group; groups were not required to identify the same number of drivers but wereasked to rank those that they did identify in terms of importance and uncertainty.
Box 1
BAU scenario for south coast mangroves.
The social, ecological and economic landscape:
Rapid population growth will exceed the national average
because of coastal cultural values and immigration to the
region, some of which is fuelled by climate refugees from
elsewhere in Kenya (as was seen in 2008 with pastoralists
M. Huxham et al. / Journal of Environmental Management xxx (2015) 1e148
1234567891011121314151617181920212223242526272829303132333435363738394041424344454647484950515253545556575859606162636465
66676869707172737475767778798081828384858687888990919293949596979899
100101102103104105106107108109110111112113114115116117118119120121122123124125126127128129130
YJEMA4776_proof ■ 11 April 2015 ■ 8/14
Please cite this article in press as: Huxham, M., et al., Applying Climate Compatible Development and economic valuation to coastalmanagement: A case study of Kenya's mangrove forests, Journal of Environmental Management (2015), http://dx.doi.org/10.1016/j.jenvman.2015.04.018
from the north). This will result in a near doubling in the
numbers of people. Rapid urban spread, especially in
Mombasa and Ukunda, and rapid industrialisation,
including developments in mining and oil and gas in-
dustries, will absorb some of this new population. Hence
impacts on natural resourcesmay not be proportionatewith
increases in population size, as economic growth and
electrification reduce the proportion of the population
directly dependent on natural resources such as firewood.
However the large increase in absolute numbers of people
implies a growth in pressure on such resources.
Economic growth, fuelled by new industries and better
education, will lift many out of poverty and generate a
burgeoning middle class. However inequality is likely to
increase and absolute numbers in poverty will remain the
same. This growing inequality is one reason for continued
insecurity; whilst better technology and new investment by
government in law enforcement brings benefits, there are
also domestic tensions between rich and poor and inter-
national insecurities and terrorist threats mediated by wider
access to weapons. Whilst tourism continues to expand
both in tourist numbers and in revenue generated it re-
mains mostly foreign owned and with an emphasis on the
long-haul luxury market with a continuing disconnect be-
tween a large tourist presence and local benefit.
Increasing use of digital media and levels of education bring
local pressures for democratic accountability. Combined
with the new devolved constitution this brings moderate
improvement in local representation and governance.
However policy implementation and law enforcement
remain weak and co-ordination between sectors remains
poor. There is little attempt to balance the needs of envi-
ronmental protection against economic growth, as power-
ful new industries push environmental protection towards
the bottom of local priorities.
Unabated climate change leads to increasingly erratic water
supplies, with water availability for natural ecosystems
further stressed by large new industrial uses, including ti-
tanium mining and sugar cane production, as well as the
construction of the new Mwache dam to provide water for
an expanding Mombasa.
The implications for mangroves
There is continued loss of forest area and reduction in forest
quality. Mangroves near to Mombasa, which are already
stressed, suffer additional problems following the Mwache
dam and are mostly destroyed. Gazi mangroves are rela-
tively protected because of high profile and existing small-
scale initiatives such as Mikoko Pamoja, which are locally
successful but which have a limited regional impact,
despite the national MangroveManagement Plan, launched
in 2014. This established a science-based approach to
management but poor enforcement and policy integration
limited its success. Degradation of the mangroves leads to
declines in in-shore fish and crustacean species with
mangrove dependence. Loss of mangrove resources,
including timber and firewood, especially near large urban
areas, increases pressure on terrestrial forests.
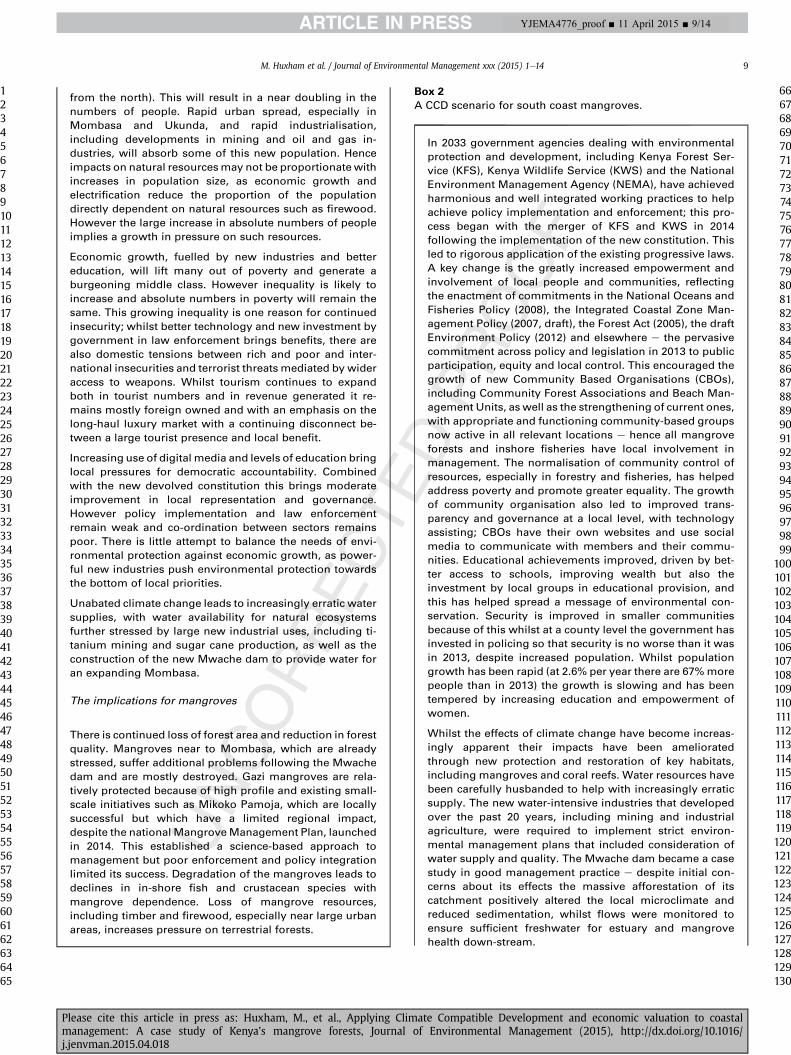
Box 2
A CCD scenario for south coast mangroves.
In 2033 government agencies dealing with environmental
protection and development, including Kenya Forest Ser-
vice (KFS), Kenya Wildlife Service (KWS) and the National
Environment Management Agency (NEMA), have achieved
harmonious and well integrated working practices to help
achieve policy implementation and enforcement; this pro-
cess began with the merger of KFS and KWS in 2014
following the implementation of the new constitution. This
led to rigorous application of the existing progressive laws.
A key change is the greatly increased empowerment and
involvement of local people and communities, reflecting
the enactment of commitments in the National Oceans and
Fisheries Policy (2008), the Integrated Coastal Zone Man-
agement Policy (2007, draft), the Forest Act (2005), the draft
Environment Policy (2012) and elsewhere e the pervasive
commitment across policy and legislation in 2013 to public
participation, equity and local control. This encouraged the
growth of new Community Based Organisations (CBOs),
including Community Forest Associations and Beach Man-
agement Units, as well as the strengthening of current ones,
with appropriate and functioning community-based groups
now active in all relevant locations e hence all mangrove
forests and inshore fisheries have local involvement in
management. The normalisation of community control of
resources, especially in forestry and fisheries, has helped
address poverty and promote greater equality. The growth
of community organisation also led to improved trans-
parency and governance at a local level, with technology
assisting; CBOs have their own websites and use social
media to communicate with members and their commu-
nities. Educational achievements improved, driven by bet-
ter access to schools, improving wealth but also the
investment by local groups in educational provision, and
this has helped spread a message of environmental con-
servation. Security is improved in smaller communities
because of this whilst at a county level the government has
invested in policing so that security is no worse than it was
in 2013, despite increased population. Whilst population
growth has been rapid (at 2.6% per year there are 67%more
people than in 2013) the growth is slowing and has been
tempered by increasing education and empowerment of
women.
Whilst the effects of climate change have become increas-
ingly apparent their impacts have been ameliorated
through new protection and restoration of key habitats,
including mangroves and coral reefs. Water resources have
been carefully husbanded to help with increasingly erratic
supply. The new water-intensive industries that developed
over the past 20 years, including mining and industrial
agriculture, were required to implement strict environ-
mental management plans that included consideration of
water supply and quality. The Mwache dam became a case
study in good management practice e despite initial con-
cerns about its effects the massive afforestation of its
catchment positively altered the local microclimate and
reduced sedimentation, whilst flows were monitored to
ensure sufficient freshwater for estuary and mangrove
health down-stream.
M. Huxham et al. / Journal of Environmental Management xxx (2015) 1e14 9
1234567891011121314151617181920212223242526272829303132333435363738394041424344454647484950515253545556575859606162636465
66676869707172737475767778798081828384858687888990919293949596979899
100101102103104105106107108109110111112113114115116117118119120121122123124125126127128129130
YJEMA4776_proof ■ 11 April 2015 ■ 9/14
Please cite this article in press as: Huxham, M., et al., Applying Climate Compatible Development and economic valuation to coastalmanagement: A case study of Kenya's mangrove forests, Journal of Environmental Management (2015), http://dx.doi.org/10.1016/j.jenvman.2015.04.018

The collectively produced CCD scenario storyline is given in Box 2.
3.4. Projections used for economic modelling
Q4Modelled losses of forest cover under BAU, projecting currenttrends, came to 43% of the south coast forest over the next 20 years.These losses were highly variable between sites, reflecting thedifferent proportions of each forest found in the high risk cate-gories: percentage losses were 100, 69, 64 and 3 for the Mwache,Funzi, Gazi and Vanga sites respectively. Under the CCD scenario, inwhich available degraded areas are reforested, forest coverage ex-pands by 8, 7, 9 and 13% respectively of the current forest areas ofFunzi, Gazi, Mwache and Vanga.
Population trends follow the projections provided in the 2090Census (KNBS, 2010): an annual growth rate for Coast Province of3.05%.
Changes in the value of provisioning services were estimatedbased in the projected changes in user numbers, the structure anddynamics of their use, and the proportion of products that aresourced from mangroves. Regulating and cultural services relateper hectare unit values to changes in themangrove area at each site.
Although there are grounds to suppose that the real price ofmangrove services may change over the next twenty years, insuf-ficient information exists to predict with any accuracy what thesetrends will be. On the one hand, continuing ecosystem degradationmay result in services becoming scarcer, and their real priceincreasing (this relates primarily to the BAU scenario). The risingdemands of a growing population, coupled with a limited resourcebase, may have a similar effect (under both scenarios). However,decreasing reliance on mangrove provisioning services due to theimproved availability of cheap alternatives may have the oppositeeffect (i.e. lead to a decrease in real prices in the future). As it isimpossible to predict with any certainty how these factors will playout on the southern Kenyan coast, all real prices are assumed toremain stable in both scenarios.
Average harvest or consumption rates per user were alsoassumed to remain stable, as there are no convincing grounds tosuppose otherwise. The percentage of the populationwhich utiliseswood products was however assumed to decline, under both BAUand CCD scenarios. This reflects a continuation of the changes thatare currently ongoing in the lifestyles, aspirations and demands ofboth coastal dwellers and the Kenyan population more generally(e.g. a shift away from reliance on wood fuel, moves towards brick-based construction, etc.). It should however be noted that theseeffects are counterbalanced somewhat by the increase in popula-tion size (in other words, although the percentage of householdssourcing products from mangroves is assumed to decline, the ab-solute number of households will increase). No change wasassumed in the percentage of households consuming or trading fish(although the percentage contribution of mangroves is assumed todecline in BAU and increase in CCD, as explained in the followingparagraph).
Two indices were applied, so as to ensure that changes inmangrove cover and quality were reflected in value estimates. A“product availability index” was applied to provisioning services;this accounts for the change in product supply or yield that willoccur as mangrove area and quality decline (under BAU) or increase
Demand for natural products including wood and fish has
increased due to urbanisation and population growth.
However it was not proportionate to the increase in people
since most of these new people are living in towns with
increased access to electricity and regional and interna-
tional markets. The expansion of industrial mining and
other industries led to increased wealth which also reduced
direct reliance on local ecosystem services including fire-
wood and poles. Hence the 20% increase in demand for
wood products is met through new woodlots and agrofor-
estry. Tourist numbers increased by 50% over the past 20
years, following a long trajectory and facilitated by a stable
security situation. But a key difference in the new tourist
economy is the importance of the domestic market, with
Kenyan tourists now making up 50% of the new visitors.
The growing Kenyan economy, large Nairobi middle class
and fast new rail link between Nairobi andMombasa played
important roles in stimulating this change. The overseas
tourists aremuchmore aware of the environmental impacts
of their travel and all airlines are now required to consider
offsetting or other mitigation efforts. Capitalising on this,
the careful nurturing of links between airlines, tourist op-
erators and local PES schemes led to a huge increase in
resources for the preservation and enhancement of local
sinks, including ‘blue carbon’ sinks.
Early encouragement for payments for ecosystem services
in the draft Environment Policy (2012) combined with early
success of pilot PES projects on the coast such as Mikoko
Pamoja has produced a flourishing policy environment for
PES. The quadrupling of carbon prices, from 6 to 24 USD
per tonne CO2, has transformed the viability of conservation
schemes based on ‘blue carbon’ sinks, especially man-
groves but including emerging schemes addressing sea-
grass. In combination with other sources of income from
eco-tourism and new non-forest products this has
increased the total economic value of natural ecosystems
on the coast, and the commitments under the draft Envi-
ronmental Policy (2012) to incorporate the value of natural
capital in government accounting have beenmet, leading to
increased policy awareness of ecosystem values.
A new generation of Kenyan tourist operators and man-
agers are trained and management and ownership of
tourist business shift towards Kenyans. Eco-tourism triples
in importance with close links between tourist visits and
community benefits, further financing good stewardship of
local ecosystems.
The implications for mangroves
The historic deforestation ofmangrovewoodswas halted in
2015 with implementation of the new national Mangrove
Management plan, and the total area has increased by
restoration of those areas that have not been permanently
converted to alternative land uses. This followed commu-
nity restoration of degraded areas which was led by the
Community Forest Associations which are now well estab-
lished and which benefit from the new political support for
local control of resources. The quality and therefore value of
the harvested mangrove wood has increased through
proper husbandry, and following a period of reduced rev-
enue from the sale of mangrove wood (which was neces-
sary for recovery) revenue from productive mangrove
services is higher than it was in 2013. All new destructive
industries, especially mines, are required in their Environ-
mental Impact Analyses to offset their biodiversity impacts
including their impacts on mangroves.
M. Huxham et al. / Journal of Environmental Management xxx (2015) 1e1410
1234567891011121314151617181920212223242526272829303132333435363738394041424344454647484950515253545556575859606162636465
66676869707172737475767778798081828384858687888990919293949596979899
100101102103104105106107108109110111112113114115116117118119120121122123124125126127128129130
YJEMA4776_proof ■ 11 April 2015 ■ 10/14
Please cite this article in press as: Huxham, M., et al., Applying Climate Compatible Development and economic valuation to coastalmanagement: A case study of Kenya's mangrove forests, Journal of Environmental Management (2015), http://dx.doi.org/10.1016/j.jenvman.2015.04.018

(under CCD). This was used to estimate changes in the percentageof a product which is obtained from mangroves (as compared toother sources of, say, firewood or building poles). For regulating andcultural services, a “quality of ecosystem service index”was appliedto the value of the ecosystem service per unit area. Indices werecalculated based on the year-on-year change in area, multiplied bya factor that is determined by the baseline forest status and qualityat each site and its assumed decline (under BAU) or improvement(under CCD) over time.
3.5. The economic impacts of forest ecosystem change under BAUand CCD
Running the economic scenario model shows that BAU willresult in a progressive decline in mangrove values over the next 20years, while CCD will see a sustained increase in ecosystem valuesover time (Fig. 4). The rate of increase in value under CCD willinitially be slow, as measures to achieve CCD are set in place; it willthen rise as these measures take effect, before slowing again as
mangroves are restored to a healthy functioning state and area. Thenet present value (NPV) of mangrove services to 2034 under theBAU scenario is US$42.85 million; under CCD it is US$ 61.01 million.
Over the 20 year period modelled, BAU will incur total losses ofaround US$41 million as compared to a continuation of the base-line, while CCD will lead to incremental benefits worth more thanUS$ 20 million in total (Table 5). These figures equate to a netpresent cost of US$ 12.38 million under BAU over and above thebaseline, and a net present value of US$ 5.77 million under CCD.
More than US$ 61 million additional value (with a NPV of US$18.16 million) will be generated over the next 20 years from CCD ascompared to BAU (Fig. 5). This is, in effect, the return to investing inclimate-compatible developmentmeasures (or, conversely, the costof policy inaction as regards sustainable coastal ecosystem man-agement). By the year 2034, mangrove ecosystem services will begenerating values worth almost US$ 10 million a year under theCCD scenario (almost 40%more thanwhat they are worth today), ascompared to under US$ 3 million under BAU (less than half of to-day's value).
Fig. 4. Mangrove ecosystem service values under BAU and CCD in 2014 KES million. Q9
Table 5Value-added by BAU and CCD in 2014 USD.
BAU value-added over baseline CCD value-added over baseline CCD value-added over BAU
Total NPV@10% Total NPV@10% Total NPV@10%
Timber, fuelwood & honey �7.94 �1.76 �4.29 �0.57 3.65 1.19Capture fisheries (finfish) �3.54 �0.98 0.99 0.26 4.53 1.25Capture fisheries (crustaceans) �2.12 �0.67 4.64 1.32 6.77 1.99Protection against coastal erosion �17.76 �5.76 4.11 1.02 21.87 6.78Protection against extreme weather events 1.07 0.17 10.25 2.51 9.18 2.33Carbon sequestration �9.24 �2.88 4.21 1.15 13.45 4.02Tourism, education & research �1.73 �0.50 0.33 0.08 2.06 0.59Total �41.27 �12.38 20.23 5.77 61.50 18.16
M. Huxham et al. / Journal of Environmental Management xxx (2015) 1e14 11
1234567891011121314151617181920212223242526272829303132333435363738394041424344454647484950515253545556575859606162636465
66676869707172737475767778798081828384858687888990919293949596979899
100101102103104105106107108109110111112113114115116117118119120121122123124125126127128129130
YJEMA4776_proof ■ 11 April 2015 ■ 11/14
Please cite this article in press as: Huxham, M., et al., Applying Climate Compatible Development and economic valuation to coastalmanagement: A case study of Kenya's mangrove forests, Journal of Environmental Management (2015), http://dx.doi.org/10.1016/j.jenvman.2015.04.018

4. Discussion
Our work is consistent with other studies (e.g. Barbier et al.,2011) in showing substantial value from a range of ecosystemservices, with regulating services that are currently mostly withoutmarkets having the highest economic value. The average currentvalue of USD 1166 ha �1 yr �1 is less than that found in most similarstudies in other parts of the world. This largely represents therelative paucity of infrastructure and low cost of land in southernKenya, as well as the conservative assumptions we used. It em-phasises the importance of contextualisation in such valuationstudies, since these sums are significant in the Kenyan context. Ourfigures are based on a large new socio-economic and ecologicaldataset and use real examples (such asMikoko Pamoja) in the studyarea to provide estimates for market values of services. Hence weare confident that they give a useful summary of current forestvalues and a baseline fromwhich to project our scenarios. Howeverthere are important omissions, including the roles of mangroves inenhancing the resilience and productivity of adjacent and con-nected ecosystems such as seagrass beds and coral reefs (e.g.Mumby, 2006), the existence value of biodiversity and the possiblerole that mangroves play in preventing saltwater intrusion intofreshwater aquifers (e.g. (Ridd and Sam, 1996)). Leaving these out(because there are no reliable ways to price them) means that wecapture only some of the services the forests supply. This is onereason why the figures presented here are not intended to repre-sent the ‘real’ value of the forests, in some abstract way. A second isthat the estimates of monetary value do not necessarily capture the
importance of ecological services to key users and agents. Forexample services such as firewood are of great and pressingimportance to the mostly poor and relatively marginalised groups(especially women) who rely on them despite being less econom-ically important compared with regulating services, the benefits ofwhich might accrue more broadly to society.
What the baseline economic analysis, combined with ourquantitative forest modelling and qualitative scenario building,does allow is a stark illustration of the economic consequences ofBAU and, conversely, of the opportunities for CCD. Recent trends arenegative and our BAU scenario shows economic losses of $47Million compared to baseline. However the policy landscape inKenya is broadly supportive of CCD. All stakeholder participantsagreed that key legislation (such as the Forest Act 2005 and theEnvironment Management and Co-ordination Act 1999) providedappropriate legal frameworks for forest conservation and inparticular for greater community control and support. A strikingfeature of these storyline scenario building conversations was thelevel of informed optimism shown by participants, who identifiedplausible pathways to a better future confident in the knowledgethat legislation did exist to facilitate CCD. Because much currentforest degradation is caused by piecemeal incursions driven by alack of alternatives and a failure to enforce current legislation CCDoptions may not require major opportunity costs or politicalstruggles. For example most of the forest area lost over the pasttwenty years has not been converted to high quality alternativeuses and is potentially available for restoration. Similarly theanalysis of forest quality showed significant economic over-harvesting at present with most of the remaining forest timber oflow quality; a properly managed harvesting regime should realisemuch higher returns on timber whilst also ensuring good regu-lating services.
We found the conceptual framework of CCD to be a useful prismthrough which to view current trends and options for changingthem. It also provides a shared platform that can accommodatestakeholders involved in development, climate change and con-servation discourses and policies and a new way to address someenduring challenges. For example integrated coastal zone man-agement should involve a careful consideration of the costs andbenefits of investment in ‘hard’ engineering compared withecosystem protection as an approach to coastal protection.Although ecosystem-based approaches to hazard mitigation have along pedigree they are still often ignored; Renaud et al. (2013, p9)conclude that ‘the role of ecosystems in the context of disasters isperhaps the most overlooked component in disaster risk reduction(DRR) and development planning’. Birkmann and von Teichman(2010) reveal that differing norms and scales of impact betweenthe climate change adaptation, development and DRR communitiesare partly to blame for this neglect. They recommend the wideradoption of cross-sectoral, multi-scale and integrative approachesto link DRR and climate change adaptation and to mainstream bothinto other activities on sustainable development. CCD combinedwith economic valuation provides a new way of achieving thisintegration. Because of its relevance to multiple sectors and scalesand its topicality in policy fora, CCD was an effective focus indrawing together the wide range of stakeholders we needed toconduct the scenario building exercises and explore relevant costsand benefits.
In the context of Kenyan mangroves, ‘triple wins’ that combineadaptation, mitigation and development are relatively easy toidentify. Because of the demonstrable importance of mangroves ascarbon sinks and in the face of climate change impacts, such as sealevel rise, conserving them will usually enhance mitigation andadaptation. The economic analysis of their range of services helpsshow how mangrove conservation can aid development too. Using
Fig. 5. CCD value-added over BAU in 2014 KES million.
M. Huxham et al. / Journal of Environmental Management xxx (2015) 1e1412
1234567891011121314151617181920212223242526272829303132333435363738394041424344454647484950515253545556575859606162636465
66676869707172737475767778798081828384858687888990919293949596979899
100101102103104105106107108109110111112113114115116117118119120121122123124125126127128129130
YJEMA4776_proof ■ 11 April 2015 ■ 12/14
Please cite this article in press as: Huxham, M., et al., Applying Climate Compatible Development and economic valuation to coastalmanagement: A case study of Kenya's mangrove forests, Journal of Environmental Management (2015), http://dx.doi.org/10.1016/j.jenvman.2015.04.018

the CCD concept helped make these links and synergies explicitduring our stakeholder conversations; this contrasts with howdevelopment and ‘conservation’ are often framed as in opposition.
Hence the broad message from our work is clear; there are largeeconomic and environmental gains to be had from a CCD scenario,in contrast to BAU, and such a scenario is plausible at least in outlineand could command widespread support from appropriate stake-holders. The challenge therefore is how to help steer policy andpractice towards CCD and away from BAU. Engagement with thefull range of stakeholders must be a key part of the answer, and wehope the approach described here illustrates a start in that process,explicitly in Kenya and as a possible model for other areas andecosystems. Whilst resources for the top-down enforcement oflegislation will remain limited there are many opportunities forlocal control and empowerment that already exist in Kenyanlegislation and local examples of how this approach is starting toimprove mangrove conservation. The analysis presented hereshows why it is in the economic, as well as social, interests of theKenyan government to work with NGOs, civil society and others tohelp realise those opportunities.
Uncited references
Spalding et al., 2010.Q6
Acknowledgements
We are grateful to the people of Gazi, Funzi, Vanga and Mwachecommunities who gave their time and expertise to this study. Theparticipants in the East African Forum for Payments for EcosystemServices November 2013 workshop collectively developed the CCDand BAU scenarios presented here and we thank them for theirtime and knowledge, and are particularly grateful to CarolineWanjiru for her organisation of that meeting. This work was fundedpartly with support from the Ecosystem Services for Poverty Alle-viation Programme (ESPA, Grant numbers NE/I003401/1). The ESPAprogramme is funded by the Department for International Devel-opment (DFID), the Economic and Social Research Council (ESRC)and the Natural Environment Research Council (NERC). It alsorepresents an output from the iCOAST project funded by the UKDepartment for International Development (DFID) and theNetherlands Directorate-General for International Cooperation(DGIS) for the benefit of developing countries. However, the viewsexpressed and information contained in it are not necessarily thoseof or endorsed by DFID, DGIS or the entities managing the deliveryof the Climate and Development Knowledge Network, which canaccept no responsibility or liability for such views, completeness oraccuracy of the information or for any reliance placed on them.Q5
References
Abuodha, P.A.W., Kairo, J.G., 2001. Human-induced stresses on mangrove swampsalong the Kenyan coast. Hydrobiologia 458, 255e265.
Aburto-Oropeza, O., Ezcurra, E., Danemann, G., Valdez, V., Murray, J., Sala, E., 2008.Mangroves in the Gulf of California increase fishery yields. Proc. Natl. Acad. Sci.U. S. A. 105, 10456e10459. http://dx.doi.org/10.1073/pnas.0804601105.
Agardy, T., Alder, J., Dayton, P., Curran, S., Kitchingman, A., Wilson, M., Catenazzi, A.,Restrepo, J., Birkeland, C., Blaber, S., Saifullah, S., Branch, G., Boersma, D.,Nixon, S., Dugan, P., Davidson, N., V€or€osmarty, C., 2005. Coastal systems, 2005.In: Hassan, R., Scholes, R., Ash, N. (Eds.), Ecosystems and Human Well-being :Current State and Trends : Findings of the Condition and Trends WorkingGroup. Island Press, Washington DC.
Alongi, D.M., 2014. Carbon cycling and storage in mangrove forests. Ann. Rev. Mar.Sci. 6, 195e219. http://dx.doi.org/10.1146/annurev-marine-010213-135020.
Bailly, D., Willmann, R., 2001. Promoting sustainable aquaculture through economicand other incentives. In: Subasinghe, R., Phillips, M., Bueno, P., Hough, C.,McGladdery, S., Arthur, J. (Eds.), Aquaculture in the Third Millennium. TechnicalProceedings of the Conference on Aquaculture in the Third Millennium,Bangkok. Food and Agriculture Organisation of the United Nations (FAO), Rome.
Bann, C., 1999. Contingent Valuation of the Mangroves of Benut, Johor State,Malaysia (Paper developed as part of the preparation of an Integrated Man-agement Plan for the Sustainable Use of the Johor Mangrove Forest, Johor StateForestry Department/DANCED/Darudec, Johor Bahru).
Barbier, E.B., Koch, E.W., Silliman, B.R., Hacker, S.D., Wolanski, E., Primavera, J.,Granek, E.F., Polasky, S., Aswani, S., Cramer, L. a, Stoms, D.M., Kennedy, C.J.,Bael, D., Kappel, C.V., Perillo, G.M.E., Reed, D.J., 2008. Coastal ecosystem-basedmanagement with nonlinear ecological functions and values. Science 319,321e323. http://dx.doi.org/10.1126/science.1150349.
Barbier, E.B., Hacker, S.D., Kennedy, C., Koch, E.W., Stier, A.C., Silliman, B.R., 2011. Thevalue of estuarine and coastal ecosystem services. Ecol. Monogr. 81, 169e193.http://dx.doi.org/10.1890/10-1510.1.
Birkmann, J., von Teichman, K., 2010. Integrating disaster risk reduction and climatechange adaptation: key challenges e scales, knowledge, and norms. Sust. Sci. 5,171e184.
Brown, K., Daw, T., Rosendo, S., Bunce, M., Cherrett, M., 2008. Ecosystem Services forPoverty Alleviation: Marine & Coastal Situational Analysis. Synthesis Report.University of East Anglia, Norwich.
Cohen, R., Kaino, J., Okello, J.A., Bosire, J.O., Kairo, J.G., Huxham, M., Mencuccini, M.,2013. Propagating uncertainty to estimates of above-ground biomass for Ken-yan mangroves: a scaling procedure from tree to landscape level. For. Ecol.Manag. 310, 968e982. http://dx.doi.org/10.1016/j.foreco.2013.09.047.
Conservation International, 2008. Economic Values of Coral Reefs, Mangroves, andSeagrasses: a Global Compilation. Center for Applied Biodiversity Science,Conservation International, Arlington.
Crona, B.I., R€onnb€ack, P., 2007. Community structure and temporal variability ofjuvenile fish assemblages in natural and replanted mangroves, Sonneratia albaSm., of Gazi Bay, Kenya. Estuar. Coast. Shelf Sci. 74, 44e52. http://dx.doi.org/10.1016/j.ecss.2007.03.023.
Dahdouh-Guebas, F., Van Pottelbergh, I., Kairo, J., Cannicci, S., Koedam, N., 2004.Human-impacted mangroves in Gazi (Kenya): predicting future vegetationbased on retrospective remote sensing, social surveys, and tree distribution.Mar. Ecol. Prog. Ser. 272, 77e92. http://dx.doi.org/10.3354/meps272077.
Das, S., 2007. Valuation of the Storm Protection Services of the Mangroves of Orissa.SANDEE Working Paper 25. South Asia Network for Development and Envi-ronmental Economics (SANDEE), Kathmandu.
De Mel, M., Weerathunge, C., 2011. Valuation of Ecosystem Services of the MahaOya. Environmental Foundation, Colombo.
De Wet, J., 2004. Establishing an Economic Value for the Mangroves of the Mnga-zana Estuary in the Eastern Cape. Thesis (M.Sc.). University of KwaZulu-Natal,Pietermaritzburg.
Dixon, J.A., 1989. The value of mangrove ecosystems. Trop. Coast. Area Manag.Newsl. 4, 5e8.
Emerton, L., 2006. Counting Coastal Ecosystems as an Economic Part of Develop-ment Infrastructure, Ecosystems and Livelihoods Group Asia. World Conserva-tion Union (IUCN), Colombo.
Emerton, L., 2013. Using valuation to make the case for economic incentives: pro-moting investments in marine and coastal ecosystems as development infra-structure. In: Essam, M. (Ed.), Economic Incentives for Marine and CoastalConservation: Prospects, Challenges and Policy Implications. Earthscan Press,London.
Emerton, L., 2014. Valuing & Investing in Ecosystems as Development Infrastruc-ture: Economic Analysis of Options for Climate-compatible Development inCoastal Zones of Kenya and Sri Lanka. iCOAST Technical Report. LTS Interna-tional Ltd, Penicuik.
Gilman, E.L., Ellison, J., Duke, N.C., Field, C., 2008. Threats to mangroves from climatechange and adaptation options: a review. Aquat. Bot. 89, 237e250. http://dx.doi.org/10.1016/j.aquabot.2007.12.009.
Giri, C., Ochieng, E., Tieszen, L.L., Zhu, Z., Singh, A., Loveland, T., Masek, J., Duke, N.,2011. Status and Distribution of Mangrove Forests of the World Using Earth,pp. 154e159. http://dx.doi.org/10.1111/j.1466-8238.2010.00584.x.
Grimsditch, G., 2011. Options for blue carbon within the international climatechange framework. Sustain. Dev. Law Policy 11, 22e24.
Huxham, M., 2013. Economic Valuation of Mangrove Ecosystem Services inSouthern Kenya. Report prepared for iCOAST Project. Napier University,Edinburgh.
Huxham, M., Kimani, E., Augley, J., 2004. Mangrove fish: a comparison of commu-nity structure between forested and cleared habitats. Estuar. Coast. Shelf Sci. 60,637e647.
Huxham, M., Kimani, E., Newton, J., Augley, J., 2007. Stable isotope records fromotoliths as tracers of fish migration in a mangrove system. J. Fish. Biol. 70,1554e1567. http://dx.doi.org/10.1111/j.1095-8649.2007.01443.x.
Huxham, M., Kimani, E., Augley, J., 2008. The fish community of an east africanmangrove : effects of turbidity and distance from the sea. West. Indian Ocean J.Mar. Sci. 7, 1e7.
IUCN., 2006. Valuation, Rehabilitation and Conservation of Mangroves in TsunamiAffected Areas: Rapid Mangrove Valuation Study, Panama Village in SouthEastern Coast of Sri Lanka. The World Conservation Union (IUCN), Ecosystemsand Livelihoods Group Asia, Colombo.
James, R., 1991. Wetland Valuation: Guidelines and Techniques. PHPA/AWB SumatraWetland Project Report No 31. Asian Wetland Bureau, Bogor.
Kairo, J.G., Lang’at, J.K.S., Dahdouh-Guebas, F., Bosire, J., Karachi, M., 2008. Structuraldevelopment and productivity of replanted mangrove plantations in Kenya. For.Ecol. Manag. 255, 2670e2677. http://dx.doi.org/10.1016/j.foreco.2008.01.031.
Kairo, J.G., Wanjiru, C., Ochiewo, J., 2009. Net pay: economic analysis of a replanted
M. Huxham et al. / Journal of Environmental Management xxx (2015) 1e14 13
1234567891011121314151617181920212223242526272829303132333435363738394041424344454647484950515253545556575859606162636465
66676869707172737475767778798081828384858687888990919293949596979899
100101102103104105106107108109110111112113114115116117118119120121122123124125126127128129130
YJEMA4776_proof ■ 11 April 2015 ■ 13/14
Please cite this article in press as: Huxham, M., et al., Applying Climate Compatible Development and economic valuation to coastalmanagement: A case study of Kenya's mangrove forests, Journal of Environmental Management (2015), http://dx.doi.org/10.1016/j.jenvman.2015.04.018

mangrove plantation in Kenya. J. Sustain. For. 28, 395e414. http://dx.doi.org/10.1080/10549810902791523.
Kimani, E., Mwatha, G., Wakwabi, E.O., Ntiba, J., Okoth, B.K., 1996. Fishes of a shallowtropical mangrove estuary, Gazi, Kenya. Mar. Freshw. Res. 47, 857e868.
King, D., 1998. The dollar value of wetlands: trap set, bait taken, don't swallow. Natl.Wetl. Newsl. 20 (4), 7e11.
Kirui, B.Y.K., Huxham, M., Kairo, J., Skov, M., 2008. Influence of species richness andenvironmental context on early survival of replanted mangroves at Gazi bay,Kenya. Hydrobiologia 603, 171e181. http://dx.doi.org/10.1007/s10750-007-9270-3.
Kirui, K.B., Kairo, J.G., Bosire, J., Viergever, K.M., Rudra, S., Huxham, M., Briers, R. a,2013. Mapping of mangrove forest land cover change along the Kenya coastlineusing landsat imagery. Ocean Coast. Manag. 83, 19e24. http://dx.doi.org/10.1016/j.ocecoaman.2011.12.004.
KNBS, 2010. Kenya Population and Housing Census 2009. Kenya National Bureau ofStatistics, Nairobi.
Kosoy, N., Corbera, E., 2010. Payments for ecosystem services as commodityfetishism. Ecol. Econ. 69, 1228e1236.
Lang'at, J.K.S., Kairo, J.G., Mencuccini, M., Bouillon, S., Skov, M.W., Waldron, S.,Huxham, M., 2014. Rapid losses of surface elevation following tree girdling andcutting in tropical mangroves. PLoS One 9, e107868. http://dx.doi.org/10.1371/journal.pone.0107868.
Lugendo, B.R., Nagelkerken, I. Van, Jiddawi, N., Mgaya, Y.D., Velde, G.V.A.N.D.E.R.,2007. Fish community composition of a tropical non-estuarine embayment inZanzibar. Tanzania 1213e1223. http://dx.doi.org/10.1111/j.1444-2906.2007.01458.x.
McNally, C., Uchida, E., Gold, A., 2011. The effect of a protected area on the tradeoffsbetween short-run and long-run benefits frommangrove ecosystems. PNAS 108(34), 13945e13950.
Mitchell, T., Maxwell, S., 2010. Defining Climate Compatible Development. PolicyBrief November 2010/A. Climate Development Knowledge Network, London.
Mohamed, M.O.S., Neukermans, G., Kairo, J.G., Dahdouh-Guebas, F., Koedam, N.,2008. Mangrove forests in a peri-urban setting: the case of Mombasa (Kenya).Wetl. Ecol. Manag. 17, 243e255. http://dx.doi.org/10.1007/s11273-008-9104-8.
Mumby, P.J., 2006. Connectivity of reef fish between mangroves and coral reefs:algorithms for the design of marine reserves at seascape scales. Biol. Conserv.128, 215e222. http://dx.doi.org/10.1016/j.biocon.2005.09.042.
Mumby, P.J., Edwards, A.J., Arias-Gonz�alez, J.E., Lindeman, K.C., Blackwell, P.G.,Gall, A., Gorczynska, M.I., Harborne, A.R., Pescod, C.L., Renken, H.,Wabnitz, C.C.C., Llewellyn, G., 2004. Mangroves enhance the biomass of coralreef fish communities in the Caribbean. Nature 427, 533e536. http://dx.doi.org/10.1038/nature02286.
Pamoja, Mikoko, 2011. Mikoko Pamoja Technical Specification. Plan Vivo, availableat: http://www.planvivo.org/projects/registeredprojects/mikoko-pamoja-kenya/.
Pretty, J.N., Noble, A.D., Bossio, D., Dixon, J., Hine, R.E., Penning De Vries, F.W.T.,Morison, J.I.L., 2006. Resource-conserving agriculture increases yields indeveloping countries. Environ. Sci. Technol. 40, 1114e1119.
Primavera, J., 1997. Socio-economic impacts of shrimp culture. Aquac. Res. 28,815e827.
Ranasinghe, T., Kallesoe, M., 2006. Valuation, Rehabilitation and Conservation ofMangroves in Tsunami Affected Areas of Hambantota, Sri Lanka: Economic
Valuation of Tsunami Affected Mangroves. The World Conservation Union(IUCN), Ecosystems and Livelihoods Group Asia, Colombo.
Renaud, F.G., Sudmeier-Rieux, K., Estrella, M., 2013. The relevance of ecosystems indisaster risk reduction. In: Renaud, F.G., Sudmeier-Rieux, K., Estrella, M. (Eds.),The Role of Ecosystems in Disaster Risk Reduction. United Nations UniversityPress, New York, ISBN 978-92-808-1221-3.
Ridd, P.V., Sam, R., 1996. Profiling groundwater salt concentrations in mangroveswamps and tropical salt flats. Estuar. Coast. Shelf Sci. 43, 627e635.
Rideout, A.J.R., Joshi, N.P., Viergever, K.M., Huxham, M., Briers, R.A., 2013. Makingpredictions of mangrove deforestation: a comparison of two methods in Kenya.Glob. Change Biol. 19, 3493e3501. http://dx.doi.org/10.1111/gcb.12176.
R€onnb€ack, P., Crona, B., Ingwall, L., 2007. The return of ecosystem goods and servicesin replanted mangrove forests: perspectives from local communities in Kenya.Environ. Conserv. 34, 313e324. http://dx.doi.org/10.1017/S0376892907004225.
Rounsevell, M.J., Metzger, M.J., 2010. Developing qualitative scenario storylines forenvironmental change assessment. Wiley Interdiscip. Rev. Clim. Change 1,606e619.
Rudd, M.A., Lawton, R.N., 2013. Scientists' prioritization of global coastal researchquestions. Mar. Policy 39, 101e111. http://dx.doi.org/10.1016/j.marpol.2012.09.004.
Sathirathai, S., 1998. Economic Valuation of Mangroves and the Roles of LocalCommunities in the Conservation of Natural Resources: Case Study of SuratThani, South of Thailand. EEPSEA Research Report. Environment and EconomicsProgram for South East Asia, International Development Research Centre,Ottawa.
Sathirathai, S., Barbier, E., 2001. Valuing mangrove conservation in SouthernThailand. Cont. Econ. Policy 19, 109e122.
Spalding, M., Kainuma, M., Collins, L., 2010. World Atlas of Mangroves. A Collabo-rative Project of ITTO, ISME, FAO, UNEP-WCMC. UNESCO-MAB, UNU-INWEHand TNC. Earthscan, London.
Tamooh, F., Huxham, M., Karachi, M., Mencuccini, M., Kairo, J.G., Kirui, B., 2008.Below-ground root yield and distribution in natural and replanted mangroveforests at Gazi bay, Kenya. For. Ecol. Manag. 256, 1290e1297. http://dx.doi.org/10.1016/j.foreco.2008.06.026.
TEEB., 2012. Why Value the Oceans?. A Discussion Paper. UNEP/GRID-Arendal DukeUniversity Nicholas Institute for Environmental Policy Solutions, UNEP TEEB,UNEP Regional Seas Programme.
Tychsen, J., Geertz-hansen, O., Schjøth, F., 2008. KenSea e tsunami damagemodelling for coastal areas of Kenya. Geol. Surv. Den. Greenl. Bull. 15, 85e88.
UNEP, 2011. Economic Analysis of Mangrove Forests : a Case Study in Gazi Bay,Kenya. United Nations Environment Programme, Nairobi.
UNEP-WCMC., 2011. Marine and Coastal Ecosystem Services: Valuation Methodsand Their Application. In: UNEP-WCMC Biodiversity Series No. 33. United Na-tions Environment Programme World Conservation Monitoring Centre (UNEP-WCMC), Cambridge.
Watson, R.T., Rosswall, T., Steiner, A., T€opfer, K., Arico, S., Bridgewater, P., 2005.Ecosystems and human well-being. Ecosyst. Millenn. Assess. 5, 1e100. http://dx.doi.org/10.1196/annals.1439.003.
Wattage, P., 2011. Valuation of Ecosystem Services in Coastal Ecosystems: Asian andEuropean Perspectives. In: Ecosystem Services Economics (ESE) Working PaperSeries No. 8.. Division of Environmental Policy Implementation, United NationsEnvironment Programme (UNEP), Nairobi.
M. Huxham et al. / Journal of Environmental Management xxx (2015) 1e1414
12345678910111213141516171819202122232425262728293031323334353637383940414243
44454647484950515253545556575859606162636465666768697071727374757677787980818283848586
YJEMA4776_proof ■ 11 April 2015 ■ 14/14
Please cite this article in press as: Huxham, M., et al., Applying Climate Compatible Development and economic valuation to coastalmanagement: A case study of Kenya's mangrove forests, Journal of Environmental Management (2015), http://dx.doi.org/10.1016/j.jenvman.2015.04.018