de economist (2007) 155:347–415 doi 10.1007/s10645-007
TRANSCRIPT

De Economist (2007) 155:347–415© Springer 2007DOI 10.1007/s10645-007-9070-1
DE ECONOMIST 155, NO. 4, 2007
SAVING AND INVESTING OVER THE LIFE CYCLE AND THEROLE OF COLLECTIVE PENSION FUNDS∗∗∗
BY
LANS BOVENBERG∗, RALPH KOIJEN∗, THEO NIJMAN∗, AND COEN TEULINGS∗∗
Summary
This paper surveys the academic literature on optimal saving and investment over an individ-ual’s life cycle. We start out with a simple benchmark model with separable and smooth prefer-ences, one aggregate risk factor and riskless wage income. Within this simple setting, optimal sav-ing and investment behavior are explored from the perspective of individuals. Subsequently, weinvestigate various constraints to optimal individual decision making. We discuss how collectivepension schemes may help to relieve some of the market incompleteness that arises from theseconstraints while at the same time introducing new types of constraints. Finally, various exten-sions to the benchmark setting are analyzed: a more elaborate modelling of human capital, addi-tional risk factors, and other types of preferences.
Key words: saving, investment, life cycle, pension schemes, defined contribution, defined benefit
JEL Code(s): D91, G11, G23
1 INTRODUCTION
This paper surveys the recent academic literature on optimal financial plan-ning of individuals over the life cycle and relates this to the optimal designof collective pension schemes in facilitating this planning. Collective pensionschemes can relieve borrowing constraints and enable intergenerational risksharing but usually impose uniform rules on heterogeneous participants. Weexplore the costs and benefits of collective pension schemes versus individ-ual schemes. Compared to other surveys of the literature on life-cycle con-sumption and saving (see e.g. Browning and Lusardi (1996) and Browningand Crossley (2001)), we explore how consumption decisions interact withrisk taking and focus on the role of pension schemes in facilitating life-cyclefinancial planning.
∗ Corresponding author: Theo Nijman, Netspar and Tilburg University, P.O. Box 90153, 5000LE, Tilburg, The Netherlands, e-mail: [email protected].∗∗ Netspar and University of Amsterdam, Roetersstraat 29, 1018 WB, Amsterdam, The Neth-erlands, e-mail: [email protected].∗∗∗ We thank Peter Kooreman for helpful comments on an earlier version and Roel Mehlkopffor research assistance.

348 BOVENBERG, KOIJEN, NIJMAN AND TEULINGS
Individuals face two main decisions in their financial planning over the lifecycle. Through the saving decision, they decide how to smooth consumptionover time by setting the pension premium and the pension benefits. Throughthe investment decision, individuals decide how to invest the premia in thevarious financial assets so as to smooth consumption across various futurecontingencies that may arise in the future. Under a set of "golden assump-tions," the young should invest a larger fraction of their financial wealth inrisky assets than the elderly (see e.g. Merton (1971) and Merton and Samuel-son (1974)). Indeed, life-cycle funds and target-date funds, which are basedon these principles, are popular investment vehicles in many countries.
Teulings and de Vries (2006) outline a stylized model to explore opti-mal financial planning over the life cycle. We outline in detail the argumentsunderlying their recommendations for individual saving and investment deci-sions. In addition, we investigate how robust their recommendations are withrespect to various extensions of their basic model. In particular, we explorealternative models for labor income, financial risks and preferences.
In addition to analyzing optimal saving and investment decisions overthe life cycle, we explore the role of financial intermediaries in general andpension funds in particular. Individuals delegate financial decision makingto financial intermediaries for a variety of reasons. First, individuals lackthe expertise to implement a financial plan for their lives. Second, financialintermediaries reduce the costs of long-term financial planning by benefitingfrom the scale economies associated with specialization in acquiring finan-cial expertise (e.g. asset management) and accessing financial markets. Com-pulsory participation in collective pension schemes allows these schemes tosmooth consumption across generations by shifting surpluses and deficits tofuture generations; the trustees of the pension scheme can decide whether topay out the surplus as dividends to current stakeholders (in the form of addi-tional pension benefits or lower pension premia) or to save the surplus forfuture participants.1 We explore the literature on the potential benefits of thisintergenerational risk sharing and investigate under which conditions thesebenefits dominate the costs of the homogeneous decision rules that these pen-sion schemes impose on heterogeneous participants. Financial intermediarieslike mutual funds and insurers offer individual plans and structured productsthat are more tailor-made to the specific preferences and circumstances of anindividual but this customization typically involves additional costs. Insurersand mutual funds, however, also execute and insure collective pension plansbased on compulsory participation, which involve risk sharing with futuregenerations but are typically not tailor-made to the individual.
1 Profit participating contracts issued by insurers in many countries are in fact very closelyrelated (see Nordahl and Dokseland (2006)). In particular, new generations may find these con-tracts attractive if they can benefit from surplusses that have not been distributed in the past.

SAVING AND INVESTING OVER THE LIFE CYCLE 349
Pension schemes may smooth income not only across generations but alsowithin contemporaneous groups of participants through redistribution.2 Toillustrate, pension contracts usually charge uniform prices for deferred annu-ities irrespective of the characteristics of individuals, such as sex and age (seee.g. Brown (2002), and Aarssen and Kuipers (2006)). Especially uniform con-tribution rates for deferred annuities with different deferral maturities tend toimply substantial value redistribution across younger and older workers (seee.g. Boeijen et al. (2006)). Redistribution of value can be analyzed by valu-ing all relevant claims at market value (see e.g. Kortleve and Ponds (2006)).3
In this paper, we largely abstract from the task of redistribution. Rather thanfinancial intermediaries, the government is often in a better position to redis-tribute across individuals. The reason is that governments are endowed withtax power over a larger pool of people: the nation as a whole. Collective pen-sion schemes, in contrast, wield less effective tax power – even if all workersin a sector are forced to participate in a sectoral scheme. The reason is thatlabor-market mobility within a country is generally larger than labor mobilitybetween countries.
Our analysis also abstracts from the employer as a risk-bearing agent. Theimplicit assumption is that the employer does not add to the risk-tradingopportunities on the capital market, for example by providing guaranteedbenefits at a lower price than what is available in the market. Indeed, firmsincreasingly mark-to-market the pension guarantees they provide to workersbecause international accounting rules force companies to put their pensionrisks on their balance sheets. Moreover, in trading risk with their employ-ers, employees will be saddled with the credit risk of the company they workfor. This makes risk trading between employer and workers within a firmless than optimal. Hence, employees trade risks on the capital markets andbetween one another in collective pension schemes. A defined-benefit planthus buys guarantees either on the capital market or from young and futureparticipants rather than from the firm that employs the workers.
The rest of this paper is structured as follows. Section 2 sets up our bench-mark framework for analyzing life-cycle financial planning. Within this frame-work, section 3 explores the optimal saving and investment behavior fromthe perspective of the individual. This section abstracts from constraints onintertemporal consumption smoothing and risk taking so that the resultingallocation is first best. Section 4 turns to various constraints on optimalindividual decision making due to imperfections in markets and individual
2 Risk sharing ex ante (i.e. before uncertainty is resolved) becomes redistribution ex post(i.e. after uncertainty is resolved). We thus explore redistribution as the ex-post outcome ofan insurance of risk-sharing contract.3 The analysis is this paper is crucially different because in these papers the assmption ismade that agents unwind the contribution and investment rules imposed by the pension fund.

350 BOVENBERG, KOIJEN, NIJMAN AND TEULINGS
decision making. Collective pension schemes may help to relieve some ofthese constraints on individual decision making and individual behavioralbiases but are also likely to introduce new types of constraints. Section5 investigates the optimal design of collective pension schemes within ourbenchmark framework, including risk sharing across generations through thetransfer of (possibly negative) surpluses over time. This section discusses whenand how compulsory pension plans can securitize human capital of currentand future participants. By thus allowing young generations and future gen-erations to borrow against their human capital, these generations can partic-ipate in risk taking and therefore take advantage of the equity risk premium.Section 6 surveys the recent literature on various extensions to the benchmarkmodel: a more elaborate modelling of human capital, financial and actuar-ial risk factors, and preferences. Mathematical equations are kept to a min-imum in the main text. Technical derivations are available in an appendix tothe working paper version of this paper (see Bovenberg et al. (2007)).
2 THE BENCHMARK MODEL
This section lays out our benchmark framework for exploring optimal life-time saving and investment (see also Merton (1971), Merton and Samuelson(1974); Teulings and de Vries (2006)). It describes our benchmark assump-tions on financial markets, labor markets and preferences and discusses theparameter values employed in our numerical simulations.
2.1 Financial Markets
• A risk-free asset (a bond) is available.• Equity-market risk is the only aggregate risk factor, which is traded through
equity. Housing is abstracted from.• The interest rate, inflation, the volatility of equity, and the equity risk pre-
mium are constant over time so that mean reversion and stochastic volatil-ity are absent. These prices are not affected by the decisions of individualsor financial intermediaries. We thus take a partial-equilibrium perspectiveof a small open economy, which takes prices as given on the world market.
• Log stock returns are identically and independently distributed accordingto a normal distribution.
• Financial markets are dynamically complete if households and pensionfunds can continuously trade stocks and bonds without constraints. Insome cases, households and pension funds face constraints.

SAVING AND INVESTING OVER THE LIFE CYCLE 351
• Death is predictable or perfect insurance of individual longevity risk isavailable. Aggregate longevity risk is thus absent.4
• Whenever we consider the presence of collective pension schemes weassume that participants have access to the capital markets only throughtheir pension scheme. From the household’s perspective markets are thusincomplete. Hence, individuals cannot offset the policies of their pensionscheme by engaging in offsetting capital-market transactions. Consumptionduring the active period (i.e. when working) equals wage income minus thepension premium. Consumption in retirement is given by the pension ben-efit.
2.2 Labor Markets
• The after-tax wage during the working career is constant and riskless witha fixed, exogenous retirement age.5 Human capital is thus paid out in theform of constant wage income until it is fully depleted at the age of retire-ment. Moreover, labor-market risks are absent.
• Labor supply is fixed.• Wages are exogenous: pension premia thus reduce disposable incomes one
for one.
2.3 Preferences
• Individuals aim to maximize lifetime utility, which is the weighted sum overtime of expected utility at each point in time. Utility at a point in timedepends only on consumption at that time. The weights of future expectedutilities decline exponentially at the so called rate of time preference. Hence,people are impatient: at equal levels of consumption a marginal unit offuture consumption adds less to utility than current consumption
• Preferences feature positive and constant relative risk aversion.Consumption in each contingency adds to utility. At larger levels ofconsumption, however, additional consumption adds less to utility. Thenegative elasticity of marginal utility with respect to the level of consump-
4 Even with ideosyncratic longevity risk but the absence of life insurance, the results belowsurvive if the length of individual life time is distributed exponentially (see Viceira (2001)).5 We abstract from taxes on capital income. A constant rate of consumption tax reduces con-sumption in each period and each contingency proportionally and will thus not affect savingand investment decisions (except that all savings and investments are scaled back proportion-ally). Such a consumption tax is equivalent to an income tax with a constant marginal ratethat treats pension saving on a so-called cash-flow basis (i.e. premia are tax deductable whilebenefits are taxed) if the tax rate against which premia can be deducted is equal to the taxrate at which the benefits are taxed.

352 BOVENBERG, KOIJEN, NIJMAN AND TEULINGS
tion is known as the coefficient of relative risk aversion. This measure forthe sensitivity of marginal utility with respect to the level of consumptionis constant and thus does not depend on the consumption level.Positive risk aversion implies that individuals have a taste for moderationacross time and across contingencies. They prefer a smooth consumptionlevel (with a low variance) rather than a highly volatile consumptionstream (with a high variance) over time or across contingencies. Moregeneral models (than expected utility) distinguish the taste for moderationacross contingencies from the taste for moderation across time. Risk aver-sion measures the taste for moderation across random outcomes. Highlyrisk-averse individuals feature a strong preference for stable consumptionlevels across various contingencies. They want their consumption level tobe certain (’stable’) irrespective of what happens (which is reflected in thecosts of maintaining the consumption level in a particular contingency).The taste for moderation across time is related to the intertemporal elastic-ity of substitution. An individual exhibiting a low intertemporal elasticityof substitution prefers a stable level of consumption over time.
• Bequest motives are absent.• Individuals start consuming when they enter the labor market.
2.4 Benchmark Parameters in Numerical Simulations
We illustrate our results with numerical simulations. Following Teulings andde Vries (2006), these simulations are based on a constant coefficient of riskaversion of 5, a working life of 45 years, an expected retirement period of 15years, a rate of time preference and a risk-free interest rate of 2% per year, anequity risk premium of 4% a year, and a standard deviation of stock returnsof 20% per year.
3 SAVING AND INVESTING OVER THE LIFE CYCLE: THE FIRST BEST
3.1 Introduction
This section derives the first-best solution to the financial planning problemof the investor under the assumptions as outlined in section 2. We analyzethis case in depth because it generates intuition and benchmark results for thefindings in more elaborate models. Section 3.2 explores consumption smooth-ing (i.e. saving decisions) in the absence of risk. Section 3.3 investigates opti-mal asset allocation in case of risky investment opportunities. Section 3.4returns to optimal consumption smoothing but considers the case with riskyassets.

SAVING AND INVESTING OVER THE LIFE CYCLE 353
3.2 Intertemporal Consumption Smoothing Without Risk
This section focuses on consumption smoothing over time in the absence ofrisk. Together with the depreciation of human capital due to aging, the pref-erence for a smooth consumption stream over time gives rise to a demandfor pension saving. Individuals want to move part of the income from theirhuman capital when they work to the periods in which they still would like toconsume even though they do not collect any labor income anymore. Capitalmarkets allow individuals to engage in intertemporal trade,6 with the inter-est rate measuring the reward for transferring resources to a later date. Inparticular, through capital markets, one can exchange resources in the activeperiods of life, when labor resources are relatively abundant but consump-tion is not so valuable at the margin, to the inactive periods of life whenconsumption is relatively more valuable at the margin but labor resourceshave already been depreciated. By investing pension premiums collected froman active individual in financial assets, financial institutions (pension funds,mutual funds, insurers) facilitate this intertemporal trade through capital mar-kets. The financial institution in effect transforms part of human capital ofthe individual into a claim of that individual on that institution. These claimsare secured by financial capital, which can be sold in retirement so that theindividual can maintain his standard of living.
3.2.1 Perfect Consumption Smoothing Without ImpatienceThe simplest case to consider is when the real interest rate is zero,7 indi-viduals are not impatient (i.e. the rate of time preference is zero), and wageincome is constant during the active life. In that case, complete consumptionsmoothing is optimal: consumption should remain constant during the lifecycle. The life-time budget constraint limits the level of consumption. Over-all wealth, which consists of human and financial wealth, measures lifetimeresources. The individual begins the working life without any financial wealthso that he relies on human wealth only. As the discounted value of life-timewage income, human wealth at the beginning of the active life is simply thenumber of active years times the annual wage income; labor income today isequally valuable as labor income tomorrow because the real interest is zero.
The life-time budget constraint implies that the discounted value of con-sumption (the sum of all consumption flows during the life course in the caseof a zero discount rate) cannot exceed human wealth. A constant consump-tion flow equal to the share of the active life in the remaining life time timesthe labor income flow during the active life exactly exhausts human capital at
6 This trade is similar to trade in other markets except that goods at different dates areexchanged.7 Recall that risk is absent. Hence, this is the risk-free interest rate.

354 BOVENBERG, KOIJEN, NIJMAN AND TEULINGS
20 30 40 50 60 70 800.7
0.8
0.9
1
1.1
1.2
Age
Ex
pe
cte
dc
on
su
mp
tio
nwithout risky investmentswith risky investments
Figure 1 – Expected consumption path (Ct ) over the life-cycle if the real interest rate is zero(r =0) and the individual is not impatient (ρ=0). Investment risk is absent
the end of life. The savings rate is thus equal to the share of retired life in theoverall adult life. Whereas human wealth is depleted at the rate of the laborincome flow, overall wealth is depleted at a lower speed because part of thelabor income flow is transformed into financial wealth. At the age of retire-ment, human capital is exhausted so that wealth consists of financial wealthonly. Financial wealth is at its maximum at the retirement age after which itis gradually depleted. However, since part of human capital is used for con-sumption during the working career, total wealth is less at the retirement agethan at the start of the career: as a ratio of initial human wealth, financialwealth at retirement equals the share of the inactive life in the overall adultlife.
Figures 1 and 2 illustrate the consumption decision and its implications forthe trajectory of financial, human and overall wealth. The solid line in Fig-ure 1 illustrates that in this simplest case without risky investments the con-sumption pattern is flat and that a quarter of labor income is saved for retire-ment. the dotted line refers to the case with risky investments and will be dis-cussed in section 3.4. Figure 2 shows that overall wealth is depleted at threequarters of the speed at which human capital is depreciated. At its maximum,financial wealth equals a quarter of initial human wealth. The figure indicatesthat human wealth dominates financial wealth (i.e. pension wealth) for mostpart of the active working life. Labor markets thus play a key role in financialplanning over the life cycle. Younger people are ceteris paribus wealthier thanolder people because they have a longer expected life time in front of themand have consumed less of their human capital.

SAVING AND INVESTING OVER THE LIFE CYCLE 355
20 30 40 50 60 70 800
5
10
15
20
25
30
35
40
45
Age
Wea
lthFinancial wealthHuman wealthTotal wealth
Figure 2 – Trajectories for financial wealth (Ft ), human wealth (Ht ) and total wealth (Wt ) overthe life-cycle in the case with a zero real interest rate (r = 0) and without impatient individuals
(ρ=0) and risk
3.2.2 Perfect Consumption Smoothing with Impatience If the Real RateEquals the Time PreferenceIndividuals are typically impatient. This implies that individuals should berewarded for saving through positive interest rates. If the real interest rateequals the rate of time preference, the individual still finds a constant con-sumption stream optimal because the reward of waiting (i.e. the interest rate)exactly balances the cost of waiting (i.e. the rate of time preference). Com-pared to the case with a zero interest rate and a zero rate of time preferences,the consumption level can be higher ceteris paribus because the pension saverbenefits from positive net interest income on his accumulated savings.Witha positive interest rate, consumption is higher even although the presentvalue of human capital is lower at the beginning of life. The value of futurelabor income declines because a positive interest rate indicates that a resourceearned tomorrow is worth less than a resource today. Hence, if the individualwould consume all his income today, he would be able to consume less com-pared to the case with a zero interest rate. However, since the individual pre-fers a stable consumption path over time, consumption occurs on average at alater date than labor income is received. The individual thus enjoys a positiveincome effect if the interest rate rises above zero.
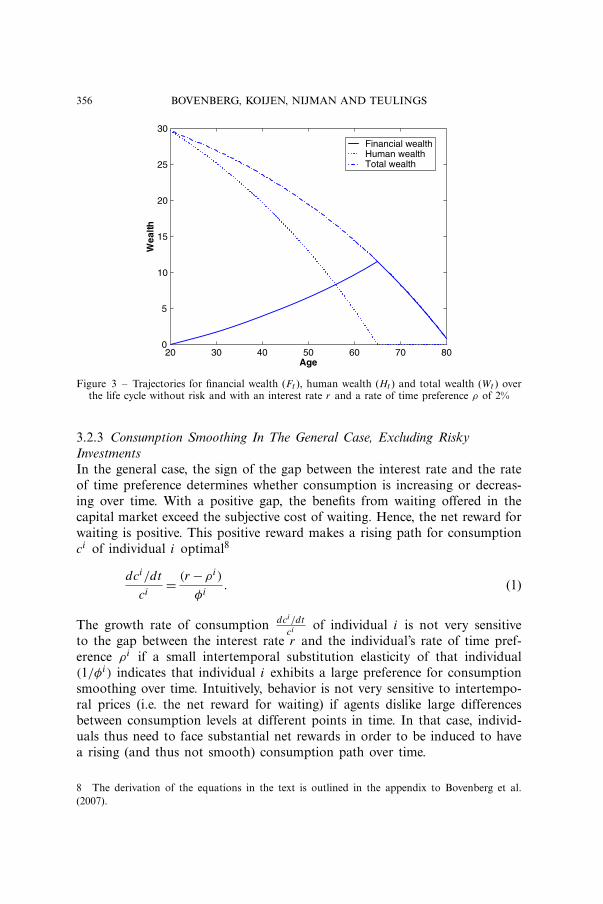
Figure 3 involves the case in which the rate of time preference ρi equals2% and the interest rate is 2%. Financial wealth at retirement is a larger shareof initial human wealth than in the case in which both the rate of time pref-erence and the real interest rate are zero.
356 BOVENBERG, KOIJEN, NIJMAN AND TEULINGS
20 30 40 50 60 70 800
5
10
15
20
25
30
Age
Wea
lthFinancial wealthHuman wealthTotal wealth
Figure 3 – Trajectories for financial wealth (Ft ), human wealth (Ht ) and total wealth (Wt ) overthe life cycle without risk and with an interest rate r and a rate of time preference ρ of 2%
3.2.3 Consumption Smoothing In The General Case, Excluding RiskyInvestmentsIn the general case, the sign of the gap between the interest rate and the rateof time preference determines whether consumption is increasing or decreas-ing over time. With a positive gap, the benefits from waiting offered in thecapital market exceed the subjective cost of waiting. Hence, the net reward forwaiting is positive. This positive reward makes a rising path for consumptionci of individual i optimal8
dci/dt
ci= (r −ρi )
φi. (1)
The growth rate of consumption dci /dtci of individual i is not very sensitive
to the gap between the interest rate r and the individual’s rate of time pref-erence ρi if a small intertemporal substitution elasticity of that individual(1/φi ) indicates that individual i exhibits a large preference for consumptionsmoothing over time. Intuitively, behavior is not very sensitive to intertempo-ral prices (i.e. the net reward for waiting) if agents dislike large differencesbetween consumption levels at different points in time. In that case, individ-uals thus need to face substantial net rewards in order to be induced to havea rising (and thus not smooth) consumption path over time.
8 The derivation of the equations in the text is outlined in the appendix to Bovenberg et al.(2007).

SAVING AND INVESTING OVER THE LIFE CYCLE 357
Expression (1) implies that the optimal consumption level and the optimalpension contribution depend on the parameters that describe the preferencesof the individual. Collective schemes that impose identical contribution rateson participants that exhibit heterogeneous preferences thus cannot be opti-mal. We will return to this issue in sections 4 and 5.
3.2.4 Shocks in Wealth and Consumption SmoothingThe rate at which overall wealth is consumed depends on age. Since olderpeople features a shorter planning horizon, they consume a larger share oftheir overall wealth. If both a young and an old person get one additionaleuro, the old person will consume the euro more rapidly. However, if bothagents obtain x% more wealth, both agents will increase their consumptionby x% during the rest of their lives.9 Intuitively, the preference for modera-tion associated with the concave utility function implies that the agents wantto spread the increase in wealth as broadly over their life time as possible.Hence, rather than spending it in a few periods, they choose to enjoy thewealth boost in equal relative consumption increases in each period duringthe rest of their lives
d log Cis
d log W it
=1,
where s ≥ t, (2)
W it stands for total wealth (i.e. the sum of human and financial wealth)
of individual i at time t and Cis denotes consumption of that individ-
ual at time s. The unitary elasticity of the consumption flow (in the restof the life time) with respect to wealth imply that both pension contribu-tions should decline and pension benefits increase following a positive wealthshock. Hence, rather than a pension system that keeps the premium fixed(a defined-contribution system) or a pension system that fixes the benefits (adefined-benefit system), a hybrid system that adjusts both premia and benefitsin response to income and wealth shocks appears to be optimal.
3.3 Risk Taking
Financial markets allow agents to shift consumption not only across time, butalso across various future contingencies when agents face uncertainty aboutwhich contingency will actually materialize. In particular, risk-averse individu-als can buy resources in bad states by giving up resources in good states. Justas in the case of optimal consumption smoothing over time, we can distin-guish between the preferences for consumption smoothing (across contingen-
9 This requires that the intertemporal elasticity of substution is fixed over the life course,which has been assumed in section 2.

358 BOVENBERG, KOIJEN, NIJMAN AND TEULINGS
cies rather than time so that risk aversion rather than the intertemporal elas-ticity of substitution measures this preference) and the prices for consumptionsmoothing (in this case, instead of the net interest rate (r − ρi ), the Sharperatio, which is defined as the expected excess return (over the risk-free return)per standard deviation of the excess return, is relevant).10
How much risk the individual optimally chooses to absorb depends onboth risk aversion and the risk premium (for each unit of risk as measuredby the Sharpe ratio, which can be interpreted as the reward for risk taking).The individual i chooses the optimal amount of risk in such a way that hiscoefficient of relative risk aversion (i.e. the negative elasticity of marginal util-ity with respect to consumption), θ i , equals the marginal rate of substitutionbetween the excess return of risk taking fi µ̄ and variance f 2
i σ2 :
θ i = fiµ
f 2i σ
2(3)
where µ̄ and σ stand for the expectation and the standard deviation of theexcess return on the risk factor,11 while fi represents the individual i ’s shareof total wealth invested in the risky asset. This implies that
fiσ = λ
θ i, (4)
where λ≡ µ̄/σ denotes the Sharpe ratio so that the optimal expected excessreturn due to risk taking amounts to fi µ̄=λ2/θ i . Risk taking (i.e. volatilityof consumption across various contingencies) as measured by fiσ increaseswith the reward to risk taking λ and decreases with the preference for con-sumption smoothing (i.e. a certain consumption level independent of contin-gencies) as measured by relative risk aversion θ i . Note that fi can be largerthan unity. In that case, the worker should go short in bonds to buy the riskfactor. With our benchmark parameters, the Sharpe ratio λ and the standarddeviation σ are both 0.2 while relative risk aversion amounts to five. The opti-mal investment share fi is thus 20%.
The expression for optimal consumption smoothing across contingencies(4) is similar to that for optimal consumption smoothing across time (1). In
10 In complete capital markets, resources in each contingency have a single, unique price.Capital markets are complete if the number of not perfectly correlated assets is equal to thenumber of risk factors and these assets can be traded continuously. If agents can freely tradein complete capital markets (as we assume in section 3), we can measure the utility value ofthe property rights of individuals on resources by a single metric: wealth. In the presence ofconstraints (as in Section 4), in contrast, individuals do not equate their marginal rates ofsubstitution (the ratios of their marginal utilities) to market prices. Hence, the market valueof assets do not fully describe the utility value of these resources.11 Assume that the relative change in the risk factor (in excess of the risk-free return) is
distributed normally: ln (�risk factor)∼ N(µ,σ 2
). Then: µ̄≡ ln(E�risk factor )=µ+ 1
2σ2.
SAVING AND INVESTING OVER THE LIFE CYCLE 359
both cases, the right-hand side involves the net price for smooth consump-tion (i.e. the Sharpe ratio λ in the case of (4) and the net interest interest rate(r −ρi ) in the case of (1)) and the preference for consumption smoothing (i.e.relative risk aversion θ i in the case of (4) and the reciprocal inverse intertem-poral substitution elasticity (1/φi ) in the case of (1)). Prices and preferencestogether determine the optimal inequality in consumption (across contingen-cies as measured by fiσ or time as measured by the growth rate of consump-tion) at the left-hand side of these expressions.
3.3.1 Optimal Investment Share Age InvariantThe share fi of total wealth invested in the risk factor does not depend onage, or more generally, the investment horizon. Suppose that we invest for tyears rather than one year. In that case, both the excess return fi µ̄t and thevariance of the excess return f 2
i σ2t in (3) vary proportionally with the length
of the investment period so that the optimal investment share is not affectedby the time horizon. In other words, both the marginal benefits and the mar-ginal costs of investing more in equity rise linearly with time.12 This reasoningshows that the familiar argument that time diversification allows young peo-ple to take more risk is fallacious and relies on a wrong interpretation of thelaw of large numbers. The sum of n independent and identically distributedrandom variables has a variance that is n times larger than the variance ofeach of the separate risks. The law of large numbers, in contrast, states thatthe variance of the average (rather than the sum) of n independent and iden-tically distributed random variables goes to zero if n becomes very large.13
Mossin (1968), Merton (1969) and Samuelson (1969) first independentlyderived the result that the investment share in the risky asset is independentof age, in contrast to the speed with which wealth is consumed. As we notedin the subsection on consumption smoothing over time above, the elasticityof consumption with respect to wealth is unity and thus independent of age.Hence, a young person is equally vulnerable (in terms of the relative change inthe consumption flow, which is relevant in case relative risk aversion is con-stant) to the same relative change in wealth and should thus ceteris paribushold the same wealth share (as opposed to the absolute amount of wealth) in
12 This is the case with smooth preferences. Subsection 6.3.4 shows that if preferences arecharacterized by loss aversion the costs of risky investment rise less rapidly with the horizonthan the benefits do.13 Another reasoning maintains that the benefit of investing in equity is the excess return,which increases linearly with the length of time, while the cost is the standard deviation of thatreturn, which rises only with the square root of that length because the drawings are indepen-dent across time. With a smooth twice differentiable utility function, however, the costs of riskare captured by the variance rather than the standard deviation. See also sub-section 6.3.4 onloss aversion in which case the costs of risk are in fact closely related to the standard devia-tion and thus rise less rapidly with the time horizon than the benefits do.

360 BOVENBERG, KOIJEN, NIJMAN AND TEULINGS
risk-bearing assets.14 If the investment share fi would depend on age, peoplewould bear more consumption risk in some parts of their lives than in oth-ers. With constant relative risk aversion, this would generate opportunities formore efficient interpersonal allocation of risk.
3.3.2 Optimal Risk Sharing Across Individuals And TimeOptimal risk sharing when a shock hits implies that marginal utilities of con-sumption in the remaining lives of all agents changes with the same percent-age. The combination of optimal consumption smoothing (i.e. optimal saving,see (2)) and optimal investment (see (4)) accomplishes exactly that. In par-ticular, a standard deviation in the risk factor changes wealth by 100λ/θ i %(according to (4)) and thus (from (2)) also consumption during the rest ofthe life of all living generations by that percentage. This yields a relativechange in marginal utility of consumption of 100λ%, which is the same forall households. We thus see that (2) and (4) ensure that a shock is distributedas broadly as possible over the currently living individuals. All these individu-als are affected and they are affected during their entire remaining lives. Con-sumption of these individuals behaves in the same fashion as the risk factor,namely as a random walk.
3.3.3 Non-Tradable Human Wealth: The Investment Share Of TradableFinancial WealthHuman wealth is non tradable.15 Hence, financial rather than human wealthshould be adjusted to achieve the right exposure to risk factors. If humancapital is riskless, it acts like a risk-free asset and all the exposure to riskshould come from financial wealth. As the wealth share of financial wealthincreases from zero to one during the working life, the share of financialwealth invested by individual i in risk-bearing assets, f ∗
i , falls from infinityat the beginning to fi at retirement:
f ∗i t = Si
t
Fit
= fiW i
t
Fit
= fi
(1+ Hi
t
Fit
)= 1θ i
λ
σ
(1+ Hi
t
Fit
), (5)
where Sit , Fi
t and Hit denote, respectively, wealth invested in the risk factor,
financial wealth, and human wealth at time t by individual i so that W it =
14 This assumes that the young and the old person share the same relative risk aversion.Gollier and Zeckhauser (2002) show that this requires that absolute risk tolerance is propor-tional to wealth. If this is not the case, the wealthier young person does not feature the samerelative risk aversion as an older person who shares the same utility function and labor incomepath over the life cycle. Fortunately, the possible non-proportionality of absolute risk toleranceyields only a marginal effect on the optimal portfolio of young investors (see Gollier (2005)).15 Other illiquid assets are owner-occupied housing and privately owned businesses. Theseassets may have similar risk characteristics as equity.

SAVING AND INVESTING OVER THE LIFE CYCLE 361
Hit + Fi
t . This financial wealth share tends16 to fall for two reasons. First, theabsolute amount of wealth invested in equity (or risk-bearing assets) tendsto fall with time as an individual consumes part of human wealth duringthe working life (so that Wt tends to decline with time). Second, the stockof financial wealth Ft tends to increase as the individual saves part of theirhuman capital. The economic intuition why the young should hold a largercomponent of their financial wealth in stocks is that the young are less depen-dent on financial wealth for their consumption because they have an alter-native income source in the form of labor income. They thus can afford totake more risk with financial wealth than elderly agents who depend almostentirely on this type of wealth for their livelihood.
3.3.4 Young Go Short to Acquire Optimal Risk ExposureEquation (5) indicates that the optimal share of financial wealth that isinvested in the risk factor can well be above one if financial capital is smalland human capital substantial. This is typically the case early in the life cycle.At the beginning of one’s career, one should thus borrow to acquire the risk-bearing assets. On the basis of benchmark parameters, Teulings and de Vries(2006) and Bodie et al. (1992) find that a young worker may want to borrowas much as six times his annual salary and invest this in the equity market.Investment in housing financed by mortgages can contribute to efficient riskbearing at younger ages if housing risk is correlated with equity risk.
Figure 4 illustrates the horizon dependence of the asset allocation of finan-cial wealth. The solid line specifies the expected fraction of financial wealthinvested in equity over the life cycle. The dotted lines provide 10%- and 90%-quantiles of the optimal fraction of financial wealth that is invested in equity.These quantiles indicate that, depending on the actual investment returnsexperienced in the past, the optimal asset allocation can deviate from the apriori expected allocation. Figure 4 shows that financial wealth can get nega-tive in which case the optimal exposure can be negative. It also presents theoptimal fraction of wealth that is invested in equity for two randomly selected
16 We use the word ’tends’ here because unexpectedly positive shocks may temporarily raisefinancial wealth so much that it offsets the depreciation of human capital. Conversely, adverseshocks may cause financial wealth to fall even though the individual saves part of his laborincome.Another reason why the ratio Ht/Ft may not decline that steeply is that retired agents maybenefit from a first-pillar pension indexed to wages. In that case, a part of pension wealth islike human capital so that also retirees rely to some extent on human capital.Finally, especially high-skilled workers can experience rapid labor-income growth in the begin-ning of their career. Hence, human capital may increase in the beginning of the career. Atthe same time, financial wealth remains small (and even become negative) as intertemporalconsumption smoothing gives rise to low saving rates. As human capital thus increases com-pared to financial wealth in the beginning of life, also the equity share in financial wealth f ∗increases (see Cocco et al. (2005)).

362 BOVENBERG, KOIJEN, NIJMAN AND TEULINGS
20 30 40 50 60 70 80-5
0
5
10
Expectation10% quantile90% quantileScenario path 1Scenario path 2
Fra
ctio
n o
f fi
nan
cial
wea
lth
inve
sted
in s
tock
s
Figure 4 – Share of financial wealth invested in risky assets ( f ∗t ) over the life-cycle with the
benchmark parameters (r =2%, ρ=2%, λ=0.2)
scenarios. The same scenarios will be used in subsequent graphs to illustratethe evolution of consumption and wealth. The scenario’s in figure 4 show thatthe optimal equity share in financial wealth is very volatile because financialwealth is very small early in the life cycle.
3.4 Intertemporal Consumption Smoothing with Risk
Section 3.2 explored optimal saving without risk. This subsection reconsid-ers optimal saving behavior in the presence of risky investment opportunities(see also figure 1, which compares consumption behavior in both the absenceand the presence of risk if agents are not impatient (i.e. ρi = 0) and the realinterest rate is zero (i.e. r = 0)). The introduction of risk affects optimal sav-ing through two channels. First, risk taking enhances welfare because inves-tors can now capture the equity premium. This positive income effect dependson the risk premium fi µ̄ and raises optimal consumption and reduces theoptimal pension premium (i.e. saving out of labor income). Intuitively, partof retirement saving is financed out of the risk premium. Second, risk tak-ing introduces a precautionary saving motive. The sign of this motive dependson whether marginal utility is convex (i.e. on the sign of the third derivativeof the utility function). In particular, risk implies an additional precaution-ary saving motive if marginal utility is convex so that the expected marginalutility of consumption (which determines the savings motive if the futureis uncertain) exceeds the marginal utility of expected consumption (whichdetermines the savings motive if the future is certain). Intuitively, transferring

SAVING AND INVESTING OVER THE LIFE CYCLE 363
resources to the future adds more to utility if the future becomes more uncer-tain. If the third derivative of the utility function is positive, the consumer isprudent (see Leland (1968)).
With a constant relative risk aversion, marginal utility is indeed convexso that the investor is prudent. As a direct consequence, the introduction ofrisk unambiguously increases the growth rate of expected consumption. Witha variance of ψ2
i = f 2i σ
2 on aggregate wealth, we derive for a CRRA utilityfunction (with φi = θ i , which we impose for the rest of this section and sec-tions 4 and 5) and the optimal investment share fi = λ
σθ i that the expectedgrowth rate of consumption can be written as17
Edci/dt
ci= (r −ρi + (1+θ i )
2 θ iψ2i )
θ i= (r −ρi + (1+θ i )
2λ2
θ i )
θ i(6)
Hence, more risk ψi ceteris paribus raises the rate of time preference (orthe growth rate of labor income) that is required to ensure that expectedconsumption is constant over the life cycle so that the expected pension pre-mium is constant during the working life.18 With our benchmark parame-ters the expected growth rate of consumption amounts to 0.48% per year. Inthe present setting, the actual consumption and wealth trajectories can verywell deviate substantially from their expectation. Figures 5 and 6 present theexpectation, some quantiles and two scenario’s of the consumption path andthe corresponding wealth trajectories over the life-cycle.
3.4.1 Cohort Effects in Premium RatesFor individuals with the same preferences but different birth dates, the opti-mal premium rate starts at the same level (Ft =0). Subsequently, the optimalpremium rates move parallel in response to shocks. This implies that individ-uals of different cohorts pay different premium rates at the same age becausethey have experienced different shocks. Figures 7 and 8 provide examples ofhow consumption and financial wealth are affected by shocks. At any point
17 The overall effect on consumption at the beginning of the working life depends on the
sign of 12 fiµ− (1+θ i )
4 f 2i σ
2. At the optimal investment share (4) this is given by λ2(θ i −1)2θ i2 .
The first term 12 fiµ represents the welfare gain (i.e. the Harberger triangle) from being able
to invest in risky assets. The second term (1+θ i )4 f 2
i σ2 stands for the impact of more precau-
tionary saving. This term is half of the corresponding term in the growth rate of consumption(6) because the other half implies higher consumption at the end of the working life.The equity risk premium does not directly raise the growth rate of consumption. This isbecause at the margin the benefit of the risk premium is exactly offset by the cost of riskif the investment share is optimal.18 With the optimal investment share fi from (4), we have ψ = fi µ̄= λ2/θ i so that ρi =r + (1+θ i )λ2
2θ i − θ i gi (where gi is the growth rate of wage income) implies that the premium
rate does not depend on age. Note that we have assumed in section 2 that gi =0.

364 BOVENBERG, KOIJEN, NIJMAN AND TEULINGS
20 30 40 50 60 70 80
0.8
1
1.2
1.4
1.6
1.8
2
Age
Co
nsu
mp
tio
nExpectation10% quantile90% quantileScenario path1Scenario path2
Figure 5 – Expectation, 10% and 90% quantiles and two simulated scenario paths of the con-sumption path (Ct ) over the life cycle for the benchmark parameters (r = 2%, ρ = 2%, λ= 0.2)
20 30 40 50 60 70 80-5
0
5
10
15
20
25
Age
Fin
anci
al W
ealt
h
Expectation10% quantile90% quantileScenario path 1Scenario path 2
Figure 6 – Expectation, 10% and 90% quantiles and two simulated scenario paths of the finan-cial wealth path (Ft ) over the lifecycle for the benchmark parameters (r = 2%, ρ = 2%, λ= 0.2)
in time, generations of different ages pay different premium rates even if theexpected premium rates are constant over the working life (i.e. the right-handside of (6) is zero). To illustrate, a generation that started to work at t = 1participates in the risks that materialized between t = 1 and t = 31. A youn-

SAVING AND INVESTING OVER THE LIFE CYCLE 365
0 10 20 30 40 50 600.85
0.9
0.95
1
1.05
1.1
1.15
1.2
1.25
1.3
Time
Co
nsu
mp
tio
nIndividual entering at time t=1Individual entering at time t=31Individual entering at time t=1 without shocksIndividual entering at time t=31 without shocks
Figure 7 – Trajectories of the consumption paths (Ct ) of individuals entering at respectively timet = 1 and t = 31. Shocks in the asset price are absent except at time t = 20 and t = 40, whena negative shock is imposed. All trajectories correspond to the benchmark parameters (r = 2%,
ρ=2%, λ=0.2)
Individual entering at time t=1Individual entering at time t=30Individual entering at time t=1 without shocksIndividual entering at time t=30 without shocks
0 10 20 30 40 50 600
5
10
15
Time t
Wea
lth
leve
l
Figure 8 – Trajectories of the financial wealth paths (Ft ) of individuals entering at respectivelytime t = 1 and t = 31. Shocks in the asset price are absent except at time t = 20 and t = 40, whena negative shock is imposed. All trajectories correspond to the benchmark parameters (r = 2%,
ρ=2%, λ=0.2)
366 BOVENBERG, KOIJEN, NIJMAN AND TEULINGS
ger generation who enters the labor market at t = 31, in contrast, does not.The negative shock in the financial market exerts a proportional effect onconsumption while the financial wealth of the younger generation is reducedby more (in absolute value) than that of the older generation.
4 SAVING AND INVESTING OVER THE LIFE CYCLE WITH CONSTRAINTS
4.1 Introduction
The first-best contribution and asset allocation strategies derived in theprevious section require that individuals can borrow against their human cap-ital. Moreover, individuals must be able to implement rather complicated sav-ing and investment strategies that depend on age and the level of financialwealth. This section investigates how constraints faced by individual inves-tors affect their strategies and welfare levels. In particular, after Subsection4.2 considers the implications of annuities, Subsection 4.3 analyzes what hap-pens if agents can not borrow against their human capital. Subsection 4.4explores the implications of constant contribution rates and asset allocations.Subsection 4.5 analyzes the impact of other behavioral limitations to indi-vidual decision making, including possible underdiversification and infrequentrebalancing.
4.2 Annuities
To protect themselves against individual longevity risk, individual agents canbuy annuities at retirement. Standard annuities typically do not allow takinginvestment risk during retirement. Individuals thus fail to exploit their risk-bearing capacity for shocks that occur after retirement. The risk exposure ofretired individuals is too small: they use an implicit Sharpe ratio of zero (oran infinite implicit relative risk aversion). Shocks are thus absorbed only dur-ing working life. All capital is risk bearing as regards the shocks that occurduring the working life. We find that the wrong risk exposure of the retiredgeneration yields a welfare loss of 0.5% of ex-ante life-time utility in terms ofcertainty equivalent consumption.19 The utility loss is small20 because of tworeasons. First, shocks that occur during the retirement period are discountedheavily (since they occur late in life). Second, these shocks affect only a smallpart of overall wealth: most wealth has already been depleted at the time ofretirement. In other words, the shocks during retirement can be smoothed
19 We measure welfare levels by the constant, certain consumption level that achieves thesame utility level as the various stochastic consumption streams.20 The losses are larger if we measure them compared to the certainty equivalent consump-tion that remains at the time of retirement (see Koijen et al. (2006a)).

SAVING AND INVESTING OVER THE LIFE CYCLE 367
only over a relatively short time period as the remaining life is relatively short.The rest of this section assumes annuities so that retired agents do not takeinvestment risk.
4.3 Borrowing Constraints
As discussed in section 3.3, the first-best asset allocation implies that oneshould borrow at the beginning of one’s career and invest the proceeds inthe stock market to acquire sufficient exposure to the equity market. Adverseselection and moral hazard, however, typically preclude borrowing againstfuture labor income. Financial institutions cannot use human capital as a col-lateral to ensure that the loan is paid back.21 This subsection therefore con-siders the more realistic case with an exogenous22 borrowing constraint sothat equity exposure cannot exceed unity (i.e. f ∗
i t ≤1). With these constraints,agents must get all their risk exposure from positive financial capital. Hence,in contrast to older workers who can accumulate substantial financial capi-tal through saving, young workers cannot get enough exposure to risk.23 Therestricted access of younger workers to capital markets that is implied by theborrowing constraint harms their welfare and thus functions like an implicittax on wealth. This negative income effects reduces consumption and thusboosts saving initially. Another reason why borrowing constraints raise savingis that additional saving allows the young worker to acquire more access toequity markets so that they can take more advantage of the equity premium.
In case of borrowing constraints, the optimal contribution rates and assetallocations can no longer be determined analytically so that we must rely onnumerical simulations (see e.g. Koijen et al. (2007)). These numerical simu-lations assume that agents can trade only at an annual frequency. The transi-tion from continuous to discrete trading (at annual frequency) yields a welfareloss of 0.8% of certainty-equivalent consumption.
The presence of the borrowing constraints implies an additional welfareloss of approximately 2.8% of certainty equivalent consumption. This welfareloss associated with borrowing constraints is thus substantially larger than thewelfare loss due to annuities. At the beginning of life, limits on risk expo-
21 In principle investments in derivatives with extreme exposures (such as far out of themoney call options) can be used to obtain adequate equity market exposure with small mon-etary investments only. However, very far out of the money derivatives are not traded in liq-uid markets. If the real estate market and the equity market are correlated, strategies basedon investments in real estate financed by mortgages can be used as an alternative strategy tobuild substantial equity exposure even though investors do not own much financial wealth.22 Cocco et al. (2005) show that exogenous borrowing constraints can be viewed as approx-imations to endogenous borrowing constraints derived from recent literature on endogenouscredit-market imperfections.23 See also Constantinides et al. (2002).

368 BOVENBERG, KOIJEN, NIJMAN AND TEULINGS
20 30 40 50 60 70 800.8
0.85
0.9
0.95
1
1.05
1.1
1.15
1.2
1.25
Age
Co
nsu
mp
tio
n le
vel
Expected consumption level unconstrainedExpected consumption level constrained
Figure 9 – Expected consumption level Ct under the benchmark parameters (r = ρ = 2%,λ=0.2) in the absence and in the presence of borrowing constraints
sure are more costly than at the end of life because at the beginning of lifeshocks can be smoothed out over a relatively long time period. The risk-bear-ing capacity of the young is particularly valuable also because shocks that areabsorbed when young are not discounted much.
For our benchmark case, the quantiles of the optimal solutions with bor-rowing constraints are presented in Figures 9 and 10. Figure 9 presents theoptimal consumption path. A comparison with the solid line in Figure 5(which is added to Figure 9 for ease of reference) illustrates that the restrictedaccess of younger workers reduces consumption levels and raises saving.
To put the welfare loss of borrowing constraints and other constraints intoperspective, we compute the welfare costs of taking no risks at all during thelife cycle. This is the most extreme form of limits on risk sharing. Individu-als in effect do not have any risk-bearing capital at all. Teulings and de Vries(2006) compute the following approximation for the welfare loss (in terms ofthe relative decline in certainty equivalent consumption) associated with thisextreme limitation on risk taking:
14λ2
θ iD. (7)
The intuition behind this expression is that the average duration of riskyinvestments is half the lifetime D and that the welfare loss for a year riskless

SAVING AND INVESTING OVER THE LIFE CYCLE 369
20 25 30 35 40 45 50 55 60 650.2
0.3
0.4
0.5
0.6
0.7
0.8
0.9
1
Fra
ctio
n of
fina
ncia
l wea
lth in
vest
ed in
equ
ity
age
Figure 10 – Expectation of the optimal equity share in financial wealth f ∗t over the life cycle
in the presence of a borrowing constraint case under the benchmark parameters (r = ρ = 2%,λ=0.2)
investment is given by half of the potential reward for risk24 12 fi µ̄= 1
2λ2
θ i . Thewelfare loss thus rises with the reward to risk taking (i.e. the Sharpe ratio λ)and declines with the willingness to do so (i.e. relative risk aversion θ i ). Withour benchmark parameters, this approximation yields a welfare loss of 12%(in terms of certainty equivalent consumption).
4.4 Time-Invariant Pension Premium and Asset Allocation
The savings and investment decisions require substantial investor sophistica-tion. This section considers the welfare losses imposed by a number of sim-pler strategies in the case with borrowing constraints.
4.4.1 Defined ContributionThe first strategy we consider is a standard defined contribution (DC) solu-tion where the premium rate is fixed independently of age or wealth. Thelevel of this premium rate is determined optimally and the asset allocationoptimally varies with age and shocks to financial wealth. For the benchmarkparameters, the optimal consumption rate is 87% of labor income.
If the contribution rate is fixed a priori and does not respond to shocks,the part of wealth that is dedicated to pre-retirement consumption doesnot contribute to risk sharing. Only the part of wealth that is dedicated
24 Only half of the reward to risk is actually a welfare gain. The reason is that the indi-vidual also bears additional risk, which harms welfare. In fact, one can interpret the welfareloss as a Harberger triangle due to a tax on risk taking. The tax on risk taking is given byµ̄ (since the reward for taking risk is taken away), while the behavioral response (as a shareof overall wealth) is given by fi . The Harberger triangle is thus given by 1
2 fi µ̄.

370 BOVENBERG, KOIJEN, NIJMAN AND TEULINGS
to post-retirement consumption is exposed to shocks, which implies thatrisk exposure is not optimal and that the individual does not fully takeadvantage of the risk premium. The elasticities of consumption with respectto wealth shocks indicate inefficient consumption smoothing. Indeed, con-sumption during the working life does not react to wealth shocks at all.The welfare loss of this individual DC plan is 3% (in certainty equiva-lent consumption) relative to the optimal individual plan (with borrowingconstraints, annuities and discrete trading) in Subsection 4.3. Compared tothe first best in section 3, the welfare loss is thus a little more than 7%(in certainty equivalent consumption) because the optimal individual schemeyields a welfare loss of 4.1% relative to the first best (0.5% due to annu-ities, 0.8% due to discrete trading, and 2.8% due to borrowing constraints).This welfare loss of 7% can be compared to the case when the individ-ual is entirely precluded from investing in equity (and not just as regardsthe part of wealth that is dedicated to post-retirement consumption) butsets an optimal age dependent contribution rate. This welfare loss is 8.5%.The welfare losses of the constraint that the DC plan imposes on risk tak-ing before retirement is particularly large if a small coefficient of risk aver-sion (and a large Sharpe ratio) indicates that young workers would liketo have taken risk on their human wealth dedicated to before-retirementconsumption.
Just as in the optimal individual system (see Figure 10), in the DC systemthe share of financial wealth invested in equity declines during the work-ing life. The reason is that pension wealth (i.e. the discounted value of con-tributions) is gradually transformed into financial wealth so that financialwealth tends to increase during the working life. With suboptimal consump-tion smoothing under the DC system, however, the absolute amount of equityat the beginning of life is substantially smaller as pension wealth (i.e. the dis-counted value of the fixed pension contributions, which are equal to the dis-counted value of retirement consumption) is significantly smaller than humancapital (i.e. the discounted value of wages, which is equal to discounted con-sumption during not only retirement but also the working life). Indeed, apension system that excludes part of life-time consumption from absorbingrisks limits the risk-bearing capacity of individuals.25
25 For that same reason, defined-benefit (DB) systems, which fix the retirement benefit, limitthe the risk-bearing capacity of individuals. Compared to DC systems, they damage the risk-bearing capacities of old agents relatively more. Indeed, compared to DC systems, DB schemesstart to constrain the risk-bearing capacity of individuals more at the age at which the valueof pension wealth (the discounted value of retirement consumption) starts to exceed the dis-counted value of consumption during the remaining working life). The larger is the workinglife compared to the inactive life, the larger are the welfare losses from a DC scheme com-pared to those of a DB scheme.
SAVING AND INVESTING OVER THE LIFE CYCLE 371
0.8 0.81 0.82 0.83 0.84 0.85 0.86 0.87 0.88 0.89 0.9-0.08
-0.075
-0.07
-0.065
-0.06
-0.055
-0.05
-0.045
-0.04
-0.035
-0.03
Constant consumption policy
Util
ity c
osts
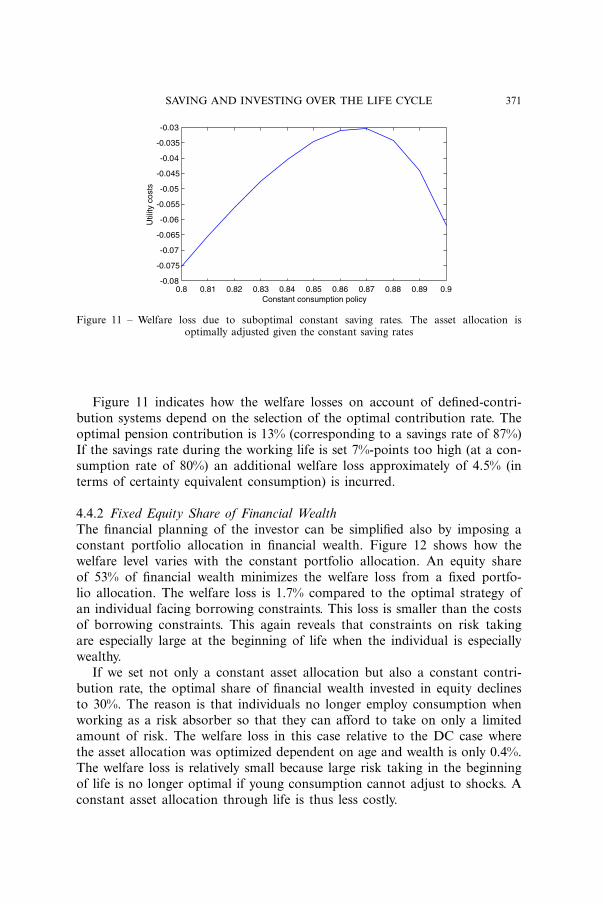
Figure 11 – Welfare loss due to suboptimal constant saving rates. The asset allocation isoptimally adjusted given the constant saving rates
Figure 11 indicates how the welfare losses on account of defined-contri-bution systems depend on the selection of the optimal contribution rate. Theoptimal pension contribution is 13% (corresponding to a savings rate of 87%)If the savings rate during the working life is set 7%-points too high (at a con-sumption rate of 80%) an additional welfare loss approximately of 4.5% (interms of certainty equivalent consumption) is incurred.
4.4.2 Fixed Equity Share of Financial WealthThe financial planning of the investor can be simplified also by imposing aconstant portfolio allocation in financial wealth. Figure 12 shows how thewelfare level varies with the constant portfolio allocation. An equity shareof 53% of financial wealth minimizes the welfare loss from a fixed portfo-lio allocation. The welfare loss is 1.7% compared to the optimal strategy ofan individual facing borrowing constraints. This loss is smaller than the costsof borrowing constraints. This again reveals that constraints on risk takingare especially large at the beginning of life when the individual is especiallywealthy.
If we set not only a constant asset allocation but also a constant contri-bution rate, the optimal share of financial wealth invested in equity declinesto 30%. The reason is that individuals no longer employ consumption whenworking as a risk absorber so that they can afford to take on only a limitedamount of risk. The welfare loss in this case relative to the DC case wherethe asset allocation was optimized dependent on age and wealth is only 0.4%.The welfare loss is relatively small because large risk taking in the beginningof life is no longer optimal if young consumption cannot adjust to shocks. Aconstant asset allocation through life is thus less costly.

372 BOVENBERG, KOIJEN, NIJMAN AND TEULINGS
0 10 20 30 40 50 60 70 80 90 100-0.055
-0.05
-0.045
-0.04
-0.035
-0.03
-0.025
-0.02
-0.015
Constant asset allocation
Util
ity c
osts
Figure 12 – Welfare loss due to suboptimal constant portfolio choice (i.e. equity as share offinancial wealth). The savings rate is adjusted optimally given the constraints on the portfolio
choice
4.5 The Ability of Individuals to Choose their Optimal Pension Contract
Section 3 considered the first-best life-time financial plan and Subsection 4.3explored the optimal individual contract in case of borrowing constraints. Inboth cases, we assumed that the contract was optimally tuned to the pref-erences of the individual. Subsection 4.4 analyzed how robust the optimalsolution is to the use of static rather than dynamic contribution rules andasset allocation strategies. This analysis suggests that the individuals suffersubstantial welfare losses if they lack the expertise to select and implementoptimal savings and investment strategies during their life time. As a directconsequence, adequate financial advice and access to the structured prod-ucts offered by financial intermediaries are quite valuable in order to helpindividuals with their life-cycle financial planning. A large literature on howindividuals actually decide on saving and investment over their life time hasdeveloped recently. This subsection provides a short introduction to this liter-ature.
Individuals spend little time and effort on planning for retirement. VanRooij et al. (2007) find that individuals in the Netherlands are not interestedin pension related issues and think they are not able to take pension relateddecisions. Lusardi (1999) reports that even in the US, where individuals havemany more pension related decisions to make, one-third of the workers had“hardly thought about retirement” only ten years before retirement. Amerikset al. (2003) reports, also for the US, that more than 50% of a sample ofhighly educated wealthy individuals had “not spent a great deal of time devel-oping a financial plan”. Lack of planning has serious consequences: thosewho do not plan have lower wealth holdings and are less likely to report thatthey experience a satisfying retirement. There are many recent papers that

SAVING AND INVESTING OVER THE LIFE CYCLE 373
analyze the impact of improved information (e.g. through benefit informa-tion fairs) and financial education (see e.g. Venti (2006); Clark et al. (2006).At best, the results indicate small improvements in the effort spent on pen-sion related decisions and on the quality of these decisions. Choi et al. (2005)report that tax-incentives for retirement saving were not utilized, even afterthey had been explicitly pointed out in financial training courses.
Individuals selecting their pension contract face two decisions: how muchto save and how to invest the financial wealth that is accumulated. Theexisting evidence, which is primarily on the US, indicates that individualsundersave and that they experience unanticipated drops in consumption atretirement. Moreover a number of surveys have found that the vast majorityof individuals thinks that they should be saving more for retirement (Laib-son et al. (1998); Choi et al. (2002)). One explanation that is well docu-mented in psychology is that people lack the self control that is required toimplement a savings plan. People want to save for the future but they lackthe capacity to carry out their intention. A convenient way to model actualbehavior is hyperbolic discounting. This model assumes that nearby discountrates are much larger than long-term discount rates. As a consequence, con-sumers exhibit time-inconsistent behavior while actual behavior diverges fromplanned behavior.
With respect to the asset allocation, an even more extensive literature indi-cates that individuals seem to make significant mistakes. Many householdstake decisions that are difficult to reconcile with the advice given to them byfinancial planners or other experts. Of course it could be that investors behaveoptimally but should be characterized by non-standard preferences such asloss aversion or habit formation. These extensions of the basic model will bediscussed in section 6. This section takes the standard preference specificationintroduced in section 2 as starting point and interprets deviations in observedbehaviour as investment mistakes.
A well-established stylized fact in the literature is that only a small partof the population in countries like Italy (Guiso and Japelli (2005)) or the US(Haliassos and Bertaut (1995)) hold stocks, directly or indirectly. Participantsin retirement saving plans rarely rebalance their portfolio or alter the alloca-tion of their contributions over the life cycle (Ameriks and Zeldes (2004)).Many households do not diversify and hold only a few stocks, often witha local bias and in 401(k) schemes often even with a bias to the stock oftheir own employer (Huberman (2001); Mitchell and Utkus (2003); Munneland Sunden (2004)). Participants in 401(k) plans display a tendency to splittheir contributions evenly among investment options, irrespective of the typeof options that is offered (Benartzi and Thaler (2001)). Such a “1/n”-rule ofthumb is clearly at odds with optimal diversification and adequate risk tak-ing. Financial education could play a role. Campbell (2006) reports that more

374 BOVENBERG, KOIJEN, NIJMAN AND TEULINGS
educated households in Sweden diversify their portfolio more efficiently thanless educated households do.
The overwhelming evidence that individuals have difficulties in taking ade-quate savings and investments decisions raises the question how to addressthis problem (see also Kooreman and Prast (2007)). One option is to forcemandatory participation in a collective scheme where decisions are taken byprofessionals. One of the main drawbacks (see also section 5) is that collec-tive schemes typically do not take into account individual characteristics andpreferences. Moreover, important decisions in these schemes are usually takenby pension fund trustees and the evidence on the competence of trustees sug-gests at least that it is heterogeneous (Clark et al. (2006)). Another optionis to provide adequate financial advice and to develop innovative productsthat stimulate individuals to take adequate pension related decisions. A wellknown example is the “Save More Tomorrow” plan proposed by Thaler andBenartzi (2004). The commitment mechanism allows individuals to commit toincreasing their savings rate at some later date. Other examples include theuse of automatic enrollment in savings plans, automatic payroll deduction inemployer-based plans and the use of adequate defaults with respect to savingsrates and asset allocation. Yet another example is the use of peer effects bysetting up benefits information fairs for some workers, which has been shownto have an impact also on the saving behavior of colleagues that had not beeninvited to attend (Duflo and Saez (2003)). No doubt in the years to comemany other structured plans and products will be developed that aim to facil-itate individual decision making.
Figure 13 illustrate the potential costs of sub-optimal individual behaviordue to behavioral biases. In particular, this Figure contains the welfare lossesif an individual adopts wrong risk aversion and time-preference parameterswhen selecting structured products to implement the optimal investment andsaving decisions in individual plans (i.e. with borrowing constraints and annu-ities) derived in Subsection 4.3. Figure 13 is based on the assumption thatproduct that is offered is based on a risk aversion of 5% and a time preferenceparameter of 2%. The costs of inadequate financial advise, i.e. of adopt-ing strategies that are optimal for individuals with other preference param-eters can be substantial. The costs of the inadequate assumptions on riskpreferences26 are particularly large if the individual turns out to have a timepreference that substantially exceeds the time preference on which the finan-cial plan is based. The welfare loss can be as large 4.0% (in terms of certaintyequivalent consumption) for a risk preference of 4% rather 2% and even sub-
26 With a CRRA utility function, a wrong risk aversion parameter implies that also theintertemporal substitution elasticity is not adequate. Hence, it distorts both risk taking andintertemporal consumption smoothing.

SAVING AND INVESTING OVER THE LIFE CYCLE 375
00.02
0.040.06
0.08
2 3 4 5 6 7 8 9 0.110
-0.12
-0.1
-0.08
-0.06
-0.04
-0.02
0
Time preference parameter
Risk aversion parameter
Figure 13 – Welfare costs of suboptimal individal behavior due to incorrect risk aversion and/ortime preference assumptions
0 0.02 0.04 0.06 0.08 0.1 0.12 0.14 0.16 0.18 0.2-0.04
-0.035
-0.03
-0.025
-0.02
-0.015
-0.01
-0.005
0
σI
Util
ity c
osts
Figure 14 – Welfare costs of idisynchratic risk taking
stantially larger for more extreme deviations between the assumed and actualpreference parameters.
In the result so far we assumed that agents hold optimally diversified port-folios when taking equity exposure. In reality individuals will often hold a fewstocks only which implies that idiosynchratic risk is taken that does not gen-erate an equity premium. Figure 14 illustrates the welfare costs of carrying id-iosynchratic risk. If both the level of systematic and idiosynchratic risk equals20% the over-all volatility of the equity investment is 28.2% with an associ-ated 3.5% welfare loss relative to an optimally diversified equity portfolio witha 20% volatility
5 COLLECTIVE PENSION SCHEMES
5.1 Introduction
Sections 3 and 4 considered the optimal individual pension contract inthe first-best case as well as under a number of more realistic constraints.

376 BOVENBERG, KOIJEN, NIJMAN AND TEULINGS
This section turns to the cost and benefits of mandatory, collective pensionschemes.
A number of arguments have been put forward as advantages collectivepension schemes:
(i) Collective pension schemes enable young participants to alleviate borrow-ing constraints
(ii) Collective pension schemes are cost efficient(iii) Collective pension schemes enable risk sharing between non-overlapping
generations(iv) Collective pension schemes complete markets by arranging trades of
assets that are not traded on financial markets(v) Collective pension funds take over decisions of boundedly rational partic-
ipants
Other arguments can be put forward as disadvantages of collective pensionschemes:
(i) Collective pension schemes are not tailor made to the characteristics ofthe individual
(ii) Collective pension schemes impose uniform contribution rates and assetallocations on heterogeneous participants
(iii) Collective pension schemes involve suboptimal consumption smoothingas shocks are not spread out over the remaining life time
(iv) Collective pension contracts are incomplete and not transparent(v) Collective pension funds reduce competition between funds
The first argument implies that collective pension schemes allow individu-als to implement their optimal saving and investment plans in a more optimalway than individual pension contracts. The reason is that compulsory partici-pation in collective pension schemes combat adverse selection and moral haz-ard if young workers borrow against the unsecured collateral of their humancapital. The second argument in favor of collective schemes is that their costsare usually lower than the costs associated with individual pension schemes.In particular, collective schemes avoid time consuming search incurred byindividuals and marketing cost by financial intermediaries. Subsection 5.2elaborates on the first two arguments in favor of collective schemes.
Mandatory collective pension schemes also allow risks to be shared withfuture generations, i.e. generations that do not yet participate in the labormarket at the time a shock materializes. Subsection 5.3 shows that the ben-efits of additional intergenerational risk sharing are potentially substantial ifall generations are committed to the contract; in this case, we can abstractfrom the so-called discontinuity risk that generations entering the labor mar-ket decide not to enter the contract if they have to make up a deficit. This

SAVING AND INVESTING OVER THE LIFE CYCLE 377
subsection considers also the welfare gains of intergenerational risk sharingin case the potential losses for newly entering generations in case of adverseshocks are limited through dynamic asset allocation strategies.
An important drawback of collective pension schemes is that they are nottailor made to the preferences or specific circumstances of each individual. Asdiscussed in Subsection 4.5, the use of the wrong preference parameters gen-erates a substantial welfare loss compared to the case in which the individ-ual could have optimally implemented a pension contract with the adequatespecifications. Indeed, individual characteristics such as the presence of part-ner pension or non-pension wealth are typically not taken into account in col-lective pension schemes.27 Subsection 5.4 explores the welfare losses due touniform pension contracts that are not tailor-made to individual features.
Subsection 5.5 explores the implications of the collective pension contractsthat are implemented in practice for welfare, consumption smoothing andindividual risk exposures. The advantages of these schemes are that they allowfor risk sharing with future generations and that they allow young agentsfacing borrowing constraints to acquire substantial exposure to equity risk.The disadvantage is that these schemes involve suboptimal intertemporal con-sumption smoothing as shocks are not spread out over the remaining lifetime. Moreover, the risk exposures of participants are not optimal as theydepend the funding rate of the scheme as a whole rather than on the wealthposition of the individual.
Collective pension schemes have other advantages and disadvantages thatwe do not explore further in this section. In the benchmark model, the singlefinancial risk factor is the only risk factor and this risk factor is traded in fric-tionless markets. In more realistic economies, also other risk factors that cannot easily be traded in capital markets (such as price inflation, wage inflationand longevity) are important. A potentially important advantage of collectivepension schemes is that risks that can not be traded in capital markets can beshared through the pension contract. In incomplete financial markets, pensioncontracts may create new, non-tradable financial assets that can enhance effi-cient risk sharing.
This section assumes that collective pension contracts are complete, i.e. allpay-offs in future contingencies are set in advance. In reality, however, manycollective pension contracts are incomplete and the property rights on the sur-plus of the pension fund are often unclear. In particular, the board of thepension scheme has the discretion to pay out the surplus as dividends to cur-rent stakeholders (in the form of additional pension benefits or additionalfuture benefit claims that are not fully covered by additional premia) or to
27 Also individual differences in the ability to postpone retirement or in life expectancy (e.gdue to socioeconomic characteristics) are important determinants of optimal individual pensioncontracts.
378 BOVENBERG, KOIJEN, NIJMAN AND TEULINGS
save the surplus for future participants. This discretionary power of the trust-ees has the advantage that all the possible contingencies do not have to bethought through ex ante, thereby reducing transaction costs. A disadvantageis that the collective decision making within the board of the scheme may giverise to political risks and less secure individual property rights, thereby harm-ing the welfare of risk-averse participants. Indeed, budget constraints apply tothe pension scheme as a whole rather than to individual participants. Hence,a collective pension scheme can redistribute market value across generationsas participants do not hold tradable individual property rights on the pensionfund. Rather, they have non-tradable claims on the pension scheme when theywork in the sector or have accumulated pension rights in that sector. Theseclaims are not necessarily matched with tradable financial assets owned by thepension scheme. Moreover, the market-value of these claims may be affectedby the discretionary decisions by the board of the pension scheme (see Hoeve-naars and Ponds (2006)). Indeed, the pension fund is an independent legalentity, which has the discretionary power to shift resources between genera-tions.
5.2 Borrowing Constraints and Cost Efficiency
As discussed in section 3.3, the first-best asset allocation implies that oneshould borrow at the beginning of one’s career and invest the proceeds inthe stock market to acquire sufficient exposure to the equity market. As dis-cussed in section 4.3, when trying to implement the first-best solution derivedin section 3.3, young workers typically face borrowing constraints. The reasonis that the lender faces substantial credit risk on an unsecured loan due toadverse selection and moral hazard. Indeed, if the stock market crashes, thelender does not have collateral. Compulsory participation in collective pen-sion schemes can alleviate adverse selection and moral hazard when youngworkers borrow against their human capital to invest in equity. In effect, man-datory participation helps to secure the human capital of younger generationas a collateral, thereby limiting bankruptcy risk and thus relaxing the creditconstraints faced by young generations. A collective defined-benefit pensionfund that carries mismatch risk by investing in equity can be viewed as youn-ger participants issuing risk-free debt to the older generations and using theborrowed funds to invest in the equity market. Indeed, the mismatch risk ofthe pension scheme is born by the younger generations in the form of vola-tile recovery premia. In fact, the risky pension contribution allows the youngto transform their riskless human capital in a risk-bearing asset. In this way,they acquire the optimal exposure to equity risk (see Beetsma and Bovenberg(2007)). Section 4.3 reported that for the benchmark parameters the welfaregains of being able to completely avoid the borrowing constraints are 2.8% ofcertainty equivalent consumption.

SAVING AND INVESTING OVER THE LIFE CYCLE 379
TABLE 1 – WELFARE LOSSES DUE TO ANNUAL IMPLEMENTATION COSTS
RELATIVE TO FRICTIONLESS FIRST-BEST SOLUTION (from section 3)
Annual implementation costs (%)
0% 0.3% 0.5% 1.0%First best 0% −1.2% −2.0% −4.0%rule of thumb 0% −1.6% −2.8% −5.6%constrained −3.6% −4.6% −5.3% −7.0%
Relieving the borrowing constraints through compulsory participation isnot costless if, in contrast to our benchmark model, labor supply in the sec-tor to which the compulsory participation applies is endogenous. In that case,mandatory participation gives rise to labor-market distortions. In particu-lar, agents reduce their labor supply to the sector if adverse developments inequity markets saddle them with negative pension wealth (i.e. pension debt)that they have to finance with recovery premia on basis of their labor sup-ply. Sectoral labor supply can be reduced by moving to other sectors orcountries, by becoming self-employed, by working part-time or by retiringearly.
Mandatory collective pension schemes allow cost-effective pension solu-tions because of economies of scale as well as lower marketing and searchcosts. Bikker and De Dreu (2006) report a cost average of 0.30% per annumfor medium sized and large collective pension schemes, whereas mutual fundsand insurers typically charge 0.80–1.00% per annum or more for individualplans (see e.g. Poterba et al. (2005)). So far, we have ignored implementa-tion costs. Table 1 computes the welfare losses (in terms of certainty equiv-alent consumption) of the various costly pension deals relative to the case inwhich implementation costs are negligible. In order to derive the welfare lossof implementation costs, the annual return on both riskless and risky assetsis decreased by the annual implementation costs. The welfare costs (in per-centage changes of certainty equivalent consumption) associated with a fixedlower annual return of x percentage points on financial wealth can be approx-imated by
x
2(D − T ), (8)
where T stands for the length of the working period so that D − T equalsthe length of the retirement period. Note that in the constrained case bothborrowing constraints and inadequate risk taking after retirement due to aninsufficiently rich annuity menu are taken into account.

380 BOVENBERG, KOIJEN, NIJMAN AND TEULINGS
5.3 Risk Taking Before Working
Section 3 considered the optimal pension contract for an individual whoenters adult life, i.e. enters the labor market and starts to consume out of hsisown labor income. As shown by Teulings and de Vries (2006), this contractcan be improved further if we allow for the possibility that agents assumefinancial risks already before they are adults. Indeed, an individual is alreadyendowed with human capital at birth and can in theory then already partici-pate in stock-market risks by borrowing against his human capital to invest inthe stock market. Teulings and de Vries (2006) demonstrate that the potentialwelfare benefits of participation in the stock market before entering the laborforce are substantial.
Teenagers and babies do not usually directly invest in equity markets.However, compulsory pension schemes allow them to participate in the stockmarket in an indirect way. Collective pension schemes share risks with gener-ations that do not yet participate in the scheme by transferring buffers (whichmay be negative) from current participants to future generations. A buffercan be defined as the assets in the scheme minus the assets of the genera-tions that have already started to work and pay pension premiums. A bufferthus corresponds to the aggregate financial wealth of future workers. Theseworkers have in fact borrowed to buy stocks, thereby participating in stockmarket risks even before they start to work (see also Beetsma and Bovenberg(2007)). In particular, collective pension schemes typically levy equal contri-butions on all active generations at a particular point in time with the levelof the uniform contribution depending on the funding rate of the collectivescheme. In this way, the premium cohorts pay when they enter the schemedepends on the investment history of the scheme before they entered and thuson the shocks that materialized before they started to work.
Through the transfer of buffers between generations a collective pensionscheme in fact helps to complete capital markets by allowing younger gener-ations (and even unborn generations) to buy risk-bearing assets. In decentral-ized capital markets, individuals can obviously buy risk-bearing assets onlyafter they have been born. They are thus not able to trade risks that occurbefore they are born. In other words, decentralized capital markets allow onlyoverlapping generations (i.e. generations that are in the market at the sametime) to trade risks that emerge during the rest of their life times. Risk shar-ing among non-overlapping generations thus has to occur through other insti-tutions, such as compulsory pension schemes but also tax and public debtpolicy.
It is theoretically optimal to diversify risk over as many generations andas many time periods as possible. Only generations who consume after theshocks occur can possibly share in the risk: generations who are deceasedwhen the shock occurs have depleted their wealth already and thus do not

SAVING AND INVESTING OVER THE LIFE CYCLE 381
have any risk-bearing capacity any more. Future generations who have notyet started consuming, in contrast, can share in current risks. Optimal risksharing implies that a current shock affects consumption during the rest ofthe life of all living and future generations by that percentage. The shock isthus smoothed out as widely as possible across both individuals and periodsso that each separate individual in each period is affected as little as possi-ble. Collective pension schemes can thus be interpreted as the pension schemehaving invested on behalf of all its current contributors before these contrib-utors actually started to work and pay a pension premium.
In our partial equilibrium setting, the benefit of additional risk sharing isnot to reduce risk but rather to increase the expected payoff from risky invest-ments by generations who have not entered the labor market yet.28 In a gen-eral equilibrium context in which the supply of risk-bearing assets is less thaninfinitely elastic, the additional risk-bearing capacity of younger generationsreduces the price of risk. This, in turn, reduces the risk born by the currentgenerations.
With intergenerational risk sharing across non-overlapping generations, theexpectation of the buffer that is transferred to future workers is positive butcan be negative for some bad draws. This risk sharing thus works only iffuture generations are forced to pay back their unsecured loans in these cases.Mandatory participation in sectoral pension schemes helps to enforce this. Inthis way, the government allows pension schemes to lay a claim on the collat-eral of workers: their human capital.
Just as in the case of relieving the borrowing constraints of young work-ers, mandatory participation is a necessary but not a sufficient condition formaking risk sharing among non-overlapping generations feasible by secur-ing the collateral of future workers. In particular, employers in a sector facecompetition from other sectors on the labor market. With mobile labor acrosssectors, these employers may have to pay compensating wage differentialsto attract workers to their sector if these workers are forced to pay backimplicit debt extended by the sectoral pension scheme. In that case, work-ers can in fact evade the compulsory participation and shift the implicit bur-den on employment in the sector by seeking employment in other sectors.As a direct consequence of the mobility of young workers, the buffers are infact benefiting the shareholders of the firms in the sector (in case of tradablegoods), the consumers of the commodities produced by the sector (in case ofnon-tradable goods such as health care), or the current retirees in the pensionscheme (in case of mobile workers, capital and consumers). Indeed, depending
28 Gollier (2006) stresses this result and formulates a simple model of risk sharing betweentwo agents facing independent risks. In an intergenerational context, the young can share inthe risks of the old. The old, however, do not share in the risks of the young. The possibilitiesfor sharing risks among non-overlapping generations are thus assymetric.

382 BOVENBERG, KOIJEN, NIJMAN AND TEULINGS
on the various elasticities, competition limits the possibilities for risk sharingamong non-overlapping generations, especially if behavior is sensitive to costs(as indicated, for example, by the elasticity of sectoral labor supply).
If young workers face substantial negative buffers on entry into a pensionscheme, they may vote with not only their feet (by seeking employment else-where or reducing labor supply) but also their voice. In particular, they mayencourage the pension scheme to default on the pension obligations to olderworkers and retirees, for example by no longer indexing their pensions toinflation. In addition to the economic considerations of competition on labor,capital and commodity markets, political economy considerations thus makecurrent participants vulnerable to large negative buffers. This is why regula-tors adopt the so-called discontinuity principle: a pension fund should be ableto comply to its obligations also if, starting today, no new generations wouldbe willing to enter the scheme. Recognizing that pension schemes cannot eas-ily secure the human capital of future generations, this discontinuity principlelimits the scope for risk sharing among non-overlapping generations.29
Risk sharing among non-overlapping generations can probably best beimplemented by the largest pool we have to enforce this risk sharing: thenational state. In particular, in combination with public debt, the govern-ment can employ its tax power to commit future generations to share riskswith current generations. To illustrate, by issuing indexed bonds and longev-ity bonds, the government protects current generations against inflation andlongevity risks and shifts these risks in part to future generations of tax pay-ers. Even the national state, however, is restricted by international mobilityand other behavioral responses to taxes (e.g. the wage elasticity of labor sup-ply). Moreover, in a democracy, the state can commit only imperfectly. Younggenerations can always exert political pressure to change laws that force themto pick up the tab of risks that the older generations have shifted unto them.Similarly, current generations, who control the votes, can always consumethe buffers that were initially assigned to the future generations. This illus-trates how difficult it is to actually implement and enforce credible contractsbetween non-overlapping generations.
Table 2 illustrates the potential welfare gains of intergenerational risk shar-ing as well as the distribution of the buffer that new generations face uponentry to the labor market. The first column of Table 2 reports the welfare gain(in terms of certainty equivalent consumption) when a cohort starts to opti-mally participate in equity-market risk B years before entering the labor mar-
29 Also positive buffers may in fact benefit current rather than future generations because ofpolitical or economic reasons. In particular, if buffers are large, current generations (and espe-cially the older generations) may put pressure on the fund to use these buffers to improve theirpensions. Moreover, young workers are willing to work for the sector at low wages, therebybenefitting shareholders and consumers.
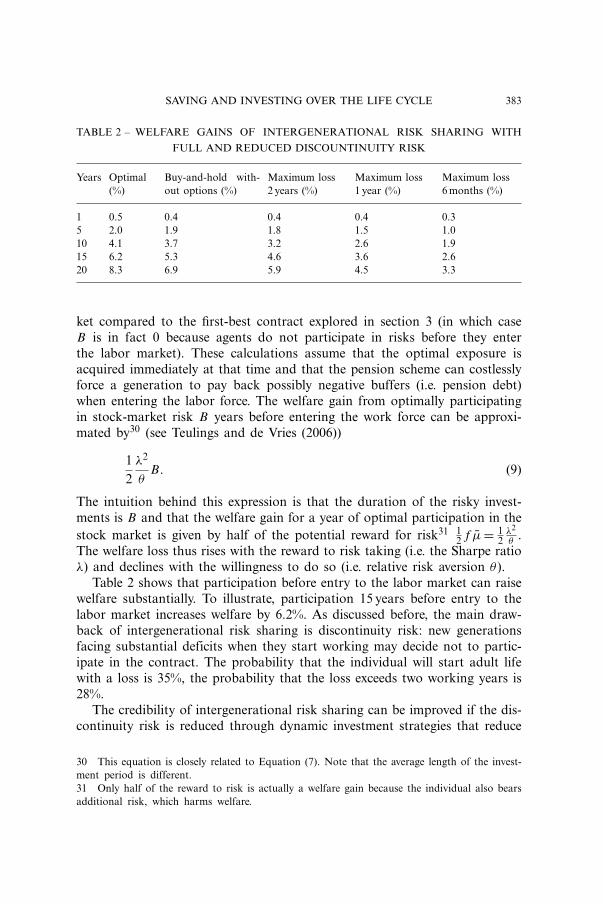
SAVING AND INVESTING OVER THE LIFE CYCLE 383
TABLE 2 – WELFARE GAINS OF INTERGENERATIONAL RISK SHARING WITH
FULL AND REDUCED DISCOUNTINUITY RISK
Years Optimal(%)
Buy-and-hold with-out options (%)
Maximum loss2 years (%)
Maximum loss1 year (%)
Maximum loss6 months (%)
1 0.5 0.4 0.4 0.4 0.35 2.0 1.9 1.8 1.5 1.010 4.1 3.7 3.2 2.6 1.915 6.2 5.3 4.6 3.6 2.620 8.3 6.9 5.9 4.5 3.3
ket compared to the first-best contract explored in section 3 (in which caseB is in fact 0 because agents do not participate in risks before they enterthe labor market). These calculations assume that the optimal exposure isacquired immediately at that time and that the pension scheme can costlesslyforce a generation to pay back possibly negative buffers (i.e. pension debt)when entering the labor force. The welfare gain from optimally participatingin stock-market risk B years before entering the work force can be approxi-mated by30 (see Teulings and de Vries (2006))
12λ2
θB. (9)
The intuition behind this expression is that the duration of the risky invest-ments is B and that the welfare gain for a year of optimal participation in thestock market is given by half of the potential reward for risk31 1
2 f µ̄= 12λ2
θ.
The welfare loss thus rises with the reward to risk taking (i.e. the Sharpe ratioλ) and declines with the willingness to do so (i.e. relative risk aversion θ ).
Table 2 shows that participation before entry to the labor market can raisewelfare substantially. To illustrate, participation 15 years before entry to thelabor market increases welfare by 6.2%. As discussed before, the main draw-back of intergenerational risk sharing is discontinuity risk: new generationsfacing substantial deficits when they start working may decide not to partic-ipate in the contract. The probability that the individual will start adult lifewith a loss is 35%, the probability that the loss exceeds two working years is28%.
The credibility of intergenerational risk sharing can be improved if the dis-continuity risk is reduced through dynamic investment strategies that reduce
30 This equation is closely related to Equation (7). Note that the average length of the invest-ment period is different.31 Only half of the reward to risk is actually a welfare gain because the individual also bearsadditional risk, which harms welfare.

384 BOVENBERG, KOIJEN, NIJMAN AND TEULINGS
TABLE 3 – PROBABILITY THAT THE MAXIMUM LOSS OF DYNAMIC STRATEGY TO
SHARE RISK WITH NON-OVERLAPPING GENERATION IS REACHED
Y Maximum loss2 years (%)
Maximum loss1 year (%)
Maximum loss6 months (%)
1 3 25 435 15 29 5710 17 49 6815 14 42 5820 11 29 45
the probability of substantial funding deficits when young cohorts start theircareer on the labor market. We model these investment strategies as buy andhold investments in equity as well as put options that limit the maximum lossto either 24, 12 or 6 months of salary. The fraction of annual income that isborrowed B years before entering the labor market is optimized. Tables 2 and3 report the welfare gains of such strategies compared to the first-best case ofsection 3, as well as the probability that the maximum loss is incurred.
Table 2 also shows that in case of participation 15 years before entry tothe labor market a welfare gain of 2.6% is left if new generations are onlywilling to participate in the contract if their initial funding deficit is limitedto six months income. Table 3 shows that the probability that this maximumloss will materialize is 58%. If new participants set two years of salary at risk,the welfare gain amounts to 4.6%, while the probability that as much as twoyears of salary will be lost is 14%. The investment strategy associated withthese guarantees closely corresponds to solvency rules imposed on collectivepension schemes by supervisors in order to ensure that the discontinuity riskdoes not become large.
Also Gollier (2006) has considered the benefits of intergenerational risksharing. He puts a constraint on how large the negative buffer can becomeby requiring that at any point in time, the fund must be large enough torepay the contributions made in the past. This in fact puts a constraint onhow large the negative buffer can become in absolute value. The solvencyconstraint thus reduces the ability of the fund to time diversify the portfo-lio risk. This has consequences for optimal saving and investment. As regardssaving, the solvency constraint strengthens precautionary saving, especially ifthe fund is close to the solvency constraint. Indeed, the fund then puts asideadditional funds to escape the limit on intergenerational risk sharing; thefinancial reserves of the fund in fact act like a buffer stock. As regards invest-ment, the fund invests mainly in bonds if it has a small amount of assetsand is thus close to the solvency constraint. Intuitively, the pension fund con-structs a put option by trading dynamically and exchanging its equity for

SAVING AND INVESTING OVER THE LIFE CYCLE 385
bonds if equity declines in value in line with a dynamic strategy that replicatesthe put option. The fund thus behaves as if it exhibits decreasing absolute riskaversion. This behavior of selling equity when the stock market goes downcontrasts with an individual who invests optimally in the absence of liquid-ity constraints. Such an investor buys additional equity to keep constant theshare of equity in overall wealth.32 Gollier (2006) shows that the welfare gainsfrom intergenerational risk sharing are substantially reduced when solvencyconstraints are imposed.
5.4 Welfare Losses Due to Uniform Premium Rates and Asset Allocations
So far we have assumed that the collective pension scheme offers every partic-ipant the pension contract that fits personal references and circumstances. Inreality, pension schemes usually impose identical contributions rates and assetallocations for all participants even though agents typically differ substan-tially in their rate of time preference ρi and risk aversion θ i (see e.g. Coccoet al. (2005)). Uniform and age independent contribution rates and asset allo-cations are optimal only under very stringent assumptions. To illustrate, inthe simple model without risk discussed in section 3.2, the optimal contribu-tion rate is constant if the real interest rate and the rate of time preferencecoincide. Equation (1) shows that consumption is constant over time in thatcase so that, with constant labor income, the optimal saving rate and thusthe optimal pension premium is also constant.33 The optimal share of finan-cial wealth invested in equity is age-independent only if human wealth has theoptimal exposure to the risk factor given by (4). This is not the case in ourbenchmark model with riskless human capital. Uniformity of the asset alloca-tion over agents with different preferences requires even stronger restrictionson the parameters.
With a stationary population, one can aggregate over the various agecohorts to arrive at a first-order approximation for the ratio between aggre-gated wealth of all participants in the pension scheme to aggregate saving (seeTeulings and de Vries (2006)):
W̄t
F̄t� D
D − T, (10)
32 Also this investor decreases the absolute size of its equity holdings as overall wealthdeclines.33 In models that include wage growth, the optimal saving rate out of labor income (i.e. theoptimal premium rate) remains constant over the life cycle and thus does not depend on age ifthe optimal growth rate of consumption equals the growth rate of labor income. This impliesa particular relationship between the growth rate of wage income, the interest rate and prefer-ence parameters (in particular, the intertemporal elasticity of substitution and the rate of timepreference).

386 BOVENBERG, KOIJEN, NIJMAN AND TEULINGS
TABLE 4 – WELFARE LOSSES WITH RESPECT TO THE FIRST-BEST SOLUTION IN
THE CASE IN WHICH CONSUMPTION AND INVESTMENT DECISIONS ARE BASED
UPON THE WRONG RATE OF TIME PREFERENCE ρ OR THE WRONG PARAMETER
OF RISK AVERSION θ . THE ACTUAL PREFERENCE PARAMETERS ARE GIVEN BY
P =0.02 AND θ =5
Rate of time preference ρ
1% 2% 3% 5%
Risk aversion θ2 −26.7% −31.2% −40.3% −74.8%3 −4.6% −4.9% −6.8% −16.3%5 −0.3% 0% −0.2% −2.5%10 −2.5% −2.3% −2.3% −2.7%
The actual preference parameters are given by ρ=0.02 and θ =5
where a bar represents the value for a variable aggregated over all participantsof a pension scheme. The ratio of aggregate overall wealth to aggregate finan-cial wealth thus approximately corresponds to total life time divided by thelength of the retirement period. Using (9) and (4) in (5), one can approxi-mate the investment share in equity for a pension scheme of participants withhomogeneous preferences. On the basis of our benchmark values, we find thata pension scheme should invest 80% of its financial assets in equity.
We do not address the optimal asset allocation of a collective pensionscheme with heterogeneous agents, which in addition to the age composi-tion of the scheme depends on the distribution of preference parameters aswell as relative weights in the collective welfare function. Rather, in line withthe analysis in Subsection 4.5, we compute the welfare losses if consumptionsmoothing and risk exposures are based on the wrong preference parameters.Subsection 4.5 reported results for borrowing constrained investors. We inter-preted these results as misspecified individual contracts because of misper-ceived preferences and poor investment advice.
Table 4 presents similar results for the case in which collective pensionschemes succeed in alleviating borrowing constraints for young, working gen-erations (but do not allow future generations to participate in equity-marketrisk). The table shows the impact of using the wrong risk aversion parame-ter or rate of time preference if constraints (including borrowing constraints)are absent so that premium and portfolio shares can adjust flexibly to shocks.These simulations indicate what happens if a collective scheme cannot tailorits behavior to the actual preferences of each individual participant, for exam-ple because it does not have access to information about the preferences ofthe individual (since the individual does not implements its own decisions but

SAVING AND INVESTING OVER THE LIFE CYCLE 387
has delegated these to the pension scheme). These losses assume that individ-uals do not have any access to capital markets outside the pension scheme.34
Furthermore, the assumed CRRA utility functions imply that the coefficientof risk aversion is equal to the inverse of elasticity of intertemporal substi-tution. The wrong coefficient of relative risk aversion thus distorts not onlyoptimal investment behavior (or risk sharing) but also optimal saving behav-ior (or intertemporal consumption smoothing).
5.5 Risk Exposure and Welfare Effects in Some Stylized Collective Models
Subsections 5.2 and 5.3 considered the idealized collective model that removesthe borrowing constraints early in the life cycle and allows intergenerationalrisk sharing while implementing the individually optimal contract. In prac-tice, collective pension schemes engage in risk sharing among non-overlappinggenerations by levying equal contributions on all active generations at a par-ticular point in time. Furthermore, the recovery premia and indexation cutsimposed in case of funding deficits typically decline over time as the fundingdeficits are gradually closed. Rather than behaving as a random walk as inthe optimal contract, consumption thus features mean reversion. Hence, risksare not optimally smoothed over the life cycle. Moreover, from the point ofview of overall remaining wealth, the generations alive at the time the shockhits bear a larger part of the overall burden than the generations who are notyet participating in the labor force even though all cohorts face the same con-sumption level at each point in time. The uniform, age-independent premiaand benefits, which depend only on the aggregate funding status of the fund,thus imply imperfect consumption smoothing and imperfect risk sharing. Thissubsection considers implications of actual pension contracts for risk expo-sures and welfare.
Boender et al. (2006) compares the performance of a number of differ-ent pension schemes using a semi-variance criterion to evaluate consumptionduring retirement.35 The study implicitly assumes that agents are risk neu-tral with respect to consumption during the working life because only theexpected premium level is taken into account when evaluating policies.36
Working agents are therefore willing to bear the risk of fluctuating premiawith small rewards in the form of risk premia. The retired generations canthus take advantage of the equity premium even though they do not bearmuch risk. One of the schemes that is considered is an individual scheme
34 In practice, it is easier for an individual to correct undersaving of the pension fund bysaving more than to correct oversaving of the fund by borrowing against the pension wealth.35 This criterion is closely associated with preferences that are associated with loss aversion(see Subsection 6.3.4).36 The paper assumes mean reversion in stock prices (see section 6.2.5).

388 BOVENBERG, KOIJEN, NIJMAN AND TEULINGS
with an age dependent asset mix.37 The paper explores also a hybrid collec-tive scheme where both the contribution rate and the (real) benefit level of allparticipants adjust in identical ways to fluctuations in the collective fundingratio. The paper argues that the hybrid collective scheme is welfare improvingcompared to the individual scheme due to the value of the buffers in intergen-erational risk sharing. The study abstracts from heterogeneity between agents.For an extensive evaluation of this study, see Boender et al. (2006).
Cui et al. (2006) consider the welfare gains due to intergenerational risksharing in four pension deals. These deals are approximately fair in valueterms and assume time-invariant asset allocations for the collective contracts.Their main finding is that these collective schemes can add value from theperspective of new entrants even relative to the optimal unrestricted individ-ual scheme without intergenerational risk sharing and even if the scheme isinitially underfunded. The welfare gain is estimated to be 1–4% in terms ofcertainty equivalent consumption. The paper also analyzes the impact of sol-vency constraints, which ensure that the probability of underfunding shouldremain small. The paper shows that the reduction in risk taking implied bythis constraint does not substantially reduce the welfare gains of the collectivescheme. The results of Cui et al. (2006) are based on homogeneous popula-tions and imply significant risk taking by the fund (up to 100% in equity) inthe unconstrained case. The paper does not report how long it takes beforesituations of underfunding are recovered and how deep underfunding can be.This makes it difficult to assess how serious the discontinuity risk actually is.
Koijen et al. (2007) consider stylized collective pension schemes using assetallocation rules that vary with the funding ratio of the scheme. The fundingratio, ft is defined as the ratio of the market value of the assets over the mar-ket value of time invariant basis benefits bb. Benefit improvements or reduc-tions ba
t occur during the entire retirement period whenever the funding ratiois more or less than one at the time of retirement.38 The basis premium πb
is actuarially fair for the basis benefits.39 If the funding ratio is below one,additional pension contributions πa
t will be imposed, and likewise reductionsare given if the funding ratio is high. The total pension contribution and the
37 In contrast to the model in section 2, the asset mix does not depend on past shocks inthe financial markets. Hence, individuals can not construct options by dynamically trading inbonds and stocks. Since options are not available in the model, financial markets are in effectdynamically incomplete. In these circumstances, collective pension funds can help to completemarkets by in effect creating new assets through pension contracts.38 Agents thus obtain fixed annuities at the time of retirement. After they have obtainedthese annuities, they are no longer exposed to risk. Agents are therefore exposed to the riskof underfunding at the time of retirement. In fact, if the pension fund is underfunded at thetime they retire, the value of their annuity is reduced so that the consumption level is scaleddown during the rest of their life.39 Since both the basis premium and the basis benefits are risk free, the risk-free interestrate is used to compute the cost price of the basis benefits.

SAVING AND INVESTING OVER THE LIFE CYCLE 389
total benefit are defined as
πt =πb +πat (11)
bt =bb +bat (12)
The asset mix xt as well as the benefits and contributions adjustments dependlinearly on the funding ratio:
xt =α0 +α1(1− ft ) (13)
πat =β1(1− ft ) (14)
bat =ς1(1− ft ) (15)
The paper considers three stylized schemes: a collective defined contributionscheme with a fixed contribution rate (β1 = 0), a collective defined benefitscheme with a fixed benefit level (ς1 = 0) and a hybrid collective scheme inwhich both the contribution and benefit levels can fluctuate with the fundingrate. The parameters in (13)–(15) are optimized conditional on a condition onthe half-time of any deficits in the fund.
Table 5 summarizes the main results. The DC schemes perform worse thanDB schemes. The intuition is that consumption during the working life con-tributes more to the risk-sharing capacity of an individual than consumptionduring retirement because the working life lasts longer than the retirementperiod does and is also discounted less heavily.40 The hybrid systems performbest because these schemes utilize the risk-bearing capacities of individualsduring both their working and retirement periods.
The results in Table 5 illustrate the importance of the recovery period.With a relatively short half-life of three years (i.e. the period during whichhalf of the funding imbalance is made up), collective schemes do worse interms of ex-ante welfare than the optimal individual scheme from Subsec-tion 4.3 (i.e. including borrowing constraints, annuities and discrete trad-ing but with fully flexible premia, annuity levels, and portfolio choices). Forlonger recovery periods (a half-life of 10 years), in contrast, the collectivehybrid scheme can realize a certainty equivalent consumption level that is4.7% above that for the optimal individual scheme.
40 An argument that goes the other way is that consumption when young cannot respondto shocks that occur after consumption has taken place. Hence, retirement consumption canrespond to more shocks. Flexibility in retirement consumption is thus more valuable than flex-ibility in working-life consumption. If the length of the working period becomes smaller com-pared to the expected retired period, the DC scheme becomes more efficient compared ta aDB scheme.

390 BOVENBERG, KOIJEN, NIJMAN AND TEULINGS
TABLE 5 – CHARACTERISTICS OF COLLECTIVE SCHEMES AND WELFARE GAINS
RELATIVE TO OPTIMAL INDIVIDUAL CONTRACT DISCUSSED IN SUBSECTION 4.3
(I.E. INCLUDING BORROWING CONSTRAINTS, ANNUITIES AND DISCRETE TRAD-
ING BUT WITH FULLY FLEXIBLE PREMIA, ANNUITY LEVELS, AND PORTFOLIO
CHOICES)
Half-life 3 years Half life 6 12 years Half-life 10 years
CDC CDB CH CDC CDB CH CDC CDB CH
α0 9.2% 28.8% 39.1% 17.9% 54% 76.6% 25.4% 73.5% 94.9%α1 −0.35 −0.08 −0.01 −0.23 0.14 0.24 −0.08 0.26 0.24πb 14.6% 15.5% 15.0% 14.1% 15.9% 14.9% 13.6% 16.2% 15.0%bb 82.1% 87.3% 84.7% 79.3% 89.4% 84.0% 76.8% 91.3% 84.4%β1 0 0.99 0.73 0 0.53 0.38 0 0.38 0.27ς1 −3.25 0 −0.79 −1.65 0 −0.42 −1.12 0 −0.29Welfare gain −4.7% −2.4% −1.8% −4.1% 0.4% 1.8% −3.4% 2.9% 4.7%
Table 5 contains also relevant information on the risk-sharing propertiesof the collective schemes. In the optimized hybrid scheme with a half-life ofthree years a 10% funding deficit implies a reduction in benefit level of 7.9percentage points to 76.8%. Likewise the contribution rate would be 7.3 per-centage points above the base level of 15.0%. In this particular case, the assetmix would be almost fixed at an equity share of 39%. In case of longer recov-ery periods, more investment risk is taken and the contribution and benefitlevels will be substantially more stable.
6 EXTENSIONS
6.1 Human Capital
Sections 3, 4 and 5 restricted the analysis to two financial assets, namelystocks and risk-free bonds. We assumed a constant and riskless wage sothat in the unconstrained case human capital was in fact equivalent to arisk-free bond. Sections 4 and 5 allowed for the non-tradability of humancapital: moral hazard and adverse selection prevent individuals from tradingclaims against their future labor income. The non-tradability of human capi-tal affects both intertemporal consumption smoothing and risk sharing.
This section considers human capital more closely. Rather than assuminga constant and riskless wage over the life cycle (until retirement), we intro-duce realistic career patterns (i.e. wage income depends on age) and allowwage income to be stochastic. Human capital risk can be decomposed intotwo components: an individual (idiosyncratic) component that is specific to

SAVING AND INVESTING OVER THE LIFE CYCLE 391
the individual and an aggregate component that applies to all individualsalike. Aggregate risk may be more important for some individuals than oth-ers. Entrepreneurs, for example, tend to bear more aggregate risk than civilservants.
Subsection 6.1.1 first discusses more realistic career patterns and theconstraints on intertemporal consumption smoothing that result in the pres-ence of borrowing constraints, then Subsection 6.1.2 introduces non-insur-able idiosyncratic human capital risk, and Subsection 6.1.3 combines this riskwith borrowing constraints. The implications of aggregate human capital areexplored in Subsection 6.1.4, while Subsection 6.1.5 analyzes what happens iflabor supply becomes endogenous.
6.1.1 Intertemporal Consumption Smoothing and Borrowing ConstraintsUntil now, we have stressed the consequences of borrowing constraints forrisk taking. Especially young agents often cannot borrow against the collat-eral of their human capital to invest in equity. As a result of these short-saleconstraints, the shadow value of equity for young agents exceeds the marketvalue. Borrowing constraints, however, constrain not only risk taking but alsointertemporal consumption smoothing for young agents. This is especially rel-evant for young high-skilled agents facing a steep career pattern: the youngestyears feature low earnings but rapid growth of these earnings. Hence, theseagents would like to borrow against the future value of their human capitalfor the purpose of consumption smoothing. The desire to borrow is particu-larly large if precautionary saving motives are weak on account of a low levelof risk. In the presence of borrowing constraints, young agents can not cap-italize the value of their human capital to raise their consumption in youth.They in effect feature shadow interest rates ri that exceed the market rate.41
6.1.2 Idiosyncratic RisksThe idiosyncratic component of human capital risk is uncorrelated to anyother risk in the economy. This component can thus in principle be diver-sified in financial markets. However, this would give rise to serious moralhazard problems; individuals would reduce their effort and claim that theresulting low wage income has been due to misfortune instead of shirking.Indeed, human capital is special in that it is not really tradable in financialmarkets and introduces market incompleteness. Nevertheless, social insuranc-es (such as disability and unemployment insurances) do provide partial insur-ance against idiosyncratic human capital risk but moral hazard reduces the
41 This shadow interest rate is determined such that (2) is met with the constrained con-sumption growth rate. Hence, rather than that (2) determines the growth rate of consumptionat a fixed interest rate, the expression determines the implicit individual-specific interest rate riat a given growth rate of consumption.
392 BOVENBERG, KOIJEN, NIJMAN AND TEULINGS
optimal coverage, thereby leaving a substantial amount of risk with the indi-vidual.
An important topic for future research is to estimate idiosyncratic humancapital risk in the Netherlands and how it has developed over time. Onthe one hand, reduced coverage of social insurance and more competitionand the associated creative destruction may have increased this risk. On theother hand, a more flexible labor market may reduce the length of unemploy-ment spells and increase the opportunities for outsiders to find work, therebyreducing persistent labor-market risks. Within idiosyncratic risks, one can dis-tinguish between temporary and permanent wage shocks. Abowd and Card(1989) and Topel and Ward (1992) have shown that log wages in the UnitedStates are close to a random walk, where the standard deviation of innova-tions is large, namely about 10% per year.
The uninsurable idiosyncratic uncertainty about human capital affects bothoptimal saving (i.e. intertemporal risk sharing over time) and optimal invest-ment (i.e. risk sharing). Persistent shocks that substantially affect the value ofhuman capital can have substantial effects, especially on precautionary savings(see Koo (1995) and Viceira (2001)).42 If we extend the basic model modellaid out in section 2 with uninsurable uncertainty about human capital, pru-dent investors increase precautionary saving.
As regards investment, the introduction of idiosyncratic risk reduces thevalue of human capital.43 In the beginning of the working career, over-all wealth consists mainly of human capital. With fixed relative risk aver-sion (CRRA) and thus a fixed optimal share of overall wealth invested inrisk-bearing assets (see (4)),44 a reduction in human wealth as a result of idio-syncratic risk decreases the initial absolute holdings of equity. Later on duringthe life cycle, the stock of financial wealth increases as a result of larger pre-cautionary savings. This tends to raise the absolute size of stock holdings. Asagents age, human capital becomes less important compared to financial cap-ital and eventually the effect on absolute equity holdings of larger financialwealth dominates the effect of smaller human capital. The young holding lessequity and the old holding more equity implies that the age pattern of equityholdings becomes less skewed towards the young as a result of uninsurable
42 Hence, more ideosyncratic risk as a result of increased labor-market flexibility boosts life-course saving for precautionary motives.43 In the presence of undiversifiable wage risk, we can no longer rely on market prices tomeasure human capital but must employ individual-specific risk premia (or pricing kernels) todiscount future wage income. If wages behave like a random walk, the reduction in humanwealth is particularly large at the beginning of the career when households face uncertaintythat accumulates over a long horizon.44 Gollier and Prat (1996) derive the conditions on more general utility functions for equityholdings to decline if investors bear another independent background risk. In particular, inves-tors should be risk vulnerable.

SAVING AND INVESTING OVER THE LIFE CYCLE 393
human-capital risk: whereas human capital increases the demand for equity,human-capital risk reduces it. As a fraction of financial assets, stock hold-ings unambiguously decline during the entire working life as a result of undi-versifiable background risk in human capital. The reason is that human cap-ital becomes less important compared to financial capital. Hence, a smallershare of financial wealth needs to be exposed to equity risk to obtain the cor-rect exposure of overall wealth to that risk (see the impact of a smaller ratioHt/Ft on f ∗
t in (5)).
6.1.3 Idiosyncratic Risks and Limited Intertemporal Consumption SmoothingCombined with borrowing constraints (and steep career patterns) limitingintertemporal consumption smoothing, idiosyncratic human-capital risk intro-duces other complications. With borrowing constraints, the individual is notable to optimally diversify labor income risks over time. As a direct conse-quence of the reduced ability to smooth risks intertemporally, the individualwill take less risk on its investment portfolio if the household owns positivefinancial wealth.45 The effects of background labor-income risks on invest-ment behavior seems relatively minor but become more important if borrow-ing constraints limit intertemporal consumption smoothing of large transitoryshocks. Indeed, the flexibility of intertemporal consumption smoothing is akey determinant of the risk that agents can afford to take on.
On the basis of numerical simulations, Gollier (2005) shows that this maycause young households with small financial reserves to invest less in equitythan older households who are less constrained by borrowing constraintsin diversifying risks over a longer period. In a similar vein, Cohen andEinav (2005) find that young investors choose portfolios that are less tiltedtowards equity than the portfolios of middle-aged investors. Thus, the com-bination of labor-market risks and a steep career pattern preventing optimalintertemporal consumption smoothing (or the potential of large drops inlabor income) thus turn around the result from unconstrained models thatyoung households should hold substantial amounts of equity that exceed theamounts (both in absolute values and as a share of financial wealth) of olderhouseholds. Indeed, the desire to hold a safe, liquid stock of precautionarysavings has become one of the explanations for the equity premium puzzleand for why young households do not participate much in the stock market(see Constantinides and Duffie (1996) and Brav et al. (2002)). Social insurancethat provide insurance of human capital risk can thus boost equity invest-ments and thus increase the risk-bearing capacity of the economy. Hence,pension schemes can raise the demand for equity not only by relieving short-sale constraints but also by providing insurance against human-capital risks.
45 This is similar to the impact of a defined-contribution pension system that forces individ-uals to absorb risk in the limited period of their retirement.

394 BOVENBERG, KOIJEN, NIJMAN AND TEULINGS
Liquidity constraints not only make investment behavior more conservativebut also strengthen precautionary saving motives – even if financial wealthis positive. Indeed, by investing conservatively and setting aside resourcesthrough saving, individuals ensure the presence of a financial buffer that helpsthem to optimally time diversify temporary risks.46 Precautionary motivesrather than saving for retirement tend to be the main reason why younghouseholds save (see Cocco et al. (2005)). As a direct consequence of theadditional saving, financial wealth will be higher later on in life, which willtend to increase equity exposure when old. Hence, precautionary saving fur-ther weakens the result that the young should have much more equity expo-sure than the old if idiosyncratic risk is combined with borrowing constraintsand a steep career pattern preventing intertemporal consumption smoothingat young ages.
Davis et al. (2005) formulate a model in which individuals can borrow butat a cost that exceeds the risk-free rate of return. As far as investment behav-ior is concerned, high borrowing rates discourage young households fromacquiring a large equity exposure by leveraging their portfolio. As regardsconsumption smoothing, high borrowing rates discourage dissaving early inlife so that agents can build up a stock of financial wealth earlier, which helpsto boost equity exposure later on in life. Their model is better able to fitthe empirical evidence on borrowing and individual equity holdings over thelife cycle. They show that a borrowing rate equal to the expected return onequity minimizes the overall demand for equity over the life cycle. The rea-son is that this crowds out all borrowing aimed at buying equity but doesnot unnecessarily discourage borrowing for consumption-smoothing purposes,which boosts wealth and equity exposure later in life. High borrowing ratesdo explain why the equity exposure of older workers is larger than that ofyounger workers.
The behavior of individuals facing borrowing constraints resembles that ofa pension fund facing solvency constraints. Both borrowing constraints andsolvency constraints harm the ability to time diversify risk. They thus reducerisk-bearing capacities and encourage precautionary saving to escape theseconstraints. Saving occurs not only to smooth consumption in the face of thedepreciation of human capital during retirement but also to help smooth con-sumption in the face of labor-income shocks during the active life. Especiallyat low levels of financial wealth, the latter precautionary motive may domi-nate the retirement motive.
Non-insured medical expenses can be an important source of idiosyncraticbackground risk for older households. Hence, also older households may face
46 In the case of permanent shocks, optimal consumption smoothing dictates that consump-tion is reduced in line with income. Habit formation, however, can then still give rise to adesire to reduce consumption gradually and thus a need for a financial buffer.
SAVING AND INVESTING OVER THE LIFE CYCLE 395
idiosyncratic risk with implications for saving behavior (i.e. precautionary sav-ing) and investment behavior (and also the willingness to take out annuities).In particular, these households then also save for precautionary reasons andwhen they start to be subject to these risks invest more conservatively andare discouraged from taking out illiquid annuities. An important topic forfuture research is to distinguish between liquid precautionary saving and illiq-uid retirement saving. The papers discussed do not distinguish between thesetwo categories and assume that all saving is liquid.
6.1.4 Aggregate RisksAn aggregate component to wage risk introduces other issues. First of all,to the extent that aggregate human-capital risk is correlated with equityrisk, human capital becomes more like equity. Equity and human capital arethus substitutes. As a direct consequence, the wealth share invested in equitydeclines compared the case in which human capital does not carry any macro-economic risk. This is especially so at the beginning of the working life whenhuman capital constitutes the bulk of overall wealth. The share of financialwealth invested in equity thus declines less sharply over the life cycle. Asnoted above, if human wealth has the optimal exposure to equity risk givenby the optimal exposure (4), the part of financial wealth invested in equityis constant during the life cycle. This may be relevant for entrepreneurs whoface substantial aggregate risk.
Another issue arises if wage risk is not perfectly correlated with equity risk.In that case, a second macro-economic risk factor emerges. This risk factorcan in principle be traded through wage-indexed bonds. In particular, youngagents who are long on this risk factor can trade this risk with older agentswho do not bear (much of) this risk. In practice, however, we do not observewage-indexed bonds. A wage-indexed defined-benefit pension may, however,act as a substitute for tradable wage-indexed bonds. Through such a pen-sion system, the younger generations share wage risk with the retired agents(see Beetsma and Bovenberg (2007)). Hence, pension schemes allow not onlyyoung workers with ample human capital to capture the equity risk premiumbut also older agents to capture part of the human capital risk premium.Compulsory pension schemes may allow human capital to become in facttradable.
Older agents are willing to absorb wage risk even without compensation ifretirees care about the value of their pension relative to the average standardof living in the economy (see also Subsection 6.3.2). Moreover, with theseso-called standard-of-living preferences, positive correlation between equityand wage risk makes equity a more attractive investment for old-age pen-sion insurance, especially for older agents who rely more on financial rather

396 BOVENBERG, KOIJEN, NIJMAN AND TEULINGS
than human capital to finance their consumption.47 Intuitively, stocks matchto some extent the liability risks that are associated with changes in desiredconsumption based on the aggregate standard of living. Hence, whereas pos-itive correlation between equity and wages reduces the equity holdings ofyoung agents with ample human capital, this correlation may actually raisethe equity holdings of older agents with standard-of-living utility. The conclu-sion is again that the age profile of equity holding is thus less steeply declin-ing than in the benchmark model.
This conclusion is strengthened in a recent paper by Benzoni et al. (2007).This study indicates that labor income is cointegrated with equity prices. Thismakes human capital a closer equity substitute for younger workers with alonger investment horizon than for older workers and retirees with a shorterinvestment horizon. Consequently, young workers invest less in stocks thanolder agents do. Benzoni et al. (2007) finds that the cointegration betweenwages and stocks can explain why young workers do not hold positive equity.In fact, they find that young investors should want to short stocks becausetheir human capital is effectively a leveraged security with large exposure tostock markets.
6.1.5 Endogenous Labor SupplySections 4 and 5 showed that more flexibility to adjust premia and retire-ment benefits can substantially enhance the capacity to bear risks. Bodie etal. (1992) show that the same holds for the flexibility to adjust labor supplyand the consumption of leisure. With endogenous labor supply, human capitalamounts to the discounted value of potential wage income (i.e. wage income ifno leisure would be consumed) and is thus larger than the discounted valueof actual wage income. Indeed, the stock of wealth is larger now because itfinances consumption of not only produced goods but also leisure. As theshare f in (4) applies now to a larger stock of wealth, the overall demandfor risk-bearing capital rises. Indeed, shocks can be absorbed by adjustingconsumption of both produced commodities and leisure. This enhances thecapacity of the economy to absorb risks and thus increases the aggregatedemand for risk taking.
If labor supply becomes more flexible over the entire life cycle, the shareof financial wealth invested in risk-bearing assets, f ∗, now varies even morewith age. This changes if labor supply is especially flexible around retirementbecause agents can adjust the time and speed with which they retire. In that
47 A similar argument applies to pension funds providing wage-indexed pension benefits. Seede Jong (2005) for the market valuation of wage-indexed liabilities, taking into account thepotential correlation between equity and wages. In particular, this correlation ceteris paribusreduces the market value of wage-indexed liabilities by raising the implicit risk premium whendiscounting.

SAVING AND INVESTING OVER THE LIFE CYCLE 397
case, also older workers can afford to invest in risk-bearing assets. This pointsto the importance of a flexible labor market for older workers to sustain thesupply of risk-bearing capital in an aging economy. A formal analysis of theimpact of flexibility of the retirement date on the optimal risk taking is pro-vided by Farhi and Panageas (2007).
6.2 Financial Risk Factors and Longevity Risk
6.2.1 IntroductionApart from human capital risk, the main risk factors that individuals faceare interest rate risk, inflation risk, equity risk and longevity risk. Until now,we have explored only equity risk and imposed that stock returns were notpredictable. Subsections 6.2.2 and 6.2.3 introduce interest-rate risk as well asinflation risk. Subsection 6.2.3 briefly discusses the evidence on stock returnpredictability and its implications for optimal consumption smoothing andrisk sharing over the life cycle. Subsection 6.2.4 considers micro as well asmacro longevity risk and the value of annuity markets and longevity bonds.
6.2.2 Interest Rate RiskSo far we ignored inflation risk and assumed a constant interest rate. If (real)interest rates fluctuate over time, the investor is faced with an additional riskfactor. Fluctuations in interest rates affect the value of the human capital aswell as the value of the bond portfolio. Early in the life cycle, portfolios areto be held with long durations to hedge against the required consumptionduring retirement. The duration of human capital is typically shorter thanrequired. If bonds or interest rate derivatives would be available with verylong maturities, the part of financial wealth that is invested in fixed incomecan be invested in these assets to obtain the optimal duration for total wealth.In the more realistic case in which the maximum maturity of traded bondsand derivatives is limited, the fraction of financial wealth invested in bondsis increased at the expense of equity. In this way, the duration of the assets ismore closely aligned with the duration of the consumption pattern while theremaining interest rate risk is balanced with equity risk. Campbell and Viceira(2001), Brennan and Xia (2000), Sangvinatsos and Wachter (2005) and Munkand Sorensen (2005) have considered the implications of time varying inter-est rates on the optimal demand for long-term bonds and analyze the welfaregains of hedging variations in real rates.
A number of recent studies report that the expected bond returns areclearly time-varying, i.e. bonds are more attractive in some periods than inothers, see e.g. Cochrane and Piazessi (2005). In particular, the real (as wellas the nominal) bond risk premium is increasing in the real rate. Sangvinat-sos and Wachter (2005) show that unconstrained long-term investors (as con-sidered in section 3) can realize large gains by exploiting these time varia-

398 BOVENBERG, KOIJEN, NIJMAN AND TEULINGS
tion s in bond premia. Koijen et al. (2006b) consider the case of borrowingconstrained life-cycle investors explored in section 4. They find that short-sellconstraints reduce the potential gains associated with bond timing strategiesbecause these gains can be obtained only at the expense of reduced equityexposure unless very long maturity bonds would be traded. The economicgains realized by bond timing strategies peak around the age of 50 (whenagents have build up substantial financial wealth and are less constrainedby borrowing constraints) and are hump-shaped over the life-cycle. If inves-tors can avoid borrowing constraints through participation in collective pen-sion schemes (see section 5), they may be able to realize the larger benefitsreported in Sangvinatsos and Wachter (2005).
6.2.3 Inflation RiskWe have assumed so far that inflation risk is negligible or, equivalently, thatall assets that have been considered are inflation indexed. In reality, infla-tion linked assets are rarely traded and inflation is an important risk factorfor long term financial planning. In the absence of inflation risk, long-termnominal bonds e.g. are riskless for long-term investors if the maturity equalsthe horizon of the investor. If inflation risk is taken into account, however,Campbell and Viceira (2005) report that the annualized standard deviation ofreal returns on these bonds is as large as 8% and exceeds that of stocks formaturities of over 35 years. Risk-averse long-term investors therefore exhibita strong preference for index-linked bonds if available. The difference betweenthe expected return on nominal bonds and that on real bonds with the samematurity is known as the inflation risk premium. The inflation risk premiumis substantial (0.7% per annum on average) and decreases in the real rate andincreases with expected inflation (Burashi and Jiltsov (2005)). Less risk-averseinvestors should take these fluctuations of the risk premium over the businesscycle (from 0.2% to 1.4%) into account in their decision whether or not tohedge inflation risk.
Campbell and Viceira (2001) report that the certainty equivalent wealtheffect of access to inflation indexed bonds for short-sell constrainedinvestors48 can be as large as 10–30%.49 In reality, inflation linked assetsare often not available to individual investors. To a lesser extent, this is alsotrue for institutional investors.50 These investors therefore face the question
48 Note though that Campbell and Viceira (2001) abstract form labor income.49 The welfare gains of access to real rather than nominal annuities have been considerede.g. by Brown et al. (2001). Koijen et al. (2006a) extend this analysis to access to real as wellas equity linked annuities.50 In the UK inflation linked bonds are traded and a number of other countries introducedthem recently. Still there could be a gap between the inflation index that is traded (e.g. nationalprice inflation) and the inflation rate that is relevant to the investor (e.g. regional wage infla-tion).

SAVING AND INVESTING OVER THE LIFE CYCLE 399
to what extent indexed bonds can be replicated by nominal bonds. The timevariation in nominal and real interest rates can be adequately captured byfluctuations in the real interest rate and in expected inflation. Expected infla-tion is much more persistent than the real rate, whereas the risk premiumfor real interest rate risk exceeds that for fluctuations in expected inflation.Unconstrained investors can exploit the differences between bonds with dif-ferent maturities with respect to the sensitivities to the real rate and expectedinflation factor in order to hedge away substantial parts of the inflation riskusing sophisticated dynamic trading strategies. Unexpected inflation howevercan not be hedged without access to inflation-linked assets. Morever, manyinvestors will be constrained to hedge against the real interest and expectedinflation factors or will not be equipped to implement dynamic trading strat-egies. Institutional investors like pension funds or insurers can create valuehere.
If inflation sensitive assets are not available for the investor, the minimumvariance portfolio for a long term investor is a horizon dependent mix of thenominal bond with the corresponding maturity, stocks and cash. This impliesthat when investors are forced to bear inflation risk they will shorten thematurity of the bond portfolio (see Campbell and Viceira (2001, 2005)).Thisimplies that the optimal duration of the fixed income portfolio is smaller thanthat of the consumption profile. In the Netherlands most pension schemesissue nominal guarantees to their participants. The solvency requirements forthese guarantees imposed by the regulator lead them to extend the maturityof their assets to that of their nominal liabilities. If individuals care aboutthe purchasing power rather than the nominal value of their pension, eventhe most risk averse individuals would prefer a less than full reduction of theduration mismatch between the assets and the liabilities.
6.2.4 Equity Risk ReconsideredIn the analysis so far we assumed that stock prices are generated by a randomwalk, and that the (log) stock returns are independently normally distributedwith constant mean and volatility. The assumptions that stock returns fea-ture constant expected returns (and hence are uncorrelated) and that theirrisk level is constant have been challenged in the literature. In the sequel, weaddress each of these assumptions as well as the implications of alternativeassumptions for optimal financial planning.
There is a lively debate in the literature as to whether the expected stockreturns are time-varying.51 Many authors claim that the expected return onequity depends on variables such as the dividend yield or the term spread sothat equity returns are to some extent predictable. The typical finding in the
51 See e.g. Ang and Bekaert (2006), Campbell and Yogo (2006), Cochrane (2006), Goyal andWelch (2006), and Lettau and van Nieuwerburgh (2006).

400 BOVENBERG, KOIJEN, NIJMAN AND TEULINGS
literature is that, at the low frequencies that are relevant for financial plan-ning over the life cycle, stock returns are negatively correlated, implying thatthe stock market is mean reverting. As discussed in Subsection 3.2, both themean and the variance of the excess return vary in the same way with theinvestment horizon (namely proportionally). If stock returns are mean revert-ing, in contrast, the variance of the excess returns rises less rapidly with thetime horizon than the mean of the excess return. As a direct consequence,stocks are less risky for long-term investors than for short-term investors sothat young investors should invest an even larger over their financial wealth inequities. Campbell, Chan and Viceira (2003) and Campbell and Viceira (2005)show that the annualized standard deviation of real returns of about 17% ofa diversified stock portfolio is reduced to an annualized standard deviation ofonly 8% on a 20-year horizon, which is in fact comparable to the annualizedvariance of the real returns of nominal bonds with the same maturity that areheld to maturity. Bond portfolios with constant maturity are also somewhatmean reverting.
A second assumption on the stock market process that we adopted so faris that the volatility of stock returns is time-invariant. The literature containsabundant evidence that this is not the case at shorter horizons and thereforecan be an approximation at lower frequencies at best. Chacko and Viceira(2005) and Liu (2007) consider an incomplete markets setting with time vary-ing volatility of equity returns. This volatility factor can not be traded. Thesepapers show that the impact of time variation in volatility on the optimalasset allocation is small, in particular in the empirically relevant case of vol-atility being negatively correlated with stock returns (so that stocks becomeless risky if returns are high).
6.2.5 Longevity RiskLongevity risk is important both for the financial planning of individualinvestors and for the optimal asset allocation of collective pension schemes.Two types of longevity risk have been distinguished in the literature. Macrolongevity risk refers to uncertain development in future mortality rates due toimproved health care, changing in nutrition and habits, etc. Macro longevityaffects the average mortality of a pool of individuals, e.g. in a pension fundor insurance pool. Micro longevity risk refers to the uncertainty for an indi-vidual on whether or not he will survive, irrespective of changes in mortalityrates.
Micro longevity risk can not easily be traded on financial markets becauseof adverse selection. Older individuals typically have superior information ontheir survival probabilities then the issuer of the annuity. As the asymmetry ininformation becomes more important for older agents with poor health con-ditions, annuities are irreversible. This gives rise to a fundamental trade-offbetween liquidity and longevity insurance. Adverse selection forces the issuer

SAVING AND INVESTING OVER THE LIFE CYCLE 401
of voluntary annuities to offer prices that are not actuarially fair for the pop-ulation at large.52 Mandatory participation in a collective pension schemealleviates these adverse-selection problems.
In the absence of bequest motives and liquidity problems and in thepresence of a rich menu of annuities is available at not too actuariallyunfair prices, annuities are welfare improving (Davidoff et al. (2005); Poterba(2006)). If real annuities or variable annuities that offer exposure to stockmarkets are not available, annuities become less attractive to the individ-ual investor. In view of the absence of adverse selection, collective pensionschemes offer annuities that are not available to individual investors. In par-ticular, many collective schemes aim to offer real annuities through theirindexation ambition and imply some equity exposure because indexation isreduced if investment returns are insufficient. Another important aspect ofcollective pension arrangements is that they usually impose deferred annu-ities at an early age. Deferred annuities, i.e. annuities that only generate cashflows after a deferral period, are often not available in voluntary annuity mar-kets. Even if the option would be available, one may wonder whether agentswould buy deferred annuities early in their life cycle. Deferred annuities canbe attractive because they offer a hedge against the conversion risk generatedby future fluctuations in interest rates and, to a lesser extent, changes in mor-tality rates.
Collective pension schemes usually impose uniform contribution rates ontheir participants. Section 5 explored the impact of heterogeneity in riskaversion and time preference, and referred to heterogeneity in non-pensionwealth. Longevity risk is another dimension of heterogeneity: the life expec-tancy of women exceeds that of men, that of whites that of blacks and thatof highly educated persons that of less educated persons. Uniform contribu-tion rates impose a welfare loss on individuals with low life expectancy due toimplicit value transfers from individuals with lower life expectancy to thosewith longer life expectancy (see e.g. Brown (2002) and Finkelstein, Poterbaand Rothschild (2005)).
For pension funds and other issuers of annuity contracts macro longevityrisk is a relevant concern. Unexpected increases in life expectancy increase themarket value of their liabilities and can harm their solvency position. Froma macro-economic point of view, the natural issuer of longevity protectionare young and future generations. By issuing longevity bonds, the governmentcan offer instruments to insure the longevity risk of older people by shift-ing it to younger cohorts, for example by conditioning the retirement age ofthe public pension system on longevity. By this conditioning of the retirementage, the government reduces the impact of longevity risk on its balance sheet.
52 Annuities can be attractive for individuals even if they are not actuarially fairly priced(see e.g. Mitchell et al. (1999)).

402 BOVENBERG, KOIJEN, NIJMAN AND TEULINGS
Macro longevity risk can in principle be traded on financial markets (seeBlake et al. (2006)) although attempts to introduce longevity bonds havefailed so far. Through financial markets, macro longevity risks can be diver-sified between pools, sectors and countries. Note that the scope for diversifi-cation is limited if changes in health care and life style affect all populationsin approximately the same way at the same point in time.
6.3 Preferences
This subsection explores the implications of a coefficient of relative risk aver-sion that is not constant. Subsection 6.3.1 first of all considers the impli-cations of minimum consumption needs. Subsections 6.3.2 and 6.3.3 subse-quently consider external and internal habits, respectively. Finally, Subsections6.3.4 and 6.3.5 investigate loss aversion and endogenous reference points.
6.3.1 Required Minimum ConsumptionPreferences may imply that people require a minimum amount of consump-tion in order to derive any utility at all:
U = E
[∫ L
0exp(−ρt)
11− θ
(Ct − C̄t
)1−θdt
], (16)
where C̄t ≥ 0 represents the minimum (or necessary or required) consumptionlevel at time t .
As regards investment behavior, the optimal wealth share invested in equityis given by
f ∗t = f
(Wt − Xt )
Wt= f
(1− Xt
Wt
), (17)
where Xt =∫L0 −t exp(−r x)C̄x+t dx stands for the discounted value (using the
risk-free rate as a discount rate) of the minimum consumption levels over therest of the life cycle and f is the solution for fi in (4) with θ i = θ . Intui-tively, the investor first invest in risk-free assets Xt to guarantee the minimumconsumption level and then invests a fixed fraction f (given by (4)) of remain-ing wealth (Wt − Xt ) in risk-bearing assets. In the terminology of asset-liabil-ity management (ALM), one thus matches the fixed liability Xt with risk-freeassets. Indeed, comparing the second equality in (17) (with Wt = Ft since Ht =0) with the corresponding equality in (5), we see that human wealth Ht actslike a risk-free asset, while the value of the minimum consumption levels Xt
functions like a risk-free liability. Defined-benefit pensions, which guaranteea particular consumption level in retirement, can thus be viewed as the opti-mal consumption level for somebody who requires a certain minimum con-sumption level in retirement (i.e. C̄t >0 for t>T ). The need for a guaranteed

SAVING AND INVESTING OVER THE LIFE CYCLE 403
level of consumption in retirement forces the pension fund to take less riskand invest a larger share of retirement wealth in risk-free assets compared tothe case without the need for consumption guarantees.
An alternative interpretation of optimal risk exposure is that preferencesexhibit decreasing instead of constant relative risk aversion. In particular, one
can compute the optimal wealth share f ∗t = λ(1− Xt
Wt)
σθas the solution for fi
from (4) with θ i =θ/((1− XtWt)). Accordingly, relative risk aversion θ i decreases
with wealth Wt . The local curvature of the utility function depends on howfar overall wealth is above wealth required for minimum consumption. Peoplethus become less willing to tolerate risk if the wealth level drops and becomecloser to this minimum wealth level. Accordingly, a low power coefficient θcan still imply high levels of relative risk aversion.
The implications of preferences (16) for saving behavior depend on howthe minimum consumption flows C̄t develop over time and whether peoplecorrectly anticipate this. If agents correctly anticipate rising minimum con-sumption needs dC̄t/dt > 0, they may save more, especially because largercoefficients of risk aversion θ i = θ/((1− Xt
Wt)) boost saving incentives.
6.3.2 External HabitsCampbell and Cochrane (1999) use the preferences (16) in which the con-sumption requirements C̄t vary with the history of aggregate consumption.They employ these preferences to explain a number of asset pricing phenom-ena, including a large equity premium that varies countercyclically. Investorsdemand a high return on stocks because stocks perform poorly in recessionswhen consumption levels Ct fall close to the minimum levels C̄t . Agents thusmeasure their consumption level compared to that of the rest of the popu-lation. This desire to "catch up with the Jones" implies a form of referencedrift. Empirical estimates typically find that reference consumption levels arein fact close to actual consumption levels, implying high levels of risk aver-sion θ i = θ/((1− Xt
Wt)).
6.3.3 Internal HabitsThis external habit formation contrasts with internal habit formation whereconsumption requirements C̄t depend on the history of individual consump-tion rather than aggregate consumption of the economy as a whole. Constan-tinides (1990), for example, assumes that habits of an individual C̄t depend onactual consumption levels of that same individual as follows
dC̄t/dt =βCt −αC̄t
Internal habit formation implies more complicated behavior if agents antici-pate how their current consumption levels Ct affect future consumption needsC̄t+s . For example, consumption at two neighbouring points in time become

404 BOVENBERG, KOIJEN, NIJMAN AND TEULINGS
complements: a high consumption level at time t raises, by its effect on hab-its C̄t+s , the marginal utility of consumption in the immediate future t + s.Hence, ceteris paribus θ in (15), the elasticity of intertemporal substitutiondeclines with β as agents dislike rapid changes in consumption levels more.As time elapses and s increases, the impact of higher consumption level attime t on habits C̄t+s declines on account of the positive depreciation coef-ficient α>0.53
This explains why, following an unexpected shock in wealth at the long-run equilibrium level Ct = α
βC̄t , consumption adjusts does not adjust immedi-
ately to its long-run level but adjusts gradually over time. Compared to thecase with preferences without habit formation (i.e. α = β = 0), the immedi-ate adjustment of consumption to a wealth shock is less, but adjustment lateris larger as habits have adjusted to the changed consumption level. Innova-tions in consumption will now be correlated and the optimal consumptionno longer follows a random walk. Internal habit formation thus explains whypension schemes adjust their premia levels only gradually following an unex-pected shock. Hence, consumption is less volatile with internal habits for tworeasons. First, shocks are absorbed more in the long run than in the shortrun. Second, agents invest less aggressively so that they have to adjust theirconsumption less in the short run.
Habit formation (i.e. α,β > 0) implies also that the ability to absorb anunexpected shock increases if time increases. This implies that younger agentswith longer horizons can adjust more easily to shocks and thus should investa larger share of their wealth in risk-bearing assets. Intuitively, they have moretime to adjust their habits to unexpected shocks. In addition to human wealththat is not exposed to equity risk and mean-reversion of returns, internalhabit formation is thus a third reason why young agents should optimallyinvest a larger share of their portfolio in equity than older agents do and whypension contracts may optimally get more of a defined-benefit nature whenpeople grow older. Habit formation also explains why retirement benefits maybe linked to earnings (and consumption levels) close to retirement.
The implications of internal habits for saving behavior (and intertempo-ral consumption smoothing over time) depend on the initial habit level C̄0.If young agents start with low habit levels, they optimally should save moresince high initial consumption levels raise consumption needs later in life.As people get older, they raise consumption levels as the horizons becomeshorter over which the negative future external effects of current consumption
53 Internal habit formation can thus explain why risk aversion declines with time (and theintertemporal elasticity of consumption increases with time). Shocks can be easier absorbedand consumption levels can change more over time if agents have more time to adjust theirconsumption needs. Just as Epstein-Zin preferences, internal habit formation can imply thatrisk aversion may deviate for intertemporal substitution.

SAVING AND INVESTING OVER THE LIFE CYCLE 405
C- C0 C+Consumption level
Uti
lity
Figure 15 – A utility function with constant relative risk aversion
levels materialize. Overall then, habit formation can explain why consumptionlevels typically rise over the life cycle in line with income levels.
6.3.4 Loss AversionStandard utility functions, which are twice differentiable, imply that the costsof risk (see the denominator of the fraction at the right-hand side of (3)) areproportional to the variance of a portfolio, f 2σ 2. Figure 15 illustrates whythis is the case. The utility function u (C) is given by the concave curve. Con-sider the effect on utility of both a positive deviation C+ and a negative,C− from the mean value, Co, keeping the expected value constant. This utilityeffect of risk (the required risk premium) can be shown graphically by the dif-ference between u(Co) and the value of the line connecting u
(C−)
and u(C+)
at Co. A twice as large a deviation of C+ and C− from the mean Co causesapproximately a four time as big effect on utility.54
Recent experimental work, however, suggests that human behavior is notalways well described by twice differentiable concave utility functions. Tverskyand Kahnemann (1992) therefore developed prospect theory to better describehuman behavior with respect to risk. In particular, behavior seems better cap-tured by the type of kinked utility function depicted in Figure 16. This util-
54 Mathematically, this result relies on a second-order Taylor expansion. The cost of risk tak-ing rises exactly quadratically with the magnitude of the deviations if the coefficient of relativerisk aversion is constant and the Taylor approximation is exact.

406 BOVENBERG, KOIJEN, NIJMAN AND TEULINGS
reference point
Consumption
Uti
lity
Figure 16 – A kinked utility function as proposed by Kahneman and Tversky
ity features a kink at the so-called reference point: a gain from this refer-ence point yields only a small increase in utility, while a loss yields a largedecrease.55 This kink implies first-order risk aversion at the reference point:an individual is sensitive to small deviations from this reference point. Thiskink in fact implies that risk aversion is particularly large at consumptionlevels close to the reference point.56 In other words, relative risk aversion isnot constant but depends on the actual consumption level and the particu-lar losses and gains considered. A second57 element of prospect theory is thatagents are risk averse in gains (twice as large gains yield less than twice asmuch increase in utility) and risk loving in losses (twice as big losses yieldless than twice as much decrease in utility) (see Figure 16). This implies thatagents in effect exhibit a large preference for consumption levels close to thetarget level of the reference point. If their current wealth is insufficient tofinance the consumption level at the reference point, they will take risks to getclose to it. If their wealth level exceeds the target level, in contrast, they willshy away from risks in order to prevent the risk of falling below the targetlevel. This is especially so if their wealth level is just sufficient to finance con-
55 On the basis of experimental work, Tversky and Kahnemann (1992) find that losses tendto weigh about 2 1/4 times more heavily than gains.56 This explains why it is often difficult to empirically disentangle risk aversion from lossaversion.57 A third element is that decision-makers employ subjective decision weights that differ fromthe true probabilities.

SAVING AND INVESTING OVER THE LIFE CYCLE 407
C- C0 C+
Consumption level
Uti
lity
Figure 17 – Utility function with a kink at consumption level C0
sumption at the reference point: the kink implies a relatively high local levelof risk aversion.
Prospect theory, and the kink at the reference point in particular, hasimportant implications for risk taking over time. We can best explain this bythe piece-wise linear utility function with a kink at the average consumptionlevel in Figure 17. We draw a line between u
(C+)
and u(C−)
and repeatthat exercise for a twice as large deviation from the mean Co (ceteris pari-bus the expected value). We then observe that the cost of risk taking increasesproportionally in the deviation rather than quadratically as with a smoothconcave utility function. This implies that the cost of risk taking (i.e. therisk premium) increases with the square root of the time horizon because theexpected standard deviations rise with the time horizon in this way as thedraws are independent of time.58 This is in contrast to the case of a smoothconcave utility function when the cost of risk taking increases quadraticallywith the deviations and thus linearly with the time horizon, see Figure 15.With kinked utility, the marginal benefit of risk taking (i.e. the excess returnµ̄T ) increases linearly in the investment horizon while the associated marginalcost increases only with the square root of the time horizon σ
√T . As a direct
consequence, optimal risk taking increases with the time horizon. This yieldsanother reason why young agents should bear more risk than old agents: loss
58 If the draws were perfectly positively correlated, the expected deviations would increaselinearly with the time horizon.

408 BOVENBERG, KOIJEN, NIJMAN AND TEULINGS
aversion as described by prospect theory implies that young agents with longhorizons should invest more in equity than old agents.
Bernatzi and Thaler (1995) argue that people are reluctant to invest instocks because of a combination of loss aversion and a short planning hori-zon. People evaluate stocks over periods that are shorter than their true long-run horizon. This so-called myopic loss aversion explains why agents requirea high risk premium on equity. Pension funds can correct this distortion byinvesting more in equity than individuals would do. Myopic loss aversion alsosuggest that pension schemes should not report their wealth levels too fre-quently to their members because this would stimulate the tendency of themembers to evaluate their wealth on an excessively short time horizon.
Berkelaar et al. (2004) revisit the relationship between length of the invest-ment horizon and risk taking if utility not only exhibits a kink at the refer-ence point (or target level) for retirement wealth but also implies risk aversionin gains and risk seeking behavior in losses (as is suggested by prospect the-ory). As long as agents are above and close to the reference point, they investless in risk bearing assets if the retirement date approaches. Intuitively, theyhave less time to make up losses if a bad shock would reduce their wealthbelow the target level. Hence, they converge to a portfolio insurance strategyas retirement gets close and their wealth level is just sufficient to finance thetarget level of retirement consumption. If wealth drops inadvertently belowthat needed to finance the target level, however, the investor attempts to gam-ble his way out by investing more in equity – especially if the planning hori-zon is short.
Ang et al. (2005) formulate a model of disappointment aversion based onthe axiomatic disappointment-aversion framework of Gul (1991). Comparedto a familiar CRRA utility, utility features a kink at the certainty equivalentoutcome: losses are overweighted compared to gains. As a consequence of thekink at the reference point, risk aversion is locally higher closer to the refer-ence point than further away from it.
A kinked, piece-wise linear utility function can be approximated as a lin-ear combination of the excess return on a portfolio and a term that is closelyrelated to the semi standard deviation of returns. With a smooth, twice differ-entiable, concave utility function, in contrast, utility can be approximated bya linear combination of the excess return and the variance of returns. Boenderet al. (2006) employ a semi-variance criterion to evaluate consumption duringretirement. One can view this criterion function as a special case of the loss-aversion specification in which gains above the reference point do not yieldutility at all, agents are risk averse in losses, while the reference point equalsthe ambition level of the pension system (70% of the final wage in the caseof Boender et al. (2006)). This study implicitly assumes that agents are riskneutral with respect to consumption during the working life because only theexpected premium level is taken into account when evaluating policies. For an

SAVING AND INVESTING OVER THE LIFE CYCLE 409
extensive evaluation of this study and an interpretation of it in terms of util-ity functions, see Boender et al. (2006).
6.3.5 Endogenous Reference PointThe reference point in prospect literature plays a similar role as the habit levelin the habit-formation literature.59 Hence, the literature has explored whathappens if the reference point adjusts over time in response to current con-sumption levels and rational investors anticipate this (see, e.g. Barberis et al.(2001), and Berkelaar et al. (2004)). Berkelaar et al. (2004) find that updatingthe reference point implies more risk taking. Intuitively, preferences are moreflexible: with adverse shocks the point from which gains and losses are beingevaluated and to which you want to be close is adjusted downwards.
Barberis et al. (2001) explore a setting in which investors derive direct util-ity from not only consumption but also from fluctuations in their financialwealth. After a run-up in stock prices, the agent gets further away from thisreference point and thus becomes less risk averse. History thus determinesrisk aversion. Just as in Campbell and Cochrane (1999), this variation in riskaversion allows the equilibrium returns to be much more volatile than theunderlying fundamentals. In contrast to the consumption-based approach ofCampbell and Cochrane (1999), however, investors care about fluctuations infinancial wealth even if they are unrelated to consumption.
Dybvig (1995) considers a model with extreme loss aversion and immediateadjustment of the reference point to changes in consumption: consumptionis not allowed to decline.60 Consumption develops smoothly and increaseseach time wealth reaches a new maximum. At each point in time, a part ofwealth is set apart to match the risk-free liability of the current consump-tion level. The wealth in excess of this level is used to take risks so as tofinance increases in consumption. The behavior of the consumer thus resem-bles that of a click fund or a so-called escalating annuity. This model obvi-ously explains why consumption increases over time and tends to be low atthe beginning of the life cycle. In fact, individuals want to save even if theirincome is expected to rise over time. Borrowing constraints are thus less rel-evant.
59 A difference is that consumption can fall below the reference point with loss aversion butthat consumption cannot fall below the necessary consumption level. Loss aversion thus givesrise to less extreme portfolio insurance as with habits. In particular, a loss-averse investor wantsto stay above the target level but this is not absolutely necessary. In bad states that are veryexpensive, the individual accepts losses and may actually become risk seeking to make up thelosses in order to return to a point above the reference point. However, habits can also bespecified in a way that allows consumption to fall below the habit. In particular, habits canbe included multiplicatively rather than additively as in (16), i.e. C/C̄ rather than C − C̄ entersthe utility function. See Gomes and Michaelides (2003) and Davidoff et al. (2005).60 This can be easily generalized for an exogenously specified minimum growth rate or max-imum decline.

410 BOVENBERG, KOIJEN, NIJMAN AND TEULINGS
7 CONCLUSIONS
This paper has explored the academic literature on optimal saving and invest-ment over the life cycle. We started out with a simple benchmark model inwhich human capital is riskless, standard preferences apply and equity riskis the only risk factor. Within this benchmark model we derived the opti-mal individual contract in both the absence and the presence of constraintson borrowing against future labor income. We also considered a number ofcollective pension contracts and discussed the advantages and disadvantagesof collective versus individual pension schemes. The final section exploreda number of extensions of the benchmark framework. We considered moreelaborate models of human capital, additional risk factors in financial mar-kets as well as non-standard specifications of preferences.
Section 6 indicates a wide variety of questions for future research on thisfascinating and highly relevant topic. Among other things, it points to theimportance of the nature of human capital for saving and investment behav-ior. This suggests that pension plans should be tailored to the type of humancapital of individuals. Hence, pools in collective pension schemes should bebased on that. Another implication of the relevance of human capital isthat financial economics and labor economics should be integrated more. Animportant future research topic concerns saving and investment implicationsof the career pattern of women, which account for an increasingly importantshare of labor supply in modern economies. This career pattern differs in anumber of important aspects from that of men. Family risks (i.e. elderly par-ents, young children) are new sources of idiosyncratic risk (see also the surveyby Browning and Crossley (2001)).
Whereas endogenous labor supply extends the scope of risk sharing byadding consumption of leisure as an additional way to adjust to shocks, italso allows individuals to evade the risk-sharing contract ex post. In this way,it weakens the commitment of future workers to risk sharing with currentgenerations. An important issue for future research is to endogenize to whatextent pension schemes can adopt the continuity perspective by modelling themobility of labor, capital, and consumers. In this way, we can model the opti-mal recovery period, i.e. optimal risk sharing among non-overlapping genera-tions. As a short cut, we can impose a maximum tax that workers are willingto pay ex post as part of a risk-sharing contract.
REFERENCES
Aarssen, Karin and Barthold Kuipers (2006), ‘Iedereen wint, maar sommigen meerdan in anderen’, in: S.G. van der Lecq and O.W. Steenbeek (eds.), Cost and Ben-efits Of Collective Pension Systems, Dutch, Kluwer.

SAVING AND INVESTING OVER THE LIFE CYCLE 411
Abowd, J.M. and D. Card (1989), ‘On the Covariance Structure of Earnings andHours Changes,’ Econometrica, 57, pp. 411–445.
Ameriks, John, Andrew Caplin and John Leahy (2003), ‘Wealth Accumulation AndThe Propensity To Plan,’ Quarterly Journal of Economics, 118, pp. 1007–1047.
Ameriks, John and Stephen Zeldes (2004), ‘How Do Household Portfolio Shares VaryWith Age?’ Unpublished Paper, Columbia University.
Ang, Andrew and Geert Bekaert (2006), ‘Stock Return Predictability: Is It There?’,The Review of Financial Studies, forthcoming.
Barbaris, N., M. Huang and T. Santos, (2001), ‘Prospect Theory and Asset Prices,’Quarterly Journal of Economics, 116, pp. 1–53.
Beetsma, R.M.W.J. and A.L. Bovenberg (2007), ‘Pensions, Intergenerational RiskSharing And Inflation,’ Netspar Discussion Paper.
Benartzi, Shlomo and Richard Thaler (2001), ‘Naive Diversification Strategies InDefined Contribution Savings Plans’, American Economic Review, 91, pp. 79–98.
Benzoni L., P. Collin-Dufresne and R.S. Goldstein (2007), ’Portfolio Choice overthe Life-Cycle when the Stock and Labor Markets are Cointegrated,’ Journal ofFinance (forthcoming).
Berkelaar, Arjan, Roy Kouwenberg and Thierry Post (2004), ‘Optimal PortfolioChoice under Loss Aversion,’ Review of Economics and Statistics, 86, pp. 973–986.
Bernatzi, S. and R. Thaler (1995), ‘Myopic Loss Aversion and the Equity PremiumPuzzle,’ Quarterly Journal of Economics, 110, pp. 73–92.
Bikker, Jaap and Jan de Dreu (2006), ‘Uitvoeringskosten van pensioenverstrekkers’,in: S.G. van der Lecq and O.W. Steenbeek (eds.), Cost and benefits of collectivepension systems, Dutch, Kluwer.
Blake, David, Andrew Cairns and Kevin Dowd (2006), ‘Living with Mortality: Lon-gevity Bonds and Other Mortality Linked Securities’, British Actuarial Journal, 45,pp. 153–197.
Bodie, Zvi, Robert C. Merton and William F. Samuelson (1992), ‘Labor Supply Flex-ibility and Portfolio Choice in a Life-Cycle Model,’ Journal of Economic Dynamicsand Control, 16, pp. 427–449.
Boeijen, Dick, Corne Jansen, Niels Kortleve and Jan Tamerus (2006), ’Lee-ftijdssolidariteit in de doorsneepremie’, in: S.G. van der Lecq and O.W. Steenbeek(eds.), Cost and Benefits Of Collective Pension Systems, Dutch, Kluwer.
Boender, C.G.E., A.L. Bovenberg, S. van Hoogdalem and Th.E. Nijman (2006), ‘Op-timale Risicodeling in Individuele en Collectieve Pensioencontracten,’ in: S.G. vander Lecq and O.W. Steenbeek (eds.), Cost and Benefits Of Collective Pension Sys-tems, in Dutch, Kluwer.
Boender, C.G.E., S. van Hoogdalem, E. van Lochem and R.M.A. Jansweijer (2000),‘Intergenerationele Solidariteit en Individualiteit in de Tweede Pensioenpijler: EenScenario-analyse,’ Report No. 114, Dutch Scientific Council for Government Policy(WRR), The Hague, The Netherlands.
Bovenberg, Lans, Ralph Koijen, Theo Nijman and Coen Teulings (2007), ‘Saving andinvesting over the life cycl and the role of collective pension funds’, Netspar Panel Paper.
Brav, Alon, George M. Constantinides and Christopher C. Geczy (2002), ‘AssetPricing with Heterogeneous Consumers and Limited Participation: Empirical Evi-dence,’ Journal of Political Economy, 110, pp. 793–824.

412 BOVENBERG, KOIJEN, NIJMAN AND TEULINGS
Brennan, Michael and Yihong Xia (2000), ‘Stochastic Interest Rates and the Bond-Stock Mix’, European Finance Review, 4, pp. 197–210.
Brown, Jeffrey (2002), Differential mortality and the value of individual accountretirement annuities, in: Feldstein and Liebman (eds.), The Distributional Aspectsof Social Security and Social Security Reform, Chicago Press.
Brown, Jeffrey, Olivia Mitchell and James Poterba (2001), ‘The Role of Real Annu-ities and Indexed Bonds in an Individual Accounts Retirement Program’, in: JohnCambell and Martin Feldstein (eds.), ’Risk Aspects of Investment-Based SocialSecurity Reform,’ University of Chicago Press, pp. 321–360.
Browning, Martin and Thomas Crossley (2001), ‘The Life-Cycle Model of Consump-tion and Saving,’ Journal of Economic Perspectives, 15, pp. 3–22.
Browning, Martin and Annamaria Lusardi (1996), ‘Household Savings: Micro Theo-ries and Micro Facts,’ Journal of Economic Literature, 34, pp. 1797–1855.
Campbell, John (2006), ‘Household Finance’, Journal of Finance, 61(4), pp. 1553–1603.
Campbell, J.Y. and J.H. Cocrane (1999), ‘By Force of Habit: A Consumption-BasedExplanation of Aggregate Stock Market Behavior’, Journal of Political Economy,107, pp. 205-251.
Campbell, John and Luis Viceira (2001), ‘Who should buy: Long term Bonds?’,American Economic Review, 91, pp. 99–127.
Campbell, John and Luis Viceira (2005), ‘The Term Structure of the Risk-ReturnTrade-off’, Financial Analysts Journal, 61(1), pp. 34–44.
Campbell, John and Motohiro Yogo (2006), ‘Efficient tests of Stock Return Predict-ability’, Journal of Financial Economics, 81, pp. 27–60.
Chacko, George and Luis Viceira (2005), ‘Dynamic Consumption and Portfoli1oChoice with Stochastic Volatility in Incomplete Markets’, Review of Financial Stud-ies, 8(4), pp. 1369–1402.
Choi, James, David Laibson and Brigitte Madrian (2005), ‘$100 Bills on the Side-Walk: Suboptimal Saving in 401(k) Plans’, working paper.
Choi, James, Brgitte Madrian, Andrew Metrick and David Laibson (2002), ‘DC Pen-sions: Plan Rules, Participant Decisions, Anf the Path of Least Resistance’, TaxPolicy and the Economy, 16, pp. 67–114.
Clark, Robert, Madeleine d’Ambrosio, Ann McDermed and Kshama Sawant (2006),‘Retriement Plans and Savings Decisions: The Role of Information and Education’Journal of Pension Economics and Finance, 5(1), pp. 45–68.
Clark, Gordon, Emiko Caerlewy and John Marshall (2006), ‘Pension Fund TrusteeCompetence: Decision Making in Problems Relevant to Practice’, Journal of Pen-sion Economics and Finance, 5(1), pp. 91–110.
Cocco, J.F., F.J. Gomes and P.J. Maenhout (2005), ‘Consumption and PortfolioChoice over the Life Cycle,’ The Review of Financial Studies, 18, pp. 492–533.
Cohen, Alma and Liran Einav (2005), ‘Estimating Risk Preferences from DeductibleChoice’, American Economic Review (forthcoming).
Cochrane, John (2006), ‘The Dog that did not bark: a Defense of Return Predictabil-ity’, Working paper, University of Chicago.
Cochrane, John and Monica Piazessi (2005), ‘Bond risk premia’, American EconomicReview, 95, pp. 138–160.

SAVING AND INVESTING OVER THE LIFE CYCLE 413
Constantinides, George M. (1990), ‘Habit formation: A resolution of the equity-premium puzzle,’ Journal of Political Economy, 48, pp. 519–543.
Constantinides, George M., John B. Donaldson and Rajnish Mehra (2002), ‘Juniorcan’t Borrow; A New Perspective on the Equity Premium Puzzle,’ Quarterly Jour-nal of Economics, 117, pp. 269–296.
Constantinides, George M. and Durrell Duffie (1996), ‘Asset Pricing with Heteroge-neous Consumers,’ Journal of Political Economy, 105, pp. 219–240.
Cui, J., F.C.J.M. de Jong, and E.M.H. Ponds (2006), ‘Intergenerational Risk Sharingwithin Funded Collective Pension Schemes’, SSRN Working Paper.
Davidoff, Thomas, Jeffrey A. Brown and Peter Diamond, (2005), ’Annuities and Indi-vidual Welfare,’ American Economic Review, 95, pp. 1573–1590.
Davis, S.J., F. Kubler and P. Willen (2005), ‘Borrowing Costs and the Demand forEquity over the Life Cycle,’ Federal Reserve Bank of Boston, Working Paper No.05-7.
Duflo, Ester and Emanuel Saez (2003), ‘The Role of Information and Social Inter-actions in Retirement Plan Decisions: Evidence from a Randomized Experiment’,Quarterly Journal of Economics, 68, pp. 815–842.
Dybvig, P.H. (1995), ‘Dusenberry’s Ratcheting of Consumption: Optimal DynamicConsumption and Investment Given Intolerance for Any Decline in Standard ofLiving,’ Review of Economic Studies, 62, pp. 287–313.
Farhi, E. and S. Panageas (2007), Saving and Investing for Early Retirement: A The-oretical Analysis. Journal of Financial Economics, 83, pp. 87–121.
Finkelstein, Amy, James Poterba and Casey Rothschild (2005), ’Redistribution byInsurance Market Regulation: Analyzing a Ban on Gender-Based RetirementAnnuities’, NBER Working Paper W12205.
Gollier, Christian (2005), ‘Understanding Saving and Portfolio Choices with Predict-able Changes in Asset Returns’, Working paper, University of Toulouse.
Gollier, C. and R.J. Zeckhauser (2002), ‘Horizon Length and Portfolio Risk,’ Journalof Risk and Uncertainty, 24 (3), pp. 195–212.
Gollier, C. (2006), ‘Intergenerational risk sharing and risk taking in a pension fund,’Working paper, University of Toulouse.
Gollier, C. and J.W. Pratt (1996), ‘Risk Vulnerability and the Tempering Effect ofBackground Risk’, Econometrica, 64, pp. 1109–1124.
Gomes, Francisco and Alexander Michaelides (2003), ‘Portfolio Choice with Inter-nal Habit Formation A Life-Cycle Model with Uninsurable Labor income Risk,’Review of Economic Dynamics, 6, pp. 729–766.
Goyal, Amid andf Ivo Welch (2006), ‘A comprehensive look at the empirical perfor-mance of equity premium prediction’, The Review of Financial Studies, (forthcom-ing).
Guiso, Luigi and Tullio Japelli (2005), ‘Awareness and stock market participation’,Review of Finance, 9, pp. 537–567.
Gul, F. (1991), ‘A theory of disappointment aversion’, Econometrica 59, pp. 667—686.Haliassos, Michael and Carol Bertaut (1995), ‘Why do so few hold stocks’, Economic
Journal, 105, pp. 1110–1129.Hoevenaars, R. and E. Ponds, ‘Valuation of Intergenerational Transfers in Funded
Collective Pension Schemes,’ Netspar Discussion Paper 2006–19.

414 BOVENBERG, KOIJEN, NIJMAN AND TEULINGS
Huberman, Gur (2001), ‘Familiarity breeds investment’, Review of Financial Studies,14, pp. 659–680.
Jong, F.C.J.M de (2005), ‘Valuation of Pension Liabilities in Incomplete Markets,’Netspar Discussion Paper 2005.
Koijen, Ralph, Theo Nijman and Bas Werker (2006a), ‘Optimal portfolio choice withannuitization’, Netspar Discussion Paper.
Koijen, Ralph, Lans Bovenberg and Theo Nijman (2007), ‘Optimal retirement provi-sion: comparing individual and collective pension schemes’, Working paper, in pro-gress.
Koijen, Ralph, Theo Nijman and Bas Werker (2006b), ‘When can Life-cycle InvestorsBenefit from Time-Varying Bond Risk Premia?’, Netspar Discussion Paper.
Kortleve, Niels and Eduard Ponds (2006), ‘Pension deals and value-based ALM’, in:Niels Kortleve, Theo Nijman and Eduard Ponds (eds.), Fair Value and PensionFund Management, Elsevier Publishers.
Laibson, David, Andrea Repeto and Jeremy Tobacman (1998), ’Self-Control and Sav-ing for Retirement’, Brookings Papers on Economic Activity, 1998(1) pp. 91–196.
Leland, H.E. (1968), Savings and Uncertainty: The Precautionary Demand for Sav-ings, Quarterly Journal of Economics, 45, pp. 621–636.
Lettau, Martin and Stijn van Nieuwerburgh (2006), Reconciling the Return Predict-ability Evidence’, the Review of Financial Studies, forthcoming.
Liu, Jun (2007), Portfolio Selection in Stochastic Environments, Review of FinancialStudies, 20(1), 39.
Lusardi, Annamaria (1999), ‘Infomation, expectations and savings for retirement’ in:Henry Aron (ed.), Behavioral Dimensions of Retirement Economics, WashingtonDC, Brookings Institution, pp. 81–115.
Merton, R. C. (1969), ‘Lifetime portfolio selection under uncertainty: The continu-ous-time case,’ Review of Economics and Statistics, 51, pp. 247–257.
Merton, R. C. (1971), ‘Optimum consumption and portfolio rules in a continuous-time model’, Journal of Economic Theory, 3, pp. 373-413.
Merton, R. C. and P.A. Samuelson (1974), ‘Fallacy of the log-normal approximationof optimal portfolio decision-making over many periods’, Journal of Financial Eco-nomics 1, pp. 67-94.
Mitchell, Olivia and Stephen Utkus (2003), ‘The Role of Company Stock in DefinedContribution Plans’ in: Olivia Mitchell and Kent Smetters (eds.), The PensionChallenge: Risk Transfers and Retirement Income Security, Oxford UniversityPress.
Mitchell, Olivia, James Poterba, Mark Warschavsky and Jeffrey Brown (1999), ‘Newevidence on the Money’s Worth of Inidvidual Annuities, American EconomicReview, 89, pp. 1299–1318.
Mossin, J. (1968), ‘Optimal multiperiod portfolio policies,’ Journal of Business, 41, pp.215–229.
Munnel, Alicia and Annika Sunden (2004), ‘Coming Up Short: The Challenge of401(k) plans’, The Brookings Institution, Washington.
Munk, Claus and Carsten Sorensen (2005), ‘Dynamic Asset Allocation with Stochas-tic Income Interest Rates’, Working paper.
SAVING AND INVESTING OVER THE LIFE CYCLE 415
Nordahl, Helge and Trond Dokseland (2006), ‘Intergenerational Effects of Guaran-teed Pension Contracts’, Working Paper, Norwegian School of Economics.
Poterba, James (2006), ‘Annuity markets’, in: Gordon Clark, Alicia Munnel andMichael Orszag, (eds.), The Oxford Handbook of Pensions and RetirementIncome, Oxford University Press.
Poterba, James, Joshua Rauh, Steven Venti and David Wise (2005), ’Utility evaluationof risk in retirement savongs accounts’, in: D. Wise (ed.), Analyses in the Econom-ics of Aging, Chicago University Press, Chicago.
Kooreman, Peter and Henriette Prast (2007), ‘Policy implications of behavioral eco-nomics’, Netspar Reference Paper.
Samuelson, P. A. (1969), ‘Lifetime portfolio selection by dynamic stochastic program-ming,’ Review of Economics and Statistics, 51, pp. 239–246.
Sangvinatsos, Antonios and Jessica Wachter (2005) ‘Does the Failure of the Expec-tations Hypothesis matter for Long Term Investors ?’, The Journal of Finance, 60,pp. 179–230.
Teulings, Coen and Casper de Vries (2006), ‘Generational Accounting, Solidarity andPension Losses,’ De Economist, 146, pp. 63–83.
Thaler, Richard and Shlomo Benartzi (2004), ‘Save More Tomorrow’, Journal ofPolitical Economy, 112/1, pp. 164–187.
Topel, R.H. and M.P. Ward (1992), ‘Job Mobility and the Careers of Young Men,’Quarterly Journal of Economics, 107, pp. 439–479.
Tversky, Amos and Daniel Kahnemann (1992), ‘Advances in Prospect Theory: Cum-mulative Representation of Uncertainty,’ Journal of Risk and Uncertainty, 5, pp.297–323.
Van Rooij, Maarten, Henriette Prast and Clemens Kool (2007), ‘Risk return prefer-ences in the pension domain: are people able to choose?’, Journal of Public Eco-nomics, Vol. 91, p. 701–722.
Venti, Steven (2006), ‘Choice, Behaviour and Retirement Savings’, in: Gordon Clark,Alicia Munnel and Michael Orszag, (eds.), The Oxford Handbook of Pensions andRetirement Income, Oxford University Press.
Viceira, L.M. (2001), ‘Optimal Portfolio Choice for Long-Horizon Investors withNontradable Labor Income,’ Journal of Finance, 56, pp. 433–470.