db2 for z/os with emc storage tiering: fast vp 2002 the rpm story \爀䐀椀猀欀...
TRANSCRIPT

DB2 for z/OS With EMC Storage Tiering: FAST VP
Paul Pendle EMC Corporation
August 12, 2013
Session Number: 13988

Agenda
• The drivers for tiered storage • Technology changes • Workload skew
• FAST VP • Storage elements • Operating parameters • Lab testing and results
• Operational/host considerations • Summary
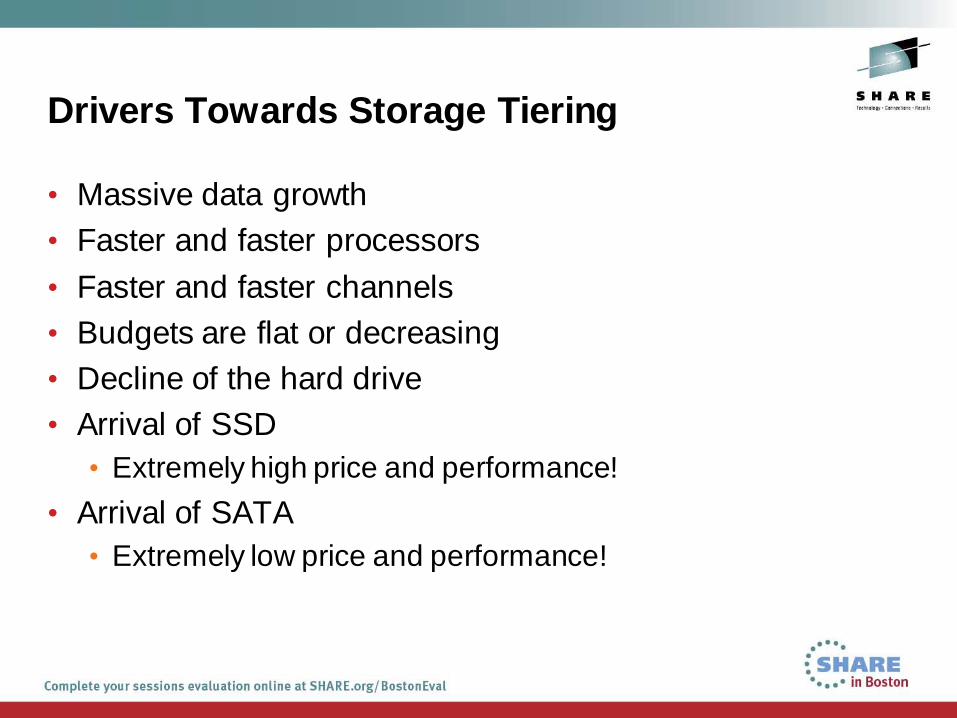
Drivers Towards Storage Tiering
• Massive data growth • Faster and faster processors
• Faster and faster channels • Budgets are flat or decreasing • Decline of the hard drive • Arrival of SSD
• Extremely high price and performance!
• Arrival of SATA • Extremely low price and performance!
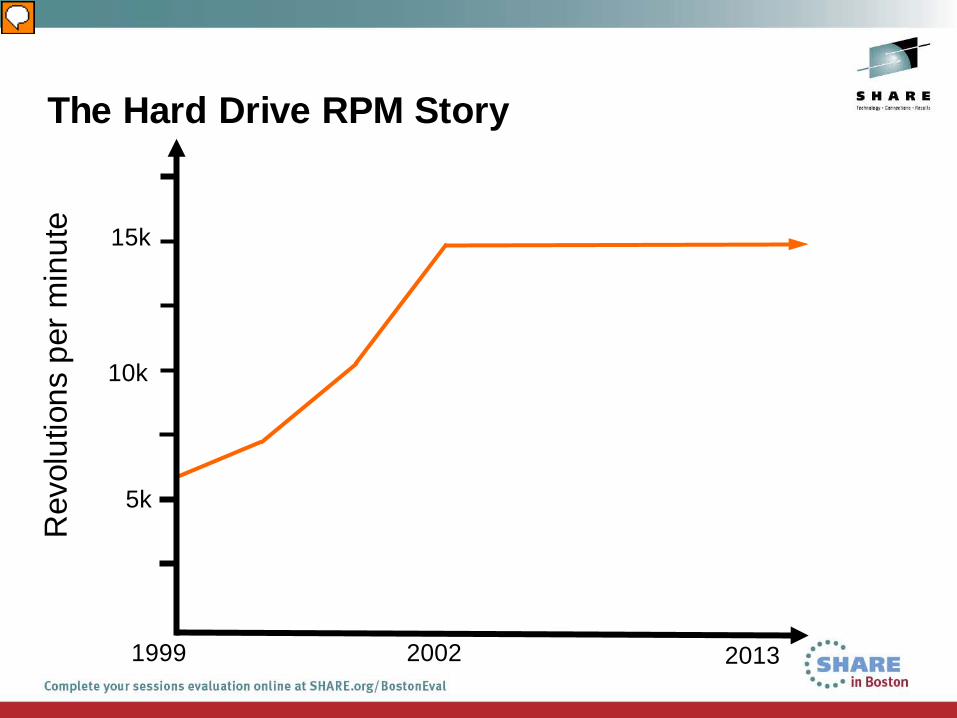
The Hard Drive RPM Story
1999 2013
Rev
olut
ions
per
min
ute
15k
10k
5k
2002
0
2
4
6
8
10
12
5400 7200 10000 15000 15000 15000 15000 7200
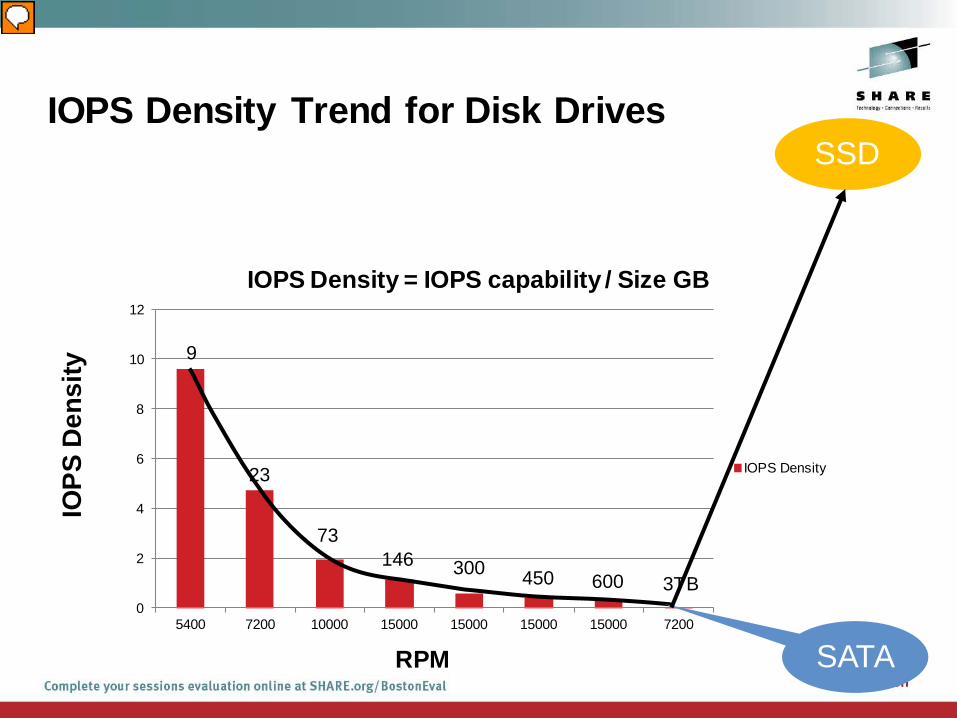
IOPS Density = IOPS capability / Size GB
IOPS Density
IOPS Density Trend for Disk Drives SSD
RPM SATA
300 146 73
23
9
IOP
S D
ensi
ty
450 600 3TB
FC
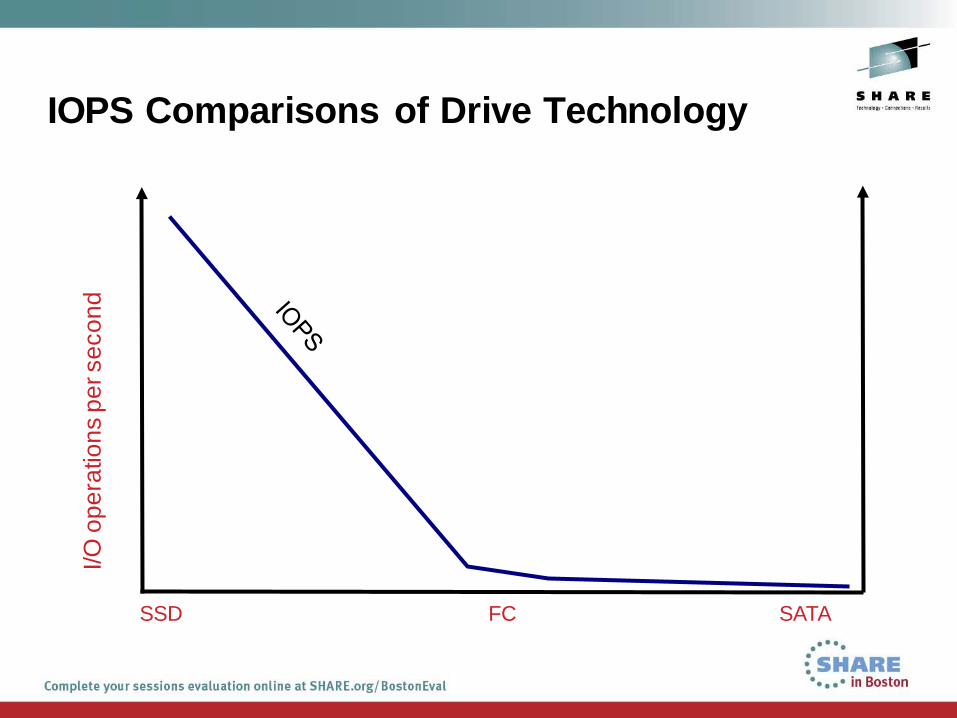
I/O o
pera
tions
per
sec
ond
SSD SATA
IOPS Comparisons of Drive Technology

Time
Fre
quen
cy o
f acc
ess
Creation Disposition
Data Life Cycle
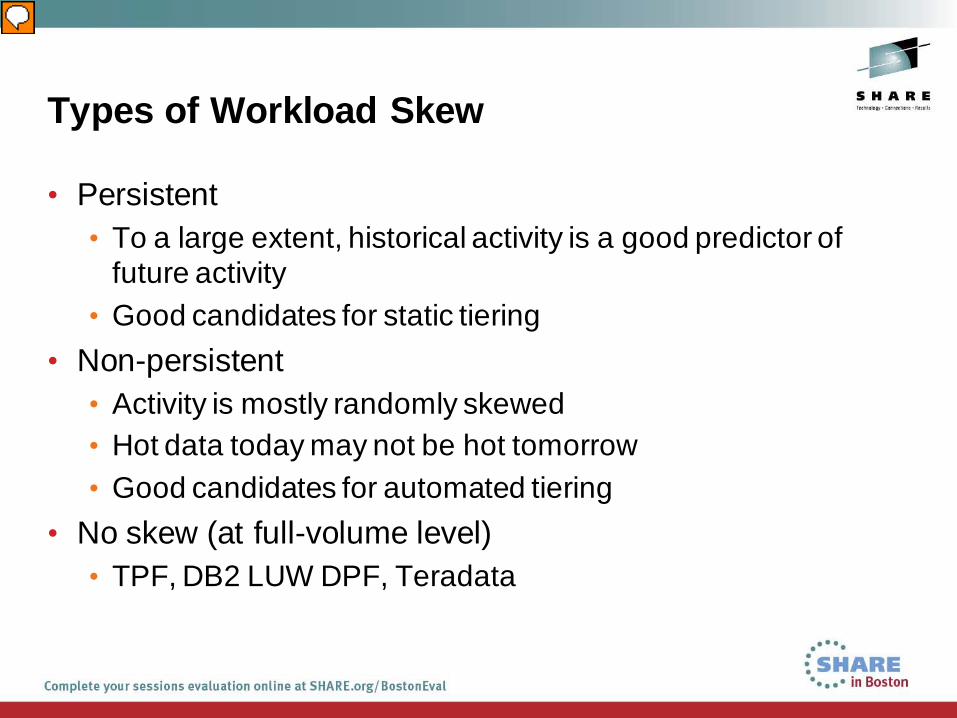
Types of Workload Skew
• Persistent • To a large extent, historical activity is a good predictor of
future activity • Good candidates for static tiering
• Non-persistent • Activity is mostly randomly skewed • Hot data today may not be hot tomorrow • Good candidates for automated tiering
• No skew (at full-volume level) • TPF, DB2 LUW DPF, Teradata
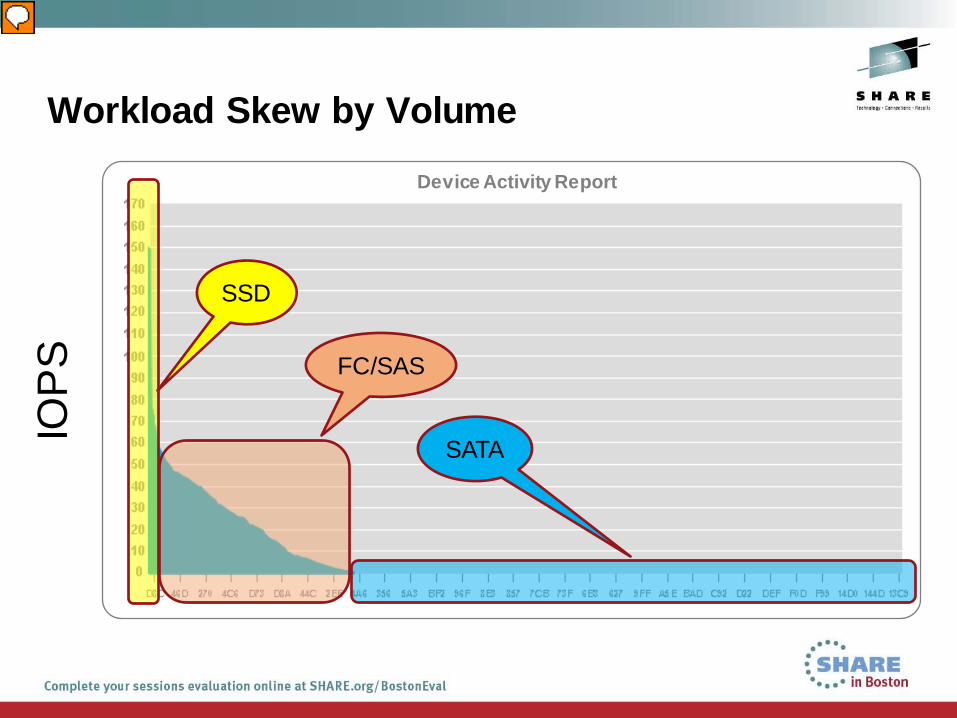
Device Activity Report
Workload Skew by Volume
IOP
S
SSD
SATA
FC/SAS
The Static Tiering Challenge
• How do you know what database objects to place on each tier? • Largely, access patterns to an object change over time • The most frequently accessed objects are in the DB2 buffer
pool or in the storage controller cache • The biggest objects are not good choices
• What about DB2 logs? • High write table spaces?
• Sequentially accessed table spaces? • The whole table space? Partition? Part of a table space?
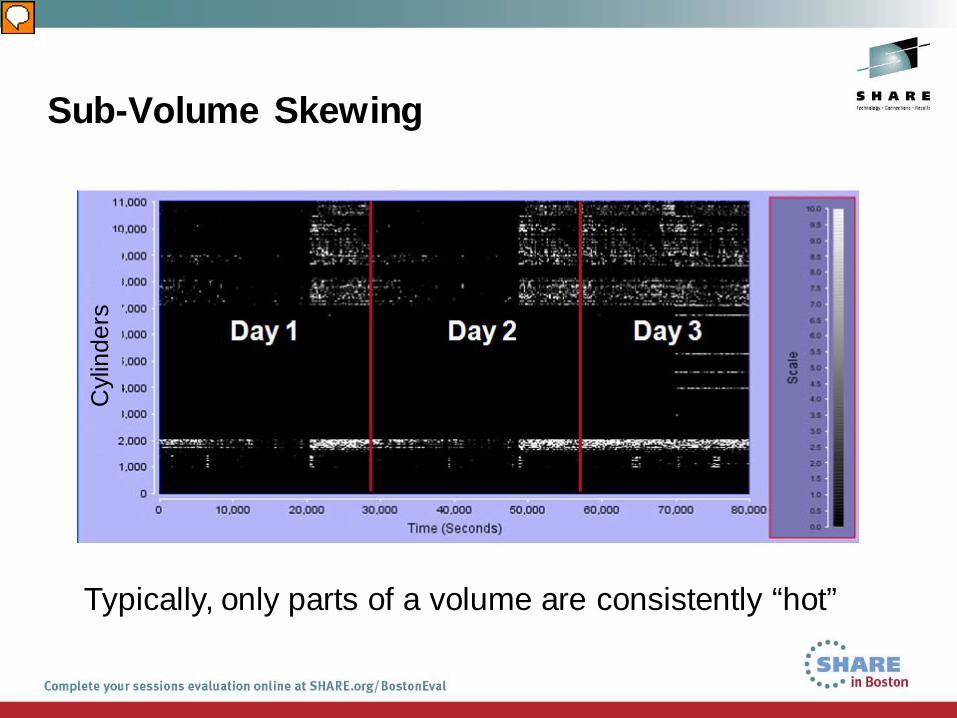
Sub-Volume Skewing
Typically, only parts of a volume are consistently “hot”
Cyl
inde
rs
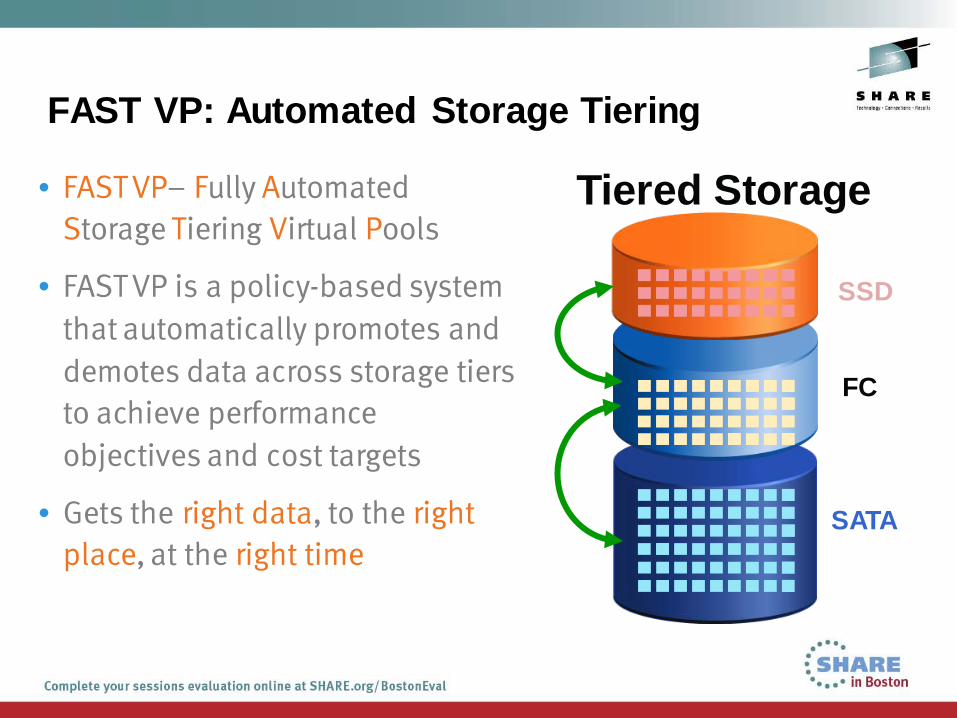
• FAST VP– Fully Automated Storage Tiering Virtual Pools
• FAST VP is a policy-based system that automatically promotes and demotes data across storage tiers to achieve performance objectives and cost targets
• Gets the right data, to the right place, at the right time
SATA
FC
SSD
Tiered Storage
FAST VP: Automated Storage Tiering

13 © Copyright 2012 EMC Corporation. All rights reserved.
FC
Flash
SATA
Traditional FAST FAST VP
FC
Flash
SATA
Evolution of FAST
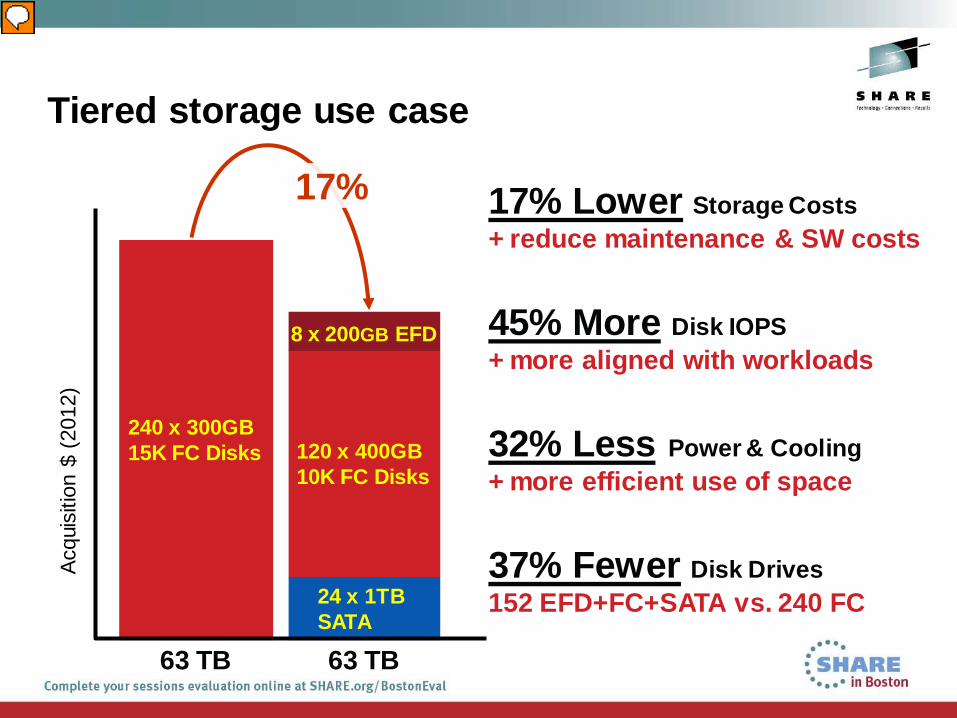
Tiered storage use case
63 TB
240 x 300GB 15K FC Disks
63 TB
120 x 400GB 10K FC Disks
8 x 200GB EFD
24 x 1TB SATA
Acq
uisi
tion
$ (2
012)
45% More Disk IOPS + more aligned with workloads
37% Fewer Disk Drives 152 EFD+FC+SATA vs. 240 FC
32% Less Power & Cooling + more efficient use of space
17% 17% Lower Storage Costs + reduce maintenance & SW costs
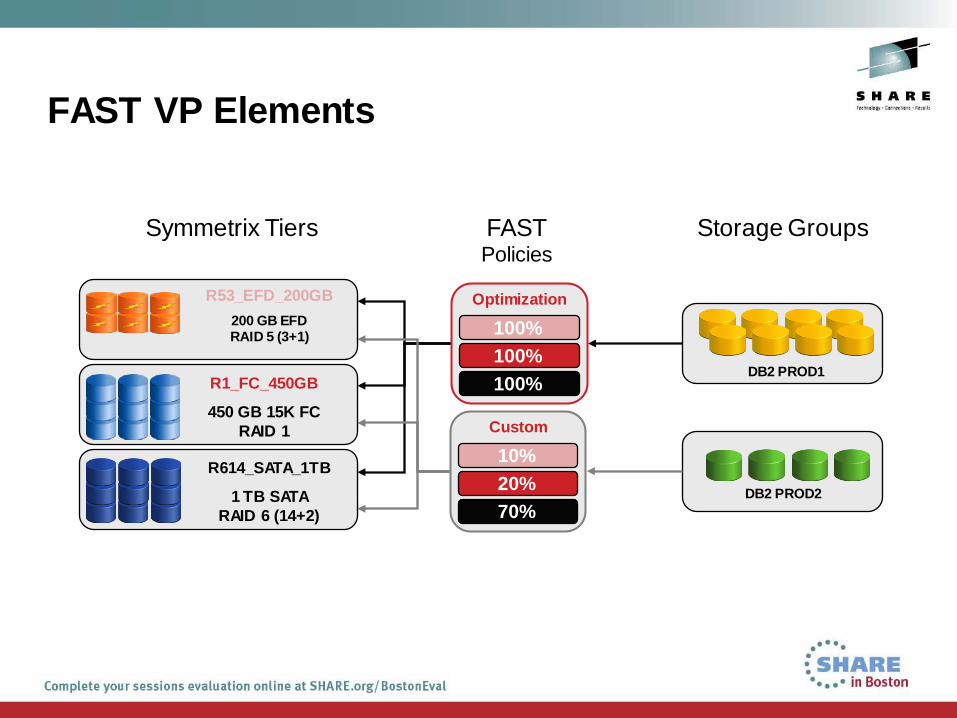
Symmetrix Tiers FAST Policies
Storage Groups
DB2 PROD1
DB2 PROD2
Optimization
100% 100% 100%
Custom
10% 20% 70%
R614_SATA_1TB
1 TB SATA RAID 6 (14+2)
R1_FC_450GB
450 GB 15K FC RAID 1
R53_EFD_200GB
200 GB EFD RAID 5 (3+1)
FAST VP Elements
Symmetrix Tiers
• Tiers combine a drive technology and a RAID protection type, e.g. • Solid state • SAS/FC 15K RPM • SATA/SAS 7200 RPM
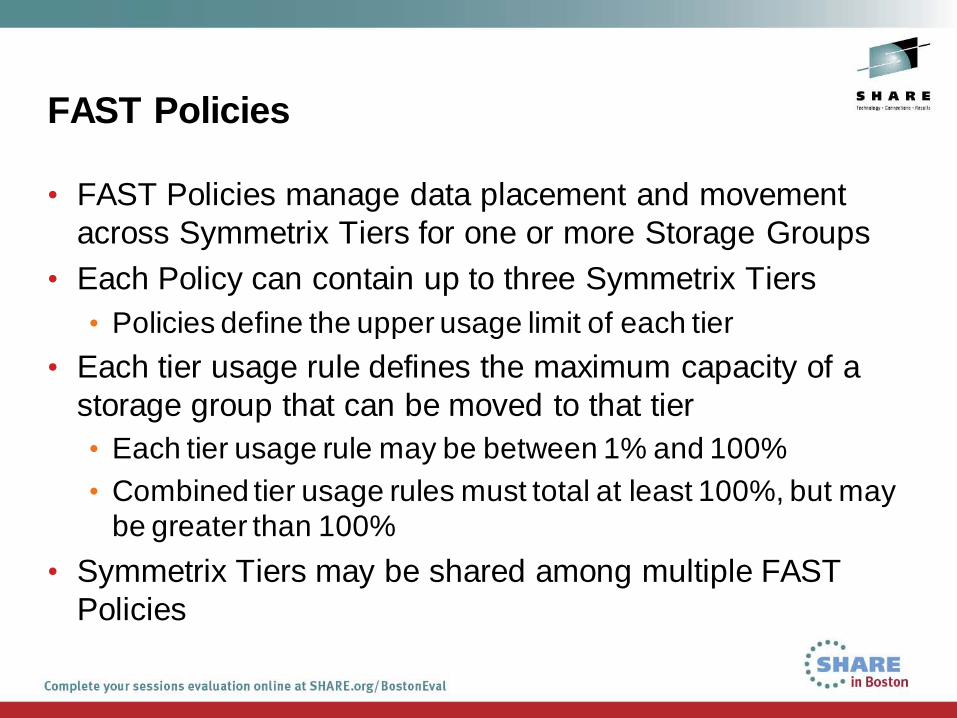
FAST Policies
• FAST Policies manage data placement and movement across Symmetrix Tiers for one or more Storage Groups
• Each Policy can contain up to three Symmetrix Tiers • Policies define the upper usage limit of each tier
• Each tier usage rule defines the maximum capacity of a storage group that can be moved to that tier • Each tier usage rule may be between 1% and 100% • Combined tier usage rules must total at least 100%, but may
be greater than 100%
• Symmetrix Tiers may be shared among multiple FAST Policies
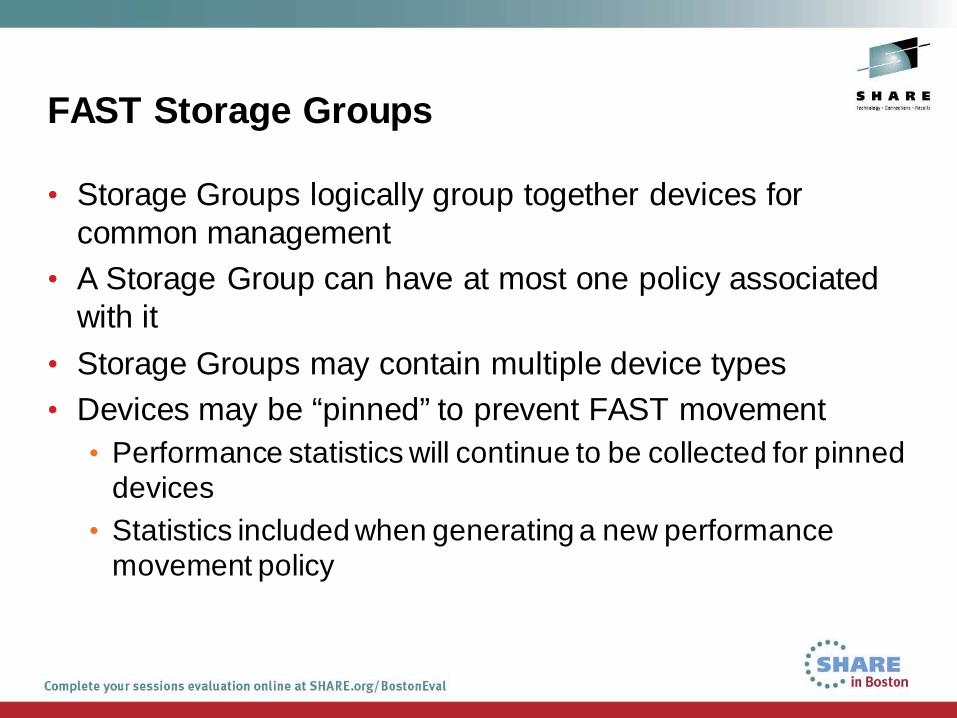
FAST Storage Groups
• Storage Groups logically group together devices for common management
• A Storage Group can have at most one policy associated with it
• Storage Groups may contain multiple device types • Devices may be “pinned” to prevent FAST movement
• Performance statistics will continue to be collected for pinned devices
• Statistics included when generating a new performance movement policy
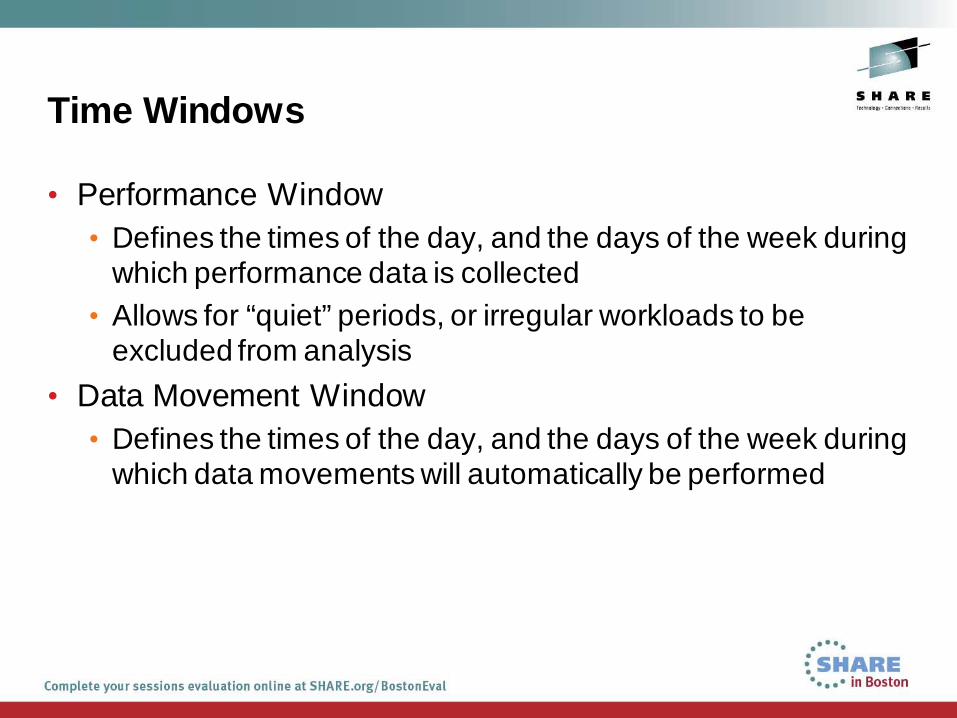
Time Windows
• Performance Window • Defines the times of the day, and the days of the week during
which performance data is collected • Allows for “quiet” periods, or irregular workloads to be
excluded from analysis
• Data Movement Window • Defines the times of the day, and the days of the week during
which data movements will automatically be performed
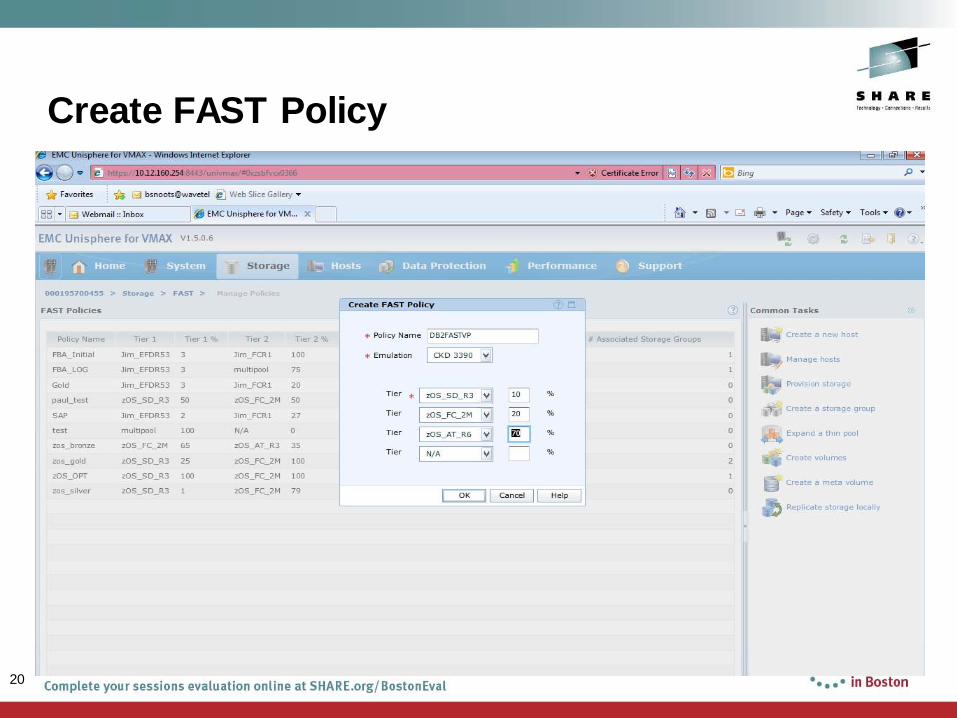
Create FAST Policy
20
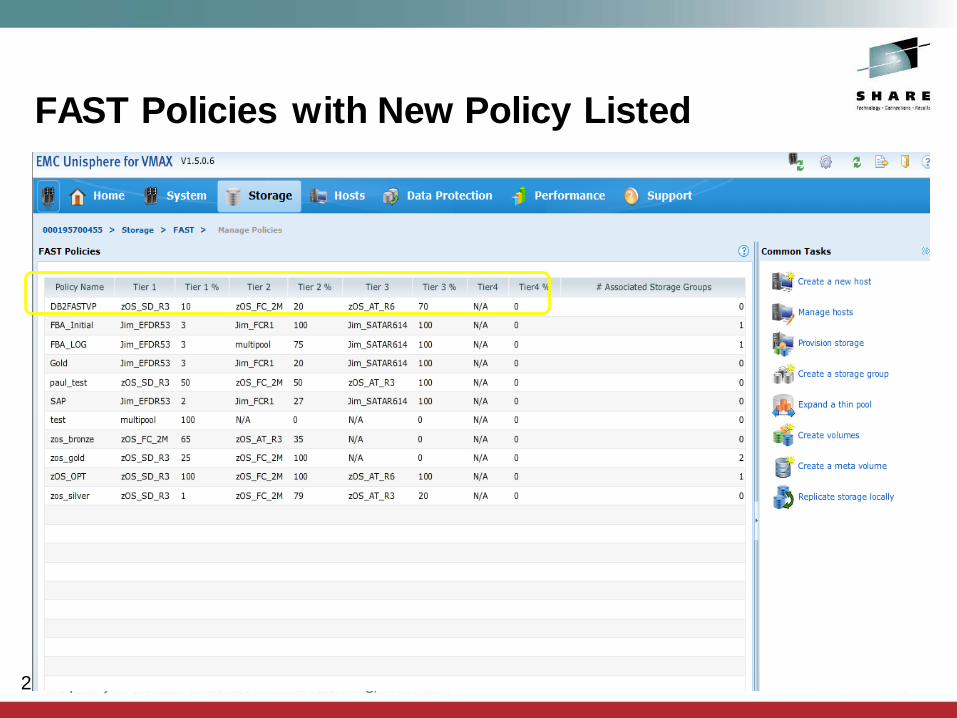
FAST Policies with New Policy Listed
21
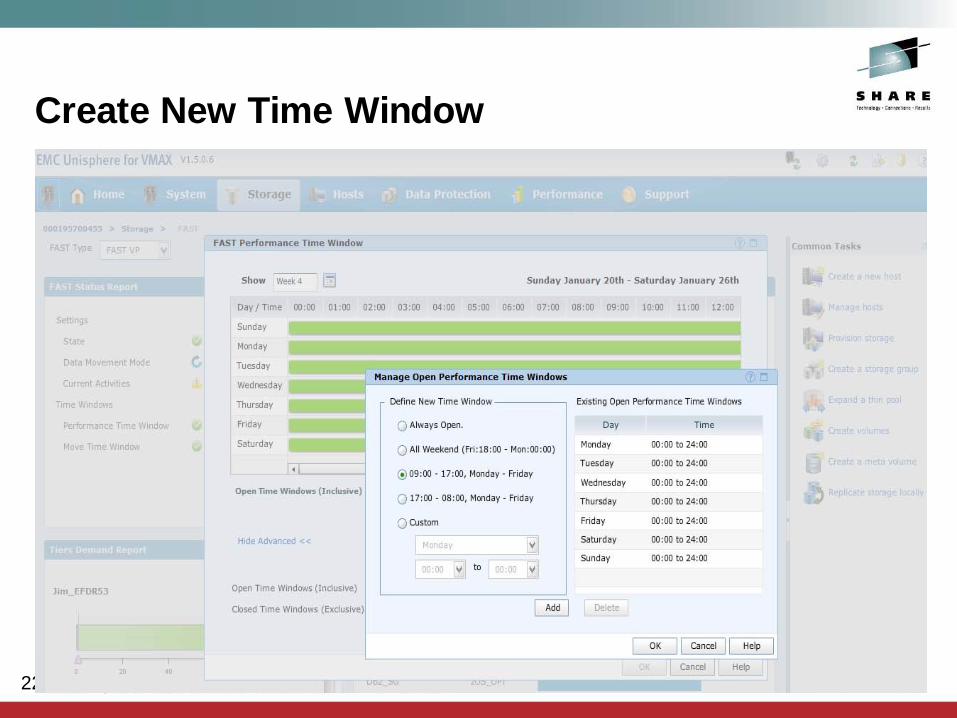
Create New Time Window
22
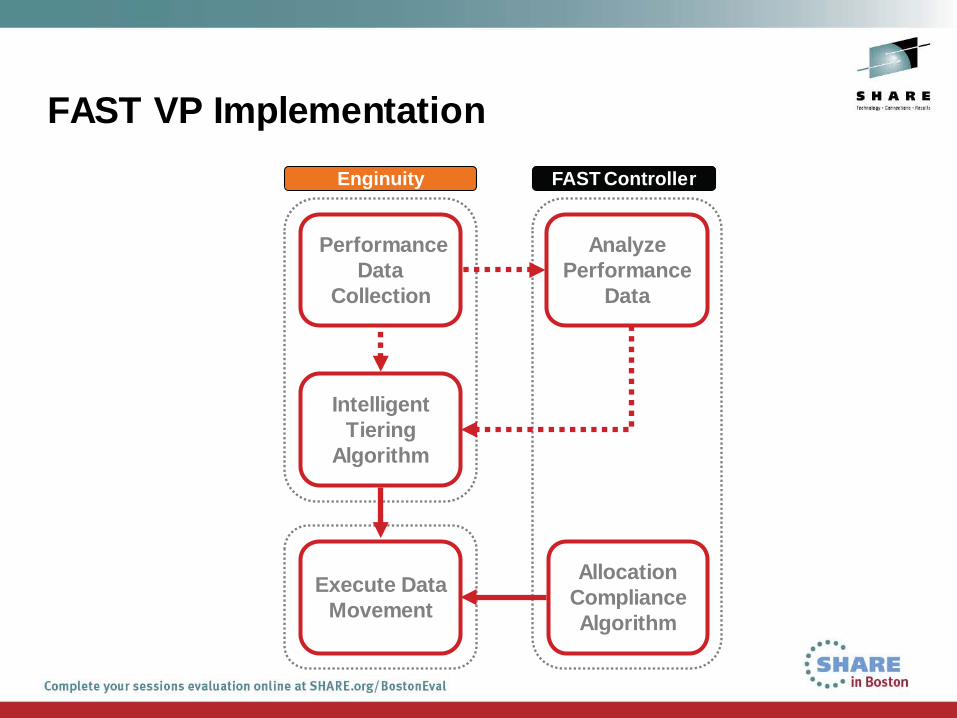
Performance Data
Collection
Analyze Performance
Data
Allocation Compliance Algorithm
Execute Data Movement
FAST Controller Enginuity
Intelligent Tiering
Algorithm
FAST VP Implementation
Data Movement
• Data chunks are moved using 6.8MB chunks • Performance-based
• Promotions due to high I/O rates • Demotions to free up space for promotions
• Compliance-based
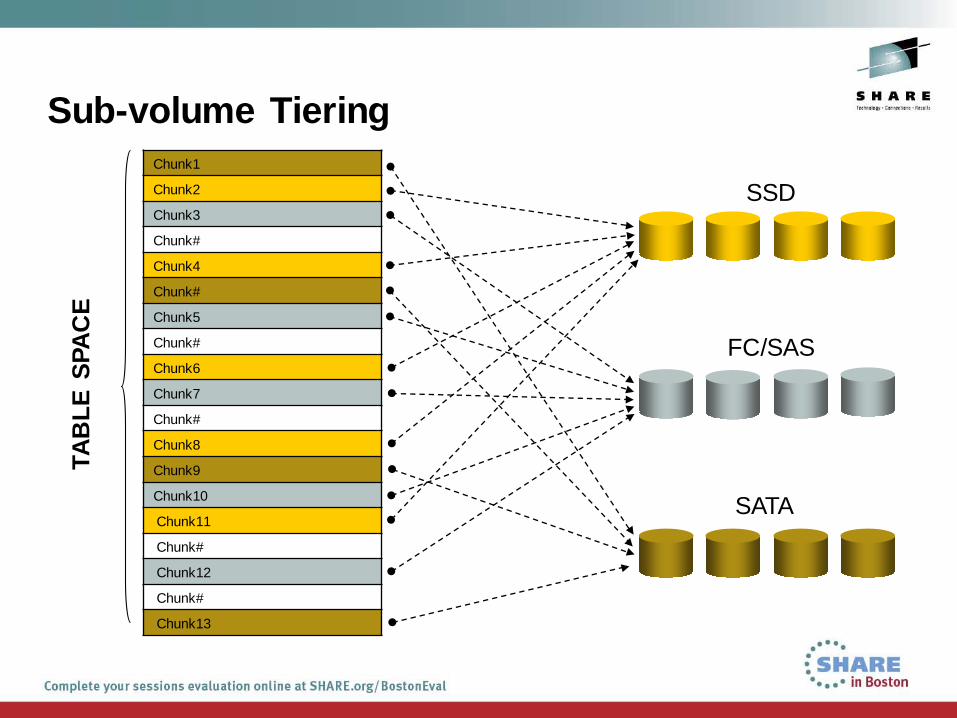
Sub-volume Tiering Chunk1
Chunk2
Chunk3
Chunk#
Chunk4
Chunk#
Chunk5
Chunk#
Chunk6
Chunk7
Chunk#
Chunk8
Chunk9
Chunk10
Chunk11
Chunk#
Chunk12
Chunk#
Chunk13
SSD
FC/SAS
SATA
TAB
LE
SPA
CE
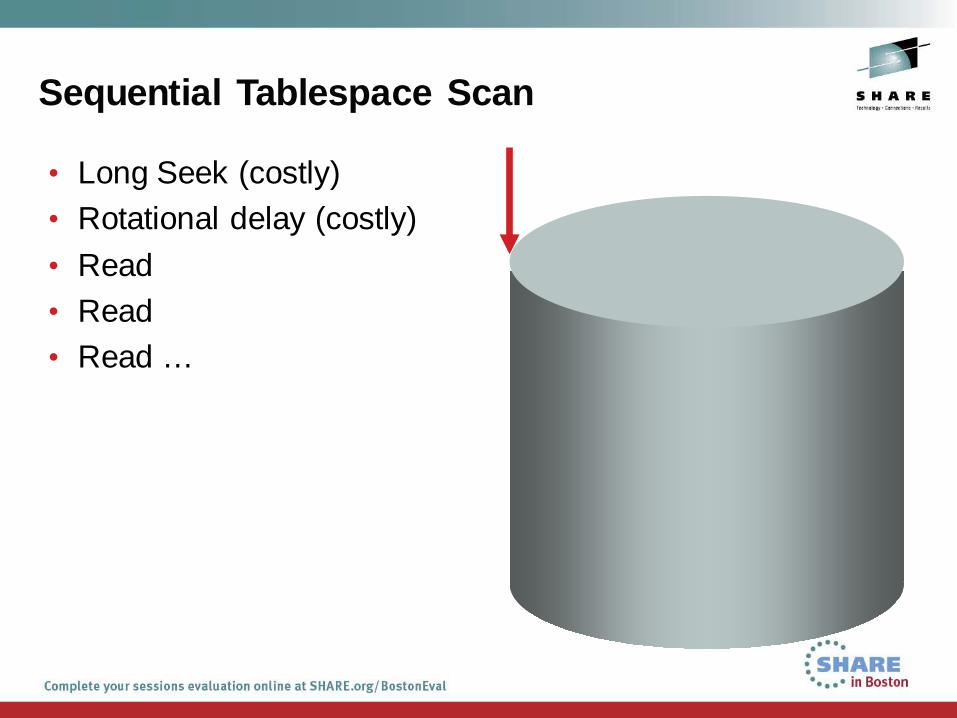
Sequential Tablespace Scan
• Long Seek (costly) • Rotational delay (costly)
• Read • Read • Read …

FAST VP TESTING WITH DB2
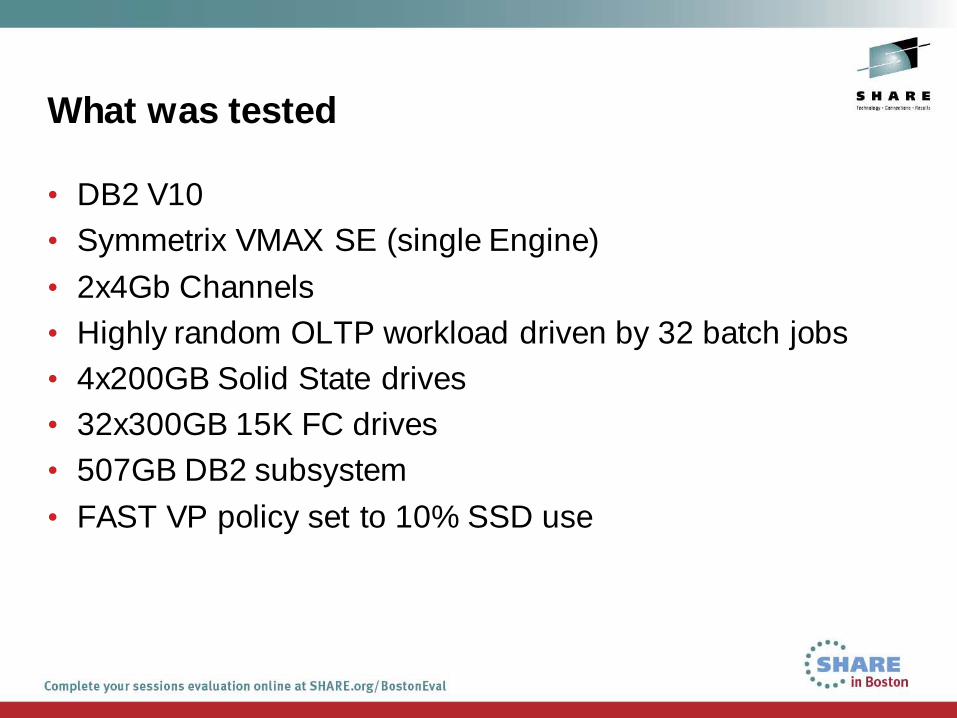
What was tested
• DB2 V10 • Symmetrix VMAX SE (single Engine)
• 2x4Gb Channels • Highly random OLTP workload driven by 32 batch jobs • 4x200GB Solid State drives • 32x300GB 15K FC drives • 507GB DB2 subsystem
• FAST VP policy set to 10% SSD use
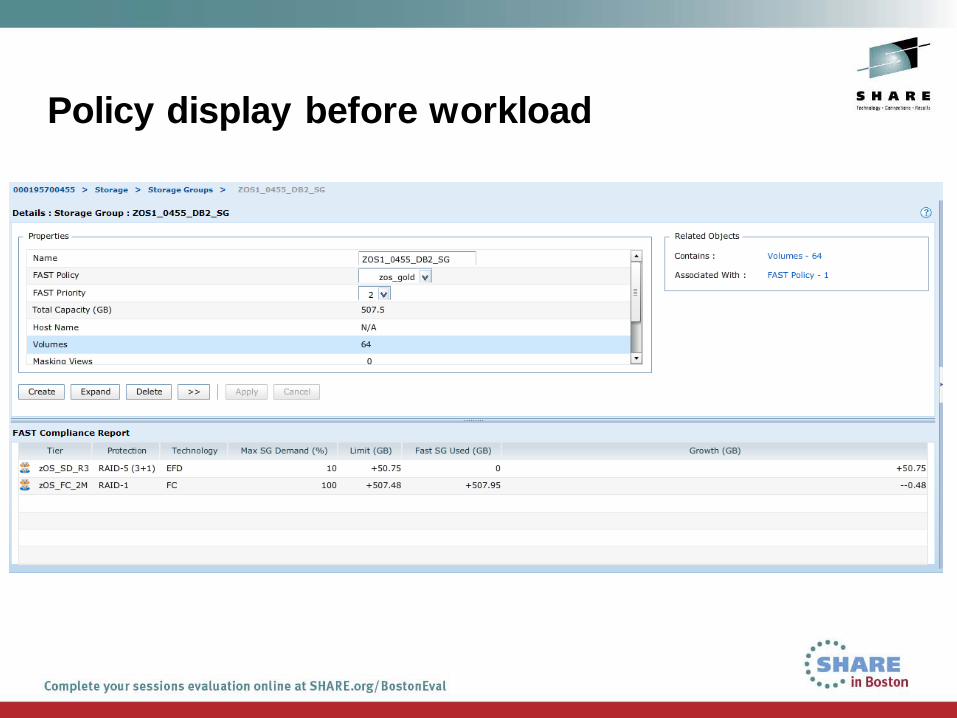
Policy display before workload
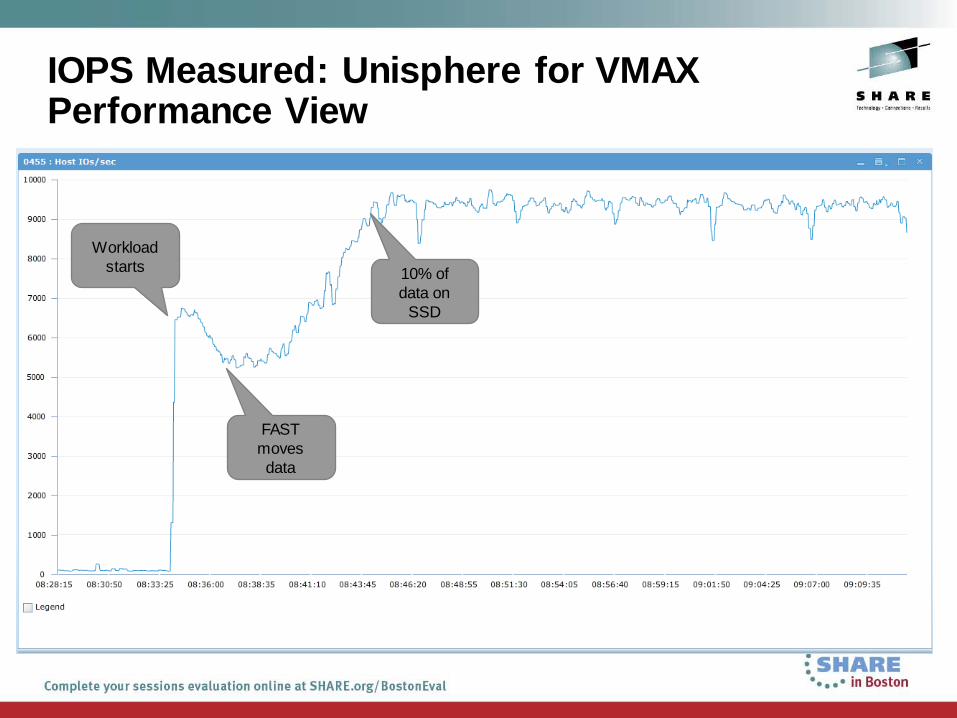
IOPS Measured: Unisphere for VMAX Performance View
Workload starts
FAST moves data
10% of data on
SSD
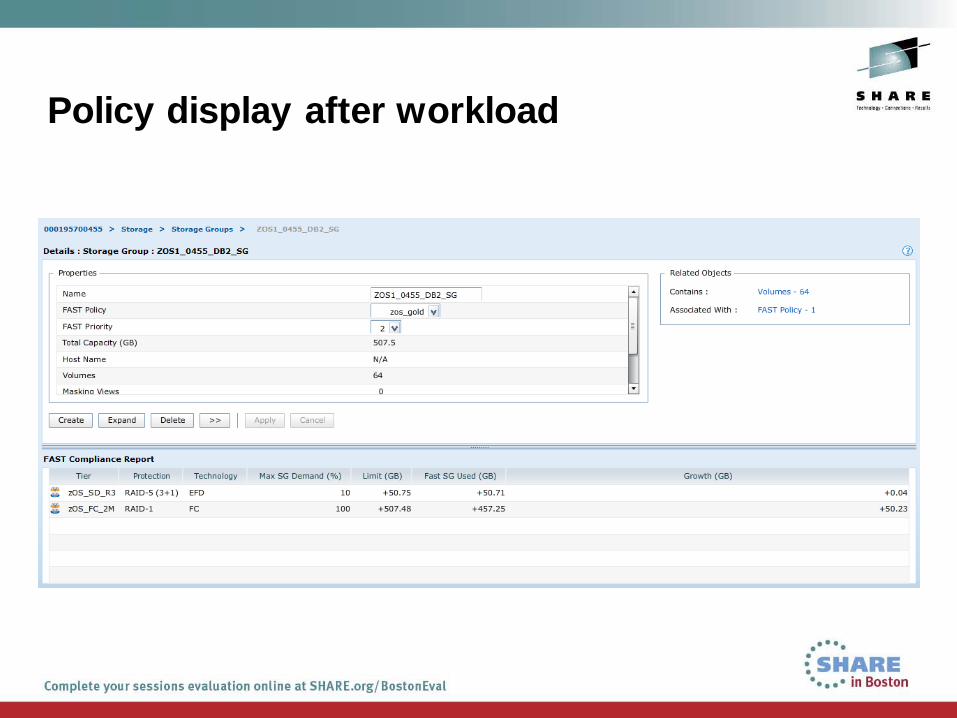
Policy display after workload

HOST CONSIDERATIONS
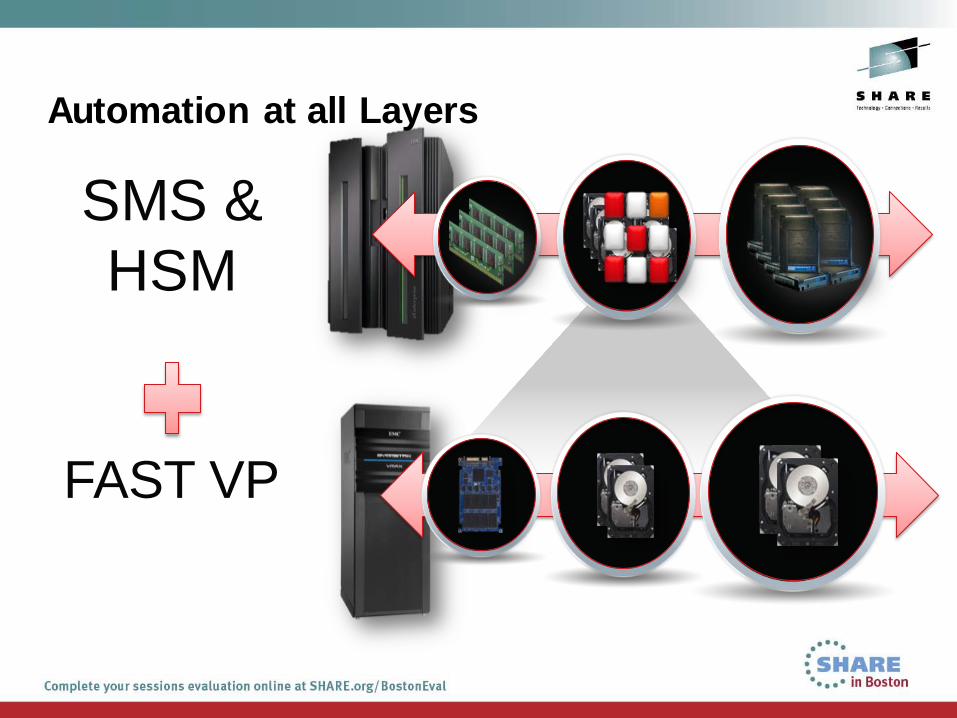
Automation at all Layers
SMS & HSM
FAST VP
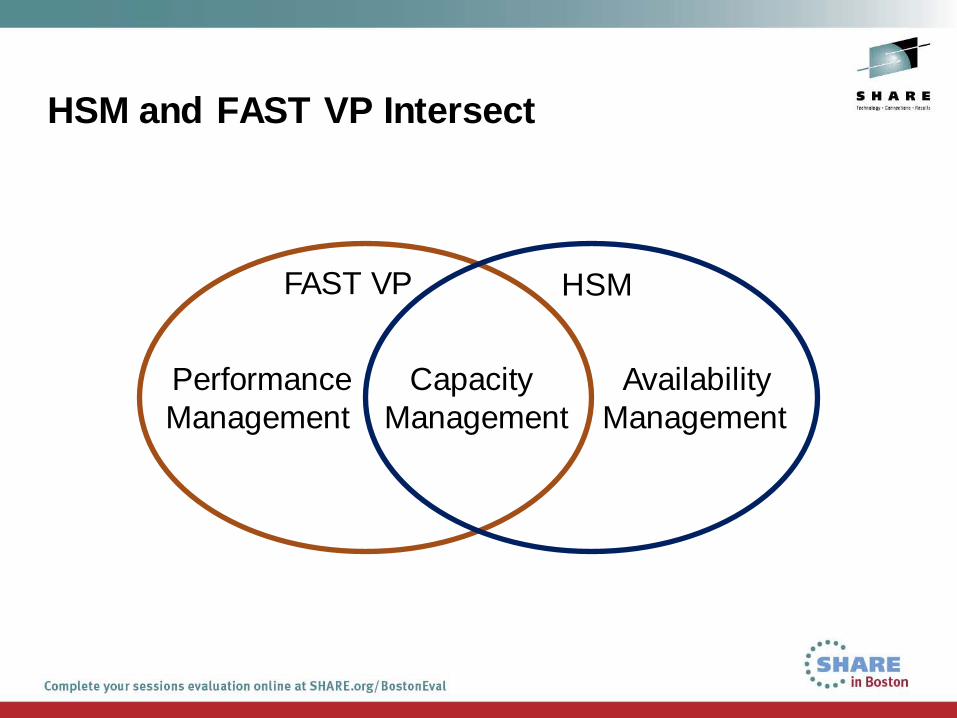
HSM and FAST VP Intersect
Capacity Management
Performance Management
Availability Management
FAST VP HSM
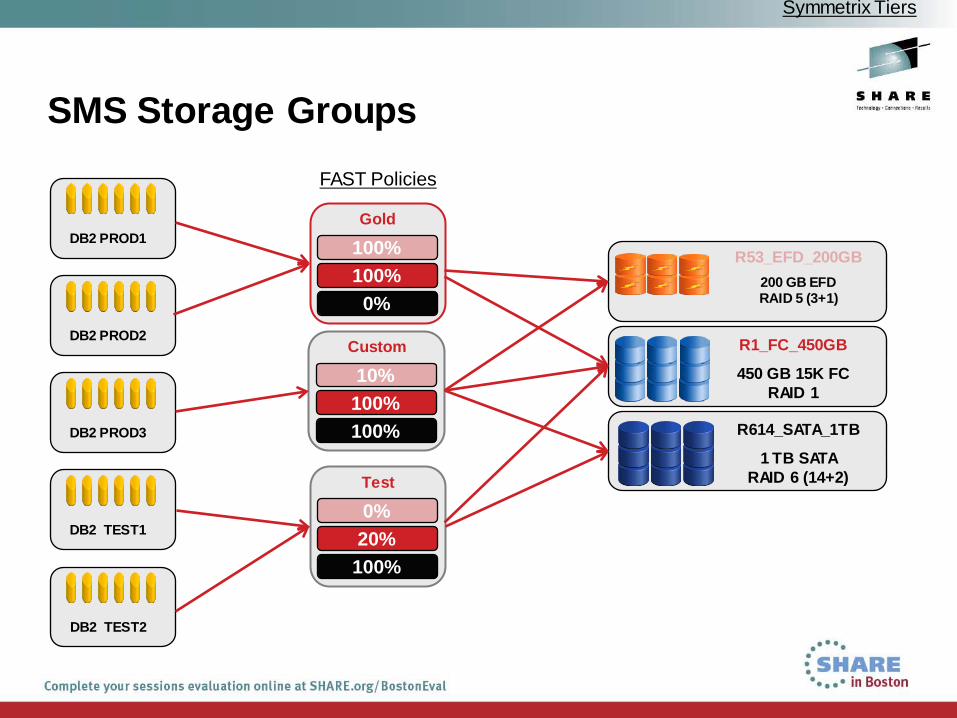
SMS Storage Groups
DB2 PROD1
DB2 PROD2
DB2 PROD3
Symmetrix Tiers
FAST Policies
Gold
100% 100% 0%
Custom
10% 100% 100% R614_SATA_1TB
1 TB SATA RAID 6 (14+2)
R1_FC_450GB
450 GB 15K FC RAID 1
R53_EFD_200GB
200 GB EFD RAID 5 (3+1)
DB2 TEST1
DB2 TEST2
Test
0% 20% 100%
Operational Considerations
• Storage tiering interactions with z/OS • SMS
• Performance-based allocations • DIRECT MSR Values (what do they mean now?)
• Thrashing • DB2 REORGs • HRECALLs • Dataset moves • Volume restore
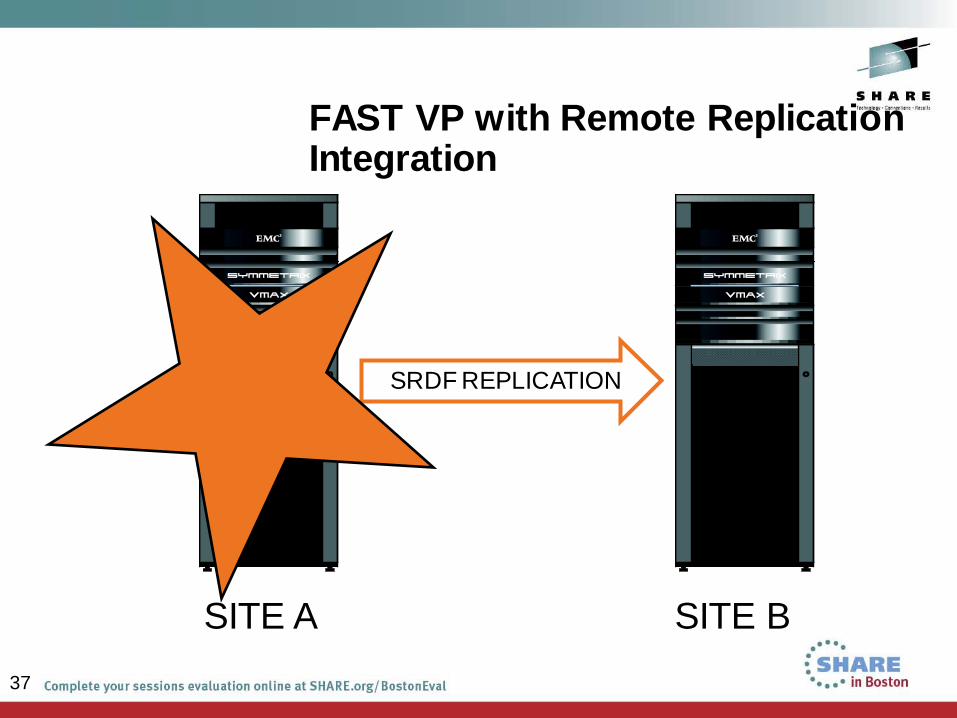
FAST VP with Remote Replication Integration
37
SITE A SITE B
SRDF REPLICATION
Operational Considerations (contd)
• How to manage charge back • How to influence decisions in the performance engine
• How to determine where everything is/was
Benefits of Storage Tiering
• Autonomic/automatic operation • Optimized performance
• Reduced cost (power and cooling) • Reduced footprint • Better capacity utilization • Ease of management
DB2 for z/OS With EMC Storage Tiering: FAST VP
Paul Pendle EMC Corporation
August 12, 2013
Session Number: 13988