davidson tisdale gold property, timmins, ontario
TRANSCRIPT

Davidson Tisdale Gold Property, Timmins, Ontario TECHNICAL REPORT
Presented to Northcott Gold Inc
Report by Geostat System International Inc
800 Blvd Chomedey, Tower C, Suite 500 Laval, Quebec, Canada, H7V 3Y4 Tel.: 1 (450) 973-6561 Fax: 1 (450) 973-6070 E-Mail: [email protected]
Written by Pierre Jean Lafleur, P.Eng. November 2003

DAVIDSON TISDALE GOLD PROPERTY, TIMMINS, ONTARIO – NORTHCOTT GOLD INC
GEOSTAT SYSTEMS INTERNATIONAL INC NOVEMBER 2003
page 2
Table of Contents
Table of Contents ...............................................................................................................2
List of Tables ...................................................................................................................5
List of Figures ..................................................................................................................6
Summary...........................................................................................................................8
Introduction and Terms of Reference .................................................................................12
Disclaimer......................................................................................................................14
Property Description and Location.....................................................................................15
Accessibility, Climate, Local Resources, Infrastructure and Physiography .............................17
History ............................................................................................................................18
1909 Discovery.........................................................................................................18
1911-1924 ................................................................................................................18
1933-1945 Ventures.................................................................................................18
1945-1981 ................................................................................................................19
1981 Dome Mines ....................................................................................................19
1984-1987 Getty Canadian Metals...........................................................................19
Getty 1984 Program............................................................................................19
Main Shaft Zone..................................................................................................19
Smith Vet-T Zone................................................................................................20
Getty 1985 Program............................................................................................20
Getty Program - 1986/87 - Phase 1 ....................................................................21
Getty Program - 1986/87 - Phase 2 ....................................................................21
1988-1993 Termination Of Getty Involvement & Subsequent Events ......................22
1993-2003 Northcott.................................................................................................22
Geological Setting ............................................................................................................24
Geological Map of Ontario........................................................................................24

DAVIDSON TISDALE GOLD PROPERTY, TIMMINS, ONTARIO – NORTHCOTT GOLD INC
GEOSTAT SYSTEMS INTERNATIONAL INC NOVEMBER 2003
page 3
Regional Geology.....................................................................................................25
Local Geology...........................................................................................................27
Deposit Types..................................................................................................................29
Mineralization..................................................................................................................30
Exploration......................................................................................................................34
Modern Exploration ..................................................................................................34
Davidson-Tisdale (1983-1984) .................................................................................34
1994-2003 ................................................................................................................34
Drilling............................................................................................................................35
Sampling Method and Approach .......................................................................................37
Sample Preparation and Security........................................................................................38
Data Corroboration...........................................................................................................39
Adjacent Properties ..........................................................................................................41
Mineral Processing and Metallurgical Testing.....................................................................42
1911-1924 ................................................................................................................42
1988 Milling Program - Davidson Tisdale.................................................................42
Mineral Resource and Mineral Reserve Estimates ...............................................................43
Methodology.............................................................................................................43
Classification.............................................................................................................44
List of Resources......................................................................................................45
Other Relevant Data and Information .................................................................................47
Sampling statistics....................................................................................................47
Variography ..............................................................................................................51
Interpretation and Conclusions ..........................................................................................53
Recommendations............................................................................................................57
References.......................................................................................................................58
Data ................................................................................................................................60
DAVIDSON TISDALE GOLD PROPERTY, TIMMINS, ONTARIO – NORTHCOTT GOLD INC
GEOSTAT SYSTEMS INTERNATIONAL INC NOVEMBER 2003
page 4
List of drill holes ........................................................................................................60
List of some composites without detailed assays .....................................................60
List of some High Grade Samples added to the DB by Geostat...............................61
Additional Requirements for Technical Reports on Development .........................................62
Properties and Production Properties ..................................................................................62
Illustrations......................................................................................................................62
Appendix........................................................................................................................67
Bulk Sample .............................................................................................................68

DAVIDSON TISDALE GOLD PROPERTY, TIMMINS, ONTARIO – NORTHCOTT GOLD INC
GEOSTAT SYSTEMS INTERNATIONAL INC NOVEMBER 2003
page 5
List of Tables
Table 1 Drilling Programs Historic ............................................................................35
Table 2 Drilling Database Status Report..................................................................36
Table 3 Bulk Sample and Production Data...............................................................40
Table 4 Historical Resource Estimate.......................................................................45
Table 5 Resources Estimate - 2003 .........................................................................46
Table 6 Comparative Resources Estimates .............................................................56

DAVIDSON TISDALE GOLD PROPERTY, TIMMINS, ONTARIO – NORTHCOTT GOLD INC
GEOSTAT SYSTEMS INTERNATIONAL INC NOVEMBER 2003
page 6
List of Figures
Figure 1- Location map of the property near Timmins..............................................15
Figure 2 Map of the Property Claims – 3D View Shows Detailed Work Area..........16
Figure 3 Map of Timmins area showing the property location ..................................17
Figure 4 Geological Map of Ontario..........................................................................24
Figure 5 Regional Map of Timmins Geology ............................................................26
Figure 6 Local Geology Map ....................................................................................28
Figure 7 3D View of Geology with Topographic Contour Lines ..............................29
Figure 8 Section 625 NW - Zones Above - Assays Below........................................31
Figure 9 Section 750 NW - Zones Above - Assays Below........................................32
Figure 10 Section 875 NW - Zones Above - Assays Below......................................33
Figure 11 Adjacent Property Location Map ..............................................................41
Figure 12 Assay Values Histogram ..........................................................................48
Figure 13 Histogram of Assays in Quartz Veins.......................................................48
Figure 14 Assays in Zones (50%)............................................................................49
Figure 15 Assays of the Main Zone..........................................................................49
Figure 16 Assays in the S zone................................................................................50
Figure 17 1m Composites Histogram......................................................................50
Figure 18 Linear Variogram......................................................................................51
Figure 19 Average Variogram ..................................................................................52
Figure 20 Down Dip Variogram................................................................................52
Figure 21 Scope of Placer Dome Open Pit...............................................................55
Figure 22 Location of DT83-101 - Pyritic Tuff ...........................................................55
Figure 23 3D Geology and Block Model.................................................................62
Figure 24 Geological Mapping, courtesy of WGM...................................................63
DAVIDSON TISDALE GOLD PROPERTY, TIMMINS, ONTARIO – NORTHCOTT GOLD INC
GEOSTAT SYSTEMS INTERNATIONAL INC NOVEMBER 2003
page 7
Figure 25 Picture of Quartz Veins...........................................................................64
Figure 26 Picture of Old Shaft Area.........................................................................64
Figure 27 Picture of Veins on Strike looking East.....................................................65
Figure 28 Picture from same location looking West.................................................65
Figure 29 Picture of Smith Vet T area.......................................................................66
Figure 30 Picture of Property Limits (West) .............................................................66

DAVIDSON TISDALE GOLD PROPERTY, TIMMINS, ONTARIO – NORTHCOTT GOLD INC
GEOSTAT SYSTEMS INTERNATIONAL INC NOVEMBER 2003
page 8
Summary
In August 2003, Northcott Gold Inc mandated Geostat Systems International Inc to prepare a Technical Report in compliance with National Policy 43-101, as much as possible, taking into consideration that much of the existing technical information may not be available.
The results and opinions expressed in this report are conditional upon the information provided to Geostat being current, accurate, and complete.
The Davidson Tisdale property is located in the North East part of Tisdale Twp., approximately 12 km NE of Timmins. The property comprises 26 claims totalling 1075 acres in the northeast quadrant of Tisdale Township.
The Davidson-Tisdale property has a paved road from Timmins to the gate of the property. The climate is typical of North East Ontario with temperatures in the range of 30°C in the summer to -30°C in the winter. The city of Timmins is a mining and logging centre with all the modern facilities.
Timmins is the largest gold producing area in Canadian history with more than 65 millions ounce of gold to its account. Gold was discovered on the Davidson-Tisdale in 1909.
Drilling was carried out and a two small shafts were sunk (250m depth) between 1911 and 1924 after the property was claimed by Davidson Gold Mines Ltd, later renamed the Davidson-Tisdale company and to Northcott Gold Inc in 2002. Between 1933 and 1945, after a legal dispute between D-T with a British company, Ventures (now Falconbridge) optioned the property and drilled 11 holes (1,557m). The property was inactive until 1977/8 after a positive report from Kirwan. In 1981 Dome Mines optioned the property and drilled 10 holes (1,118 m) with only one deep hole in the vicinity of the old workings. Early in 1984, 11 drill holes (2,080 m) were completed in the vicinity of the Main Shaft area and some underground mapping and sampling was completed. The mine had been flooded from 1924 until 1984 when Getty Metals (of Getty Oil) optioned the property and did a ramp (250m vertical depth) plus extensive underground drilling and bulk sampling. In 1985, the Smith Vet T zone west of the Main zone was investigated and deemed suitable for an open pit. It comprises a vein with a shallower dip and an easterly strike. In 1986/87, Getty mined some 5,220 tonnes at 7.31 g Au/t and it took more than 4,000 samples from muck to chips to channels to compare with drilling. One u/g sample returned over 4kg Au/t. Visible gold (VG) is commonly observed. This program confirmed the discrepancies between drilling and mining samples, typical of Timmins gold mines. In 1988, 43,850 tonnes at 5.48 g Au/t were mined from 8 stopes in the Main zone. Getty reportedly had expected a much larger resource and pulled out of mining altogether in 1988. The property was optioned to Midas until 1993. Midas did some deep drilling (4 holes) in 1989. In 1993/94, Placer Dome did an open pit study in a very small perimeter around the Main zone, reporting 160,000 tonnes at 5.72 g Au/t, excluding the Smith Vet T area. The Davidson-Tisdale Company changed its named to Northcott Gold Inc in 2002 and restructured itself in 2003. On February 10th, 2003, Vedron optioned the property to earn a 50% interest by spending $5 million (Can) in 5 years.
The Timmins District encompasses a vast portion of the province and is underlain by diverse geology. Portions of the Superior and Southern structural provinces of the

DAVIDSON TISDALE GOLD PROPERTY, TIMMINS, ONTARIO – NORTHCOTT GOLD INC
GEOSTAT SYSTEMS INTERNATIONAL INC NOVEMBER 2003
page 9
Canadian Shield and Phanerozoic rocks are all present in the District. Archean subprovinces within the Timmins District include the Abitibi/Wawa Subprovince and Quetico/Opatica Subprovince rocks. The property is located in the Porcupine Gold Camp, along the possible offset easterly projection of the Hollinger-Macintyre trend. Alteration on the property is widespread, consisting of a low-grade calcite-chlorite envelope enclosing a high-grade quartz-sericite-ferro dolomite or ankerite core. The abundance of faults is one of the most prominent features of the Davidson Tisdale property. They contain prominent short veins, locally with gold mineralization. The Main zone strikes ENE and dips steeply NW, which is typical of Timmins gold mines that reach depths of 1 km. Coarse gold grains are abundant in the quartz and its altered volcanic host rocks.
Two types of quartz veins were identified on the property, the Main zone (in echelon) and the S zone (thick flat quartz vein). The Main zone veins forms rich pockets of gold mineralisation. The S zone appears to carry very high gold values, often over 30 g Au/t, confined to the edge of the 4 to 5 m thick flat vein. The gold appears to be concentrated in the S zone near the lineament where the Main zone and the S zone intersect.
Modern exploration was most extensive after 1983, including underground and surface deep drilling in addition to geological mapping and geophysics’ surveys, trenching was also extensive. Since 1994, exploration has been more limited.
It is reported that over 47,675 m of drilling in 326 drill holes was done from 1911 until 1989. The drilling assays prior to 1983 are not available. The current database has 308 drill holes from surface accounting for 41,898 meters of core drilling including 6,592 samples, plus 287 underground drilling for 10,437 meters of core including 4,852 samples.
Sampling from drilling is the main source of data. It is reported more than 4,000 samples were taken underground other than drilling. Only the drill assays were available for this study. Historical data indicate that it is appropriate to cut high grade samples at about 30 to 34 g Au/t. Coarse gold is common and this leads to a ratio of about 2 out of 3 samples returning barren values where known mineralisation is sampled.
It was suggested at one time that assaying the whole core, instead of splitting the core could reduce the ‘nugget effect’. This could cause a security problem and it is not recommended to carry out this procedure. Milling of the bulk samples, the muck and some production corroborates the nature of the resource and the sampling problems typical of core drilling in this type of material. Some 57,571 tonnes at 6.15 g Au/t were processed between 1918 and 1988.
The Davidson-Tisdale property is adjacent to major gold producers in Timmins, just kilometres away either East (Pamour - Hollinger) or West (Macintyre).
Geostat used the Gemcom software to model the resource with a 3D wireframe geological model for volumes and kriging on a 2 x 2 x 2 (cubic) grid for grades, with 2 directions (90°/25°; 50°/40°) for search ellipsoids (50 x 50 x 15 m) and a minimum of 6 samples and a maximum of 12 samples. The block model extends from 9400 to 10350 East and from 9500 to 10400 North. A density of 2.8 (SG) was used in all calculations for tonnages.
The classification was based on the criteria prescribed by the CIM Standards on Mineral Resources and Ore Reserves into the categories: measured, indicated and inferred. There is no mine plan, so no dilution is added, nor mining recovery applied, to the resources quoted in this report. The resource numbers are the direct output from the model without subtracting the tonnage (57,571 tonnes at 6.15 g Au/t) already extracted.

DAVIDSON TISDALE GOLD PROPERTY, TIMMINS, ONTARIO – NORTHCOTT GOLD INC
GEOSTAT SYSTEMS INTERNATIONAL INC NOVEMBER 2003
page 10
When compared to previous resource estimates using similar criteria (geology, cut grade and cut-off), the tonnage and grade are almost identical.
Resources above 2.0 g Au/t cut-off grade
measured indicated Total
Tonnes Total Au g/t
Total on Au
Zones Tonnes Au g/t on Au Tonnes Au g/t on Au UPPER 213,447 4.49 30,811 133,559 4.22 18,106 347,006 4.38 48,917LOWER 114,516 4.70 17,316 22,642 3.45 2,515 137,158 4.50 19,830S_ZONE 338,480 5.50 59,837 415,045 4.52 60,383 753,525 4.96 120,219Total 666,443 5.04 107,963 571,246 4.41 81,004 1,237,689 4.75 188,967 inferred Zones Tonnes Au g/t on AuUPPER 5,392 3.05 529LOWER 70 2.47 6S_ZONE 386,359 4.68 58,150Total 391,821 4.66 58,684 Including Resources above 4.0 g Au/t cut-off grade
measured indicated Total
Tonnes Total Au g/t
Total on Au
Zones Tonnes Au g/t on Au Tonnes Au g/t on Au UPPER 87,641 6.93 19,524 56,744 6.08 11,087144,385 6.59 30,611LOWER 49,882 7.17 11,493 4,846 6.65 1,037 54,728 7.12 12,530S_ZONE 200,823 7.15 46,143 154,209 7.45 36,961355,032 7.28 83,104Total 338,346 7.09 77,160 215,799 7.07 49,085554,145 7.09 126,245 inferred Zones Tonnes Au g/t on Au UPPER 802 5.53 143S_ZONE 190,581 6.32 38,706Total 191,383 6.31 38,848

DAVIDSON TISDALE GOLD PROPERTY, TIMMINS, ONTARIO – NORTHCOTT GOLD INC
GEOSTAT SYSTEMS INTERNATIONAL INC NOVEMBER 2003
page 11
The statistical analysis indicates the data has a sustained high-grade group of samples in all categories. The variography indicates a relatively short range of grade continuity (15m by 4m), which confirms the shape and size of the gold bearing structures.
This study indicates that the detailed geological interpretation is difficult but required to insure that the most efficient drilling layout and method of work (bulk samples, mining) are used to determine the resources available with accuracy. There are a number of issues to be addressed such as the pyritic tuff reported in DT83-101, the extension of the mineralisation down dip and on strike. It appears the Main zone is the most favourable target to discover new resources. The S zone may be ‘steeling’ its gold from the Main zone. Current drilling and workings are concentrated in the South portion of the property. Some work has been done on the rest of the property but it is time to reconsider all potential targets and make use of the latest geophysical surveys, for example. Northcott must design a strategic plan, which takes into consideration the existing information, the missing information, the methods of investigation for exploration, but the main objectives may be to prepare a pre-feasibility study for an eventual production of gold. Small-scale mining, if it is possible, given the requirements of the environment, etc., may be the best solution to confirm the value of the known resources on the property.
Resource Estimation
1985 Geostat (Kriging) 1985 Getty (Titaro-Polygones)
Cut Grades @ 34.28 g Au/tCut-Off 3.43 Cut-Off 3.43
Zone Tonnes Au g/t Class Tonnes Au g/tUpper 125,042 6.49 Indicated 217,306Lower 367,857 6.77 Inferred 262,111S zone 198,481 4.46 Inf.geol. 70,634Total 691,380 6.06 Total 550,051 8.74
2003 Geostat (Kriging 3D)Cut-Off 4.0
Zone Tonnes Au g/tUpper 145,187 6.59Lower 54,728 7.12S zone 545,613 6.94Total 745,528 6.89
8.74
DAVIDSON TISDALE GOLD PROPERTY, TIMMINS, ONTARIO – NORTHCOTT GOLD INC
GEOSTAT SYSTEMS INTERNATIONAL INC NOVEMBER 2003
page 12
Introduction and Terms of Reference
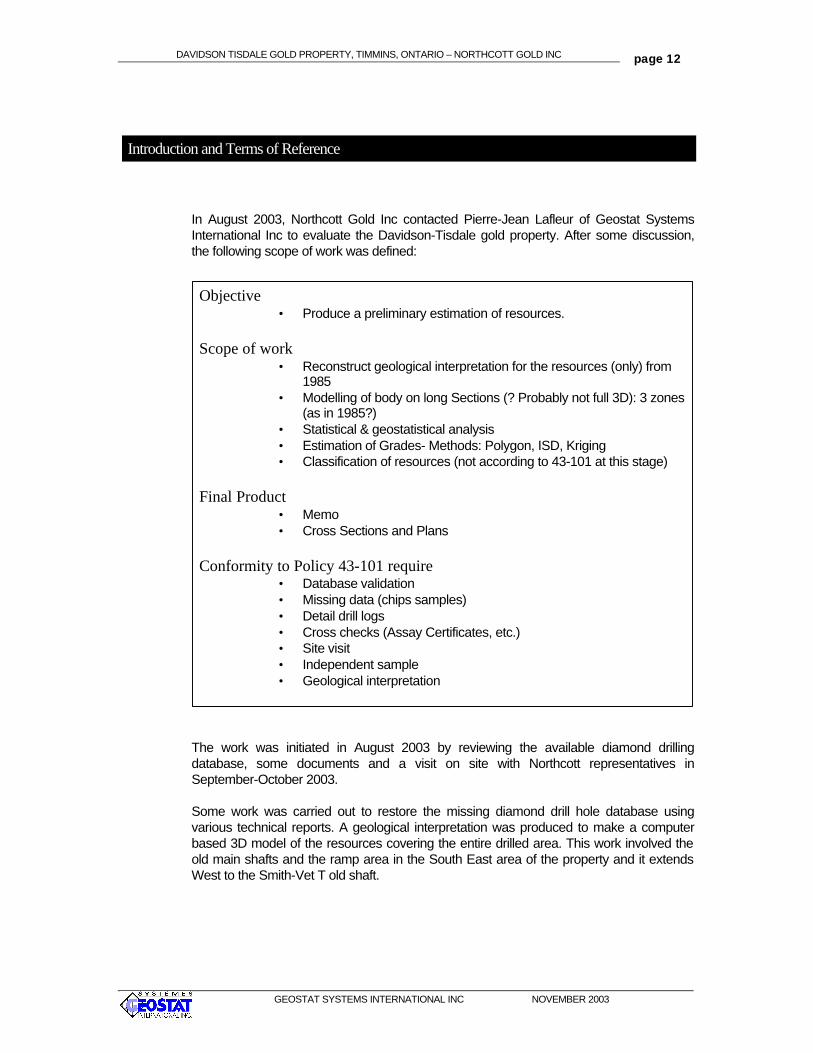
In August 2003, Northcott Gold Inc contacted Pierre-Jean Lafleur of Geostat Systems International Inc to evaluate the Davidson-Tisdale gold property. After some discussion, the following scope of work was defined:
The work was initiated in August 2003 by reviewing the available diamond drilling database, some documents and a visit on site with Northcott representatives in September-October 2003.
Some work was carried out to restore the missing diamond drill hole database using various technical reports. A geological interpretation was produced to make a computer based 3D model of the resources covering the entire drilled area. This work involved the old main shafts and the ramp area in the South East area of the property and it extends West to the Smith-Vet T old shaft.
Objective • Produce a preliminary estimation of resources.
Scope of work
• Reconstruct geological interpretation for the resources (only) from 1985
• Modelling of body on long Sections (? Probably not full 3D): 3 zones (as in 1985?)
• Statistical & geostatistical analysis • Estimation of Grades- Methods: Polygon, ISD, Kriging • Classification of resources (not according to 43-101 at this stage)
Final Product
• Memo • Cross Sections and Plans
Conformity to Policy 43-101 require
• Database validation • Missing data (chips samples) • Detail drill logs • Cross checks (Assay Certificates, etc.) • Site visit • Independent sample • Geological interpretation

DAVIDSON TISDALE GOLD PROPERTY, TIMMINS, ONTARIO – NORTHCOTT GOLD INC
GEOSTAT SYSTEMS INTERNATIONAL INC NOVEMBER 2003
page 13
Some information is not available for this study including:
• Many detailed drill logs and assays – the missing assays are replaced by the composites whenever possible – including all assays of the S zone and data pertaining to the Smith Vet T area;
• Surface and underground geological mapping;
• Some survey data, including many elevations of drill hole collars and underground workings and a partial set of topographic contours for the property;
• A comprehensive and complete geological interpretation - - the only set of section available at the time of this report writing being from the “quick and dirty” Placer Dome Study in 1994.
It was known at the time of preparing and writing the present report that much of the technical information produced in the past was missing. It is understood that Geostat Systems International Inc. is to do what it can with the available data and make recommendations to acquire the required technical information whether it be from the old record or from work laid out for the future.

DAVIDSON TISDALE GOLD PROPERTY, TIMMINS, ONTARIO – NORTHCOTT GOLD INC
GEOSTAT SYSTEMS INTERNATIONAL INC NOVEMBER 2003
page 14
Disclaimer
Geostat Systems International Inc (‘Geostat’) has not reviewed the land tenure, nor independently verified the legal status or ownership of the property or underlying and/or joint venture agreements. The results and opinions expressed in this report are based on Geostat’s field observations and the geological and technical data listed in the References. While Geostat has carefully reviewed all of the information provided by Northcott Gold Inc. (‘Northcott’), the owner of the property, and believes that the information is reliable, Geostat has not conducted an in-depth independent investigation to verify its accuracy and completeness.
The results and opinions expressed in this report are conditional upon the aforementioned geological and legal information being current, accurate, and complete as of the date of this report, and the understanding that no information has been withheld that would affect the conclusions made herein. Geostat reserves the right, but will not be obliged, to revise this report and conclusions if additional information becomes known to Geostat subsequent to the date of this report. Geostat does not assume responsibility for Northcott’s actions in distributing this report.

DAVIDSON TISDALE GOLD PROPERTY, TIMMINS, ONTARIO – NORTHCOTT GOLD INC
GEOSTAT SYSTEMS INTERNATIONAL INC NOVEMBER 2003
page 15
Property Description and Location
The Davidson Tisdale property is located in the North East part of Tisdale Twp., approximately 12 km NE of Timmins. The property is located approximately 3 km northeast and along strike from the Hollinger-McIntyre-Coniarum ore bodies that have produced in excess of thirty-one million ounces of gold.
Figure 1- Location map of the property near Timmins.
The property comprises 26 claims totalling 1075 acres in the northeast quadrant of Tisdale township. The claims registry was verified by Francis P. Yungwirth, barrister and solicitor of Timmins in April 2003. He reported to Cunningham & Associates LLP in Toronto that “Northcott Gold Inc. has a good and valid title to the Mining Rights for the properties scheduled.”
Yungwirth also reports that “Historically, the company (Northcott Gold Inc) was named Davidson Tisdale Mines Limited, and changed its name to Davidson Tisdale Ltd. By Articles of Amendment dated July 27, 1992. Further the company again changed its name to Northcott Gold Inc. by Articles of Amendment dated June 10, 2002.”

DAVIDSON TISDALE GOLD PROPERTY, TIMMINS, ONTARIO – NORTHCOTT GOLD INC
GEOSTAT SYSTEMS INTERNATIONAL INC NOVEMBER 2003
page 16
Figure 2 Map of the Property Claims – 3D View Shows Detailed Work Area

DAVIDSON TISDALE GOLD PROPERTY, TIMMINS, ONTARIO – NORTHCOTT GOLD INC
GEOSTAT SYSTEMS INTERNATIONAL INC NOVEMBER 2003
page 17
Accessibility, Climate, Local Resources, Infrastructure and Physiography
The Davidson-Tisdale property has a paved road from Timmins to the gate of the property. The climate is typical of North East Ontario with temperatures in the range of 30°C in the summer to -30°C in the winter.
The City of Timmins is about 100 years old and one of the most famous gold mine camp in Canada as well as one of its most productive still today. Therefore, the local community offers all the services for exploration and mine production underground and in open pit.
Timmins has a modern airport and it is connected to the major network of highways, including the Trans Canada Highway.
The physiography is typical of glacial regions where the landscape is made of low hills and numerous rivers and lakes.
The forest industry is also very active in the area, apart from mining.
Timmins host the Kidd Creek mine, a polymetallic mine with zinc, copper, gold and silver. It is the largest zinc mine in the world. It has smelting and refineries facilities on location in Timmins.
Figure 3 Map of Timmins area showing the property location

DAVIDSON TISDALE GOLD PROPERTY, TIMMINS, ONTARIO – NORTHCOTT GOLD INC
GEOSTAT SYSTEMS INTERNATIONAL INC NOVEMBER 2003
page 18
History
1909 Discovery
In 1909, the Dome, Hollinger, McIntyre and Davidson mines were discovered.
1911-1924
The property was incorporated as Davidson Gold Mines Limited in 1911 and was succeeded in 1919 by Davidson Consolidated Gold Mines Limited. In 1921 Porcupine Davidson Mines Limited was formed as a 50/50 joint venture with British interests. Due to disagreement between the partners, prolonged litigation resulted in the property being tied up for several years.
Between 1911 and 1924 exploration on the property comprised surface drilling and underground development through a small exploration shaft. Thirteen surface holes totalling 4,070 m were drilled and a 2-compartment vertical shaft (Main Shaft) was sunk to a depth of 95 m. Levels were established at 30 m, 60 m and 90 m with approximately 700 m of lateral development. An internal vertical winze was sunk a further 67 m from the 90 m Level with some 490 m of drifts and cross-cuts on the 3 new levels developed. A limited amount of underground drilling was carried out.
In 1918 electricity was brought to the site and a 10-stamp mill operated at 30 tons per day till it burned down in 1924. A reported total of 8501 tonnes @ 8.9 g Au/t was milled and 2,438 ounces of gold recovered using mercury amalgamation. It is noted that about 20% of the gold content was lost using this process.
In 1923/24 the 3-compartment Horseshoe Shaft was sunk at a site 180 m west of the Main Shaft. Inclined at 72 degrees to the northwest, the shaft was intended to go to a depth of 300 m in order to develop the deeper gold-bearing veins encountered by surface diamond drilling. Due to withdrawal of the British financial backers in late 1924, the shaft stopped at 247 m and stations were established at 60 m, 120 m and 167 m along the incline.
1933-1945 Ventures
In 1925 control reverted to Davidson Consolidated Mines Limited who then sold the mineral rights to Mining Contracting and Supply Company (Ventures Limited - the forerunner of Falconbridge). In 1945 Ventures sold the rights to Davidson Tisdale Mines Limited and, though various joint ventures have been undertaken with several parties over the years, title has remained with the Company.
Between 1933 and 1945 Ventures drilled 11 holes into and below the old workings in an attempt to locate vein extensions and to verify the high-grade results reported from previous drilling. They drilled a total of 1,557 m but the results did not meet their requirements and they returned the property to Davidson Tisdale Mines.

DAVIDSON TISDALE GOLD PROPERTY, TIMMINS, ONTARIO – NORTHCOTT GOLD INC
GEOSTAT SYSTEMS INTERNATIONAL INC NOVEMBER 2003
page 19
1945-1981
A report by Ed Hart in 1977/8 indicates that the tonnage and grade are understated while Kirwan reported positively on the property.
1981 Dome Mines
In 1981 Dome Mines drilled 10 holes (1,118 m) with only one deep hole in the vicinity of the old workings. Dome regarded the old mine as exhausted and quoted the results of Ventures’ underground sampling. Kirwan notes that Ventures had NOT done any underground sampling, as they had not dewatered the mine. In fact the old workings remained flooded from 1924-1983. Dome drilled an 11th hole to test the strike continuity based on “the old 70º: 70º model”, i.e., an ore zone dipping at 70º and striking 070º.
During early 1984, 11 drill holes (2,080 m) were completed in the vicinity of the Main Shaft area and some underground mapping and sampling was completed. Getty Canadian Metals Limited became operator of the project on March 1, 1984.
1984-1987 Getty Canadian Metals
This company, a subsidiary of Getty Oil of the USA, exemplifies the move by the Oil Companies into metal exploration and mining that began in the 1970s. This foray by the oil sector lasted approximately 20 years so that by the end of the 1980s most of the oil companies had abandoned the metals sector with very little to show for their large budgets and 20 years of effort.
Getty 1984 Program
The stated objectives of the 1984 program were as follows:
• To indicate by drilling the tonnage potential of the known quartz vein zones.
• To establish the inferred continuation of these systems to the southwest along a strike length of 700 m and to a maximum depth of 230 m.
• To assess the potential for a 1 to 3 million ton deposit.
• To explore for additional vein systems.
• To outline sufficient tonnage to justify an underground exploration and development program.
The program achieved the following:
Main Shaft Zone
Drill testing the Main Shaft Zone completed on 50 m centres and to a depth of 250 m between the Main Shaft and the S-Zone, a distance of 450 m. In-fill drilling at 25 m centres were completed in selected areas of the main Zone.
Two en echelon auriferous vein systems striking 030º and dipping at 30 to 45º NW were identified.

DAVIDSON TISDALE GOLD PROPERTY, TIMMINS, ONTARIO – NORTHCOTT GOLD INC
GEOSTAT SYSTEMS INTERNATIONAL INC NOVEMBER 2003
page 20
45% of the drill holes encountered VG, with 45% of the holes returning 1.7 g Au/t or greater over the full width of the vein system.
Smith Vet-T Zone
Exploration for 400 m to west of Smith Vet-T Zone to a vertical depth between 50 and 200 m.
At least 2 parallel vein systems identified with the main auriferous structure (S-Zone) striking at 090º and dipping north at 25º.
Limited in-fill drilling on 25 m centres were completed.
Thirty six percent of the holes intersecting the S-Zone quartz vein system encountered VG with 25% of the holes returning 1.7 g Au/t or greater over the full width of the vein.
The status at the end of 1984 was as follows:
An in-house ore reserve calculation by Getty for the main Shaft and South Zone demonstrated 747,600 tonnes in the drill indicated category. The average uncut and in-situ grade averaged 12.39 g Au/t over an average true vein width of 3 m and to a depth of approximately 200 m.
Potential to significantly increase the reserves was identified.
Getty also identified open pit potential for the S-Zone.
(It should be noted that the parameters used by Getty in their definition of “Reserves” have not been stated. A more appropriate wording may be to regard these as resources or even sampling statistics).
Getty 1985 Program
This program comprised 2 phases. Phase 1 program was to evaluate the potential for near-surface open pittable reserves in the S-Zone in the Smith Vet-T Zone area, while Phase 2 involved mining a bulk sample from underground to validate the drill-indicated reserves between the 4th and 5th Levels.
1985 Program - Phase 1
This program comprised 835 m in ten diamond drill holes. Though the vein system was encountered where anticipated, the lack of significant assays together with budget constraints caused the program to be terminated and efforts to be focused on the Phase 2 underground program.
1985 Program - Phase 2
This program consisted of 4 surface and 8 underground pilot core holes (761 m), site preparation, headframe installation and underground rehabilitation. Ninety-seven meters of crosscutting and 53 m of raises were completed and a 2,885 tonnes bulk sample was obtained. Systematic chip and muck sampling comprised approximately 4,000 samples. An important part of this program was the comparison of grade as indicated from drill holes with that achieved from the various sampling methods employed.

DAVIDSON TISDALE GOLD PROPERTY, TIMMINS, ONTARIO – NORTHCOTT GOLD INC
GEOSTAT SYSTEMS INTERNATIONAL INC NOVEMBER 2003
page 21
The principle conclusions from this program were:
The quartz vein systems are very irregular and erratically mineralized. The vein systems are complex rather than being a simple sheet-type system.
Comparison of assays from drill core with those from various sampling experiments underground suggest that:
• Whole core rather than split core should be sent for assay.
• Cutting individual assays > 34.28 g in drill core is indicated.
Muck, panel and channel samples correlate very well with sample tower results, suggesting that these be used for grade estimation.
Getty Program - 1986/87 - Phase 1
Underground Program
The main component of this program was a bulk sample from the 4th Level to test the Lower Vein System. A total of 7,270 tonnes was mined and some 6,970 tonnes, of which 1,750 tonnes were classified as waste, were brought to the surface. Though the bulk of the material (75%) was mined on the 4th Level, ore was also recovered from the 3rd and 5th Levels. An additional 55 short diamond drill holes were completed for 1,337 m and the excavations mapped. The material was panel and muck sampled.
As slashing began on the 4th Level it became apparent that the high-grade areas were visually identifiable so that the mining of this sample was effectively under geological control. Material was divided into stockpiles of varying grades as determined using chip samples from underground on one-metre squares and surface grab samples.
Underground panel sampling completed subsequent to the mining indicated a grade of 7.31g Au/t for the area of bulk sample Pile 1.
1985 Geostatistical Study and 1987 Getty Resource Estimates
Geostat Systems International undertook a geostatistical study in order to:
• Determine the optimum drill hole spacing
• Calculate and classify the in-situ geological reserves
• Make recommendations for programs necessary to upgrade reserves
A comparison of the reserves as determined by Geostat with those of Getty is discussed in the Mineral Resource section of this report.
It was concluded that the optimum drill hole spacing should be 6.25 m apart to permit economic blocks of ore to be outlined.
Getty Program - 1986/87 - Phase 2
Commencing in November 1986, the objectives of this program were:

DAVIDSON TISDALE GOLD PROPERTY, TIMMINS, ONTARIO – NORTHCOTT GOLD INC
GEOSTAT SYSTEMS INTERNATIONAL INC NOVEMBER 2003
page 22
• To detail the geometry of the mineralized shoots above the 106 m (350 ft) Level.
• To upgrade the reserve category from drill probable to mine proven and to generate sufficient information for the proposed feasibility study.
• To determine the most efficient mining method.
• To process the bulk sample at a custom Go-Mill.
Under the Phase II underground exploration program the main ramp was driven 17 meters below the 5th Level, a total distance of 1,081 m and the west ramp was driven 506 m to the “S” Zone. In excess of 6,000 m of underground diamond drilling was completed. Detailed channel sampling was carried out on the 5th Level and the results indicated two areas with very high grade (up to 4075 g Au/t in one channel) which was well supported with other samples ranging from 200 to >1000 g Au/t (Fig.4).
1988-1993 Termination Of Getty Involvement & Subsequent Events
In mid to late 1988 Getty Metals underwent a series of corporate reorganizations. The company changed its name to Total Erickson, which in turn was merged into a wholly owned subsidiary to become Total Energold. During 1988 Total Energold closed down the Davidson Tisdale operation.
The property was then optioned to Midas Minerals, which company could earn a 60% interest by spending $2.0 million through 1993. Midas drilled 4 deep diamond drill holes in 1989 in order to follow the structure down plunge. Former Midas personnel have verbally confirmed “we got 1 or 2 decent intersections” but decided not to complete their earn in. In addition they confirmed that Getty’s objective was a large daily tonnage operation rather than the smaller operation the deposit could have supported.
No reports are available on this work but it is intended that further sources of information be followed up.
1993-2003 Northcott
The property was brought to Placer Dome Canada by J.L. Kirwan on behalf of Davidson, in the fall of 1993. In 1994, a study was prepared by D. Ings, D. Hunt and D. Sketchley. The scope of work was limited to making a “quick and dirty” block model of the mineral resources to design a pit in a small area around the old mine, excluding the Smith-Vet T area. That study reports a resource estimated to 340,000 tonnes at 4.6 g Au/t, including a resource of 160,000 tonnes at 5.72 g Au/t inside the pit shell.
In 2002, the Davidson Tisdale Ltd Company’s name was changed to Northcott Gold Inc.
Northcott had planned to dewater the mine, go underground and start production. This has been delayed by a restructuring of Northcott in 2003.
On February 10th 2003, Northcott Gold Inc. (YNO-TSX Venture) announced that it had signed a property option agreement with Vedron Gold Inc. (“Vedron”) (YVG-TSX Venture) on the Tisdale property north of Timmins, Ontario. Under the terms of the property option agreement, Vedron can earn an undivided 50% interest in the property for consideration of work expenditures of $5,000,000 over five years and by issuing 100,000 Vedron shares. In the first year of the agreement, Vedron has agreed to spend up to $1,000,000 and not

DAVIDSON TISDALE GOLD PROPERTY, TIMMINS, ONTARIO – NORTHCOTT GOLD INC
GEOSTAT SYSTEMS INTERNATIONAL INC NOVEMBER 2003
page 23
less than $250,000. In addition Vedron will pay Northcott $10,000 every three months during the term of the agreement. Northcott and Vedron will act as joint operators, consulting on a regular basis in connection with developing a work program.
DAVIDSON TISDALE GOLD PROPERTY, TIMMINS, ONTARIO – NORTHCOTT GOLD INC
GEOSTAT SYSTEMS INTERNATIONAL INC NOVEMBER 2003
page 24
Geological Setting
Geological Map of Ontario
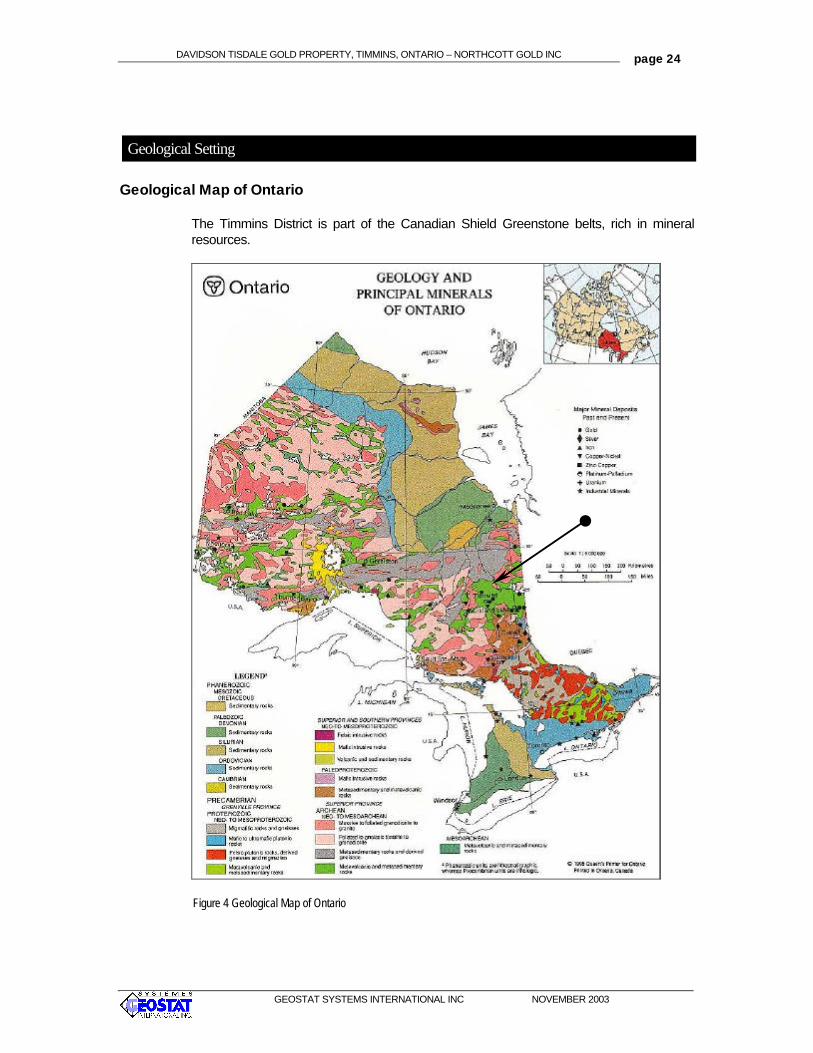
The Timmins District is part of the Canadian Shield Greenstone belts, rich in mineral resources.
Figure 4 Geological Map of Ontario
DAVIDSON TISDALE GOLD PROPERTY, TIMMINS, ONTARIO – NORTHCOTT GOLD INC
GEOSTAT SYSTEMS INTERNATIONAL INC NOVEMBER 2003
page 25
Regional Geology
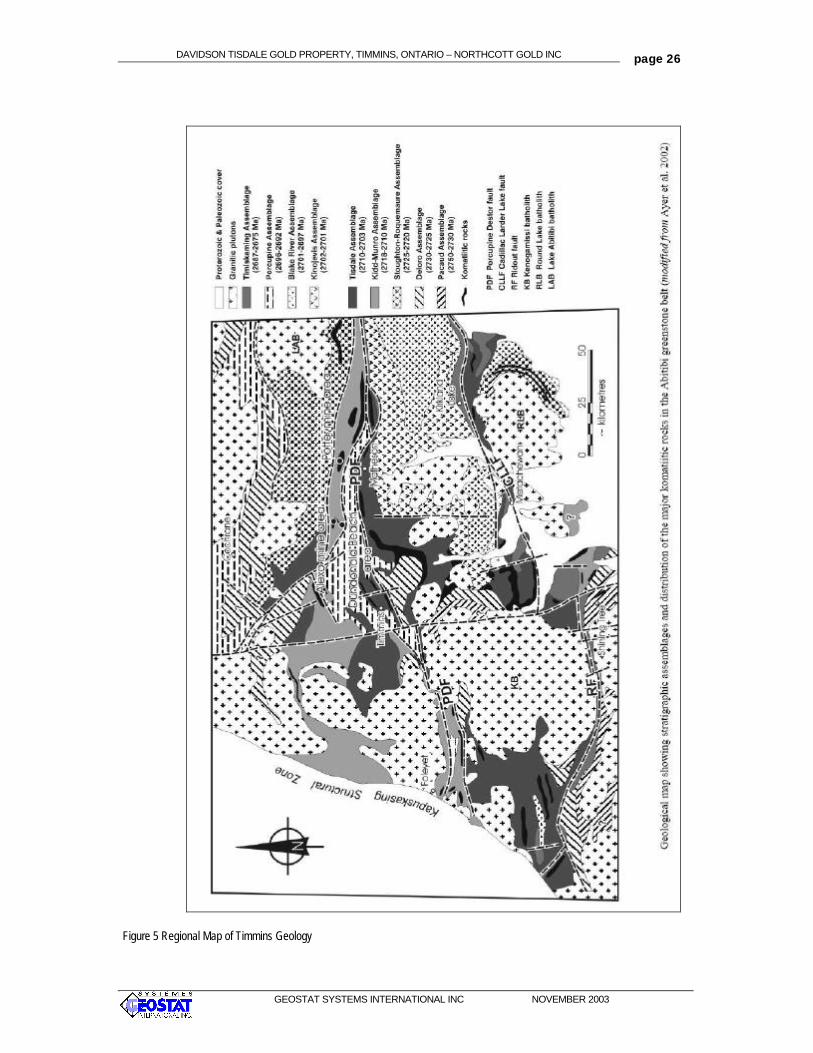
The Timmins District encompasses a vast portion of the province and is underlain by diverse geology. Portions of the Superior and Southern structural provinces of the Canadian Shield and Phanerozoic rocks are all present in the District.
In the north, Paleozoic and Mesozoic sediments of the Hudson Bay and Moose River basins comprise the bedrock geology, punctuated by Proterozoic rocks of the Sutton Inlier. Paleozoic rocks of the Moose River Basin unconformably overlie Archean rocks of the Superior structural province. The contact between Phanerozoic and Archean rocks is faulted, such that Arctic drainage tumbles as rapids, cataracts and waterfalls from the higher southern Archean bedrock surface to the Paleozoic lowlands.
Archean rocks include crustal plutonic rocks, greenstone volcanic rocks and metasedimentary foreland basin rocks, distributed in broad, east trending subprovinces that cross the District. Greenstone and greystone belts are intruded by voluminous, regionally extensive batholiths of tonalite, trondjemite and granodiorite composition and lessor amounts of mafic intrusions.
Proterozoic dike swarms with consistent orientations intrude Archean rocks throughout the District. Carbonatite-alkalic complexes are locally significant. Minor amounts of exotic rocks including kimberlite, lamprophyre and alnoites intrude both Archean and Phanerozoic rocks of the district.
Proterozoic metasedimentary rocks of the Cobalt embayment finger northward and overlie Archean rocks south of Timmins.
Archean subprovinces within the Timmins District include the following:
n Abitibi/Wawa Subprovince rocks underlie most of the south part of the District. These are lithologically diverse metavolcanic rocks with a wide variety of intrusive suites and lessor amounts of chemical and clastic metasedimentary rocks. Abitibi/Wawa rocks are a major source of Ontario’s and Canada’s mineral wealth. Individual greenstone belts within the subprovinces are intruded, deformed and truncated by intervening felsic batholiths.
n Quetico/Opatica Subprovince rocks outcrop between Abitibi/Wawa subprovince and Phanerozoic rocks of the Moose River Basin. The rocks are predominantly clastic sediments and metamorphosed schists and gneisses of sedimentary origin. Such rocks comprise the greystone belts of the province.
Erosion throughout geologic time has resulted in peneplanation of the Archean rocks; hence topography throughout the District is subdued. Glaciation during the Pleistocene has resulted in widespread drift cover of unconsolidated Quaternary sediments. Extensive till sheets, glaciolaustrine clays and glaciofluvial deposits blanket much of the bedrock. Many outcrops are glacially striated, permitting reconstruction of the latest glacial history. The bedrock surface continues to rebound since Pleistocene times and moderate earth tremors with shallow epicentres and low magnitudes are occasionally felt throughout the Timmins District.
The map below depicts the general geology of the Timmins District.
DAVIDSON TISDALE GOLD PROPERTY, TIMMINS, ONTARIO – NORTHCOTT GOLD INC
GEOSTAT SYSTEMS INTERNATIONAL INC NOVEMBER 2003
page 26
Figure 5 Regional Map of Timmins Geology

DAVIDSON TISDALE GOLD PROPERTY, TIMMINS, ONTARIO – NORTHCOTT GOLD INC
GEOSTAT SYSTEMS INTERNATIONAL INC NOVEMBER 2003
page 27
Local Geology
The Davidson Tisdale property was mapped in 1936 by D.R. Derry on behalf of Ventures and again in 1984 and 1985 by D.W. Broughton and R.G. Roberts on behalf of Getty.
The property is located in the Porcupine Gold Camp, along the possible offset easterly projection of the Hollinger-Macintyre trend. The property is underlain by a sequence of overturned easterly striking, northward dipping, pillowed and massive, magnesium tholeiitic volcanic flows of the Tisdale Group. (See Figure 6 Local Geology Map) In the southernmost part of the property there are outcrops of the distinctive V8 variolitic flows, underlain by a massive flow (“99”), which forms the basal member of the iron tholeiitic group. Minor graphitic sediments containing some pyrite and pyrrhotite have been noted locally on the property.
Alteration on the property is widespread, consisting of a low-grade calcite-chlorite envelope enclosing a higher-grade quartz-sericite-ferro dolomite or ankerite core. Alteration was not well documented in the drill logs database and has been recorded as somewhat patchy at the margins. The alteration is largely, if not entirely pre-faulting.
The abundance of faults is one of the most prominent features of the Davidson Tisdale property. Three distinct fault sets have been identified from underground workings on the property (Watts, Griffis, and McOuat, 1988). The faults are moderate to strong shear zones up to two metres in thickness. All known ore blocks lie within or very close to these faults. The “Main Fault” strikes 060º and dips 50º to the north. There is a set of faults, which generally parallel the main fault, but dip at 60º to 75º to the north. The second set of faults strikes 025º and dips northwest at 60º to 65º. These have been noted between fourth and fifth levels, representing a dilatant zone between two 060º structures. They contain prominent short veins, locally with gold mineralization. The third set trends 080º, dipping 30º to the north. These are limited to the east end of the workings and contain large “blow-outs” of quartz with erratic gold grains.

DAVIDSON TISDALE GOLD PROPERTY, TIMMINS, ONTARIO – NORTHCOTT GOLD INC
GEOSTAT SYSTEMS INTERNATIONAL INC NOVEMBER 2003
page 28
Figure 6 Local Geology Map
DAVIDSON TISDALE GOLD PROPERTY, TIMMINS, ONTARIO – NORTHCOTT GOLD INC
GEOSTAT SYSTEMS INTERNATIONAL INC NOVEMBER 2003
page 29
Deposit Types
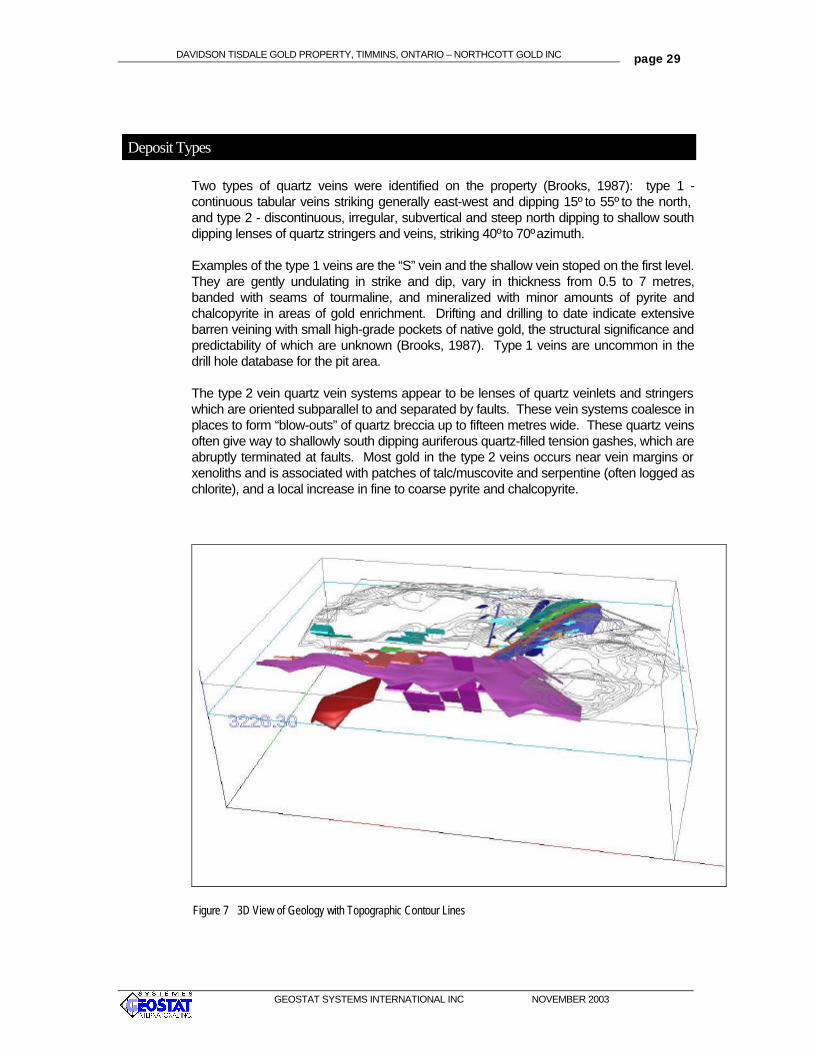
Two types of quartz veins were identified on the property (Brooks, 1987): type 1 - continuous tabular veins striking generally east-west and dipping 15º to 55º to the north, and type 2 - discontinuous, irregular, subvertical and steep north dipping to shallow south dipping lenses of quartz stringers and veins, striking 40º to 70º azimuth.
Examples of the type 1 veins are the “S” vein and the shallow vein stoped on the first level. They are gently undulating in strike and dip, vary in thickness from 0.5 to 7 metres, banded with seams of tourmaline, and mineralized with minor amounts of pyrite and chalcopyrite in areas of gold enrichment. Drifting and drilling to date indicate extensive barren veining with small high-grade pockets of native gold, the structural significance and predictability of which are unknown (Brooks, 1987). Type 1 veins are uncommon in the drill hole database for the pit area.
The type 2 vein quartz vein systems appear to be lenses of quartz veinlets and stringers which are oriented subparallel to and separated by faults. These vein systems coalesce in places to form “blow-outs” of quartz breccia up to fifteen metres wide. These quartz veins often give way to shallowly south dipping auriferous quartz-filled tension gashes, which are abruptly terminated at faults. Most gold in the type 2 veins occurs near vein margins or xenoliths and is associated with patches of talc/muscovite and serpentine (often logged as chlorite), and a local increase in fine to coarse pyrite and chalcopyrite.
Figure 7 3D View of Geology with Topographic Contour Lines
DAVIDSON TISDALE GOLD PROPERTY, TIMMINS, ONTARIO – NORTHCOTT GOLD INC
GEOSTAT SYSTEMS INTERNATIONAL INC NOVEMBER 2003
page 30
Mineralization
Following the Phase 1 underground program Getty personnel commented on the nature of the mineralized zones:
• In the vicinity of the Main Shaft gold occurs in a quartz stringer zone associated with a strong shear and sericite-carbonate alteration halo
• Though the quartz conforms to the shearing along strike, it cross cuts the shearing down dip
• Locally the stringer zones are very irregular and contain very erratic gold values
• Individual veins dip steeply to 90º at the center of the system and locally flatten to 0º, suggesting a sigmoidal pattern
• Interpretation of surface drilling had suggested a “sheet-like” vein system dipping about 45º NW.
• Underground, the gold mineralization was seen to be largely confined to a series of steeply dipping, en echelon quartz vein fracture systems occurring within the overall 45º dipping structure.
The geometry of the mineralized zones is as follows:
• Strike lengths of up to 40 m
• Widths of 2 to 4 m
• Dip lengths of about 12 m
• Upper and lower contacts plunging 20º and 70º to the west
• Dip is near vertical
Mineralized zones are en echelon lining up within an envelope having a dip of 45º N and striking 060º
DAVIDSON TISDALE GOLD PROPERTY, TIMMINS, ONTARIO – NORTHCOTT GOLD INC
GEOSTAT SYSTEMS INTERNATIONAL INC NOVEMBER 2003
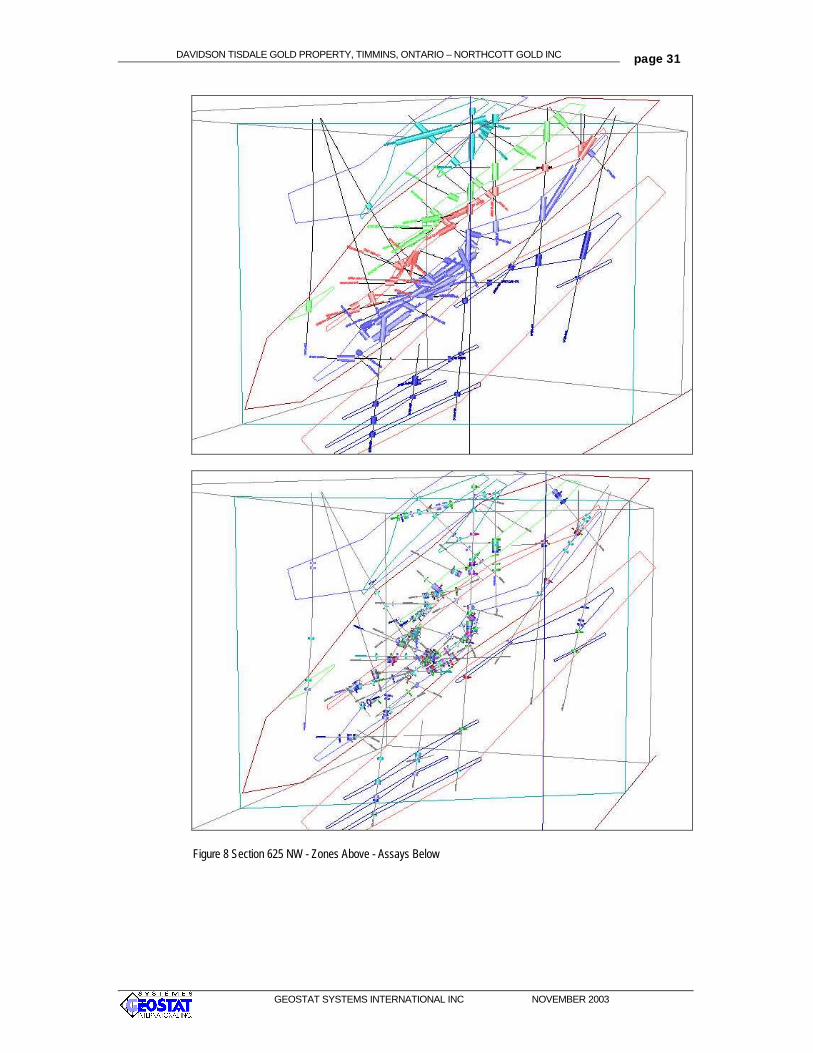
page 31
Figure 8 Section 625 NW - Zones Above - Assays Below

DAVIDSON TISDALE GOLD PROPERTY, TIMMINS, ONTARIO – NORTHCOTT GOLD INC
GEOSTAT SYSTEMS INTERNATIONAL INC NOVEMBER 2003
page 32
Figure 9 Section 750 NW - Zones Above - Assays Below

DAVIDSON TISDALE GOLD PROPERTY, TIMMINS, ONTARIO – NORTHCOTT GOLD INC
GEOSTAT SYSTEMS INTERNATIONAL INC NOVEMBER 2003
page 33
Figure 10 Section 875 NW - Zones Above - Assays Below

DAVIDSON TISDALE GOLD PROPERTY, TIMMINS, ONTARIO – NORTHCOTT GOLD INC
GEOSTAT SYSTEMS INTERNATIONAL INC NOVEMBER 2003
page 34
Exploration
Modern Exploration
The period from 1983 to 1987 witnessed the most extensive and integrated exploration of the property. Efforts were concentrated in the known areas of old showings and workings, with very little property-wide exploration. It was during this period that resources and reserves were developed and the potential of the property quantified for the first time.
Davidson-Tisdale (1983-1984)
In early 1983 a new group assumed control of Davidson Tisdale Mines Limited and an extensive surface and underground exploration program was carried out. New grids were established; ground geophysical surveys (magnetics, VLF-EM, Maxmin II HEM and Pulse EM) were completed. A thorough compilation of all available data was completed by Kirwan who recommended an extensive, though flexible, program.
The following program was completed during 1983:
• Extensive stripping in the Main Shaft area uncovered numerous occurrences of free gold (VG) over an area greater than 600 ft long. Smith Vet & South Shaft areas were stripped but not mapped while trenching and stripping at Cal’s Dome showed high gold values in quartz veins in sediments. Kirwan notes that VLF surveys show this sedimentary horizon to extend across the property.
• Stripping uncovered “an exciting occurrence” at the intersection of NW and NE trending quartz vein systems (the T-Zone). Gold occurs in thin quartz veins underlain by highly carbonated volcanics with VG.
• Extensive percussion drill sampling was carried out in the Main Shaft and T-Zone areas to test for open pit potential.
• Twenty-three holes comprising 2,125 m were drilled in the Main Shaft area.
• The underground workings were de-watered and rehabilitated followed by extensive sampling, assaying and geological mapping. No underground drilling was undertaken.
One of the most significant conclusions from the 1983 program was the demonstration that the major vein system in the Main Shaft area strike at 030º with a 45º northwesterly dip rather than the 70º striking and 70º dipping structure as previously thought and which had guided previous exploration.
1994-2003
Limited exploration work has been completed since 1993. Northcott did some drilling before 2003 but the results were not available for this report, except a short drilling program done by Vedron in October 2003 near the main shaft, which confirmed the geology and grades.

DAVIDSON TISDALE GOLD PROPERTY, TIMMINS, ONTARIO – NORTHCOTT GOLD INC
GEOSTAT SYSTEMS INTERNATIONAL INC NOVEMBER 2003
page 35
Drilling
Numerous drilling programs have been undertaken on the property since the initial work in 1911. Approximately 48,000 m of drilling has been drilled in over 300 holes. (Table 1 Drilling Programs Historic) The following table shows the statistics on the surface drilling as compiled from the reports available in the public domain.
Much of this drilling was infill and shallow around the known occurrences. Some deep holes were drilled and the deepest intersection of the Getty drilling showed the zone to be present at a depth in excess of 400 m. The Midas Minerals drilling was aimed at investigating the down plunge extension of the zones and “one or two significant intersections” have been verbally reported.
Table 1 Drilling Programs Historic
A seven-drill hole program was carried out in October 2003 by Vedron, who have an option agreement with Northcott Gold. The program was executed successfully to demonstrate the existence of the reported mineralisation near the main shaft.
The current database has 308 drill holes from surface accounting for 41,898 meters of core drilling including 6,592 samples, plus 287 underground drilling for 10,437 meters of core including 4,852 samples. See Table 2 Drilling Database Status Report.

DAVIDSON TISDALE GOLD PROPERTY, TIMMINS, ONTARIO – NORTHCOTT GOLD INC
GEOSTAT SYSTEMS INTERNATIONAL INC NOVEMBER 2003
page 36
Table 2 Drilling Database Status Report
LENGTH Nb DH Nb Smp LENGTH Nb DH Nb Smp LENGTH Nb DH Nb Smp1980 399 17 42 399 17 421983 4,577 35 2,390 4,577 35 2,3901984 16,750 86 1,375 16,750 86 1,3751985 1,458 14 267 448 13 203 1,906 27 4701986 5,259 48 1,346 2,421 91 1,753 7,680 139 3,0991987 13,065 99 1,048 7,569 183 2,896 20,633 282 3,9442003 390 9 124 390 9 124
Total 41,898 308 6,592 10,437 287 4,852 52,335 595 11,444
Surf U/G TotalYEAR

DAVIDSON TISDALE GOLD PROPERTY, TIMMINS, ONTARIO – NORTHCOTT GOLD INC
GEOSTAT SYSTEMS INTERNATIONAL INC NOVEMBER 2003
page 37
Sampling Method and Approach
An extensive program of sampling underground was carried out by Getty in 1987. See bulk sample tables in Appendix. It shows the results of the various types of samples that were taken to determine the reliability of grade determination according to the sampling method. The results are relatively conclusive and indicate the drill core samples grade can match the other types of samples when the high grade is capped at 34.28 g Au/t.
This value of 34.28 g Au/t is all too familiar to gold miners. It is the round value of 1 on Au per short tonne of ore converted to grams per metric tonnes. The historic economic cut-off grade used on this project came from the same kind of unit conversion: 1.7 and 3.4 g Au/t. This old rule of thumb is once again proven to be generally accurate on average in this series of test comparing drill holes samples generally cut in 0.5 meter length (which is not the 1.5 meter or 5 feet ‘industry standard’ length) to muck samples, panel samples, back channel samples and a sample tower. The conversion of this arbitrary grade-capping factor to metric using 4 significant digit does not make it more valid or statistically correct to use.
It happens to be convenient that this factor produces a drill hole sampling average that matched the results from all other methods. In fact, these other methods represent either larger samples and/or better controlled samples because of the geological visual check which is not available while drilling. The convenience of this practice does not prove or disprove it usefulness. On the other hand, when the comparison of all the sampling averages is compared line by line in the tables, it is possible to see a relatively good correlation between all samples except diamond drilling samples, in spite of the cutting of high grade.
In fact, this confirms the observation by D.S. Rogers at Dome mine presented in 1981 at the CIM in Calgary (See References). In other words, it is possible to have the diamond drill assays match the resource grade in the bulk part on average, but local variation can be considerable. What was not mention about the test like many similar test in gold mines is that strong sampling variances are inherent to discrete samples such as diamond drill holes in gold, especially when coarse gold (nuggets) are common as is the case in Timmins, the Davidson-Tisdale property included. Dividing the core into small length such as 0.5 m in most of this property drilling compound the sampling grade variance. This is typically confused with potential problems of sample preparation and assaying. Those last two elements are important but using the whole core as an escape way as suggested in some reports about the property is not acceptable any more and it would not fix the problem. The diamond drilling sampling variance is obvious on the sections (See section on Mineralization). Samples that are too small increase the nugget effect by overestimating the areas indicated by high grade DH samples and, conversely, underestimating the area near low grade DH samples known to be in mineralisation zones.
This is why DH samples must be considered in small clusters, not individually, in relation to the local geology, while bulk sampling methods should be given a favourable place to determine the resource grade. Hence the importance of the method of work used by the old gold miners (with sparse drilling but development instead) as well as by Getty underground activity in the 1980’s.

DAVIDSON TISDALE GOLD PROPERTY, TIMMINS, ONTARIO – NORTHCOTT GOLD INC
GEOSTAT SYSTEMS INTERNATIONAL INC NOVEMBER 2003
page 38
Sample Preparation and Security
In the past, it is reported that most samples came from drill core that was split and analysed using a standard sample preparation with a fire assay. There was a recommendation to use the whole core instead of the split core in 1987 (?). Although a larger size sample is always more accurate by definition, the theoretical precision gained does not increase significantly. According to current industry standards, especially policy 43-101, it is highly recommended that split core be kept for the record, audit and verification. It is possible to have split core using larger tubing for drilling and still have the higher weight from half the core to obtain a better assay.
On the other hand, a bulk sample approach is highly recommended when coarse gold is frequent as is the case on the property. Many drill log report the presence of VG where the corresponding assays do not match well. Past experience (see previous section) has demonstrated that it is relatively easy to improve the results of sampling by combining drilling with other more direct method of measuring the grade of gold.
Geostat spent only one day on the property and took only one sample. It had a very low grade, but VG was observed in the rock where the sample was taken. In this case, the presence of coarse gold and sampling variance it induces is much more of a problem to determine the resource grade reliably than other aspects of security. If and when bulk samples are used, the security issue is different.
There was no security problems reported in the past to the best of our knowledge.

DAVIDSON TISDALE GOLD PROPERTY, TIMMINS, ONTARIO – NORTHCOTT GOLD INC
GEOSTAT SYSTEMS INTERNATIONAL INC NOVEMBER 2003
page 39
Data Corroboration
Combining the gold recovered from the 1988 milling program and that recovered from early stamp mill and mercury amalgamation, approximately 9,740 oz Au have been recovered from some 51,600 short tonnes for an average recovered grade of 0.19 oz Au/ton (6.51 g Au/tonne). It must be noted that these recoveries will be low due to the inefficiency of the older mercury amalgam methods and the problems with the Go-Mill test work.
The bulk sampling (or small scale production) mention above demonstrates that commercial gold can be extracted from the mineral resource on the property. On the other hand, some difficulties appear to have arisen in understanding of the size of the mineral resources. Part of this difficulty comes from the geological interpretation and part comes from the reliability of drilling.
These two issues are common in gold ores, but Timmins has a very rich experience that should benefit local projects such as Davidson-Tisdale.
The presence of coarse gold grains is challenging in determining the grade of the resource. The fact is that diamond drill samples are too small to be accurate in this type of mineralisation to determine the exact concentration of gold in the rock at each specific location samples are taken. As a result and among other things, it has been suggested that core samples should be assayed entirely, instead of being split on the property. On the other hand, samples are very short (0.5 m to 1.0 m).
These phenomena have best been described by D.S. Rogers, chief geologist at Dome Mines Ltd, in a paper presented at the CIM in 1981. His paper talks about the Dome mine experience over 72 years (in 1981) in using diamond drilling for ore definition. The Dome mine is only a few kilometers from the Davidson-Tisdale property. The paper statistics are based on 22,000 holes totaling about 4,290,000 feet of drilling (over 1,000 kilometers). It goes on to say that in spite of having relatively high grade ore (0.30 oz/t or 9 g Au/t) 50% of drill samples in mined area returned assays with less than 0.05 oz/t (1.5 g Au/t). In fact, Rogers says that on a stope-by-stope basis, only 20% to 50% of diamond drill samples returned grades better than 0.05 oz/t. He goes on saying that muck samples from the stopes typically produce average grade two to three times higher than the diamond drill holes. He concluded that between 1950 and 1980, the ratio of tons milled per foot of drilling was 9 tons/DH and the costs of drilling never exceeded 5% of mining cost. Drilling should be in line with those factors, he suggested.
Drilling is required to establish the geological model. It can only be used to determine the grade to a certain extent. Grade determination is an essential part of outlining the resource volume, etc. This report shows that estimating the resources with 130 drill holes (Geostat 1985) or 586 holes (Geostat 2003) do not significantly change the resource estimate as long as the same criteria are used. Hence, drilling should be used parsimoniously in conjunction with bulk sampling and mining to confirm the geological model, including grade determination. Split core should be used all the time. Drilling systematically with the same core size (at the most suitable angle with respect to the geological structure) is more commendable than constantly changing habits for the sake of using the latest technology or drilling at all cost. The lack of accuracy of drill samples must be compensated by having a larger number of systematic samples to reduce the local grade estimation variance (or

DAVIDSON TISDALE GOLD PROPERTY, TIMMINS, ONTARIO – NORTHCOTT GOLD INC
GEOSTAT SYSTEMS INTERNATIONAL INC NOVEMBER 2003
page 40
margin or error) and that should be done with relatively short drill hole such as what was done underground, unless drilling is done specifically for exploration. In this last instance, drill targets should be properly determined using a solid geological model in case drill samples don’t give positive results, to pursue the effort if required, since core assaying will be negative most of the time even in potentially ore grade material such as quartz veins.
Table 3 Bulk Sample and Production Data
Bulk sample and Production data Year Tonnes Au Ag 1918 8,501 8.90 1987 5,220 7.31 1988 43,850 5.48 4.16
57,571 6.15

DAVIDSON TISDALE GOLD PROPERTY, TIMMINS, ONTARIO – NORTHCOTT GOLD INC
GEOSTAT SYSTEMS INTERNATIONAL INC NOVEMBER 2003
page 41
Adjacent Properties
Figure 11 Adjacent Property Location Map
A list of all Timmins gold mines is in Appendix. Timmins is the most productive area of gold in Canada with more than 65 million ounces of gold to its account in the last 100 years. The Tisdale-Davidson property is within a few kilometres from some of the most famous gold mines in the region. Among them are the Macintyre west of the property and Pamour-Hollinger east of the property.

DAVIDSON TISDALE GOLD PROPERTY, TIMMINS, ONTARIO – NORTHCOTT GOLD INC
GEOSTAT SYSTEMS INTERNATIONAL INC NOVEMBER 2003
page 42
Mineral Processing and Metallurgical Testing
1911-1924
In 1918 electricity was brought in to the site and a 10-stamp mill operated at 30 tons per day till it burned down in 1924. A reported total of 8501 tonnes @ 8.9 g Au/t was milled and 2,438 ounces of gold recovered using mercury amalgamation. It is noted that about 20% of the gold content was lost using this process.
1988 Milling Program - Davidson Tisdale
The custom milling of the Davidson Tisdale ore at the Go-Mill ran from April to November 1988. A total of 43,850 short dry tons was processed for a metal recovery of 7,302 oz gold and 5,665 oz silver. This gave a recovered grade of 0.16 oz Au/ton (5.48 g/tonne) and 0.13 oz Ag/ton (4.16 g/tonne). The average milling rate was 212 tons/day and it is estimated that problems that arose caused the plant to operate at less than 50% efficiency during the test period. Other problems arose and it was concluded that the test milling was not a success.

DAVIDSON TISDALE GOLD PROPERTY, TIMMINS, ONTARIO – NORTHCOTT GOLD INC
GEOSTAT SYSTEMS INTERNATIONAL INC NOVEMBER 2003
page 43
Mineral Resource and Mineral Reserve Estimates
Methodology
The old gold miners (1920-1950) defined the reserves of their gold mines with underground workings using sparse drilling. This method provides the mine with very short term reserves (few years at best) and practically no resources outside the reserves.
From 1981 to 1985, 134 diamond drill holes had been drilled when GSII did a resource estimate using a 2D model with Kriging to calculate the grade and thickness of the Lower, the Upper and S zones.
Reportedly, Getty used the polygonal method until 1987. This method is biased in this case because it is highly selective on an individual drill hole basis which tends to overestimate their surroundings. It leads to estimate the resources as a smaller tonnage at a higher grade, indicating a similar metal content as the study by Geostat. Mining cannot be so selective as to separate the ore blocks by diamond drill holes. Sampling variance command the use of a better modelling technique than that of the polygonal method.
Given the fact that 586 drill holes were available for this study, a 3D block model was used to estimate the resources.
The block model was made from SMU (small mining units) of 2m by 2m by 2m. It extends from 9400 to 10350 East and from 9500 to 10400 North. Vertically, it was allowed to reach the elevation of 3100, about 225 m from the surface. It covers the whole area with drill holes.
A density of 2.8 (SG) was used in all calculations for tonnages.
Two search ellipsoid definitions were used to follow each trend in the strike and dip of the vein systems, in the Main Zone (Az 50°/40° dip) and the flat S zone (Az 90°/25° dip). The Main zone is actually made of two set of ‘veins’ with Az 30° and 60° and dips of 35° and 60° respectively. An average orientation was used with a broad search ellipsoid to allow Kriging to sort out the ‘best connectivity’ between the local samples because the veins are actually folded and faulted. Various runs were made to obtain this final ‘optimal’ result. The maximum search radius used was 50 m by 50m by 15 m with a Cut grade of 30 g Au/t and 15m by 15m by 5m for samples between 30 and 50 g Au/t. Composited samples with value above 50 g Au/t were ‘cut’ to 50 g Au/t. The variography was set according to the data analysis to 15 m maximum range on strike and dip to 4m across the zones. A minimum of 6 samples and a maximum of 12, with no more than 3 samples from the same drill hole, was used to compute the grade of each block (SMU 2x2x2 digit) with a nugget effect about 43% of the sill (sample variance).

DAVIDSON TISDALE GOLD PROPERTY, TIMMINS, ONTARIO – NORTHCOTT GOLD INC
GEOSTAT SYSTEMS INTERNATIONAL INC NOVEMBER 2003
page 44
Classification
The classification was based on the following specific criteria, other than those prescribed by the CIM Standards on Mineral Resources and Ore Reserves:
• Measured: areas drill with underground holes with less than 15 m spacing.
• Indicated: areas with both surface and underground drilling spaced between 15 m and 25 m.
• Inferred: areas with drill spacing between 25m and 50m along known geological gold bearing features.
Warning:
Currently, there is no mine plan and no resources were classified as reserves. The current grade and tonnage reported should be considered as in situ (in the ground) resources before mining (57,517 tonnes at 6.15 g Au/t), without dilution or mine recovery factors being applied.

DAVIDSON TISDALE GOLD PROPERTY, TIMMINS, ONTARIO – NORTHCOTT GOLD INC
GEOSTAT SYSTEMS INTERNATIONAL INC NOVEMBER 2003
page 45
List of Resources
Table 4 Historical Resource Estimate
The table above reproduces the numbers most frequently published in previous resource estimates. It should be noted that the method used does not comply with the current CIM Standards on Mineral Resources and Ore Reserves, which was published in August 2000.
Among other things, the numbers most frequently published did not include a Cut grade of high samples (maximum value). Usually, that calculation was done using 34.28 and 64.56 g Au/t , that is the equivalent values of 1.0 and 2.0 on Au per short ton (Imperial system). For the current updated resource estimates, those arbitrary numbers were set and replace with 30 and 50 g Au per metric tonne where applicable.
Conversely, the numbers most frequently published used a cut-off grade for low-grade resource blocks (minimum value) of 1.7 and 3.4 g Au/t, that is the equivalent values of 0.10 and 0.05 on Au/t in the Imperial unit system. For the current updated resource estimates, those arbitrary numbers were set and replace with 2.0 and 4.0 g Au/t in the metric unit system were applicable.
The preferred presentation format is to use high grade samples ‘cut’ at 30 g Au/t and a cut-off close to current economic limits dictated by the markets (4.0 g Au/t). On the other hand, it must be kept in mind that without a mining plan, the estimates presented here are somewhat theoretical since some high-grade resource blocks are isolated in areas of waste and, conversely, some blocks of waste are surrounded by economic grade resource blocks. Therefore, classified resources blocks are not 100% ideally located.
1985 Geostat (Kriging) 1985 Getty (Polygones)
Uncut Grades Cut-Off 1.7 Cut-Off 1.7
Class Tonnes Au g/t Class Tonnes Au g/t Proven 261,592 9.85 Indicated 247,724 13.37Probable 426,521 6.43 Inferred 432,099 12.88
Possible 1,102,406 5.38 Cut-Off 3.43
Class Tonnes Au g/t Proven 216,484 11.45 Probable 336,651 7.49 Possible 761,043 6.62

DAVIDSON TISDALE GOLD PROPERTY, TIMMINS, ONTARIO – NORTHCOTT GOLD INC
GEOSTAT SYSTEMS INTERNATIONAL INC NOVEMBER 2003
page 46
Table 5 Resources Estimate - 2003
Resources above 2.0 g Au/t cut-off grade
measured indicated Total
Tonnes Total Au g/t
Total on Au
Zones Tonnes Au g/t on Au Tonnes Au g/t on Au UPPER 213,447 4.49 30,811 133,559 4.22 18,106 347,006 4.38 48,917LOWER 114,516 4.70 17,316 22,642 3.45 2,515 137,158 4.50 19,830S_ZONE 338,480 5.50 59,837 415,045 4.52 60,383 753,525 4.96 120,219Total 666,443 5.04 107,963 571,246 4.41 81,004 1,237,689 4.75 188,967 inferred Zones Tonnes Au g/t on Au
UPPER 5,392 3.05 529LOWER 70 2.47 6S_ZONE 386,359 4.68 58,150Total 391,821 4.66 58,684 Including Resources above 4.0 g Au/t cut-off grade
measured indicated Total
TonnesTotal Au g/t
Total on Au
Zones Tonnes Au g/t on Au Tonnes Au g/t on Au UPPER 87,641 6.93 19,524 56,744 6.08 11,087 144,385 6.59 30,611 LOWER 49,882 7.17 11,493 4,846 6.65 1,037 54,728 7.12 12,530 S_ZONE 200,823 7.15 46,143 154,209 7.45 36,961 355,032 7.28 83,104 Total 338,346 7.09 77,160 215,799 7.07 49,085 554,145 7.09 126,245 inferred Zones Tonnes Au g/t on Au
UPPER 802 5.53 143 S_ZONE 190,581 6.32 38,706 Total 191,383 6.31 38,848
Warning:
Currently, there is no mine plan and no resources were classified as reserves. The current grade and tonnage reported should be considered as in situ (in the ground) resources before mining (57,517 tonnes at 6.15 g Au/t), without dilution or mine recovery factors being applied.

DAVIDSON TISDALE GOLD PROPERTY, TIMMINS, ONTARIO – NORTHCOTT GOLD INC
GEOSTAT SYSTEMS INTERNATIONAL INC NOVEMBER 2003
page 47
Other Relevant Data and Information
Sampling statistics
Five hundred and eighty six drill holes were sampled by splitting the core and used in this resource estimation. The core was cut in relatively small length of 0.5 to 1.0 m when in the known mineralized zones. The samples are not of uniform lengths. This increases discrepancies due to the presence of frequent coarse gold grains. Therefore, the samples were composited (grouped) in equal length of 1.0 meter before cutting any values, as if the original samples had been fairly and evenly cut. All samples outside the outlined zones were not taken into account for the resource estimation but the zones were drawn in a relatively broad fashion to take into account the ‘nuggety’ nature of the mineralisation. Zero value was assumed where no samples were available inside the zones. Capping or cutting of high-grade value is done in the Gemcom software at the time of computing the grades in the block model. The data in the database is kept as much as possible in its original form before applying any arbitrary rule.
Various check assays were done in the past. The reviews indicate the laboratories were very reliable, which does not mean the samples are accurate as discussed in other sections of this report. The fact that any given laboratory take a second or third scoop from the pulp or the sample bags and obtain similar assay results only prove the quality of their work is high, while the quality of the samples depends on many more geological factors.
Overall, the quality of samples is very high on the property, although the rule of about one drill hole having positive results for every three-drill holes crossing the zones is true. In other words, the values generating by the samples is consistent with the Timmins camp and they are very irregular, but the high values are frequent enough and match the geological rock type sufficiently to outline the resources in a broad fashion as long as lithology is the primary criteria.
For example, the average grade of the 475 assays (about 5% of samples) clearly classified as being in quartz veins and above 0.1 g Au/t (in other words with detectable values) is 70 g Au/t. See Figure 13. In a similar fashion, the average grade of the samples identified by one or the other geological criteria to make it belong to a specific zone and having a detectable amount of gold (above 0.1 g Au/t) averages 5 g Au/t. See Figure 14.
The sample values in the S zone are similar to the samples in the Main zone (Figure 15) with the exception of a cluster of values around 10 g Au/t (Figure 16).
More than a thousand sample value were retrieve from ERMES archives to complete the database. Most of the missing values were associated with the S zone. Without them, the S zone could not have been estimated. Many hundreds of those values are grouped values, some on as much as 16 meters with a grade of 13 g/t (GT84-077), other with grade as high as 1.254 kg Au/t over half a meter (GT84-071). See section Data at end of report.

DAVIDSON TISDALE GOLD PROPERTY, TIMMINS, ONTARIO – NORTHCOTT GOLD INC
GEOSTAT SYSTEMS INTERNATIONAL INC NOVEMBER 2003
page 48
Gold g/t
Fre
qu
ency
Co
un
t
0.100 1.000 10.000 100.000
74
148
221
295
369
LOG Normal Histogram
All Assays
Software By Gemcom
Figure 12 Assay Values Histogram
Figure 13 Histogram of Assays in Quartz Veins
Gold g/t
Fre
qu
ency
Co
un
t
0 20 40 60 80 100 120 140 160 180 2000
10
20
30
40
50
Normal Histogram
475 Assays in Quartz Veins
Software By Gemcom

DAVIDSON TISDALE GOLD PROPERTY, TIMMINS, ONTARIO – NORTHCOTT GOLD INC
GEOSTAT SYSTEMS INTERNATIONAL INC NOVEMBER 2003
page 49
Gold g/t
Fre
qu
ency
Co
un
t
0.100 1.000 10.000 100.000
53
105
158
210
263
LOG Normal Histogram
Assays by zones (avg 5 g/t)
Software By Gemcom
Figure 14 Assays in Zones (50%)
Figure 15 Assays of the Main Zone
Gold g/t
Fre
qu
ency
Co
un
t
0.100 1.000 10.000 100.000
77
154
230
307
384
LOG Normal Histogram
Main Zone
Software By Gemcom

DAVIDSON TISDALE GOLD PROPERTY, TIMMINS, ONTARIO – NORTHCOTT GOLD INC
GEOSTAT SYSTEMS INTERNATIONAL INC NOVEMBER 2003
page 50
Gold g/t
Fre
qu
ency
Co
un
t
0.100 1.000 10.000 100.0000
13
25
38
50
63
LOG Normal Histogram
Assays of S zone
Software By Gemcom
Figure 16 Assays in the S zone
Gold g/t
Fre
qu
ency
Co
un
t
0.1 1.0 10.0 100.0
98
197
295
394
492
LOG Normal Histogram
1m Composites in all Zones
Software By Gemcom
Figure 17 1m Composites Histogram

DAVIDSON TISDALE GOLD PROPERTY, TIMMINS, ONTARIO – NORTHCOTT GOLD INC
GEOSTAT SYSTEMS INTERNATIONAL INC NOVEMBER 2003
page 51
Variography
The variography of the data is fairly clear cut for gold mineralisation. It does have relatively short-range continuity of between 5 m across the vein and about 10 to 15 m on strike and dip. A study of the predominant direction of continuity has indicated a strike Az of 30° and a 60° plunge (dip) direction of 120° Az. There are other minor preferential continuity directions as mentioned by previous authors. They correspond to the various strike and dip of the veins and mineralized zones.
A detailed analyses by zone indicates that the S zone has a strike of 90° and a dip of 25° with similar range of continuity. A more detail study for individual zones/veins in the Main Zone was not conclusive. Needless to say the geological interpretation does need more work to sort out the various lenses and/or veins before the variography can be improved, if it can be improved.
Figure 18 Linear Variogram
Range [m]
Gam
ma
(H)
0 2 5 7 10 12 14 17 19 22 24
5.192
6.057
6.922
Linear Semi-variogram
BZ-CMP
Software By Gemcom
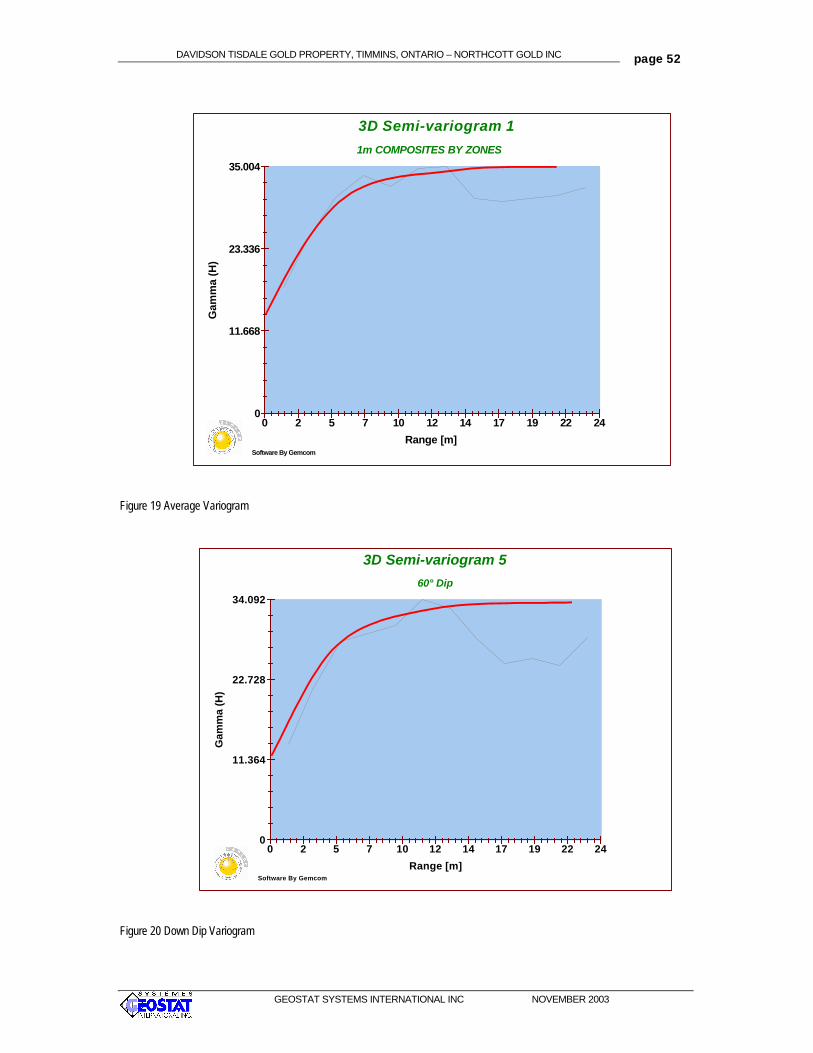
DAVIDSON TISDALE GOLD PROPERTY, TIMMINS, ONTARIO – NORTHCOTT GOLD INC
GEOSTAT SYSTEMS INTERNATIONAL INC NOVEMBER 2003
page 52
Figure 19 Average Variogram
Figure 20 Down Dip Variogram
Range [m]
Gam
ma
(H)
0 2 5 7 10 12 14 17 19 22 240
11.668
23.336
35.004
3D Semi-variogram 1
1m COMPOSITES BY ZONES
Software By Gemcom
Range [m]
Gam
ma
(H)
0 2 5 7 10 12 14 17 19 22 240
11.364
22.728
34.092
3D Semi-variogram 5
60° Dip
Software By Gemcom

DAVIDSON TISDALE GOLD PROPERTY, TIMMINS, ONTARIO – NORTHCOTT GOLD INC
GEOSTAT SYSTEMS INTERNATIONAL INC NOVEMBER 2003
page 53
Interpretation and Conclusions
In the 1980’s, drilling was commonly used to outline mineral resources according to investment requirement of that time (easy money with lowering interest rates after the 1970’s surge of inflation – aka oil companies with money to spend, etc.) and some advances in technology (hydraulic and/or electric drills) and mechanized mining (large open pits). In gold, diamond drilling and sampling is not as efficient as in other bulkier types of ore, mostly because of the nature of the gold occurrence. The Davidson-Tisdale property is no exception. From a certain point of view, it may be considered the property was drilled in excess. It was also the object of an open pit study. See Figure 21 Scope of Placer Dome Open Pit. On the other hand, the detail drilling was relatively systematic and it did demonstrate that the gold bearing structures were extensive on the property as well as in line with the regional geology. Detailed drilling and sampling was done underground in the most favourable and accessible areas, properly combined with bulk sampling (see Appendix,
Bulk Sample) and geological mapping.
On the other hand, drilling was limited to relatively shallow and easy targets compared with known gold mines in the region. The configuration of the property through the various claim ownership and options may have played a role in the fact that some areas have less work done than others. One example is the open pit study carried by Placer Dome between 1993 and 1994. It was restricted to a relatively small perimeter around the Main zone. Another example is the area around drill hole GT83-101 mentioned by P.T. George which intersected a pyritic tuff twice which return values of 0.28 oz Au/ton over 49 feet and 0.36 oz Au/ton over 30 feet. See Figure 22 Location of DT83-101 - Pyritic Tuff.
Various problems with the missing assays, survey data, topography, combining surface and u/g drill holes and so on are currently affecting the quality of the resource estimation. Geostat did various geological model to suite various interpretation of the data. In a nutshell, the various shortcomings of the stope mapping underground, the poor geology on the open pit sections, the uneven distribution of detail drilling as well as the exploration work are justified by context sensitive issues such as historical changes in the property rights and time and money constraints. On the other hand, the advantageous location of the property and the value of the existing work on it could benefit the current owner if a set of strategic tasks is properly laid out to make the best use of the current resources. Here are some examples before making our recommendations in the following section of the report. The text is extracted from personal communication. Please forgive the reflexive style of writing.
There are a number of unresolved problems and complexity with the local geology. Among them are the relation between the main zone and the S zone, mainly in the

DAVIDSON TISDALE GOLD PROPERTY, TIMMINS, ONTARIO – NORTHCOTT GOLD INC
GEOSTAT SYSTEMS INTERNATIONAL INC NOVEMBER 2003
page 54
Smith Vet T old mine shaft. In addition, there is some difficulty in explaining as to why some thickening of the ore occurred, as it does near the main zone old shaft. It may suggest local rock folding related to regional folding at first glance on drill sections, however, Ken Guy who is the Q.P. representing on the current drilling programs for Vedron, believes it is thrust faulting. Ken Guy who also worked for Getty on this project stressed that some underground flat veins mined on the 4th level were very rich (15 g Au/t), for example. He pointed out that this is a detail not highlighted by the drill holes. When it was mined, this material was mixed with the 5th level stope material which graded about 3 g Au/t, so neither can be understood without knowing that kind of detail. Another geological feature which Ken Guy explained to me for the first time (which is not written anywhere, I believe) is that the so-called Upper and Lower Zones in the Main Zone are an over simplification. It was a relief for me to hear that. I told him I saw 5 lenses in echelon which I grouped into the so-called 'Upper and Lower' zones in an attempt to match previous geological interpretation. This explains why it is difficult to make the geological interpretation. When I started, I was hesitant but I chose to make a full 3D wireframe, which is better to validate the geological interpretation, however I repeatedly encountered problems in relating my interpretation on the drill sections to the level plans. That is because on individual sections or level plans, only two lenses would show up at one time. When it was attempted to tie it all up in 3D, most times the model breaks up into 4 or 5 lenses depending what specific area you look at. I could see a comprehensive geological explanation how the various reports mentioned different sets of strike and dips for the veins, the zones, etc., but I could not make it fit in just two simple Upper and Lower zones, not to mentioned the S zone.
The current interpretation shows that there is high grade within the resource numbers produced, but the mapping should confirm that the more you focus on the rich material, the more it breaks up in a manner that it will inevitably be diluted during mining. All these concepts were put to the test by Getty and others before us. The Davidson Tisdale does have similar characteristic as the neighbouring gold mines. The potential to produce the typical Timmins’ 7 g Au/t (or more) ore material can be seen in the sampling statistics, but to demonstrate both the high grade and a continuous set of resource blocks exist requires some bulk sampling and mining experience. Much of the existing work is poorly documented at the moment. It will require going underground to make a new compilation of the geology in the Main zone and the Smith Vet T area eventually.
This has lead me to discuss of the S zone with Ken Guy. For reasons different than his, I believe that zone is barren and it has been a diversion over the years. But Ken and I converge toward the same idea in that my theory is that the S zone is basically barren and it intersects the main zone which crosses the whole region and host some of the major gold mines in Timmins (although it folds at the Dome mine and so on). What would have happen is the S zone robbed gold from the main zone. That is why we see gold only on the edges of this 4 m thick flat vein. In the Smith Vet T Zone, I believe there is another set of in echelon lenses as in the ramp area, but the S zone intersected into it just below surface, were it is seen today. The S zone appear to 'blow out' as Ken says, which means their intersection is not a cold cut through the main zone, but rather a sort of hot paste like deformed bulge. Be that as it may, the Smith Vet T area may be as interesting as the main zone to produce gold ounces, but more difficult to follow, which is why the Main Zone was the target of more drilling and mining in the past. Ken believes there is a third system at the T Zone. In a nutshell, this leaves me thinking that the most potential on the property will be found in the Main Zone on strike and down dip. Similar parallel gold bearing contacts may exist North of the Main Zone on the property. That is something to explore. On the other

DAVIDSON TISDALE GOLD PROPERTY, TIMMINS, ONTARIO – NORTHCOTT GOLD INC
GEOSTAT SYSTEMS INTERNATIONAL INC NOVEMBER 2003
page 55
hand, there is a fold axis in that area on the property that may suggest the Main Zone could increase in size at depth. The plunge of that fold is going East, making it a shallower target on the West side of the property, if this interpretation is correct and meaningful.

DAVIDSON TISDALE GOLD PROPERTY, TIMMINS, ONTARIO – NORTHCOTT GOLD INC
GEOSTAT SYSTEMS INTERNATIONAL INC NOVEMBER 2003
page 56
Figure 21 Scope of Placer Dome Open Pit
Figure 22 Location of DT83-101 - Pyritic Tuff

DAVIDSON TISDALE GOLD PROPERTY, TIMMINS, ONTARIO – NORTHCOTT GOLD INC
GEOSTAT SYSTEMS INTERNATIONAL INC NOVEMBER 2003
page 57
Table 6 Comparative Resources Estimates
1985 Geostat (Kriging) 1985 Getty (Titaro-Polygones)
Uncut Grades Cut-Off 1.7 Cut-Off 1.7
Class Tonnes Au g/t Class Tonnes Au g/t Proven 261,592 9.85 Indicated 294,324 Probable 426,521 6.43 Inferred 347,925
Possible 1,102,406 5.38 Inf.geol. 105,805
12.33
Cut-Off 3.43 Cut-Off 3.43
Class Tonnes Au g/t Class Tonnes Au g/t Proven 216,484 11.45 Indicated 217,306 Probable 336,651 7.49 Inferred 262,111
Possible 761,043 6.62 Inf.geol. 70,634
15.93
Cut Grades @ 34.28 g Au/t Cut-Off 1.7 Cut-Off 1.7
Zone Tonnes Au g/t Class Tonnes Au g/t Upper 125,042 6.59 Indicated 294,324 Lower 524,677 5.51 Inferred 347,925
S zone 675,560 3.04 Inf.geol. 105,805
7.06
Cut-Off 3.43 Cut-Off 3.43
Zone Tonnes Au g/t Class Tonnes Au g/t Upper 125,042 6.49 Indicated 217,306 Lower 367,857 6.77 Inferred 262,111
S zone 198,481 4.46 Inf.geol. 70,634
8.74
Total 691,380 6.06 Total 550,051 8.74 2003 Geostat (Kriging 3D) Cut-Off 4.0
Zone Tonnes Au g/t Upper 145,187 6.59 Lower 54,728 7.12 S zone 545,613 6.94
Total 745,528 6.89

DAVIDSON TISDALE GOLD PROPERTY, TIMMINS, ONTARIO – NORTHCOTT GOLD INC
GEOSTAT SYSTEMS INTERNATIONAL INC NOVEMBER 2003
page 58
Recommendations
A significant amount of information is available on Ermes, the Ontario computer database, including some detailed logs. A detail review of all available information should be made to retrieve the data required to complete the geological interpretation, including missing detailed assays.
An updated geological interpretation should be made based on carrying the previous task to an end. This interpretation should aim at confirming as much as possible the various conclusions that were drawn in the various programs. This task should include the underground mapping of existing development, when it becomes accessible. A detail surface geological map should be prepared, including field trips to collect new data.
The conclusion of this work should confirm targets for exploration on strike and down dip. This would include a follow up below the current ramp, also at depth NE of the current ramp, around the Smith-Vet T shaft near DH no GT84-077, West of this area and South.
The new study for a pit should be contemplated between the Smith-Vet T and the current ramp. A detail plan for the taking of a bulk sample is recommended to determine the grade of the resource with more accuracy. It would allow the testing of the DH results. This bulk sample could be taken on surface while making the current area of the property compliant with environmental requirements. Geostat would be please to propose a plan for this work based on similar experience in other projects.
The underground workings should be dewatered, mapped and sampled. The work should be laid out to define a mining plan, including defining the mining method and the size of the operation according to the resource quality and the history of Timmins gold mining.
A surface geological map should be prepared for the whole property. Additional targets to find gold mineralisation should be explored in the Northern claims, including the definition of finding such mineralisation at great depth, given the history of Timmins, to determine a long term strategic plan for the development of the property.
Drilling should be used sparsely and intelligently. The history of Timmins, as most gold mining settings, are renowned for being difficult to determine the grade and size of the resource using only drilling. The Davidson-Tisdale property is known to frequently display visible gold (‘VG’) without a corresponding response from the fire assay. This is typical of coarse gold mineralisation.
The implementation of all the task mentioned above depend on the time and money available to Northcott. This could be detailed in a pre-feasibility study and/or and exploration program with a schedule according to available resources.

DAVIDSON TISDALE GOLD PROPERTY, TIMMINS, ONTARIO – NORTHCOTT GOLD INC
GEOSTAT SYSTEMS INTERNATIONAL INC NOVEMBER 2003
page 59
References
1981: CIM Report on Diamond Drilling as an aid in ore definition at the Dome Mine for presentation at the 83rd Annual General Meeting of the C.I.M.M., Calgary - May 1981: by D.S. Rogers
1983: Report on Property Evaluation Davidson-Tisdale Mines Limited, Tisdale Township Porcupine Mining Division Ontario; NTS 42 A/11: by P.T. George.
1985: Report on summarizes the results of our recent evaluation of the Getty-Davidson Tisdale Joint Venture, property situated in Tisdale Township, Ontario: by Derry,Michener, Booth & Wahl.
1985: Getty Mines Limited Report on geological ore reserve estimates of the Getty-Davidson Tisdale Joint Venture, Tisdale Project, Timmins, Ontario: by D. Titaro.
1985: Report on site progress report for the period June 1- November 15, 1985 for Getty-Davidson Tisdale Joint Venture, Tisdale Project: by Charles G. Pitcher.
1985: Geostat Systems International Inc. on geostatistical study of the Davidson-Tisdale Gold Deposit of Getty Canadian Metals Limited: by Robert de l’Étoile.
1984-1986: Various quarterly reports for Period 1984 to 1986 for Tisdale Project: by P.T. George.
1986: 1985 Summary Report for the Getty-Davidson Tisdale Joint Venture, Tisdale Project, Timmins, Ontario; OM84-5-JV-337: by John Kita.
1984-1987: ERMES (Earth Resources and Minerals Exploration Ontario Web Site - Ministry of Northern Development and Mines), Getty Resources Limited, various drill logs.
1986-1987: Various monthly reports for May 1986 to December 1987 for Getty-Davidson Tisdale Joint Venture, Tisdale Project: by J. Ramsay.
1986-1987: Various monthly reports on Exploration on the Tisdale Project for October 1986 to June 1987 for Getty Resources Limited: by Kenneth Guy.
1987: Report on Profitability of Extracting Main and “S” Zone Reserves: by J. Tully.
1987: Report on a Surface Diamond Drill Program for Getty Resources Limited, Tisdale Project, Timmins, Ontario: by Kenneth Guy, May 1987.
1987: Report on a Surface Diamond Drill Program for Getty Resources Limited, Tisdale Project, Timmins, Ontario: by Kenneth Guy, January 1987.
1987: OMEP Report for Period March 7 to July 7, 1986 for the Getty-Davidson Tisdale Joint Venture, Tisdale Project, Timmins, Ontario; OM86-5-C-006: by John Kita.

DAVIDSON TISDALE GOLD PROPERTY, TIMMINS, ONTARIO – NORTHCOTT GOLD INC
GEOSTAT SYSTEMS INTERNATIONAL INC NOVEMBER 2003
page 60
1987-1988: OMEP Report for Period May 26, 1987 to March 31, 1988, for Getty Resources Limited for the Getty-Davidson Tisdale Joint Venture, Tisdale Project, Timmins, Ontario; OM 87-5-L-098: by John Ramsay.
1994: PLACER DOME CANADA LIMITED Report on Timmins Generative project 457E Davidson Tisdale Property Evaluation Resource Estimation, Tisdale Township, Ontario N.T.S. 42A/6, volumes I, II, III, IV: by D. Ings, D. Hunt, D. Sketchley.
1999: Report on Gold Property Tisdale Township Timmins Camp Ontario, a review and synopsis of previous exploration activity for Davidson Tisdale Mines Limited: by James M. Patterson.

DAVIDSON TISDALE GOLD PROPERTY, TIMMINS, ONTARIO – NORTHCOTT GOLD INC
GEOSTAT SYSTEMS INTERNATIONAL INC NOVEMBER 2003
page 61
Data
List of drill holes
See database on CD in back pocket.
List of some composites without detailed assays
BHID F R O M T O LENGTH SAMPLE_NO AU(G/T)
GT84-077 56.00 72.50 16.50 c m p 13.200
GT85 -125 57.30 69.60 12.30 c m p 1.160
GT84-090 164.00 172.00 8.00 c m p 1.610
GT87-257 198.50 206.00 7.50 c m p 4.840
GT87-256 192.00 199.00 7.00 c m p 3.150
GT84-057 61.50 68.00 6.50 c m p 23.560
GT84-089 146.00 152.50 6.50 c m p 1.610
GT84-072 93.00 97.00 4.00 c m p 16.250
GT87-264 33.00 37.00 4.00 c m p 1.690
GT86 -176 187.50 191.00 3.50 c m p 5.210
GT87-250 13.00 16.50 3.50 c m p 1.560
GT87-269 118.50 122.00 3.50 c m p 1.230
GT84-055 108.00 111 .00 3.00 c m p 20.800
GT84-060 231.50 234.50 3.00 c m p 1.460
GT84-073 95.00 98.00 3.00 c m p 1.940
GT84-090 65.00 68.00 3.00 c m p 4.160
GT87 -188 95.50 98.50 3.00 c m p 6.090
GT87 -195 71.50 74.50 3.00 c m p 22.090
GT85 -124 80.00 82.80 2.80 c m p 1.950
GT84-054 22.50 25.00 2.50 c m p 1.140
GT84-096 102.40 104.90 2.50 c m p 4.210
GT84-065 101.50 103.50 2.00 c m p 4.080
GT85 -123 82.00 84.00 2.00 c m p 1.070
GT85 -125 62.00 64.00 2.00 c m p 6.370
GT86 -125 182.50 184.50 2.00 c m p 1.310
GT86 -171 148.00 150.00 2.00 c m p 2.300
GT86 -171 155.00 157.00 2.00 c m p 2.490
GT87-233 174.50 176.50 2.00 c m p 1.350
GT85 -124 35.80 37.40 1.60 c m p 2.120
GT84-078 93.50 95.00 1.50 c m p 6.630

DAVIDSON TISDALE GOLD PROPERTY, TIMMINS, ONTARIO – NORTHCOTT GOLD INC
GEOSTAT SYSTEMS INTERNATIONAL INC NOVEMBER 2003
page 62
List of some High Grade Samples added to the DB by Geostat
BHID F R O M T O LENGTH SAMPLE_NO AU(G/T)
GT84 -071 187.50 188.00 0.50 c m p 1254.190
GT87-244 83.50 84.00 0.50 c m p 187.580
GT87 -197 85.00 85.50 0.50 c m p 178.360
GT84-066 100.50 101.50 1.00 c m p 30.100
GT87-278 70.50 71.00 0.50 c m p 28.600
GT87-276 76.50 77.50 1.00 c m p 27.580
GT87-258 227.00 228.50 1.50 c m p 25.840
GT87-252 74.00 74.50 0.50 c m p 24.140
GT87-279 73.50 74.00 0.50 c m p 23.800
GT84-057 61.50 68.00 6.50 c m p 23.560
GT87-229 117.50 118.00 0.50 c m p 22.220
GT87 -195 71.50 74.50 3.00 c m p 22.090
GT87 -199 91.00 91.50 0.50 c m p 20.920
GT84-055 108.00 111 .00 3.00 c m p 20.800
GT87 -196 79.50 80.00 0.50 c m p 20.440
GT87-278 66.00 66.50 0.50 c m p 17.490
GT84-072 93.00 97.00 4.00 c m p 16.250
GT87-277 68.50 69.00 0.50 c m p 15.460
GT87-243 92.70 93.20 0.50 c m p 14.850
GT84-090 180.00 181.00 1.00 c m p 13.540
GT84-077 56.00 72.50 16.50 c m p 13.200
GT87 -193 36.50 38.00 1.50 c m p 12.650
GT87-249 89.00 90.50 1.50 c m p 11.140
GT87-247 9.50 11.00 1.50 c m p 8.780
GT87 -192 111 .50 112.50 1.00 c m p 6.830
GT84-078 93.50 95.00 1.50 c m p 6.630
GT85 -125 62.00 64.00 2.00 c m p 6.370
GT87-257 95.00 95.50 0.50 c m p 6.310
GT87 -188 95.50 98.50 3.00 c m p 6.090
GT87 -199 102.00 102.50 0.50 c m p 5.940
GT87-273 69.00 69.50 0.50 c m p 5.870
GT84-052 79.30 79.80 0.50 c m p 5.700
GT87-262 77.50 78.00 0.50 c m p 5.490
GT87-256 219.50 221.00 1.50 c m p 5.420
GT84-078 212.50 213.00 0.50 c m p 5.300
GT86 -176 187.50 191.00 3.50 c m p 5.210
GT87-255 71.00 72.00 1.00 c m p 5.020
GT87-257 198.50 206.00 7.50 c m p 4.840
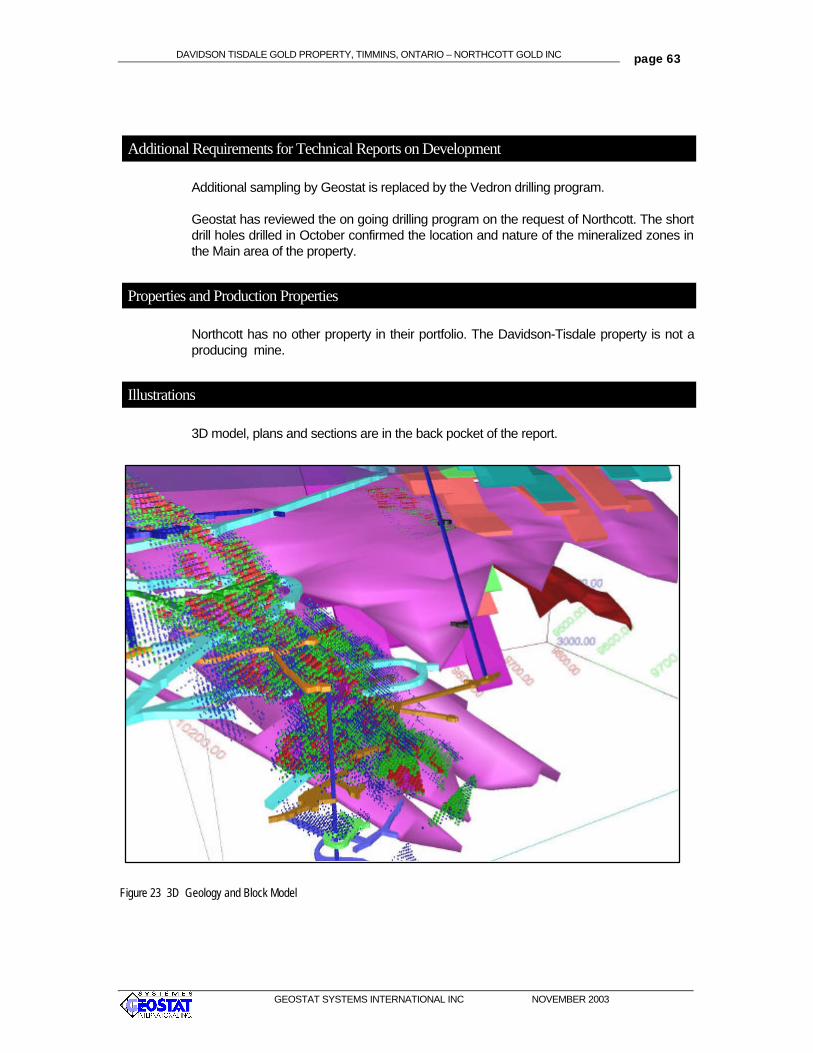
DAVIDSON TISDALE GOLD PROPERTY, TIMMINS, ONTARIO – NORTHCOTT GOLD INC
GEOSTAT SYSTEMS INTERNATIONAL INC NOVEMBER 2003
page 63
Additional Requirements for Technical Reports on Development
Additional sampling by Geostat is replaced by the Vedron drilling program.
Geostat has reviewed the on going drilling program on the request of Northcott. The short drill holes drilled in October confirmed the location and nature of the mineralized zones in the Main area of the property.
Properties and Production Properties
Northcott has no other property in their portfolio. The Davidson-Tisdale property is not a producing mine.
Illustrations
3D model, plans and sections are in the back pocket of the report.
Figure 23 3D Geology and Block Model

DAVIDSON TISDALE GOLD PROPERTY, TIMMINS, ONTARIO – NORTHCOTT GOLD INC
GEOSTAT SYSTEMS INTERNATIONAL INC NOVEMBER 2003
page 64
Figure 24 Geological Mapping, courtesy of WGM
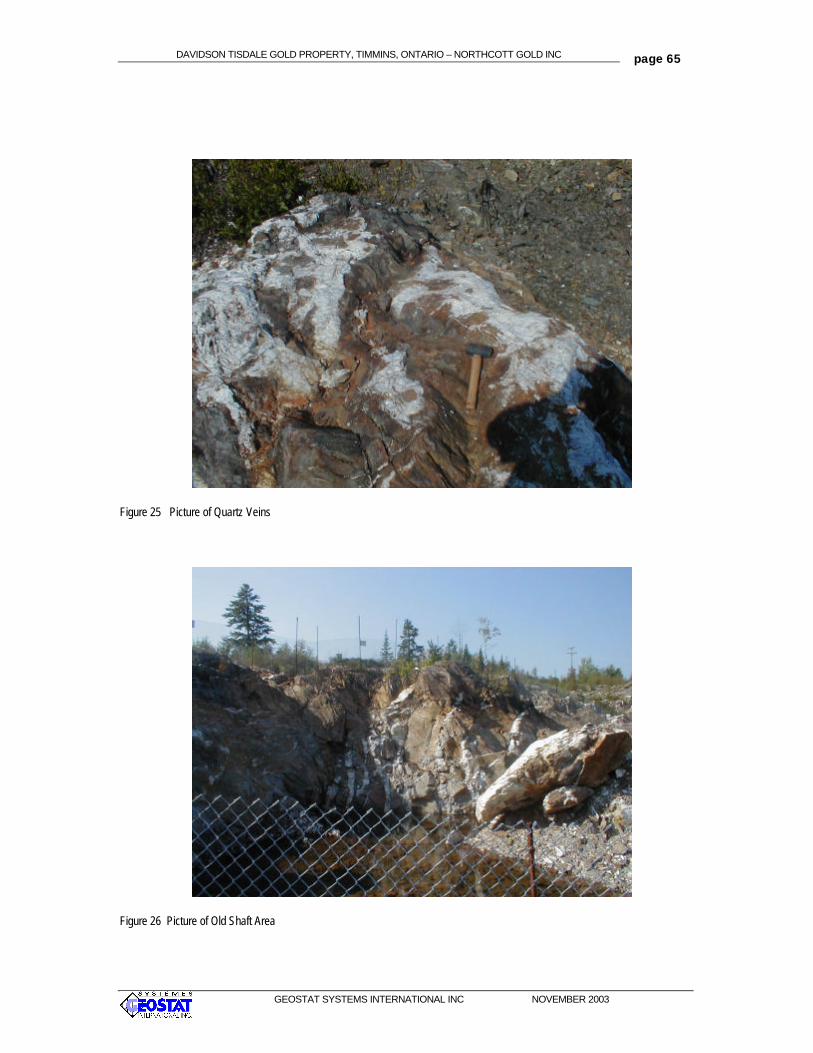
DAVIDSON TISDALE GOLD PROPERTY, TIMMINS, ONTARIO – NORTHCOTT GOLD INC
GEOSTAT SYSTEMS INTERNATIONAL INC NOVEMBER 2003
page 65
Figure 25 Picture of Quartz Veins
Figure 26 Picture of Old Shaft Area

DAVIDSON TISDALE GOLD PROPERTY, TIMMINS, ONTARIO – NORTHCOTT GOLD INC
GEOSTAT SYSTEMS INTERNATIONAL INC NOVEMBER 2003
page 66
Figure 27 Picture of Veins on Strike looking East
Figure 28 Picture from same location looking West

DAVIDSON TISDALE GOLD PROPERTY, TIMMINS, ONTARIO – NORTHCOTT GOLD INC
GEOSTAT SYSTEMS INTERNATIONAL INC NOVEMBER 2003
page 67
Figure 29 Picture of Smith Vet T area
Figure 30 Picture of Property Limits (West)

DAVIDSON TISDALE GOLD PROPERTY, TIMMINS, ONTARIO – NORTHCOTT GOLD INC
GEOSTAT SYSTEMS INTERNATIONAL INC NOVEMBER 2003
page 68
Appendix
Table 3. Gold Production in the Timmins Regional Resident Geologist District to the end of 2001.

DAVIDSON TISDALE GOLD PROPERTY, TIMMINS, ONTARIO – NORTHCOTT GOLD INC
GEOSTAT SYSTEMS INTERNATIONAL INC NOVEMBER 2003
page 69
Bulk Sample

