data source
DESCRIPTION
Data Source. Overview of the Study - PowerPoint PPT PresentationTRANSCRIPT

Data Source
Information in this presentation is derived from the Alcohol Tobacco and Other Drug Abuse Among Delaware Students Survey of 2002. The survey was conducted by The Center for Drug and Alcohol Studies, University of Delaware, and supported by Cooperative Agreement #SP08192 to Delaware's Division of Substance Abuse and Mental Health Department of Health and Social Services. This award is funded by the Center for Substance Abuse Prevention, U.S. Department of Health and Human Services. We wish to thank the Delaware Department of Education and the Delaware Drug Free School Coordinators in each school district for their help in conducting the study. The cooperation of all of the participating schools, teachers, and students is greatly appreciated and gratefully acknowledged.
Overview of the Study
Gambling questions were added to the statewide survey “Alcohol, Tobacco and Other Drug Abuse Among Delaware Students” in 1999. This survey is administered annually to all Delaware public school students in the 5th, 8th and 11th grades. All eligible schools participated. The survey is administered from January through June as an anonymous classroom administration by trained personnel from the University of Delaware. Although student participation is voluntary, few students refuse or are denied access to the survey by their parents, who have the opportunity to refuse for them.

Sample Description
Public Schools Only--80% of School Population
No Self-Contained Special Education, Alterative or Special Schools
Significant attrition rates--explains the relatively high percentage high-risk behaviors in 8th grade than in 11th grade and age of onset
for alcohol and other drugs is higher for 11th grade
•97% of the 5th grade enrollment
•84% of the 8th grade enrollment
•74% of the 11th grade enrollment.

The sample is representative of the state’s youth population:
FIFTH GRADE(N= 7,248)
EIGHTH GRADE(N=6,753)
ELEVENTH GRADE(N=4,880)
GENDER (%) Males Females
5149
5149
4951
ETHNICITY (%) White Black Latino Other
46308
16*
612767
672445
COUNTY (Ns) New Castle Kent Sussex
443714971314
393414951324
2435944911

Sample and Gambling Question
The sample consisted of 6,753 Delaware public school 8th graders and 4,880 Delaware public School 11th graders.
Information on gambling is derived from the following two questions:
1 ) How often have you gambled (bet) for money or possessions?
1) Never2) Before, but not in past year3) A few times in past year4) Once or twice a month5) Once or twice a week6) Almost every day
Lifetime gambling was created from responses 2 thru 6 above.
Past year gambling was created from responses 3 thru 6 above.
Past month gambling was created from responses 4 thru 6 above
Never gambled was created from response number 1 above.

2) Second Gambling Question (Grid)
The second question consisted of a grid in which students were asked how often during the past 12 months they did each of the following:
a) Gambled at a casino
b) Played the lottery or scratch-off tickets
c) Bet on team sports
d) Played cards for money
e) Bet money on horse races
f) Played bingo for money or prizes
g) Gambled on the Internet
h) Bet on dice games such as craps
i) Bet on games of personal skill such as pool,darts or bowling
Response categories were: 1) Never
2) Before, but not in past year3) A few times in past year4) Once or twice a month5) Once or twice a week6) Almost every day

Gambling Among 2002 Delaware 8th Graders
Past Month12%
Past Year, But Not In Past
Month19%
Lifetime, But Not In Past Year
18%
Never51%

Gambling Among 2002 Delaware 8th Graders by Gender
63%
40%37%
60%
19%
43%
6%
19%
0%
10%
20%
30%
40%
50%
60%
70%
Male Female
Never
Lifetime
Past Year
Past Month

52%
48%
30%
11%
52%
48%
31%
15%
0%
10%
20%
30%
40%
50%
60%
White Black
Gambling Among 2002 Delaware 8th Graders by Race
Never
Lifetime
Past Year
Past Month

Gambling Among 2002 Delaware 11th Graders
Never56%
Lifetime, But Not In Past Year
16%
Past Year, But Not In Past Month
19%
Past Month9%

36%
64%
45%
16%
75%
25%
12%
2%
0%
10%
20%
30%
40%
50%
60%
70%
80%
Male Female
Gambling Among 2002 Delaware 11th Graders by Gender
Never
Lifetime
Past Year
Past Month
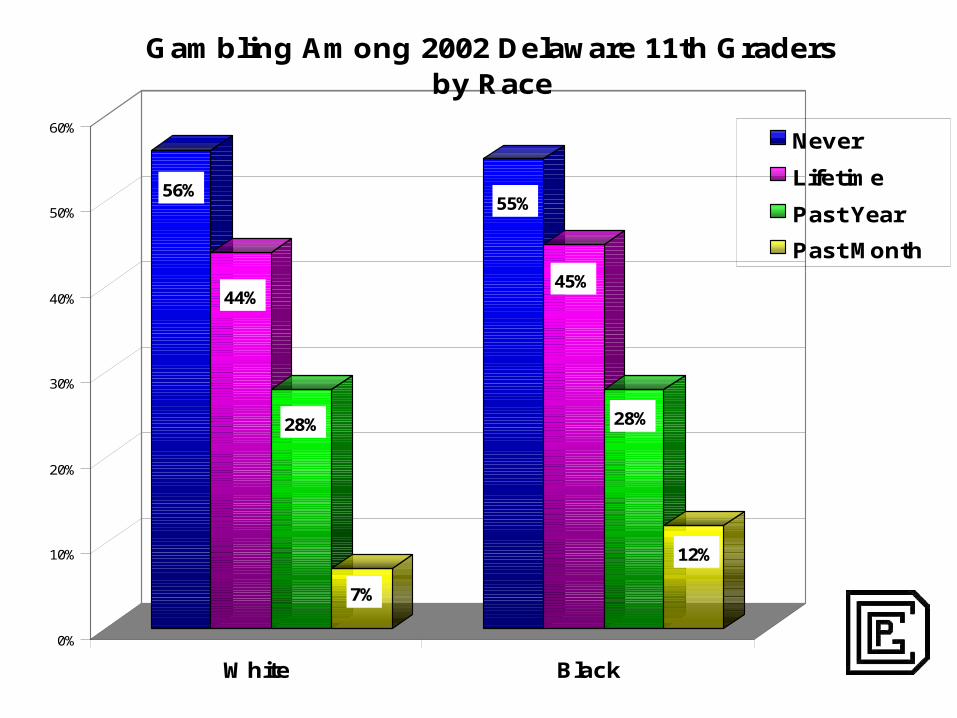
56%
44%
28%
7%
55%
45%
28%
12%
0%
10%
20%
30%
40%
50%
60%
White Black
Gambling Among 2002 Delaware 11th Graders by Race
Never
Lifetime
Past Year
Past Month

32%
57%
63%
69%
0%
10%
20%
30%
40%
50%
60%
70%
Never Gambled Gambled inLifetime
Gambled PastYear
Gambled PastMonth
Percent of Delaware 8th Graders Reporting Past Year Alcohol Use by Frequency of Gambling
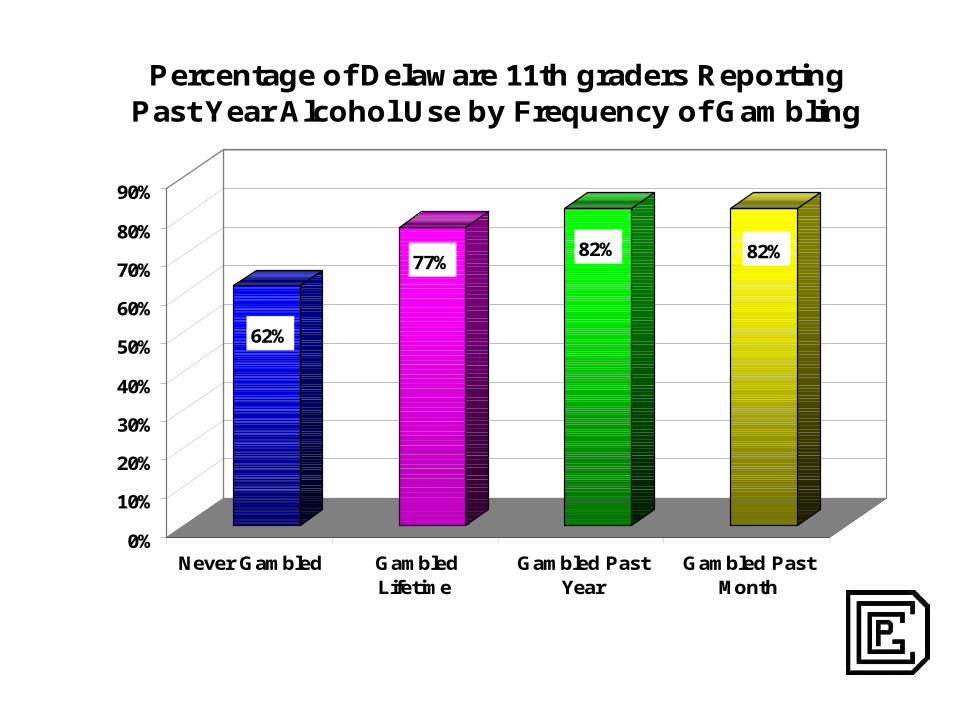
62%
77%82% 82%
0%
10%
20%
30%
40%
50%
60%
70%
80%
90%
Never Gambled GambledLifetime
Gambled PastYear
Gambled PastMonth
Percentage of Delaware 11th graders Reporting Past Year Alcohol Use by Frequency of Gambling

8%
17%
20%
28%
0%
5%
10%
15%
20%
25%
30%
Never Gambled Gambled Lifetime Gambled PastYear
Gambled PastMonth
Percent of 2002 Delaware 8th Graders Reporting Past Year Binge Drinking by Frequency of
Gambling
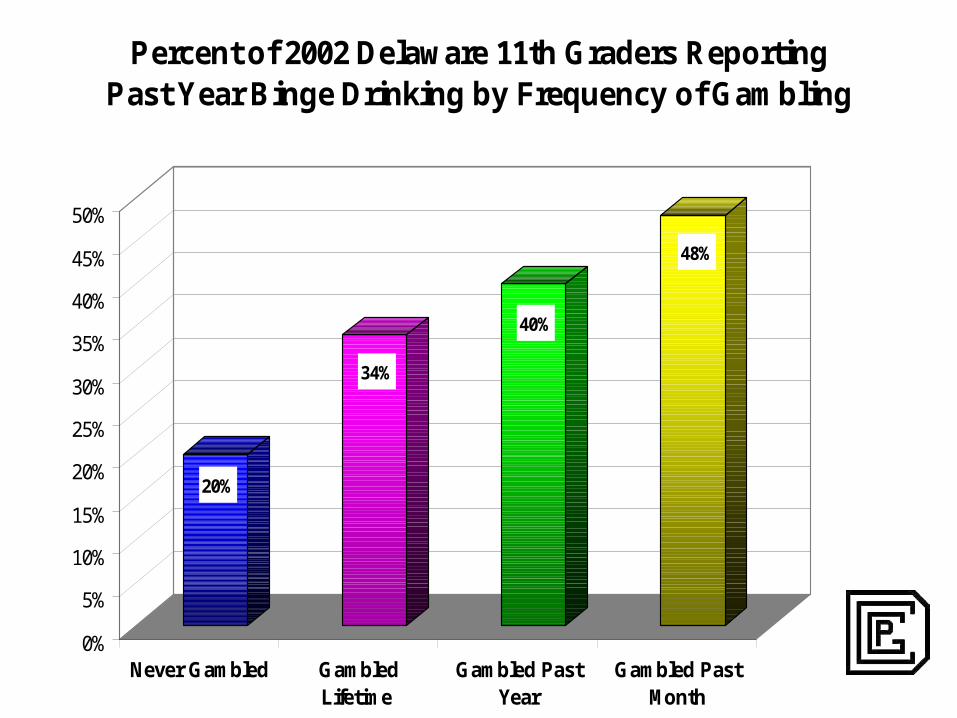
20%
34%
40%
48%
0%
5%
10%
15%
20%
25%
30%
35%
40%
45%
50%
Never Gambled GambledLifetime
Gambled PastYear
Gambled PastMonth
Percent of 2002 Delaware 11th Graders Reporting Past Year Binge Drinking by Frequency of Gambling
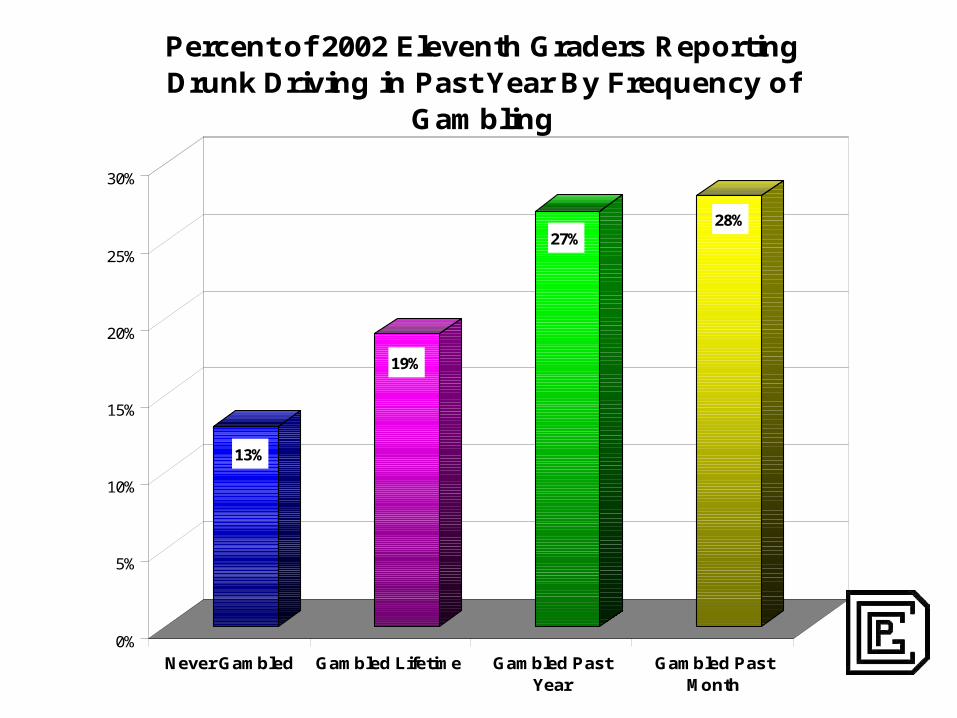
13%
19%
27%28%
0%
5%
10%
15%
20%
25%
30%
Never Gambled Gambled Lifetime Gambled PastYear
Gambled PastMonth
Percent of 2002 Eleventh Graders Reporting Drunk Driving in Past Year By Frequency of
Gambling

16%
26%
29%
34%
0%
5%
10%
15%
20%
25%
30%
35%
Never Gambled GambledLifetime
Gambled PastYear
Gambled PastMonth
Percent of 2002 Delaware 8th Graders Reporting Past Year Cigarette Use by Frequency of Gambling

27%
34%36%
42%
0%
5%
10%
15%
20%
25%
30%
35%
40%
45%
Never Gambled GambledLifetime
Gambled PastYear
Gambled PastMonth
Percent of 2002 Delaware 11th Graders Reporting Past Year Cigarette Use by Frequency of
Gambling

16%
30%
34%
41%
0%
5%
10%
15%
20%
25%
30%
35%
40%
45%
Never Gambled GambledLifetime
Gambled PastYear
Gambled PastMonth
Percent of 2002 Delaware 8th Graders Reporting Past Year Marijuana Use by Frequency of Gambling

35%
47%
51%
57%
0%
10%
20%
30%
40%
50%
60%
Never Gambled Gambled Lifetime Gambled Past Year Gambled PastMonth
Percent of 2002 Delaware 11th Graders Reporting Past Year Marijuana Use by Frequency of
Gambling

8%
20%
24%
30%
0%
5%
10%
15%
20%
25%
30%
NeverGambled
GambledLifetime
Gambled PastYear
Gambled PastMonth
Percent of 2002 Delaware 8th Graders Reporting Past Year Use of Other Illegal Drugs by
Frequency of Gambling
Other illegal drugs include prescription downers and stimulants, inhalants, hallucinogens, crack, cocaine, and heroin

15%
25%
29%
33%
0%
5%
10%
15%
20%
25%
30%
35%
Never Gambled GambledLifetime
Gambled PastYear
Gambled PastMonth
Percent of 2002 Delaware 11th Graders Reporting Past Year Use of Other Illegal Drugs and Frequency of Gambling
Other illegal drugs include prescription downers and stimulants, inhalants, hallucinogens, crack, cocaine, and heroin
7%
16%
19%
25%
0%
5%
10%
15%
20%
25%
Never Gambled GambledLifetime
Gambled PastYear
Gambled PastMonth
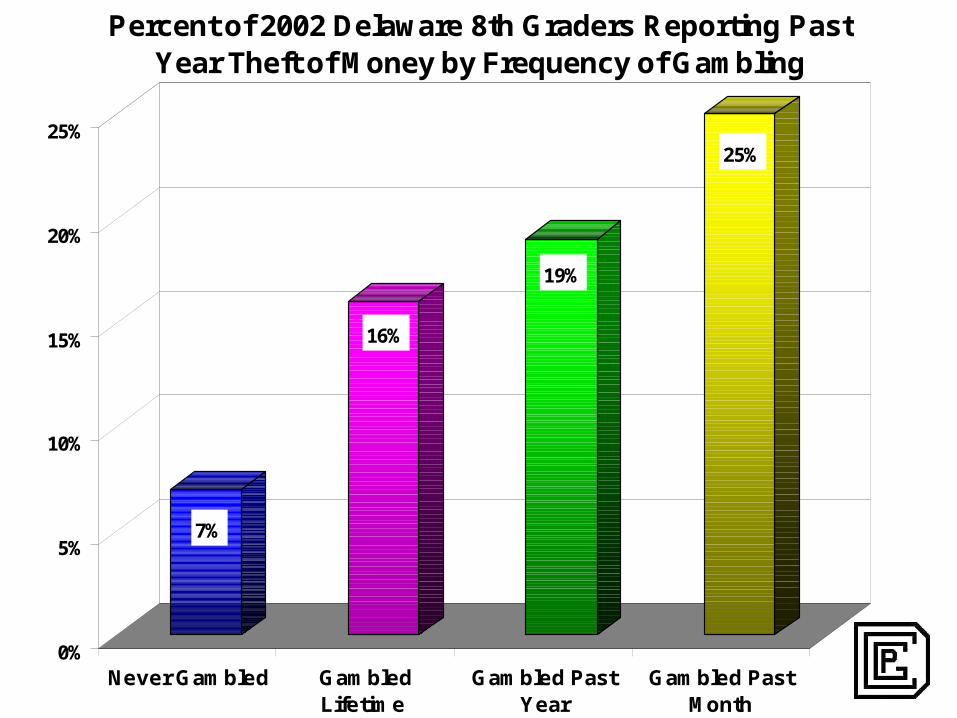
Percent of 2002 Delaware 8th Graders Reporting Past Year Theft of Money by Frequency of Gambling

7%
12%
14%
18%
0%
2%
4%
6%
8%
10%
12%
14%
16%
18%
NeverGambled
GambledLifetime
Gambled PastYear
Gambled PastMonth
Percent of 2002 Delaware 11th Graders Reporting Past Year Theft of Money by
Frequency of Gambling

12%
29%
36%
47%
0%
5%
10%
15%
20%
25%
30%
35%
40%
45%
50%
Never Gambled GambledLifetime
Gambled PastYear
Gambled PastMonth
Percent of 2002 Delaware 8th Graders Reporting Past Year Involvement in Gang Fights by Frequency of
Gambling

8%
20%
26%28%
0%
5%
10%
15%
20%
25%
30%
NeverGambled
GambledLifetime
GambledPast Year
GambledPast Month
Percent of 2002 Delaware 11th Graders Reporting Past Year Gang Fights by Frequency of Gambling

9%
22%
26%
34%
0%
5%
10%
15%
20%
25%
30%
35%
Never Gambled Gambled Lifetime Gambled PastYear
Gambled PastMonth
Percent of 2002 Delaware 8th Graders Reporting Past Year Shoplifting by Frequency of Gambling

11%
26%
31%
36%
0%
5%
10%
15%
20%
25%
30%
35%
40%
NeverGambled
GambledLifetime
Gambled PastYear
Gambled PastMonth
Percent of 2002 Delaware 11th Graders Reporting Past Year Shoplifting by Frequency of Gambling

11%
28%
34%
43%
0%
5%
10%
15%
20%
25%
30%
35%
40%
45%
Never Gambled Gambled Lifetime Gambled PastYear
Gambled PastMonth
Percent of 2002 Delaware 8th Graders Reporting Past Year Illegal Entry by Frequency of Gambling
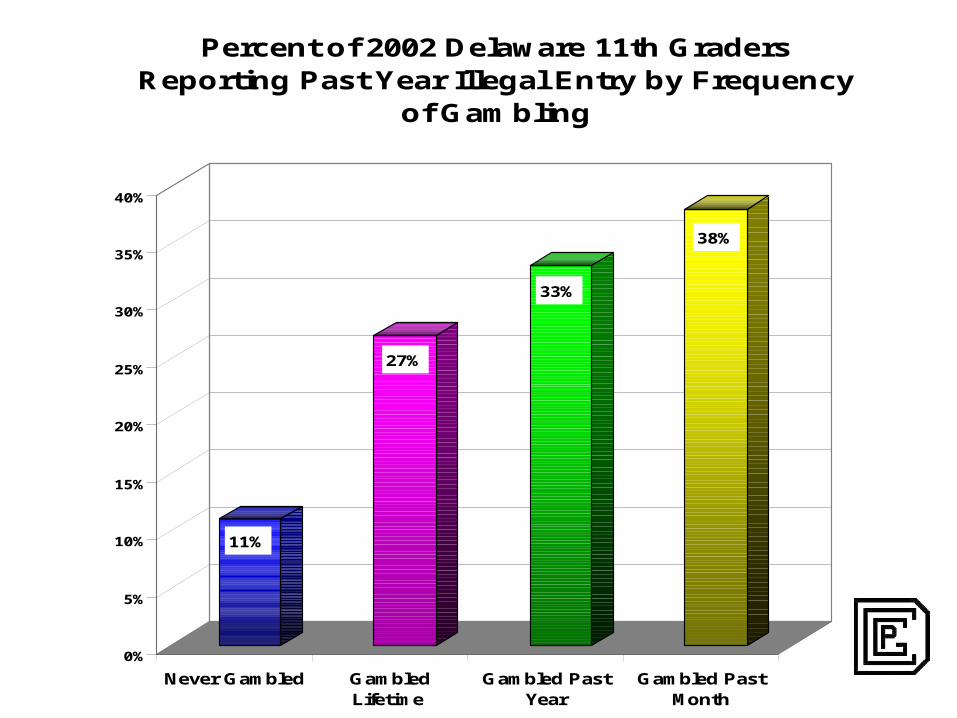
11%
27%
33%
38%
0%
5%
10%
15%
20%
25%
30%
35%
40%
Never Gambled GambledLifetime
Gambled PastYear
Gambled PastMonth
Percent of 2002 Delaware 11th Graders Reporting Past Year Illegal Entry by Frequency
of Gambling

7%
16%
20%
28%
0%
5%
10%
15%
20%
25%
30%
Never Gambled GambledLifetime
Gambled PastYear
Gambled PastMonth
Percent of 2002 Delaware 8th Graders Reporting Past Year Trouble With Police by Frequency of
Gambling

5%
16%
19%
25%
0%
5%
10%
15%
20%
25%
Never Gambled GambledLifetime
Gambled PastYear
Gambled PastMonth
Percent of 2002 Delaware 11th Graders Reporting Past Year Trouble With Police by Frequency of
Gambling

4%2% 1%
36%
23%
9%
34%
23%
11%
35%
22%
10%
9%
5%
2%
34%
19%
6%
15%
10%
6%9%
6%
3%
30%
21%
11%
0%
5%
10%
15%
20%
25%
30%
35%
40%
Casino Lottery Sports Cards Horses Bingo Dice Internet Pool
Past Year Wagering Activity Among Delaware 8th Graders
Lifetime
Past Year
PastMonth
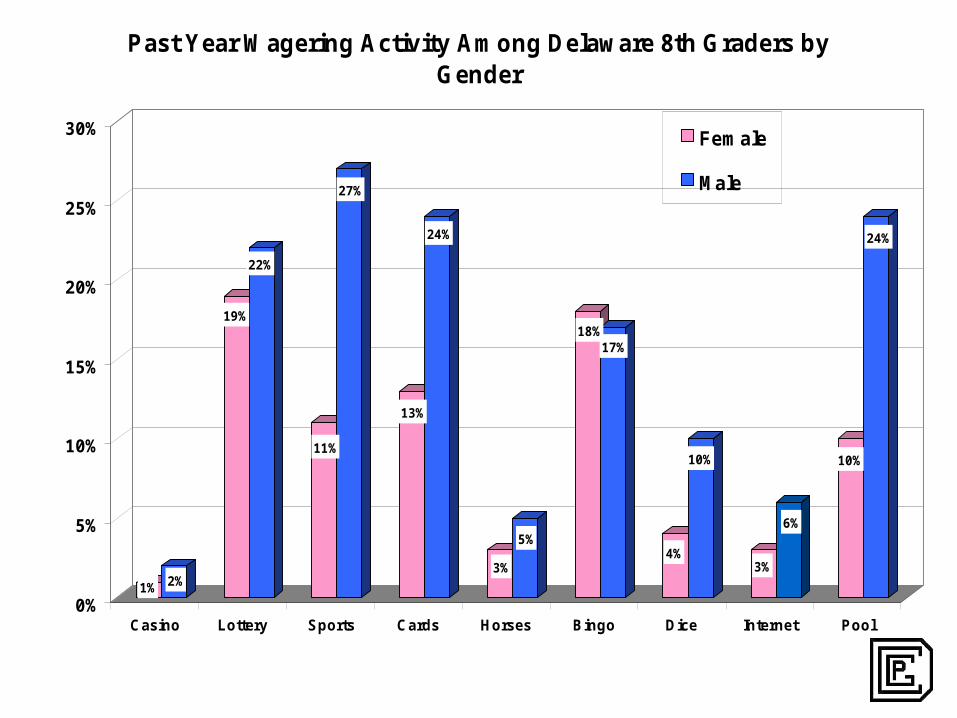
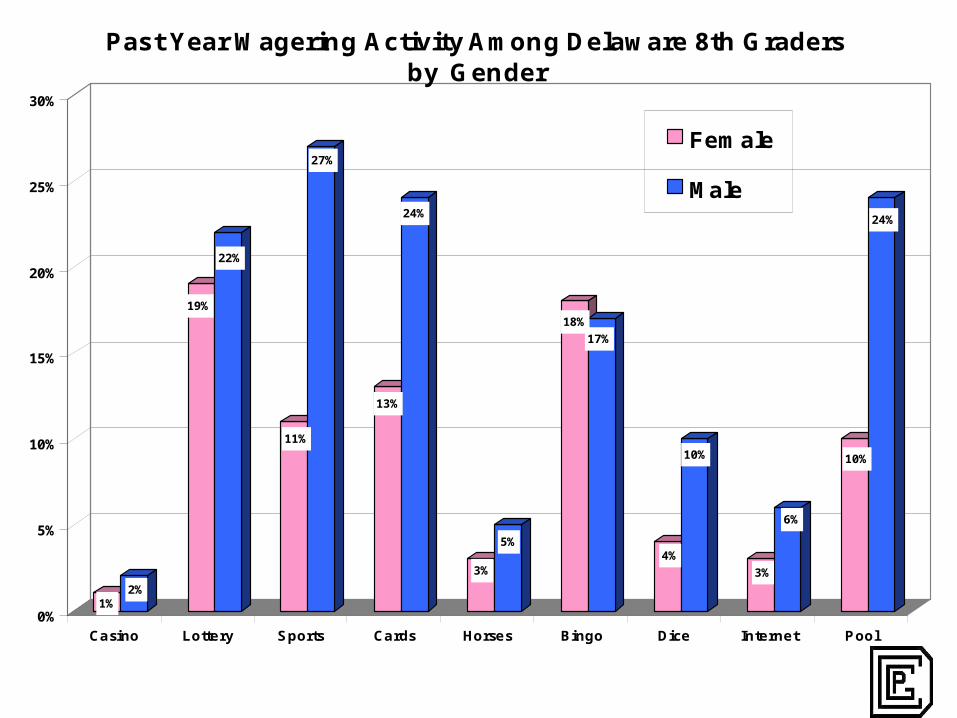
1% 2%
19%
22%
11%
27%
13%
24%
3%
5%
18%17%
4%
10%
3%
6%
10%
24%
0%
5%
10%
15%
20%
25%
30%
Casino Lottery Sports Cards Horses Bingo Dice Internet Pool
Past Year Wagering Activity Among Delaware 8th Graders by Gender
Female
Male

1% 1%
14%
25%
19%18%
19%18%
3%
5%
18%17%
9%
5%
4%
5%
15%
18%
0%
5%
10%
15%
20%
25%
Casino Lottery Sports Cards Horses Bingo Dice Internet Pool
Past Year Wagering Activity Among Delaware 8th Graders by Race
Minority
White

4%2% 1%
32%
19%
5%
31%
21%
8%
31%
19%
7%
9%
4%
2%
20%
9%
2%
14%
9%
4% 4%3%
1%
28%
21%
9%
0%
5%
10%
15%
20%
25%
30%
35%
Casino Lottery Sports Cards Horses Bingo Dice Internet Pool
Past Year Wagering Activity Among Delaware 11th Graders
Lifetime
Past Year
PastMonth
1%2%
19%
22%
11%
27%
13%
24%
3%
5%
18%
17%
4%
10%
3%
6%
10%
24%
0%
5%
10%
15%
20%
25%
30%
Casino Lottery Sports Cards Horses Bingo Dice Internet Pool
Past Year Wagering Activity Among Delaware 8th Graders by Gender
Female
Male
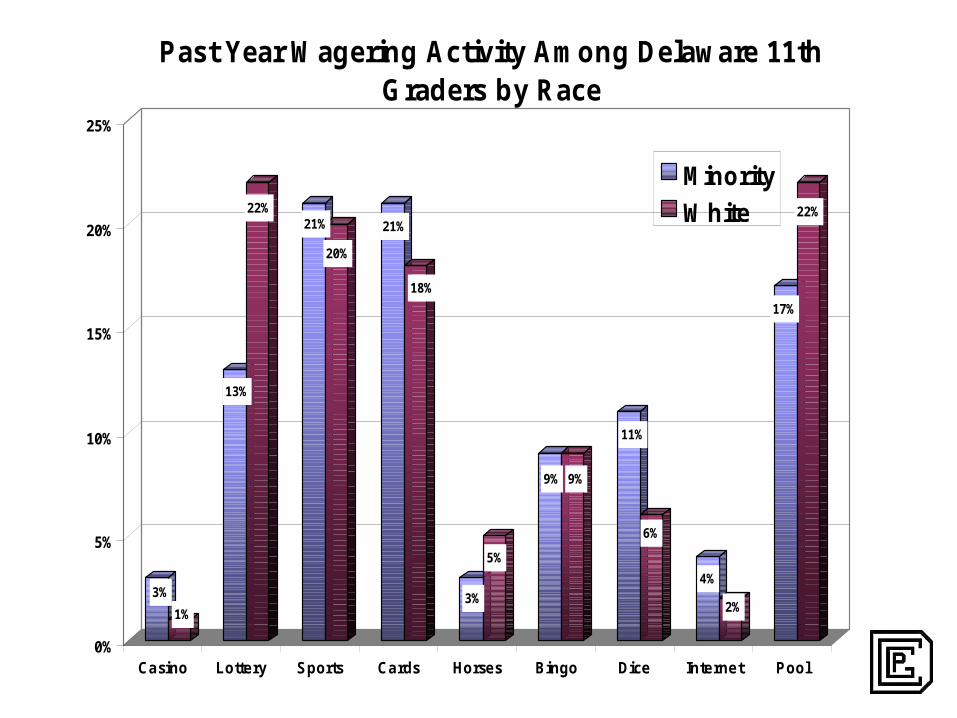
3%
1%
13%
22%21%
20%
21%
18%
3%
5%
9% 9%
11%
6%
4%
2%
17%
22%
0%
5%
10%
15%
20%
25%
Casino Lottery Sports Cards Horses Bingo Dice Internet Pool
Past Year Wagering Activity Among Delaware 11th Graders by Race
Minority
White
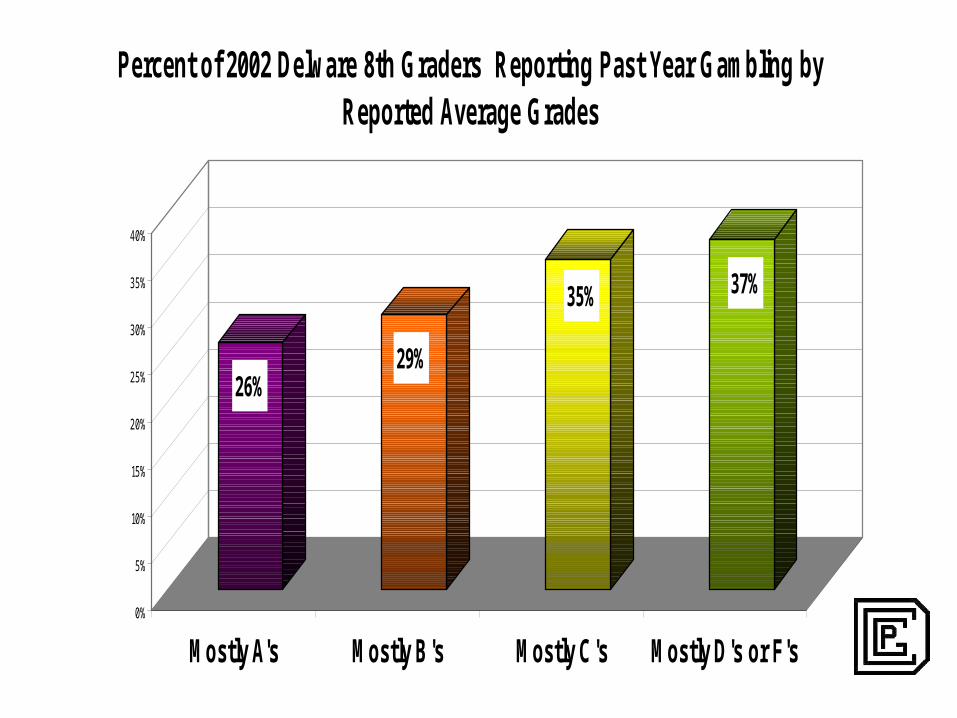
26%29%
35% 37%
0%
5%
10%
15%
20%
25%
30%
35%
40%
Mostly A's Mostly B's Mostly C's Mostly D's or F's
Percent of 2002 Delware 8th Graders Reporting Past Year Gambling by Reported Average Grades

23%26%
33%
43%
0%
5%
10%
15%
20%
25%
30%
35%
40%
45%
Mostly A's Mostly B's Mostly C's Mostly D's or F's
Percent of 2002 Delaware 11th Graders Reporting Past Year Gambling by Reported Average Grades

9%
20%
23%
30%
0%
5%
10%
15%
20%
25%
30%
NeverGambled
GambledLifetime
Gambled PastYear
Gambled PastMonth
Percent of 2002 Delaware 8th Graders Reporting Past Year Skipping School by Frequency of Gambling
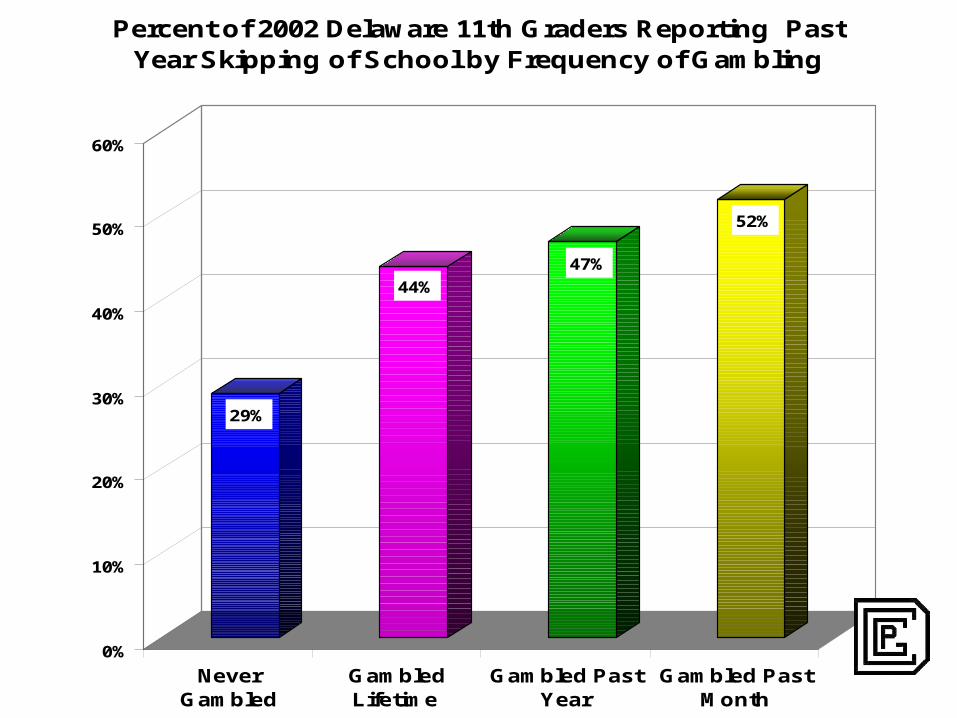
29%
44%
47%
52%
0%
10%
20%
30%
40%
50%
60%
NeverGambled
GambledLifetime
Gambled PastYear
Gambled PastMonth
Percent of 2002 Delaware 11th Graders Reporting Past Year Skipping of School by Frequency of Gambling

43%
36%
27%
23%21%
0%
5%
10%
15%
20%
25%
30%
35%
40%
45%
None less than1/2 hour
1-2 hours 2-4 hours 4 or morehours
Percent of 2002 Delaware 8th Graders Reporting Past Year Gambling by Studying Outside of School
(Hours Per Week)

44%
33%
23%
19%
12%
0%
5%
10%
15%
20%
25%
30%
35%
40%
45%
None less than1/2 hour
1-2 hours 2-4 hours 4 or morehours
Percent of 2002 Delaware 11th Graders Reporting Past Year Gambling by Studying Outside of School
(Hours Per Week)

34%35%
33%
28%26%
0%
5%
10%
15%
20%
25%
30%
35%
None less than 1/2hour
1-2 hours 2-4 hours 4 or more hours
Percent of 2002 Delaware 8th Graders Reporting Past Year Gambling by Spending Time With Parents
(Hours Per Day)
30% 30%
28%
25%
21%
0%
5%
10%
15%
20%
25%
30%
None less than1/2 hour
1-2 hours 2-4 hours 4 or morehours
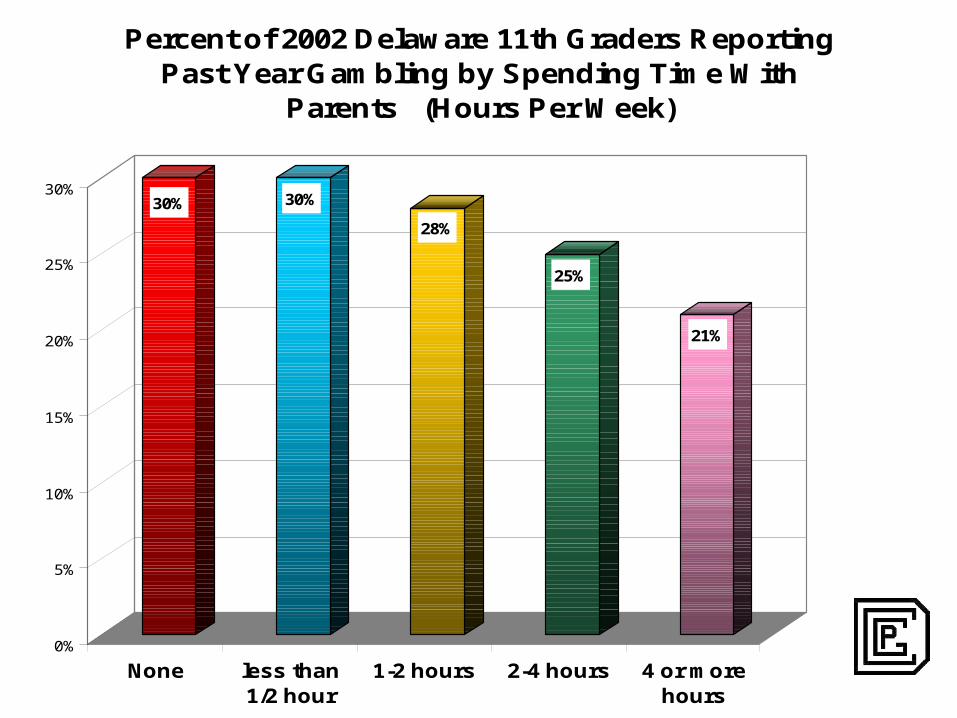
Percent of 2002 Delaware 11th Graders Reporting Past Year Gambling by Spending Time With
Parents (Hours Per Week)

21%
26%
32%
37%
42%
0%
5%
10%
15%
20%
25%
30%
35%
40%
45%
None less than1/2 hour
1-2 hours 2-4 hours 4 or morehours
Percent of 2002 Delaware 8th Graders Past Year Gambling by Time Spent Playing Video/Computer
Games (Hours Per Week)
18%
26%
35%36%
39%
0%
5%
10%
15%
20%
25%
30%
35%
40%
None less than1/2 hour
1-2 hours 2-4 hours 4 or morehours
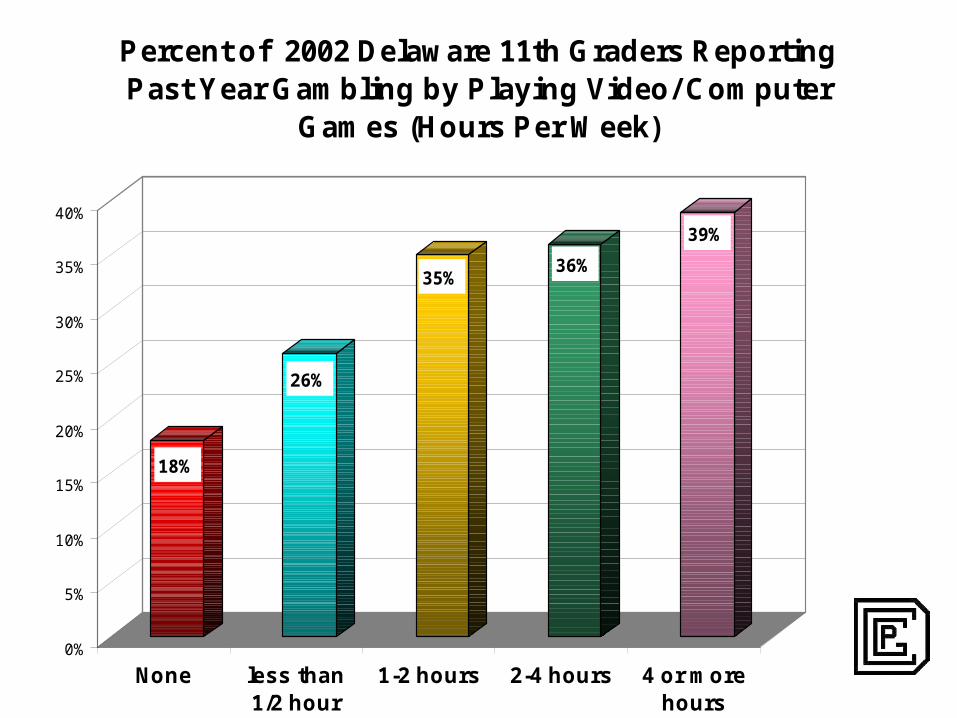
Percent of 2002 Delaware 11th Graders Reporting Past Year Gambling by Playing Video/ Computer
Games (Hours Per Week)

25%
75%
51%
49%
35%
65%
32%
68%
38%
62%
55%
45%
25%
75%
32%
68%
34%
66%
Casino Lottery Sports Betting
Card Games
HorseRaces
Bingo Dice Games
Internet Pool/ Billiards
Percent of Delaware 8th Graders Who Report Past Year Gambling By Type of Reported Wagering
Reported Past Year Gambling
Did Not Report Past Year Gambling
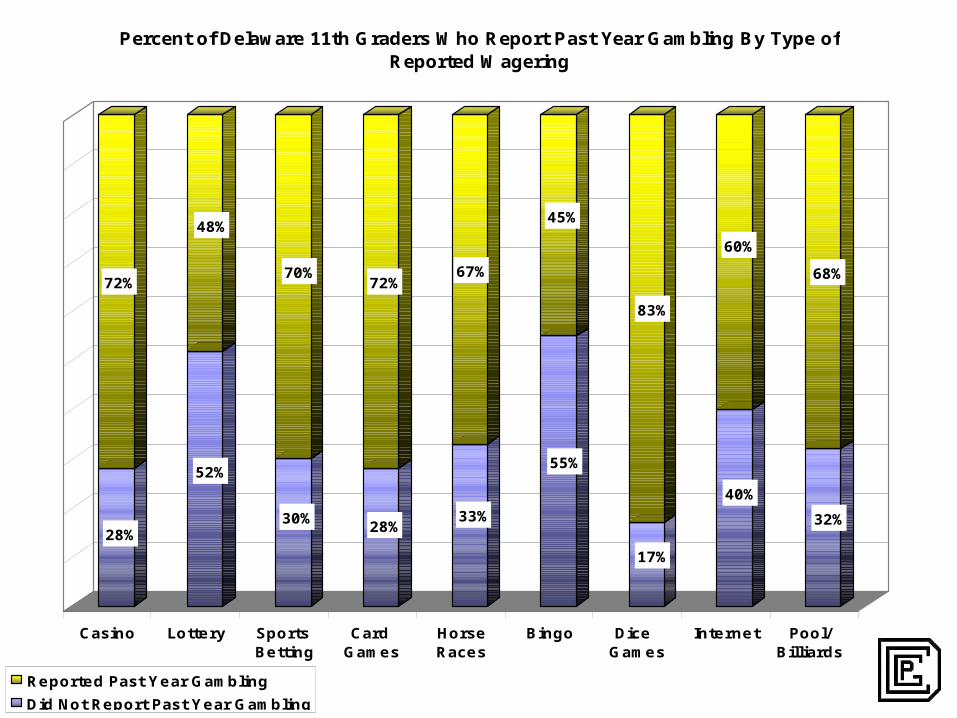
28%
72%
52%
48%
30%
70%
28%
72%
33%
67%
55%
45%
17%
83%
40%
60%
32%
68%
Casino Lottery Sports Betting
Card Games
HorseRaces
Bingo Dice Games
Internet Pool/ Billiards
Percent of Delaware 11th Graders Who Report Past Year Gambling By Type of Reported Wagering
Reported Past Year Gambling
Did Not Report Past Year Gambling

Summary of Findings-8th GradeIn 2002:
• almost 1/3 of Delaware 8th graders gambled
• 43% of 8th grade boys and 19% of 8th grade girls gambled
Delaware 8th graders that gambled in 2002 were:
•over 50% more likely to drink alcohol
•more than twice as likely to binge drink
•more than 3 times as likely to use marijuana
•3 times as likely to use other illegal drugs
•almost 3 times as likely to get in trouble with the police
•3 times as likely to be involved in a gang fight
•almost 3 times as likely to steal or shoplift

Summary of Findings-11th GradeIn 2002:
• more than 1/4 of Delaware 11th graders gambled
•45% of 11th grade boys and 12% of 11th grade girls gambled
Delaware 11th graders that gambled in 2002 were
•25% more likely to drink alcohol
•twice as likely to binge drink
•33% more likely to use marijuana
•almost twice as likely to use other illegal drugs
•more than 3 times as likely to be involved in a gang fight
•almost 4 times as likely to get in trouble with the police
•almost 3 times as likely to steal or shoplift