data driven project management · quality of the project’s product”? ... • productivity =...
TRANSCRIPT
Copyright © 1994-2004 by Quality Improvement Consultants, Inc. (QIC) 1
World-Class Quality
Measurement DrivenProject
ManagementTim Olson, PresidentQuality Improvement Consultants, Inc. (QIC)(760) 804-1405 (Business)(760) 804-1406 (Fax)[email protected]
2004 CMMI Conference
Copyright © 1994-2004 by Quality Improvement Consultants, Inc. (QIC) 2
World-Class Quality
Presentation Objectives
Discuss some principles of measurement.
Explain the benefits of implementing data drivenproject management.
Present a QIC Process Measurement FrameworkSM.
Provide some examples of data driven projectmanagement metrics.
Discuss some measurement strategies and providean example project measurement dashboard.
Answer any of your questions.
Copyright © 1994-2004 by Quality Improvement Consultants, Inc. (QIC) 3
World-Class Quality
Agenda
Motivation
Data Driven Project Management
QIC Process Measurement FrameworkSM
Some Measurement Examples
Some Measurement Strategies
Summary
Questions and Answers
Copyright © 1994-2004 by Quality Improvement Consultants, Inc. (QIC) 4
World-Class Quality
The Principle of Measurement
As Lord Kelvin said a century ago:
“When you can measure what you are speakingabout, and express it in numbers, you knowsomething about it; but when you cannotmeasure it, when you cannot express it innumbers, your knowledge is of a meager andunsatisfactory kind; it may be the beginning ofknowledge, but you have scarcely in yourthoughts advanced to the stage of science.”
Copyright © 1994-2004 by Quality Improvement Consultants, Inc. (QIC) 5
World-Class Quality
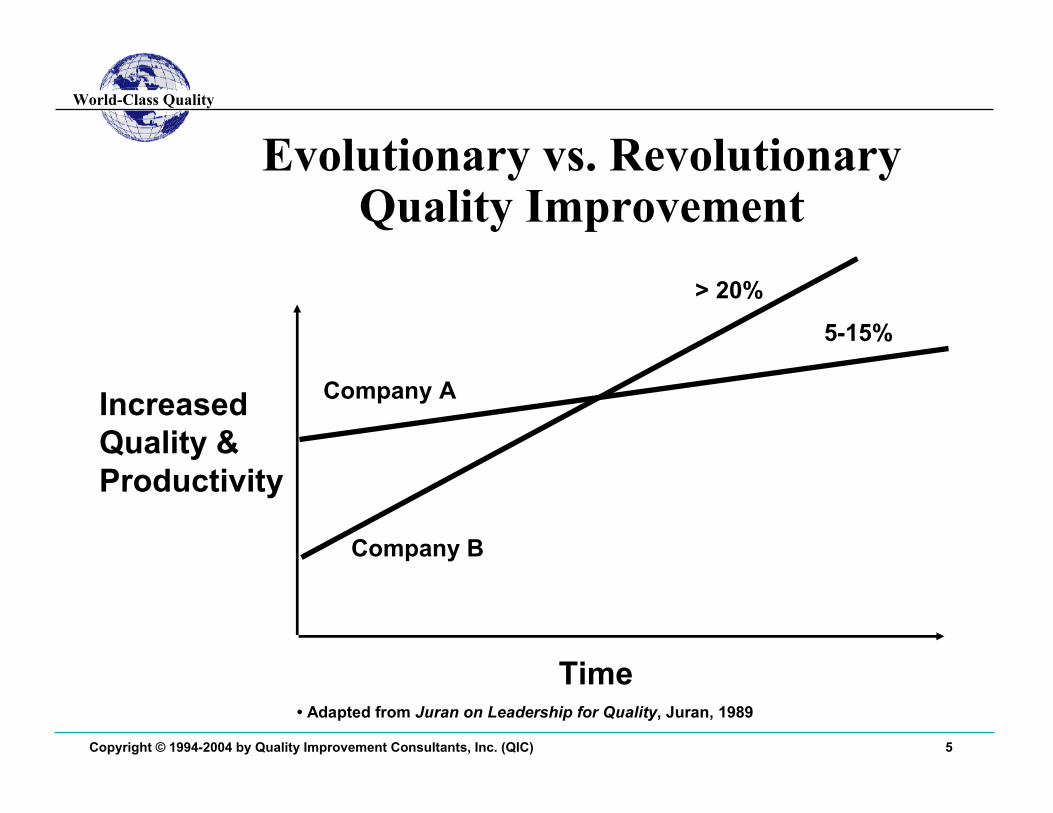
Evolutionary vs. RevolutionaryQuality Improvement
IncreasedQuality &Productivity
Time
Company B
Company A
> 20%
5-15%
• Adapted from Juran on Leadership for Quality, Juran, 1989

Copyright © 1994-2004 by Quality Improvement Consultants, Inc. (QIC) 6
World-Class Quality
Some Best-In-Class Benchmarks
METRIC WORLD-CLASS BENCHMARK
Productivity
Defect Removal Efficiency
Schedule / Cycle Time
Post-Release Defect Rate
Return on Investment
Costs of Poor Quality
70-90% total defects removed before test
Six Sigma (3.4 defects per Million Parts)
Doubled (e.g., in 5 years)
5:1 - 10:1 ROI
Cut in half (e.g., in 5 years)
Reduced from 33% to under 10%
Copyright © 1994-2004 by Quality Improvement Consultants, Inc. (QIC) 7
World-Class Quality
Agenda
Motivation
Data Driven Project Management
QIC Process Measurement FrameworkSM
Some Measurement Examples
Some Measurement Strategies
Summary
Questions and Answers

Copyright © 1994-2004 by Quality Improvement Consultants, Inc. (QIC) 8
World-Class Quality
Problem Statement
80% of all improvement efforts have nomeasurable results.
Most projects have limited or poor metrics to helpthem manage their projects.
The most common metrics are schedule andbudget (which are usually inadequate).
Most organizations keep changing the scheduleand budget, so that the original estimates are lost.
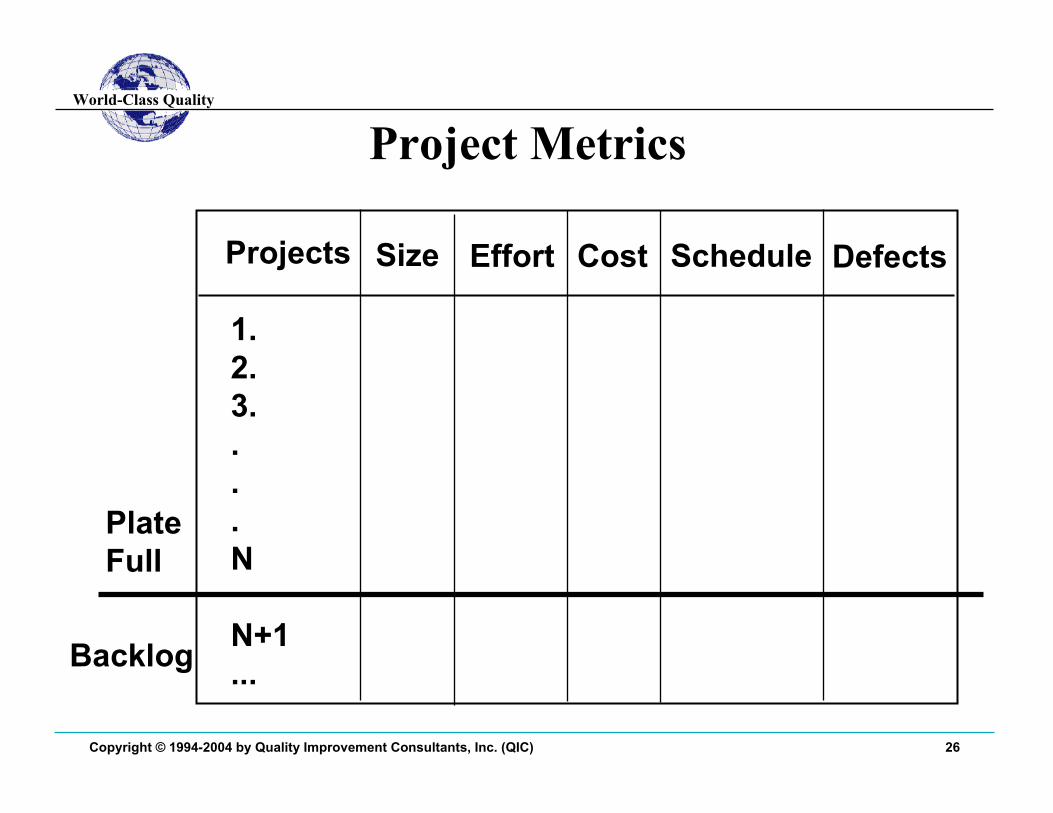
If an organization achieves their N+1 schedule, isthat really a success?

Copyright © 1994-2004 by Quality Improvement Consultants, Inc. (QIC) 9
World-Class Quality
Project Management and Metrics
Most projects estimate:• Schedule (e.g., dates)
• Effort (e.g., hours)
• Cost (e.g., $)
Many projects do not estimate:• Size (i.e., how big is the project?)
• Defects (e.g., what is the needed quality ofthe product)?

Copyright © 1994-2004 by Quality Improvement Consultants, Inc. (QIC) 10
World-Class Quality
Some PMI PMBOK MetricsPlanned Value (PV) = BCWS (Planned Effort)
Earned Value (EV) = BCWP (Earned Planned Effort)
Actual Value (AV) = ACWP (Actual Effort)
Schedule Performance Index (SPI) = EV/PV (ratio or %)
Cost Performance Index (CPI) = EV/AV (ratio or %)
Schedule Variance (SV) = EV - PV (in hours or cost)
Cost Variance (CV) = EV - AV (in hours or cost)• Reference: “A Guide to the Project Management Body of Knowledge”, Project Management Institute, 2000.

Copyright © 1994-2004 by Quality Improvement Consultants, Inc. (QIC) 11
World-Class Quality
Why Size?Size is “how big is the project”?
For example, what is a size metric for building ahouse?
• Total square feet• Total Finished/Unfinished square feet• Foundation size• Number of rooms (large, medium, small)
Projects with unclear or changing requirementscan double in size.
Projects can track on schedule, effort, and cost,and still be in trouble.

Copyright © 1994-2004 by Quality Improvement Consultants, Inc. (QIC) 12
World-Class Quality
Why Defects?Defects help answer the question, “what is thequality of the project’s product”?
One major defect that reaches a customer cancause the project to lose money (e.g., lawsuit).
Defects can be estimated and tracked during aproject.
Quality shipped to the customer can beaccurately predicted ahead of time.
Measuring defects is a great way to do processimprovement and defect prevention.

Copyright © 1994-2004 by Quality Improvement Consultants, Inc. (QIC) 13
World-Class Quality
Why Size and Defects?Without size, organizations don’t know:
• How big are our projects?• Estimating may be off• Productivity = size/effort
Without defects and size, organizations don’tknow their quality:
• Defect density = defects/size- (During project execution)
• Product defect rate = defects/size- (After shipping the product to the customer)
Copyright © 1994-2004 by Quality Improvement Consultants, Inc. (QIC) 14
World-Class Quality
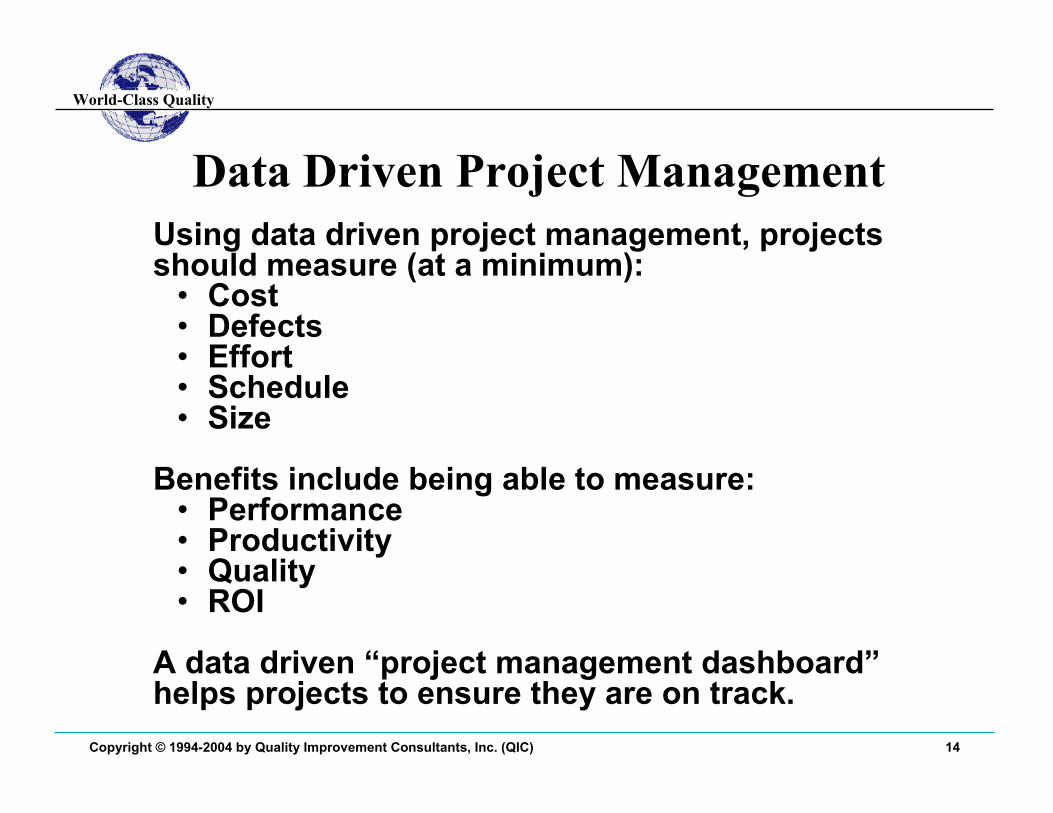
Data Driven Project ManagementUsing data driven project management, projectsshould measure (at a minimum):
• Cost• Defects• Effort• Schedule• Size
Benefits include being able to measure:• Performance• Productivity• Quality• ROI
A data driven “project management dashboard”helps projects to ensure they are on track.

Copyright © 1994-2004 by Quality Improvement Consultants, Inc. (QIC) 15
World-Class Quality
Agenda
Motivation
Data Driven Project Management
QIC Process Measurement FrameworkSM
Some Measurement Examples
Some Measurement Strategies
Summary
Questions and Answers
Copyright © 1994-2004 by Quality Improvement Consultants, Inc. (QIC) 16
World-Class Quality
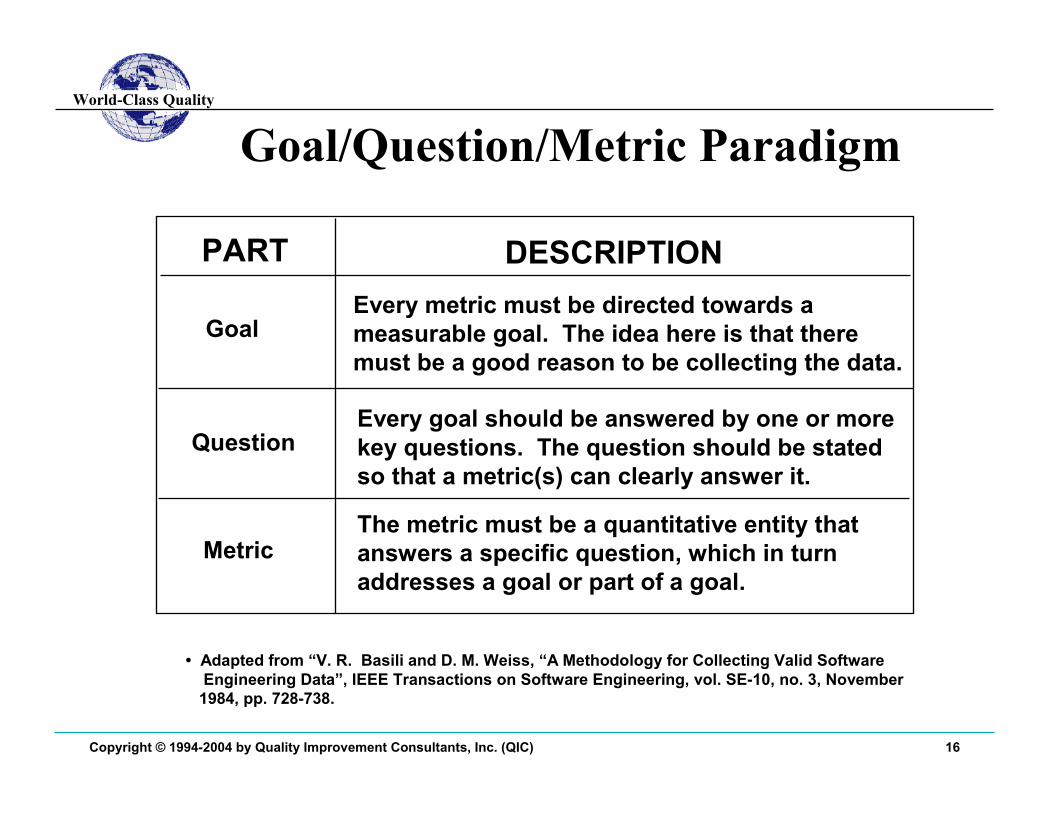
Goal/Question/Metric Paradigm
PART DESCRIPTION
GoalEvery metric must be directed towards ameasurable goal. The idea here is that theremust be a good reason to be collecting the data.
QuestionEvery goal should be answered by one or morekey questions. The question should be statedso that a metric(s) can clearly answer it.
MetricThe metric must be a quantitative entity thatanswers a specific question, which in turnaddresses a goal or part of a goal.
• Adapted from “V. R. Basili and D. M. Weiss, “A Methodology for Collecting Valid SoftwareEngineering Data”, IEEE Transactions on Software Engineering, vol. SE-10, no. 3, November
1984, pp. 728-738.
Copyright © 1994-2004 by Quality Improvement Consultants, Inc. (QIC) 17
World-Class Quality
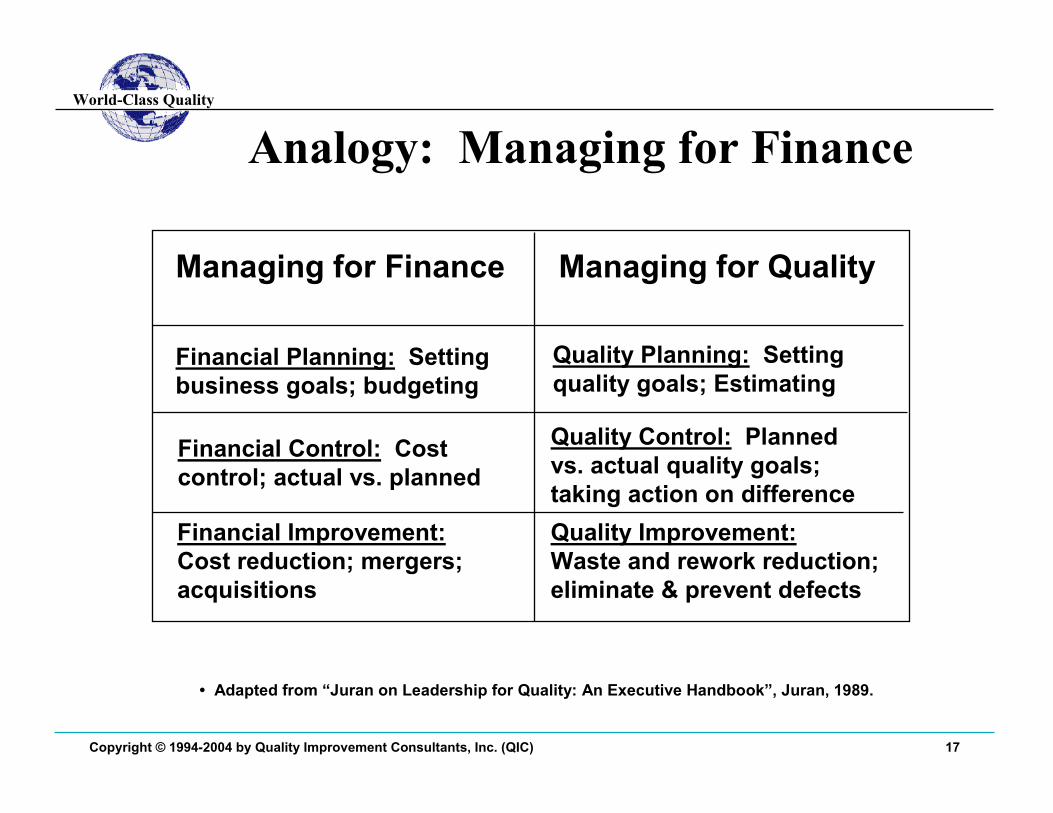
Analogy: Managing for Finance
Managing for Finance Managing for Quality
Financial Planning: Settingbusiness goals; budgeting
Quality Planning: Settingquality goals; Estimating
Financial Control: Costcontrol; actual vs. planned
Quality Control: Plannedvs. actual quality goals;taking action on difference
Financial Improvement:Cost reduction; mergers;acquisitions
Quality Improvement:Waste and rework reduction;eliminate & prevent defects
• Adapted from “Juran on Leadership for Quality: An Executive Handbook”, Juran, 1989.
Copyright © 1994-2004 by Quality Improvement Consultants, Inc. (QIC) 18
World-Class Quality
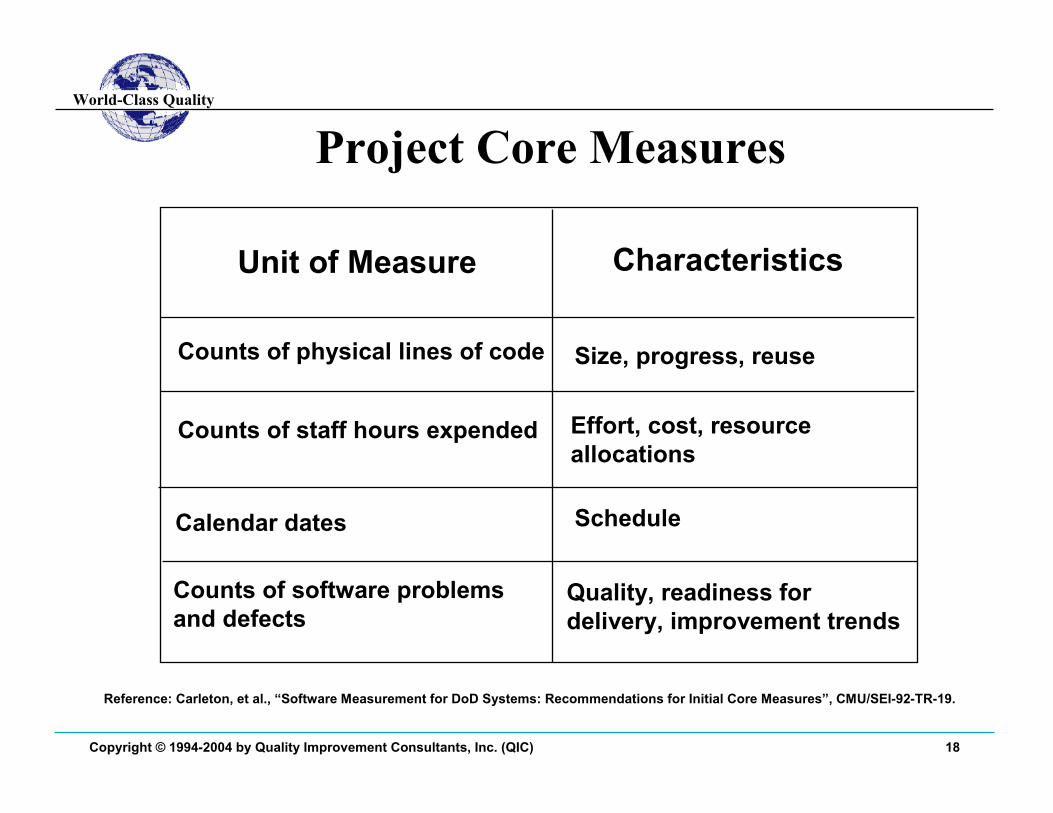
Project Core Measures
Reference: Carleton, et al., “Software Measurement for DoD Systems: Recommendations for Initial Core Measures”, CMU/SEI-92-TR-19.
Unit of Measure Characteristics
Counts of physical lines of code Size, progress, reuse
Counts of staff hours expended Effort, cost, resourceallocations
Calendar dates Schedule
Counts of software problemsand defects
Quality, readiness fordelivery, improvement trends

Copyright © 1994-2004 by Quality Improvement Consultants, Inc. (QIC) 19
World-Class Quality
QIC Process Measurement FrameworkSM
GOALS
CONTROL
PLAN
METRICSKEY QUESTIONS
IMPROVE
*DC
* DC = Data Collection; DS = Data Storage
Cost, defects,effort, size,schedule, etc.
Cost, defects,effort, size,schedule, etc.
Cost, defects,effort, size,schedule, etc.
*DS
• Reference: “A Process Measurement Framework That Works”, Olson, Timothy G., 1997 SEPG

Copyright © 1994-2004 by Quality Improvement Consultants, Inc. (QIC) 20
World-Class Quality
Agenda
Motivation
Data Driven Project Management
QIC Process Measurement FrameworkSM
Some Measurement Examples
Some Measurement Strategies
Summary
Questions and Answers
Copyright © 1994-2004 by Quality Improvement Consultants, Inc. (QIC) 21
World-Class Quality
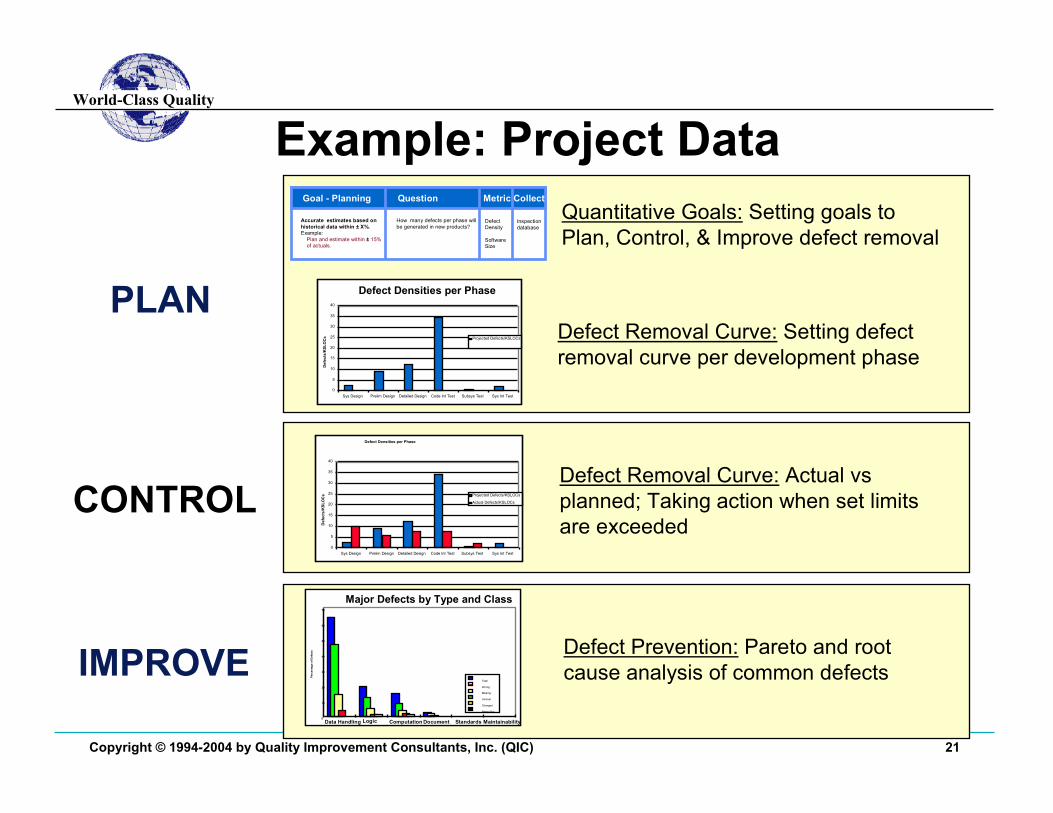
Example: Project Data
PLAN
Major Defects by Type and Class
0
10
20
30
40
50
60
70
Data Handling Logic Computation Document Standards Maintainability
Perc
enta
ge o
f Def
ects
Total
Wrong
Missing
Unclear
Changed
Better Way
Defect Densities per Phase
0
5
10
15
20
25
30
35
40
Sys Design Prelim Design Detailed Design Code Int Test Subsys Test Sys Int Test
Def
ects
/KSL
OC
s Projected Defects/KSLOCs
Actual Defects/KSLOCs
Defect Densities per Phase
0
5
10
15
20
25
30
35
40
Sys Design Prelim Design Detailed Design Code Int Test Subsys Test Sys Int Test
Def
ects
/KSL
OC
s Projected Defects/KSLOCs
Goal - Planning Question Metric Collect
Accurate estimates based onhistorical data within ± X%.Example:
Plan and estimate within ± 15%of actuals.
How many defects per phase willbe generated in new products?
DefectDensity
SoftwareSize
Inspectiondatabase
Defect Removal Curve: Actual vsplanned; Taking action when set limitsare exceeded
Defect Prevention: Pareto and rootcause analysis of common defects
Defect Removal Curve: Setting defectremoval curve per development phase
Quantitative Goals: Setting goals toPlan, Control, & Improve defect removal
CONTROL
IMPROVE

Copyright © 1994-2004 by Quality Improvement Consultants, Inc. (QIC) 22
World-Class Quality
Control: Project Quality Tracking
BUILD 1Planned Actual
Control Within
Limits Set Limits?
Defect Removal(Pages)
Project Start-Up
System Design
Preliminary Design
Detailed Design
Code
Sub-System Int. Test
0.14 1.37
0.19 1.76
0.26 0
0.87 0
0
15%
15%
15% 0%
15% 0%
15% 0%
978.5%
0.112
926.3%
Defect Removal Curve (Build 1)
Def
ects
per
Pag
e
0
0.2
0.4
0.6
0.8
1
1.2
1.4
1.6
1.8
2
8
Series1
Series2
System
Design
Prelim.
Design
CodeDetail
Design
SubSystm
Test
System
D&D Test
Fleet
Util.
System
V&V Test
PlannedActuals
NewProcess
Capability
• Adapted from Beeson, Dennis D. and Olson, Timothy G. , “Instrumenting Software Projects: A Case Study of Real World Projects”, SEPG 2001.
Track defect removal taking corrective action when acceptable limits exceeded
Copyright © 1994-2004 by Quality Improvement Consultants, Inc. (QIC) 23
World-Class Quality
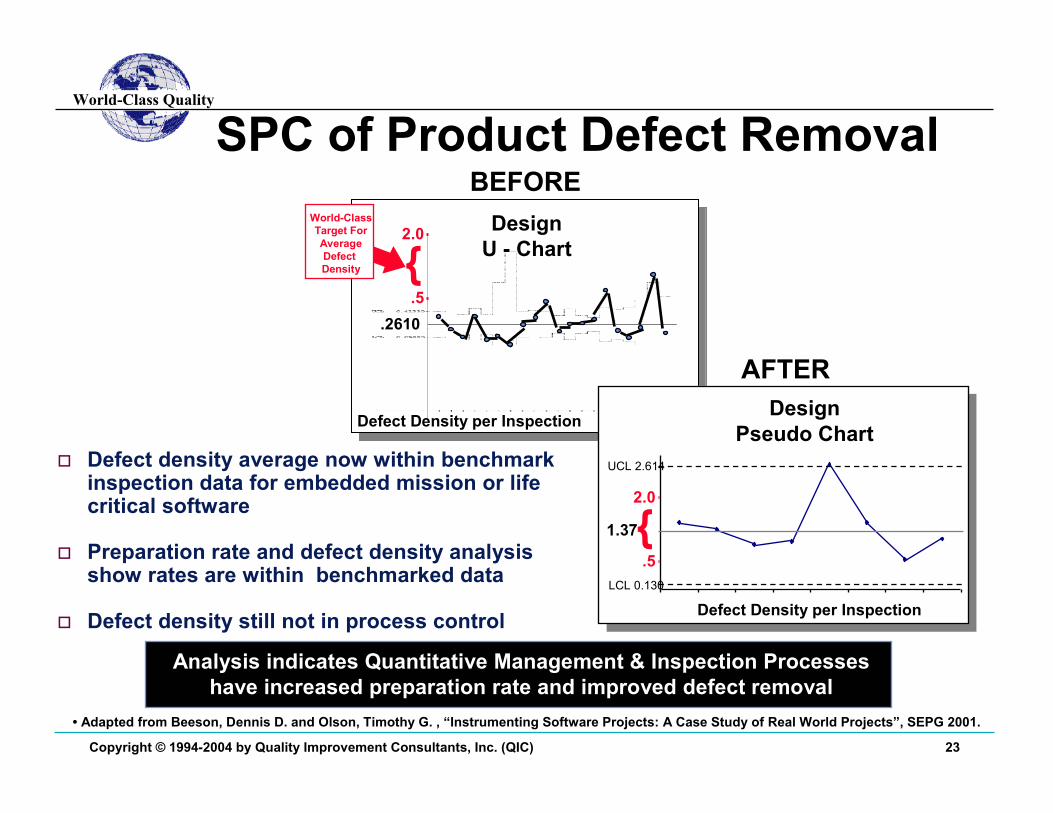
SPC of Product Defect Removal
Analysis indicates Quantitative Management & Inspection Processeshave increased preparation rate and improved defect removal
� Defect density average now within benchmarkinspection data for embedded mission or lifecritical software
� Preparation rate and defect density analysisshow rates are within benchmarked data
� Defect density still not in process control
BEFOREDesign
U - Chart
Defect Density per Inspection
.5
World-ClassTarget ForAverageDefectDensity
.2610
AFTERDesign
Pseudo Chart
1.37
Defect Density per InspectionLCL 0.130
UCL 2.614
2.0
{
.5
2.0
{
• Adapted from Beeson, Dennis D. and Olson, Timothy G. , “Instrumenting Software Projects: A Case Study of Real World Projects”, SEPG 2001.

Copyright © 1994-2004 by Quality Improvement Consultants, Inc. (QIC) 24
World-Class Quality
Improvement: Benchmarking
Benchmarks indicated Requirements and Design inspections couldyield highest ROI from process improvement
Defect Removal Life Cycle
0
5
10
15
20
25
30
35
40
1 2 3 4 5 6 7 8
Def
ects
per
KSL
OC
Series1Series2Series3Series4
89A OFP (1990)92A OFP (1993)10A OFP (1996)12A OFP (1998)
Minimum defect density yieldfrom safety critical world-classprocesses benchmark.
System Software Design Code Software System System FleetDesign Reqmts Insp. Int. Test Int. Test Ver. Test Use
Before
Defect Removal Curve (Build 1)
Def
ects
per
Pag
e
00.20.40.60.8
11.21.41.61.8
2
8
Series1
Series2
SystemDesign
Prelim.Design
CodeDetailDesign
SubSystmTest
SystemD&D Test
FleetUtil.
SystemV&V Test
PlannedActuals
Defect density yields fromsafety critical world-classprocesses benchmark.
After
• Adapted from Beeson, Dennis D. and Olson, Timothy G. , “Instrumenting Software Projects: A Case Study of Real World Projects”, SEPG 2001.

Copyright © 1994-2004 by Quality Improvement Consultants, Inc. (QIC) 25
World-Class Quality
Agenda
Motivation
Data Driven Project Management
QIC Process Measurement FrameworkSM
Some Measurement Examples
Some Measurement Strategies
Summary
Questions and Answers
Copyright © 1994-2004 by Quality Improvement Consultants, Inc. (QIC) 26
World-Class Quality
Project Metrics
Projects Size Effort Cost
1.2.3....N
N+1...
PlateFull
Backlog
Schedule Defects

Copyright © 1994-2004 by Quality Improvement Consultants, Inc. (QIC) 27
World-Class Quality
Example Metrics DashboardRISK
PRODUCTIVITYQUALITY
PERFORMANCE
SchedulePerformance
Index
CostPerformance
Index
ReturnOn
Investment
ProductDefectRate
RiskScore
Size/Effort
DefectRemovalEfficiency
Costof PoorQuality
ROI
Copyright © 1994-2004 by Quality Improvement Consultants, Inc. (QIC) 28
World-Class Quality
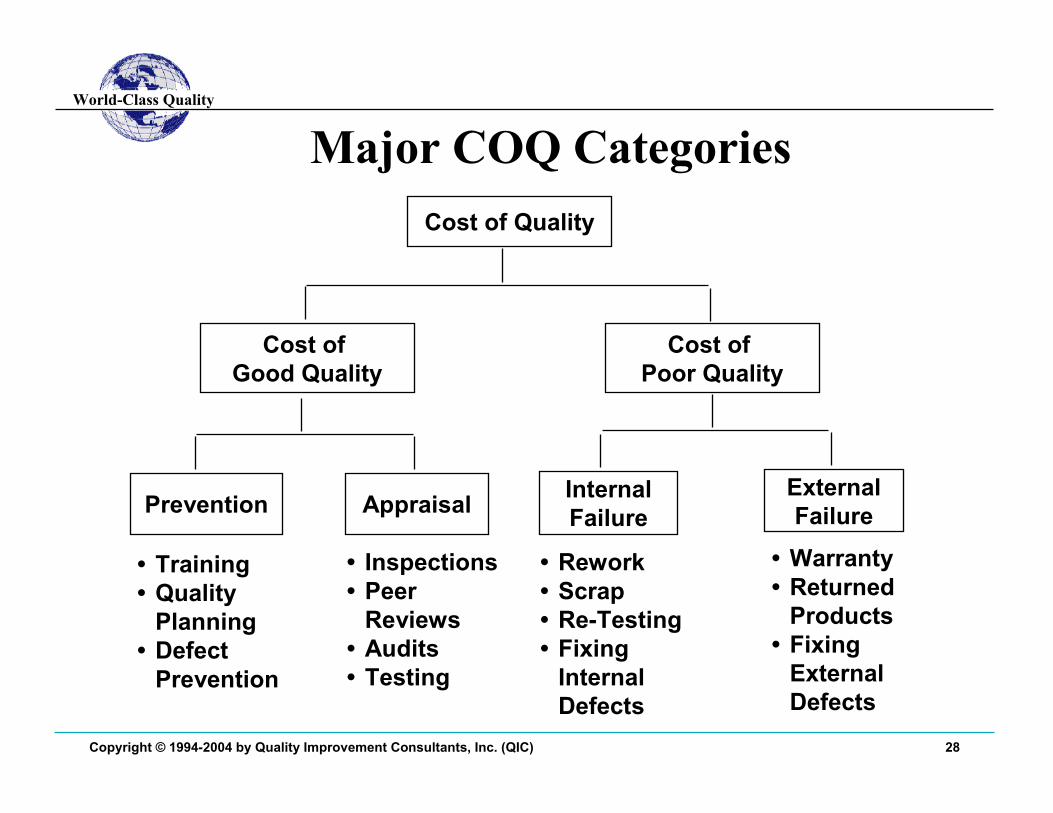
Major COQ CategoriesCost of Quality
Cost ofGood Quality
Cost ofPoor Quality
Prevention Appraisal InternalFailure
ExternalFailure
• Training• Quality
Planning• Defect
Prevention
• Inspections• Peer
Reviews• Audits• Testing
• Rework• Scrap• Re-Testing• Fixing
InternalDefects
• Warranty• Returned
Products• Fixing
ExternalDefects

Copyright © 1994-2004 by Quality Improvement Consultants, Inc. (QIC) 29
World-Class Quality
How Much Do Defects Cost?
Requirements Design Implementation Test Release
TIME
COST
$
DEFECTS
Defects cost less to fix when detected earlier in the process
1
10
100

Copyright © 1994-2004 by Quality Improvement Consultants, Inc. (QIC) 30
World-Class Quality
Best-in-Class Strategies
Req.’s Design Implementation Test Release
NUMBEROFDEFECTS
DEFECTPREVENTION
EARLYDEFECTDETECTION(70-90% before Test)
• Slide adapted from Olson, “A Software Quality Strategy for Demonstrating Early ROI”, SSQ Journal, May 1995.

Copyright © 1994-2004 by Quality Improvement Consultants, Inc. (QIC) 31
World-Class Quality
Agenda
Motivation
Data Driven Project Management
QIC Process Measurement FrameworkSM
Some Measurement Examples
Some Measurement Strategies
Summary
Questions and Answers

Copyright © 1994-2004 by Quality Improvement Consultants, Inc. (QIC) 32
World-Class Quality
SummaryMost improvement efforts have no measurableresults.
Many projects do not estimate size and defects andhave poor visibility into productivity and quality.
Data driven project management can provide a“metrics dashboard”:
• Performance• Productivity• Quality• Risk• ROI

Copyright © 1994-2004 by Quality Improvement Consultants, Inc. (QIC) 33
World-Class Quality
Agenda
Motivation
Data Driven Project Management
QIC Process Measurement FrameworkSM
Some Measurement Examples
Some Measurement Strategies
Summary
Questions and Answers

Copyright © 1994-2004 by Quality Improvement Consultants, Inc. (QIC) 34
World-Class Quality
Measurement DrivenProject
ManagementTim Olson, PresidentQuality Improvement Consultants, Inc. (QIC)(760) 804-1405 (Business)(760) 804-1406 (Fax)[email protected]
2004 CMMI Conference