data collection in future mobile networks · data collection in future mobile networks marc...
TRANSCRIPT

Data Collection in Future Mobile Networks
Marc Fouquet1, Christian Hoene2, Morten Schlager3, and Georg Carle1
1 Technical University of Munich2 University of Tubingen
3 Nokia Siemens Networks, Berlin
Abstract. Future mobile networks will be increasingly heterogeneous. Alreadytoday, wireless LAN is used by many mobile network operators as an additionto traditional technologies like GSM and UMTS; WiMax and 3GPP Long TermEvolution (LTE) will be added. Having heterogeneous wireless networks, onechallenging research question needs to be answered: Which user should be servedby which access network and when to conduct a handover? For such decisions,information on the state of networks and terminals is required. In this publica-tion, we simulate mobile networks in which a central entity called Network Re-source Management (N-RM) gives handover recommendations to mobile termi-nals. Based on these recommendations and local knowledge on link qualities, theterminals choose the cell to switch to. The N-RM should have a global view onthe networks to give best recommendations. We designed the Generic MeteringInfrastructure (GMI), a publish/subscribe system to collect information about ac-cess networks and terminals efficiently.We investigate the tradeoff between the signalling overhead caused by data col-lection and the quality of the handover decisions and show, how smart monitoringcan reduce the amount of measurement data while ensuring the efficient use ofheterogeneous networks. In addition, our simulation results show that combinedlocal and central handover decisions significantly increase the capacity of thenetworks as compared to only local decisions.
1 Introduction
Future mobile networks will be heterogeneous, i.e., consisting of GSM, UMTS, WLAN,WiMax [1], LTE [2], and other radio access technologies. 3GPP is currently standardiz-ing IP-based mobility solutions that will allow seamless handovers between such tech-nologies [3].
Having a heterogeneous network, we need to decide, which user should be servedby which access technology at which time. This problem is complex, as the decisioncan depend on many factors like signal strength, user location and movement, the loadin different cells, capabilities of the mobile terminal, the currently running sessions, etc.
As different user and operator preferences must be considered, a policy-driven deci-sion engine has to make the handover decisions [4]. It is probably impossible to developone “perfect” algorithm that fits all needs.
Deciding handovers locally in the mobile terminal is sub-optimal, as the globalsituation in the network, i.e. the load in the different cells, can not be taken into account.It would be advantageous to have a “Wizard of Oz” view on the access networks and
make network-side handover decisions with perfect information, but, of course, it isimpossible for physical reasons to collect all data and to make decisions on time. Thus,any central view on the network will be inaccurate and delayed.
Flat hierarchies in future mobile networks make the process of data collection evenmore difficult. In LTE networks there will no longer be a node like the UMTS RNC,which already has load- and radio data of hundreds of cells, but only evolved nodeBslocated much closer to the antennas. With wireless LAN the situation is similar becauseall measurement data has to be collected at the access points.
Collecting management data is expensive as base stations are spread in the country-side, with costly rented or wireless “backhaul”-links connecting them to the operator’score network. Management and control traffic has to share these links with user data— and as the customer’s data is what an operator is paid for, the share of measurementtraffic has to be minimized.
To get an efficient view on the state of the network, we have designed the GenericMetering Infrastructure (GMI) [5], a publish/subscribe system for collecting and dis-tributing measurement data in an operator’s network. It uses various techniques to in-crease efficiency of data collection, i.e. by building ditribution trees, by caching dataand by data compression. The GMI is intended for all kind of management applica-tions, i.e. for fault management, security management, and resource management. Inthis publication we concentrate on the usage of GMI for making handover decisions.
In this work we do not aim at increasing the performance of the handover systembecause it could follow diverse goals and any arbitrary policies. Instead, we take afew algorithms as examples and study, how the accuracy of information influences thequality of central decisions. More precisely, we primarily focus on the effect of differentstrategies for data collection and the resulting quality of mobility decisions.
Our achitecture assumes that the mobile devices have a certain degree of freedomto choose networks based on local preferences. However this can be overridden bynetwork-side decisions, which also relieves the mobile device from constantly having toscan for alternative radio networks. Our network-side decision engine called NetworkResource Management (N-RM) resides in the core network (Figure 2). It implementsalgorithms, which give the terminals handover recommendations. The mobile terminalsmake the final handover decisions based on their local knowledge on the radio con-ditions and the N-RM recommendations. We base this exemplary system on researchresults by Fan et al. [6] achieved in the BmBF project “ScaleNet”.
We describe the GMI in Section 2 and the setup for our experiments in Section 3.Results are presented in Section 4 and interpreted in terms of data volume in Section 5.We discuss related work in Section 6 and finally conclude the paper in Section 7.
2 The Generic Metering Infrastructure
In this section we describe the Generic Metering Infrastructure (GMI), our publish/-subscribe system for future networks. It allows for efficient data distribution by enablingclients to selectively subscribe for information they need, by distributing the data tointerested parties in a multicast-like fashion, by caching and by compressing data.

Like all publish/subscribe systems, the GMI offers an event service (see Figure 1).Clients (called consumers in publish/subscribe terms) can subscribe for “types” of in-formation they are interested in. Whenever new information is created at a producer,it is sent to the event service which then takes care of distributing the new data to allinterested consumers.
Fig. 1. Basic concept of an Event Service.
2.1 GMI Design
The GMI’s event brokers are called Metering Management and Collection Entities(MMCEs). These nodes manage the subscriptions and create distribution trees if mul-tiple receivers are interested in the same data.
Our generic metering infrastructure is a subject-based publish/subscribe system.This means that the “types” of information as described above are organized in a tree,an individual leaf of the tree is identified by a DNS-like address, for example:
percentUsed.bandwidth.nodeB0123←↩.mmce.mnc123.mcc123.3gppnetwork.org
The general decoupling of senders and receivers which is generally typical for pub-lish/subscribe systems is partially removed by this form of addressing, as the abstract“subject” can include information about the source node of the data (nodeB0123). Thisis necessary as we sometimes need to get specific information from certain nodes. How-ever, we still have logical addressing as not the information source (called meter in ourterms) is addressed directly, but the associated MMCE. The interface between MMCEsand meters will be discussed in Section 2.3.
In the GMI, subscriptions not only configure the actual event service but also themeters. This is why the clients send CREATE messages instead of SUBSCRIBE mes-sages, a message from a client will create a new measurement job in a meter if it doesnot exist yet. Therefore, data that no one is interested in will never be transmitted overthe network. Similar measurement jobs are merged and as the MMCEs form a distribu-tion tree for each job, we have a multicast-like “late duplication” property — the samechunk of data is transmitted only once over each link.

The GMI supports three different types of measurement jobs:Periodic measurements: A client can subscribe to periodic metering tasks. In this
case, the subscriber specifies a desired report period and the subject it wants to stayinformed about.
Triggers: It is also possible to set triggers for measurements. For such a subscription,the client specifies one or multiple thresholds for a metered value. If the value risesabove or falls below the given threshold, the client is informed immediately. Usuallyour triggers are defined with hysteresis, so there is an upper threshold and a lowerthreshold. If, for example, the upper threshold has been crossed, the metered value hasto fall below the lower threshold to cause another trigger message.
Request/Reply: The last type of reporting is an immediate response to a requestof a metering client for a certain value of data. This notification is not an event inthe classical sense of a p/s-system. In this case, the metering client simply sends arequest for a subject (which is a message similar to a subscription) and receives a replycontaining the value (which is handled like a notification). Such requests should beused sparingly in practice. As they do not benefit from the “late duplication” propertyof the multicast-like data distribution, they cause more load in the system than othernotifications.
There are also some additional advanced GMI features that are not mentioned here,the interested reader might consult [5] for an in-depth description of the GMI.
2.2 Granularity Periods and Report Periods
Monitoring in 3GPP networks usually does not directly work on raw data from thenetwork elements, but with derived ”key performance indicators” (KPI). A networkelement collects raw data for an interval called granularity period (GP). After the GPis finished, this data is used to calculate the KPIs [7]. With today’s network elementslike RNCs, the minimum GP is 5 minutes, while 30 minutes are a far more typical value.Of course monitoring with such a granularity barely helps when building a system toimprove handover performance.
For the GMI we expect the meters to work the same way as they do today, but withshorter granularity periods. Each meter has a specific minimum GP. New data for theGMI’s publish/subscribe system is only available when a GP has ended. This meansthat with periodic measurements, the minimum report interval is one GP. With triggers,the system can only evaluate at the end of each GP, whether or not the trigger has fired.Request/reply-style queries are answered after the current GP has ended, so they mayget delayed for one GP. Alternative implementations would be to immediately send thelast (possibly outdated) value or to mix between the two approaches — to wait for anew value if the last one is too old.
Granularity periods are not a property of the GMI, but of the meters. The GMI pub-lish/subscribe system works event-based and forwards messages whenever they arrive— it is not bound to granularity periods. GMI can also cope with different meters hav-ing different GPs, i.e. if old UMTS hardware delivers a value only each 5 minutes whilenewer hardware might be more responsive.
For periodic measurement jobs, the client specifies the reporting interval in multi-ples of the granularity period. We call this property of measurement jobs the report

period (RP). So a report period of 10 GPs means that each 10th metered value is actu-ally reported to the client.
2.3 GMI in future mobile networks
Figure 2 shows, how the GMI could be deployed in a 3G-beyond network. For UMTS,meters would be placed at the Radio Network Controller (RNC), a central node thatcontrols hundreds of cells. However in other radio access networks, the necessary datahas to be collected at much more distributed locations.
The links between the cells (that may be located somewhere in the countryside)and the packet core network are a scarce and expensive resource for mobile networkoperators. So any management task has to be careful to save bandwidth here. Thereforethe MMCEs should generally be placed “above” bandwidth bottlenecks in the packetcore network or on its border. The meters reside at the actual locations where data isproduced. The interface between MMCEs and meters depends on the type of meter andthe link between meter and MMCE. Legacy meters could use well-known protocolslike SNMP here, while GMI-enabled meters would use protocols that are optimized tocompress the data.
Fig. 2. Mapping of the GMI to the SAE network architec-ture.
MMCE
CREATE PUBLISH
N-R
M C
OM
MA
ND
S
RA
N S
imu
lato
rw
ith
loca
l R
M
GMI Meter EmulationDynamic sampling
according to N-RM'sCREATE-messages.
N-RMNetwork Resource
Management
MMCE MMCE
Fig. 3. Experiment setup includingN-RM.
Our concept of the GMI is not only suitable for heterogeneous access management,but also for general management tasks or for security applications (i.e. distributed in-trusion detection). Therefore we assume that we will have many consumers that use theGMI to collect data. However in our simulations we will only have a single consumerthat cares for heterogeneous access management. It is clear that many of the GMI’sadvantages — like the possibility to build up distribution trees — do not come to playwhen only a single client is active.

3 Setup for N-RM Experiments
In this section we describe the setup of our experiments. All components of our simu-lations can be seen in Figure 3 and are described in the following sections. They wererun on a single machine, but as separate applications using TCP/IP communications.
3.1 The User- and Radio Network Simulator
The simulator is an application that simulates the mobile networks and their users. Sev-eral cells belonging to different radio access networks (RANs) are placed on a map.The users move around on this map and start and stop sessions. We use an “acceleratedreal-time” simulation, events in the simulator happen 15 times faster than they wouldin reality. The simulator is able to accept GMI subscriptions for a large number of pa-rameters regarding cells and users. The minimum granularity period of all meters is onesecond, which would be 15 seconds in the real system. In the following we will give thereport period in multiples of the granularity period — and not in seconds — to avoidconfusion between real time and simulated time.
Map and Radio Access Networks: The map which was used in our simulations isshown in Figure 4. There are three different radio access technologies, which differ inthe capacity and range of their cells. The range is given in meters while the capacity isdefined as the number of simultaneous sessions that a cells supports. Sessions requirea fixed amount of bandwidth and there is only one type of sessions. Compared to thecell capacity, the sessions can be regarded as video calls. We also do not distinguishbetween upstream and downstream traffic.
RAN A is a network of high capacity and high range, it could be realized using real-world technologies like LTE or WiMAX. RAN B is a cellular network. The individualcells have a lower capacity, but RAN B has coverage everywhere on the map and inmost areas there is even an overlap between the cells. One could imagine RAN B asbeing GSM or UMTS. RAN C consists of cells with relatively high bandwidth but avery small range — they can be considered WLAN hotspots. On our map there is atotal of nine cells in an area of 1.44 km2. We assume free space radio propagation,users will lose connectivity as soon as the distance to the base station is larger than therange given in Table 1.
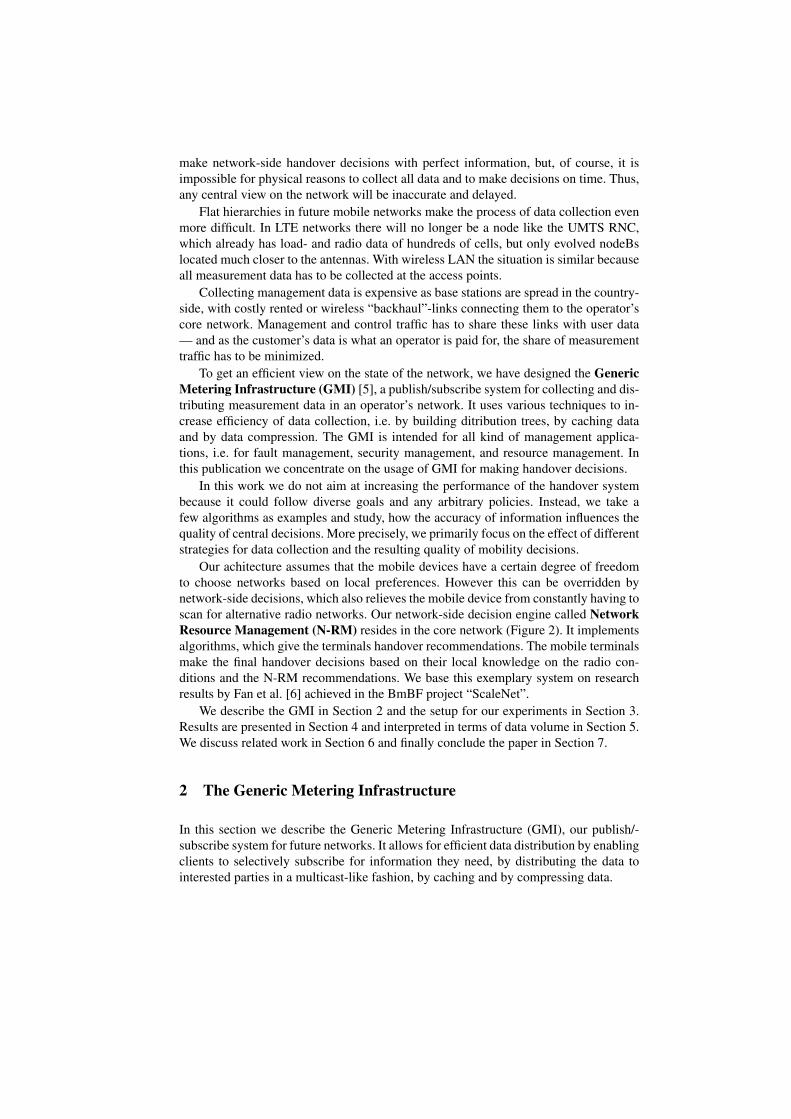
There is a network-internal resource management build into the simulator, whichallows handovers between cells of the same RAN, the handover logic for this case isgiven in Algorithm 1 which is executed for each user periodically.
Access Technology Number of Cells Capacity (Simultaneous Sessions) Range (m)RAN A 1 31 800RAN B 5 12 600RAN C 3 20 120
Table 1. Different radio access networks.

RAN A
RAN B
RAN C
Fig. 4. The map for the simulations, with nine cells of three different radio access technologies.
Users: The movement model of the simulated users is a modified random waypointpattern. The users select a new waypoint somewhere on the map with a probability of40%. With 10% probability they will move to one of the three interesting locationsthat are covered by the RAN C hotspots. In 50% of the cases a user will stay at hiscurrent position for an exponentially distributed random time. On average, users moveat a ”pedestrian” pace of 1 meter per second.
In reality users of mobile devices are inactive most of the time, but for our simula-tion it makes little sense to model inactive users. To keep our model simple, we havechosen users who start sessions with an exponentially distributed inter-arrival time. Ses-sion lengths are exponentially distributed with the same expectation. By this construc-tion, each user has 0.5 active sessions on average.
The users produce actual load on the air interface by opening sessions, while theGMI produces signalling load which only occurs on the backhaul links between the basestations and the core network. Our assumption here is that there is no direct interactionbetween these two kinds of traffic, even though in reality they have to share the backhaullink. One primary goal of this paper is to estimate the load on the backhaul link whichis caused by the measurements. We just monitor the bandwidth but do not limit it.
3.2 The MMCEs
As explained in Chapter 2, the MMCEs are the message brokers of our publish/subscribesystem. In a real network they would collect data for the N-RM and other applicationsfrom various different locations in the network. In our current setup, all data comes fromthe simulator. Details about the MMCEs can be found in our previous publication [5].
3.3 Network Resource Management (N-RM)
The N-RM is our global application for handover management. It gets data from thesimulator via GMI after subscribing by sending CREATE messages. Its decisions are
Algorithm 1: Mobile terminal- and RAN-internal RM decisionsinput : users, cellsconstants: δ > 0foreach u ∈ users do
// mobile terminal-side logic. If N-RM recommends cells,the mobile terminal tries to connect there.
foreach c ∈ cells recommended by global rm(u) do// check signal qualityif sq(c, u) > thacceptable sq then
u.handoverTo(c);continue with next user;
// This is the "local RM" logic. It only makes handoverswithin cells of the same RAN.
foreach c ∈ nearby cells of current ran do// check minimum requirements for load and signalif sq(c, u) > thcritical sq and load(c) < thcritical load then
// find best available cellscore(c)← calculate score(load(c), sq(c, u));if score(c) > score(former best cell) + δ then
new best cell← c;
if new best cell found thenu.handoverTo(new best cell);
Algorithm 2: N-RM decision logic on bad signal qualityprecondition: u ∈ users, sq(u) < thcritical sq
input : users, cellscellsrecommended ← ∅;foreach n ∈ neighbour cells(cell(u)) do
if load(n) < thacceptable load thencellsrecommended ← cellsrecommended + {n};
sort by load(cellsrecommended);send recommendation(u, cellsrecommended);
Algorithm 3: N-RM decision logic on cell overloadprecondition: c ∈ cells, load(c) > thcritical load
input : users, cells, user list(c)cellsrecommended ← ∅;foreach n ∈ neighbour cells(c) do
if load(n) < thacceptable load thencellsrecommended ← cellsrecommended + {n};
sort by load(cellsrecommended);receivers = random subset(users(c));foreach r ∈ receivers do
send recommendation(r, cellsrecommended);
passed back to the simulator and influence the mobile terminal’s cell selection (seeFigure 3).
We assume that N-RM does not know the exact location of the user — it only knowsthe user’s location on a “per cell” granularity. Therefore it can not tell exactly whichcells are available at the user’s current position; it only knows which cells overlap.
The mobile terminal initially does not know about cells of other RANs. In real lifeit would have to scan different frequencies to find alternative cells — and this con-stant scanning would waste battery power. So in our case, N-RM will give the mobileterminal hints, which cells to search for. In reality these hints would also contain ra-dio parameters. The mobile terminal will only scan for cells of different RANs afterreceiving such a hint.
We are testing five different algorithms:
– Experiments without N-RMIn these runs, the users will stay in their RAN as long as they have connectivity.When the user leaves the coverage-area and losses connectivity, he will start scan-ning for other radio access networks and connect to the strongest cell he sees.
– Experiments with a purely trigger-based N-RMThe N-RM subscribes for the load in each cell and the signal quality of each user.The subscriptions are trigger-based, which means that N-RM is notified whenevera threshold-value is crossed.In case of a user with bad signal quality, N-RM will request load information fromsurrounding cells in a request/reply fashion. Based on the results it will recommendcells to the user (see Algorithm 2). This recommendation will have an impact onthe next run of the local RM (Algorithm 1) inside the simulator.In case of an overloaded cell, N-RM will again be informed by a trigger and thenrequest load information from the neighbour cells. It will choose a subset of thecurrent users in the overloaded cell and send its recommendations to this subset(see Algorithm 3).With this basic triggered N-RM, the resource management will only be informedwhen a critical situation occurs, there is no feedback whether the situation persistsdespite the countermeasures. As our triggers are defined with hysteresis, N-RMwill only take action again when i.e. the load in a cell crosses the upper thresholdagain after it has crossed the lower threshold.
– Experiments with an N-RM getting on periodic reportsN-RM subscribes to load information of each cell and signal quality informationof each user on a periodic basis. This means that there is a constant flow of reportswhich does not change during the simulation. When receiving information, N-RMwill check if a parameter is critical. With this measurement strategy N-RM willnever request current information when it needs specific data, but it uses the lastreported value.The basic decision algorithms are Algorithm 2 and 3. These are run periodicallywhenever new data has arrived.
– Combination of triggers and periodic reportsThis variant works with triggers again, but after a trigger has fired and N-RM hastaken action, it enters a success control loop. In this state the trigger is turned off and

replaced by a periodic measurement job which continuously monitors the criticalvalue. Then, with each arrival of a current value, N-RM will check if the systemstill is in a critical state. If this is the case, it will again request additional datawhich is needed for the decision and take action accordingly. There is a different(much lower) threshold for cancelling the periodic measurement job and returningto triggered measurements when the situation has been resolved.
– N-RM with full informationFor comparison all simulations have also been run using a N-RM which subscribesfor periodic reports of all values in the simulator with a report period of 1 GP. Thiscan be seen as the theoretical maximum amount of data that N-RM could possiblysubscribe to. The decision algorithms are still the same.
Parameter Threshold ValueLoad Hysteresis higher threshold (thcritical load) 0.94
Hysteresis lower threshold (thacceptable load) 0.89Control loop stop threshold 0.70
Signal Quality Control loop stop threshold 0.15Hysteresis higher threshold (thacceptable sq) 0.07Hysteresis lower threshold (thcritical sq) 0.06
Table 2. Threshold values for N-RM.
Triggers and threshold values: Table 2 shows the different threshold values that wereused in the simulations. The hysteresis critical threshold (0.94 for the cell load, 0.06 forthe signal quality) is crosses (upwards and downwards respectively), the N-RM starts totake. For example, when the cell load of RAN B is equal or higher than 0.94, the N-RMwill send recommendations to switch to a cell with lower capacity.
To limit the amount of trigger messages, after reaching once the hysteresis criticalthreshold, the value must reach the hysteresis acceptable threshold, before the high loador low signal quality events can be triggered again. So to say, the hysteresis acceptablethreshold (0.89 for the cell load and 0.07 for the signal quality) re-activates the load-trigger after it has fired once. This avoids a message storm if the value oscillates aroundthe actual critical threshold.
The third threshold (0.70 for the cell load) is only active when triggers and periodicreports are combined. Crossing this threshold from above causes the reporting to switchback from periodic to triggered reporting.
3.4 Simulation Flow
On startup, users will connect to the strongest cell in range. RAN A and RAN C haveno overlapping cells, so there are no horizontal (intra-RAN) handovers. For users of thecellular RAN B, it is assumed that there is a local resource management instance in theRAN (i.e. an UMTS RNC), which knows the load of all cells and the signal quality for
all users. For each user, this controller calculates a score based on the signal qualityof the radio link between the user and each cell and the load of the cell. If the scoreof a different cell is better by a certain delta than the user’s current cell’s score, theuser will conduct a handover to the new cell (see Algorithm 1). There are no handoversbetween different RANs as long as global resource management application (N-RM) isnot running. When users leave the coverage area of the current RAN they will lose theirsessions and scan for a new RAN as soon as they notice that the old one is no longerreachable.
When a user decides to create a session, it has to pass an admission control. Theadmission control checks, if there is enough capacity in the cell to allow the session,otherwise the session is denied.
In case that an N-RM is active, it monitors load and signal quality of the user’sdevices. Assume that a user approaches the border of his current cell. There is no othercell of the same RAN in range, so the local resource management has no possibility toimprove the situation. Depending on the measurement strategy, N-RM might now beinformed and decide to take action. N-RM does not know the exact location of the userand signal qualities between the users and other cells, it only knows which cells overlapwith the user’s current cell. Further, it aims for sending the user into a cell with lowload. Therefore, it has to request load information from the overlapping cells if there isno sufficiently current data in the local cache.
With this information, N-RM will sort the cells by load and send the sorted list ofcells to the user’s device. The UE will then try the alternative cells in the given orderand make a handover if the signal quality is sufficient and if admission control for theuser’s possibly active session succeeds.
The other situation which is handled by N-RM is an overloaded cell. Again N-RMmight be informed about this in time depending on the chosen measurement strategy.If N-RM decides to take action, it fetches the list of users of the cell and the load of allother cells that overlap with it. Then it creates a list of recommended cells, ordered byload, and sends this list to a subset of the users in the cell (i.e., to 10% of the users).Again the users will change to a recommended cell if possible.
4 Results of N-RM Experiments
In this section the results of our simulations are described. The values have beennormalized to 1 hour of simulated time and 1 km2 wherever possible. Figure 5 showsthe amount of traffic which is produced by GMI reports. On the horizontal axis we haveincreased the user density and therefore the offered load. One can see that the curvefor periodic reports with a report period of 10 GP is linear in the number of users asexpected. The curve for a report period of 1 GP is also linear but comparably high.
When the system load is low, triggers produce only very few messages as almostno critical events happen. However, when the load increases, the number of trigger-messages explodes. As one can see, the number of messages decreases again when theload is extremely high, as the parameters always stay above their thresholds.

0
2000
4000
6000
8000
10000
0 20 40 60 80 100 120 140 160 180 200 220
Rep
orte
d Va
lues
/ h
User Density (Users per km^2)
No RMTriggers only
Combined Reports, RP 10Periodic Reports, RP 10
Full information (RP 1)
Fig. 5. Number of transmitted values.
0
10
20
30
40
50
60
0 20 40 60 80 100 120 140 160 180 200 220
Faile
d Se
ssio
ns (%
)
User Density (Users per km^2)
No RMTriggers only
Combined Reports, RP 10Periodic Reports, RP 10
Full information (RP 1)
Fig. 6. Failed sessions.
The “combined reports” curve shows the result of an N-RM algorithm which switchesto periodic reports after receiving a trigger for a subject. As one can see this curve al-ways produces less messages than the triggered or periodic curves.
The quality of the decisions is evaluated using Figure 6, which shows the percentageof failed sessions. Here one can see that the three “realistic” systems are in the middlebetween the resource management with perfect information and the complete lack ofresource management.
One astonishing fact is that the trigger curve is better than periodic reports andcombined reports. This was not expected as the used trigger algorithm is quite primi-tive, it only acts when it gets an ascending trigger and does not control the success ofits actions. However the variance in the measured parameters is high, so the resourcemanagement is still triggered very often — which causes N-RM to send more recom-mendations to the users.
0
20
40
60
80
100
0 20 40 60 80 100 120 140 160 180 200 220
Aver
age
Load
in th
e Sy
stem
(%)
User Density (Users per km^2)
No RMTriggers only
Combined Reports, RP 10Periodic Reports, RP 10
Full information (RP 1)
Fig. 7. Average load.
0
20
40
60
80
100
0 20 40 60 80 100 120 140 160 180 200 220
Aver
age
Load
in R
AN A
(%)
User Density (Users per km^2)
No RMTriggers only
Combined Reports, RP 10Periodic Reports, RP 10
Full information (RP 1)
Fig. 8. Load in RAN A.
Figure 7 shows the average load in the system. Again the user density can be seenas a measure of the offered load, while the vertical axis is the actual load which could
0
20
40
60
80
100
0 20 40 60 80 100 120 140 160 180 200 220
Aver
age
Load
in R
AN B
(%)
User Density (Users per km^2)
No RMTriggers only
Combined Reports, RP 10Periodic Reports, RP 10
Full information (RP 1)
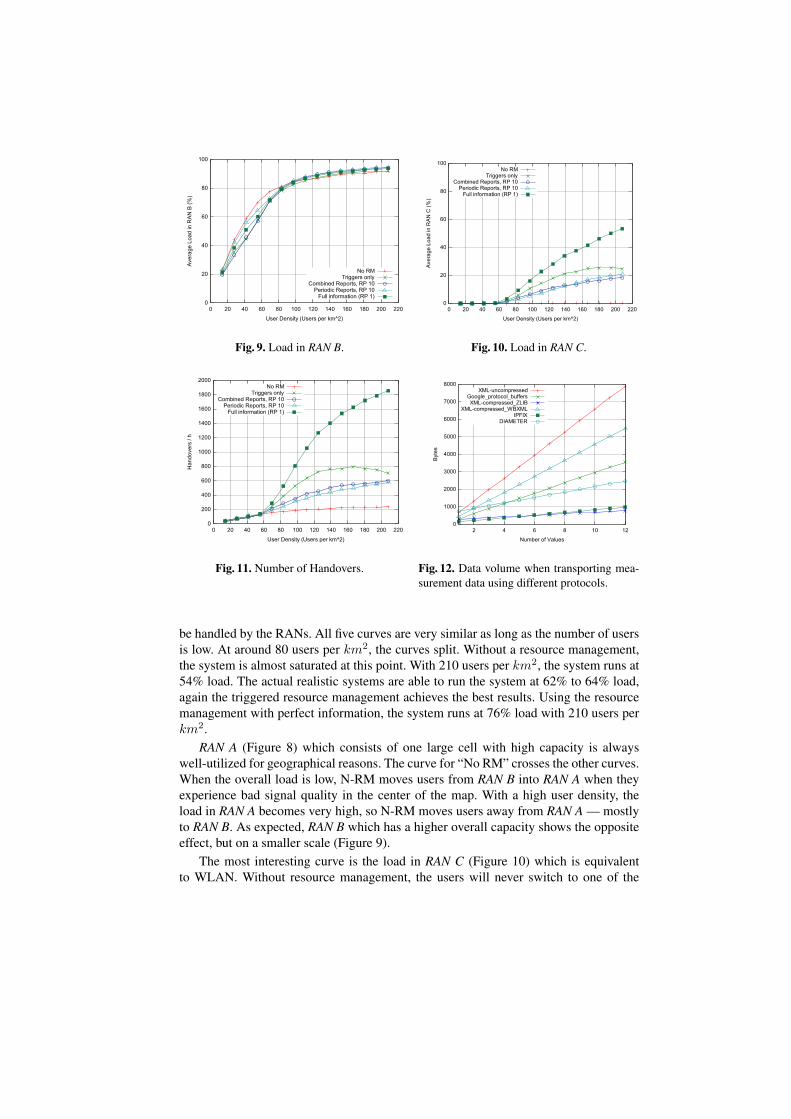
Fig. 9. Load in RAN B.
0
20
40
60
80
100
0 20 40 60 80 100 120 140 160 180 200 220
Aver
age
Load
in R
AN C
(%)
User Density (Users per km^2)
No RMTriggers only
Combined Reports, RP 10Periodic Reports, RP 10
Full information (RP 1)
Fig. 10. Load in RAN C.
0
200
400
600
800
1000
1200
1400
1600
1800
2000
0 20 40 60 80 100 120 140 160 180 200 220
Han
dove
rs /
h
User Density (Users per km^2)
No RMTriggers only
Combined Reports, RP 10Periodic Reports, RP 10
Full information (RP 1)
Fig. 11. Number of Handovers.
0
1000
2000
3000
4000
5000
6000
7000
8000
2 4 6 8 10 12
Byte
s
Number of Values
XML-uncompressedGoogle_protocol_buffersXML-compressed_ZLIB
XML-compressed_WBXMLIPFIX
DIAMETER
Fig. 12. Data volume when transporting mea-surement data using different protocols.
be handled by the RANs. All five curves are very similar as long as the number of usersis low. At around 80 users per km2, the curves split. Without a resource management,the system is almost saturated at this point. With 210 users per km2, the system runs at54% load. The actual realistic systems are able to run the system at 62% to 64% load,again the triggered resource management achieves the best results. Using the resourcemanagement with perfect information, the system runs at 76% load with 210 users perkm2.
RAN A (Figure 8) which consists of one large cell with high capacity is alwayswell-utilized for geographical reasons. The curve for “No RM” crosses the other curves.When the overall load is low, N-RM moves users from RAN B into RAN A when theyexperience bad signal quality in the center of the map. With a high user density, theload in RAN A becomes very high, so N-RM moves users away from RAN A — mostlyto RAN B. As expected, RAN B which has a higher overall capacity shows the oppositeeffect, but on a smaller scale (Figure 9).
The most interesting curve is the load in RAN C (Figure 10) which is equivalentto WLAN. Without resource management, the users will never switch to one of the

Resource Management Users per km2 Failed Sessions Data Volume per CellNone 56 2.28% 0.00 kBit/sCombined Reports (RP 10) 56 0.40% 0.01 kBit/sMaximum Information (RP 1) 56 0.09% 0.64 kBit/sNone 112 28.01% 0.00 kBit/sCombined Reports (RP 10) 112 22.09% 0.09 kBit/sMaximum Information (RP 1) 112 14.16% 1.18 kBit/s
Table 3. Data volume vs. success
very small RAN C cells but stay in RAN A or RAN B even when passing by a RAN Ccell. However, with N-RM, some users can be moved to RAN C, therefore the availablebandwidth of the whole network can be used better. This can be seen in Figure 10.
Finally, Figure 11 shows the number of handovers that occur in the system. Here onecan see that a perfect resource management results in a very large number of handovers.This is mostly due to the event-triggered nature of the N-RM, which takes action moreoften if it gets more input data. This is another type of overhead which can be causedby N-RM besides the signalling data on the backhaul links. Again there is a trade-offbetween the benefits like better load distribution and these extra handovers. There mightbe ways to improve this by using a more sophisticated resource management, howeverthis is out of scope for this publication.
5 Data Volume
So far, we have only been talking about the number of values that were sent through theGMI. In this section we will discuss the volume of management data which has to besent over the backhaul links for heterogeneous resource management.
In our implementation, the GMI uses an uncompressed XML data format. Howeverin a production environment it would be favourable to use more bandwidth-efficientprotocols. Basically any protocol which transmits key-value-pairs is suitable for trans-porting the GMI messages.
Figure 12 shows the performance of six different candidate protocols when trans-mitting a representatively chosen GMI dataset. This section estimates the practicallyrequired data volume. With each of the presented algorithm there are almost unlimitedpossibilities to encode the data differently which of course affects the volume. It shouldalso be noted that only application layer data volume is considered, there are no IP-headers and also no headers of the layer 4 protocols that might be used in combinationwith our six candidates (TCP, UDP, SCTP).
– Uncompressed XML has advantages in terms of transparency as the data is trans-mitted in plain text. However it wastes bandwidth on the expensive backhaul links.
– WBXML [8] is a standard by the Open Mobile Alliance, which replaces XML tagsby shorter binary strings, but leaves the actual content of the tags unchanged. Inabsence of a DTD, it builds a string table from the tag names and uses references

to this table afterwards, which was the case here. In our example the data has beencompressed to 69% of the size of the original XML.
– Google Protocol Buffers [9] is another representation which preserves the hierar-chical structure of XML. In the example the data was compressed to 45% of theoriginal size. The direct comparison with WBXML may be a bit unfair, as theProtocol Buffers encoder was able to use meta-information on the structure of thedocument. With a DTD, we would expect WBXML to perform roughly equivalentto Google Protocol Buffers.
– Diameter [10] is shown in this comparison as it is a common accounting protocolin 3GPP networks. It is the first protocol in the comparison, which has to map thedocument structure to flat key-value-pairs. However using meta-knowledge aboutGMI messages, the whole information can be reconstructed at the receiver. With ourexample data, the data volume used by Diameter was 25% of the original XML.
– IPFIX [11] is based on Cisco’s Netflow v9 protocol. It is basically meant to exporttraffic flow data, but it is flexible enough for our purpose. IPFIX also works onflat attribute-value-pairs, but on the link it separates the attributes from the values.The attributes are sent once in so-called template records in the beginning of thetransmission, while the values are sent separately in data records. It is also possibleto use options templates for redundancy reduction, so values like long strings thatappear in the data quite often only have to be sent once. Therefore IPFIX can savebandwidth compared to Diameter. Our data was compressed to 12% of the originalsize.
– The last candidate protocol is a simple LZ77-zipped [12] version of the originalXML data. The messages have not been compressed one by one, but the state onboth sides is held during the transmission of multiple messages. This method oftransmission is very efficient. In the long term, after 50 messages, the data volumecould be reduced to 7% of the original XML size. However this advantage comeswith increased costs in terms of memory and CPU-usage at sender and receiver.
For Table 3 the results from Section 4 have been combined with knowledge aboutmessage sizes. Here we assume data transport by IPFIX, which was the second-bestsolution in the comparison above, as we want to avoid the computational effort of com-pressing the data using LZ77. We also assume that each value is sent in a separate packet— which is a worst-case scenario — and add TCP and IP headers. As mentioned in Sec-tion 3.1, our granularity period is 15 seconds.
As we can see, heterogeneous access management gives a high benefit while usingvery little bandwidth. With 56 users per km2 in the system the result with our com-bined periodic and triggered reporting is almost as good as the result obtained with themaximum available information.
With 112 users per km2 the radio network is already overloaded as we can seefrom the success rate of the sessions. However the number of messages we need forN-RM still remains negligible compared to the amount of user data transferred throughHSDPA or LTE cells. Here one could even consider to send all available data (GP 1) tothe N-RM, which produces 14 times the data volume of the combined reports method,but still stays around 1 kBit/s per cell.

6 Related Work
In recent years, there has been a lot of research on handovers in heterogeneous net-works. The approaches in [13], [4] and [14] leave the decision which network to chooseto the mobile terminal. This is a reasonable design concept since the information aboutsignal quality of the surrounding base stations is available there, while with network-centric decision engines this information must be transported to the core network.Transporting this data also introduces undesired delay that leads to potentially impre-cise values.
On the other hand a management facility inside the network is able to take globalinformation, i.e. on the load situation into account and therefore is able to make bet-ter decisions. Additionally, it can help the mobile terminal to find adjacent networkswithout forcing it to scan for available access points which would deplete its batterypower.
The authors of [15] use a network-centric approach which basically integrates WLANinto an UMTS UTRAN network. Our approach attempts to be more general by abstract-ing the handover-logic from details of the RANs. The authors of [16] adjust load triggerson the network-side to optimize handover performance. This work is about the actualhandover decision process, i.e. in a combined GERAN/UTRAN network, while we pri-marily focus on data collection and intentionally keep the decision process as simpleas possible. In our approach ping-pong effects are mitigated by the score calculation ofthe local resource management (Algorithm 1).
The authors of [6] use a network-assisted policy-based approach. They’re using twodecision engines, one of which is located in the core network while the other resideson the mobile terminal. This scenario is also the base of our work, the GMI could beused here to provide the network- and RAN-related information which is required bythe decision engine on the network side.
A related standard is IEEE 802.21 [17], which specifies an information service,an event service and a command service to support heterogeneous access decisionsand therefore consists of several building blocks that were similarly realized for oursimulations. However IEEE 802.21 leaves the actual question of data transport open.
7 Conclusions
Today, users of mobile networks increasingly demand data services and voice-calls forflat prices. This makes business difficult for network operators, there is hard competitionon the market, and revenues are shrinking. Operators have to cut costs — one way to doso is increasing network efficiency. This requires heterogeneous networks, as differentaccess technologies have different strengths and weaknesses. It also leads to a need fornew methods of data collection, as smart management is needed to take advantage ofthe different networks.
We have shown that the flexibility provided by our GMI has advantages when mak-ing heterogeneous handover decisions. It is possible to take good decisions with fewerdata by switching between periodic reporting and setting triggers. Our simulation re-sults show that customer experience can be enhanced significantly, while the cost interms of produced overhead are comparably small.

Our concept of the GMI is not only suitable for heterogeneous access management,but also for general management or security tasks (e.g. distributed intrusion detection).If the GMI was be used for those purposes as well, the compression gains could be evenlarger because the multicast distribution and caching of measurement parameters.
8 Acknowledgements
The authors would like to thank Andreas Monger and Mark Schmidt for their work onthe GMI concept and implementation, Vladimir Maldybaev for his help regarding theevaluation and Frank-Uwe Andersen for the basis of Figure 2.
References
1. IEEE802.16, “Air Interface for Fixed Broadband Wireless Access Systems,” IEEE Standardfor Local and Metropolitan Area Networks, Oct. 2004.
2. 3GPP, “TS 23.401 v8.4.1: General Packet Radio Service (GPRS) enhancements for EvolvedUniversal Terrestrial Radio Access Network (E-UTRAN) access,” 2008.
3. ——, “TS 23.402 v8.4.1: Architecture enhancements for non-3GPP accesses,” 2008.4. H. J. Wang, R. H. Katz, and J. Giese, “Policy-Enabled Handoffs Across Heterogeneous Wire-
less Networks,” in WMCSA ’99: Proceedings of the Second IEEE Workshop on Mobile Com-puter Systems and Applications. Washington, DC, USA: IEEE Computer Society, 1999,p. 51.
5. A. Monger, M. Fouquet, C. Hoene, G. Carle, and M. Schlager, “A metering infrastructurefor heterogeneous mobile networks,” in First International Conference on COMmunicationSystems and NETworkS (COMSNETS), Bangalore, India, Jan. 2009.
6. C. Fan, M. Schlager, A. Udugama, V. Pangboonyanon, A. C. Toker, and G. Coskun, “Manag-ing Heterogeneous Access Networks. Coordinated policy based decision engines for mobil-ity management,” in LCN ’07: Proceedings of the 32nd IEEE Conference on Local ComputerNetworks. Washington, DC, USA: IEEE Computer Society, 2007, pp. 651–660.
7. 3GPP, “TS 32.401 V8.0.0: Telecommunication management; Performance Management(PM); Concept and requirements (Release 8),” 2008.
8. B. Martin and B. Jano, “WAP Binary XML Content Format,”http://www.w3.org/TR/wbxml/, 1999.
9. Google Inc., “Protocol Buffers,” http://code.google.com/apis/protocolbuffers/, 2008.10. P. Calhoun, J. Loughney, E. Guttman, G. Zorn, and J. Arkko, “Diameter
Base Protocol,” RFC 3588 (Proposed Standard), Sept. 2003. [Online]. Available:http://www.ietf.org/rfc/rfc3588.txt
11. B. Claise, “Specification of the IP Flow Information Export (IPFIX) Protocol for theExchange of IP Traffic Flow Information,” RFC 5101 (Proposed Standard), Jan. 2008.[Online]. Available: http://www.ietf.org/rfc/rfc5101.txt
12. J. Ziv and A. Lempel, “A universal algorithm for sequential data compression,” IEEE Trans-actions on Information Theory, vol. 23, pp. 337–343, 1977.
13. V. Gazis, N. Alonistioti, and L. Merakos, “Toward a generic ”always best connected” capa-bility in integrated WLAN/UMTS cellular mobile networks (and beyond),” Wireless Com-munications, IEEE, vol. 12, pp. 20–29, 2005.
14. E. Stevens-Navarro and V. Wong, “Comparison between vertical handoff decision algorithmsfor heterogeneous wireless networks,” Vehicular Technology Conference, 2006. VTC 2006-Spring. IEEE 63rd, vol. 2, pp. 947–951, May 2006.

15. R. Pries, A. Mader, and D. Staehle, “A Network Architecture for a Policy-Based HandoverAcross Heterogeneous Networks,” in OPNETWORK 2006, Washington D.C., USA, Aug2006.
16. A. Tolli and P. Hakalin, “Adaptive load balancing between multiple cell layers,” VehicularTechnology Conference, 2002. Proceedings. VTC 2002-Fall. 2002 IEEE 56th, vol. 3, pp.1691–1695 vol.3, 2002.
17. IEEE802.21, “Media Independent Handover Services,” http://www.ieee802.org/21/, 2007.