data collection and review - new jersey data collection and review ... cso long-term control plan...
TRANSCRIPT

NJDEP | Rebuild by Design – Hudson River Feasibility Study |Data Collection| 17
4 Data Collection and Review
As part of the feasibility assessment, Dewberry coordinated with various stakeholders such as City of Hoboken,
City of Jersey City, Town of Weehawken, Hudson County, North Hudson Sewerage Authority (NHSA), NJ
Transit, Hartz Mountain, utility companies and others to obtain various datasets that allowed to understand
the existing site constraints and opportunities to implement feasible “Resist” and “DSD” strategies. Various
types of reports, Geographic Information System (GIS) and Computer Aided Design (CAD) from various local,
state and federal agencies were collected and evaluated for its applicability to the RBDH project. A brief
description of the data collected and the project’s datum used for the maps and drawings is provided in the
following sections -
4.1 Project Datum
The projection used for this project is the State Plane New Jersey FIPS 2900 Feet. The horizontal datum is
North American Datum of 1983 (NAD83). The vertical datum used for this project is North American Vertical
Datum of 1988 (NAVD88). However, the data collected for this project varied with respect to vertical datum.
Several data sources were referenced to National Geodetic Vertical Datum of 1929 (NGVD29). The conversion
factor from NAVD 88 to NGVD 29 is +1.1 (NAVD 88 = NGVD29 – 1.1). The Universal Transverse Mercator
(UTM) Zone 18N horizontal projection system with elevation values in meters-NAVD 88 datum was used to
setup and simulate hydrodynamic coastal and stormwater models. All the results from these models were
converted from meters to feet-NAVD88 datum.
4.2 Existing Data Inventory
Existing secondary source data were collected from various sources, including New Jersey Department of
Environmental Protection (NJDEP), the City of Hoboken, City of Jersey City, Town of Weehawken, Hudson
County, New Jersey Transit, North Hudson Sewerage Authority (NHSA), United Water, PSEG, Verizon,
Cablevision, Steven’s Institute of Technology, the Federal Emergency Management Agency (FEMA), the
National Oceanic and Atmospheric Administration (NOAA), U.S. Geological Survey (USGS), Hartz Mountain
Industries and others. Applicable inventory of secondary source data, its description and the format
(Geographic Information System (GIS), Computer Aided Design Drawing (CAD) or Adobe Post Document
Format (PDF)) is shown in Table 4-1. Additionally, Dewberry completed a thorough walkthrough of the study
are and logged photographs which can be found in Appendix A. Relevant data was used to develop base maps
of the study area (Appendix B).

NJDEP | Rebuild by Design – Hudson River Feasibility Study |Data Collection| 18
Table 4-1. Summary of Data Inventory
Data Source Data Type Format
NJDEP
2012 Land Cover GIS
2007 LiDAR for Hudson County, NJ GIS
OMA’s Rebuild by Design Proposal Report for “Resist, Delay, Store, Discharge” PDF
NJ Transit
Long Slip Canal Bathymetry CAD
Long Slip Canal Fill and Rail Enhancement Project Interim Report PDF
NJ Transit’s Hoboken Terminal Survey CAD
Hudson Bergen Light Rail (HBLR) Project Drawings PDF
City of Hoboken
Zoning Map GIS/PDF
Tidelands Map PDF
City of Hoboken Master Plan (2004) and City of Hoboken Reexamination Report (2010) PDF
Building a Resilient City Design Guidelines Draft – June 2015 PDF
Design Drawings for several buildings located in the northern portion of Hoboken PDF
Stormwater Management Calculations for City Hall Green Infrastructure Project PDF
Parcels Database (2015) GIS
Various Redevelopment Plans including Hudson Yards Redevelopment Plans GIS/PDF
Sinatra Drive Complete Streets Redesign Study (2014) PDF
Pier A and C Drawings PDF
“Complete Street” Redesign of Washington Street: Technical Memorandum- Pavement Coring Analysis and additional project documents PDF
ROW Bioswale/ Curb Extension Rain Gardens Plans and Borings for 1st Street PDF
Sinatra Park Drawings and Geotechnical Report PDF
Transportation Safety Information (Vehicular, Bicycle, and Pedestrian Collision 2007-2011) XLS
Transportation GIS Shapefiles and Geodatabases (parking, loading zones, bike paths, Hoboken Terminal, bus shelters/stops/lines, light
rail line/stations, Path line, ferry routes, PATCO line, NJ Transit commuter rail line/stations, NYC railroad) GIS
Land Use Planning GIS Shapefiles and Geodatabases (building footprints, blocks, historical sites, etc.) GIS
Environment/Utility GIS Shapefiles and Geodatabases (parks, substations, trees, energy surety design methodology, historic fill, fire
hydrants, law enforcement, fire stations, hospitals, schools, generators, garages) GIS
Locations for on-going Green Infrastructure and previously completed stormwater management projects GIS
Washington Street Reconstruction PDF

NJDEP | Rebuild by Design – Hudson River Feasibility Study |Data Collection| 19
Data Source Data Type Format
Hoboken Green Infrastructure Strategic Plan PDF
Southwest Resiliency Park (Block 12) and Washington Street Rain Gardens Project PDF/CAD
Waterfront Inspection Reports (2011) PDF
City of Jersey City
Jersey City Redevelopment Plans PDF
Stormwater Management Plan 2008 PDF
GIS Shapefiles and Geodatabases (elevations at grade, ferry docks, historical sites, drainage area, parcels, zoning) GIS
Hudson County
Observer Highway Plans PDF
Hudson River Walkway and Outfalls PDF
Hudson County Hazard Mitigation Plans PDF
Town of Weehawken Plan of Harbor View Village at Lincoln Harbor PDF
Hartz Mountain Industries, Inc. Topographic Survey of Weehawken Waterfront walkway PDF
Steven’s Institute of Technology
Weehawken Cove Bathymetry GIS
Street Scale Modeling of Storm Surge Inundation along New Jersey Hudson River Waterfront along with associated observed High Water
Mark data PDF
FEMA 2015 Updated Preliminary FEMA Flood Insurance Study for Hudson County GIS and PDF
NOAA Hydrographic Surveys (2012, 2013) GIS
USGS Land Cover and Impervious Data GIS
Post Sandy LiDAR Data GIS
NHSA
Sewer Network: Inlets, Manholes, Outfall, Sewer Lines, Facility Points/Polygons, Sewersheds GIS
CSO Long-Term Control Plan Feasibility Study: Adams Street CSO Control PDF
Fiscal Year 2011 Annual Report PDF
NHSA’s facility level hydrologic and hydraulic model Infoworks
Verizon As-built Drawings of Utility Locations PDF
United Water Geodatabase containing Water Mains, Service Laterals, etc. GIS
Cablevision Utility Locations CAD
PSEG Utility Locations GIS
Jersey City MUA Hydrology and Hydraulic Models and As-built plans of JCMUA system within study area SWMM/PDF
NJDEP | Rebuild by Design – Hudson River Feasibility Study |Data Collection| 20
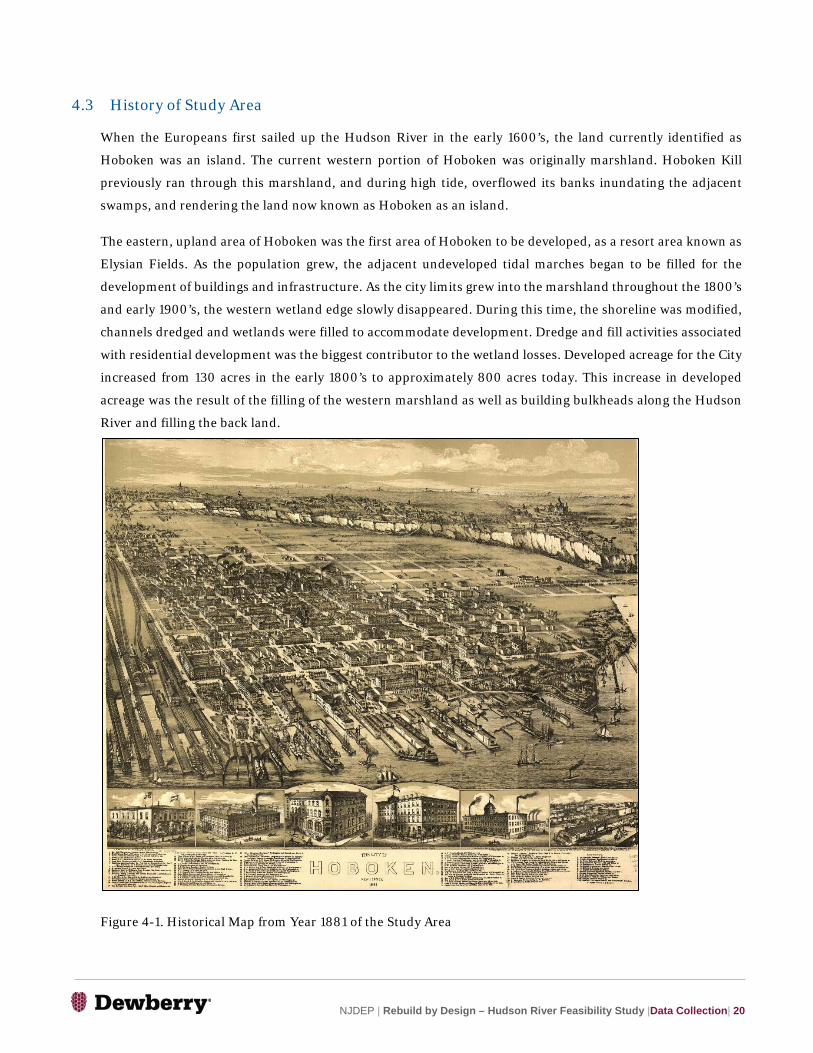
4.3 History of Study Area
When the Europeans first sailed up the Hudson River in the early 1600’s, the land currently identified as
Hoboken was an island. The current western portion of Hoboken was originally marshland. Hoboken Kill
previously ran through this marshland, and during high tide, overflowed its banks inundating the adjacent
swamps, and rendering the land now known as Hoboken as an island.
The eastern, upland area of Hoboken was the first area of Hoboken to be developed, as a resort area known as
Elysian Fields. As the population grew, the adjacent undeveloped tidal marches began to be filled for the
development of buildings and infrastructure. As the city limits grew into the marshland throughout the 1800’s
and early 1900’s, the western wetland edge slowly disappeared. During this time, the shoreline was modified,
channels dredged and wetlands were filled to accommodate development. Dredge and fill activities associated
with residential development was the biggest contributor to the wetland losses. Developed acreage for the City
increased from 130 acres in the early 1800’s to approximately 800 acres today. This increase in developed
acreage was the result of the filling of the western marshland as well as building bulkheads along the Hudson
River and filling the back land.
Figure 4-1. Historical Map from Year 1881 of the Study Area

NJDEP | Rebuild by Design – Hudson River Feasibility Study |Data Collection| 21
From 1887 to 1988, the first few blocks inland from the waterfront consisted of a variety of commercial and
industrial operations that supported daily living and development (banking, hotel, lumber, coal, iron works,
cattle, food, etc.). The southern portion of the project area has consisted of a large railroad terminal
transportation operations from before 1885 until the present. By 2006, most of the industrial operations along
the waterfront were no longer present, and those areas had been converted into open space, residential or office
buildings. North of the railroad and west of the near-waterfront, the inland areas were sparsely developed with
primarily residential properties prior to 1937. After this time, some industrial/manufacturing properties were
in operation, until the mid-1960s to early-1970s. However, most of the area has since become residential and
commercial with an occasional industrial/manufacturing property.
4.4 Flooding Conditions in the Study Area
The study area is vulnerable to two interconnected types of flooding: coastal flooding (both from storm surges
as well as high tides) and systemic inland flooding (rainfall) which occurs during high intensity longer duration
rainfall events (Rutgers University, 2014). These flooding problems are attributed to several factors, including
naturally low topography and proximity to waterways; impervious surface coverage and associated runoff;
existing, relatively old, sewer infrastructure with interconnected storm and sanitary sewer lines and
insufficient discharge capability particularly during high tide. The duration of the rainfall events versus the
duration of peak storm surge, as well as the timing between the two types of events can have a significant
impact on the amount of inland flooding seen in Hoboken.
Coastal Flooding Condition
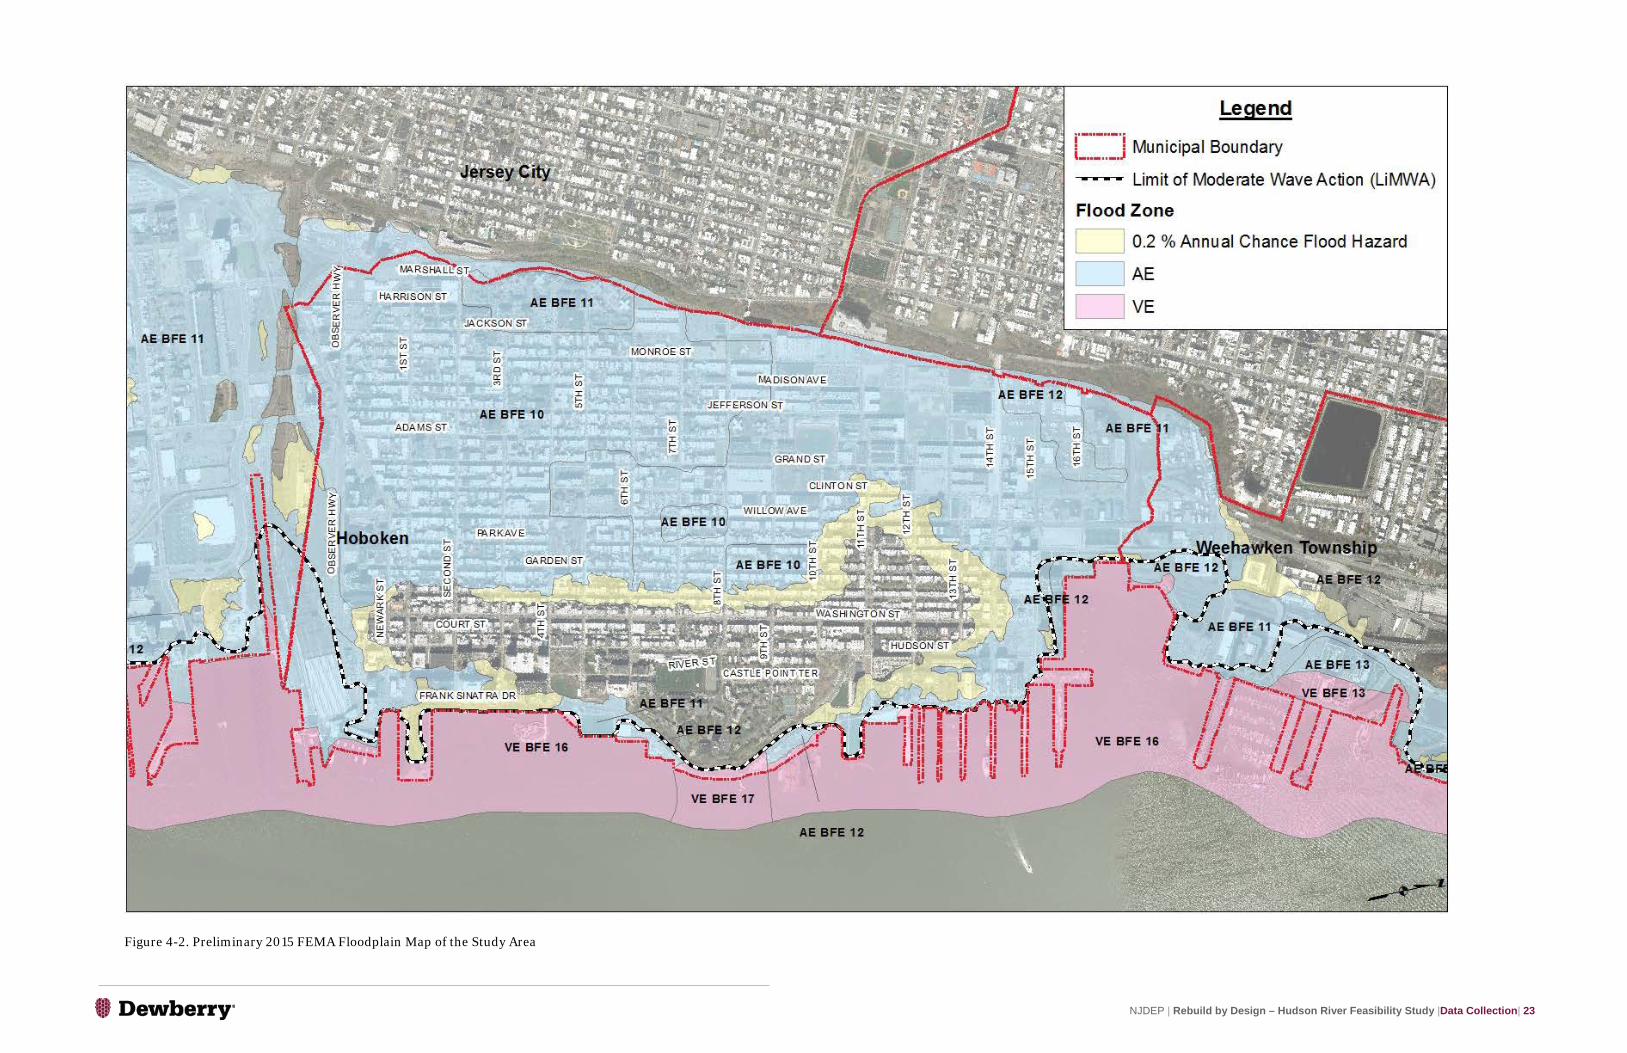
According to FEMA's Preliminary Flood Insurance Study of Hudson County, New Jersey (FEMA, 2013 and
2015), the most severe flooding for the coastal communities of Hudson County occurs from coastal storm
surges during hurricanes. Figure 4-2 shows a map of the preliminary 1% (100-year) and 0.2% (500-year)
annual-chance event floodplain delineated by FEMA (FEMA, 2015) in the study area. Approximately 73
percent, or 16,800 parcels of land, within the Study Area are within the 1% annual-chance floodplain (Zone
AE/VE). The AE and VE zones are both 1% annual-chance floodplains, but the VE zone, which is usually along
coastlines and typically does not extend beyond the waterfront (the streets, parks and esplanade directly
bordering the Hudson River), is also subject to storm-induced velocity wave actions where the wave heights
are greater than 3 feet. About 4% of the land within the Study Area is within the VE zone and has base flood
elevations (BFEs) of between 16 and 17 feet North American Vertical Datum (NAVD) 88. The majority of the
Study Area (69%) is within the AE flood zone, with BFEs of between 10 and 12 feet NAVD 88. The AE flood
zone is further divided by the Limit of Moderate Wave Action (LiMWA) line, where between this line and the
VE zone wave heights are between 1.5 feet and 3 feet. Landward of the LiMWA to the 1-percent-annual-chance
boundary wave heights are less than 1.5 feet. Figure 4-2 also shows the preliminary 0.2-percent-annual-chance
floodplain that is mapped using the 0.2-percent-annual-chance still-water elevations only.
NJDEP | Rebuild by Design – Hudson River Feasibility Study |Data Collection| 22
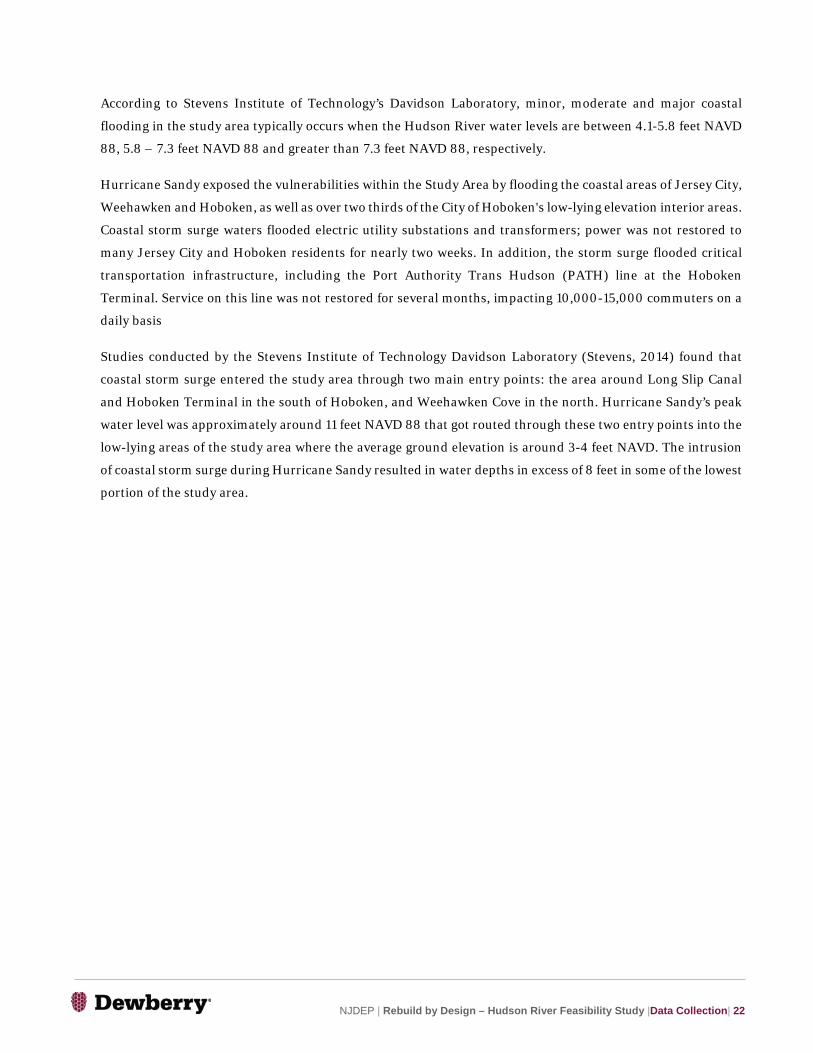
According to Stevens Institute of Technology’s Davidson Laboratory, minor, moderate and major coastal
flooding in the study area typically occurs when the Hudson River water levels are between 4.1-5.8 feet NAVD
88, 5.8 – 7.3 feet NAVD 88 and greater than 7.3 feet NAVD 88, respectively.
Hurricane Sandy exposed the vulnerabilities within the Study Area by flooding the coastal areas of Jersey City,
Weehawken and Hoboken, as well as over two thirds of the City of Hoboken's low-lying elevation interior areas.
Coastal storm surge waters flooded electric utility substations and transformers; power was not restored to
many Jersey City and Hoboken residents for nearly two weeks. In addition, the storm surge flooded critical
transportation infrastructure, including the Port Authority Trans Hudson (PATH) line at the Hoboken
Terminal. Service on this line was not restored for several months, impacting 10,000-15,000 commuters on a
daily basis
Studies conducted by the Stevens Institute of Technology Davidson Laboratory (Stevens, 2014) found that
coastal storm surge entered the study area through two main entry points: the area around Long Slip Canal
and Hoboken Terminal in the south of Hoboken, and Weehawken Cove in the north. Hurricane Sandy’s peak
water level was approximately around 11 feet NAVD 88 that got routed through these two entry points into the
low-lying areas of the study area where the average ground elevation is around 3-4 feet NAVD. The intrusion
of coastal storm surge during Hurricane Sandy resulted in water depths in excess of 8 feet in some of the lowest
portion of the study area.
NJDEP | Rebuild by Design – Hudson River Feasibility Study |Data Collection| 23
Figure 4-2. Preliminary 2015 FEMA Floodplain Map of the Study Area

NJDEP | Rebuild by Design – Hudson River Feasibility Study |Data Collection| 24
Rainfall Flooding Condition
The NHSA, which provides storm and sanitary sewer utility service to the Study Area, has a combined sewer
system that was built in two periods, during the 1850s, and from the 1920s to the 1940s. The combined sewer
system handles both sanitary sewerage and stormwater runoff. Hoboken is divided into seven main drainage
areas (H1-H7, see Figure 4-3). Sewerage is conveyed through the system by gravity from its source (e.g., a
residence or business) through combined sewer mains beneath street beds to the system’s main interceptor
pipelines. During dry conditions, a system of pump stations located within the NHSA’s service area pumps the
sewerage to the NHSA’s Adam’s Street Wastewater Treatment Plant (WWTP). This WWTP serves Hoboken,
Weehawken and Union City. During rainstorms, stormwater (i.e., rainfall runoff) flows into the combined
sewer mains via street and curb inlets, and combines with the sanitary sewerage. If the combined sewer-flow
volume exceeds the maximum volume capacity (between 32 and 36 million gallons per day) of the WWTP, a
portion of the combined sewer volume is either being pumped or overflows into the Hudson River through the
various outfalls located along Hoboken’s waterfront.
Inland flooding occurs when the combined sewer system is unable to outflow excess water into the Hudson
River. This typically occurs when high volumes of water are brought into the combined sewer system during a
high tide and/or storm surge and the outfalls are closed and are unable to discharge. Rainfall events of greater
than two inches, combined with a high tide of four feet or greater, occurred 26 times in Hoboken from 2002 to
2012 (Rutgers, 2014). This is expected to increase in frequency over time based on projections of sea levels
rising. As a result, high tides and storm surges are expected to block or obstruct the outfalls for increasingly
longer periods of time. The City of Hoboken has identified hot spot flooding areas that are typically flooded
during a high intensity rainfall event (see Figure 4-3).

NJDEP | Rebuild by Design – Hudson River Feasibility Study |Data Collection| 25
Figure 4-3. Map of Typical Hot Spot Rainfall Flooded Areas within NHSA Sewersheds

NJDEP | Rebuild by Design – Hudson River Feasibility Study |Data Collection| 26
4.5 Topography and Bathymetry Data
Topographical and bathymetric data was retrieved from a number of sources. The following sources were used
in gathering topographical and survey data: the USGS provided post Sandy LiDAR data (2013), NJ Transit
provided Hoboken Terminal survey data (2013), and Dewberry collected waterfront survey data (2015). The
following sources were used in gathering bathymetric data: NOAA provided hydrographic surveys (2012,
2013), Stevens Institution provided the Weehawken Cove bathymetry, and NJ Transit provided the Long Slip
Canal bathymetry (2015).
4.6 Geotechnical Data
Existing geological and geotechnical data in the project area, especially along the proposed hurricane and storm
resistance structures were collected from various sources. The following subsurface information was collected,
reviewed and, used in the analysis for the report. This information is included in Appendix C.
• Dewberry boring logs from previous projects at Hoboken – 4 borings at Hoboken Terminal Area
• Historic boring and geotechnical laboratory information:
o NJDOT project – 76 borings at Hoboken terminal and NJ Transit railroad area
o PANYNJ project– 135 borings along South Sinatra Drive area between Newark and 4th Street
o Hudson County project – 10 borings near the intersection of North Sinatra Drive and 14th Street
o McLaren Engineering Group borings – 2 borings at Hoboken Cove area along Tea Building
o Boswell Engineering borings and test pits – Sinatra Park area near the 5th Street and Sinatra Drive
• USGS, NJDEP Geologic maps of Hoboken, Weehawken and Jersey City area
o Surficial Geology of the Jersey City (1995),
o Surficial Geology of Weehawken and Central Park Quadrangle, Hudson and Essex Counties, New Jersey
(1993) by New Jersey Geologic Survey
o Bedrock and Engineering Geology Maps of New York County and parts of Kings and Queens Counties,
New York, and parts of Bergen and Hudson Counties, New Jersey (1994) by United States Geologic Survey
4.7 Utilities Data
The spatial locations of various surface and subsurface utilities were obtained in either digital or paper format
from the following utility companies -
• North Hudson Sewerage Authority (NHSA) -Storm-Sewer network in Hoboken and Weehawken
• Public Service Enterprise Group (PSEG) – Electric and Gas
• Verizon – Communications (Telephone and Internet)
• Cable Vision – Cable Television
• United Water – Drinking Water
• Jersey City Municipal Utilities (JCMUA) – Storm-Sewer network in Jersey City

NJDEP | Rebuild by Design – Hudson River Feasibility Study |Data Collection| 27
Figure 4-4. Map Showing Spatial Location of Various Sources of Topography and Bathymetry

NJDEP | Rebuild by Design – Hudson River Feasibility Study |Data Collection| 28
It should be noted that surface and subsurface utility data such as electric conduits and others owned by NJ
Transit and Port Authority of New York and New Jersey (PANYNJ) were not obtained.
4.8 Environmental Data
In order to understand the potential impacts of the project on the built and natural environment, information
on the following resources was collected including: geology, soils, wetlands, floodplains, aquatic ecology,
terrestrial vegetation and wildlife, surface waters, groundwater, hazardous waste, air quality, noise,
archaeological resources, historic buildings/districts, minority and low income populations, land use and open
space. This information was collected from sources including:
• GIS data layers
• Site visits
• Regulatory databases
• Historic maps and resources
4.9 Key Past Studies/Reports
An extensive review of related reports and studies applicable to the study area were conducted. The summaries
below include some of the key points from each of the selected studies.
4.9.1 Rebuild by Design “Resist, Delay, Store, Discharge” Proposal
As a part of the Rebuild by Design competition in 2014, OMA submitted a proposal to provide a comprehensive
urban water strategy for the City of Hoboken. The approach set out in the proposal establishes the four
components of the strategy (Resist, Delay, Store, and Discharge) and consisted of an assessment of the flood
risk in the community, a stakeholder and funding framework, an implementation plan, and a benefit-cost
analysis. The objectives listed in the proposal were to manage water, mitigate flood insurance, and deliver co-
benefits. The report stresses that a discreet one-house-at-a-time solution will not work for such a complex
urban environment such as Hoboken. The strategy outlined in the proposal incorporates both hard
infrastructure and soft landscape design elements for the “Resist” portion, policy recommendations,
guidelines, and urban infrastructure for the delay portion, interconnected green infrastructure for the store
portion, and pumps for the discharge portion of the strategy.
OMA completed a flood risk assessment for both storm surge and urban stormwater flooding conditions,
independently. The storm surge safety level (Design Flood Elevation) was arrived at after an analysis which
consisted of collection of hydraulic boundary conditions, determination of potential investments in flood
protection, and completion of a damage assessment. Ultimately, the flood risk assessment determined that a
storm surge safety level for a 0.2-percent-annual-chance storm should be the new standard of flood protection
for Hoboken.

NJDEP | Rebuild by Design – Hudson River Feasibility Study |Data Collection| 29
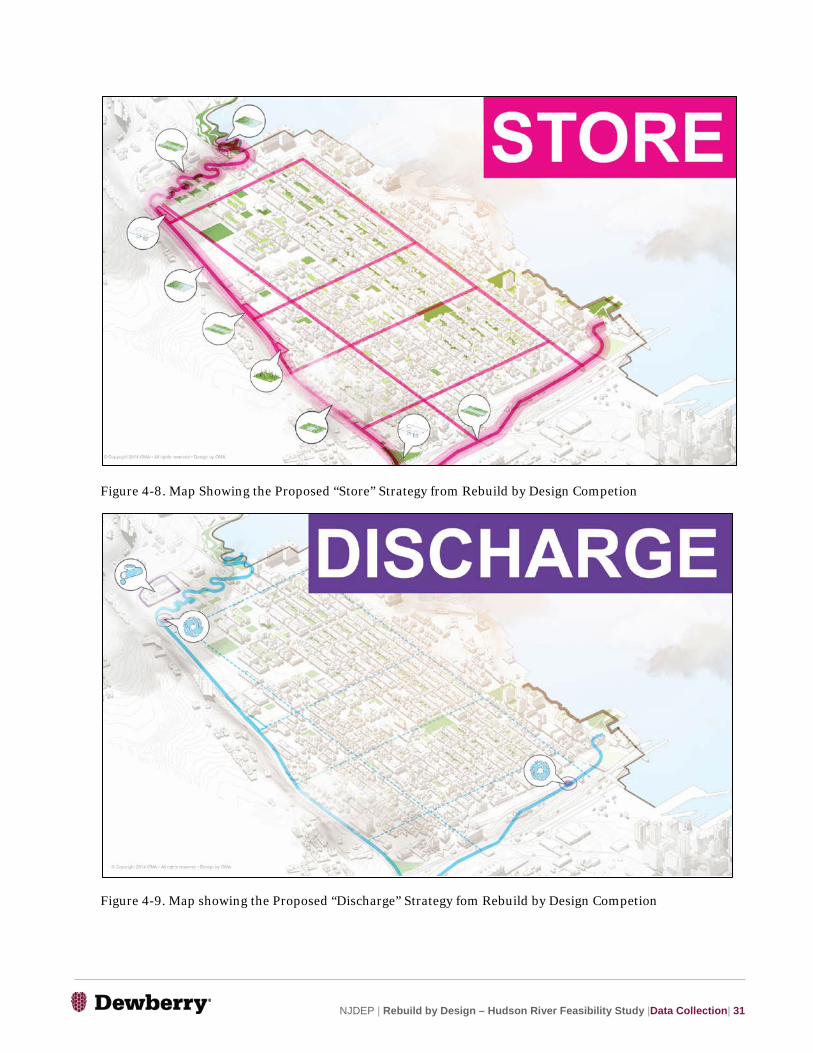
Figure 4-5 shows the comprehensive master plan strategy laid out by OMA in the Rebuild by Design proposal.
Figures 4-6 to 4-8 show the four components - “Resist, Delay, Store, Discharge” – and the potential
interventions that can be utilized in these components that would reduce the flood risk for the City of Hoboken.
The proposed intervention location to implement these four strategies relied mostly on privately owned
properties.
Figure 4-5. Map Showing the Proposed Comprehensive Water Strategy for City of Hoboken from Rebuild by Design Competion

NJDEP | Rebuild by Design – Hudson River Feasibility Study |Data Collection| 30
Figure 4-6. Map Showing the Proposed “Resist” Alignment Strategy from Rebuild by Design Competion
Figure 4-7. Map showing the Proposed “Delay” Strategy fom Rebuild by Design Competion
NJDEP | Rebuild by Design – Hudson River Feasibility Study |Data Collection| 31
Figure 4-8. Map Showing the Proposed “Store” Strategy from Rebuild by Design Competion
Figure 4-9. Map showing the Proposed “Discharge” Strategy fom Rebuild by Design Competion

NJDEP | Rebuild by Design – Hudson River Feasibility Study |Data Collection| 32
4.9.2 Hoboken Green Infrastructure Strategic Plan
In October 2013, Together North Jersey (a coalition consisting of the City of Hoboken, Hudson County, North
Hudson Sewerage Authority, Stevens Institute of Technology, and New Jersey Transit, among others)
published a strategic plan (the plan) for incorporating green and/or infrastructure into the community of
Hoboken in order to reduce the surface runoff that enters the North Hudson Sewerage Authority (NHSA)
combined sewer system. The goal is to enable the sewer system to capably send sewage and wet weather flow
to the Adams Street Wastewater Treatment Plant while limiting the amount of combined sewer overflows
(CSOs) and flooding. Currently, the wastewater treatment plant is overtaxed by combined flow due to a storm
event, on average, five times every month. The strategic plan focused on five main tasks:
• Creating a framework for green infrastructure on both a city-wide and district by district basis;
• Identifying the most cost-effective best management practices (BMPs) that the City could employ for
stormwater management;
• Understanding how these measures can improve resilience in Hoboken, and of the transit
infrastructure in particular;
• Locating and prioritizing the assets most in need of protection;
• Developing a set of strategies the City can use to implement the strategic plan
Ultimately, the plan organized the City into three zones based on the infiltration and stormwater carrying
capacity of the subsurface: the Gray Zone, the Green Zone, and the Blue Zone (as shown in Figure 4-10). The
Gray Zone, which consisted of the eastern side of Hoboken, has a shallow depth to bedrock and therefore is not
conducive to infiltration. Applicable BMPs in this zone include above ground strategies such as green roofs and
rainwater harvesting. The Green Zone encompasses portions of the interior of Hoboken and contains a greater
depth to bedrock and soils that are conducive to infiltration. Applicable BMPs in this zone include vegetated
strategies such as bioswales and stormwater planters. The Blue Zone, which runs along the western edge of
Hoboken and lies adjacent to critical New Jersey Transit (NJT) infrastructure, contains the lowest elevations
in the City and may be useful for stormwater retention strategies such as constructed wetlands or subsurface
detention.
The BMPs units are primarily proposed to mitigate flooding conditions in existing low lying (hot spots) areas
of the City. Most of the proposed DSD elements are not intended to be an infiltration practice due to low soils
permeability rate and high groundwater table elevation.

NJDEP | Rebuild by Design – Hudson River Feasibility Study |Data Collection| 33
Figure 4-10. Map of Three Zones Identified in the Green Infrastructure Strategic Plan
Additionally, the plan identified sewersheds (as identified by the NHSA) which should be targeted for strategic
green infrastructure implementation. The plan found that interconnections between H1 and H3/H4 may be
causing an increase in localized flooding in the low lying areas of those sewersheds. It was also determined that
the H3 sewershed has subsurface geology that is not ideal for installation of vegetated green infrastructure
while the H7 sewershed has ideal subsurface geology for green infrastructure. Ultimately, the plan
recommended the H1, H4, H5, and H7 sewersheds for implementation of green infrastructure opportunities.
The plan also conducted a survey to determine the areas within the City of Hoboken that is most prone to
flooding. As a result of the survey, it was confirmed that the worst flooding typically occurs in the H1, H4, and
H5 sewersheds.
4.9.3 Hoboken Master Plan (2004) and Reexamination Report (2010)
The City of Hoboken issued its Master Plan in 2004 and a re-examination of that plan in 2010. The former
plan established recommendations for development and design in Hoboken while the latter examined the
status of those objectives and provided recommended changes to the original plan. The Hoboken Master Plan
aimed to position Hoboken as a new type of “urban village” that utilizes unique planning techniques to
incorporate new technologies while maintaining and preserving the identity and historical character of the city.
The plan identifies that Hoboken is already the type of community it seeks: a compact, walkable, transit-
accessible community with a mix of land uses. The goal of the plan is to help ensure that future development
is balanced and does not upset this existing identity. The plan’s key ideas and initiatives can be organized into
NJDEP | Rebuild by Design – Hudson River Feasibility Study |Data Collection| 34
the following themes: transportation, community facilities, parks, housing, economic development, land use,
and design.
In the theme of transportation, the plan focuses future improvements to make walking and biking safer, transit
access more convenient with the expansion of light rail service, and parking more available. The 2010
Reexamination Report (the Report) identifies that parking, biking and pedestrian issues have begun to be
addressed. Bike lanes have been added throughout Hoboken and expanded car sharing programs have been
initiated for people who do not own a car but may need one occasionally. Among the recommendations in the
Report is to update the Circulation and Parking Element and transform it into a Sustainable Transportation
Plan, lower speed limits to improve pedestrian safety, and to consider requiring a transportation impact
analysis for any project that exceeds a certain established threshold.
Within the parks and open space theme of the Master Plan, the amount of park area is expected to triple within
10 years of the plan to 60 acres of park land. The vision includes an urban greenway that will connect the entire
waterfront with a pedestrian walkway and parks to create a synergy amongst the park system. Parks, ballfields,
and other open space elements will be built in redevelopment areas that are currently lacking in them. The
report identifies that as of 2010, the updated count of open space in the City is more than 48 acres which brings
the open space ratio to 0.96 acres per 1000 people. This is significantly lower than the ration for New York City
which is 2.5 acres per 1000 people. Some of the recommendations in the Report regarding open space include
pursuing a County/multi-jurisdictional park in the southern portion of the City, creating a plan for the
financing and acquisition of open space, creating a central location such as an office for all developer
agreements and other approvals to be made, and beginning the discussion of climate change and mitigation
strategies.
4.9.4 Hoboken Strategic Recovery Planning Report (2014)
The Strategic Recovery Planning Report engages planners to evaluate the impacts of natural disasters on
relevant community features in the City of Hoboken. The evaluation focuses on planning goals, strategies, and
priorities that are most necessary for public safety and economic recovery. It serves as a guide for actions to be
taken and lists all planned or completed projects. The recovery and resiliency plan that was developed by the
City of Hoboken addressed vulnerabilities in the following sectors: energy resiliency, shoreline protection,
flood mitigation, stormwater management, critical facilities/infrastructure, emergency notification, public
information, resilient building codes, and resiliency task force. The City of Hoboken, identified 16 critical
community facilities, 14 of which lie within the FEMA 1-percent-annual-chance and 0.2-percent-annual-
chance floodplains. These facilities include the NHSA sewerage treatment plant, three PSEG substations, three
fire stations, the fire station headquarters, the hospital, ambulance corps, the community center, a shelter at
3rd and Bloomfield, the Wallace School shelter, police headquarters, city hall, and the DPW garage. Below is a
list that briefly summarizes the steps and/or projects that the City has initiated as of the completion of the
report. Mitigation measures that used the post Sandy Advisory base Flood Elevation maps produced by FEMA
to set design heights would be based on higher flood elevations than the 2015 Preliminary FIRMs.
NJDEP | Rebuild by Design – Hudson River Feasibility Study |Data Collection| 35
• Energy resiliency: the City has worked with numerous state and federal constituents to design a
“Micro-grid” and in conjunction with PSEG’s “Energy Strong” program, will ensure uninterrupted
service to designated critical facilities in Hoboken.
• Shoreline protection: two projects in the Hoboken area were selected to receive federal funding for
comprehensive protection strategies. The first is part of the Rebuild by Design competition to design
and build coastline defenses and the second is through NJ Transit to eliminate the Long Slip Canal.
Additionally, the City plans to examine the feasibility of incorporating coastal surge protection into
the design of the 1600 Park Avenue/Hoboken Cove park project at Weehawken Cove.
• Flood mitigation: The NHSA has applied for Hazard Mitigation funding to construct new wet weather
pump stations to alleviate flooding during high tides. In addition, the city submitted a Letter of Intent
(LOI) for a $9 Million loan to install a new wet weather pump station at 11th Street.
• Stormwater management: the City has applied to the State of New Jersey for funding to purchase
three tracts of land within the flood hazard area to be used for parks or open space with stormwater
retention incorporated to reduce stormwater runoff and flooding. The City has also received funding
in technical assistance from Re.Invest Initiative to design green infrastructure and from Together
North Jersey to examine the sewer system and quantify the benefits of green infrastructure. Finally,
the city also received funding from the National Fish and Wildlife Foundation and Sustainable Jersey
for independent green infrastructure projects.
• Critical facilities/infrastructure: the City has been awarded funding to prepare a Municipal Hazard
Mitigation Plan and also an Open Space, Recreation, and Historic Preservation Plan. Additionally,
funding was received to prepare a 5 year Capital Improvement Plan.
• Emergency notification: the City has applied for funding to purchase programmable, solar powered,
mobile message boards which can be quickly deployed during emergencies to inform residents and
motorists of information and/or instructions ahead of an impending hazard.
• Public information: the City has applied for funding to engage in a public awareness campaign to
inform residents of the natural and man-made hazards that the community faces and recommend
that residents develop preparedness plans.
• Resilient building codes: the City has worked with FEMA, NJDEP, and the NJ Department of
Community Affairs (NJDCA) to revise the city’s zoning code to allow for “wet proofing” and “dry
proofing” of ground level floors below the Base Flood Elevation (BFE). In particular, the City is hoping
to allow residential and mixed-use buildings to have usable ground floors below the BFE.
Additionally, the City has been awarded funding to update its design standards and stormwater
management and floodplain protection zoning ordinances.
• Resiliency task force: The Mayor created a “Resiliency Task Force” to develop ideas, policies, projects
and programs to aid in community resilience and recovery after a disaster.

NJDEP | Rebuild by Design – Hudson River Feasibility Study |Data Collection| 36
4.9.5 Waterfront Structures Inspection Report (2011)
Boswell Underwater Engineering (BUE), performed an investigation and survey of the City of Hoboken, city-
owned and city-leased waterfront structures over four months from November 2010 to February 2011 (prior
to Hurricane Sandy). This report included a summary of findings from those inspections and recommendations
for the rehabilitation or repair of those structures. The study found that no emergency action or immediate
repair was required for the inspected structures. The following are the four waterfront structures that were
inspected as a part of the study and the conditions found during each inspection as well as any
recommendations. A map showing the location of the inspected structures is shown in Figure 4-11.
Figure 4-11. Waterfront Inspection Location Map in the Southern Area of Hoboken

NJDEP | Rebuild by Design – Hudson River Feasibility Study |Data Collection| 37
Figure 4-12. Waterfront Inspection Location Map in Northern Area of Hoboken
Castle Point
Roughly 976 linear feet of seawall and a steel pile supported platform and pier were inspected.
Conditions: The overall condition of the structures at Castle Point were found to be satisfactory with the
exception of one area at the southern end of the inspection area which is currently in the rehabilitation design
and permitting phase. The concrete seawall was found to be in generally fair condition with seven isolated areas
of voids at the base of the seawall; the steel pipe piles were also found to be in fair to satisfactory condition with
minor to moderate corrosion; the concrete pile caps and deck planks were found to be in good condition.
NJDEP | Rebuild by Design – Hudson River Feasibility Study |Data Collection| 38
Recommendations: Repair the voids at the base of the concrete seawall on a routine basis, and protect the steel
pipe piles that have coating loss or corrosion on a routine basis to prevent corrosion.
Seawall north of Pier A
Approximately 1,370 linear feet of the seawall north of Pier A was inspected, consisting of a 290 foot long steel
pipe platform and a 1,080 foot long masonry gravity wall.
Conditions: The overall conditions of the steel pipe platform was found to be satisfactory. The steel pipe piles
were found in typically satisfactory condition with minor loss of coating and corrosion on the top 2 or 3 feet of
the piles; the condition of the concrete pile caps and re-cast concrete deck planks was found to be good. The
overall conditions of the masonry gravity wall was found to be fair. The timber cribbing beneath the wall is
exposed for about 580 feet; the timber displays moderate to severe marine borer infestation; roughly 174 feet
of the northern portion of the wall has widespread grout loss, displaced masonry blocks and several voids.
Recommendations: Clean and re-coat steel pipe piles where coasting loss or corrosion is present on a routine
basis to prevent future corrosion. Perform an engineering evaluation on areas with timber cribbing exposed
below the masonry gravity wall.
Pier A
Concrete encased steel H-piles, concrete pile caps, and deck planks were inspected at Pier A.
Conditions: The overall condition of Pier A was found to be fair. Approximately 893 of 1,362 H-piles supporting
the pier had steel exposed below the encasement. The mudline was scoured, exposing the steel H-piles to a
maximum exposure of 8.5 feet. Measurements of a representative number of piles indicated loss of exposed
steal an average of 37 percent; 91 concrete encasements have voids at the top of the pile, exposing the steel H-
pile. The concrete deck planks and pile caps were found to be in satisfactory conditions. There is a cantilevered
steel girder at Bent 31 that was damaged by impact and is not functional.
Recommendations: Protect the exposed steel H-piles below the encasements to prevent further corrosion,
patch voids and gaps in the encasements, and repair the cantilevered girder on a priority basis.
Dewberry, along with Boswell Engineering, completed a waterfront inspection in 2015 to evaluate the existing
state of condition along sections of the Hoboken waterfront and estimate available load handling capacity. The
full report can be found in Appendix D and is discussed in Section 5.2.
4.9.6 Hoboken Yard Redevelopment Plan Report (2014)
The Hoboken Yard Redevelopment Plan (the Plan) lays out a proposed development framework focused
around transit in order to create a distinct destination while preserving the character and enhancing the quality
of life in Hoboken. The Plan includes a vision for redevelopment of two developable areas in Hoboken Yard
where no NJ Transit rail or historic building currently exist and a planning framework with specific provisions

NJDEP | Rebuild by Design – Hudson River Feasibility Study |Data Collection| 39
for land use, building height, public space, and circulation requirements, among others. A majority of the
redevelopment area is below sea level and within the 1-percent-annual-chance floodplain so flood resilience
measures are also required. The two developable areas include 1.8 acres at the Hudson Place site near the
Terminal Building and 8.3 acres along Observer Highway between Marin Boulevard and Hudson Street.
Among the planning and design principles identified in the Plan are provisions for Development Program and
Uses, Building Heights/Bulk, Circulation and Parking, View Corridor, Sustainable Development, Flood
Resiliency, and Affordable Housing. The vision for the redevelopment area is that of a transit oriented mixed-
use development that encourages ridership while advancing environmental, social, and economic
sustainability goals of the City. Some of the ways that this vision will be accomplished include creating new
public space and pedestrian plazas as focal points, encouraging architectural design elements that maximize
air, light, and create an open environment, minimizing the need for parking, maintaining views of the
Lackawanna Clocktower, and encouraging sustainable building design and materials. The Plan realizes that
this redevelopment area also provides an opportunity to incorporate flood protection and resiliency into the
vision of this redevelopment. Some of the measures that are required as part of the redevelopment include
separate storm and sanitary sewers, stormwater and sanitary sewer pumps, and a variety of stairs, seating
levels, and green walls to tie the development to grade in accordance with ABFE maps and the City’s current
Flood Damage Prevention ordinances. The ABFE maps tended to have higher elevations then the 2015
Preliminary FIRMs due to the slightly conservative estimate of wave heights, however the storm surge
stillwater elevations are the same in each. Ultimately, the Plan provides a structured framework to
accommodate a mixed-use development that maintains the existing and historic character of Hoboken and
complements or enhances existing development across the site and downtown Hoboken. The framework also
provides flexibility to incorporate future transit improvements planned by NJ Transit independent of the Plan.

NJDEP | Rebuild by Design – Hudson River Feasibility Study |Data Collection| 40
4.10 Base Map
The City of Hoboken, the City of Jersey City, the Township of Weehawken, NJ Transit, and Hudson County
provided various information on the physical infrastructure located within the project area. The information
provided was used to create a base map in AutoCAD that was used in the conceptual design drawing package.
This base map in addition to the urban design base map can be found in Appendix B. The City of Hoboken
provided Geographic Information System (GIS) based shapefiles regarding transportation within Hoboken
(parking, loading zones, bike paths, Hoboken Terminal, bus shelters/stops/lines, light rail line/stations, Path
line, ferry routes, PATCO line, NJ Transit commuter rail line/stations, NYC railroad). The City also provided
GIS shapefiles regarding land use planning (building footprints, blocks, historical sites, etc.) as well as
environmental and utility GIS shapefiles (parks, substations, trees, energy surety design methodology, historic
fill, fire hydrants, law enforcement, fire stations, hospitals, schools, generators, garages). The City of Jersey
City also provided information on their physical infrastructure, including a map of Jersey City as well as GIS
shapefiles with information regarding elevation, ferry docks, historical sites, parcels, zoning, and the city’s
drainage area. Weehawken (courtesy of Hartz Mountain) provided a plan view of the physical infrastructure
at the Harbor View Village at Lincoln Harbor. NJ Transit provided survey data for the Hoboken terminal. All
the applicable GIS data was used as part of this feasibility study.