data analysis - part i (secondary data)shodhganga.inflibnet.ac.in/bitstream/10603/23977/9/09...3.1...
TRANSCRIPT

3.1 INTRODUCTION:
Chapter III
DATA ANALYSIS - Part I (SECONDARY DATA)
Nationalized banks have become a helping hand to the students who
wish to pursue higher education for gaining a competitive edge in their
careers. Since education is becoming costlier by the day and footing
the college or university fees is a strain on the lower and middle-class
pockets, banks have become more supportive in extending loans to
them. The educational loan scheme launched by Reserve Bank of
India in 2000-2001 provides financial assistance to students seeking
admission to professional colleges to pursue higher education for
graduate/post-graduate courses. As per Indian Bank's Association
(IBA) recommendations, the Model Educational Loan Scheme was
announced in Union Budget for 2001-2002. Accordingly, all 28
nationalized banks were advised to implement the scheme. In 2004-
2005, the educational loan scheme was reviewed by the Working
Group of General Managers from few select banks constituted by IBA.
Accordingly, some modifications were made in the educational loan
scheme to facilitate smooth operation at bank branches.
There are 28 nationalized banks in India. Out of these, a sample of
seven banks has been selected as sample for the study. The sample is
selected on the basis of the location of the Head Offices or Regional
Offices of the Banks with in Mumbai region. Thus, importance was
given to the residential location of the Banks. The seven banks
108
(sample) which have their Head Offices or Regional offices in Mumbai
are as follows:-
1. Bank of Maharashtra.
2. Bank of Baroda.
3. Central Bank of India.
4. State Bank of India.
5. Union Bank of India.
6. Bank of India.
7. Dena Bank.
The data for all 28 nationalized banks has been collected and tabulated
for analysis and interpretation. The data has also been collected and
tabulated for the sample banks for analysis. The data collection
includes the amount of educational loans disbursed and amount
outstanding. It also includes the number of accounts (student
borrowers) for the educational loans disbursed and outstanding. The
data is presented in two parts: Part A: - Brief Profile of the sample and
Part B: - Data analysis.
The primary data has been collected from the internal report of Indian
Banks Association. Sources of secondary data include newsletters of
IBA, websites of nationalized banks, Reserve Bank of India
publications and Reserve Bank of India circulars and newspapers.
109

3.1 BRIEF PROFILE OF SAMPLES:
A brief profile of the seven banks (sample) which have their Head
Offices or Regional offices in Mumbai is as follows:-
1. Bank of Baroda:
Bank of Baroda was started in the year 1908, under the Companies Act
of 1897. It was nationalized along with 13 other banks in July 1969. It
has 2857 Indian Branches and 72 Foreign Branches. Its Head Office is
at Baroda and its corporate centre is at Mumbai.
2. Bank of India:
Bank of India was founded on 7th September, 1906 by a group of
eminent businessmen from Mumbai. It was nationalized in 1969.
Beginning with one office in Mumbai, the Bank has made a rapid
growth over the years. The Bank has 2884 branches in India. Its Head
office is at Mumbai.
3. Bank of Maharashtra:
It was registered in 1935 and commenced business on 8th Feb 1936.
After nationalization in 1969, the bank expanded rapidly. It now has
1375 branches all over India. Its head office is at Pune while its
Regional office is at Mumbai.
4. Central Bank of India:
Established in 1911, Central Bank of India was the first Indian
commercial bank which was wholly owned and managed by Indians. It
110

was nationalized in 1969, after which expanded rapidly. It has 3442
branches all over India. Its Head Office is at Mumbai.
5. Dena Bank:
Dena Bank was founded on 26th May, 1938. It became a Public Ltd.
Company in December 1939 and later the name was changed to Dena
Bank Ltd. It got nationalized in 1969. It has 1160 branches all over
India. Its Head Office is at Mumbai.
6. Union Bank of India:
UBI was registered on November 11, 1919 as a limited company in
Mumbai. It was inaugurated by Mahatma Gandhi. It got nationalized in
1975. It has 2361 branches in India. Its Head Office is at Mumbai.
7. State Bank of India:
The origin of the State Bank of India goes back to the first decade of
the nineteenth century with the establishment of the Bank of Calcutta in ... :
Calcutta on 2 June 1806. Three years later, the bank received its
charter and was re-designed as the Bank of Bengal (2 January 1809).
A unique institution, it was the first joint-stock bank of British India
sponsored by the Government of Bengal. Followed by Bank of Bengal,
the Bank of Bombay (15 April 1840) and the Bank of Madras (1 July
1843) were set up. These three banks remained at the apex of modern
banking in India till their amalgamation as the Imperial Bank of India on
27 January 1921. The Government of India nationalized the Imperial
Bank of India in 1955. An act was accordingly passed in Parliament in
May 1955 and the State Bank of India was constituted on 1 July 1955.
111

With more than 11,111 branches and a further 6500 branches of
associate bank branches, the SBI has extensive coverage. The bank
has 14 Local Head Offices in various states such as Maharashtra,
Gujarat, Andhra Pradesh, Assam, Bihar, Tamil Nadu, New Delhi, West
Bengal. State Bank of India's Central Office / Corporate Centre is
located in Mumbai.
A. PROFILE OF SAMPLES:
A brief profile of the banks (sample) is shown in Table 3.1. Accordingly,
the table shows the data about the age of the bank, capital, number of
offices and number of employees.
Table 3.1
Profile of the sample Banks:
Name of the Bank Capital Age No. of No. of Amount Rs. in Offices Employees
in Crores years Bank of Baroda 365.52 100 2931 37496
Bank of India 525.91 102 2805 40616
Bank of Maharashtra 430.52 73 1415 13590
Central Bank of India 1204.14 87 3433 37488
Dena Bank 286.82 70 1098 9957
Union Bank of India 505.11 87 2410 27168
State Bank of India 631.47 77 10369 179205
Source: Compiled from Annual Reports and Websites of Banks and RBI.
Table 3.1 indicates clearly that Central Bank of India has the largest
capital of Rs.1204.14 crores as on 31 st March 2008 among all seven
sample banks. This is followed by State Bank of India having
112

RS.631.47 crores capital as on 31 st March 2008. Dena Bank has the
lowest capital of Rs.286.82 crores as on 31st March 2008 in the
sample.
Table 3.1 also shows the age of the banks as on 31 st March 2008.
Accordingly, Bank of India which was started in 1906 is the oldest bank
among the sample. The second oldest bank in the sample is Bank of
Baroda which was established in 1908. The bank having the lowest
age among the sample is Dena Bank which was established in 1938.
The number of offices including the number of branches as on 31 st
March 2008 is also revealed in table 3.1. It shows clearly that State
Bank of India has the maximum number of offices i.e.1 0369 among the
sample. It is followed by Central Bank of India which has 3433 number
of offices all over India. Dena Bank has 1098 number of offices which
is the lowest among the sample.
It is revealed in table 3.1 that as on 31 5t March 2008, State Bank of
India has the 179205 number of employees, which is the largest
among the sample. It is followed by Bank of India which has 40616
number of employees. Dena Bank has 9957 number of employees
which is the lowest number of employees among the sample.
1. Capital-wise Profile of the Banks:
The data regarding capital of the sample banks is taken from table 3.1.
Accordingly, capital-wise profile of the banks is presented in the
following table:-
113
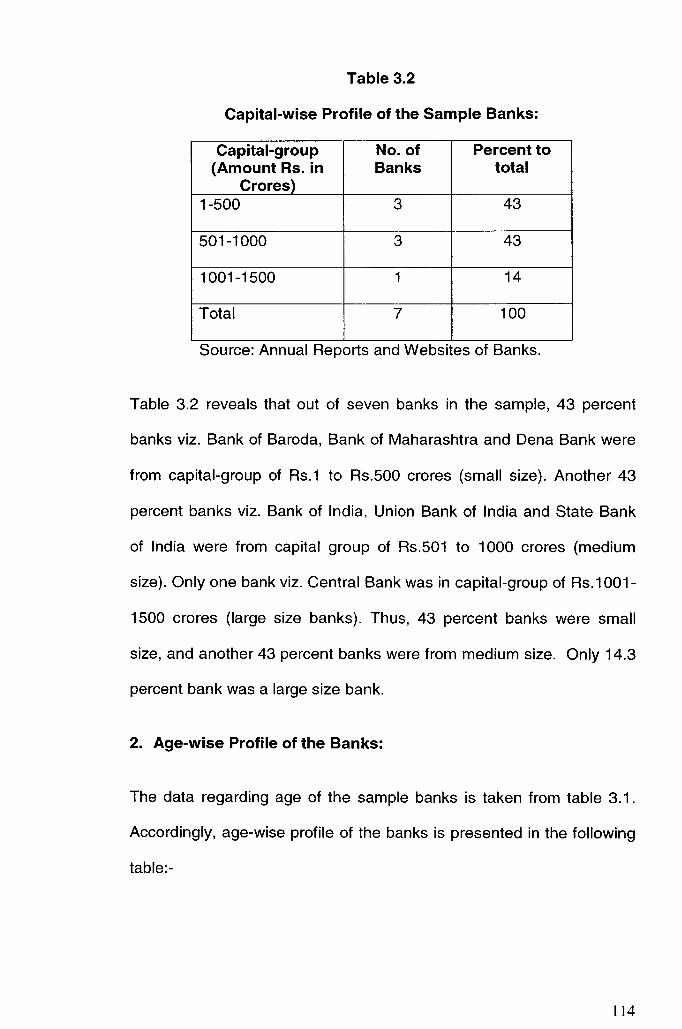
Table 3.2
Capital-wise Profile of the Sample Banks:
Capital-group No. of Percent to (Amount Rs. in Banks total
Crores) 1-S00 3 43
S01-1000 3 43
1001-1S00 1 14
Total 7 100
Source: Annual Reports and Websltes of Banks.
Table 3.2 reveals that out of seven banks in the sample, 43 percent
banks viz. Bank of Baroda, Bank of Maharashtra and Dena Bank were
from capital-group of Rs.1 to Rs.SOO crores (small size). Another 43
percent banks viz. Bank of India, Union Bank of India and State Bank
of India were from capital group of Rs.S01 to 1000 crores (medium
size). Only one bank viz. Central Bank was in capital-group of Rs.1 001-
1S00 crores (large size banks). Thus, 43 percent banks were small
size, and another 43 percent banks were from medium size. Only 14.3
percent bank was a large size bank.
2. Age-wise Profile of the Banks:
The data regarding age of the sample banks is taken from table 3.1.
Accordingly, age-wise profile of the banks is presented in the following
table:-
114

Table 3.3
Age-wise Profile of the Sample Banks:
Age-group No. of Banks Percent to total
51-75 2 29
76-100 3 43
101 & Above 2 29
Total 7 100
Source: Annual Reports and Websites of Banks.
Table 3.3 reveals that out of seven banks in the sample, 29 percent of
the banks viz. Dena Bank and Bank of Maharashtra were from the age
group of (51-75) years. 43 percent of the banks viz. State Bank of
India, Central Bank of India and Union Bank of India were from the
age-group of (76-100) years. Whereas another 29 percent of the banks
viz. Bank of Baroda and Bank of India were from the age-group of (101
& above) years. Thus, Bank of Baroda and Bank of India were the
oldest banks among the sample.
3. Number of Offices-wise Profile of the Banks:
The data regarding number of offices of the sample banks is taken
from table 3.1. Accordingly, the number of offices-wise profile of the
banks is presented in the following table:-
115

Table 3.4
Number of Offices-wise profile of the Sample Banks:
No. of Offices No. of Banks Percent to total
1000-2000 2 29
2001-3000 3 43
3001 & Above 2 29
Total 7 100
Source: Annual Reports and Websites of Banks.
Table 3.4 reveals that out of seven banks in the sample, 29 percent of
the banks viz. Bank of Maharashtra and Dena Bank were from the
group of (1000-2000) offices. 43 percent of the banks viz. Bank of
Baroda, Bank of India and Union Bank of India were from the group of
(2001-3000) offices. Whereas, 29 percent of the Banks viz. Central
Bank of India and State Bank of India were from the group of (3001 &
above) offices. Thus, Central Bank of India and State Bank of India
had large number of offices viz. 3433 and 10369, among the sample
banks.
4. Number of Employees-wise Profile of the Banks:
The data regarding number of employees of the sample banks is taken
from table 3.1. Accordingly, the number of employees-wise profile of
the banks is presented in the following table:-
116

Table 3.5
Number of Employees-wise profile of the Sample Banks:
No. of Employees No. of Banks Percent to total
1000-15000 2 29
1 5001 -30000 1 14
30001 & Above 4 57
Total 7 100
Source: Annual Reports and Websltes of Banks.
Table 3.5 reveals that out of seven banks in the sample, 29 percent of
the banks viz. Bank of Maharashtra and Dena Bank were from the
group of (1000-15000) employees. 14 percent of the banks viz. Union
Bank of India was the only bank from the group of (2001-3000)
employees. Whereas, 57 percent of the Banks viz. Bank of Baroda,
Bank of India, Central Bank of India and State Bank of India were from
the group of (30001 & above) employees. Thus, Bank of Baroda, Bank
of India, Central Bank of India and State Bank of India had large
number of employees among the sample banks.
B. DATA ANALYSIS:
The data collected from all 28 nationalized banks, seven sample Banks
and various sources have been analyzed and interpreted as follows:
1. Progress of Educational Loans Disbursed by all Nationalized
Banks:
The data on the educational loans disbursed by all 28 Banks in India is
presented in the following table:-
117

Table 3.6
Progress of Educational Loans (disbursed) by all Nationalized Banks:
Year Number of Percent Amount Percent Accounts Change (Rs. in Change
Crores) 2000-2001 48694 - 668 -
2001-2002 88614 82 1033 55
2002-2003 140925 59 1995 93
2003-2004 107829 -24 1983 -1
2004-2005 210617 95 2782 40
2005-2006 306557 46 3320 19
2006-2007 361213 18 4148 25
2007-2008 336758 -7 5635 36
Total 1601207 - 21564 -Average 200151 39 2695 38
Source: Compiled from Reserve Bank of India, Indian Banks' Association.
The data is presented in the Charts as follows:-
Chart 3.1
Progress of Educational loans (disbursed) by all nationalized banks w.r.t. no. of accounts
I/) 400 --£:: I/) j"C o £:: 300 Co) as Co) I/) « j
'0 ~ 200 ·tc o ._
z - 100
o 2000- 2001- 2002- 2003- 2004- 2005- 2006- 2007-2001 2002 2003 2004 2005 2006 2007 2008
Year
118

CI) :1000 0 :1000
0 u; a:: -c ::s 0 E «
Chart 3.2
Progress of educational loans (disbursed) by all nationalized banks w.r.t. amount
6000
4000
2000
0
5635
2000- 2001- 2002- 2003- 2004- 2005- 2006- 2007-2001 2002 2003 2004 2005 2006 2007 2008
Year
Table 3.6 reveals that the number of students taking educational loans
has increased from 48694 in 2000-2001 to 336758 in 2007-2008. The
average number of students taking education loans is 200151 per year.
The number of students taking educational loans increased from
107829 in 2003-2004 to 210627 in 2004-2005, registering highest
increase of 95 percent over 2003-2004. This was mainly due to
introduction of revised model education loan scheme in 2004. The
number of accounts reduced by -24 percent in 2003-2004 and by -7
percent in 2007-2008 over the previous year. However, on an average,
there is an increase of 39 percent in the number of students taking
education loans per year. This indicates that there is an increase in the
number of students availing the benefits of educational loans from
nationalized banks.
Table 3.6 also reveals that the amount disbursed from 2000-2001
increased from Rs.668 crores to Rs. 5635 crores in 2007-2008. The
119

average amount disbursed as education loans is Rs. 2695 crores per
year. The amount disbursed as educational loans increased from Rs.
1983 crores in 2003-2004 to Rs. 2782 crores in 2004-2005, registering
highest increase of 40 percent over 2003-2004. The amount disbursed
by Banks reduced marginally by -1 percent in 2003-2004 over 2002-
2003. However, on an average, there is an increase of 38 percent in
the amount disbursed by nationalized banks per year. Also, though the
number of borrowers reduced marginally by -7 percent in 2007-2008,
the amount disbursed by banks as educational loans increased by 36
percent in the same period. This indicates that there is an increase in
the amount disbursed for educational loans by nationalized banks on a
year-on-year basis.
2. Growth of Educational loans Disbursed by all Nationalized
Banks:
The data on educational loans disbursed by all 28 nationalized banks
have been analyzed further on the basis of compounded annual growth
rate. Accordingly, the analysis of educational loans disbursed by Banks
has been presented in the following table:-
120

Table 3.7 Growth in Educational Loans Disbursed (Compound Annual
Growth Rate in %) CAGR CAGR
Year 2000- 2003- 2004- 2007- 2001- 2005-2001 2004 2005 2008 2004 2008
(%) (%) Number
of 48694 107829 210617 336758 30 17 Accounts
Amount (Rs. 668 1983 2782 5635 43 26
Crore)
Source: Compiled from Reserve Bank of India, Indian Banks' Association.
CAGR 2000-2008 (%)
35
31
Table 3.7 reveals the growth of educational loans in terms of number of
accounts as well as amount disbursed. It is observed that the total
number of accounts have grown from 48694 in 2000-2001 to 107829
accounts in 2003-2004, registering a high annual compound annual
growth rate of about 30 percent. Comparatively, the growth in the
number of accounts in 2004-2005 from 210617 to 336758 in 2007-
2008, registered a little lower annual compound growth rate of as much
as 17 percent. However, the number of accounts registered a
remarkably higher growth from 48694 in 2000-2001 to 336758 in 2007-
2008, with a high annual compound growth rate of as much as 35
percent. This indicates that the number of borrowers taking educational
loans from nationalized banks has been increasing.
The amount disbursed towards educational loans have grown from
Rs.668 crores in 2000-2001 to Rs. 1983 crores in 2003-2004,
registering a much higher annual compound annual growth rate of
121

about 43 percent. Comparatively, the growth in the amount disbursed
towards educational loans in 2004-2005 from Rs. 2782 crores to Rs.
5635 crores in 2007-2008, registered a little lower annual compound
growth rate as much as 26 percent. However, the amount disbursed for
educational loans have grown gradually from Rs.668 crores in 2000-
2001 to Rs. 5635 crores in 2007 -2008, registering an annual
compound growth rate as much as 31 percent. This indicates that there
has been an increase in the disbursements for educational loans by
nationalized banks.
3. Progress of Educational Loans Outstanding for all Nationalized
Banks:
The data collected on the outstanding educational loans of all 28
Nationalized Banks has been presented in the following table:-
Table 3.8 Progress of Educational Loans (Outstanding)
Amount Outstanding Number of Percent Rs. in Percent
as on ..... Accounts Change Crores Change 31.03.2001 112000 - 1028
31.03.2002 157000 40 1527 49
31.03.2003 239000 52 2870 88
31.03.2004 347000 45 4179 46
31.03.2005 468207 35 6713 61
31.03.2006 679945 45 10012 49
31.03.2007 944397 39 14283 43
31.03.2008 1246870 32 19817 39
Total 4194419 - 60429
Average 524302 41 7554 53
Source: Compiled from Reserve Bank of India, Indian Banks' Association.
-
122

The data is presented in the Charts as follows:-
0_ - 0 C-c :J C o m o 0 o :J
<C 0 - .c 01-o C z:.:::;..
C1) ... 0 ...
0 U)
a: -s::: :J 0 E «
Chart 3.3
Educational loans Outstanding at Nationalized Banks (No. of Accounts)
1400 1200 1000
800 600 400 157 112 200 -r-----r 0
Chart 3.4
Educational loans Outstanding at Nationalized Banks (Amount)
1246.87
25000 19817 20000
14283 15000 10012 10000 6713
5000 1028 0
Table 3.8 reveals that the total number of accounts outstanding for
educational loans for all 28 nationalized banks increased from 112000
as on 31 st March 2001 to 944397 as on 31 st March 2008. The number
123

of accounts outstanding for educational loans grew as high as 52
percent as on 31 st March 2003. The number of accounts outstanding
as on 31 st March 2002 increased from 157000 to 239000 as on 31 st
March 2003, registering a considerably high growth of as much as 52
percent vis-a-vis 40 percent as on 31 st March 2002. On an average,
there is a 41 percent increase in the number of accounts outstanding
for educational loans provided by nationalized banks per year. This
indicates that there is an increase in the number of students availing
the benefit of educational loans.
Table 3.8 also reveals that amount outstanding for educational loans
for all 28 nationalized banks increased from RS.1028 crores as on 31 st
March 2001 to RS.19817 crores as on 31 st March 2008. The amount
outstanding as on 31 st March 2002 increased from RS.1527 crores to
Rs. 2870 crores as on 31 st March 2003, registering a considerably high
growth of as much as 88 percent vis-a-vis 49 percent as on 31 st March
2002. The table also indicates that on an average, there is a 53
percent increase in the amount outstanding for educational loans
provided by nationalized banks per year. This indicates that there is an
increase in the outstanding amount for educational loans provided by
nationalized banks.
4. Combined Data for Educational loans of all Nationalized Banks:
The combined data related to the number of accounts and amount
disbursed as educational loans from 2004-2008 by all 28 banks has
been presented in the following table:-
124

Table 3.9
Combined data for Educational loans disbursed by all 28 Banks from 2004-2008
S. Name of the Bank Number Percent Amount Percent No. of Rs. in
Accounts Crores
1 Allahabad Bank 21907 2 402 3
2 Andhra Bank 48121 4 643 4
3 Bank of Baroda 48448 4 805 5
4 Bank of India 58207 5 975 6
5 Bank of Maharashtra 13832 1 268 2
6 Canara Bank 206493 17 1223 8
7 Central Bank of India 27624 2 457 3
8 Corporation Bank 39079 3 352 2
9 Dena Bank 10503 1 172 1
10 Indian Bank 102588 8 1167 7 Indian Overseas
11 Bank 56179 5 621 4 12 lOBI Bank 2036 0 23 0
Oriental Bank of 13 Commerce 27187 2 445 3 14 Punjab & Sind Bank 6174 1 171 1
Punjab National 15 Bank 24816 2 584 4 16 Syndicate Bank 60079 5 827 5 17 UCO Bank 16834 1 280 2 18 Union Bank of India 46262 4 553 3 19 United Bank of India 18062 1 249 2 20 Vijaya Bank 20733 2 284 2 21 State Bank of India 214773 18 3577 23
State Bank of 22 Bikaner & Jaipur 10095 1 186 1
State Bank of 23 Hyderabad 25072 2 421 3
State Bank of 24 Mysore 12892 1 165 1 25 State Bank of Indore 2711 0 32 0
26 State Bank of Patiala 10942 1 265 2 State Bank of
27 Saurashtra 7578 1 172 1 State Bank of
28 Travancore 75918 6 567 4 Total 1215145 100 15886 100 Average 43398 - 567 -
Source: Compiled from Reserve Bank of India, Indian Banks' Association.
125

Table 3.9 reveals that the total number of accounts for educational
loans disbursed by all nationalized banks from 2004 to 2008 is
1215145. The average number of borrowers for educational loans
disbursed by all nationalized banks during 2004 and 2008 is 43398.
State Bank of India has the highest number of accounts i.e. 214773 for
educational loans disbursed from 2004 to 2008 followed by the Canara
Bank which disbursed educational loans to 206493 borrowers. As a
proportion to total educational loans, State Bank of India displays the
maximum percent share of 18 percent followed by Canara Bank
contributing by 17 percent during 2004 to 2008. Accordingly, State
Bank of India has come out to be the leader in all 28 banks which has
the maximum number of accounts for educational loans during 2004 to
2008. State Bank of Indore and lOBI Bank disbursed educational loans
to only 2711 and 2036 borrowers respectively during 2004 to 2008,
thereby sharing the lowest i.e. 0 percent each in the total number of
accounts for all banks during the same period.
Table 3.9 reveals that the total amount for educational loans disbursed
by all nationalized banks from 2004 to 2008 is Rs. 15886 crores. The
average amount disbursed by all nationalized banks as educational
loans during 2004 and 2008 is Rs.567 crores. The table indicates that
State Bank of India has provided maximum educational loans to a tune
of Rs.3577 crores during the period of 2004 and 2008. Accordingly, in
the total amount disbursed for educational loans by all nationalized
banks from 2004 to 2008, State Bank of India has the highest share of
23 percent. This is followed by Canara Bank which disbursed RS.1223
126

crores during 2004 and 2008 and has 8 percent share in total
disbursements. State Bank of Indore and lOBI Bank disbursed an
amount of Rs.32 crores and Rs.23 crores thereby registering lowest
share of 0 percent each respectively.
5. Number of Accounts for Educational Loans disbursed by all
nationalized banks:
Year wise data related to number of accounts disbursed by all 28
nationalized banks from 2004 to 2008 is presented in the following
table:-
127

Table 3.10 Year wise data for Educational loans disbursed by all 28 Banks
(No. of accounts)
s. 2004- 2005- 2006- 2007-No. Name of the Bank 2005 2006 2007 2008 Total
1 Allahabad Bank 2714 5296 7119 6778 21907
2 Andhra Bank 9736 13199 14167 11019 48121
3 Bank of Baroda 6931 15174 15184 11159 48448
4 Bank of India 9683 12983 16767 18774 58207
5 Bank of Maharashtra 2081 3391 4307 4053 13832
6 Canara Bank 35912 43483 71739 55359 206493
7 Central Bank of India 3580 4232 8926 10886 27624
8 Corporation Bank 8561 11037 12953 6528 39079
9 Dena Bank 2128 4091 3478 806 10503
10 Indian Bank 9552 24809 31141 37086 102588
11 Indian Overseas Bank 10548 15558 15912 14161 56179
12 lOBI Bank 186 648 510 692 2036 Oriental Bank of
13 Commerce 3933 5643 7635 9976 27187
14 Punjab & Sind Bank 1038 1588 1731 1817 6174
15 Punjab National Bank* - - - 24816 24816
16 Syndicate Bank 10686 13283 20781 15329 60079
17 UCO Bank 3824 3932 4589 4489 16834
18 Union Bank of India 8047 12046 12210 13959 46262
19 United Bank of India 5266 7718 2926 2152 18062
20 Vijaya Bank 3147 4641 5504 7441 20733
21 State Bank of India 47009 60878 58442 48444 214773 State Bank of Bikaner
22 & Jaipur 1444 1860 2627 4164 10095 State Bank of
23 Hyderabad 3181 4304 6752 10835 25072 24 State Bank of Mysore 2410 2334 3300 4848 12892
25 State Bank of Indore* - - - 2711 2711
26 State Bank of Patiala 1218 1637 2064 6023 10942 State Bank of
27 Saurashtra 1997 2221 2868 492 7578 State Bank of
28 Travancore 15805 30571 27581 1961 75918 Total 210617 306557 361213 336758 1215145 Average 43398
* Figures not available Source: Compiled from Reserve Bank of India, Indian Banks' Association
128

Table 3.10 reveals that the total number of accounts for educational
loans disbursed by all nationalized banks increased from 210617 in
2004-2005 to 336758 in 2007-2008. The average number of borrowers
for educational loans disbursed by all nationalized banks during 2004
and 2008 is 43398. The highest number of borrowers for educational
loans in 2004-2005 and 2005-2006 is observed in State Bank of India
which is 47009 and 60878. Whereas, the highest number of borrowers
for educational loans in 2006-2007 and 2007-2008 is observed in
Canara Bank which is 71739 and 55359. The lowest number of
borrowers for educational loans is observed in lOBI Bank for all the four
years. lOBI Bank had 186 borrowers in 2004-2005, 648 borrowers in
2005-2006, 510 borrowers in 2006-2007 and 692 borrowers in 2007-
2008.
6. Amount of Educational Loans disbursed by all Nationalized
Banks:
Year wise data related to amount disbursed by all 28 nationalized
banks from 2004 to 2008 is presented in the following table:-
129

Table 3.11
Year wise data for Educational loans disbursed by all 28 Banks (Amount Rs. in Crores)
s. 2004- 2005- 2006- 2007-No. Name of the Bank 2005 2006 2007 2008 Total
1 Allahabad Bank 49 85 126 142 402
2 Andhra Bank 141 162 182 158 643
3 Bank of Baroda 103 205 276 221 805
4 Bank of India 102 212 286 375 975
5 Bank of Maharashtra 32 55 82 99 268
6 Canara Bank 211 327 379 306 1223
7 Central Bank of India 59 72 130 196 457
8 Corporation Bank 51 75 60 167 352
9 Dena Bank 32 55 53 33 172
10 Indian Bank 119 260 352 435 1167
11 Indian Overseas Bank 103 132 169 217 621
12 lOBI Bank 2 6 6 9 23 Oriental Bank of
13 Commerce 57 76 129 184 445 14 Punjab & Sind Bank 25 37 54 55 171
15 Punjab National Bank* - - - 584 584
16 Syndicate Bank 143 168 240 276 827 17 UCO Bank 58 61 72 90 280 18 Union Bank of India 92 110 140 212 553 19 United Bank of India 59 81 63 46 249 20 Vijaya Bank 40 59 73 112 284 21 State Bank of India 1016 668 760 1134 3577
State Bank of Bikaner 22 & Jaipur 29 41 34 81 186
State Bank of 23 Hyderabad 34 52 93 242 421 24 State Bank of Mysore 19 32 41 73 165 25 State Bank of Indore* - - - 32 32 26 State Bank of Patiala 34 60 83 88 265
State Bank of 27 Saurashtra 34 52 70 16 172
State Bank of 28 Travancore 141 179 196 51 567
Total 2782 3320 4149 5635 15886 Average 567
* Figures not available Source: Compiled from Reserve Bank of India, Indian Banks' Association
130

Table 3.11 reveals that the total amount for educational loans
disbursed by all nationalized banks increased from Rs.2782 crores in
2004-2005 to Rs.5635 crores in 2007-2008. The average amount
disbursed by all nationalized banks as educational loans during 2004
and 2008 is Rs.567 crores. The table indicates that State Bank of India
has provided maximum educational loans in all four years i.e. Rs.1016
crores in 2004-2005, Rs.668 crores in 2005-2006, Rs.760 crores in
2006-2007 and Rs.1134 crores in 2007-2008. It is followed by Canara
Bank which disbursed Rs.211 crores in 2004-2005, Rs.327 crores in
2005-2006, Rs.379 crores in 2006-2007 and Rs.306 crores in 2007-
2008. The lowest amount of educational loans is disbursed by lOBI
Bank i.e. Rs.2 crores in 2004-2005, Rs.6 crores in 2005-2006, Rs.6
crores in 2006-2007 and Rs.9 crores in 2007-2008.
7. Number of Accounts of all Nationalized banks in Urban areas
and Rural and Semi-Urban areas:
The data related to number of accounts for educational loans disbursed
in Urban areas and Rural and Semi Urban Areas, by all 28 banks from
2004 to 2008 is presented in the following table:-
131

Table 3.12 Educational Loans disbursed by all 28 banks in Urban areas and
Rural and Semi Urban Areas (Number of Accounts) No. of Accounts (2004-2008)
S. Urban Percent Rural and
Percent No.
Name of the Bank Total Areas to Total
Semi-urban to Total areas
1 Allahabad Bank 21907 14185 1 7722 1
2 Andhra Bank 48121 29403 2 18718 2
3 Bank of Baroda 48448 29896 3 18552 2
4 Bank of India 58207 34261 3 23946 2
5 Bank of Maharashtra 13832 8985 1 4847 0
6 Canara Bank 206493 100531 8 105962 9
7 Central Bank of India 27624 19608 2 8016 1
8 Corporation Bank 39079 21351 2 17728 2
9 Dena Bank 10503 6854 1 3649 0
10 Indian Bank 102588 49518 4 53070 4
11 Indian Overseas Bank 56179 22711 2 33468 3
12 lOBI Bank 2036 1238 0 798 0
13 Oriental Bank of 27187 21537 2 5650 1 Commerce
14 Punjab & Sind Bank 6174 3094 0 3080 0
15 Punjab National Bank 24816 15920 1 8896 1
16 Syndicate Bank 60079 30179 3 29900 3
17 UCO Bank 16834 9089 1 7745 1
18 Union Bank of India 46262 30932 3 15330 1
19 United Bank of India 18062 9378 1 8684 1
20 Vijaya Bank 20733 11737 1 8996 1
21 State Bank of India 214773 127728 11 87045 7
22 State Bank of 10095 6864 1 3231 0 Bikaner & Jaipur
23 State Bank of 25072 12832 1 12240 1 Hyderabad
24 State Bank of Mysore 12892 6822 1 6070 1
25 State Bank of Indore 2711 2196 0 515 0
26 State Bank of Patiala 10942 7595 1 3347 0
27 State Bank of 7578 0 0 Saurashtra* - -
28 State Bank of 75918 13612 1 62306 5 Travancore Total 1215145 648350 53 559709 46
* Figures not available Source: Indian Banks' Association
132

Table 3.12 reveals that from 2004 to 2008, the total number of
students availing educational loans from all nationalized banks was
1215145. Out of this, 648350 number of students were from urban
areas while 559709 students were from rural and semi-urban areas.
Out of total number of borrowers for all 28 banks, 53 percent were from
urban areas and 46 percent borrowers from rural and semi-urban
areas. This indicates that more number of students for educational
loans were in urban areas vis-a-vis rural and semi-urban areas.
Table 3.12 also shows that amongst all nationalized banks, State Bank
of India had the maximum number of students taking educational loans
followed by Canara Bank. State Bank of India had 214773 borrowers
for educational loans during 2004 and 2008. Out of this, 127728
students were from urban areas and 87045 borrowers were from rural
and semi-urban areas. Out of the total 53 percent borrowers for
educational loans disbursed in urban areas from 2004 to 2008, 11
percent borrowers were from State Bank of India and 8 percent
borrowers were from Canara Bank. Similarly, out of total 46 percent
borrowers in rural and semi-urban areas, 7 percent borrowers were
from State Bank of India and 9 percent borrowers were from Canara
Bank. In Urban areas, lOBI bank, Punjab & Sind Bank, and State Bank
of Indore Bank display lowest number of borrowers for educational
loans during 2004 and 2008 viz. 1238, 3094 and 2196 respectively.
These banks had the lowest number of borrowers of 0 percent each
out of total 53 percent borrowers in urban areas. However, the lowest
number of borrowers in urban areas is observed in lOBI Bank during
133

2004-2008 i.e. 1238. Whereas in rural and semi-urban areas, Bank of
Maharashtra, Dena Bank, lOBI bank, Punjab & Sind Bank, State Bank
of Bikaner & Jaipur, State Bank of Indore, State Bank of Patiala ,
displayed lowest number of borrowers viz. 4847, 3649, 798, 3080,
3231, and 515 number of borrowers respectively. These banks had
lowest number of borrowers i.e. 0 percent each out of total 46 percent
borrowers in rural and semi-urban areas during 2004 and 2008.
However, out of total number of borrowers in rural and semi- urban
areas, State Bank of Patiala displayed the lowest number of borrowers
i.e. 515 borrowers during 2004-2008.
8. Amount disbursed by all Nationalized Banks in Urban areas and
Rural areas & Semi-Urban areas:
The data related to amount disbursed in Urban and Rural & Semi
Urban Areas, by all 28 banks from 2004 to 2008 is presented in the
following table:-
134

Table 3.13 Educational Loans disbursed by all 28 banks in Urban areas and
Rural & Semi Urban Areas (Amount) Amount Rs. Crore (2004-2008) --~.
Rural and S. Name of the Bank Total
Urban Percent Semi-Urban Percent
No. areas to Total to Total areas
1 Allahabad Bank 402 261 2 141 1
2 Andhra Bank 643 380 2 263 2
3 Bank of Baroda 805 521 3 284 2
4 Bank of India 975 649 4 326 2
5 Bank of Maharashtra 268 196 1 73 0
6 Canara Bank 1223 661 4 563 4
7 Central Bank of India 457 326 2 131 1
8 Corporation Bank 352 241 2 111 1
9 Dena Bank 172 107 1 65 0
10 Indian Bank 1167 656 4 511 3
11 Indian Overseas Bank 621 299 2 322 2
12 lOBI Bank 23 15 0 8 0 --f-----f--
13 Oriental Bank of 445 345 2 100 1 Commerce --f---f--
14 Punjab & Sind Bank 171 91 1 80 1
15 Punjab National Bank 584 346 2 238 2
16 Syndicate Bank 827 500 3 327 2
17 UCO Bank 280 150 1 130 1 ----
18 Union Bank of India 553 398 3 155 1
19 United Bank of India 249 129 1 119 1
20 Vijaya Bank 284 185 1 99 1
21 State Bank of India 3577 2573 16 1005 6
22 State Bank of Bikaner 186 128 1 57 0 & Jaipur
23 State Bank of 421 231 1 190 1 Hyderabad
24 State Bank of Mysore 165 89 1 76 0
25 State Bank of Indore 32 26 0 7 0
26 State Bank of Patiala 265 208 1 57 0 State Bank of
--f-----1--.
27 Saurashtra*
172 - 0 - 0
28 State Bank of 567 137 1 430 3 Travancore
Total 15886 9856 62 5875 37
* Figures not available Source: Indian Banks' Association
135

Table 3.13 shows that the total amount disbursed by all nationalized
banks from 2004-2008 was Rs.15886 crores. Out of this, an amount of
Rs.9856 crores was disbursed to borrowers in urban areas and
Rs.5875 crores to borrowers in rural and semi-urban areas. Thus, 62
percent amount of educational loans was disbursed in urban areas and
37 percent amount was disbursed in rural and semi-urban areas. This
indicates that more amount of educational loans was disbursed in
urban areas as compared to rural and semi-urban areas.
Table 3.13 also reveals that State Bank of India had disbursed the
highest amount of educational loans from 2004 to 2008, followed by
Canara Bank. Out of total Rs.3577 crores amount disbursed by State
Bank of India, Rs.2573 crores was disbursed in urban areas while
Rs.1005 crores was disbursed in rural and semi-urban areas. Thus, out
of total 62 percent educational loans disbursed in urban areas, State
Bank of India had disbursed the highest amount of 16 percent
educational loans whereas Bank of India, Canara Bank and Indian
Bank each had disbursed 4 percent amount of educational loans.
Similarly, out of total 37 percent educational loans disbursed in rural
and semi-urban areas, State Bank of India had disbursed the highest 6
percent educational loans while Canara Bank had disbursed 4 percent
educational loans. This indicates that higher amount of educational
loans were disbursed in urban areas from 2004 to 2008 as compared
to rural and semi-urban areas. lOBI Bank and State Bank of Indore
displayed the lowest amount disbursed of 0 percent each in urban
areas during 2004-2008 viz. Rs.15 crores and Rs.26 crores
136

respectively. However, out of total amount disbursed in urban areas,
lOBI Bank displayed lowest amount disbursed during 2004-2008. Bank
of Maharashtra, Dena Bank, lOBI bank, State Bank of Bikaner &
Jaipur, State Bank of Mysore, State Bank of Patiala ,displayed lowest
amount disbursed i.e. 0 percent each in rural and semi-urban areas
during 2004 and 2008. However, out of total amount disbursed in rural
and semi-urban areas, State Bank of Indore disbursed lowest Rs. 7
crores during 2004-2008.
9. Number of Accounts for Sample Banks in Urban areas and
Rural and Semi-Urban areas:
The data related to number of accounts disbursed in Urban areas and
Rural and Semi Urban Areas, sample banks from 2004 to 2008 is
shown in the table 3.14:
Table 3.14 Educational Loans disbursed by Sample Banks in Urban areas
and Rural and Semi Urban Areas (number of accounts) No. of Accounts (2004 to 2008)
S. Urban Percent Rural and
Percent No.
Name of the Bank Total Areas to Total Semi Urban
to Total Areas
1 Bank of Baroda 48448 29896 7 18552 4
2 Bank of India 58207 34261 8 23946 6
3 Bank of 13832 8985 2 4847 1 Maharashtra
4 Central Bank 27624 19608 5 8016 2 of India
5 Dena Bank 10503 6854 2 3649 1
6 Union Bank 46262 30932 7 15330 4 of India
7 State Bank
214773 127728 30 87045 21 of India
Total 419649 258264 62 161385 38
Average 59950 36895 23055
Source: Indian Banks' Association.
137

The data is presented in the chart as follows:-
Chart 3.5
Number of accounts for Educational loans disbursed by sample banks (during 2004-2008)
250~-------------------------------, • Total number of accounts
200 I/) -I/) C-c :::l C o cu Co) I/)
~ ~ 150 - J:: 01-a C z·-
100
50
~ No. of accounts in Urban areas
lSI No. of accounts in Rural and Semiurban areas
Table 3.14 the number of accounts for educational loans disbursed by
sample banks from 2004 to 2008 is 419649. Out of this, the total
number of borrowers for educational loans in urban areas is 258264
whereas in rural and semi-urban areas, it is 161385. The average
number of borrowers for educational loans disbursed by sample banks
is 59950. Also, the average number of borrowers for educational loans
disbursed by sample banks in urban areas is 36895 and in rural and
138

semi-urban areas are 23055 .. Among the sample banks under study,
during 2004 and 2008, State Bank of India had the highest number of
students taking educational loans followed by Bank of India. Thus, out
of total 214773 number of borrowers for educational loans disbursed by
State bank of India, 127728 students were from urban areas and
87045 borrowers were from rural and semi-urban areas. Out of the
total 62 percent borrowers for educational loans disbursed by sample
banks in urban areas from 2004-2008, State Bank of India had 30
percent borrowers from Urban areas. Similarly, out of total 38 percent
borrowers in rural and semi-urban areas, State Bank of India had 21
percent borrowers from rural and semi-urban areas. Whereas out of
total 58207 number of borrowers for educational loans disbursed by
Bank of India, 34261 students were from urban areas and 23946
borrowers were from rural and semi-urban areas. Thus, Bank of India
had 8 percent borrowers out of total 62 percent borrowers for
educational loans disbursed in urban areas and 6 percent borrowers
out of total 38 borrowers in rural and semi-urban areas. Among the
sample banks, Dena Bank had the lowest number of borrowers for
educational loans during 2004 and 2008. Out of 10503 borrowers for
educational loans disbursed by Dena Bank, 6854 borrowers were from
urban areas while 3649 borrowers were from rural and semi-urban
areas. Thus, out of the total 62 percent borrowers for educational loans
disbursed by sample banks in urban areas from 2004 to 2008, Dena
Bank had a mere 2 percent borrowers from Urban areas. While, out of
total 38 percent borrowers in rural and semi-urban areas, Dena Bank
139

had lowest 1 percent borrowers from rural and semi-urban areas.
Overall, for all the banks among the sample, higher number of
borrowers was from urban areas as compared to number of borrowers
from rural and semi-urban areas. This indicates that there are more
number of borrowers for educational loans in urban areas as compared
to rural and semi-urban areas.
10. Amount disbursed by Sample Banks in Urban and Rural &
Semi-Urban areas:
The data related to amount disbursed in Urban and Rural and Semi
Urban Areas, by sample banks from 2004 to 2008 is presented in the
following table:-
Table 3.15 Educational Loans disbursed by Sample Banks in Urban areas
and Rural and Semi Urban Areas (Amount) Amount Rs. Crore 2004 to 2008
S. Urban Percent Rural &
Percent No. Name of the Bank Total
Areas to Total Semi Urban
to Total Areas
1 Bank of Baroda 805 521 8 284 4
2 Bank of India 975 649 10 326 5
3 Bank of 268 196 3 73 1 Maharashtra
4 Central Bank 457 326 5 131 2 of India
5 Dena Bank 172 107 2 65 1
6 Union Bank 553 398 6 155 2 of India
7 State Bank 3577 2573 38 1005 15 of India
Total 6808 4770 70 2038 30
Average 973 681 291
Source: Indian Banks' Association.
140

The data is presented in the chart as follows:-
CP ... 0 ... u I/)
a: -c J 0 E <t
Chart 3.6
Amount disbursed by sample banks as Educational loans during 2004 and 2008
4000
3500
3000
2500
2000
1500
1000
500
0
• Total Amount disbursed
K:I Amount disbursed in Urban areas
§Amount disbursed in rural and semi-urban areas
Table 3.15 reveals that the total amount disbursed as educational
loans by sample banks during 2004 and 2008 is Rs.6808 crores. Out
of this, total amount disbursed in urban areas is Rs.4770 crores while
in rural and semi-urban areas, it is Rs.2038 crores. The average
amount disbursed as educational loans by sample banks during 2004
and 2008 is Rs.973 crores. The average amount disbursed towards
educational loans by sample banks during 2004 and 2008 is Rs.681
141

crores while in rural and semi-urban areas it is RS.291 crores. Among
the sample banks under study, State Bank of India disbursed the
highest amount of educational loans during 2004 and 2008. Out of total
amount of RS.3577 crores disbursed by State Bank of India, an amount
of RS.2573 crores was disbursed in urban areas while an amount of
RS.1005 crores was disbursed in rural and semi-urban areas. Thus, out
of total 70 percent amount of educational loans disbursed by sample
banks in urban areas during 2004 and 2008, State Bank of India had
the largest 38 percent amount disbursed in urban areas. Whereas, it
disbursed 15 percent out of total 30 percent amount of educational
loans disbursed by sample banks in rural and semi-urban areas. This
was followed by Bank of India which disbursed a total amount of
Rs.975 crores towards educational loans during 2004 and 2008. Out of
this, it disbursed Rs.649 crores in urban areas and RS.326 crores in
rural and semi-urban areas. Thus, out of total 70 percent amount of
educational loans disbursed in urban areas, Bank of India disbursed 10
percent among the sample banks while it disbursed 5 percent out of
total 30 percent amount of educational loans disbursed in rural and
semi-urban areas. Among the sample banks, Dena Bank had the
lowest amount of educational loans disbursed during 2004 and 2008.
Out of total Rs.172 crores amount of educational loans disbursed by
Dena Bank, an amount of Rs.1 07 crores was disbursed in urban areas
while an amount of RS.65 crores was disbursed in rural and semi-urban
areas. Thus, out of the total 70 percent amount of educational loans
disbursed by sample banks in urban areas during 2004 and 2008,
142

Dena Bank had disbursed a mere 2 percent amount. Whereas, it
disbursed lowest 1 percent out of total 30 percent amount of
educational loans disbursed by sample banks in rural and semi-urban
areas. Overall, for all the banks among the sample, higher amount of
educational loans was disbursed in urban areas as compared to
number of borrowers from rural and semi-urban areas. This indicates
that more amount of educational loans have been disbursed in urban
areas as compared to rural and semi-urban areas.
11. Progress of educational loans provided by Bank of Baroda:
The data regarding educational loans disbursed by Bank of Baroda is
as follows:
Table 3.16
Progress of educational loans disbursed by Bank of Baroda
Year Number of Percent Amount Percent Accounts Change Rs. in Crores Change
2004-05 6931 - 103 -
2005-06 15174 119 205 99
2006-07 15184 0 276 35
2007-08 11159 -27 221 -20
Total 48448 - 805 -Average 12112 31 201 38
Source: Indian Banks' Association.
The data is presented in the Charts as follows:-
143

UI -c ::l 0 u u « -0
0 z
-C ::l o E «
Chart 3.7
Educational Loans disbursed by Bank of Baroda ( no. of accounts)
20000 15174 15184
15000
10000
5000
0
2004-05 2005-06 2006-07 2007-08
Year
Chart 3.8
Educational loans disbursed by Bank of Baroda (amount)
276 300 ~-----------------------------------,
200
100
o 2004-05 2005-06 2006-07 2007-08
Year
Table 3.16 reveals that the total number of borrowers for educational
loans from Bank of Baroda during 2004 and 2008 was 48448. The
average number of students taking educational loans from Bank of
144

Baroda is 12112 per year in the country. The number of students taking
educational loans from Bank of Baroda increased from 6931 in 2004-
2005 to 11159 in 2007-2008. The number of borrowers for educational
loans increased from 6931 in 2004-2005 to 15174 in 2005-2006,
thereby registering a remarkably high growth of 119 percent. However,
the number of borrowers reduced by 0 percent to 15184 accounts in
2006-2007 over 2005-2006. Subsequently, number of borrowers
reduced further by -27 percent to 11159 borrowers in 2007-2008.
However, on an average, there is an increase of 31 percent in the
number of students taking education loans from Bank of Baroda per
year. This indicates that there is an increase in the number of students
taking educational loans from Bank of Baroda per year. Similarly, the
total amount disbursed as educational loans from Bank of Baroda
during 2004 and 2008 was Rs.805 crores. The amount of educational
loans disbursed by Bank of Baroda increased from Rs.103 crores in
2004-2005 to Rs.221 crores in 2007-2008. The average amount of
educational loans disbursed by Bank of Baroda per year is Rs.201
crores. The amount disbursed in 2005-2006 increased remarkably by
99 percent over 2004-2005. However, the amount disbursed in 2006-
2007 reduced to Rs.276 crores over 2005-2006, thereby registering an
increase of 35 percent. This reduced further to as low as -20 percent
in 2007-2008 over 2006-2007. However, on an average there is an
increase of 38 percent in the amount disbursed by Bank of Baroda per
year. This indicates that there is an increase in the amount disbursed
as educational loans by Bank of Baroda per year.
145

12. Progress of educational loans provided by Bank of India:
The data regarding educational loans disbursed by Bank of India is as
follows:
Table 3.17
Progress of educational loans disbursed by Bank of India
Year Number of Percent Amount Percent Accounts Change Rs. in Crores Change
2004-05 9683 - 102 -
2005-06 12983 34 212 109
2006-07 16767 29 286 35
2007-08 18774 12 375 31
Total 58207 - 975 -Average 14552 25 244 58
Source: Indian Banks' Association.
The data is presented in the Charts as follows:-
U) - 20000 c: J 0 15000 u u
<C 10000 -0
0 5000 z
0
Chart 3.9
Educational loans disbursed by Bank of India (no. of accounts)
18774
2004-05 2005-06 2006-07 2007-08 Year
146
Q) 400 ... 0 ... 0 300 rn a:: - 200 c ::l 0 E 100 <
0
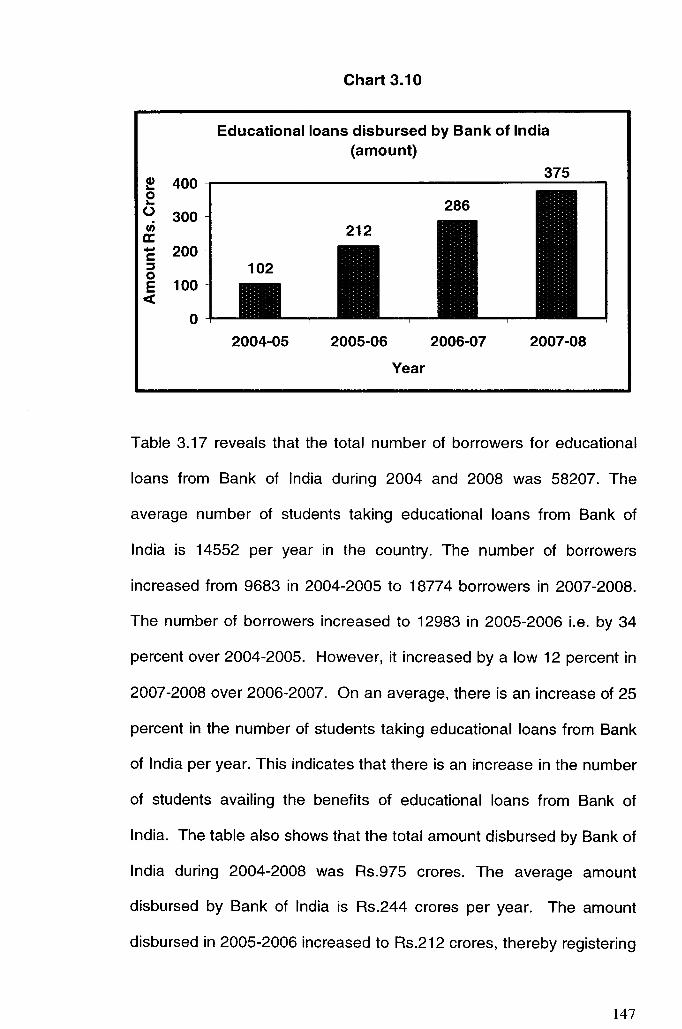
Chart 3.10
Educational loans disbursed by Bank of India (amount)
375
2004-05 2005-06 2006-07 2007-08
Year
Table 3.17 reveals that the total number of borrowers for educational
loans from Bank of India during 2004 and 2008 was 58207. The
average number of students taking educational loans from Bank of
India is 14552 per year in the country. The number of borrowers
increased from 9683 in 2004-2005 to 18774 borrowers in 2007-2008.
The number of borrowers increased to 12983 in 2005-2006 i.e. by 34
percent over 2004-2005. However, it increased by a low 12 percent in
2007-2008 over 2006-2007. On an average, there is an increase of 25
percent in the number of students taking educational loans from Bank
of India per year. This indicates that there is an increase in the number
of students availing the benefits of educational loans from Bank of
India. The table also shows that the total amount disbursed by Bank of
India during 2004-2008 was Rs.975 crores. The average amount
disbursed by Bank of India is Rs.244 crares per year. The amount
disbursed in 2005-2006 increased to Rs.212 crares, thereby registering
147

as high as 109 percent over 2004-2005. It increased by a low 31
percent in 2007-2008 over 2006-2008. However, on an average, there
is an increase of 58 percent in the amount disbursed as educational
loans by Bank of India per year. This indicates that there is an increase
in the amount disbursed for educational loans by Bank of India per
year.
13. Progress of educational loans provided by Bank of
Maharashtra:
The data regarding educational loans disbursed by Bank of
Maharashtra is as follows:-
Table 3.18
Progress of educational loans Disbursed by Bank of Maharashtra
Number of Amount Year Accounts Change Rs. in Crores Chanae 2004-05 2081 - 32 -
2005-06 3391 63 55 74
2006-07 4307 27 82 49
2007-08 4053 -6 99 21
Total 13832 - 268 -Average 3458 28 67 48
Source: Indian Banks' Association.
The data is presented in the Charts as follows:-
148

U) 5000 -C ::::J 4000 0 (,) (,) 3000 « -0 2000 0 z 1000
0
120
~ 100 0 ~
(.) 80 t/)
a: 60 -C ::::J 40 0 E 20 «
0
Chart 3.11
Educational loans disbursed by Bank of Maharashtra (no. of accounts)
2004-05 2005-06 2006-07
Year
Chart 3.12
Educational loans disbursed by Bank of Maharashtra (amount)
2007-08
99
2004-05 2005-06 2006-07 2007-08
Year
Table 3.18 reveals that the total number of borrowers for educational
loans from Bank of Maharashtra during 2004 and 2008 was 13832.
The average number of students taking educational loans from Bank of
Maharashtra is 3458 per year in the country. The number of borrowers
149

increased from 2081 in 2004-2005 to 4053 borrowers in 2007-2008.
The number of borrowers increased to 3391 in 2005-2006 i.e. by 63
percent over 2004-2005. However, it reduced marginally by -6 percent
in 2007-2008 over 2006-2007. On an average, there is an increase of
28 percent in the number of students taking educational loans from
Bank of Maharashtra per year. This indicates that there is an increase
in the number of students availing the benefits of educational loans
fram Bank of Maharashtra. The table also shows that the total amount
disbursed by Bank of Maharashtra during 2004-2008 was Rs.268
crores. The average amount disbursed by Bank of Maharashtra is
Rs.67 crares per year. The amount disbursed in 2005-2006 increased
to Rs.55 crores, thereby registering as high as 73 percent over 2004-
2005. It increased by a low 21 percent in 2007-2008 over 2006-2007.
However, on an average, there is an increase of 48 percent in the
amount disbursed as educational loans by Bank of Maharashtra per
year. This indicates that there is an increase in the amount disbursed
for educational loans by Bank of Maharashtra per year.
14. Progress of educational loans provided by Central Bank of
India:
The data regarding educational loans disbursed by Central Bank of
India is as follows:-
150

Table 3.19
Progress of educational loans Disbursed by Central Bank of India:
Year Number of Percent Amount Accounts Change Rs. in Crores
2004-05 3580 - 72
2005-06 4232 18 59
2006-07 8926 111 130
2007-08 10886 22 196
Total 27624 - 457
Average 6906 50 114
Source: Indian Banks' Association.
The data is presented in the Charts as follows:-
Chart 3.13
Educational loans disbursed by Central Bank of India (no. of accounts)
Percent Change
-
-19
121
51
-51
10886 12000 ,....----------------.....,
-E 10000
5 8000 (,)
~ 6000 -o 4000
~ 2000
o
3580
2004-05 2005-06 2006-07 2007-08
Year
151

250
CD 200 ~
0 ~
0 ui 150 a: -c 100 ::J 0 E 0< 50
0
Chart 3.14
Educational loans disbursed by Central bank of India (amount)
2004-05 2005-06 2006-07 Year
196
2007-08
Table 3.19 reveals that the total number of borrowers for educational
loans from Central Bank of India during 2004 and 2008 was 27624.
The average number of students taking educational loans from Central
Bank of India is 6906 per year in the country. The number of borrowers
increased from 3580 in 2004-2005 to 10886 borrowers in 2007-2008.
The number of borrowers increased to 8926 in 2006-2007 i.e. by 111
percent over 2005-2006. However, it increased by 22 percent only in
2007-2008 over 2006-2007. On an average, there is an increase of 50
percent in the number of students taking educational loans from
Central Bank of India per year. This indicates that there is an increase
in the number of students availing the benefits of educational loans
from Central Bank of India. The table also shows that the total amount
disbursed by Central Bank of India during 2004 and 2008 was Rs. 457
crores. The average amount disbursed by Central Bank of India is
152
Rs.114 crores per year. The amount disbursed in 2006-2007
increased to Rs.130 crores, thereby registering as high as 121 percent
over 2005-2006. It increased by 51 percent in 2007-2008 over 2006-
2007. On an average, there is an increase of 51 percent in the amount
disbursed as educational loans by Central Bank of India per year. This
indicates that there is an increase in the amount disbursed for
educational loans by Central Bank of India per year.
15. Progress of educational loans provided by Dena Bank:
The data regarding educational loans disbursed by Dena Bank is as
follows:-
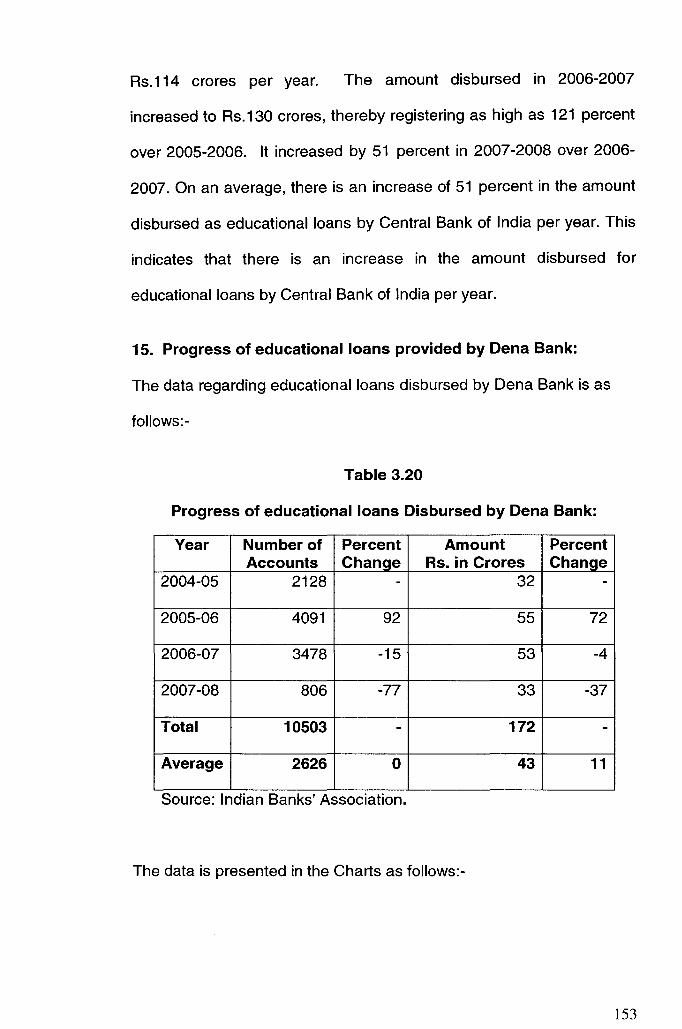
Table 3.20
Progress of educational loans Disbursed by Dena Bank:
Year Number of Percent Amount Percent Accounts Change Rs. in Crores Change
2004-05 2128 - 32 -
2005-06 4091 92 55 72
2006-07 3478 -15 53 -4
2007-08 806 -77 33 -37
Total 10503 - 172 -Average 2626 0 43 11
Source: Indian Banks' Association.
The data is presented in the Charts as follows:-
153

5000 rn
4000 -£: :::J 0 3000 u u m
2000 -0
0 1000 z 0
60 G) 50 -0 -0 40 rn a: 30 -£: :::J 20 0 E 10 «
0
Chart 3.15
Educational loans disbursed by Dena Bank (no. of accounts)
4091
2004-05 2005-06 2006-07 2007-08
Year
Chart 3.16
Educational loans disbursed by Dena Bank (amount)
2004-05 2005-06 2006-07 2007-08
Year
Table 3.20 reveals that the total number of borrowers for educational
loans from Dena Bank during 2004 and 2008 was 1 0503. The average
number of students taking educational loans from Dena Bank is 2626
154

per year in the country. The number of borrowers increased from 2128
in 2004-2005 to 4091 borrowers in 2005-2006, thereby registering a
remarkable increase by 92 percent in the number of borrowers.
However, the number of borrowers reduced to 3478 in 2006-2007 i.e.
by -15 percent over 2005-2006. It reduced further to only 806 i.e. by -
77 percent in 2007-2008. On an average, there is an increase of 0
percent in the number of students taking educational loans from Dena
Bank per year. This indicates that the number of students taking
educational loans from Dena Bank has reduced per year. The table
also shows that the total amount disbursed by Dena Bank during 2004
and 2008 was RS.172 crores. The average amount disbursed by Dena
Bank is Rs.43 crores per year. The amount disbursed in 2005-2006
increased to Rs.55 crores, thereby registering a high a 72 percent over
2004-2005. It reduced by -4 percent in 2006-2007 over 2005-2006 and
further to Rs.33 crores in 2007-2008 thereby reducing by -37 percent
over 2006-2007. However, on an average, there is an increase of 11
percent in the amount disbursed as educational loans by Dena Bank
per year.
16. Progress of educational loans provided by Union Bank of
India:
The data regarding educational loans disbursed by Union Bank of India
is as follows:-
155

Table 3.21
Progress of educational loans Disbursed by Union Bank of India:
Year Number of Percent Amount Accounts Change Rs. in Crores
2004-05 8047 - 92
2005-06 12046 50 110
2006-07 12210 1 140
2007-08 13959 14 212
Total 46262 - 553
Average 11566 22 138
Source: Indian Banks' Association.
The data is presented in the Charts as follows:-
15000
t/) 12000 -c: J 0 9000 () () as - 6000 0
0 z 3000
0
Chart 3.17
Educational loans disbursed by Union Bank of india (no. of accounts)
2004-05 2005-06 2006-07
Year
Percent Change
-
20
28
51
-33
13959
2007-08
156

250 CI) ... 200 0 ... 0 en 150 a: -s:: 100 ::s 0 E 50 C3:
0
Chart 3.18
Educational loans disbursed by Union Bank of India (amount)
2004-05 2005-06 2006-07
Year
212
2007-08
Table 3.21 reveals that the total number of borrowers for educational
loans from Union Bank of India during 2004 and 2008 was 46262. The
average number of students taking educational loans from Union Bank
of India is 11566 per year in the country. The number of borrowers
increased from 8047 in 2004-2005 to 13959 borrowers in 2007-2008.
The number of borrowers increased to 12046 in 2005-2006 i.e. by 50
percent over 2004-2005. However, it increased by 1 percent in 2006-
2007 over 2005-2006 and further in 2007-2008 by 14 percent over
2006-2007. On an average, there is an increase of 22 percent in the
number of students taking educational loans from Union Bank of India
per year. This indicates that there is an increase in the number of
students availing the benefits of educational loans from Union Bank of
India. The table also shows that the total amount disbursed by Union
Bank of India during 2004 and 2008 was Rs. 553 crores. The average
amount disbursed by Union Bank of India is Rs. 138 crores per year.
157
The amount disbursed in 2006-2007 increased to Rs.140 crores,
thereby registering as high as 28 percent over 2005-2006. It increased
further by 51 percent in 2007-2008 over 2006-2007. However, on an
average, there is an increase of 33 percent in the amount disbursed as
educational loans by Union Bank of India per year. This indicates that
there is an increase in the amount disbursed for educational loans by
Union Bank of India per year.
17. Progress of educational loans provided by State Bank of
India:
The data regarding educational loans disbursed by State Bank of India
is as follows:-
Table 3.22
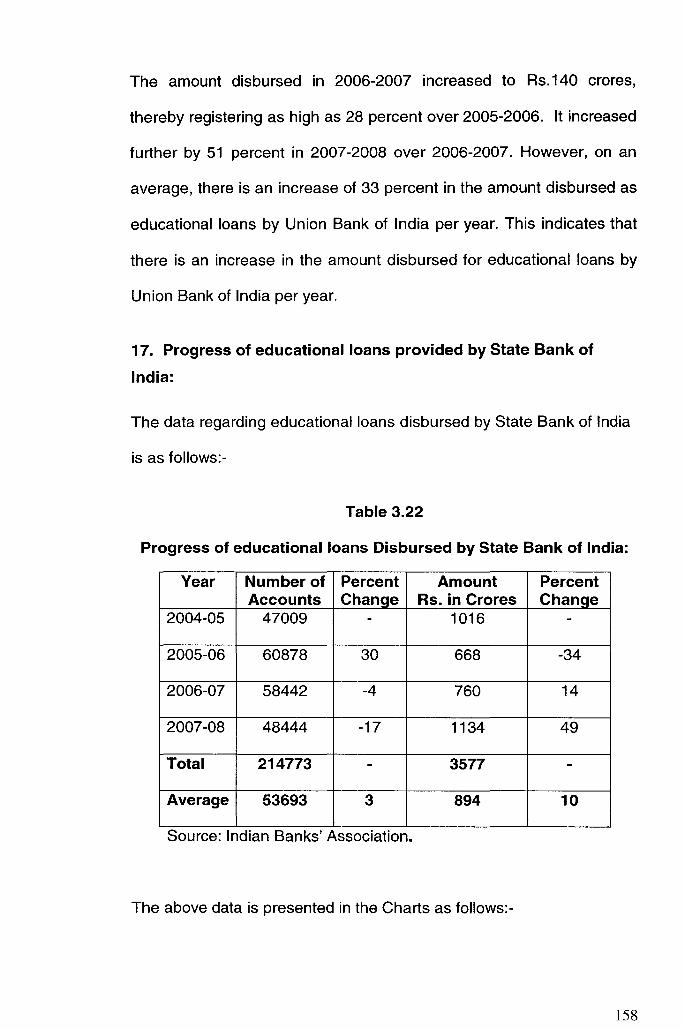
Progress of educational loans Disbursed by State Bank of India:
Year Number of Percent Amount Percent Accounts Change Rs. in Crores ChanQe
2004-05 47009 - 1016 -
2005-06 60878 30 668 -34
2006-07 58442 -4 760 14
2007-08 48444 -17 1134 49
Total 214773 - 3577 -
Average 53693 3 894 10
Source: Indian Banks' Association.
The above data is presented in the Charts as follows:-
158

t/) 80000 -c: :::s 60000 0 (.) (.)
40000 « -0 20000
0 z
0
Cl) 1600 "-0 "-0 1200 t/)
a: 800 -c: :::s 400 0 E « 0
Chart 3.19
Educational loans disbursed by State Bank of India (no. of accounts)
60878 58442
2004-05 2005-06 2006-07
Year
Chart 3.20
Educational loans disbursed by State Bank of India (amount)
48444
2007-08
1134
2004-05 2005-06 2006-07 2007-08
Year
Table 3.22 reveals that the total number of borrowers for educational
loans from State Bank of India during 2004 and 2008 was 214773. The
average number of students taking educational loans from State Bank
of India is 53693 per year in the country. The number of borrowers
increased from 47009 in 2004-2005 to 60878 borrowers in 2005-2006
i.e. by 30 percent. However, it reduced marginally to 58442 accounts
159

i.e. by -4 percent in 2006-2007 over 2005-2006. It reduced further by -
17 percent in 2007-2008 over 2006-2007. However, on an average,
there is an increase of 3 percent in the number of students taking
educational loans from State Bank of India per year. This indicates
that there is an increase in the number of students availing the benefits
of educational loans from State Bank of India. The table also shows
that the total amount disbursed by State Bank of India during 2004 and
2008 was Rs. 3577 crores. The average amount disbursed by State
Bank of India is Rs. 894 crores per year. The amount disbursed in
2005-2006 reduced to Rs.668 crores i.e. by -34 percent over 2004-
2005. However, it increased to Rs.760 crores in 2006-2007 and further
to Rs.1134 crores in 2007-2008. Thus, the amount disbursed by State
Bank of India increased by 14 percent in 2006-2007 over 2005-2006
and by 49 percent in 2007-2008 over 2006-2007. On an average, there
is an increase of 10 percent in the amount disbursed as educational
loans by State Bank of India per year. This indicates that there is an
increase in the amount disbursed for educational loans by State Bank
of India per year.
18. Growth of Educational Loans Disbursed in Sample Banks
(Compound Annual Growth Rate in %):-
The data on educational loans disbursed by sample banks have been
analyzed further on the basis of compounded annual growth rate.
Accordingly, the analysis of educational loans disbursed by Banks has
been presented in the following table:-
160

Table 3.23
Growth in Educational Loans disbursed by sample banks (Compound Annual Growth Rate in %)
Number of CAGR Amount Rs. in CAGR Accounts 2005- Crores 2005-
Name of the 2004- 2007- 2008 2004- 2007- 2008 Bank 2005 2008 (%) 2005 2008 (%)
Bank of Baroda 6931 11159 17 103 221 29
Bank of India 9683 18774 24 102 375 54
Bank of 2081 4053 25 32 99 46 Maharashtra Central Bank of 3580 10886 44 59 196 49 India
Dena Bank 2128 806 -27 32 33 2
Union Bank of 8047 13959 20 92 212 32 India State Bank of 47009 48444 1 1016 1134 4 India Source: Indian Banks' Association.
Table 3.23 reveals the growth of educational loans disbursed by
sample banks in terms of number of accounts as well as amount
disbursed. It is observed that Central Bank of India had registered the
highest compounded annual growth rate of 44 percent in the number of
accounts. The number of accounts has grown from 3580 in 2004-2005
to 10886 in 2007-2008. This was followed by both Bank of India and
Bank of Maharashtra. The number of accounts of Bank of India
increased from 9683 in 2004-2005 to 18774 in 2007-2008, registering a
compounded annual growth rate of 24 percent. Similarly, the number
of accounts of Bank of Maharashtra increased from 2081 in 2004-2005
to 4053 in 2007-2008, registering a compounded annual growth rate of
25 percent. In terms of increase in the number of accounts, State Bank
of India had the largest number of accounts followed by Bank of India
161

and Union Bank of India. Yet, the increase in number of accounts of
State Bank of India from 47009 in 2004-2005 to 48444 in 2007-2008,
registered a low compounded annual growth rate of 1 percent.
Comparatively, it is observed from the table, that there was a high
growth in the number of accounts for educational loans disbursed by
Union Bank of India and Bank of Baroda which registered a high
compounded annual growth rate of 20 percent and 17 percent each.
Dena Bank had the lowest number of borrowers for educational loans
which rather reduced from 2128 in 2004-2005 to 806 in 2007-2008
thereby registering a negative compounded annual growth rate of -27
percent. However, except for Dena Bank among the sample, all other
banks have shown a positive growth in the number of accounts for
educational loans. This indicates that the number of borrowers taking
educational loans from nationalized banks has been increasing.
The table also reveals that the amount of educational loans disbursed
by Bank of India has increased from Rs.102 crores in 2004-2005 to
Rs.375 crores in 2007-2008. Among the sample banks, Bank of India
registered the highest compounded annual growth rate of 54 percent in
the amount disbursed as educational loans. This was followed by
Bank of Maharashtra i.e. 46 percent and Central Bank of India i.e. 49
percent respectively. The amount disbursed towards educational loans
by Bank of Maharashtra increased from Rs.32 crores in 2004-2005 to
Rs.99 crores in 2007-2008, thereby registering a high compounded
annual growth rate of 46 percent. Similarly, the amount disbursed
towards educational loans by Central Bank of India increased from
162
Rs.72 crores in 2004-2005 to Rs.196 crores in 2007-2008 thereby
registering a high compounded annual growth rate of 39 percent. In
terms of increase in the amount disbursed towards educational loans,
State Bank of India had the disbursed the highest amount of
educational loans followed by Bank of Baroda and Bank of India. Yet,
the increase in amount disbursed as educational loans by State Bank
of India from RS.1016 crores in 2004-2005 to RS.1134 crores in 2007-
2008, registered a low compounded annual growth rate of 4 percent.
Among the sample banks, the lowest amount towards educational
loans was disbursed by Dena Bank. The amount disbursed as
educational loans by Dena Bank increased from RS.32 crores in 2004-
2005 to RS.33 crores in 2007-2008 thereby registering the lowest
compounded annual growth rate of 2 percent only. Overall, all banks
among the sample have registered a positive compounded annual
growth rate in the amount disbursed towards educational loans. This
indicates that there has been an increase in the amount disbursed
towards educational loans by nationalized banks.
19. Amount Outstanding for Priority Sector Advances (PSA) and
Education loans in all Nationalized Banks:
Year wise data related to amount outstanding for Priority Sector
Advances (PSA) and Education Loans as on March 2005 onwards for
all 28 Banks is presented in the following table:-
163

Table 3.24 Amount Outstanding for Priority Sector Advances (PSA) and
Educational loans (EL) of all 28 banks (Amount Rs. Crore)
As on March As on March I As on March As on March 2005 2006
I 2007 2008 !
--r
Name of the Bank PSA EL PSA EL PSA EL PSA EL
Allahabad Bank 9592 111 12453 208 16554 324 18774 463 ,
Andhra Bank 7070 511 8924 677 , 11427 905 13298 1168
Bank of Baroda 13524 281 18740 436 25291 677 31681 917
Bank of India 17682 291 22611 467 ! 28735 720 32827 1018 Bank of 5465 68 7206 105 9576 168 11147 249 Maharashtra Canara Bank 24777 719 30937 955 I 37844 1252 43202 1737 I
--
I 22496 Central Bank 14272 181 17897 257 380 25230 569 of India I
Corporation Bank 6579 101 9044 157 11564 261 13071 449
Dena Bank 4755 57 6074 105 7629 162 8096 210
IDBI Bank* - - 6872 - 9557 1 15233 39
Indian Bank 8105 162 10675 376 13335 692 14965 1149 Indian Overseas 10450 318 14114 417 17290 539 20303 732 Bank Oriental Bank of 11081 209 13399 287 15955 406 18464 583 Commerce I
Punjab & Sind Bank 3096 47 i 3994 70 5032 101 6045 148 (----
Punjab National I
Bank 26731 483 33410 676 40197 959 43412 1035
Syndicate Bank 10589 261 14627 400 18441 613 21841 852
UCO Bank 18804 98 22232 156 26649 241 29803 333
Union Bank of India 4509 231 I 7109 346 9416 462 10041 677
United Bank of India 10980 78 13643 152 17466 225 20452 277
Vijaya Bank 6176 88 7361 139 9957 209 11506 311
State Bank of India 62673 1594 82895 2417 110373 3302 133202 4413 State Bank of 5327 49 6970 74 8421 116 10373 187 Bikaner & Jaipur State Bank of 6134 224 8767 270 11295 335 12727 598 Hyderabad State Bank of Mysore 4083 79 5190 124 6153 185 7753 274
State Bank of Indore 3323 45 4493 55 6063 82 6960 117 r --f--
State Bank of Patiala 6104 56 8550 93 10310 120 11656 173 -- -
State Bank of Saurashtra 2912 34 3638 52 4523 70 4875 86
State Bank of 5934 336 7966 541 9632 775 12025 1052 Travancore Total 310727 6713 409791 10012 521181 14283 608963 19817 * Figures not available Source: Indian Banks' Association, Reserve Bank of India.
164

Table 3.24 reveals that the total amount outstanding for priority sector
advances of all nationalized banks increased from Rs.310727 crores
as on March 2005 to Rs.608963 crores as on March 2008. The
amount outstanding for educational loans also increased from Rs.6713
crores as on March 2005 to Rs.19817 crores as on March 2008. State
Bank of India has the highest amount outstanding for priority sector
advances as well as educational loans. Accordingly, the amount
outstanding for priority sector advances of State Bank of India is
Rs.62673 crores as on March 2005, Rs.82895 crores as on March
2006, Rs.110373 crores as on March 2007 and Rs.133202 crores as
on March 2008 respectively. Similarly, the amount outstanding for
educational loans of State Bank of India is Rs.1594 crores as on March
2005, Rs.2417 crores as on March 2006, Rs.3302 crores as on March
2007 and Rs.4413 crores as on March 2008 respectively. The lowest
amount outstanding for priority sector advances is observed in State
Bank of Saurashtra which is Rs.2912 crores as on March 2005,
Rs.3638 crores as on March 2006, Rs.4523 crores as on March 2007
and Rs.4875 crores as on March 2008 respectively. Whereas, the
lowest amount outstanding for educational loans is observed in lOBI
Bank which is Rs.39 crores as on March 2008.
Among the sample banks under study, State Bank of India has the
maximum amount outstanding for priority sector advances as well as
educational loans as on 31 st March 2005, March 2006, March 2007 and
March 2008 respectively. It is followed by Bank of India in which
amount outstanding for priority sector advances is Rs.17682 crores as
165

on March 2005, Rs.226ll crores as on March 2006, Rs.28735 crores
as on March 2007 and Rs.32827 crores as on March 2008
respectively. Also, the amount outstanding for educational loans in
Bank of India is Rs.29l crores as on March 2005, Rs.467 crores as on
March 2006, Rs.720 crores as on March 2007 and Rs.l018 crores as
on March 2008 respectively. Amongst the sample Banks under study,
Dena Bank has the lowest amount outstanding for priority sector
advances which is Rs.4755 crores as on March 2005, Rs.6074 crores
as on March 2006, Rs.7629 crores as on March 2007 and Rs.8096
crores as on March 2008 respectively. Whereas, the amount
outstanding for educational loans in Dena Bank is Rs.57 crores as on
March 2005, Rs.l05 crores as on March 2006, Rs.162 crores as on
March 2007 and Rs.2l0 crores as on March 2008 respectively.
Overall, the amount outstanding for priority sector advances in all
nationalized banks show an increasing trend. Correspondingly, the
amount outstanding for educational loans also shows an increasing
trend in all nationalized banks.
20. Priority Sector Advances and Educational loans of all banks
as on 31 st March 2008:
The data related to amount outstanding for Priority Sector Advances
(PSA) as well as Educational Loans (EL) as on March 2008 is
presented in the following table:-
166

Table 3.25
Amount outstanding for Priority Sector Advances (PSA) and Educational Loans (EL)
(As on March 2008) (Amount Rs. in Crores)
ELasa %of
S. No. Name of the Bank PSA EL PSA 1 Allahabad Bank 18774 463 2.5 2 Andhra Bank 13298 1168 8.8 3 Bank of Baroda 31681 917 2.9 4 Bank of India 32827 1018 3.1 5 Bank of Maharashtra 11147 249 2.2 6 Canara Bank 43202 1737 4.0 7 Central Bank of India 25230 569 2.3 8 Corporation Bank 13071 449 3.4 9 Dena Bank 8096 210 2.6 10 lOBI Bank 15233 39 0.3 11 Indian Bank 14965 1149 7.7 12 Indian Overseas Bank 20303 732 3.6 13 Oriental Bank of Commerce 18464 583 3.2 14 Punjab & Sind Bank 6045 148 2.4 15 Punjab National Bank 43412 1035 2.4 16 Syndicate Bank 21841 852 3.9 17 UCO Bank 29803 333 1.1 18 Union Bank of India 10041 677 6.7 19 United Bank of India 20452 277 1.4 20 Vijaya Bank 11506 311 2.7 21 State Bank of India 133202 4413 3.3
State Bank of Bikaner & 22 Jaipur 10373 187 1.8 23 State Bank of Hyderabad 12727 598 4.7 24 State Bank of Mysore 7753 274 3.5 25 State Bank of Indore 6960 117 1.7 26 State Bank of Patiala 11656 173 1.5 27 State Bank of Saurashtra 4875 86 1.8 28 State Bank of Travancore 12025 1052 8.7
Total 608963 19817 3.3 Source: Indian Banks' Association, Reserve Bank of India.
Table 3.25 reveals that for all nationalized banks, the total amount
outstanding for priority sector advances as on March 2008 is Rs.
167

608963 crores. Also, for all nationalized banks, the total amount
outstanding for educational loans as on 31 st March 2008 is Rs.19817
crores. Total educational loans as a percentage of total priority sector
advances as on 31 st March 2008 is 3.3 percent. Education loans as a
percentage of priority sector advances is highest for Andhra Bank i.e.
8.8 percent as on March 2008. The amount outstanding for priority
sector advances and for educational loans in Andhra Bank as on
March 2008 is Rs.13298 crores and Rs.1168 crores respectively. State
Bank of India has maximum priority sector advances i.e. Rs.133202
crores as well as educational loans advances i.e. Rs.4413 crores as on
31 st March 2008, yet educational loans as a percentage of priority
sector advances is only 3.3 percent. The lowest amount outstanding
for educational loans as a percentage of priority sector advances is
observed in lOBI Bank i.e. 0.3 percent. The amount outstanding for
priority sector advances in lOBI Bank is Rs.15233 crores and amount
outstanding for educational loans is Rs.39 crores respectively.
Among the sample banks under study, Union Bank of India has the
highest share of 6.7 percent educational loans as a percentage of
priority sector advances. The amount outstanding for priority sector
advances and for educational loans in Union Bank of India as on March
2008 is Rs.10041 crores and Rs.677 crores respectively. It is followed
by State Bank of India which has 3.3 percent educational loans as a
percentage of priority sector advances. Central Bank of India has the
lowest 2.3 percent educational loans as a percentage of priority sector
advances. The amount outstanding for priority sector advances in
168

Central Bank of India is Rs.25230 crores and amount outstanding for
educational loans is Rs.569 crores respectively.
21. Educational Loans as a percentage of Priority Sector
Advances for Sample Banks:
The data related to educational loans as a percentage of Priority Sector
Advances for Sample Banks is presented in the following table:-
Table 3.26
Educational Loans as a Percentage of Priority Sector Advances (PSA) in Sample Banks
S. Name of As on As on As on As on March March March March Mean S.D.
No. the Bank 2005 2006 2007 2008
1 Bank of Baroda 2.1 2.3 2.7 2.9 2.5 0.37
2 Bank of India 1.6 2.1 2.5 2.5 2.2 0.43
3 Bank of Maharashtra 1.2 1.5 1.8 2.2 1.7 0.43 Central
4 Bank of India 1.3 1.4 1.7 2.3 1.7 0.45
5 Dena Bank 1.2 1.7 2.1 2.6 1.9 0.59
6 Union Bank of India 5.1 4.9 4.9 6.7 5.4 0.87
7 State Bank of India 2.5 2.9 3 3.3 2.9 0.33
Source: Reserve Bank of India, Indian Banks' Association.
Table 3.26 reveals that the highest Mean of 5.4 is observed in Union
Bank of India and the lowest Mean of 1.7 is observed in both i.e. Bank
of Maharashtra and Central Bank of India respectively. The highest
deviation of 0.87 is observed in Union Bank of India and the lowest
deviation of 0.33 is observed in State Bank of India. Overall, the table
169

clearly reveals that in each bank except for Union Bank of India,
educational loans as a percentage of priority sector advances is
increasing per year. This indicates that there is an increase in the
amount of educational loans provided by banks every year.
22. Comparison of total Priority Sector Advances and Educational
Loans of all nationalized banks:
The data related to total Priority Sector Advances (PSA) and
Educational Loans for all nationalized banks is as follows:
Table 3.27
Comparison of Priority Sector Advances (PSA) and Educational Loans (EL) of all nationalized banks
Amount Outstanding (Amount Rs. in Crores)
Educational Education Priority Sector Loans Loans as a
As on March Advances Advances %age of PSA 2001 127478 1028 0.81
2002 149116 1527 1.02
2003 171485 2870 1.67
2004 244456 4179 1.71
2005 310727 6713 2.16
2006 409791 10012 2.44
2007 521181 14283 2.74
2008 608963 19817 3.25
Source: Reserve Bank of IndIa, IndIan Banks' AssocIation.
Table 3.27 reveals the amount outstanding for priority sector advances
of all nationalized banks as on March 2001 increased from RS.1274 78
crores to Rs.608963 crores as on March 2008. The amount
170
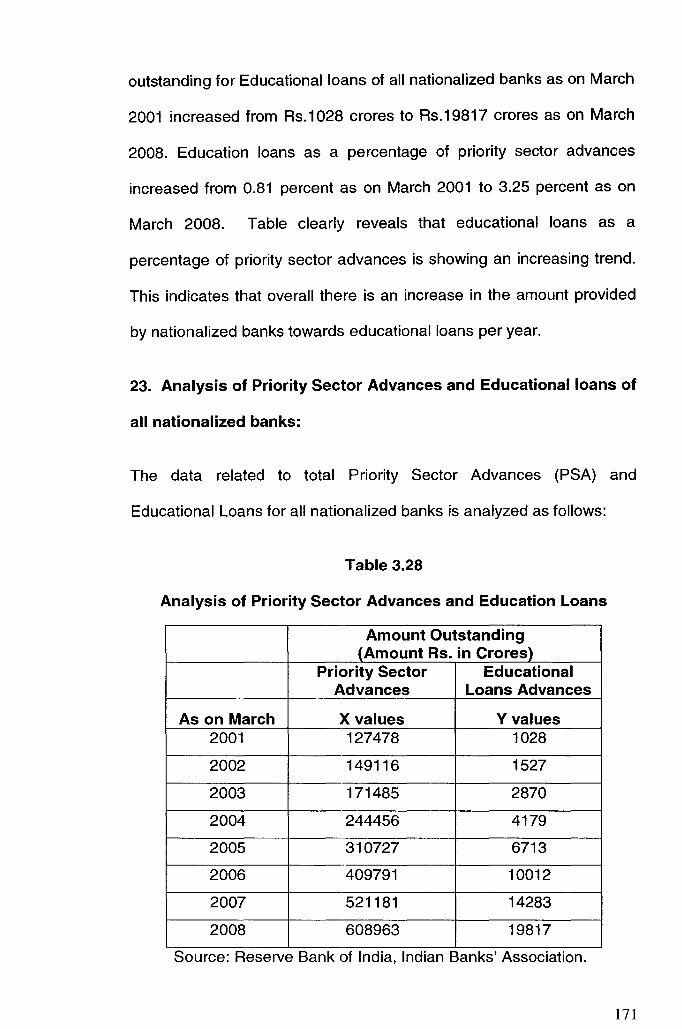
outstanding for Educational loans of all nationalized banks as on March
2001 increased from Rs.1028 crores to Rs.19817 crores as on March
2008. Education loans as a percentage of priority sector advances
increased from 0.81 percent as on March 2001 to 3.25 percent as on
March 2008. Table clearly reveals that educational loans as a
percentage of priority sector advances is showing an increasing trend.
This indicates that overall there is an increase in the amount provided
by nationalized banks towards educational loans per year.
23. Analysis of Priority Sector Advances and Educational loans of
all nationalized banks:
The data related to total Priority Sector Advances (PSA) and
Educational Loans for all nationalized banks is analyzed as follows:
Table 3.28
Analysis of Priority Sector Advances and Education Loans
Amount Outstanding (Amount Rs. in Crores)
Priority Sector Educational Advances Loans Advances
As on March X values Yvalues 2001 127478 1028
2002 149116 1527
2003 171485 2870
2004 244456 4179
2005 310727 6713
2006 409791 10012
2007 521181 14283
2008 608963 19817
Source: Reserve Bank of India, Indian Banks' Association.
171

Results:
Correlation Coefficient 0.99144
X values = Amount outstanding for Priority Sector Advances of all
Nationalized Banks.
Y values = Amount outstanding for Educational Loans of all
Nationalized Banks.
The correlation coefficient between X values and Y values is 0.99144.
Table 3.28 reveals that X values and Y values show a strong positive
correlation. This indicates that if priority sector advances increase, then
educational loans advances also increase correspondingly. Thus,
"Nationalized banks have been playing a very important role in
supporting higher education through educational loans."
24. Testing of Hypotheses:
The Hypotheses stated in the Proposal is as follows:-
"Nationalized banks have been playing a very important role in
supporting higher education through educational loans."
The progress of education loans is available with two samples i.e. all
the Nationalized banks and seven sample banks. Hence, Z test can be
used to test the hypotheses:-
172

Table 3.29
Compound Annual Growth Rate in % for sample banks (as per Table 3.23):-
Name of the Bank CAGR 2005-2008 (%)
Bank of Baroda 28.6
Bank of India 54.0
Bank of Maharashtra 45.7
Central Bank of India 38.9
Dena Bank 1.7
Union Bank of India 31.8
State Bank of India 3.7
Total 204.4
Average 29.2
Similarly, compound annual growth rate in % for 28 Banks is 31.1
(as per Table 3.7)
• Ho = Nationalized banks have been playing a very important role in
supporting higher education through educational loans.
H1 = Nationalized banks have not been playing a very important
role in supporting higher education through educational loans.
Let p s = Growth rate of Educational Loans in case of Sample banks.
P N = Growth rate of Educational Loans in case of all Nationalized
banks.
173

:.Ho= Ps = PN
Where PI = 29.2%
P2 =31.1%
ql = 1- PI = 100- 29.2 = 70.8
q 2 = 1- P 2 = 100 - 31.1 = 68.9
29.2 -31.1 :. Z = ----r========
/29.2x70.8 + 31.1x~8~ -V 7 28
29.2 -31.1 = ----.=:::::=:========
206;.36 + 21~~.79
-1.9 = ---:-jr=29=5=.3=3=+=7=6=.5=3
174
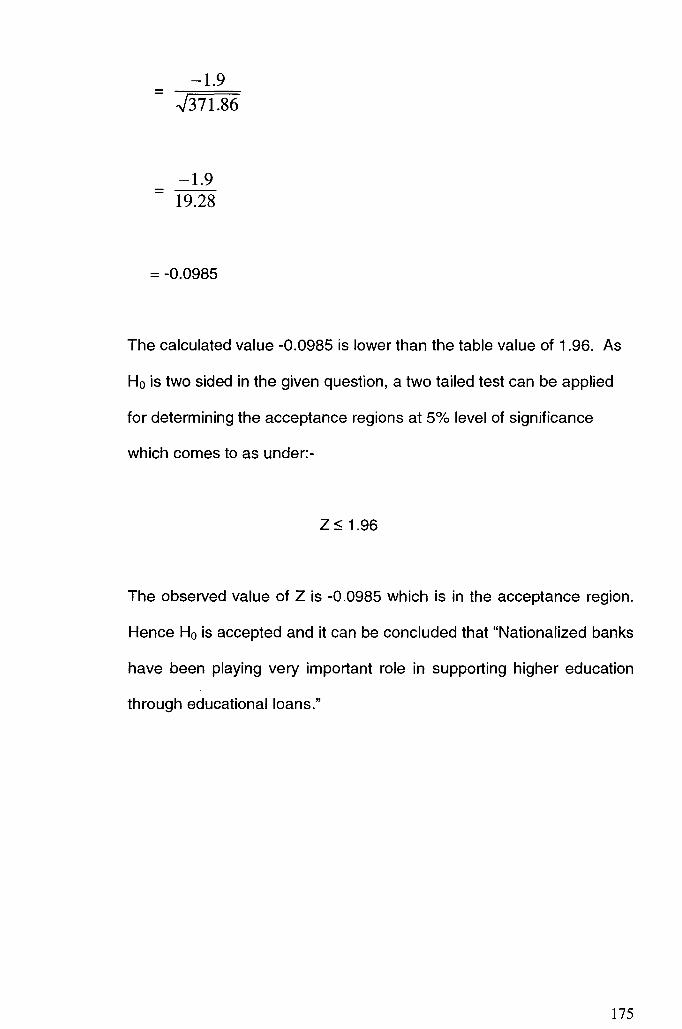
-1.9 =
..)371.86
-1.9 =
19.28
= -0.0985
The calculated value -0.0985 is lower than the table value of 1.96. As
Ho is two sided in the given question, a two tailed test can be applied
for determining the acceptance regions at 5% level of significance
which comes to as under:-
z ~ 1.96
The observed value of Z is -0.0985 which is in the acceptance region.
Hence Ho is accepted and it can be concluded that "Nationalized banks
have been playing very important role in supporting higher education
through educational loans."
175