danish greenhouse gas reduction scenarios for …€¦ · danish greenhouse gas reduction scenarios...
TRANSCRIPT

Danish Greenhouse Gas Reduction Scenarios for 2020 and 2050 February 2008 Prepared by Ea Energy Analyses Risø DTU

2
ISBN: 978-87-7844-723-4

3
Content
PREFACE 6
SUMMARY AND CONCLUSIONS 7 SEVEN SCENARIOS FOR THE FUTURE 8 SCENARIO ECONOMICS 15 MEASURES 20 PLANNING, RESEARCH, DEVELOPMENT AND DEMONSTRATION 24
SAMMENFATNING OG KONKLUSIONER 25 SYV FREMTIDSBILLEDER 26 SCENARIERNES ØKONOMI 32 VIRKEMIDLER 39 PLANLÆGNING, FORSKNING, UDVIKLING OG DEMONSTRATION 43
1 INTRODUCTION 44 1.1 STRUCTURE 45
2 METHODOLOGY AND MAIN ASSUMPTIONS 46 2.1 SCENARIO METHODOLOGY 46 2.2 MODELLING TOOL 47 2.3 ECONOMIC ANALYSES 49 2.4 ECONOMIC GROWTH 51 2.5 GROWTH IN ENERGY SERVICES 52 2.6 FUEL PRICES 53 2.7 CO2-PRICE 54 2.8 TECHNOLOGY DATA 54 2.9 ENERGY RESOURCES 55
3 DANISH GREENHOUSE GAS EMISSION 58 3.1 GREENHOUSE GAS SOURCES 58
4 SCENARIOS FOR 2020 60 4.1 MAIN RESULTS 60 4.2 ENERGY SAVINGS MEASURES 65 4.3 MEASURES IN THE TRANSPORT SECTOR 68 4.4 SUPPLY SIDE MEASURES 73 4.5 INFRASTRUCTURE 76 4.6 MEASURES IN THE AGRICULTURAL SECTOR 77 4.7 MEASURES IN OTHER SECTORS 78 4.8 RESEARCH, DEVELOPMENT & DEMONSTRATION 79
5 SCENARIOS FOR 2050 81 5.1 MAIN RESULTS 81 5.2 ENERGY SAVINGS MEASURES 86 5.3 MEASURES IN THE TRANSPORT SECTOR 89 5.4 SUPPLY SIDE MEASURES 91 5.5 INTEGRATION OF WIND POWER 91 5.6 MEASURES IN THE AGRICULTURAL SECTOR 93 5.7 RESEARCH, DEVELOPMENT & DEMONSTRATION 93

4
6 REFERENCES 95 6.1 TRANSPORT TECHNOLOGIES 96
7 APPENDIX 97 TECHNOLOGY DATA – ENERGY PRODUCTION TECHNOLOGIES 97

5

6
Preface
In the autumn of 2006 and the spring of 2007, Ea Energy Analyses and Risø DTU developed a number of greenhouse gas emissions reduction scenarios for Denmark for 2020 and 2050 for the Danish Environmental Protection Agency (DEPA). During the autumn of 2007 and January-February 2008 the scenarios have been revised, primarily in order to coordinate the assumptions of the reference projections for 2020 with the Danish Energy Authority. These adjustments have been made in a close collaboration with DEPA and the Danish Energy Authority. The work was carried out by the following team:
- Kenneth Karlsson, Risø DTU - Kaj Jørgensen, Risø DTU - Jesper Werling, Ea Energy Analyses - Helge Ørsted Pedersen, Ea Energy Analyses - Anders Kofoed-Wiuff, Ea Energy Analyses
The work has been followed by a project steering group with representatives from Danish Environmental Protection Agency, Danish Energy Authority and Danish Ministry of Finance. The consultancy report is made by Ea Energy Analyses and RISØ DTU, which are the only responsible for possible errors and omissions and for the method, analysis, assessments and conclusions in the report.

7
Summary and conclusions
The aim of the present project is to develop scenarios for reducing Danish greenhouse gas emissions in 2020 and 2050. The scenarios are to provide a basis for estimating which technologies should be combined in order to obtain future reductions in greenhouse gas emissions in a cost-effective way. The scenarios in this project include all emissions of greenhouse gases from agriculture, industry and oil extraction activities in the North Sea as well as the transport and energy sectors. Foreign air and sea carriage is not included because emissions related to such activities are not yet subject to international climate change agreements. The scenarios focus particularly on the technological possibilities and the necessary system changes in the Danish energy system and transport sector. Parallel to this, COWI has carried out analyses for the Danish Environmental Protection Agency focussing primarily on the reduction potentials in the transport sector and other emissions (Miljøstyrelsen/COWI, 2007). COWI’s results regarding agriculture and other emissions have been included in this analysis. Two timeframes are applied in the scenarios: the medium term, 2020, and the long term, 2050. For each timeframe, we have set up indicative targets that the scenarios must reach:
• 2020: 30 and 40 per cent reduction in greenhouse gas emissions compared to 1990
• 2050: 60 and 80 per cent reduction in greenhouse gas emissions compared to 1990
The scenarios for 2020 focus primarily on technologies that are already commercially available, whereas the scenarios for 2050 also examine technological options at the experimental or developmental stage. This includes hydrogen technologies and fuel cells as well as CO2 capture and sequestration (CCS) technologies. The scenarios should be seen in connection with the EU objectives of a 20-30 per cent reduction in greenhouse gas emissions in 2020 and 60-80 per cent in 2050 compared to 1990. The EU’s 30 per cent objective is contingent upon global efforts to reduce the world’s greenhouse gas emissions, implying that other countries such as the US, China, India and others will undertake the obligation to reduce emissions in a global climate change agreement for the period after 2012. The analyses in the present project have profited from the scenarios, tools and data used in connection with the project “The Future Danish Energy System” by the Danish Board of Technology. In 2004, the Danish Board of Technology invited a broad range of representatives from the major players in the energy sector, as well as researchers, NGOs and the Danish Parliament to participate in an investigation of possible ways forward for the Danish energy system. The cornerstone of this project was a so-called “Future Panel” comprising of members from the all-party parliamentary committee on energy policy.

8
In the above-mentioned project for the Danish Board of Technology, the scenarios focussed on two concrete targets for 2025: to halve CO2 emissions compared to 1990 and to reduce oil consumption by 50 per cent compared to the present level. The project showed that by combining different technology specific measures in a so-called “combination scenario” both targets can be reached. In the combination scenario, the most important measures were more energy savings, increased use of wind power and domestic biomass resources in the energy sector, electric/hybrid vehicles and biofuels as well as better fuel efficiency in the transport sector.1 In the present project the baseline projection for 2020 has been adjusted in order to correlate as closely possible to the latest baseline made by the Danish Energy Authority in January 2008. The Danish background The developments in the Danish gross energy consumption over the last 35 years is shown in Figure 1. In spite of significant economic growth it has been possible to maintain the gross energy consumption at a reasonably constant level (see Figure 1). At the same time, the actual CO2 emission from the energy sector (excluding transport) decreased by 19 per cent from 1990 to 2005. If foreign trade in electricity and seasonal variations in temperature are taken into account the decrease is 30 per cent. The most important tools in achieving this have been the insulation of buildings and improved fuel efficiency, particularly through co-generation of electricity and heat. The share of renewable energy has also grown and now covers 16 per cent of gross energy needs. At the same time, Denmark has succeeded in developing its energy system so that wind power covers almost 20 per cent of the present electricity consumption.2
-
100
200
300
400
500
600
700
800
900
1 000
1 97
2 1
976
1 97
8 1
980
1 98
2 1
984
1 98
6 1
988
1 99
0 1
992
1 99
4 1
996
1 99
8 2
000
2 00
2 2
004
PJ
oil
coalRE
natural gas
Figure 1: Trends in Danish gross energy consumption (1972-2004). Foreign air and sea carriage is not included.
Seven scenarios for the future
In the present project, seven different scenarios for the future have been analysed. This includes two reference forecasts for 2020 and 2050 respectively (see Table 1). All
1 The Danish Board of Technology 2006. 2 Danish Energy Authority: Energy Statistics 2006.

9
scenarios assume the same economic growth rate (approx. 1.9 per cent p.a.) and the same increase in the demand for energy services3. Increased use of renewable energy, improved efficiency and energy savings are the central measures in the reference scenarios and the reduction scenarios. The references are used as a basis of comparison for the reduction scenarios. In the references, continued active efforts as regards energy savings, improved energy efficiency and renewable energy are presumed. It is thus assumed that the energy savings initiatives set out in the Danish government’s action plan from 20054 are continued. This implies that the end consumption of energy, excluding transport, declines slightly from 450 PJ in 2006 to approx. 435 PJ in 20205. The end consumption of energy reflects the energy consumption by the end consumers of the private and public sectors as well as of households. To reach an end-use of 435 PJ in 2020, savings of approx. 1.6 per cent per year in the end consumption of energy (excl. the transport sector) must be implemented. Without efficiency improvements and energy saving measures, end consumption would increase to approx. 567 PJ in 2020. After 2020, the end consumption of energy in the reference scenario rises and in 2050 it is 608 PJ. However, this development implies continued savings, because the end consumption of energy on the demand side would have risen to nearly 900 PJ in 2050 if no savings measures had been implemented. In the reduction scenarios, further savings measures are implemented on the basis of the technical savings potentials stated in the background material for the Danish Energy Authority’s energy savings plan from 2005. In all reduction scenarios, the savings efforts are greater than in the reference scenarios. In the transport sector, it is assumed that more fuel-efficient means of transport are used in 2020 in all the scenarios. In the reference, it is assumed that the fuel efficiency of the fleet of cars is improved by 10 per cent compared to the present level due to more rigorous international requirements. In the most ambitious reduction scenario, an improvement of 20-25 per cent is assumed thanks to a combination of national and international measures. This corresponds to CO2 emission of 125-130 g/km for an average car in 2020 compared to approx. 170 g-CO2/km today. By way of comparison, the EU Commission has suggested a binding agreement with the European motor industry on a maximum average emission from new cars of 130g CO2/km in 2012. Furthermore, biofuels and electric/hybrid cars are introduced in the scenarios at various levels of ambition. In 2050, hydrogen and electric car technologies are expected to be fully commercialised, playing an important role in all the reduction scenarios. In the 80 per cent reduction scenario focussing particularly on the use of renewable energy, all conventional oil-based fuels have been phased out of the transport sector. Moreover, the fuel efficiency in conventional cars equipped with combustion engines is assumed
3 Cf. the Danish Energy Authority 2005: Fremskrivninger inkl. en styrket energibesparelsesindsats som følge af aftalen af 10. juni 2005 (Projections including enhanced energy savings efforts as a consequence of the agreement of 10 June 2005) 4 For the period 2006-2013, the energy savings agreement lays down a target according to which the annual effect of the energy savings activities must correspond to 1.7 per cent of the energy consumption in 2003. 5 End consumption reflects the energy supplied to the end consumers, which means private and public trades and households.
10
to have improved noticeably in the reduction scenarios (50-60 per cent compared to the present level, corresponding to 75g CO2/km). Although electricity consumption is expected to increase from well over 36 TWh today to just under 40 TWh in 2020, fuel consumption for electricity and district heating production decreases from 369 PJ6 in 2006 to 339 PJ in the reference for 2020. The reason is that the small-scale gas-fired power plants are assumed to be replaced by new, more efficient plants (Best Available Technology). Moreover, three large coal-fired power plant units (Asnæs Unit 5, Studstrup Unit 4 and Ensted Unit 3) are assumed to be refurbished. In this connection is assumed that their electric efficiency increases and that the plants are prepared for up to 50 per cent co-firing with biomass.. Generally, it is assumed that investors in the electricity sector make their investments expecting that fuel prices will not get any lower than today and that CO2 has a market value. If investors act on the basis of a short timeframe, there is a risk that the above-mentioned fuel savings potential will not be realised. The assumption that the “Best Available Technology” is used means that the average electricity efficiency will increase from just below 35 per cent today to almost 40 per cent in the reference for 2020. It should be stressed, that the scenarios focus on domestic electricity supply only and therefore it is assumed in the calculations that there is no exchange of electricity with neighbouring countries apart from export of surplus wind power in some of the scenarios.7 In the real world Danish power producers compete against producers in neighbouring countries and therefore their generation will depend on their competitiveness. Yearly variations in production from the Nordic hydro power plants does among other things determine the need for production at Danish power plants. In dry years Danish power plants will generate more to compensate for the lacking hydro power and vice versa. Sector specific models such as Balmorel are capable of modelling this relationship with a high level of detail. On average Denmark experienced a net export of 3 TWh per annum during the last 10 years (1997-2006). The actual exchange of electricity with neighbouring countries will affect the CO2-emissions from the sector in the scenarios, but not the chance of complying with international reduction targets since the power sector is covered by the present EU emissions trading scheme. This implies that the generators each year are obliged to deliver quotas to the Danish state corresponding to their emissions. In the reduction scenarios, wind power and biomass become central measures on the supply side. In 2020, 40 per cent of electricity consumption is covered by wind power in the most ambitious scenario, and in 2050 wind power accounts for as much as 70 per cent of total electricity production in the 80 percent reduction scenario focusing on renewable energy. In this respect the transport sector will have a central role as storage for wind power – either in the batteries of the cars or in caverns as a part of the overall hydrogen infrastructure in 2050. In one of the scenarios for 2050 CCS (carbon capture and storage) technologies are incorporated as a possibility, including depositing CO2 in geological layers after it has been captured at central power plants. However, a number of important barriers related to CO2 storage need to be clarified before this technology can be used full- 6 Including wind power and corrected for variations in climate and electricity exchange (Danish Energy Authority 2007, Energistatistik 2006) 7 In 2004, Denmark had a net electricity export of approx. 10 PJ. In 2005, there was an import of 5 PJ.

11
scale in the future. For example CCS technologies have high investment costs and large energy consumption for capturing CO2, which is expected to result in a loss of 8-10 percentage points of electric efficiency. In addition, even if the risk of seepage from carefully selected storage sites is considered to be negligible, the risk of leakage in connection with extraction, transport and storage processes is considerable. Furthermore, it is generally difficult to carry out long-term monitoring of leakage from storage sites under the seabed, since current satellite technologies cannot 'see through water'. In the CCS scenario, CO2 capture technologies are installed at both coal-fired and biomass-fired power plants. The latter will thus contribute to a net reduction of CO2 emissions. 2020 2050
Reference Combi-30% Combi-40% Reference Red.- 60% Red.- 80%- RE
Red.- 80%-CCS
Energy savings**
1.6% p.a.
435 PJ
2.7% p.a.
363 PJ
2.7% p.a.
363 PJ
0.8% p.a.
609 PJ
1.5% p.a.
448 PJ
1.7% p.a.
409 PJ
1.5% p.a.
448 PJ Transport efficiency***
+10% 150 g CO2/km
+10% 150 g CO2/km
+20-25% 125-130 g CO2/km
Approx. +15% 140 g CO2/km
+50-60% Approx. 75 g
CO2/km
+50-60% Approx. 75 g
CO2/km
+50-60% Approx. 75g
CO2/km Transport fuels/techs.****
8 % bio. 10% bio 5% el
15% bio 10% el
10% bio 5% el
45% el 20% h2 10% bio
55% el 35% h2 10% bio
45% el 35% h2 10% bio
Renewable energy share of gross energy
21% 30% 39% 20% 75% 100% 58%
Electricity supply
Continuation of present system
18% wind 15% bio/waste
More RE 35% wind
22% bio/waste
Considerably more RE 40% wind
31% bio/waste
Continuation of present system
20% wind 11% bio/waste
Considerably more RE
60% wind, 22% bio/waste
2% solar 2% wave
Pure RE 70% wind
27% bio/waste2% solar 1% wave
RE+CCS*****50% wind
16% bio/waste1% solar 1 % wave 37% CCS
Need for biomass import
0 PJ 0 PJ 42 PJ 0 PJ 137 PJ 211 PJ 99 PJ
Agriculture NERI forecast to 2020
NERI forecast to 2020
NERI forecast to 2020
NERI forecast to 2030*
NERI forecast to 2030*
NERI forecast to 2030*
NERI forecast to 2030*
Table 1: Overview of the analysed scenarios * NERI (National Environmental Research Institute) projections are only available up till 2030. Emissions from agriculture are assumed to remain unchanged in the remaining period 2030-2050. ** End consumption of energy excluding transport. *** average efficiency of the car fleet. **** Share of transport work by cars. Bioethanol is assumed to be produced by means of second generation technology. ***** CCS technologies are used on coal fired plants as well as on biomass fired plants. The latter therefore lead to a net reduction of CO2. Figure 2 gives an overview of total gross energy consumption in the scenarios. Compared to the present energy system, gross energy consumption remains more or less constant in the reference for 2020, while it increases considerably towards 2050. However, in all reduction scenarios gross energy consumption decreases significantly.8
Today, renewable energy covers approx. 16 per cent of gross energy consumption. In the reference for 2020, this share rises to 21 per cent, in the 30 per cent reduction scenario to 30 per cent and in the 40 per cent reduction scenario to 39 per cent. In the scenarios for 2050, the share of renewable energy increases even further, so that renewable energy covers approx. 75 per cent of total energy consumption in the 60 per cent reduction scenario and 58 per cent in the 80 per cent reduction scenario applying CCS technologies. In the 80 per cent RE scenario, fossil fuels are phased out and fully replaced by renewables. 8 Due to the model’s simplification of the energy system, historical figures and the results of the model are, however, not completely comparable. Minor deviations might occur as the model makes a slightly simplified optimisation of the energy system.

12
In the 100 per cent RE scenario for 2050, it is necessary to import considerable amounts of biomass if it is assumed that the Danish biomass resources for energy purposes are of the same size as today. In this scenario, about 300 PJ of biomass is used (excl. waste and biogas) whereas the present total resource of wood wastes and straw for energy purposes is just under 90 PJ (including biomass from waste land). It will probably be necessary to import a large part of the missing biomass resources from countries outside Europe. Alternatively, Denmark must import a large part of its electricity consumption from neighbouring countries. If Denmark were to cover its energy consumption with domestic resources only, it would be necessary to increase the use of wind power further or include large amounts of solar energy, wave power and geothermal energy. Photovoltaics and wave power only play a small role in the reduction scenarios because there is a significant degree of uncertainty as to whether these technologies will be competitive with wind power and biomass in 2050. The larger total energy consumption in the CCS scenario, compared to the other reduction scenarios, is due to the additional energy consumption used to separate CO2 from flue gas at power plants.
Gross energy consumption
0
100
200
300
400
500
600
700
800
900
1000
1100
2005
Reference 2020
Combi30%_2020
Combi40%_2020
Reference 2050
Red60%_2050
Red80%-CCS_2050
Red80%-RE_2050
Other REWasteBiogasBiomassWindNatural gasCoalOil
PJ/year
Figure 2: Gross energy consumption in 2005, and in the scenarios for 2020 and 2050. Other RE includes production based on solar energy, photo-voltaics, geothermal energy and wave power. The energy consumption in the scenarios has been converted into CO2 emissions on the basis of the greenhouse gas emission factors of the fuels. Emissions from agriculture (primarily methane and N2O) and from industrial processes etc have been added to this. The emissions from agriculture are based on a projection of emissions up to 2030, made by the Danish National Environmental Research Institute (NERI, 2007). Over the period 2030-2050, emissions from agriculture are reduced by just below 2 Mt from 10.4 Mt to 8.7 Mt. In the period 2030-2050, emissions are assumed to be unchanged. The agricultural sector has not been subject to analyses of reduction potentials in this project. However, in parallel to this project, COWI has analysed the reduction potentials and costs in the agricultural sector. According to COWI, it is possible to reduce emissions from agriculture by a further 4.8 Mt, and emissions from industrial

13
processes and waste/sewage can be reduced by 50 per cent (a reduction of approx. 1.4 Mt) (Danish Environmental Protection Agency/COWI, 2007). Figure 3 shows the historical emissions of greenhouse gasses in 1990 and 2005 compared to the emissions in the seven scenarios of the future. It should be noted that the figures for 1990 are based on actual emissions. Today, emissions from the energy and transport sectors account for more than 70 per cent of the total emissions – and in the scenarios, reduction measures are implemented particularly in these two sectors. The total greenhouse gas emission in the reference for 2020 is approx. 60 Mt, which is 5 Mt more than the Danish Kyoto objective for 2008-2012. This corresponds to a reduction of just under 14 per cent compared to 1990. In the reduction scenarios for 2020, the emission of greenhouse gasses is reduced to 47 Mt (Combi30%) and 39 Mt (Combi40%) respectively. In 2050, it is only in the 100 per cent RE scenario that an 80 per cent reduction of the emissions - corresponding to a total emission of just under 14 Mt CO2 equivalents - is obtained. However, the CCS scenario is close to attaining the target, and by use of further reduction measures within agriculture, for example, the 80 per cent objective can be achieved.
Greenhouse gas emissions (CO2-eqv.)
-10
0
10
20
30
40
50
60
70
80
1990 2005
Reference 2020
Combi30%_2020
Combi40%_2020
Reference 2050Red60%_2050
Red80%-CCS_2050
Red80%-RE_2050
mill. tonnes CO2
wastewaterlandfillF-gassesindustrial gassesagricultureoil/gas extractiontransportenergy purposes
Figure 3: Greenhouse gas emissions in 1990 and 2005 (actual emissions) and in the scenarios for 2020 and 2050. The Danish Kyoto objective for the period 2008-12 is indicated by a broken line.

14
CO2 emissions from oil and gas recovery activities in the North Sea are expected to increase from approx. 2 Mt today to approx. 3.1 Mt in 2020 according to the Danish Energy Authority. This increase is due to a continued high level of production and increased energy consumption for extraction as the fields get older. This includes increased use of gas for water injection and gas compression. The increase is to some extent moderated by an expected improvement of efficiency over time in connection with integration of new technology with higher efficiency (Best Available Technology) In 2050 it is assumed that oil and gas are no longer extracted from the fields in the North Sea (cf. Figure 4.)
Figure 4: The Danish government’s production forecasts for Dansk Undergrunds Consortium (DUC)9. In the scenarios for 2050, emissions are reduced to a level between 12 Mt (80 per cent reduction scenario with RE) and 26 Mt (60 per cent reduction scenario). In the 100 per cent RE scenario, the emission of greenhouse gasses from the energy sector is limited to approx. 1 Mt. The remaining emission is mainly due to the fact that household waste contains a fossil fraction (plastic etc.) that is burnt during waste handling.
9 Cf., Økonomi- og erhvervsministeren 2003: Redegørelse til Folketinget vedrørende Nordsøen (Statement on the North Sea to the Parliament by the Minister for Economic and Business Affairs, from 2003).
Greenhouse gas sources Energy purposes include emissions from electricity and heat production as well as other emissions from private households and industry, including the internal transport within industry, forestry, agriculture and fisheries. The transport sector includes both passenger transport and conveyance of goods. Foreign air and sea carriage is not included in the analyses. The agricultural sector’s emissions are primarily related to methane from animal digestion and from handling of manure as well as to N2O from nitrogenous fertilisers in the fields. Industrial gasses cover non energy-related CO2 from processes in industry (chemical, cement and metal industry) and from solvents F-gasses are HFC, PFC and SF6. The F-gasses are mainly used as a refrigerant in refrigerating plants and as insulating foam for various purposes. F-gasses have a far larger greenhouse gas effect than CO2 – for example, 1 kg HFC corresponds to 1,300 kg CO2. Emissions from oil/gas extraction cover the energy consumption for extraction and flaring of natural gas. Emissions from rubbish dumps and cleaning of sewage.

15
Scenario economics
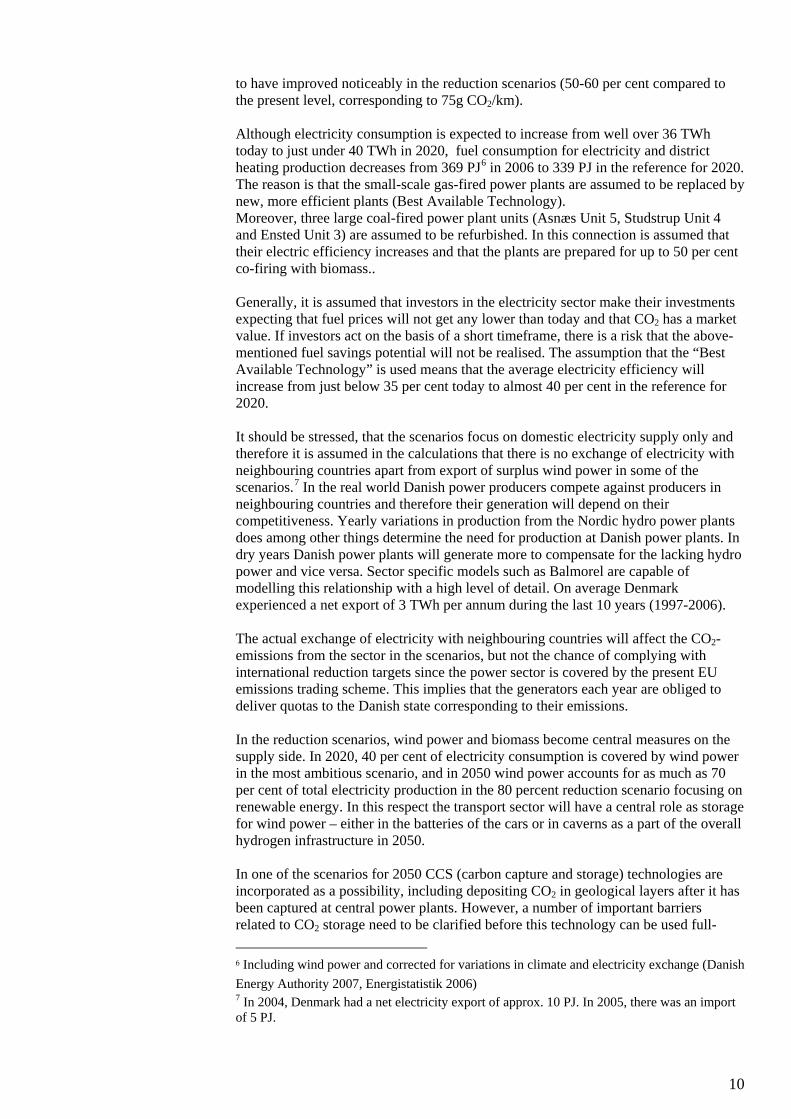
The economics of the scenarios are calculated as the annualised value of the entire energy system in the scenario years 2020 and 2050 respectively. It should be stressed that it is the annual costs in the two specific years, 2020 and 2050, which are determined. The annual costs cannot be expected to be constant within the periods 2008-2020 and 2020-2050. The average annual capital costs as well as costs for fuels, operation and maintenance are shown. The outcome is a simplified welfare-economic calculation, which does not take into consideration possible tax distortion elements, other environmental externalities than greenhouse gases (e.g. NOx, SO2 and particles), the value of security of supply and the so-called net tax factor. This financial calculation makes a relative comparison of scenarios and references possible. The calculations are made in fixed 2006 prices, and the discount rate is set at 6 per cent on the basis of the recommendations of the Danish Ministry of Finance regarding socio-economic calculations. Figure 5 shows the additional annual costs of the scenarios compared to the references. Annual costs are distributed on fuel costs, CO2-costs, operation and maintenance costs and capital costs related to investments. Moreover, the total additional costs are illustrated, which is the sum of the previously mentioned cost elements. Fuel costs are generally reduced in the reduction scenarios whereas investment costs increase. Also operation costs increase in all reduction scenarios, partly due to the fact that it is more demanding to handle biomass, biogas and waste than fossil fuels. The comparison in Figure 5 assumes an oil price of $57/barrel in 2020 and $75/barrel in 2050, and a CO2 quota price of DKK 175/tonne. An oil price of $57/barrel in 2020 corresponds to the latest projection made by the International Energy Agency in World Energy Outlook 2007. The IEA has not made fuel price projections for 2050 in World Energy Outlook 2007. As oil is expected to become a more and more scarce resource a higher oil price of 75 $/barrel is assumed in 2050. The financial calculations indicate that at the assumed CO2 and fuel prices, CO2 storage is a more cost effective measure than aiming for 100 per cent renewable energy. However, as previously mentioned, the economics of CO2 storage technologies are connected with a significant level of uncertainty as large-scale plants are still in the demonstration phase. Moreover, a number of security, environmental and liability issues have not yet been clarified. On the whole, large uncertainties are connected with estimating long-term costs of operating an energy system. Not only the investment costs of the technologies may change significantly over more than 40 years – also fuel costs may depart considerably from the assumptions made in this report. This is illustrated in Figure 6 and Figure 7 showing the relative costs of the scenarios at an oil price of $35/barrel and $100/barrel respectively. At an oil price level of $100/barrel, all scenarios are less expensive than the corresponding references. The sensitivity analyses show the consequences of investing in specific energy producing technologies and transport technologies under different fuel price assumptions. It should be stressed, that the sensitivity analyses are static, in the sense, that the total fuel consumption and its composition is assumed to be unchanged regardless of the fuel prices examined. For example, the dispatching of power plants is
16
not changing according to fuel prices and consumers do not reduce their demand for transportation at higher fuel prices. As previously mentioned security of supply (e.g. in the form of failing fuel supplies) and other environmental and health costs (e.g. air pollution) are not valued in this study. Compared to the reference, the consumption of fossil fuels is brought down in all reduction scenarios, and a gain in the form of lower environmental and health costs as well as a more reliable supply may therefore be expected in this connection. On the other hand the report has not assessed how the additional investments in the scenarios should be financed and how economic incentives should be structured. There may be significant transactions costs related to make players in the energy markets (including energy consumers) pick the solutions envisaged in the scenarios. Moreover, publicly financed economic incentives may lead to distortion losses, which have not been quantified. Finally the costs of investments may prove to be higher or lower than estimated. The scenarios cover a range of measures on the demand side as well as the supply side and in the transport sector that must been seen as a whole. Measures that may seem relatively expensive when considered individually (e.g. heat pumps at CHP plants or electricity-based cars) may be advantageous in interaction with other measures (e.g. wind power). It has not been possible to estimate the marginal costs of individual initiatives within this project.
Additional annual costs of reduction scenarios2020: 57 $/bbl2050: 75 $/bbl
-50,000
-40,000
-30,000
-20,000
-10,000
0
10,000
20,000
30,000
40,000
50,000
Fuel CO2 O&M Capital Total
mill. DKK. pr. annum
Combi30%_2020Combi40%_2020Red60%_2050Red80%-RE_2050Red80%-CCS_2050
Figure 5: Annualised additional costs of the scenarios compared to the reference at the same time. An oil price of $57/barrel in 2020 and $75/barrel in 2050 has been assumed. The calculations also include a CO2 quota price of DKK 175/tonne. A discount rate of 6 per cent is used. Please note that the costs have not been discounted to today’s value.

17
Additional annual costs of reduction scenariosLow fuel prices - 35 $/barrel
-50,000
-40,000
-30,000
-20,000
-10,000
0
10,000
20,000
30,000
40,000
50,000
Fuel CO2 O&M Capital Total
mill. DKK. pr. annum
Combi30%_2020Combi40%_2020Red60%_2050Red80%-RE_2050Red80%-CCS_2050
Figure 6: Sensitivity analysis. Annualised additional costs of the scenarios compared to the reference at the same time. An oil price of $35/barrel in 2020 and 2050 has been assumed. The prices of gas, coal and biomass are assumed to match the oil price to some extent. The calculations also include a CO2 quota price of DKK 175/tonne. A discount rate of 6 per cent is used. Please note that the costs have not been discounted to today’s value.
Additional annual costs of reduction scenariosHigh fuel prices - 100 $/barrel
-50,000
-40,000
-30,000
-20,000
-10,000
0
10,000
20,000
30,000
40,000
50,000
Fuel CO2 O&M Capital Total
mill. DKK. pr. annum
Combi30%_2020Combi40%_2020Red60%_2050Red80%-RE_2050Red80%-CCS_2050
Figure 7: Sensitivity analysis. Annualised additional costs of the scenarios compared to the reference at the same time. An oil price of $100/barrel in 2020 and 2050 has been assumed. The prices of gas, coal and biomass are assumed to match the oil price to some extent. The calculations also include a CO2 quota price of DKK 175/tonne. A discount rate of 6 per cent is used. Please note that the costs have not been discounted to today’s value.
18
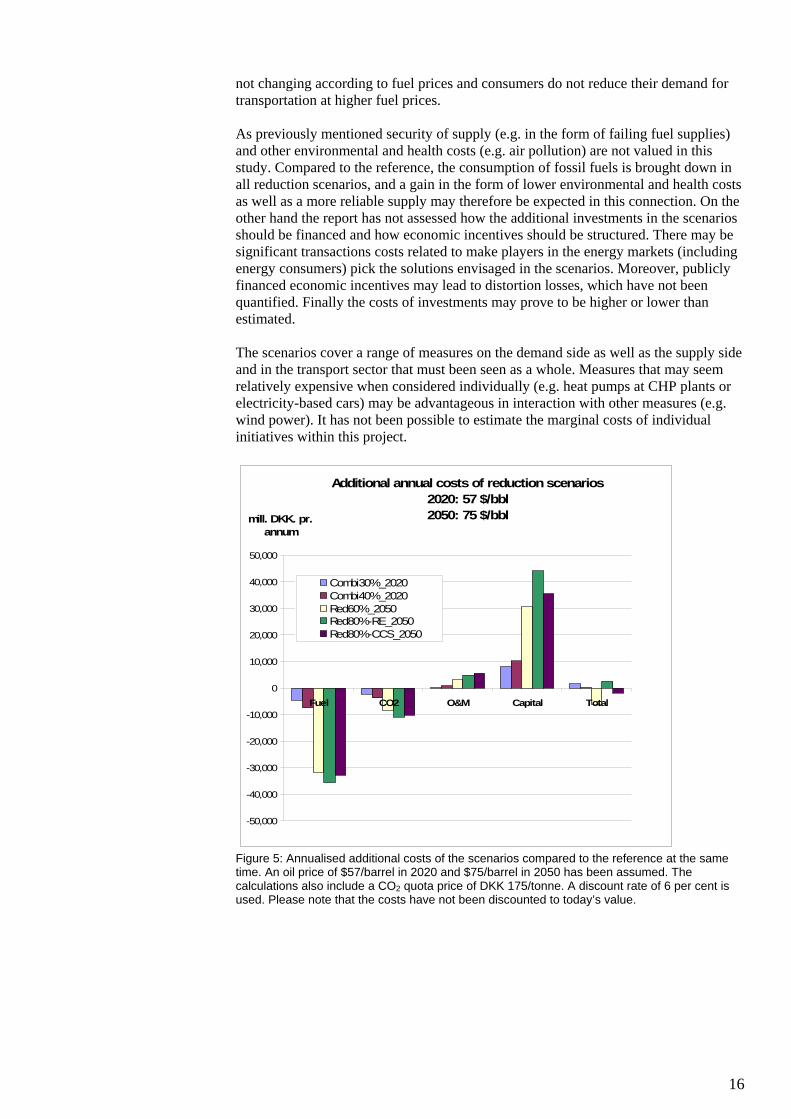
Sensitivity analysis with 3 per cent discount rate If a discount rate of 3 per cent is used as opposed to 6 per cent in the base case, the economy of the scenarios is improved relatively to the reference projections (Figure 8). This is due to the fact that the reduction scenarios comprise greater investments in production technologies, vehicles and energy savings.
Additional annual costs of reduction scenarios2020: 57$/bbl, 2050: 75$/bbl
Discount rate 3 %
-50,000
-40,000
-30,000
-20,000
-10,000
0
10,000
20,000
30,000
40,000
50,000
Fuel CO2 O&M Capital Total
mill. DKK. pr. annum
Combi30%_2020Combi40%_2020Red60%_2050Red80%-RE_2050Red80%-CCS_2050
Figure 8: Sensitivity analysis – 3 % discount rate. Annualised additional costs of the scenarios compared to the reference at the same time. An oil price of $57/barrel in 2020 and $75/barrel 2050 is assumed. The prices of gas, coal and biomass are assumed to match the oil price to some extent. The calculations also include a CO2 quota price of DKK 175/tonne. Please note that the costs have not been discounted to today’s value. Sensitivity analysis – higher costs of energy savings Estimating the costs of undertaking energy savings in industry, households and trade/service sectors is associated with a high degree of uncertainty. Depending on the specific energy services in question the investment costs are estimated to range between 10 and 150 DKK per GJ per year (75 DKK/GJ on average in 2020). To this 5 DKK/GJ per year has been added to all types of energy savings in order to represent transaction costs associated with the implementation of the needed policy measures, for example costs of informing consumers and companies about the benefits of implementing energy savings. In the Combi-30% and Combi40% scenarios for 2020 the total additional annual costs related energy savings have been estimated to 5.760 M DKK, of which 360 M DKK are attributed to the implementation of policy measures. Due to the uncertainty about the costs of promoting and undertaking energy savings a sensitivity analysis is carried out assuming that the total costs of energy savings are twice as high as in the base case. It appears from Figure 8 that the costs of energy savings measures have a significant impact on the economic results. Assuming saving costs are doubled all reduction scenarios have higher costs than the reference projections.

19
Additional annual costs of reduction scenarios2020: 57$/bbl, 2050: 75$/bbl
Double cost of energy savings
-50,000
-40,000
-30,000
-20,000
-10,000
0
10,000
20,000
30,000
40,000
50,000
60,000
Fuel CO2 O&M Capital Total
mill. DKK. pr. annum
Combi30%_2020Combi40%_2020Red60%_2050Red80%-RE_2050Red80%-CCS_2050
Figure 9: Sensitivity analysis – double cost of energy savings. Annualised additional costs of the scenarios compared to the reference at the same time. An oil price of $57/barrel in 2020 and 75 $/barrel 2050 is assumed. The prices of gas, coal and biomass are assumed to match the oil price to some extent. The calculations also include a CO2 quota price of DKK 175/tonne. The discount rate is 6 per cent. Please note that the costs have not been discounted to today’s value. CO2-abatement costs The economics of the scenarios can also be expressed by their average CO2 abatement costs. The average CO2 abatements costs are computed by dividing the additional costs of the scenarios (without including a price of CO2) by their total CO2 reduction compared to the reference. The average abatement costs are examined with the reference fuel prices as well as the low (35 $/bbl) and high fuel price level (100 $/bbl), see Table 2 below.
2020 2050 Fuel prices Combi30
% Combi40%
Red60% Red80% RE
Red80% CCS
Ref - 57/75 $/bbl 290 190 50 220 140 Low – 35 $/bbl 410 320 420 550 460
High - 100 $/bbl 70 -80 -190 10 -60 Table 2: Average CO2 reduction costs (DKK/tonne) in the reduction scenarios compared to the references With the exception of biogas plants, potentials and costs of reducing greenhouse gas emissions from agriculture and from industrial processes and waste/sewage have not been examined in this report. According to COWI (The Danish Environmental Protection Agency/COWI, 2007) it is possible to reduce emissions by a total of 4 MT through measures costing less than DKK 500/tonne in these sectors (biogas not included). If more expensive measures are applied, emissions can be reduced by well over 6 Mt.

20
The reason why the average CO2 reduction costs are lower in the Combi40% scenario than in the Combi30% scenario is in part that the fleet of cars is expected to become more efficient in the Combi40% scenario – and that a number of motorists are transferred to public transport and bicycling decreasing the car share of passenger transport from 76 per cent to 69 per cent. The costs of these initiatives have not been assessed, and they might require considerable political efforts in relation to car producers, both nationally and internationally. If the Combi40% scenario is implemented without these initiatives, the average CO2 reduction costs will rise to approx. DKK 370/tonne under reference fuel prices. Summary Altogether, the additional costs in the reduction scenarios can be calculated to between 0.1 and 0.5 per cent of total GDP in the scenario years 2020 and 2050 respectively when applying reference fuel prices (Table 3). These figures do not include a price on CO2. Taking into account the sensitivity analyses shown above the gap ranges from -0.1 % to +0.5 % of GDP in 2020 corresponding to an interval of -300 to +1750 DKK/inhabitant per year. For the 2050 scenarios the gap stretches from -0.4 % to +1.4 % of GDP corresponding to somewhere between -1650 and +6200 DKK/inhabitant. The development in fuel prices constitutes the greatest element of uncertainty.
2020 2050 Combi30% Combi40% Red60% Red80%
RE Red80% CCS
3.9 bn
3.9 bn
2.2 bn
13.4 bn
8.2 bn
0.2 % of GDP
0.2 % of GDP
0.1 % of GDP
0.5 % of GDP
0.3 % of GDP
700 DKK/capita
710 DKK/capita
400 DKK/capita
2400 DKK/capita
1500 DKK/capita
Table 3: Total additional costs (DKK) per annum in the reduction scenarios compared to the reference projections (without a CO2 price). Additional costs are also shown as share of GDP and per capita. Reference fuel prices (57/75 $/bbl). Assuming 5.5 mill. inhabitants in Denmark in 2020 as well as in 2050.
Measures
The references presuppose that the existing energy policy is continued. This means that the current energy savings efforts are continued, and that some existing power plants are gradually replaced with new ones with higher fuel efficiency or refurbished. In order to realise the reduction scenarios – or elements of these – additional efforts are needed in Denmark, in the EU and at global level. This will require long-term targets for the energy and transport sectors as well as framework conditions and measures that may contribute to pushing development in the desired direction. In that connection, it is important to underline that the scenarios focus on the technical and financial perspectives of the various technologies, and it has not been analysed in detail which measures could or should be applied. Consequently, the effects of trade in CO2 quotas, certificate systems, taxes and similar measures have not been examined separately in the work with the scenarios. Energy savings and improvement of energy efficiency are central elements in all scenarios and require efforts in relation to buildings, industry and appliances. There is a need for a continued effort both at EU level and at the national level in order to

21
promote more energy efficient products. One example is dynamic minimum standards for the energy efficiency of a number of products (white goods, engines, pumps, boilers, computers, television sets, chargers, standby consumption etc.) within the framework of the Eco-design Directive. Also the energy labelling requirements could be extended to include more products in order to promote the best products in the market. To illustrate which potentials could be achieved by promoting best available technology, the trend in the energy consumption of refrigerators and freezers is shown in the figure below.
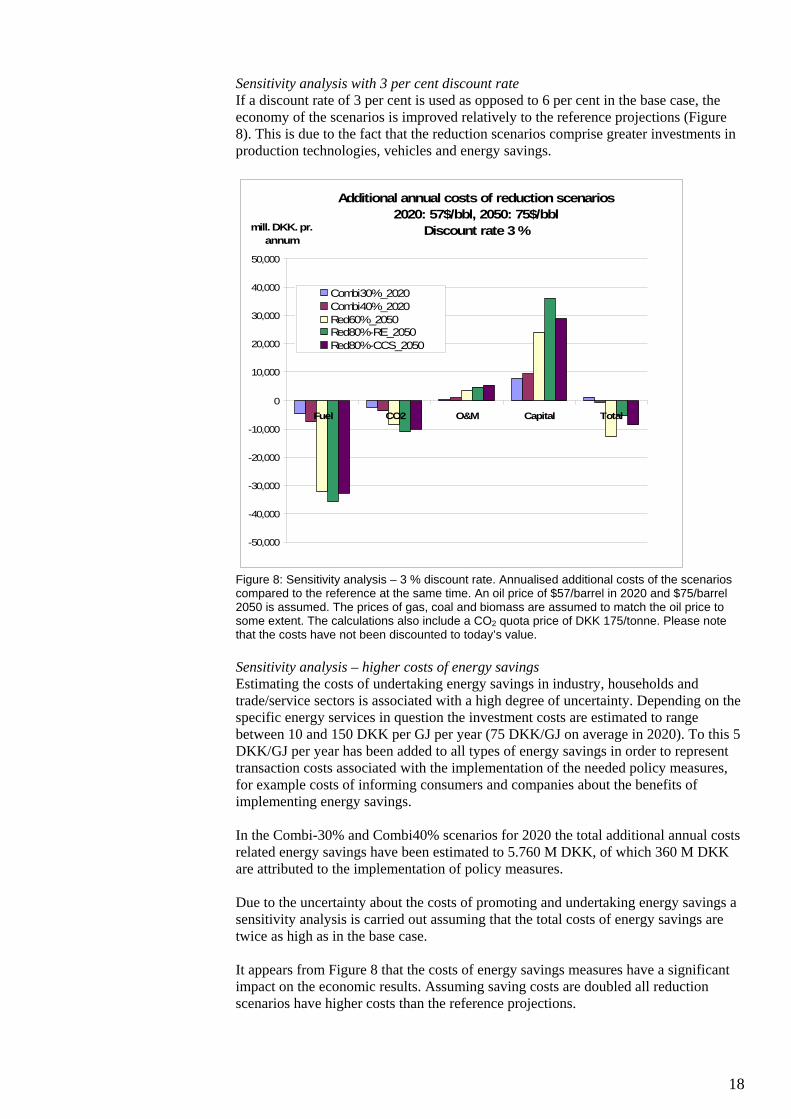
Figure 10: There is a great potential in consumers using the most efficient technologies. Example: Energy consumption of new and old refrigerators and freezers. In the building sector, there is a need to tighten up requirements for new construction projects. In the 2020 scenario, in which the total emission of greenhouse gasses is reduced by 40 per cent, the energy consumption for heating falls by approx. 30 per cent. This is in part based on the assumption that all new houses are built as zero-energy houses from 2015. In Figure 9, the energy consumption in an average Danish building is compared to the requirements in the building regulations from 1982, 1995 and 2006. Furthermore, possible tightening of the building regulations for 2010 and 2015 as well as the low-energy concepts Bolig+ and Passivhaus are shown.
0
100
200
300
400
500
600
700
800
nyt 1975 nyt 1988 nyt 2001 Bedst 06
kWh/
år KøleskabFryser
Refrigerator Freezer
New 1988 New 1975 New 2001 Best 2006
kWh/
year
22
Figure 11: Energy consumption in Danish buildings. The average Danish building compared to the requirements in the building regulations from 1982, 1995 and 2006. Furthermore, possible tightening of the building regulations for 2010 and 2015 (low-energy class 2 and 1) as well as the low-energy concepts Bolig+10 and Passivhaus are shown. However, the greater part of the savings is to be made in the existing housing stock. This means that the requirements regarding renovation of existing buildings will be further tightened through energy efficiency requirements in connection with replacement of various parts of the building such as the roof, windows and boilers. A central measure may also be the promotion of so-called ESCOs – Energy Service Companies, for example on the basis of a common market in Europe for energy savings certificates. The transport sector is a special challenge because Denmark is to a large extent dependent on common measures at international level – and particularly in the EU. In the ambitious 40 per cent reduction scenario for 2020, it is assumed that the existing fleet of cars exploits the fuels 20-25 per cent more efficiently than today. This corresponds to an average emission of 125-130 g CO2/km from all cars in Denmark in 2020. By way of comparison the EU Commission has proposed a binding agreement with the European motor industry according to which the emission from new cars is not allowed to exceed an average of 130g CO2/km in 2012. In addition to this, the Commission intends to find further reductions of 10g CO2/km by means of “other technical improvements” and by increased use of biofuels. As the renewal of the car fleet takes place gradually it may be necessary to introduce stricter minimum requirements after 2012 in order to reach the efficiency target of the 40 per cent reduction scenario.
10 Bolig+ houses will be energy neutral on a yearly basis due to their self-production of energy from e.g. solar energy or photovoltaics. In the figure, the self-production is indicated as a negative consumption.
Average energy consumption in Danish buildings
Liters of oil per m2
23
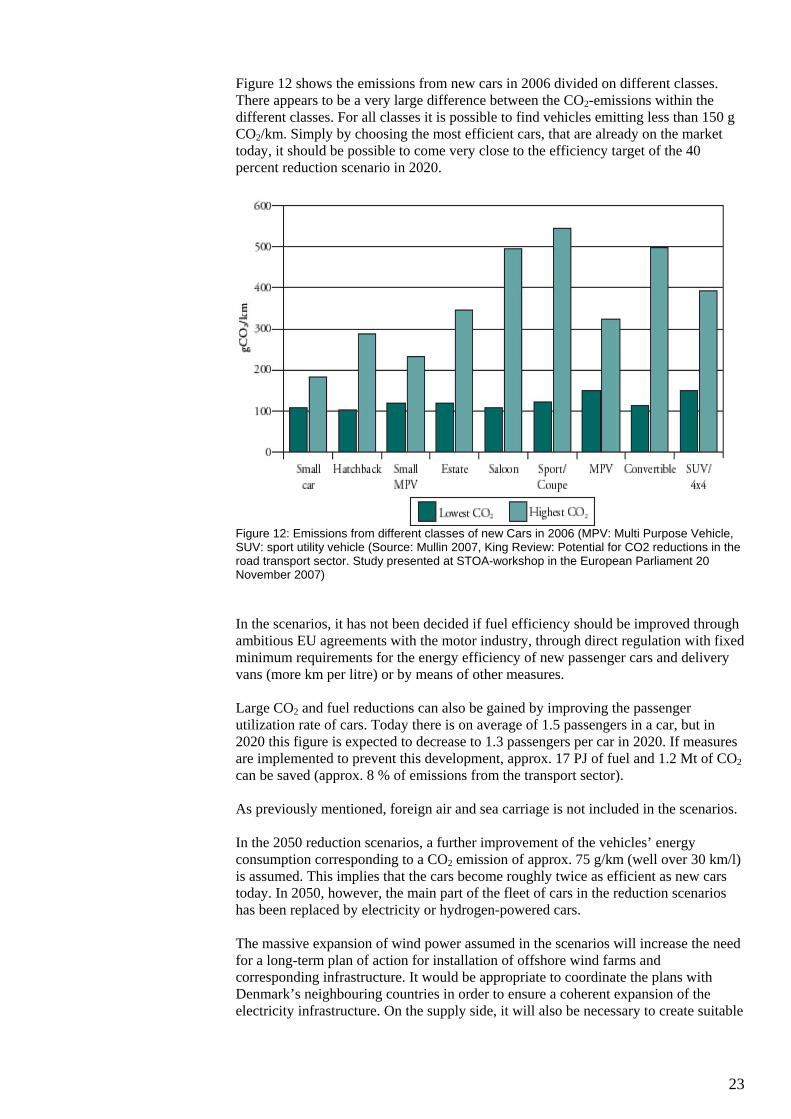
Figure 12 shows the emissions from new cars in 2006 divided on different classes. There appears to be a very large difference between the CO2-emissions within the different classes. For all classes it is possible to find vehicles emitting less than 150 g CO2/km. Simply by choosing the most efficient cars, that are already on the market today, it should be possible to come very close to the efficiency target of the 40 percent reduction scenario in 2020.
Figure 12: Emissions from different classes of new Cars in 2006 (MPV: Multi Purpose Vehicle, SUV: sport utility vehicle (Source: Mullin 2007, King Review: Potential for CO2 reductions in the road transport sector. Study presented at STOA-workshop in the European Parliament 20 November 2007) In the scenarios, it has not been decided if fuel efficiency should be improved through ambitious EU agreements with the motor industry, through direct regulation with fixed minimum requirements for the energy efficiency of new passenger cars and delivery vans (more km per litre) or by means of other measures. Large CO2 and fuel reductions can also be gained by improving the passenger utilization rate of cars. Today there is on average of 1.5 passengers in a car, but in 2020 this figure is expected to decrease to 1.3 passengers per car in 2020. If measures are implemented to prevent this development, approx. 17 PJ of fuel and 1.2 Mt of CO2 can be saved (approx. 8 % of emissions from the transport sector). As previously mentioned, foreign air and sea carriage is not included in the scenarios. In the 2050 reduction scenarios, a further improvement of the vehicles’ energy consumption corresponding to a CO2 emission of approx. 75 g/km (well over 30 km/l) is assumed. This implies that the cars become roughly twice as efficient as new cars today. In 2050, however, the main part of the fleet of cars in the reduction scenarios has been replaced by electricity or hydrogen-powered cars. The massive expansion of wind power assumed in the scenarios will increase the need for a long-term plan of action for installation of offshore wind farms and corresponding infrastructure. It would be appropriate to coordinate the plans with Denmark’s neighbouring countries in order to ensure a coherent expansion of the electricity infrastructure. On the supply side, it will also be necessary to create suitable

24
framework conditions for the construction of new efficient biomass and biogas plants. Moreover, incentives are required to ensure a higher use of biomass at existing central power plants. A key challenge will be to ensure the cost effectiveness of the measures while at the same time offering investors sufficient security for their investments. One way to do this is to ensure stable framework conditions. As regards the future infrastructure, it should be analysed which roles the district heating and natural gas systems should have. When the energy consumption for heating is reduced and the share of wind power is increased, the basis for district heating will decrease in many places. On the other hand the district heating system provides a valuable storage medium for integrating wind power through the use of electric boilers and heat pumps. It is important to clarify in which areas district heating should be given priority, how energy losses from district heating can be reduced and how energy efficiency can be further improved by dynamic use of heat pumps, geothermal energy and district cooling. Also the cost and benefits of having larger heat storage facilities in relation to district heating should be analysed. Similarly it will become important to clarify the future role of the natural gas infrastructure, which was established in Denmark in the 1980’es.
Planning, research, development and demonstration
There is a need for continued targeted research efforts as well as commitment to technological development that are adjusted on an ongoing basis according to long-term political goals. Moreover, the research and development activities should be focussed on the areas in which Denmark has a particular potential for promoting new energy technology solutions for energy savings, improvement of energy efficiency and RE. Efforts should also be made to make EU research activities reflect long-term Danish priorities. Denmark could play a special role as the EU’s ”test lab” for the flexible energy system of the future, based on the principles of the market. This implies a system in which consumers play a far more active role than today in creating coherence in the system, and where the possibilities that lie in information technologies for communication between market players and appliances are fully exploited. Important elements comprise flexible district heating systems with electricity-powered heat pumps, components for electricity/hydrogen cars (intelligent recharging in relation to needs of both the electricity system and the motorist) and, not least, activation of other demand response from consumers and industry. For Denmark, energy technologies represent a great industrial potential. As a consequence of the Danish energy policy commitments since the 1980s, the energy sector contributes considerably to economic growth and employment in Denmark. The export of Danish energy technology calculated in current prices has developed from approx. DKK 17 bn in 1996 to DKK 46 bn in 2006. The global market for pollution control technologies is estimated at DKK 4,100 bn with an annual growth of approx. 5 per cent according to the Danish government’s strategy to promote eco-efficient technology.11 A strengthened and coordinated effort within the energy sector would contribute to maintaining and expanding Denmark’s position in the market.
11 The Danish Government 2006: Promoting Eco-efficient Technology.

25
Sammenfatning og konklusioner
Formålet med dette projekt er at opstille scenarier for, hvordan Danmarks udledning af drivhusgasser kan reduceres i 2020 og 2050. Scenarierne skal tilvejebringe et grundlag for at vurdere, hvilke kombinationer af teknologier der er nødvendige for at opnå fremtidige drivhusgasreduktioner på en omkostningseffektiv måde. Scenarierne i dette projekt omfatter alle emissioner af drivhusgasser fra landbrug, industri og indvindingsaktiviteter i Nordsøen, samt fra transport- og energisektoren, dog ikke udenrigs luft- og søtransport, da emissioner herfra ikke på nuværende tidspunkt er omfattet af internationale klimaaftaler. Scenarierne har særlig fokus på de teknologiske muligheder og systemændringer, der er nødvendige i det danske energisystem og på transportområdet i Danmark. COWI har parallelt hermed gennemført analyser for Miljøstyrelsen, der primært fokuserer på reduktionspotentialer inden for transportsektoren og andre emissioner (Miljøstyrelsen/COWI, 2007). COWIs potentiale- og omkostningsopgørelser vedr. landbrug og øvrige emissioner er inddraget i denne analyse. I scenarierne arbejdes med to tidshorisonter, hhv. det mellemlange sigt, 2020, og det lange sigt 2050. For hver tidshorisont er der angivet indikative målsætninger, som scenarierne skal opfylde:
2020: 30 og 40 % reduktion i emissionen af drivhusgasser sammenlignet med 1990
2050: 60 og 80 % reduktion i emissionen af drivhusgasser sammenlignet med 1990
Scenarierne for 2020 har primært fokus på allerede kommercielle teknologier, mens der i 2050-scenarierne også ses på teknologiske muligheder, som i dag er i forsøgs- eller udviklingsstadiet. Det drejer sig bl.a. om brint og brændselsceller samt CO2-lagringsteknologier. Scenarierne skal ses i sammenhæng med EU’s målsætninger om reduktion af udledningen af drivhusgasser med 20-30 % i 2020 samt 60-80 % i 2050 sammenlignet med 1990. EU’s 30 % målsætning er betinget af en global indsats for at reducere verdens drivhusgasemissioner, dvs. at andre lande som USA, Kina, Indien m.fl. vil påtage sig reduktionsforpligtelser i en global klimaaftale for perioden efter 2012. Analyserne i dette projekt drager nytte af de scenarier, scenarieværktøjer og data, der blev anvendt i forbindelse med teknologirådsprojektet ”Det fremtidige danske energisystem”. I 2004 inviterede Teknologirådet et bredt udsnit af repræsentanter for de største aktører i energisektoren, forskere, NGO’ere og Folketinget til at belyse mulige veje for udviklingen af det danske energisystem. Hjørnestenen i projektet var det såkaldte Fremtidspanel, bestående af medlemmer fra Folketingets Energipolitiske Udvalg. Scenarierne i teknologirådsprojektet har fokuseret på to konkrete målsætninger for 2025: halvering af CO2-udledningen i forhold til 1990-niveau og reducering af olieforbruget med 50 % sammenlignet med i dag. Projektet viser, at målene kan opnås ved at kombinere forskellige teknologispecifikke virkemidler i et såkaldt “kombinationsscenarie”. I kombinationsscenariet er de vigtigste tiltag flere

26
energibesparelser, øget anvendelse af vindkraft og hjemlige biomasseresurser i energisektoren, samt elbiler, hybridbiler, biobrændstoffer og bedre brændselsøkonomi i transportsektoren.12 Forudsætningerne bag nærværende scenarieberegninger er justeret, så referencefremskrivningen nu så vidt muligt matcher Energistyrelsens seneste basisfremskrivning fra januar 2008. Udviklingen i det danske bruttoenergiforbrug er vist i Figur 1. Til trods for en betydelig økonomisk vækst – BNP er steget med mere end 50 % siden 1980 – er det lykkedes at fastholde bruttoenergiforbruget på nogenlunde konstant niveau (se Figur 1). Den faktiske CO2-emission fra energisektoren (ekskl. transport) er samtidig mindsket med 19 % i perioden 1990-2005 – og med 30 %, hvis der korrigeres for udenrigshandel med el og årlige temperaturforskelle. De væsentligste bidrag til at opnå dette har været varmeisolering af bygninger og øget brændselseffektivitet specielt gennem samproduktion af el og varme, samt en forøgelse af andelen af vedvarende energi til ca. 16 % af bruttoenergiforbruget i dag. Det er samtidig lykkedes at udvikle energisystemet således, at vindkraft i dag dækker 20 % af elforbruget.13
-
100
200
300
400
500
600
700
800
900
1 000
1 97
2 1
976
1 97
8 1
980
1 98
2 1
984
1 98
6 1
988
1 99
0 1
992
1 99
4 1
996
1 99
8 2
000
2 00
2 2
004
PJ
olie
kulVE
gas
Figur 1: Udviklingen i dansk bruttoenergiforbrug (1972-2004). Udenrigs luft- og søfart indgår ikke i figuren.
Syv fremtidsbilleder
I nærværende projekt er der analyseret syv forskellige fremtidsbilleder, herunder to referencefremskrivninger for hhv. 2020 og 2050 (se Tabel 1). Der forudsættes samme økonomiske vækst (ca. 1,9 % p.a.) i alle scenarierne og samme udvikling i efterspørgslen på energitjenester14. Øget anvendelse af vedvarende energi, flere effektiviseringer og energibesparelser er de centrale virkemidler i referencescenarierne samt i reduktionsscenarierne.
12 Teknologirådet, 2007. 13 Energistyrelsen 2006: Energistatistik 2006. 14 Jf. Energistyrelsen 2005: Fremskrivninger inkl. en styrket energibesparelsesindsats som følge af aftalen af 10. juni 2005.

27
Referencerne bruges som sammenligningsgrundlag for reduktionsscenarierne. I referencerne forudsættes en fortsat aktiv indsats i forhold til energibesparelser, energieffektiviseringer og vedvarende energi. Der antages således en forlængelse af den energispareindsats, der er udstukket i regeringens handlingsplan fra 200515. Det indebærer, at det endelige energiforbrug ekskl. transport falder svagt fra 450 PJ i 2006 til ca. 435 PJ i 202016. Det endelige energiforbrug udtrykker energiforbruget leveret til slutbrugerne, dvs. private og offentlige erhverv samt husholdninger For at nå 435 PJ i 2020 skal der gennemføres faktiske besparelser i det endelige energiforbrug (ekskl. transport) på ca. 1,6 % per år. Uden effektiviseringer og besparelser vurderes det endelige energiforbrug eksklusiv transport at stige til 567 PJ i 2020. Efter 2020 stiger det endelige energiforbrug i referencescenariet, således at det ender på 608 PJ i 2050. Udviklingen dækker dog over fortsatte besparelser, idet det endelige energiforbrug uden besparelsestiltag på forbrugssiden ville være steget til næsten 900 PJ i 2050. I reduktionsscenarierne udmøntes yderligere tiltag på besparelsesområdet på baggrund af de tekniske besparelsespotentialer, der er opgjort i baggrundsmaterialet til Energistyrelsens energisparehandlingsplan fra 2005. I alle reduktionsscenarierne sker en større besparelsesindsats end i referencerne. I transportsektoren er der forudsat en anvendelse af mere brændselsøkonomiske transportmidler i 2020 i alle scenarierne. I referencen forudsættes det, at bilparkens gennemsnitlige brændselseffektivitet forbedres med 10 % i forhold til i dag via skærpede internationale krav og i det mest ambitiøse af reduktionsscenarierne med 20-25 % ved en kombination af nationale og internationale virkemidler. Dette svarer til en CO2-emission på lidt over 125 g/km. Til sammenligning har EU Kommissionen foreslået en bindende aftale med den europæiske bilindustri, om at udledningen fra nye biler i gennemsnit ikke må overstige 130 g CO2/km i 2012. Endvidere introduceres biobrændstoffer og el-/hybridbiler med forskellige ambitionsniveauer i scenarierne. I 2050 forventes det, at brint- og elbilteknologierne er fuldt kommercialiserede og spiller en betydelig rolle i alle reduktionsscenarierne. I det 80 %-reduktionsscenarie, der har særligt fokus på anvendelsen af vedvarende energi, er alle konventionelle oliebaserede brændsler udfaset af transportsektoren. Endvidere forudsættes brændstoføkonomien i konventionelle biler med brændselsmotorer at være forbedret mærkbart i reduktionsscenarierne (50-60 % sammenlignet med i dag svarende til 75 g CO2/km). På trods af at elforbruget antages at stige fra godt 36 TWh i dag til knap 40 TWh i 2020 falder brændselsforbruget til el- og fjernvarmeproduktion fra 369 PJ i 200617til 339 PJ i referencen 2020. Dette skyldes, at de decentrale gasfyrede kraftvarmeværker forudsættes erstattet med nye anlæg med højere virkningsgrad (Best Available
15 Jf. Energistyrelsen 2005: Fremskrivninger inkl. en styrket energibesparelsesindsats som følge af aftalen af 10. juni 2005. For perioden 2006 – 2013 fastsætter energispareaftalen en målsætning om, at den årlige effekt af energispareindsatsen skal svare til 1,7 % af energiforbruget i 2003. 16 Endeligt energiforbrug udtrykker energiforbruget leveret til slut-brugerne, dvs. private og offentlige erhverv samt husholdninger. 17 Det klima- og eksportkorrigerede energiforbrug i 2006. Brændselsforbruget inkluderer vindkraft.
28
Technology). Desuden forudsættes tre ældre kulfyrede kraftværksblokke renoveret (Asnæsværkets blok 5, Studstrupværkset blok 4 samt Enstedværkets blok 3) og i den forbindelse antages en vis forbedring af virkningsgraden, samt at værkerne forberedes for biomassetilsatsfyring på op til 50 %. Det forudsættes, at investorerne i elsektoren investerer ud fra forventninger om, at brændselspriserne ikke bliver lavere end i dag, og at CO2 har en markedsværdi. Såfremt investorerne handler ud fra en kort tidshorisont, er der risiko for, at ovennævnte potentialer for brændselsbesparelser ikke realiseres. Antagelsen om anvendelse af ”Best Available Technology” betyder, at den gennemsnitlige elvirkningsgrad stiger fra knap 35 % i dag til næsten 40 % i referencefremskrivningen for 2020. Endelig har scenarierne fokus på den indenlandske elforsyning, og der er derfor ikke beregningsmæssigt forudsat nogen udveksling med el, bortset fra de scenarier, hvor der er et overskud af vindmølleproduktion, som må eksporteres. I virkeligheden vil de danske elproducenter konkurrere på elmarkederne med kraftværkerne i nabolande, og derfor vil deres produktion og dermed udvekslingen afhænge af kraftværkernes konkurrencedygtighed. De klimatiske variationer i produktionen fra norske og svenske vandkraftværker har desuden stor betydning for produktion og udveksling. I tørre år vil danske kraftværker producere mere for at kompensere for den begrænsede vandkraftproduktion og omvendt i våde år. Disse sammenhænge kan studeres nøjere ved hjælp af sektorspecifikke modeller som Balmorel. I gennemsnit har Danmark haft en nettoeksport på 3 TWh årligt i løbet af de sidste 10 år (1997-2006). Den faktiske udveksling af el med nabolande vil påvirke CO2-emissionsniveauet, som vurderet i scenarierne. Da elsektoren er omfattet af EU’s nuværende kvotehandelssystem påvirkes mulighederne for at opfylde Danmarks internationale kvoteforpligtelser imidlertid ikke, idet kvotesystemet forpligter elproducenterne at indlevere kvoter til den danske stat svarende til værkernes faktiske emissioner. I reduktionsscenarierne bliver vindkraft og biomasse de centrale virkemidler på forsyningssiden. I 2020 forsynes 40 % af elforbruget med vindkraft i det mest ambitiøse scenarie, og i 2050 udgør vindkraft hele 70 % af den samlede elproduktion i 80%-reduktionsscenariet med fokus på vedvarende energi. Transportsektoren vil i den forbindelse få en central rolle som lager for vindkraft – enten i bilernes lagre eller i centrale brintlagre i kaverner, som del af en overordnet brintinfrastruktur i 2050. I et af scenarierne for 2050 inddrages desuden CO2-deponering i geologiske lagre efter udskilning af CO2 på centrale kraftværker som en teknologisk mulighed. Der er dog en række væsentlige barrierer forbundet med CO2-lagring, som skal afklares inden denne teknologi kan tages i brug i fuld skala i fremtiden. Bl.a. er investeringsomkostningerne høje i dag, og der medgår et betydeligt energiforbrug til at udskille CO2. Der antages således et tab på 8-10 procentpoint af elvirkningsgraden på et kraftværk med CO2-lagring. Selvom risikoen for udsivning fra fornuftigt valgte lagre i dag betragtes som forsvindende, menes udslip i forbindelse med ekstraktions-, transport- og nedpumpningsprocesser at indebære en ikke ubetydelig risiko. Endvidere er det generelt vanskeligt at langtidsovervåge udslip fra lagre under havet, idet der ikke i dag findes satellitter, som kan "se gennem vand". I 80 % reduktionsscenariet med fokus på CO2-lagring installeres CO2-udskillelsesteknologierne på både kulkraftværker og biomassekraftværker. De sidste bidrager derved til en nettoreduktion i CO2-udledningen.

29
2020 2050 Reference Kombi-30 % Kombi-40 % Reference Red.- 60 % Red.- 80 %-
VE Red.- 80 %-CO2-lagring
Energi-besparelser** Endeligt energiforbrug
1,6 % p.a.
435 PJ
2,7 % p.a.
363 PJ
2,7 % p.a.
363 PJ
0,8 % p.a.
609 PJ
1,5 % p.a.
448 PJ
1,7 % p.a.
409 PJ
1,5 % p.a.
448 PJ
Transport Effektivitet****
+10 % 150 g CO2/km
+10 % 150 g CO2/km
+20-25 % 125-130
g CO2/km
App. +15% 140 g CO2/km
+50-60 % Ca. 75 g CO2/km
+50-60 % Ca. 75 g CO2/km
+50-60 % Ca. 75g CO2/km
Transport brændsler ***
8 % bio 10 % bio 5 % el
15 % bio 10 % el
10 % bio. 5 % el.
45 % el 20 % brint 10 % bio
55 % el 35 % brint 10 % bio
45 % el 35 % brint 10 % bio
Vedvarende energi (af bruttoenergi- forbrug)
21 % 30 % 39 % 20 % 75 % 100 % 58 %
Elforsyning Fortsættelse af nuværende
system 18 % vind
15 % bio/affald
Mere VE 35 % vind,
22 % bio/affald
Betydeligt mere VE
40 % vind 31 % bio/affald
Fortsættelse af nuværende
system 20 % vind
11 % bio/affald
Betydeligt mere VE
60 % vind, 22 %
bio/affald 2 % sol
2 % bølge
Kun VE 70 % vind
26 % bio/affald2 % sol
2 % bølge
VE+CO2-lagring***** 50 % vind
16% bio/affald1 % sol
1 % bølge 37 % CCS
Nødvendig biomasse import
0 PJ
0 PJ
42 PJ
0 PJ
137 PJ
211 PJ
99 PJ
Landbrug DMU-fremskrivning til
2020
DMU-fremskrivning til
2020
DMU-fremskrivning til
2020
DMU-fremskrivning til
2030 *
DMU-fremskrivning
til 2030 *
DMU-fremskrivning til
2030 *
DMU-fremskrivning
til 2030 *
Tabel 1: Overblik over de undersøgte scenarier * DMUs fremskrivninger går kun til 2030. emissionerne fra landbrug er forudsat uændrede i perioden 2030-2050. **Endeligt energiforbrug ekskl. transport. ***Andel transportarbejde for personbiler. Bioethanol antages produceret vha. 2. generationsteknologi.****Gennemsnitlige effektivitet for bilparken. ***** CCS anvendes på både kul- og biomassekraftværker, hvor sidstnævnte bidrager til en netto reduktion af CO2-udledningen. Figur 2 giver et overblik over det samlede bruttoenergiforbrug i scenarierne. Sammenlignes med dagens energisystem er energiforbruget i referencen for 2020 stort set uændret, mens der sker en væsentlig stigning frem mod 2050. I scenarierne ses derimod betydelige fald i bruttoenergiforbruget.18 I dag udgør den vedvarende energi ca. 16 procent af bruttoenergiforbruget. I referencen for 2020 stiger den andel til 21 procent, i 30 %-reduktionsscenariet til 30 procent og i 40%-reduktionsscenariet til 39 procent. I scenariene for 2050 øges andelen af vedvarende energi yderligere, således at vedvarende energi udgør ca. 75 procent af det samlede energiforbrug i 60 %-reduktionsscenariet og 58 procent i 80 %-reduktionsscenariet, hvor der anvendes CO2-lagring. I det andet 80 %-reduktionsscenarie udfases de fossile brændsler og erstattes fuldt ud med vedvarende energi, I 2050 scenariet med 100 procent VE er det nødvendigt at importere betydelige mængder biomasse, hvis man forudsætter, at den danske biomasseresurse til energiformål er af samme størrelse som i dag. I scenariet anvendes ca. 300 PJ biomasse (ekskl. affald og biogas), mens den nuværende samlede resurse af affaldstræ og halm til energiformål er knap 90 PJ (inkl. biomasse fra brakarealer). Formentligt vil det være nødvendigt at importeres en stor del af den manglende biomasseresurse fra lande uden for Europa. Alternativt skal Danmark importere en stor del af sit elforbrug fra naboområder. Såfremt Danmark skulle dække sit energiforbrug med egne resurser, ville det være nødvendigt at øge anvendelsen af vindkraft yderligere eller inddrage større mængder
18 På grund af modellens forenkling af energisystemet er de historiske opgørelser og modellens resultater dog ikke fuldstændigt sammenlignelige. Der kan således være mindre afvigelser, da modellen laver en lidt forenklet optimering af energisystemet.

30
solenergi, bølgekraft og geotermi. Solceller og bølgekraft er kun inddraget i begrænset omfang, fordi der vurderes at være betydelig usikkerhed forbundet med, om disse teknologier vil blive konkurrencedygtige med vind og biomasse i 2050. Det højere samlede energiforbrug i CO2-lagringsscenariet sammenlignet med de øvrige reduktionsscenarier skyldes det ekstra energiforbrug, der medgår til udskillelse af CO2 fra røggassen på kraftværkerne.
Bruttoenergiforbrug
0
200
400
600
800
1000
1200
2005
Reference 2020
Combi30% 2020
Combi40% 2020
Reference 2050
Red60%_2050
Red80%_2050_CCS
Red80%_2050_RE
Anden VEAffaldBiogasBiomasseVindNaturgasKulOlie
PJ/år
Figur 2: Bruttoenergiforbrug i 2005, samt i scenarierne for 2020 og 2050. Anden vedvarende energi (VE) omfatter produktion fra solvarme, solceller, geotermisk varme og bølgekraft. Energiforbruget i scenarierne er omregnet til CO2-emissioner på baggrund af brændslernes drivhusgasemissionsfaktorer. Hertil er tilføjet emissioner fra landbrug (primært methan og lattergas) samt fra industriprocesser mv. Landbrugets emissioner er baseret på en fremskrivning af emissioner fra DMU, der går frem til 2030 (NERI, 2007). Over perioden reduceres landbrugets emissioner med knap 2 Mt fra 10,4 Mt til 8,7 Mt. I perioden 2030-2050 er emissionerne antaget uændrede. Landbruget har således ikke været genstand for analyser af reduktionspotentialer i dette projekt. Imidlertid har COWI parallelt med dette projekt analyseret reduktionspotentialer og -omkostninger i landbruget. Ifølge COWI er det muligt at reducere landbrugets emissioner med yderligere 4,8 Mt., og emissionerne fra industriprocesser og affald/spildevand kan halveres (reduktion på ca. 1,4 Mt) (Miljøstyrelsen/COWI, 2007). Figur 3 viser de historiske emissioner af drivhusgas i 1990 og 2005 sammenlignet med udledningerne i de syv fremtidsscenarier. Det skal bemærkes, at der for 1990 er taget udgangspunkt i de faktiske emissioner. I dag udgør emissioner fra energi- og transportsektoren over 70 procent af den samlede udledning, og i scenarierne er det særligt her, reduktionstiltagene gennemføres. Den samlede drivhusgasudledning i referencen for 2020 er på ca. 60 Mt – hvilket er 5 Mt højere end Danmarks Kyoto-målsætning for 2008-2012. Det svarer til en reduktion på knap 14 procent sammenlignet med 1990. I reduktionsscenarierne for 2020 reduceres udledningen af drivhusgasser til hhv. 47 Mt (Kombi30%) og 39 Mt (Kombi40%).

31
I 2050 er det alene 100 % VE-scenariet, der opnår en 80 procent reduktion af emissionerne – svarende til en samlet udledning på knap 14 Mt CO2-ækvivalenter. CO2-lagringsscenariet er dog tæt på målopfyldelse, og ved anvendelse af yderligere reduktionstiltag indenfor fx landbrug vil det kunne føre til tilsvarende samlede reduktioner.
Drivhusgasudledninger (CO2-ækv.)
-10
0
10
20
30
40
50
60
70
80
1990 2005
Reference 2020
Combi30% 2020
Combi40% 2020
Reference 2050Red60%_2050
Red80%_2050_CCS
Red80%_2050_RE
mio. ton CO2
rensning af spildevandlossepladserF-gasserindustrigasserlandbrugolie/gas udv.transportenergiformålKyoto 2008-12
Figur 3: Drivhusgasemissioner i 1990 og 2005 (Faktiske) og i scenarierne for 2020 og 2050. Danmarks Kyoto-målsætning for perioden 2008-12 er markeret med en stiplet linje.
CO2-emissionerne fra olie- og gasindvindingsaktiviteterne i Nordsøen forventes ifølge Energistyrelsen at stige fra ca. 2 Mt i dag til ca. 3,1 Mt i 2020. Stigningen skyldes, at der forventes et fortsat højt produktionsniveau og et øget energiforbrug, fordi egetforbruget til brøndenes produktion stiger, efterhånden som felterne ældes. Dette
Drivhusgaskilder Energiformål omfatter emissioner fra el- og varmeproduktionen i de netbundne systemer samt i private husholdninger og industri, herunder den interne transport i industri, skovbrug, landbrug og fiskeri. Transportsektoren omfatter såvel person- som godstransport. Udenrigsluft- og skibsfart er ikke medtaget i analyserne. Landbrugets emissioner er især knyttet til metan fra husdyrenes fordøjelse og fra gødningshåndteringen samt til lattergas fra kvælstofgødning i marken. Industrigasser dækker over ikke energirelateret CO2 fra processer i industrien (kemisk-, cement- og metalindustri) og fra opløsningsmidler F-gasser udgøres af HFC, PFC og SF6. F-gasserne anvendes primært som kølemiddel i køleanlæg og i isoleringsskum til forskellige formål. F-gassernes drivhuseffekt er langt større end CO2, fx svarer 1 kg HFC til 1300 kg CO2. Emissioner fra olie/gasudvinding dækker over energiforbrug til udvindingen samt flaring af naturgas. Emissioner fra lossepladser og rensning af spildevand.

32
omfatter et øget forbrug af gas til vandinjektion og gaskompression. Stigningen modereres i et vist omfang af, at der over tid forventes forbedring af effektiviteten i forbindelse med udskiftning til ny teknologi med højere virkningsgrad (Best Available Technology). I 2050 er det antaget, at der ikke længere udvindes olie og gas i felterne i Nordsøen (jf. Figur 4).
Statens produktionsprognoser for DUC
0,00
5,00
10,00
15,00
20,00
25,00
2004
2008
2012
2016
2020
2024
2028
2032
2036
2040
Olie
mio
. m
Statens lave scenarieStatens middel scenarieStatens høje scenarie
Figur 4: Statens produktionsprognoser for DUC19. Mio. m3. I 2050-scenarierne reduceres emissionerne til mellem 12 Mt (80 % reduktion med VE) og 26 Mt (60 % reduktionsscenariet). I 100 % VE-scenariet begrænses energisektorens emission af drivhusgasser til ca. 1 Mt. Den resterende emission skyldes hovedsagligt, at der indgår en fossil fraktion i husholdningsaffaldet (plastik mv.), som afbrændes ved affaldsbehandlingen.
Scenariernes Økonomi
Økonomien i scenarierne beregnes som den annuiserede værdi af hele energisystemet i scenarierårene i hhv. 2020 og 2050. Det skal understreges, at det er de årlige omkostninger i to specifikke år, nemlig 2020 og 2050, der er beregnet. De årlige omkostninger er ikke nødvendigvis konstante indenfor perioden 2008- 2020 og 2020-2050. Der vises den gennemsnitlige årlige omkostning til afdrag og finansiering ved en reinvestering af energisystemet samt omkostninger til brændsler, drift og vedligehold. Der er dermed tale om en forenklet samfundsøkonomisk beregning, uden hensyntagen til evt. skatteforvridningstab, værdien af evt. afledte miljøeffekter (andre end CO2, dvs. NOx, SO2, partikler etc.) og forsyningssikkerhed samt anvendelse af den såkaldte nettoafgiftsfaktor. Beregningen af omkostningerne muliggør en relativ sammenligning af scenarierne med referencerne, og der vises meromkostninger i forhold til referencerne. Beregningerne er i faste 2006-priser, og renten til beregning af finansieringsomkostningerne er som udgangspunkt valgt til 6 % på baggrund af Finansministeriets anbefalinger til samfundsøkonomiske beregninger. Figur 5 viser de annuiserede meromkostninger i scenarierne sammenholdt med referencerne fordelt på brændselsomkostninger, CO2-omkostninger, drift og vedligeholdelsesomkostninger og investeringsomkostninger. Desuden fremgår de totale meromkostninger, som er summen af førnævnte omkostningselementer.
19 Økonomi- og erhvervsministeren 2003: Redegørelse til Folketinget vedrørende Nordsøen.

33
Det er generelt for reduktionsscenarierne, at de har lavere brændsels- og CO2-omkostninger end referencerne (vist som negativ meromkostning i figuren), men højere investeringsomkostninger. Driftsomkostningerne er ligeledes højere i reduktionsscenarierne, bl.a. fordi biomasse, biogas og affald er mere krævende at håndtere end fossile brændsler. Sammenligningen i Figur 5 forudsætter en oliepris på 57 $/tønde i 2020 og 75 $/tønde i 2050 og en CO2-kvotepris på 175 kr./ton. Olieprisen for 2020 er valgt i overensstemmelse med Energistyrelsens basisfremskrivning og baserer sig på IEAs langsigtede forventninger som redegjort for i World Energy Outlook 200720. IEA har ikke vurderet olieprisen for 2050. Her er 75 $/tønde anvendt som et bedste bud ud fra en forudsætning om, at olie med tiden vil blive en mere knap resurse. De økonomiske beregninger viser, at CO2-lagring under udgangsbetingelserne er et mere omkostningseffektivt virkemiddel end at satse på 100 % vedvarende energi. Som nævnt er der imidlertid betydelig usikkerhed om økonomien i CO2-lagringsteknologierne, da storskalaanlæg endnu er i demonstrationsfasen. Endvidere er der en række sikkerheds-, miljø- og erstatningsansvarsmæssige spørgsmål, som endnu ikke er afklaret.
Reference brændselspriser2020: 57 $/tønde2050: 75 $/tønde
-50.000
-40.000
-30.000
-20.000
-10.000
0
10.000
20.000
30.000
40.000
50.000
Brænd
sel
CO2
Drift
Inves
tering
Total
mio. kr. per år
Kombi30%_2020Kombi40%_2020Red60%_2050Red80%-VE_2050Red80%-CO2-lagring_2050
Figur 5: Annuiserede meromkostninger for scenarierne sammenlignet med referencen til samme tidspunkt. Der er forudsat en oliepris på 57 $/t i 2020 og 75 $/t i 2050. I beregningerne indgår desuden en CO2-kvotepris på 175 kr./ton. Som rente anvendes 6 %. Bemærk: Omkostningerne er ikke tilbagediskonteret til i dag. I det hele taget er der store usikkerheder forbundet med at vurdere de langsigtede omkostninger ved at drive et energisystem. Der er derfor gennemført en række følsomhedsanalyser på scenariernes økonomi, som er oversigtligt samlet i Figur 13 i Appendix (s. 98). Ikke kun teknologiernes investeringsomkostninger kan ændre sig væsentligt på 45 års sigt. Brændselspriserne kan ligeledes afvige betydeligt fra de forudsætninger, der er anvendt her. Dette er illustreret i Figur 6 og Figur 7, hvor scenariernes relative
20 Her forudses en oliepris på 57 $/tønde i 2015 og 62 $/tønde i 2030.

34
omkostninger er vist med oliepriser på hhv. 35 $/tønde og 100 $/tønde. Ved et olieprisniveau på 100 $/tønde er alle reduktionsscenarierne, billigere end de tilhørende referencer. Følsomhedsanalyserne viser konsekvensen af at have investeret i bestemte kraftværker og transportteknologier under forskellige brændselsprisforudsætninger. Det skal i den forbindelse bemærkes, at der er tale om statiske følsomhedsanalyser, hvor det totale brændselsforbrug og sammensætningen heraf antages uændret uafhængigt af prisen på brændsler. Fx gives kraftværkerne ikke mulighed for et skifte fra en brændselstype til en anden, og forbrugerne reducerer ikke deres transportbehov ved højere brændstofpriser. Som nævnt er forsyningssikkerhed (fx i form af svigtende brændselsleverancer) samt øvrige miljø- og sundhedsomkostninger (fx luftforurening) ikke er værdisat i dette studie. Sammenlignet med referencen nedbringes forbruget af fossile brændsler i alle reduktionsscenarierne, og der kan derfor forventes en gevinst her i form af lavere miljø- og sundhedsomkostninger og sikrere forsyning. Omvendt er der ikke taget stilling til finansieringen af merinvesteringerne i reduktionsscenarierne og behovet for økonomiske incitamentstrukturer. Der kan være betydelige virkemiddelomkostninger forbundet med at fremme de rette teknologier, ligesom offentligt finansierede tilskud vil indebære økonomiske forvridningstab, som ikke er kvantificeret. Endelig skal det bemærkes, at det samlede investeringsbehov i praksis kan vise sig at blive højere eller lavere end estimeret.

Lave brændselspriser35 $/tønde
-40.000
-30.000
-20.000
-10.000
0
10.000
20.000
30.000
40.000
50.000
Brænd
sel
CO2
Drift
Inves
tering
Total
mio. kr. per år
Combi30% 2020Combi40% 2020Red60%_2050Red80%_2050_RERed80%_2050_CCS
Figur 6: Følsomhedsanalyse. Annuiserede meromkostninger for scenarierne sammenlignet med referencen til samme tidspunkt. Der er forudsat en oliepris på 35 $/t i 2020 og 2050. Priserne på gas, kul og biomasse antages at følge olieprisen i et vist omfang. I beregningerne indgår desuden en CO2-kvote pris på 175 kr./ton. Som rente anvendes 6 %. Bemærk: Omkostningerne er ikke tilbagediskonteret til i dag.

36
Høje brændselspriser100 $/tønde
-50.000
-40.000
-30.000
-20.000
-10.000
0
10.000
20.000
30.000
40.000
50.000
Brænd
sel
CO2Drif
t
Inves
tering
Total
mio. kr. per år
Combi30% 2020Combi40% 2020Red60%_2050Red80%_2050_RERed80%_2050_CCS
Figur 7: Følsomhedsanalyse. Annuiserede meromkostninger for scenarierne sammenlignet med referencen til samme tidspunkt. Der er forudsat en oliepris på 100 $/t i 2020 og 2050. Priserne på gas, kul og biomasse antages at følge olieprisen i et vist omfang. I beregningerne indgår desuden en CO2-kvote pris på 175 kr./ton. Som rente anvendes 6 %. Bemærk: Omkostningerne er ikke tilbagediskonteret til i dag. Følsomhedsanalyse med 3 % rente Anvendes en diskonteringsrente på 3 % i stedet for 6 % forbedres scenariernes økonomi relativt i forhold til referenceforløbet, fordi de indebærer større investeringer i produktionsteknologier, køretøjer og energibesparelser.

37
Reference brændselspriser2020: 57 $/tønde, 2050: 75 $/tønde
Diskonteringsrente: 3%
-40.000
-30.000
-20.000
-10.000
0
10.000
20.000
30.000
40.000
50.000
Brænd
sel
CO2Drif
t
Inves
tering
Total
mio. kr. per år
Kombi30%_2020Kombi40%_2020Red60%_2050Red80%-VE_2050Red80%-CO2-lagring_2050
Figur 8: Følsomhedsanalyse med 3 % rente. Annuiserede meromkostninger for scenarierne sammenlignet med referencen til samme tidspunkt. Der er forudsat en oliepris på 57 $/t i 2020 og 75 $/t i 2050. I beregningerne indgår desuden en CO2-kvotepris på 175 kr./ton.. Som rente anvendes 3 %. Bemærk: Omkostningerne er ikke tilbagediskonteret til i dag. Følsomhedsanalyse med højere energispareomkostninger Der vurderes at være en betydelig usikkerhed forbundet med at vurdere prisen på at gennemføre energibesparelser i industri, husholdninger og handel/service sektorerne. Afhængigt af den konkrete energitjeneste er investeringsomkostningerne vurderet til mellem 10 og ca. 150 kr. per GJ sparet energienhed per år (i 2020 gennemsnitligt 75 kr./GJ). Hertil er der lagt et bidrag på 5 kr. per GJ per år for alle typer af energibesparelser til at repræsentere såkaldte virkemiddelomkostninger, dvs. omkostningerne til at informere befolkning og virksomheder til at vælge de rigtige energirigtige løsninger. Virkemiddelomkostningerne er tænkt til finansiering af eksempelvis energimærkningsordninger, Elsparefonden og de Lokale Energitjenester. I 30 % og 40 % reduktionsscenarierne for 2020 er de samlede meromkostninger til energibesparelser estimeret til 5,760 mio. kr. årligt, heraf 360 mio. kr. til virkemiddelomkostninger. På grund af usikkerheden forbundet med at vurdere omkostninger ved at gennemføre energibesparelser er der gennemført en følsomhedsanalyse af, at de samlede omkostninger til energibesparelser er dobbelt så høje omkostninger, som antaget i udgangspunktet. Som det fremgår af Figur 9, har teknologibesparelsernes omkostningsniveau, stor betydning for den samlede økonomi, idet alle scenarierne har højere omkostninger end referencerne med dobbelt pris på energibesparelser.

38
Reference brændselspriser2020: 57 $/tønde, 2050: 75 $/tøndeDobbelt pris på energibesparelser
-40.000
-30.000
-20.000
-10.000
0
10.000
20.000
30.000
40.000
50.000
Brænd
sel
CO2Drif
t
Inves
tering
Total
mio. kr. per år
Kombi30%_2020Kombi40%_2020Red60%_2050Red80%-VE_2050Red80%-CO2-lagring_2050
Figur 9: Følsomhedsanalyse med dobbelt pris på energibesparelser. Annuiserede meromkostninger for scenarierne sammenlignet med referencen til samme tidspunkt. Der er forudsat en oliepris på 57 $/t i 2020 og 75 $/t i 2050. I beregningerne indgår desuden en CO2-kvotepris på 175 kr./ton. Som rente anvendes 6 %. Bemærk: Omkostningerne er ikke tilbagediskonteret til i dag. CO2-fortrængningsomkostninger En anden måde at vurdere scenariernes økonomi på er at betragte de gennemsnitlige CO2-fotrængningsomkostninger. CO2-fortrængningsomkostningerne beregnes som scenariernes meromkostninger – uden at inddrage en pris på CO2 – divideret med den samlede CO2-reduktion i forhold til referencen (se Tabel 2). I tilfælde af lave fremtidige brændselspriser vil CO2-fortrængningsomkostningerne blive relativt højere end under referencebetingelserne og omvendt i tilfælde af høje brændselspriser.
2020 2050 Brændselspris Kombi30
% Kombi40%
Red60% Red80% VE
Red80% CO2-lagring
Ref. (57/75 $/tønde)
290 190 50 220 140
Lav 35 $/tønde 410 320 420 550 460
Høj 100 $/tønde 70 -80 -190 10 -60 Tabel 2: gennemsnitlige CO2-fortrængningsomkostninger (kr./ton) i reduktionsscenarierne sammenlignet med referencerne. Omkostningerne kan sammenholdes med en forventet CO2-pris på 175 kr./t CO2.

39
Scenarierne dækker over en række virkemidler på såvel forbrugssiden som forsyningssiden og transportsektoren, der skal ses i samspil. Virkemidler, der isoleret set kan forekomme relativt dyre (fx varmepumper på kraftvarmeanlæg eller elbaserede biler), kan i samspil med andre virkemidler (fx vindkraft) være fordelagtige. Det har ikke inden for dette projekts rammer været muligt at opgøre de marginale omkostninger ved enkeltstående tiltag. Grunden til, at de gennemsnitlige CO2 reduktionsomkostninger er lavere i Kombi40% scenariet end i Kombi30% scenariet, er bl.a., at bilparken forventes at blive mere effektiv i Kombi40%-scenariet, samt at der overflyttes bilister til kollektiv trafik og cykel således at bilers andels af passagertransporten falder fra 76 % til 69 %. Der er ikke opgjort omkostninger ved disse tiltag, som kan kræve en betydelig politisk indsats på nationalt plan og på internationalt plan i forhold til bilproducenterne. Gennemføres Kombi40%-scenariet uden disse tiltag, stiger de gennemsnitlige CO2-reduktionsomkostninger til ca. 370 kr./ton. Det skal bemærkes, at med undtagelse af biogasanlæg er potentialer og omkostninger ved at reducere drivhusgasser fra landbruget samt fra industriprocesser og affald/spildevand ikke behandlet i denne rapport. Ifølge COWI (2006) er det muligt at reducere udledningen med i alt knap 4 Mt ved anvendelse af tiltag til under 500 kr./ton i disse sektorer (ekskl. biogas). Ved anvendelse af dyrere tiltag kan emissionerne reduceres yderligere til godt 6 Mt. Sammenfatning Sammenlagt kan meromkostningerne for CO2-reduktionerne i scenarierne opgøres til mellem 0,1 og 0,5 % af det forventede BNP i scenarieårene hhv. 2020 og 2050 (Tabel 3) under antagelse af referencebrændselspriserne. Heri er ikke indregnet en pris på CO2-kvoter. Med de viste følsomhedsanalyser bliver spændet fra -0,1 % til +0,5 % af BNP i 2020 svarende til et interval på -300 til +1750 kr./indbygger. For 2050 scenarierne går spændet fra -0,4 % til +1,4 % af BNP svarende til mellem -1650 og +6200 kr./indbygger. Udviklingen i brændselspriserne udgør det væsentligste usikkerhedselement for scenariernes økonomi.
2020 2050 Kombi30% Kombi40% Red60% Red80%
VE Red80% CO2-lagring
3,9 mia. kr. per år
3,9 mia. kr. per år
2,2 mia. kr. per år
13,4 mia. kr. per år
8,2 mia. kr. per år
0,2 % af BNP
0,2 % af BNP
0,1 % af BNP
0,5 % af BNP
0,3 % af BNP
700 DKK/indb.
710 DKK/ indb.
-400 DKK/ indb.
2400 DKK/ indb.
1500 DKK/ indb.
Tabel 3: Totale årlige meromkostninger i reduktionsscenarierne sammenlignet med referencefremskrivninger (uden pris på CO2). Meromkostningerne er desuden vist som andel af BNP. Reference brændselspriser (57/75 $/tønde). Under antagelse af et indbyggertal på 5,5 mio. i såvel 2020 som 2050.
Virkemidler
Referencerne forudsætter en videreførelse af den eksisterende energipolitik, bl.a. en fortsættelse af den nuværende energispareindsats og en vis udskiftning til nye kraftværker med højere brændselseffektivitet.

40
At realisere reduktionsscenarierne, eller elementer af disse, forudsætter en yderligere indsats både i Danmark, i EU og på globalt plan, jf. regeringens høringssvar af 15. oktober 2006 til EU's grønbog om en samlet energipolitik for Europa. Det kræver langsigtede målsætninger for energi- og transportområdet, samt et bevidst valg af rammebetingelser og virkemidler, som kan være med til at skubbe udviklingen i den ønskede retning. I den forbindelse skal det understreges, at scenariernes fokus er på de tekniske og økonomiske perspektiver i forskellige teknologivalg, og at der ikke er foretaget en analyse af hvilke virkemidler, der kan eller bør tages i anvendelse. Effekten af CO2-kvotehandel, certifikatsystemer, afgifter og tilsvarende virkemidler er således ikke belyst i dette scenariearbejde. Energibesparelser og energieffektiviseringer står centralt i alle scenarier og fordrer en indsats i forhold til såvel bygninger, industri og apparater. Der er behov for en fortsat indsats både på EU plan og på nationalt plan for at fremme mere energieffektive produkter. Det kunne fx dreje sig om dynamiske minimumsnormer for energieffektiviteten for en række produkter (bl.a. hvidevarer, motorer, pumper, kedler, computere, tv, opladere, standbyforbrug) inden for rammerne af Eco-design-direktivet, samt at udvide kravene til energimærkning til at omfatte flere produkter for at fremme de bedste produkter på markedet. For at illustrere hvilke potentialer, der kan opnås ved at fremme den bedste tilgængelige teknologi, er udviklingen i køleskabe og fryseres energiforbrug illustreret i figuren nedenfor.
0
100
200
300
400
500
600
700
800
nyt 1975 nyt 1988 nyt 2001 Bedst 06
kWh/
år KøleskabFryser
Figur 10: Der er store potentialer i, at forbrugerne anvender de mest effektive teknologier. Eksempel: Energiforbrug fra nye og gamle køleskabe og frysere. På bygningsområdet er der behov for fortsat at stramme kravene til nyt byggeri. I 2020-scenariet, hvor den samlede udledning af drivhusgasser reduceres med 40 %, falder energiforbruget til opvarmning med ca. 30 %. Det bygger bl.a. på en forudsætning om, at alle nye huse fra 2015 bygges som nulenergihuse. I Figur 11 er energiforbruget i gennemsnitligt dansk byggeri sammenlignet med kravene i bygningsreglementerne fra 1982, 1995 og 2006. Endvidere fremgår mulige stramninger til bygningsreglementerne for 2010 og 2015, samt lavenergikoncepterne Bolig+ og Passivhaus.

41
Figur 11: Energiforbrug i danske bygninger. Det gennemsnitlige danske byggeri sammenlignet med kravene i bygningsreglementerne fra 1982, 1995 og 2006. Endvidere fremgår mulige stramninger til bygningsreglementerne for 2010 og 2015 (lavenergiklasse 2 og 1), samt lavenergikoncepterne Bolig+21 og Passivhaus. De største besparelser skal dog hentes i den eksisterende boligmasse. Det betyder, at kravene i forbindelse med renovering af eksisterende bygninger fortsat strammes gennem energieffektivitetskrav i forbindelse med udskiftning af forskellige bygningsdele som fx tag, vinduer og kedler. Et centralt virkemiddel kan desuden blive udviklingen af energisparevirksomheder, såkaldte ESCOs (Energy Service Companies), fx på baggrund af et fælles marked i Europa for energisparebeviser. Transportområdet udgør en særlig udfordring, fordi Danmark i høj grad er afhængig af fælles virkemidler på internationalt plan – og særligt i EU-regi. I det ambitiøse 40%-reduktionsscenarie for 2020 er det antaget, at den eksisterende bilpark udnytter brændslerne 20-25 % mere effektivt end i dag. Det svarer omtrent til, at alle biler i Danmark i 2020 i gennemsnit udleder omtrent 125-130g CO2/km. Til sammenligning har EU Kommissionen foreslået en bindende aftale med den europæiske bilindustri, om at udledningen fra nye biler i gennemsnit ikke må overstige 130 g CO2/km i 2012. Herudover vil EU Kommissionen finde yderligere reduktioner på 10 g CO2/km vha. ”andre tekniske forbedringer” og ved øget anvendelse af biobrændstoffer. Da udskiftningen af bilparken sker gradvist kan det være nødvendigt med endnu skrappere minimumskrav efter 2012 for at nå målet i 40%-reduktionsscenariet i 2020. Figur 12 viser emissionerne fra nye biler i 2006 fordelt på forskellige klasser. Det ses, er der meget stor forskel på CO2-emissionen indenfor de forskellige klasser, og at man kan finde biler indenfor alle klasser der udleder under 150 g CO2/km. Man vil således kunne komme tæt på de langsigtede mål for scenarierne i 2020 ved at vælge de mest effektive biler, som allerede er på markedet i dag.
21 Bolig+ huse vil være energineutrale på årsbasis pga. egenproduktion af energi fra fx solvarme eller solceller. Egenproduktionen er markeret som negativt forbrug på figuren.
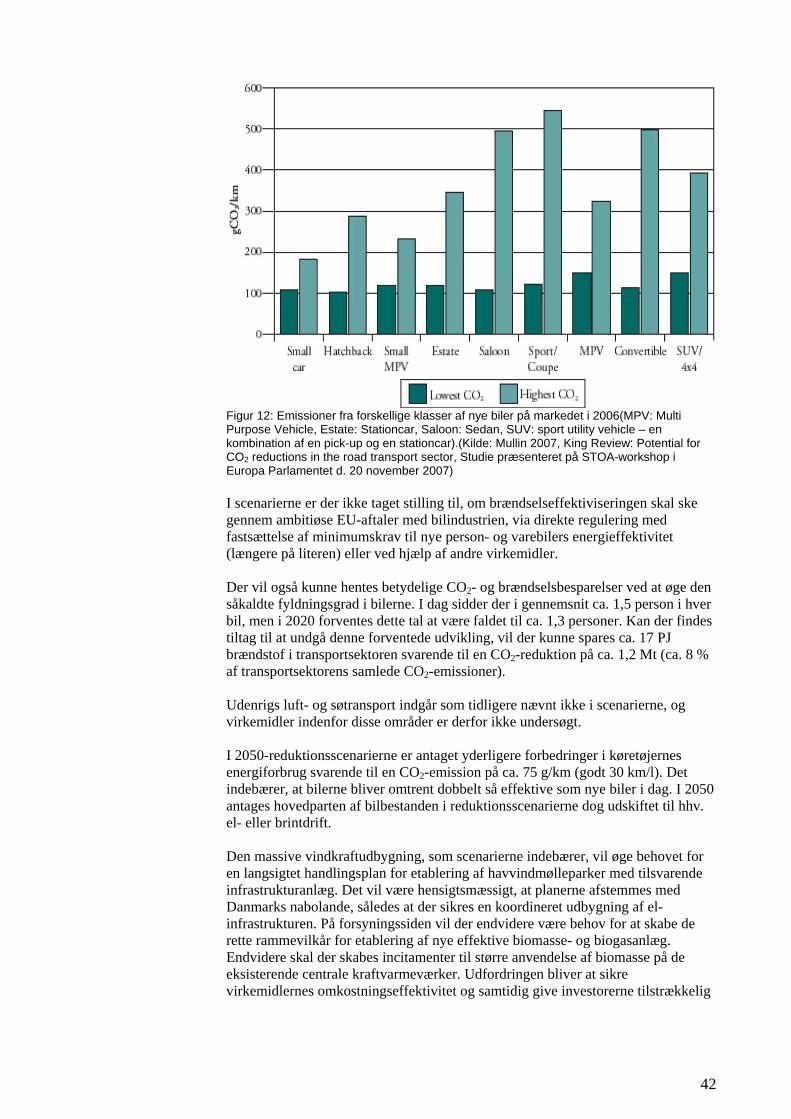
42
Figur 12: Emissioner fra forskellige klasser af nye biler på markedet i 2006(MPV: Multi Purpose Vehicle, Estate: Stationcar, Saloon: Sedan, SUV: sport utility vehicle – en kombination af en pick-up og en stationcar).(Kilde: Mullin 2007, King Review: Potential for CO2 reductions in the road transport sector, Studie præsenteret på STOA-workshop i Europa Parlamentet d. 20 november 2007) I scenarierne er der ikke taget stilling til, om brændselseffektiviseringen skal ske gennem ambitiøse EU-aftaler med bilindustrien, via direkte regulering med fastsættelse af minimumskrav til nye person- og varebilers energieffektivitet (længere på literen) eller ved hjælp af andre virkemidler. Der vil også kunne hentes betydelige CO2- og brændselsbesparelser ved at øge den såkaldte fyldningsgrad i bilerne. I dag sidder der i gennemsnit ca. 1,5 person i hver bil, men i 2020 forventes dette tal at være faldet til ca. 1,3 personer. Kan der findes tiltag til at undgå denne forventede udvikling, vil der kunne spares ca. 17 PJ brændstof i transportsektoren svarende til en CO2-reduktion på ca. 1,2 Mt (ca. 8 % af transportsektorens samlede CO2-emissioner). Udenrigs luft- og søtransport indgår som tidligere nævnt ikke i scenarierne, og virkemidler indenfor disse områder er derfor ikke undersøgt. I 2050-reduktionsscenarierne er antaget yderligere forbedringer i køretøjernes energiforbrug svarende til en CO2-emission på ca. 75 g/km (godt 30 km/l). Det indebærer, at bilerne bliver omtrent dobbelt så effektive som nye biler i dag. I 2050 antages hovedparten af bilbestanden i reduktionsscenarierne dog udskiftet til hhv. el- eller brintdrift. Den massive vindkraftudbygning, som scenarierne indebærer, vil øge behovet for en langsigtet handlingsplan for etablering af havvindmølleparker med tilsvarende infrastrukturanlæg. Det vil være hensigtsmæssigt, at planerne afstemmes med Danmarks nabolande, således at der sikres en koordineret udbygning af el-infrastrukturen. På forsyningssiden vil der endvidere være behov for at skabe de rette rammevilkår for etablering af nye effektive biomasse- og biogasanlæg. Endvidere skal der skabes incitamenter til større anvendelse af biomasse på de eksisterende centrale kraftvarmeværker. Udfordringen bliver at sikre virkemidlernes omkostningseffektivitet og samtidig give investorerne tilstrækkelig
43
sikkerhed for deres investeringer. Dette kan bl.a. ske ved at sikre stabile rammebetingelser. I forhold til den fremtidige infrastruktur vil der desuden blive behov for at analysere, hvilke roller og hvilken udbredelse fjernvarme- og naturgassystemet skal have. Når energiforbruget til opvarmning mindskes, og andelen af vindkraft øges, vil grundlaget for fjernvarme mange steder forringes. På den anden side kan fjernvarmesystemet via elpatroner og varmepumper fungere som et værdifaldt lager til integration af storskala vindkraft. Det er vigtigt at afklare, dels i hvilke områder fjernvarmen fortsat bør prioriteres, dels hvordan energitab ved fjernvarme kan reduceres, og hvordan energieffektiviteten yderligere kan øges ved dynamisk anvendelse af varmepumper, geotermi og fjernkøling. Også fjernvarmens muligheder i forhold til varmelagring bør analyseres. Tilsvarende vil det være væsentligt at få analyseret, hvordan den infrastruktur, der er etableret i forbindelse med naturgassens indførelse i Danmark i 1980’erne, skal anvendes fremover.
Planlægning, forskning, udvikling og demonstration
Der er behov for en fortsat målrettet forskningsindsats samt satsning på teknologisk udvikling, som justeres løbende i overensstemmelse med de langsigtede politiske mål. Forsknings- og udviklingsindsatsen bør desuden prioriteres til de områder, hvor Danmark har et særligt potentiale for at fremme nye energiteknologiske løsninger, hvad angår energibesparelser, energieffektivisering og VE. Endvidere bør der arbejdes for, at EU’s forskningsindsats afspejler Danmarks langsigtede prioriteringer. Danmark kan få en særlig rolle som EU's ”test-lab”, for fremtidens fleksible energisystem baseret på markedsmæssige principper, dvs. et system, hvor forbrugerne spiller en langt mere aktiv rolle for at skabe sammenhæng i systemet end i dag, og hvor it-teknologiernes muligheder for kommunikation mellem markedsaktører og apparater til fulde udnyttes. Vigtige komponenter er fleksible fjernvarmesystemer med eldrevne varmepumper, komponenter til el-/brintbiler (intelligent opladning i forhold til både elsystemets og bilistens behov) samt ikke mindst aktivering af øvrigt fleksibelt forbrug hos forbrugere og industri. For Danmark indebærer energiteknologier et stort erhvervspotentiale. De energipolitiske satsninger herhjemme siden 1980’erne har betydet, at energisektoren yder et væsentligt bidrag til Danmarks økonomiske vækst og beskæftigelse. Eksporten af dansk energiteknologi målt i løbende priser har udviklet sig fra cirka 17 mia. kr. i 1996 til 46 mia. kr. i 2005. Det globale marked for teknologier til forureningsbekæmpelse er estimeret til 4.100 mia. kr. – og med en årlig vækst på ca. 5 %, jf. regeringens redegørelse for fremme af miljøeffektiv teknologi22. En styrket og koordineret indsats i energisektoren vil bidrage til at fastholde og udbygge Danmarks rolle på markedet.
22 Regeringen 2006: Redegørelse om fremme af miljøeffektiv teknologi.

44
1 Introduction
Denmark is a signatory to the UN Framework Climate Change Convention and ratified the Kyoto Protocol together with the other EU countries on 31 May 2002. Under the EU burden sharing agreement, Denmark is committed to reducing its emissions of greenhouse gases by 21 per cent in 2008-12 compared to the level in 1990. The purpose of the present project is to develop green house gas emissions reduction scenarios for Denmark for 2020 and 2050. The scenarios should provide a basis for discussing, which measures and combinations of technologies are suited to obtain future greenhouse gas emissions reduction in a cost-efficient manner. For each time frame GHG reduction objectives are indicated which the scenarios are supposed to comply with:
2020: 30 – 40 % reduction in greenhouse gases compared to 1990 2050: 60 – 80 % reduction in greenhouse gases compared to 1990
The 2050 analyses examine future technological options which are not yet commercially available, including for example hydrogen technologies and CO2 capture and storage, whereas the focus of the 2020 scenarios is on proven technologies. The scenarios should be seen in connection with the EU objectives of 20/30 % reduction in 2020 and 60-80 % reduction in 2050 compared to 1990. The EU objectives are conditioned by a global effort to reduce greenhouse gas emissions. The work carried out within the project ”The future Danish energy system” by the Danish Board of Technology is providing a foundation for the analyses in the present study. In 2004, the Danish Board of Technology invited a broad range of representatives for the major actors in the energy sector, researchers, NGOs and the Danish Parliament, to participate in an investigation of possible ways forward for the Danish energy system. The cornerstone of this project was a so-called ‘Future Panel’, composed of members from the Danish parliament - representing all political parties active in parliament. Ea Energy Analyses and RISØ DTU contributed to the project which resulted in a number of scenarios for the Danish energy system. The scenarios centred on two concrete targets for 2025: to halve CO2 emissions compared to 1990 and to reduce oil consumption by 50 per cent compared to the present level. The project showed that by combining different measures in a so-called “combination scenario” both targets could be fulfilled. In the combination scenario focus was on energy savings, increased use of wind power and domestic biomass in the energy sector and electric/hybrid vehicles and biofuels in the transport sector. GHG emissions connected to oil/gas extraction and the agricultural sector were not included in the project by the Danish Board of Technology. In the present project the modelling tools have been extended to include all Danish GHG including expected development reduction potentials in other sectors (international air and ship transport are not included).
45
1.1 Structure
The report is structured in the following way: Chapter 2 describes the applied scenario methodology, the tools and models which are used to develop the scenarios and the main assumption for the study concerning for example economic growth assumptions and fuel prices. Chapter 3 gives a description of the main sources of greenhouse gas emissions in Denmark. It explains how emissions have developed historically and what measures have been the most important to reduce emissions up to now. Chapter 4 presents the scenarios that have been developed for 2020. Chapter 5 presents the scenarios that have been developed for 2050. Appendix: Data on energy generation technologies

46
2 Methodology and main assumptions
The present chapter describes the applied scenario methodology, the tools and models which are used to develop the scenarios and the main assumption for the study concerning for example economic growth assumptions and fuel prices.
2.1 Scenario methodology
The figure below provides an overview of the historical Danish greenhouse 1990 – 2005, the Kyoto-objective for 2008-2012 and the GHG targets which are examined in the present study for 2020 and 2050. In addition the official projection to 2030 from the National Environmental Research Institute (NERI) is included.
0
10
20
30
40
50
60
70
80
90
100
1985 1995 2005 2015 2025 2035 2045 2055
mill. ton
Historic Target 2020 30 % Target 2020 40 %Target 2050 60 % Target 2050 80 % Kyoto-objective (2008-2012)NERI projection
Figure 13: Danish Greenhouse Gas emissions (1990-2005), the projection from the National Environmental Research Institute (NERI 2006, November) to 2030, Kyoto Objective 2008-2012 and the targets examined in this project. Emissions related to energy consumption and flaring associated with the extraction of oil and gas in the North Sea have been updated to take into account the latest projection by the Danish Energy Authority from January 2008. For 2020 two scenarios are developed with the goal of reducing GHG emissions by 30 and 40 % respectively compared to 1990. In 2050 similar targets of 60 and 80 % are established. The 2020 focus is on using existing technologies, whereas 2050 also looks at technologies that are currently in the phase of research and demonstration (including for example hydrogen technologies and CO2 capture and storage). Three scenarios are explored in 2050: a 60 % reduction scenario and two 80 % reduction scenarios. In one of the 80 % reduction scenarios all fossil energy is replaced by renewables, whereas CO2 capture and storage technologies are used in the other scenario to achieve the objectives. Table 4 provides an overview of the measures that are put into action in the various scenarios developed for 2020 and 2050.
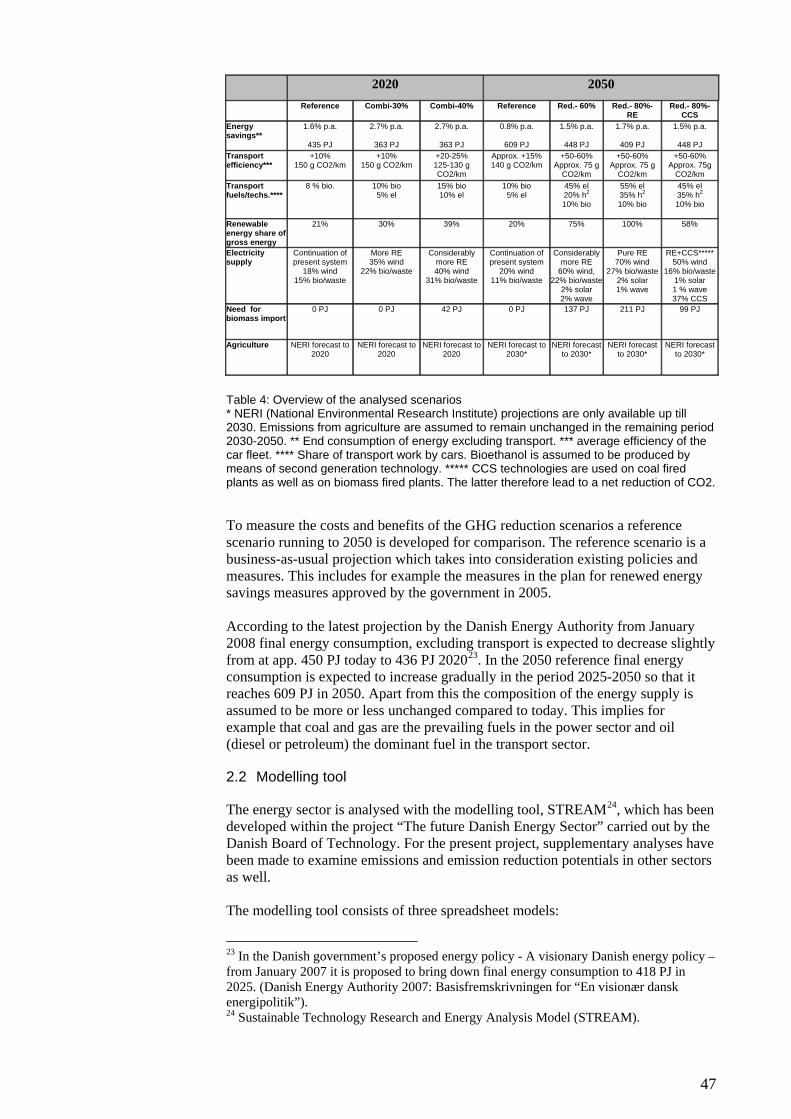
47
2020 2050 Reference Combi-30% Combi-40% Reference Red.- 60% Red.- 80%-
RE Red.- 80%-
CCS Energy savings**
1.6% p.a.
435 PJ
2.7% p.a.
363 PJ
2.7% p.a.
363 PJ
0.8% p.a.
609 PJ
1.5% p.a.
448 PJ
1.7% p.a.
409 PJ
1.5% p.a.
448 PJ Transport efficiency***
+10% 150 g CO2/km
+10% 150 g CO2/km
+20-25% 125-130 g CO2/km
Approx. +15% 140 g CO2/km
+50-60% Approx. 75 g
CO2/km
+50-60% Approx. 75 g
CO2/km
+50-60% Approx. 75g
CO2/km Transport fuels/techs.****
8 % bio. 10% bio 5% el
15% bio 10% el
10% bio 5% el
45% el 20% h2 10% bio
55% el 35% h2 10% bio
45% el 35% h2 10% bio
Renewable energy share of gross energy
21% 30% 39% 20% 75% 100% 58%
Electricity supply
Continuation of present system
18% wind 15% bio/waste
More RE 35% wind
22% bio/waste
Considerably more RE 40% wind
31% bio/waste
Continuation of present system
20% wind 11% bio/waste
Considerably more RE
60% wind, 22% bio/waste
2% solar 2% wave
Pure RE 70% wind
27% bio/waste2% solar 1% wave
RE+CCS*****50% wind
16% bio/waste1% solar 1 % wave 37% CCS
Need for biomass import
0 PJ 0 PJ 42 PJ 0 PJ 137 PJ 211 PJ 99 PJ
Agriculture NERI forecast to 2020
NERI forecast to 2020
NERI forecast to 2020
NERI forecast to 2030*
NERI forecast to 2030*
NERI forecast to 2030*
NERI forecast to 2030*
Table 4: Overview of the analysed scenarios * NERI (National Environmental Research Institute) projections are only available up till 2030. Emissions from agriculture are assumed to remain unchanged in the remaining period 2030-2050. ** End consumption of energy excluding transport. *** average efficiency of the car fleet. **** Share of transport work by cars. Bioethanol is assumed to be produced by means of second generation technology. ***** CCS technologies are used on coal fired plants as well as on biomass fired plants. The latter therefore lead to a net reduction of CO2. To measure the costs and benefits of the GHG reduction scenarios a reference scenario running to 2050 is developed for comparison. The reference scenario is a business-as-usual projection which takes into consideration existing policies and measures. This includes for example the measures in the plan for renewed energy savings measures approved by the government in 2005. According to the latest projection by the Danish Energy Authority from January 2008 final energy consumption, excluding transport is expected to decrease slightly from at app. 450 PJ today to 436 PJ 202023. In the 2050 reference final energy consumption is expected to increase gradually in the period 2025-2050 so that it reaches 609 PJ in 2050. Apart from this the composition of the energy supply is assumed to be more or less unchanged compared to today. This implies for example that coal and gas are the prevailing fuels in the power sector and oil (diesel or petroleum) the dominant fuel in the transport sector.
2.2 Modelling tool
The energy sector is analysed with the modelling tool, STREAM24, which has been developed within the project “The future Danish Energy Sector” carried out by the Danish Board of Technology. For the present project, supplementary analyses have been made to examine emissions and emission reduction potentials in other sectors as well. The modelling tool consists of three spreadsheet models:
23 In the Danish government’s proposed energy policy - A visionary Danish energy policy – from January 2007 it is proposed to bring down final energy consumption to 418 PJ in 2025. (Danish Energy Authority 2007: Basisfremskrivningen for “En visionær dansk energipolitik”). 24 Sustainable Technology Research and Energy Analysis Model (STREAM).

48
• The energy flow model • The energy savings model • The duration curve model
The models are based on a bottom-up approach. This means that the user defines the input to the models, e.g. x per cent power produced from wind turbines in the electricity sector or x per cent bioethanol in the transport sector, and on this basis, a financial output is calculated. Hence, the model does not perform an economic optimisation specifying exactly which set of measures are the most advantageous to combine under the given conditions. How the models function and interact is described briefly below. 2.2.1 The energy flow model
The purpose of the energy flow model is to create an overview of GHG emissions, energy resources, fuel consumption and conversion in the energy system. The model also contains assumptions as regards investment and operation costs of the technologies used to convert fuels into energy services, which enables it to compute the costs of investing in production facilities. It is possible to break down the fuel consumption by end consumption of energy services or by sectors. The energy flow model is a static model assessing and arranging the total energy system in a given year. For the present project the model has been extended to include an overview of GHG from all sectors including agriculture, oil/gas extraction, gasses emitted from industrial processes and emissions from waste-handling and sewage. Methane-emissions from the energy sector and N2O emissions from the transport sector are not included. However, these emissions make up a very small part of total GHG emissions. The input to the energy flow model comes from the energy savings model (final energy demand) and the duration curve model (system correlations). 2.2.2 The energy savings model
By means of the so-called energy savings model, the demand for energy services in the given year is projected. It has been decided to base the projection on the latest growth assumptions by the Danish Energy Authority. The demand for energy services is assumed to increase with the economic growth multiplied by an energy intensity factor reflecting the fact, that not all economic growth is translated into increased demand for energy services (partly due to structural changes within the sectors). For Denmark, the demand for energy services and consequently the end consumption of energy are calculated for four areas: Trade and the service sector, Production, Households and Transport. Within each of these areas, different types of end uses are indicated (lighting, cooling, pumping etc.) as well as savings potentials and related costs. 2.2.3 The duration curve model
The purpose of the duration curve model is to analyse correlations in the Danish electricity and CHP system at an hourly level. The analyses made by the duration curve model form the basis for the input to the overall energy flow and economy
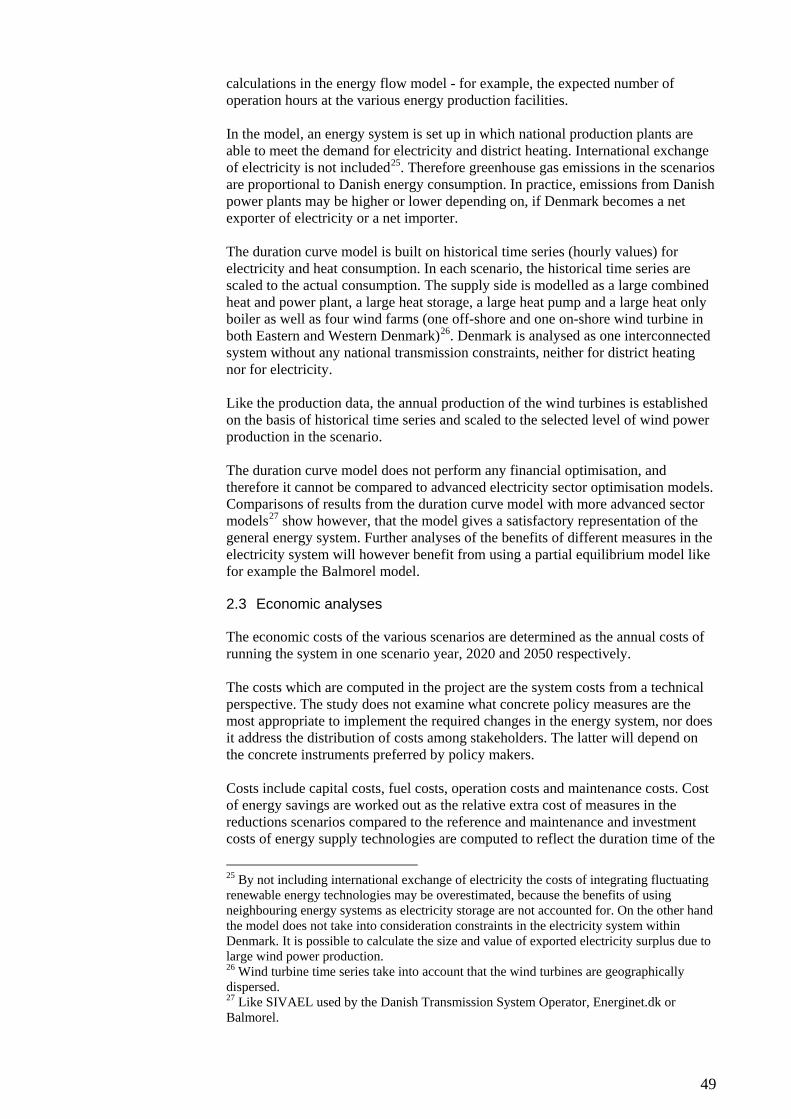
49
calculations in the energy flow model - for example, the expected number of operation hours at the various energy production facilities. In the model, an energy system is set up in which national production plants are able to meet the demand for electricity and district heating. International exchange of electricity is not included25. Therefore greenhouse gas emissions in the scenarios are proportional to Danish energy consumption. In practice, emissions from Danish power plants may be higher or lower depending on, if Denmark becomes a net exporter of electricity or a net importer. The duration curve model is built on historical time series (hourly values) for electricity and heat consumption. In each scenario, the historical time series are scaled to the actual consumption. The supply side is modelled as a large combined heat and power plant, a large heat storage, a large heat pump and a large heat only boiler as well as four wind farms (one off-shore and one on-shore wind turbine in both Eastern and Western Denmark)26. Denmark is analysed as one interconnected system without any national transmission constraints, neither for district heating nor for electricity. Like the production data, the annual production of the wind turbines is established on the basis of historical time series and scaled to the selected level of wind power production in the scenario. The duration curve model does not perform any financial optimisation, and therefore it cannot be compared to advanced electricity sector optimisation models. Comparisons of results from the duration curve model with more advanced sector models27 show however, that the model gives a satisfactory representation of the general energy system. Further analyses of the benefits of different measures in the electricity system will however benefit from using a partial equilibrium model like for example the Balmorel model.
2.3 Economic analyses
The economic costs of the various scenarios are determined as the annual costs of running the system in one scenario year, 2020 and 2050 respectively. The costs which are computed in the project are the system costs from a technical perspective. The study does not examine what concrete policy measures are the most appropriate to implement the required changes in the energy system, nor does it address the distribution of costs among stakeholders. The latter will depend on the concrete instruments preferred by policy makers. Costs include capital costs, fuel costs, operation costs and maintenance costs. Cost of energy savings are worked out as the relative extra cost of measures in the reductions scenarios compared to the reference and maintenance and investment costs of energy supply technologies are computed to reflect the duration time of the
25 By not including international exchange of electricity the costs of integrating fluctuating renewable energy technologies may be overestimated, because the benefits of using neighbouring energy systems as electricity storage are not accounted for. On the other hand the model does not take into consideration constraints in the electricity system within Denmark. It is possible to calculate the size and value of exported electricity surplus due to large wind power production. 26 Wind turbine time series take into account that the wind turbines are geographically dispersed. 27 Like SIVAEL used by the Danish Transmission System Operator, Energinet.dk or Balmorel.

50
applied production machinery. Investments in machinery and equipment (power plants, energy saving measures, vehicles etc.) are converted to annual capital cost using a discount rate of 6 per cent as recommended by the Danish Ministry of Finance (Finansministeriet, 1999). A 3 per cent discount rate is used in a sensitivity analysis. All costs are accounted for as socio-economic costs, i.e. excluding VAT and other taxes. No valuing of preferences has been included in the economic evaluation and we are thereby not considering welfare economic costs. The study attempts to monetize all important cost elements. However, due to time constraints or lack of data some elements have been left out. The most significant of these are mentioned below:
• Externalities from other pollutants than GHG. Greenhouse gases are the only pollutants which are fully quantified and monetized in the study. Since fuel consumption (and indirectly emissions) is lower in the reduction scenarios compared to the reference scenario, including other environmental externalities in the study (for example emissions of SO2, NOX and particles from combustion plants and the transport sector) is therefore likely to improve the economic benefits of the reduction scenarios.
• Energy efficient cars. In the GHG reduction scenarios assumptions are made that new cars become more fuel efficient compared to the reference projection. However, the cost of this change is not estimated. People may suffer a welfare-economic loss from driving cars with lower performances (less room, less acceleration, no air-condition etc.) and direct extra cost for the construction of the efficient cars (more costly engines, low-weight materials etc). On the other hand, if people are encouraged to buy smaller cars (= better fuel economy) this may lower the direct costs.
• Transport mode changes. In the reduction scenarios it is assumed that the share of passenger transport covered by cars decline somewhat compared to today. The incentives to bring this change through could for example be road-pricing, improved public transportation, improved conditions for cyclists or health campaigns. The direct costs associated with such measures have not been quantified, nor has the benefits in terms of lower congestion and improved health of commuters.
• Demand response at consumers and industry. The level of demand response is the same in all scenarios (0.25 TWh is moved from peak- to base-load) except for Red80%-RE where an additional effort is assumed in order to integrate wind power (1.0 TWh is moved). The possible extra costs of developing demand response at consumers and industry in these scenarios have not been assessed (two-way metering systems, cost automation etc).
• Infrastructure costs. From an economic perspective the existing infrastructure can be considered as sunk costs. To what extent the infrastructure needs to be replaced or extended has only been broadly dealt with in the study:
a. Electricity transmission system. Investments in the system are assumed to be the same in all scenarios. Costs of reinforcing the grid to take in off-shore wind power are included in the costs of the wind farms, 3.5 MDKK/MW.
b. District heating system. Investments in the district heating system are assumed to be the same in all scenarios. Energy savings may reduce the need for (re)investments in the district heating system, but this is not quantified.

51
c. Natural gas transmission system. Investments in the general system are assumed to be the same in all scenarios. Energy savings and substitution of gas with other fuels may reduce the need for (re)investments in the gas system, but this is not quantified.
d. Transport infrastructure costs for the distribution of transport fuels are not included in the study. This concerns traditional fuels as gasoline and diesel as well as biofuels, electric loading stations, hydrogen for loading stations, and natural gas loading stations
As a general point, it should be stressed, that there are significant uncertainties associated with forecasting the future costs of reducing greenhouse emissions. For example some energy producing technologies may become more expensive than expected (and others less expensive) and fuel prices may differ significantly from basic assumptions. To take account of this a range of sensitivity analyses have been prepared using different key assumptions. It should also be mentioned that the methodology of looking at the scenarios in only one year implies some limitations in the economic analyses. For example it is not possible to examine the replacement of power plants in detail over time. The long-term extra costs of developing more energy efficient apparatus are difficult to estimate precisely, because they highly depend on the opportunities of manufacturers to make the efficient products the standard technology. The greater the effort is to promote the efficient technologies, nationally and particularly internationally, the better are the prospects of reducing the extra costs. According to a recent IEA study experience shows that there are no or negligible extra cost of most energy efficient technologies28.
2.4 Economic growth
The Danish Energy Authority has supplied information on the latest economic growth projections from January 2008. The economic growth and growth in energy services is explored in the form of one development for both the reference development and the scenarios, i.e. the economic growth and the demand for energy are assumed to be constant regardless of the scale of measures introduced to reduce GHG emissions. As it appears from Table 5 industry will have a lower growth in the first period but catch up with the others from 2020 to 2050. Period GDP Trade/service Industry Households 2003-2020 1.5 % 2.3 % 1.5 % 2.5 % 2020-2050 1.8 % 2.0 % 2.2 % 2.3 % Table 5: Average annual growth rates in GDP (all sectors), trade & service, industry and households.
28 IEA 2006: ”Do energy saving appliances cost more?”

52
Economic growth
1
1.5
2
2.5
3
2003 2013 2023 2033 2043
2003=1
ProductionTrade&ServiceHouseholds
Figure 14: Assumed growth in sectors (2003=1)
2.5 Growth in energy services
Based on the economic growth rate factors the related increases in energy services have been estimated based on energy intensity factors for the different sectors. The energy intensity factors describe how much of the economic growth is converted into higher energy consumption. Energy intensity factor of for example 0.9 means that energy demand increases by 0.9 % when GDP increases by 1 %.
Trade/service Industry Households Electricity
Households Heat
0.78 0.90 0.90 0.53Table 6: Energy Intensity factors29 The intensity factors for industry and electricity consumption are relatively high, whereas the demand for heat in households is expected to be less sensitive to economic growth.
29 Own assumptions based on the background report for the Danish Energy Savings Plan from 2005 (Energistyrelsen 2004, "Faglig baggrundsrapport - Handlingsplan for en fornyet indsats - Energibesparelser og marked", Udkast december 2004).

53
In the transport sector demand for passenger transport is envisaged to increase by 1.2 per cent and freight transport by 1.9 per cent. In comparison the average historical growth rates over longer periods have been somewhat higher – in the range of 2% per annum. At the same time this development has been quite sensitive to transport costs in the past (with experienced price elasticity’s in the order of 0.3-0.5). Hence future transport demand development can be impacted both by fuel price increases and/or by design through the use of fuel taxes or similar promotional instruments. The projected transport demand development presumes that sufficient transport infrastructure will be available to support the growth.
Demand for energy services
1
1.5
2
2.5
3
2003
2007
2011
2015
2019
2023
2027
2031
2035
2039
2043
2047
Transport - person
Transport - goods
Trade&Service
Production
Households - electricity
Households - heat
Figure 15: Assumed growth in energy services (2003=1). The growth rates are the same in the reference projections and the reduction scenarios.
2.6 Fuel prices
Assumptions about future fuel prices have a significant impact on the economy in the scenarios. The higher the prices on fossil fuels are the more attractive investments in energy savings and renewable energy become.
How energy consumption is calculated on the basis of economic growth, energy intensity and saving potentials Electricity for lighting in households in 2003 was 5.8 PJ and assuming annual growth in private consumption at 2.4 per cent per year, the energy intensity 0.90 and implemented savings reducing consumption by 63 per cent – then electricity for lighting in 2020 is calculated as follows: El.light2020 = (1-saving%)*El.light2003*(1+growth%*energy intensity)(2020-2003) El.light2020 = (1-63%)*5.8PJ*(1+2.4%*0.90) (2020-2003) = 3.1 PJ/year

54
As the reference an oil price of 57 $ per barrel is used for 2020. This is in agreement with the latest forecasts by the International Energy Agency’s World Energy Outlook 2007. The IEA has not made fuel price projections for 2050 in World Energy Outlook 2007. As oil is expected to become a more and more scarce resource a higher oil price of 75 $/barrel is assumed in 2050. This price may reflect a situation where conventional supplies give way to more expensive non-conventional supplies. Oil Gas Coal Straw/wood
waste Oil seed crop for biodiesel
2020 57 USD/bbl
35 DKK/GJ
13 DKK/GJ
39 DKK/GJ
60 DKK/GJ
2050 75 USD/bbl
47 DKK/GJ
15 DKK/GJ
43 DKK/GJ
64 DKK/GJ
Table 7: Fuel Prices (basic assumptions, in addition sensitivity analyses are made) In accordance with the Danish Energy Authority an exchange rate of 5.42 DKK/USD has been used to convert prices in USD to Danish kroner. Since there is great uncertainty about the future fuel prices – particularly of oil and gas – this is addressed in the scenarios by the use of sensitivity analyses. It is assumed that biomass (wood wastes etc.) is traded at an international market for biomass as it is already the case today. The price of biomass is therefore assumed to the international market price. Biogas (slurry), however, is considered to be a gratis waste product.
2.7 CO2-price
The future cost of emitting CO2 depends on a range of factors including the technological development of new technologies, the world economic growth and the development in fuel prices. The level of international climate change ambitions however is probably the dominant factor. A high international ambition level will increase the demand for quotas and thereby increase costs, whereas a low ambition level should lead to a low price of carbon. A high international CO2 price will make it more attractive for Denmark to use domestic GHG reduction measures in order to comply with future reduction objectives. In the present analyses it is assumed that CO2 is traded and valued in international markets as any other good. 175 DKK/ tonnes is used as the basic CO2 price in 2020 as well as in 2050. This price is in accordance with long term projections used by the Danish Energy Authority.
2.8 Technology data
Information on energy supply technologies are based primarily on data from the Energy Technology Catalogue developed by the Danish Energy Authority in cooperation with the Danish transmission system operators30. The technology catalogue provides “a uniform, commonly accepted and up-to-date basis for energy planning activities, such as future outlooks, evaluations of security of supply and
30 Previously there were two Danish transmission system operators: Eltra and Elkraft System. In 2005 they were merged to form Energinet.dk.

55
environmental impacts, climate change evaluations, and technical and economic analyses” (Energistyrelsen et al, 2005). The time-frame of the catalogue is 2005-2025. Investment in large scale solar district heating is based on data from Energinet.dk (2006) and household solar heating on data from Prosol. Wind power investment and operation and maintenance cost for 2020 are updated based on input from the Danish Energy Authority. In the summer 2006 the International Energy Agency (IEA) published the study ”Energy Technology Perspectives – Scenarios and Strategies to 2050” (IEA 2006) as a response to the G8 ministers request for clean and competitive energy scenarios. The report provides comprehensive data on a wide range of technologies up to 2050. Together with technology data from the IEA project RECaBS (www.recabs.org) the IEA report has been used as a key source for the 2050 technology data for technologies, which have not yet commercialised by 2025 (the time frame of the Danish technology catalogue). The key transport technology data source is the CONCAWE-study (Edwards et al 2006) a large European Wells-to-Wheel study covering a wide range of fuels/technologies, except EVs and Plug-in hybrids. These, in addition to hydrogen and its infrastructure, are mainly based on American studies from Princeton University and University of California (Ogden et al 2001, Deluchi 2003, Weinert & Lipman 2006) and Dept. of Energy (Padró & Putsche 1999, Simbeck & Chang 2002). The vehicles used for cost calculations are based on Ministry of Transport (2006) and Friis Hansen (2005). Data on the production of biodiesel is based on data from the Danish Climate Strategy (Finansministeriet 2003) and ethanol and methanol production on data supplied by energy producer Elsam (now DONG Energy) (Elsam Engineering, 2005). Data on energy saving technologies has been derived from the background material to the governments Energy Savings Plan from 2005. The appendix summarises key technology assumptions for electricity producing units in 2020 and 2050.
2.9 Energy resources
Today Denmark is no longer dependent upon imported oil, due in part to its oil reserves in the North Sea, and in part to the fact that oil has been replaced by coal, gas and renewable energy during the recent 30 years. In the scenarios, oil production is expected to decline from 777 PJ in 2003 to 653 PJ in 2020. Projections up to 2020 are based on forecasts made by the Danish Energy Authority. The forecasts take into consideration increased oil recovery rates and expected new oil and gas strikes.
PJ 2003 2020 2050 Oil 773 653 0 Natural gas 312 160 0 Table 8: North Sea production potential in 2003 and projections for 2020 and 2050.

56
By 2050 production from the Danish oil and gas fields in the North Sea is expected to have expired31.
Figure 16: Projection of Danish oil and gas production (NERI 2006, p. 19). Table 9 provides an overview of the assumption on available Danish energy resources in 2020 and 2050. As regards the Danish biomass resources it is assumed that the same amounts of biomass will be available in 2020 and 2050 as today. The energy resource from municipal waste on the other hand is expected to increase from app. 37 PJ today to 45 PJ in 2020 and 55 PJ in 2050. In all scenarios the domestic resource of municipal waste is used for energy production.
PJ 2003 2020 2050 Straw 25 25 25 Cereals 1.6 1.6 1.6 Municipal waste 37 45 55 Wood and wood waste 30 30 30 Biogas 40 40 40 Set-aside land 23 23 23 Rape 9 9 9 Table 9: Danish Energy resources (PJ) in 2003 and projections for 2020 and 2050. The Danish wind power resource is estimated to 12,000 MW off-shore wind power capacity and some 3000 MW on-shore. The off-shore figures are based on the report ”Havmøllehandlingsplan for de danske farvande” (“Action plan for Danish off-shore wind power”) from June 1997, where depths up to 15 meters are considered. Newer assessments indicate that the potential may be smaller due to considerations of environmental protection and navigation interests. On the other hand the wind power plants have been scaled up significantly since 1997 making it realistic to build wind farms at sites deeper than 15 meters (DEA 2005, Baggrundsrapport til Energistrategi 2025).
31 Cf., Økonomi- og erhvervsministeren 2003: Redegørelse til Folketinget vedrørende Nordsøen (Statement on the North Sea to the Parliament by the Minister for Economic and Business affairs, from 2003).
0
5
10
15
20
25
30
2004
2006
2008
2010
2012
2014
2016
2018
2020
2022
Pro
duct
ion Production of oil, mio
m3Production of naturalgas, mia Nm3
Production of oil, mill. m3
Production of gas, bn. m3

57
In April 2007 the Committee for Future Offshore Wind Turbine Locations under the Danish Energy Authority published the report: ”Future Offshore Wind Turbine Locations – 2025”. The report identifies a number of possible offshore areas where offshore turbines could be built to a capacity of some 4,600 MW. The committee examined in detail 23 specific possible locations each of 44 square kilometres to an overall area of 1012 square kilometres divided between 7 offshore area (Energistyrelsen 2007: Fremtidens Havmølleplaceringer). As regards solar heating/power and geothermal energy there is not assumed any resource constraints in practice.
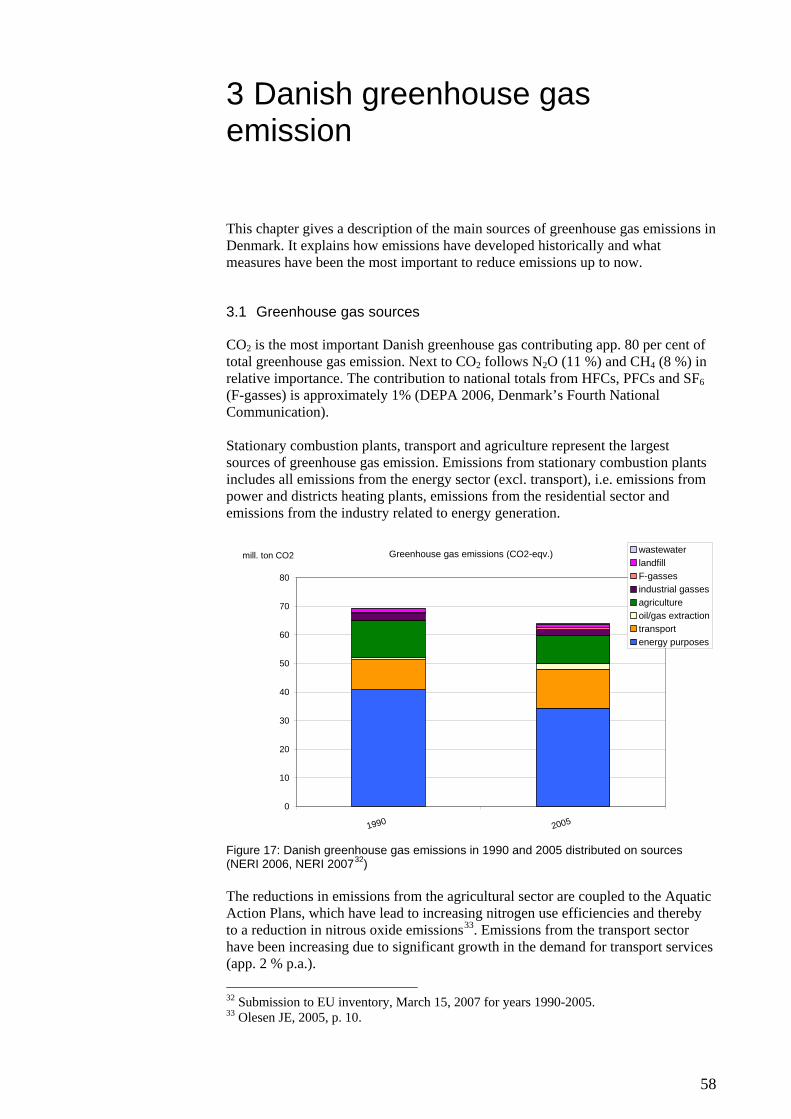
58
3 Danish greenhouse gas emission
This chapter gives a description of the main sources of greenhouse gas emissions in Denmark. It explains how emissions have developed historically and what measures have been the most important to reduce emissions up to now.
3.1 Greenhouse gas sources
CO2 is the most important Danish greenhouse gas contributing app. 80 per cent of total greenhouse gas emission. Next to CO2 follows N2O (11 %) and CH4 (8 %) in relative importance. The contribution to national totals from HFCs, PFCs and SF6 (F-gasses) is approximately 1% (DEPA 2006, Denmark’s Fourth National Communication). Stationary combustion plants, transport and agriculture represent the largest sources of greenhouse gas emission. Emissions from stationary combustion plants includes all emissions from the energy sector (excl. transport), i.e. emissions from power and districts heating plants, emissions from the residential sector and emissions from the industry related to energy generation.
Greenhouse gas emissions (CO2-eqv.)
0
10
20
30
40
50
60
70
80
1990 2005
mill. ton CO2 wastewaterlandfillF-gassesindustrial gassesagricultureoil/gas extractiontransportenergy purposes
Figure 17: Danish greenhouse gas emissions in 1990 and 2005 distributed on sources (NERI 2006, NERI 200732) The reductions in emissions from the agricultural sector are coupled to the Aquatic Action Plans, which have lead to increasing nitrogen use efficiencies and thereby to a reduction in nitrous oxide emissions33. Emissions from the transport sector have been increasing due to significant growth in the demand for transport services (app. 2 % p.a.). 32 Submission to EU inventory, March 15, 2007 for years 1990-2005. 33 Olesen JE, 2005, p. 10.

59
Emissions from the energy sector have been reduced significantly during the last 15 years and the national target from 1990 of 20 % reduction in CO2-emissions from the energy sector in 2005 compared to 1988 has been fulfilled. This is due to a unique development in the Danish energy sector. In spite of significant economic growth, with GDP rising by more than 50 % since 1980, it has been possible for Denmark to maintain its gross energy consumption level at roughly the same level as 25 years ago. Some of the most important tools in achieving this have been the insulation of buildings, wind power and improved fuel efficiency, particularly through co-generation of electricity and heat. At the same time, the share of renewable energy has grown and now covers 16 % of gross needs. See Figure 18.
- 100 200 300 400 500 600 700 800 900
1 000
1 972 1 976 1 978 1 980 1 982 1 984 1 986 1 988 1 990 1 992 1 994 1 996 1 998 2 000 2 002 2 004
PJ
Oil
CoalRE
gas
Figure 18: Trends in Danish gross energy consumption Figure 19 shows the development in total Danish greenhouse gas emission from 1990 to 2005. The peak in 1996 is due to large exports of power to Norway and Sweden because of low inflow to their hydropower plants that year.
Historic Danish Greenhouse Gas Emissions (1990-2005)
0
10
20
30
40
50
60
70
80
90
100
1990 1991 1992 1993 1994 1995 1996 1997 1998 1999 2000 2001 2002 2003 2004 2005
Mill. ton
Figure 19: Danish greenhouse gas emissions (1990-2005)

60
4 Scenarios for 2020
Three pictures of the future have been developed for 2020: a reference projection and two scenarios where GHG emissions are reduced by 30 and 40 per cent compared to 1990. 2020 scenarios:
Reference projection Combi30% Combi40%
The two reduction scenarios are named Combi30% and Combi40 % due to their origin in the so-called Combination-scenario34 developed in the project by the Danish Board of Technology (Teknologirådet, 2007). In both reduction scenarios the main measures to achieve reductions are energy savings, improved efficiency and increased utilisation of renewable energy.
4.1 Main results
Figure 20 shows the distribution of GHG on sources in 1990, in 2005 and in the three scenarios for 2020. In the 2020-reference total emissions are at approximately the same level as in 2005. Though the demand for energy services increase by 10-50 % (heat demand increases by the lowest rate) continuing energy saving measures and the more efficient energy technologies, which are introduced in the energy system, keep the emissions in control. Emissions from oil and gas extraction in the North Sea increase in all scenarios for 2020 primarily because energy consumption for extraction processes increase as the fields are exhausted. F-gasses gases comprise HFCs, PFCs and SF6, all containing fluorine. F-gasses are used for among other things refrigerants, insulation foams and in high-voltage equipment. In many applications F-gas emissions can be controlled or reduced. Historically F-gas emissions have increased; however in 2002 bans were introduced in Denmark - the first of these coming into force in 2006 and 2007. F-gas emissions are expected to be reduced significantly up to 2020 as a result of the new regulation (NERI 2007, Projection of Greenhouse Gas Emissions 2005-2030).
34 In the project by the Danish Board of Technology future technology scenarios have been developed dealing with wind power, natural gas, biomass and energy savings respectively. Measures from each of these scenarios are combined in a so-called “combination scenario”.

61
Greenhouse gas emissions (CO2-eqv.)
0
10
20
30
40
50
60
70
80
1990 2005
Reference 2020
Combi30%_2020
Combi40%_2020
mill. tonnes CO2 wastewaterlandfillF-gassesindustrial gassesagricultureoil/gas extractiontransportenergy purposes
Figure 20: Greenhouse gases distributed on sources in 1990, 2005 and 2020 (CO2-eqv.) In the reduction scenarios total emissions are brought down by 30 and 40 per cent compared to the 1990 level. The majority of emission reductions take place in the energy sector. The reason for this is a strong effort to reduce the demand for energy – through energy savings measures and a large effort for greater utilization of wind power and bio-energy. In the Combi-40% wind power constitutes 40 per cent of total electricity demand and in Combi-30% wind makes up 35 per cent. For comparison wind power’s share of Danish electricity demand is app. 20 per cent today35. The use of biomass and biogas is 12 % per cent of electricity supply in the reference and in Combi-30%, while it is 22 % in Combi-40%. In the reference for 2020 gross energy consumption is roughly the same as today. The increasing demand for energy and transport services over the years adds to gross energy consumption whereas the expected energy efficiency measures set out in the Government’s energy savings plan have the opposite effect. In the reduction scenarios further measures are introduced to reduce energy consumption and the substitution of fossil fuels with wind power leads to significantly lower gross energy consumption in the reduction scenarios (see Figure 21) Moreover, new more efficient cars are introduced in the transport sector and in combination with new transports means and fuels this reduces oil consumption by a large margin.
35 Energistyrelsen 2006: Energistatistik 2005
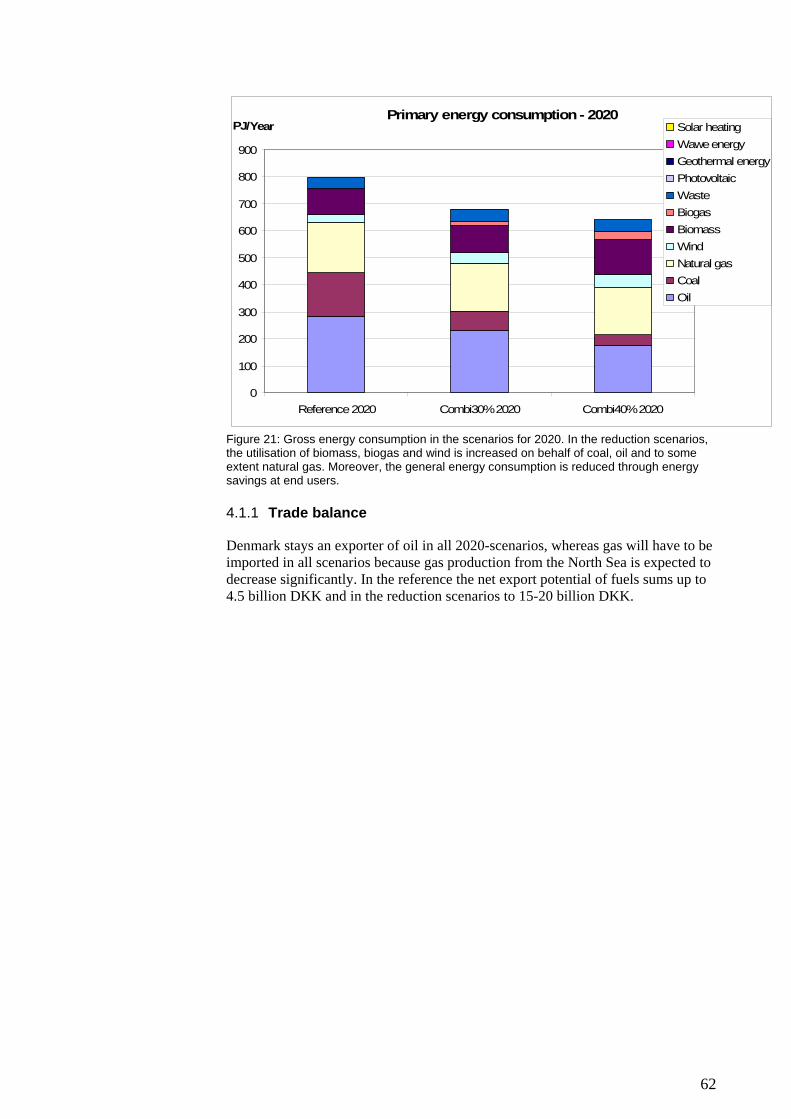
62
Primary energy consumption - 2020
0
100
200
300
400
500
600
700
800
900
Reference 2020 Combi30% 2020 Combi40% 2020
PJ/Year Solar heatingWawe energyGeothermal energyPhotovoltaicWasteBiogasBiomassWindNatural gasCoalOil
Figure 21: Gross energy consumption in the scenarios for 2020. In the reduction scenarios, the utilisation of biomass, biogas and wind is increased on behalf of coal, oil and to some extent natural gas. Moreover, the general energy consumption is reduced through energy savings at end users. 4.1.1 Trade balance
Denmark stays an exporter of oil in all 2020-scenarios, whereas gas will have to be imported in all scenarios because gas production from the North Sea is expected to decrease significantly. In the reference the net export potential of fuels sums up to 4.5 billion DKK and in the reduction scenarios to 15-20 billion DKK.

63
Trade balance - 2020 scenarios
-15.000
-10.000
-5.000
0
5.000
10.000
15.000
20.000
25.000
30.000
oil coal natural gas biomass total
mill. DKK
Reference 2020Combi30%_2020Combi40%_2020
Figure 22: trade balance in the 2020 scenarios (+ indicates export potential, – indicates import need). * The total also includes income from sale of surplus electricity (of minor influence). 4.1.2 Scenario economy
Figure 23 depicts the changes in fuel, operation and maintenance and investment cost in the reduction scenarios compared to the reference projection. In the reduction scenarios substantial increase in investments (additional 8-10 billion DKK per annum) are made in energy savings and production technologies leading to fuel and CO2-costs savings of almost similar size.
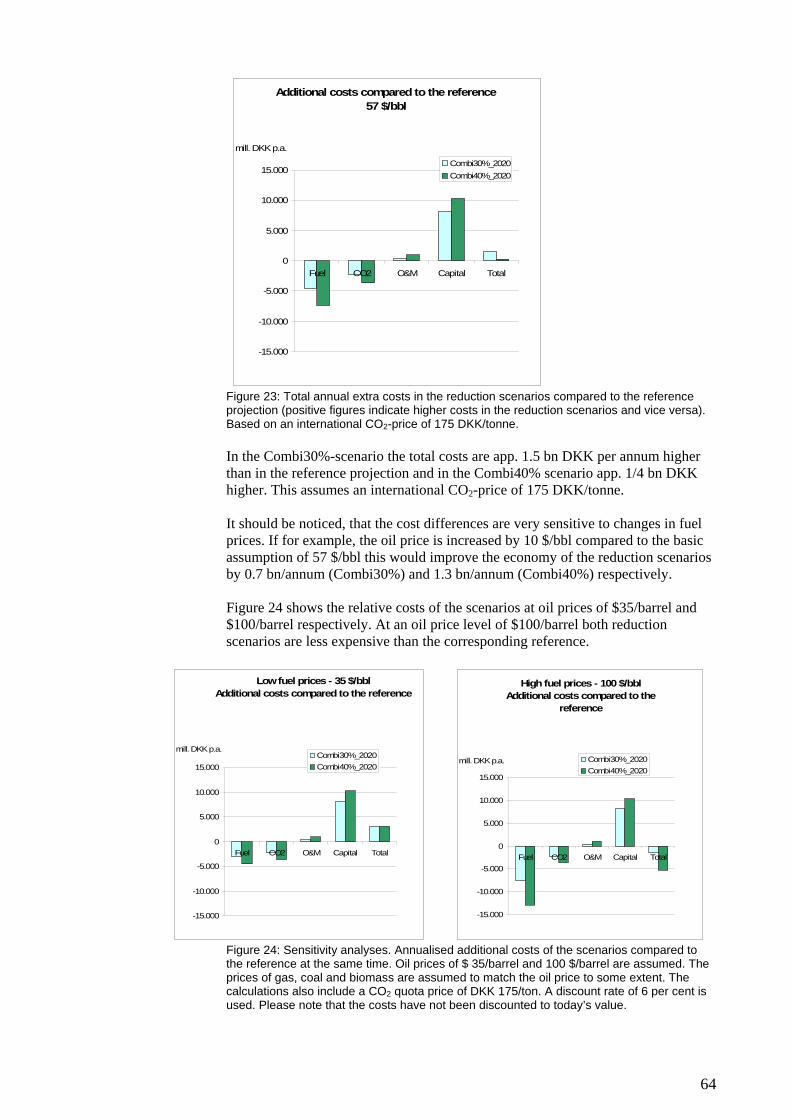
64
Additional costs compared to the reference57 $/bbl
-15.000
-10.000
-5.000
0
5.000
10.000
15.000
Fuel CO2 O&M Capital Total
mill. DKK p.a.
Combi30%_2020Combi40%_2020
Figure 23: Total annual extra costs in the reduction scenarios compared to the reference projection (positive figures indicate higher costs in the reduction scenarios and vice versa). Based on an international CO2-price of 175 DKK/tonne. In the Combi30%-scenario the total costs are app. 1.5 bn DKK per annum higher than in the reference projection and in the Combi40% scenario app. 1/4 bn DKK higher. This assumes an international CO2-price of 175 DKK/tonne. It should be noticed, that the cost differences are very sensitive to changes in fuel prices. If for example, the oil price is increased by 10 $/bbl compared to the basic assumption of 57 $/bbl this would improve the economy of the reduction scenarios by 0.7 bn/annum (Combi30%) and 1.3 bn/annum (Combi40%) respectively. Figure 24 shows the relative costs of the scenarios at oil prices of $35/barrel and $100/barrel respectively. At an oil price level of $100/barrel both reduction scenarios are less expensive than the corresponding reference.
Low fuel prices - 35 $/bblAdditional costs compared to the reference
-15.000
-10.000
-5.000
0
5.000
10.000
15.000
Fuel CO2 O&M Capital Total
mill. DKK p.a.Combi30%_2020Combi40%_2020
High fuel prices - 100 $/bblAdditional costs compared to the
reference
-15.000
-10.000
-5.000
0
5.000
10.000
15.000
Fuel CO2 O&M Capital Total
mill. DKK p.a. Combi30%_2020Combi40%_2020
Figure 24: Sensitivity analyses. Annualised additional costs of the scenarios compared to the reference at the same time. Oil prices of $ 35/barrel and 100 $/barrel are assumed. The prices of gas, coal and biomass are assumed to match the oil price to some extent. The calculations also include a CO2 quota price of DKK 175/ton. A discount rate of 6 per cent is used. Please note that the costs have not been discounted to today’s value.

65
4.1.3 CO2 abatement costs
The economy of the scenarios can also be expressed by their average CO2 abatement costs. The average CO2 reduction costs in the reduction scenarios compared to the references are shown in Table 10. The additional costs of the reduction scenarios may be converted to an average abatement cost of 290 DKK/tonne CO2 in Combi30% (emissions are reduced by 13 Mt at total cost of 3.9 bn/annum) and 190 DKK/tonne in Combi40% (emissions are reduced by 21 Mt. at a cost of 3.9 bn/annum). The scenario abatement costs cover a range of different measures, where some will have low or even negative abatement costs, and others have relatively high abatement costs. Higher fuel prices will generally lead to lower abatements costs and vice versa. Fuel prices Combi30% Combi40
% Ref - 60 $/bbl 290 190 Low - 35 $/bbl 410 320 High - 100 $/bbl 70 -80 Table 10: Average CO2 reduction costs (DKK/ton) in the 2020 reduction scenarios compared to the references Reductions are cheapest in the Combi40% primarily due to modal change from car to public transport and bicycling and because the fuel economy of cars is expected to improve by 20-25% in Combi40% compared to 10 % in the reference and Combi30%. This saves CO2 as well as oil – and with no assumed extra costs. If more fuel efficient cars were not introduced in the Combi40% scenario and no modal change was assumed to reference the average CO2 reduction costs would increase to app. 370 DKK/ton . Under reference fuel prices the additional costs of reducing greenhouse gas emissions by 30 and 40 % are estimated to 0.2 of GDP.
Combi30% Combi40% DKK 3.9 bn per year DKK 3.9 bn per year
0.2 % of GDP 0.2 % of GDP Table 11: Total additional costs in the 2020 reduction scenarios compared to the reference projections (without a CO2 price). Additional costs are also shown as share of GDP. Reference fuel prices (57 $/bbl).
4.2 Energy savings measures
In relation to the needed technological development to realise the combination scenarios, the development of, among other things, highly insulated standard building elements is a top priority. This includes windows, removing the traditional thermal bridges, etc. End-use energy consumption in the Combination scenarios are reduced compared to the reference by introducing energy saving appliances and buildings. Excluding energy for transport purposes final energy consumption is reduced from 435 PJ in the reference to 363 PJ in Combi30% and Combi40% It is assumed that all new houses from 2015 and ahead are zero-energy-consuming houses – which are highly insulated, equipped with heating recovery technologies and make use of passive solar heating technologies.

66
The main heat loss is from the existing mass of buildings and therefore renovation and improvement of these buildings are crucial to reach saving targets.
0
0.2
0.4
0.6
0.8
1
1.2
1.4
2005 2010 2015 2020 2025 2030 2035 2040 2045 2050
Inde
x Bu
ildin
g ar
ea, 2
005
= 1
new demolished/new renovated non-renovated
Figure 25: Assumed development in the Danish building stock (1 = size of the current Danish building stock. Over the period 2005-2050 the building stock is expected to increase by almost 30 % to index 1.3) In 2020 it is assumed that 70% of the existing buildings have not yet been renovated. The other 30% is either renovated existing buildings or new-build houses. Some buildings are demolished and replaced by new buildings. All renovated houses are expected to have their demand for heat reduced by 65 % in the reduction scenarios. The two reduction scenarios are assumed to have the same effort within energy savings in households. In Table 12 the saving measures are compared to the potentials presented in the Danish Energy Saving Plan36. The “socio-economic potential” represents savings with a short pay-back time with today’s technology, while “Max potential” represents saving potentials with a reasonable pay-back time for technologies joining the market within the next 10-15 years. End-Use Technologies
Socio-economic potential
Max potential
Reference Combi 30% and
40%
Costs DKK./GJ/year
Light 35 % 75 % 28 % 63 % 44 Pumping 35 % 75 % 28 % 63 % 97 Refrigerator/freezer 15 % 30 % 12 % 27 % 41 Computer and electronics
40 % 80 % 32 % 67 % 113
Other use of power 25 % 50 % 20 % 43 % 36 Cooking 30 % 65 % 24 % 55 % 42 Washing 35 % 70 % 28 % 59 % 49 TV/video 30 % 65 % 24 % 55 % 41 Heating 25 % 40 % 20 % 34 % 143 Table 12: Households end-use energy saving potentials. Costs are in annualised 2005-DKK. Pr GJ saved per year compared to the reference.
36 Energistyrelsen 2004: Energisparehandlingsplan.

67
The reference scenario is thought as a continuation of the Danish Energy Saving Plan (the plan is running to 2013) and is assumed to utilise 80% of the plan’s “Socio-economic potential”. The “Combi-scenarios” are assumed to utilise 80% of the “Max potential” when reaching 2020. Savings within industry, trade and service are divided on process energy and non-process energy (see Table 13). The reference used for saving potentials within industry, trade and service is based on a background report from the Danish Energy Saving Plan authored by the Danish consultants company Birch & Krogboe A/S. In the reference scenario for 2020 80% of the savings with a simple pay-back time below 8-10 years is implemented (the resulting saving percent can be seen in the table below) and in the scenarios Combi30% and Combi40% it is assumed additional to the savings in reference that also 60% of the potential with simple pay-back time from 10-20 years is implemented.
Process Energy
Reference Combi 30% and 40%
Costs Industry D.kr./GJ/year
Costs T&S D.kr./GJ/year
Boiler losses 32% 42% 38 40 Heating/boiling 20% 23% 23 40 Drying 20% 28% 40 40 Evaporation 32% 40% 29 Distillation 24% 32% 29 Baking 16% 21% 27 28 Smelting 16% 21% 47 Other heat above 150 Dgr. C. 16% 31% 48 Own transport 12% 20% 82 82 Other end-use energy Lighting 16% 39% 44 44 Pumping 28% 41% 97 97 Cooling / freezing 32% 40% 41 41 Ventilation 32% 52% 77 77 Kompressors 28% 51% 64 64 Electric motors 12% 22% 65 65 Electronics 20% 35% 74 113 Other use of electricity 8% 16% 68 36 Heating 20% 30% 10 24 Table 13. Industry and Trade&Service (including Public Service) end-use energy saving potentials. Costs are in annualised 2005-Dkr. Pr GJ saved per year compared to the reference. The cost differs between industry and trade & service due to their different mixture of end-use energy services. Costs listed in the tables for both households and industries are calculated as average extra costs compared to the reference scenario. The costs are to be understood as annualised yearly costs in 2005-DKK. For industry, trade and service sectors the investment costs are calculated on behalf of a simple pay back time and historic energy prices listed for each of the potentials taken from background material for the Danish Energy Savings Plan37.
37 Birch&Krogboe (2004) “Potentialevurdering Energibesparelser i husholdninger, erhverv og offentlig sector Sammenfatning af eksisterende materiale og analyser”.

68
Furthermore it is assumed that the long term costs of savings due to ambitious measures are 50 percent lower than calculated in the abovementioned background material for the Danish Energy Savings Plan. In the project ”The future Danish energy system” by the Danish Board of Technology a energy saving panel with experts where established and they concluded that savings becomes cheaper if ambitious measures are followed. This is e.g. supported by an IEA working paper38 investigating the development in price for different electrical appliance where efficiency has been improved. The working paper shows, that in many cases the efficiency of appliances can be improved without extra costs. Because of lack of cost data for households the costs calculated for trade & service are used for the households as well. Except costs for building and renovating houses, which are based on analyses by Tommerup and Svendsen39. As for the other savings it is also assumed that these costs can be reduced by 50 percent. Energy saving potentials as listed in the table is not pure science fiction. Today, sold electrical appliances are 25 per cent more efficient than the average appliances in the households. Laptop computer uses less than 15 percent of the electricity used by a stationary computer with a “thick” screen and by replacing the existing pumps in central heating systems with energy efficient pumps – electricity for pumping can be reduced by a factor 5 (all these examples are taken from the Danish Energy Saving Trust).
4.3 Measures in the transport sector
Both reference and scenarios are based on an assumed annual growth of the passenger and goods transport demand by 1.2 and 1.9 %/annum respectively. In the reference scenario the only major changes presumed in the transport sector is linked to the energy efficiency level of the transportation means and the distribution of these on fuels - while the distribution on transportation modes and the utilisation of transportation means remain constant. A general improvement of the energy efficiency of the transportation means stocks by 10% compared to the present level is assumed in the reference scenario in line with the historic development. As regards the distribution on fuels the main developments are a marked increase of the diesel share of the passenger car stock to 20% (materialising a trend already seen in the sale of passenger cars in Denmark) and the introduction of biofuels at a significant, but still moderate, level. 8% of the demand of transport work by passenger cars is assumed to be covered by bio-fuels as well as 3-4 % of transport work by busses and lorries. On the whole biofuels make up 5.75 % of total
38 IEA 2006: ”Do energy saving appliances cost more?” 39 Tommerup and Svendsen (2006). Energy savings in Danish residential building stock. Energy and Buildings, issue: 38, pages: 618-626, Elsevier B.V.
Energy Service Companies (ESCOs) Energy savings are traditionally carried out by companies that are paid a fixed amount. Consequently, their profit depends on the success of the energy savings initiatives they implement. This means that there is no direct incentive for these companies to ensure that users make optimal use of the implemented technology. However, ESCOs that carry out energy savings are more or less directly paid in proportion to the extent of the implemented savings. In this way, the ESCOs have an incentive to ensure that the implemented savings are as large as possible and work optimally, and that the individual initiatives are cost-effective at the same time.

69
transportation fuel in 2020, corresponding to the EU target for 2010(55% per cent of this is assumed to be biodiesel and 45% bioethanol). Hence 72% of the passenger car work is covered by gasoline as compared to 90% today. In the Combi30%-scenario biofuels for car-passenger transport cover 5 % of transport work and electricity covers 5 %. In addition electricity covers 20 % of transport work by busses. The Combi40%-scenario reinforces the energy efficiency improvements, increasing the improvement to 25% in gasoline driven transportation means and 20% for the remainder. In addition the shift to bio-fuels is increased markedly with a share of the transportation fuel consumption that is more than doubled as compared to the reference scenario (to 15% for passenger cars). Also electric propulsion is introduced to a higher degree in passenger cars mainly in the form of Plug-in hybrids. Electric based transport accounts for 10% of the transport work of passenger cars and light and heavy goods vehicles and 25% in busses. In the latter both natural gas and hydrogen are introduced to cover 25% and 5% respectively.
Further the Combi40 % reduction scenario includes a shift of the passenger transport demand to cycling and public transport, with the share of the former being increased from 5% to 7% and from 18% to 23% for the latter. Hence the fraction accounted for by passenger cars is reduced from 76% to 69%. Capacity utilisation rates for all transportation means remain unaltered in 2020. The projected technological development in the transport sector can be divided into three main development levels:
• gradual improvement of existing vehicle technologies, notably in the form of better fuel economies and widespread application of hybrid vehicle technologies already on the market
• medium-term developments requiring new technologies to a limited degree but not requiring technological breakthroughs, e.g. in the form of application of alternative fuels (e.g. bio-fuels) in existing drive-systems or introduction of energy-efficient grid-connected hybrid vehicle technologies (plug-in hybrids)
EC fuel efficiency standards The target of the present voluntary agreement between the EC Commission and the automobile industry, namely average emissions of 140 g CO2/km for the passenger car sale, corresponds to a 15% reduction compared to the present average of the sale in Denmark (average of gasoline and diesel cars). It should be kept in mind that there is a delay by approximately 15 years before the improvements of the sale penetrates the stock completely. Further the remedies can be chosen from a broader range when the target is expressed in terms of CO2-emissions rather than fuel use – not least including fuel shift as an option. In addition the EC Commission has a target of maximum emissions of 120 g CO2/km by 2010, corresponding to an improvement by more than one quarter. For comparison, the scenario contains an improvement of the average energy efficiency at stock level by 20-25% (app. 120 g/km). In view of the poor prospects for the agreement to be met by the industry, the EC Commission (as of March 2007) is likely to commit itself in its recent action plan on energy efficiency to introduce legislation by 2007 to ensure that the target of 120 g CO2/km is met by 2012. This target is proposed by the Commission to be met partly through an obligation on the manufacturers to reach an average of 130 g/km and partly by letting biofuels count towards the target. Taking the above reservations into account the, scenario and the EC strategy can be considered to be in the same order of magnitude.
70
• long-term technologies requiring technological breakthroughs and possibly also establishment of new fuel infrastructure (for example hydrogen technologies or wide-spread use of electric vehicles)
The historical development indicates that the projected energy efficiency development of vehicles in the scenario requires stronger promotional instruments than the present voluntary agreement between the EC Commission and the automotive industry. Most of these instruments are only viable at an international level, particularly those targeting the technological development at industry level. The most significant instrument category in the context is fuel consumption or CO2 emission standards. However, such instruments could be supplemented by instruments directed at the purchasing of transportation means.
The last-mentioned technology development category is considered to be conditional on an international development supported by international promotional instruments including both restrictions toward conventional technologies (e.g. very severe environmental regulations) and support for the alternative solutions. There are particularly serious obstacles in conjunction with hydrogen and fuel cell technologies, which are probably only viable if the present research, development and demonstration efforts within the automotive industry are maintained and reinforced. There may be interesting niche markets for fuel cells in other parts of the transport sector, e.g. bus transport, and in mobile applications outside of the transport sector but the question is whether there will be enough research and development capital unless the automotive industry is involved. 4.3.1 Cost assumptions
Different costs assumptions for transport technologies have been used for each scenario reflecting a different effort within each technology. If electrical and hydrogen vehicles are promoted massively in Denmark and internationally, then
Passenger utilization rate (cabin factor) Large CO2 and fuel reductions can be gained by improving the passenger utilization rate of cars and other means of transport. Today there is on average 1.5 passengers in a Danish car, but in 2020 this figure is expected to decrease to 1.3 passengers per car. The following table indicates what fuel and CO2-savings may be gained if the passenger utilization rate of cars is increased to an average of 1.45, 1.60, 1.75 or 2.0. Passenger utilization rate of cars in 2020
Fuel saving (PJ) CO2-saving (Mt)
1.45 9 0.6 1.60 20 1.3 1.75 28 1.8 2.00 39 2.5
The calculations are based on marginal changes in the Combi-30% scenario. In the Combi-40% scenario savings will be approx. 25 per cent lower because a larger share of the cars are electric and because the conventional diesel and gasoline based cars are expected to become more efficient.

71
the costs per unit will probably be reduced. Figure 26 shows the applied investment and maintenance costs for passenger cars in 2020 and 2050. For the other means of transport similar cost estimates have been established (not shown here).
Figure 26: Cost derived for different passenger car technologies in DKK per passenger km per year. All investments are annualised using a discount rate of 6 %. VAT and taxes are not included.
In the 2020 scenarios the costs of electricity and hydrogen based cars are expected to be app. 50 % higher than the costs of conventional gasoline based cars – measured in DKK per passenger kilometre (0.5 DKK/pkm vs. 0.34 DKK/pkm). Fuel costs are not included in this comparison, since the costs of producing electricity or hydrogen depend on the combination of electricity supply technologies in the specific scenarios. In the 2050 scenarios the different technologies are progressed further and relative extra costs of electricity and hydrogen based cars decrease to app. 35 %.
Yearly costs for cars in the reference 2050(excluding fuel)
0 0.2 0.4 0.6 0.8
1 1.2 1.4 1.6 1.8
2
Electricity Gasoline Diesel Natural gas Ethanol Methanol Biodiesel Hydrogen
D.kr./pkm/year
Yearly costs for cars in the scenario 2050 (excluding fuel)
0
0.05
0.1
0.15
0.2
0.25
0.3
0.35
0.4
Electricity Gasoline Diesel Naturalgas
Ethanol Methanol Biodiesel Hydrogen
D.kr./pkm/year
Yearly costs for cars in the reference 2020(excluding fuel)
0 0.5
1 1.5
2 2.5
3
Electricity Gasoline Diesel Natural gas Ethanol Methanol Biodiesel Hydrogen
D.kr./pkm/year
Yearly costs for cars in the scenario 2020 (excluding fuel)
0.00
0.10
0.20
0.30
0.40
0.50
0.60
Electricity Gasoline Diesel Naturalgas
Ethanol Methanol Biodiesel Hydrogen
D.kr./pkm/year
72
Bio-ethanol production In the reduction scenarios for 2020 up to 10 % of total car transport is supplied by bio-ethanol. The ethanol is assumed to be produced from advanced2nd generation facilities using straw from the agricultural sector as the primary input for the processes. The following main assumptions determine the energy usage for the production: Input of energy required to produce 1 unit of bio-ethanol (units): Biomass (straw): 1.33 Electricity: 0.14 Steam: 0.52 The above equation takes into consideration that the biomass residue, which is produced in connection with the ethanol generation, can be reused for power and heat generation. The fuel consumption for steam and electricity production will depend on the composition of the power and heat sector in the scenarios. Investments cost for the bio-ethanol plant amount to 48 DKK/GJ-biofuel. Operation and maintenance costs are 22 DKK/GJ.

73
4.4 Supply side measures
By 2020 a large share of the existing portfolio of power plants is expected to be worn-out. Most of the existing decentralised gas units are assumed to be replaced by new efficient units. Moreover three large coal power plants (Studstrup Unit 4, Asnæs Unit 5 and Enstedværket Unit 3) are refurbished. In this connection an increase in their electric efficiency is assumed and the units are prepared for co-firing with
Electric powered vehicles In addition to being a vehicle with very low negative local impacts with zero local exhausts and very low noise, the Battery-powered Electric Vehicle (BEV) is a very energy-efficient potential option in the transport sector. Electrical propulsion allows simpler, more light-weight, cheaper and more flexible layout of the propulsion system, including that the onboard transmission can be left out. However, a wider dissemination of BEVs is limited by high costs and short range between recharging. The cost problem is aggravated by insufficient lifetime (in terms of recharching cycles) of the present state-of-the-art battery technology, frequently requiring the battery to be replaced during the lifetime of the car. Battery development is crucial to overcome these problems but other factors have been vital too – especially motor, control systems and power electronics. The energy efficiency of the vehicle is a key means for increasing both range and battery lifetime. Both battery technology and (especially) the rest of the vehicle have shown significant development over the last couple of decades but still have serious shortcomings to be generally applied in normal transport tasks, notably in passenger cars. A state-of-the-art BEV based on nickel-metal hydride (NiMH) battery technology typically have a range in the order of 150 km. In the future the main option is probably the lithium battery in various forms (e.g. lithium-ion or lithium polymer). Lithium batteries are already on the market but for different applications (electronic and electric equipment) with different demands and usage patterns. Thus they need both practical test and further development with respect to costs and durability to be ready for the market. A Hybrid Vehicle (HEV) is characterised by having both internal combustion engine (ICE) and electric motor in its drive system. This heading covers a wide range of different options. A first dividing line is whether the vehicle is based partly on electricity from the grid (a Plug-in Hybrid Electric Vehicle, PHEV) or entirely on fuels such as gasoline or diesel, which is the case for all HEVs sold on the market today (e.g. the Toyota Prius). The latter is basically a very fuel-efficient vehicle but has a very short range in electrical mode, while the PHEV has a larger (and more costly) battery and hence longer range in electrical mode. Even within the PHEV category there is a considerable variation with respect to design and operation principles, with the design being typically a compromise between different aspects such as energy, environment and costs. A further dividing line relates to the configuration of propulsion system – whether both ICE and electric motors are linked to the driving wheels (called Parallel Hybrid) or only by the electric motors (Series Hybrid). The plug-in capability of the PHEV means that PHEVs can be used to substitute petroleum, unlike the HEVs at the market, but the total energy and emission impacts depend on both the actual design and operation of the vehicle and the power system. While there are a number of different models of the non-grid connected types on the market, no PHEV-models are yet commercially available but are in development and demonstration phase. Several automakers have expressed interest in the technology (including Ford, General Motors and maybe Toyota) and there are several projects with vehicles being converted to PHEV. Previous experiences indicate that a large-scale application of PHEVs – and even more so for BEVs – depends on the use of promotional instruments unless in the case of significant increases of oil prices. With adequate promotional instruments (mandates, subsidies etc.) a market can be developed for PHEVs in a shorter time frame than for BEVs. At the same time the mass production of key components such as batteries and advanced electric motors will reduce the market barrier for BEV.

74
biomass. In the reference projection these units are fuelled mainly with coal, whereas they apply up to 50 per cent biomass co-firing in the reduction scenarios. No new coal fired plants are built in neither the reference projection or in the scenarios. In Combi40% approximately 800 MW of biomass and biogas capacity is established. In the reference projection the similar figure is 150 MW.
In the reference projection the composition of the energy supply is approximately the same as today. In accordance with the latest reference projection by the Danish Energy Authority (2008) investment in new wind power is not profitable at most sites and therefore wind power capacity decrease slightly as existing turbines are worn out. However, in terms of wind power generation this is counterbalanced to some extent by the higher capacity factor of new wind turbines. In the reference wind power covers 18 per cent of demand, with coal and gas remaining the backbone of the supply (41 per cent and 21 per cent of supply respectively). In the Combi30% the wind power share of electricity production increases to 35 per cent and in the Combi40% to 40 per cent. In addition the utilization of biomass and particularly biogas is increased in both reduction scenarios. The use of biogas is 15 PJ in Combi30% and 32 PJ in Combi40%. For comparison the use of biogas is app. 4 PJ today whereas the total Danish resource potential has been estimated to 40 PJ. The total energy resource of municipal waste increases from app. 35 PJ today to 45 PJ in 2020 in all scenarios. In the two reduction scenarios the entire waste resource is used for combined heat and power generation whereas some of the resource is used in heat only boilers in the reference projection.
Off-shore wind power In the future off-shore wind power will be one of the key supply-side elements to reducing emissions from the energy sector. In the Combi30% scenario total Danish off-shore wind power capacity increases to almost 1400 MW and in the Combi40% scenario to 1900 MW. The latter corresponds to establishing a 200 MW wind farm every two years from 2010 to 2020. Sweden, Germany and Norway also have plans for large scale wind power facilities in the North Sea and the Baltic Sea. Ensuring a cost efficient deployment of wind off-shore wind power will require a coherent planning between neighbouring countries. In the economic calculations the following cost figures are applied for off-shore wind farms in 2020. The investment cost of the wind farm includes foundations. Investment cost, wind farm: 15 M DKK/MW Investment cost, grid reinforcement: 3.5 M DKK/MW Operation and maintenance costs: 115 DKK/MWh Expected technical life time: 20 years In 2050 significant cost reductions are expected (see 0-Appendix B).

75
El ectricity generat ion 2020
0%10%20%30%40%50%60%70%80%90%
100%
Reference 2020 Combi30% 2020 Combi40% 2020
WasteBiogasBiomassWindNatural gasCoalOil
Figure 27: Composition of the electricity supply in the 2020 scenarios. Most of the heat for the district heating systems (app. 75-80 %) is generated as combined heat and power in all scenarios in order to increase the overall fuel efficiency, and the remaining demand for heat is produced from natural gas and biomass, and in the reference projection also from municipal waste. Furthermore heat pumps are introduced in the reduction scenarios in order to make the full benefit of the fluctuating wind power in the energy system. In Combi30% and in Combi40% app. 700 MWheat heating pump capacity is installed in connection with the district heating system. Demand response is developed in all scenarios as another means to integrate wind power and to reduce the requirements for costly peak power capacity. In the reference as well as the scenarios a total of 0.25 TWh of load is moved from hours where the system is strained to base load hours. This corresponds to moving 500 MW in 500 hours. Electric and hybrid cars provide a further valuable storage for integrating wind power. By giving car owners incentives to load power when it is most advantageous for the system it is assumed that the demand for electricity can be increased primarily at night and at windy times. In total the transport sector uses app. 2.7 TWh in Combi40% or app. 10 per cent of total electricity demand.
The synergies between the transport sector and the energy sector becomes even more prominent in the 2050 reduction scenarios where wind power share is increased further and hydrogen and electric vehicles become dominant. Because of the measures being made to integrate wind power, the wind power induced export of electricity in Combi40 % amounts to less than 0.1TWh. The surplus is assumed to be
exported to Denmark’s neighbouring countries at a base load power price of 20 €/MWh.
Heat pumps Heat pumps work in the same as a refrigerator. Using a compressor, energy is transferred from an outdoor reservoir (air/soil/water) for heating purposes indoor. Heat pump systems can deliver up to 4 times more energy than the electricity they consume and can be used for both district heating systems and private households. Assumed coefficients of performance: District heating systems: 3.5 Private heat pumps: 3.0

76
Figure 28 shows the annual load duration curve for the electricity consumption in the Combi40% scenario after deducting the wind power production. In a few hours (furthest to the right) wind power generation exceeds demand. The remaining load needs to be covered by thermal power plants or imported power. A high level of wind power in the system reduces the relative operation time for the thermal power plants and thereby increases their relative investment costs. Therefore it is important to develop measures to adapt to these circumstances, for example by ensuring a high-level of integration between the Danish power system and neighbouring system (this is already done in the Nordic context via the power exchange Nord Pool). Exchanging power between countries reduces the total demand for residual power capacity because of the geographic variation of wind power generation and variations in the demand for power. Furthermore the Nordic hydro based power system provides an excellent storage for wind power, because many hydro power plants are capable of withholding production when wind generation is high and electricity market prices plunge. Other measures include the commissioning of energy producing technologies with low capital costs, such as gas power, to cover peak loads.
Electricity duration curve
-2000
-1000
0
1000
2000
3000
4000
5000
1 501 1001 1501 2001 2501 3001 3501 4001 4501 5001 5501 6001 6501 7001 7501 8001 8501
MW
Figure 28: Annual load duration curve in the Combi40% scenarios (Electricity demand minus wind power)
4.5 Infrastructure
Because of their long technical lifetime infrastructure investments should be made with caution and preferably based on the goals of a long term energy strategy. When energy consumption for heating is reduced and the share of wind power is increased, the basis for district heating will, in many places, deteriorate. It is important to understand which areas should continue to prioritise district heating, how the loss of energy with district heating can be reduced and how energy

77
efficiency can be further increased through the dynamic utilization of heat pumps, geothermal energy, central cooling and heat storage.40 It is not possible to assess the need for replacement and extensions of the energy infrastructure with the modelling tool applied in the present project. Further analyses are required to determine the role and expansion of district heating and the natural gas infrastructure in the future41.
4.6 Measures in the agricultural sector
In 2005 the Danish Institute of Agricultural Sciences provided a comprehensive overview of GHG measures in the agricultural sector (Olesen et al. 2005). According to the report “It is estimated that Danish agriculture and forestry may contribute to a further reduction of emissions of greenhouse gases in Denmark by 1 to 3 mio. ton CO2-eq per year. A number of measures, including energy crops, biogas and changes in cattle feeding, have considerable potentials and also welfare-economic costs that are lower then the benchmark of 120 DKK per ton CO2. “ (p. 11). The report notices however, that there may be other barriers for implementation, which have to be taken into account. On the other hand more mitigation options may exist, which have considerable potential, but which “require further research and development before they can be taken into practical use and included in the emissions inventories” (p. 11). A range of different GHG reduction measures were identified in the agricultural sector, including:
1) reducing the energy use associated with soil tillage in agriculture 2) reducing energy consumption in greenhouse horticulture by means of
improved climate control and for example in combination with better insulation
3) reducing emissions of methane from enteric fermentation by dairy cows through changed feeding practices or by use of methane inhibitors
4) using slurry for biogas production 5) reducing emissions of nitrous oxide by reducing the use of nitrogen
fertilisers and by reducing the losses through ammonia volatilisation and nitrate leaching
6) reducing emissions of nitrous oxide through changed cropping practices 7) reduced methane emissions by increasing the use of fats in the feed for
dairy cattle 8) growing energy crops 9) sequestration of carbon for example by converting organic soils to
permanent wetlands or increasing the carbon stock in the wood of growing trees
It should be mentioned that some of these measures overlap with measures analysed in the energy sector – this regards for example biofuels, biogas-plants for 40 Enlarging heat storage capacity will increase the flexibility of systems with a high level of CHP generation such as the Danish. It would allow owners of CHP plans to move more heat production from periods with high wind power generation to periods with no or low wind. Supplying heat customers with stored CHP-heat would improve general fuel efficiency as opposed to generation from heat only boilers. 41 Partial equilibrium modelling tools such as the Balmorel model are suited to carry out such detailed analyses.
78
combined heat and power generation and measures aimed at reducing energy consumption. For more details on potentials and costs see, Olesen et al., 2005: 23. In the present study emissions from the agricultural sector are based on the latest projection by the National Environmental Research Institute covering emissions of methane and N2O (NERI 2006). This projection going from 2005-2030 is applied in the reference scenario as well as in the reduction scenarios. In the reduction scenarios one adjustment need to be made however to take into account that biogas is used for electricity and heat generation to a much higher degree than assumed in the projection by the National Environmental Research Institute. Using biogas for energy purposes has significant GHG-benefits in the agricultural sector (reduced methane and N2O emissions) and these reductions have therefore been added to the NERI projections. Today app. 1.6 Mt of slurry is used in the agricultural sector for biogas production - this corresponds to app. 5 % of the total potential of 32 Mt. Using 1 Mt of slurry leads to a reduction of GHG in from the agricultural sector of app. 0.02 Mt CO2-equivalents according to NERI 2006. Thus the total GHG potential from using all slurry for biogas production is 0.02*32 Mt = 0.64 Mt. (app. 0.016 Mt/PJ-slurry). This does not take into account the GHG-benefits in energy sector due to the substitution of coal/natural gas. In this project these benefits are modelled with the energy sector model, STREAM.
4.7 Measures in other sectors
Oil and gas extraction is the fourth largest source of greenhouse gas emissions next to emissions from the stationary combustion plant, transport and the agricultural sector. Currently app. 2.1 Mt CO2-equivalents is emitted due to oil and gas extraction and flaring, but this figure is expected to increase to 3.1 Mt in 2020 in spite of declining oil and gas production (NERI 2006, Danish Energy Authority 2008). The increase is due to the fact that it becomes more energy consuming to extract oil and gas as the fields age. The share of water in the wells increases and this necessitates an increasing demand for water injection to maintain pressure as well as the use of lift gas, which is injected into the wells to improve productivity (DEA 2006, Oil and Gas Production in Denmark 2005). The energy consumption for extraction may be reduced by applying more efficient energy generation technologies, for example combined cycle gas turbines as opposed single cycle turbines. It is beyond the scope of the present report to perform a comprehensive analysis of costs and potentials. Emissions from flaring42 are expected to remain decrease slightly, from app 0.46 Mt today to 0.41 Mt in 2020 according to the latest projection by the Danish Energy Authority. According to the governments climate strategy from 2003 it is possible to reduce emissions from flaring by 0.3 Mt in the Kyoto-commitment period with a total socio-economic benefit of 710 million DKK. The benefit is due to the sale of the recovered flare gas (Finansministeriet 2003, p. 148). Flare gas recovery is not included as a GHG-measure in the present report.
42 Flaring: burning of unusable waste gas or flammable gas and liquids at oil wells (or at refineries).

79
4.8 Research, Development & Demonstration
Though the 2020 scenarios primarily make use of technologies, which are already commercial today, a concerted research and demonstration effort is required to harvest the full benefits of the reduction scenarios. In many respects Denmark will be dependent on the international learning curves for new technologies, but a national effort and a proactive international role can be vital to bring some of the
technologies forward. In this respect it is important that funds for research and demonstration activities are used in accordance with long term energy policy goal. Future RD&D priority areas in the reduction scenarios include: Buildings and appliances. Development of standard building elements with highly isolative properties is a top priority. This includes windows, removing the traditional thermal bridges, etc. Within the arena of efficient appliances, Denmark is already a leader in some areas (pumps, refrigerators, control systems, etc.). Intelligent appliances. To be able to take advantage of flexibility in energy consumption, new control systems and intelligent appliances must be developed. These will enable a household or company to adjust consumption to the power systems actual load and real-time pricing. District heating. When energy consumption for heating is reduced and the share of wind power is increased, the basis for district heating will, in many places, deteriorate. It is important to understand which areas should continue to prioritise district heating, how the loss of energy with district heating can be reduced and how energy efficiency can be further increased through the dynamic utilization of heat pumps, geothermal energy, central cooling and heat storage. Natural gas. It will also be relevant to examine the future role of the natural gas infrastructure, which was established in the 1980’es. Transport. An improvement of fuel-efficiency in cars requires improvements in existing motors. This includes diesel, petrol and the so-called flexi-fuel cars that run on a mix of ethanol and petrol. Furthermore, major developments are needed to develop electric cars and hybrid-cars. Hybrid plug-in cars could provide the “missing link” between conventional cars based on the combustion engine and the long-awaited electric cars. Moreover development and demonstration of 2nd generation biofuel facilities will be required. Promotional measures will be needed to encourage modal shifts from cars to bikes and public transport. Experience with road-pricing from Stockholm and London shows that it is possible to change commuter behaviour if the right incentives are provided. The effort to promote public transport and bikes in Groningen in the Netherlands and in Odense have also been successful. Integration of wind power. Other priority areas include research, development and demonstration of offshore windmills (also in deep waters), large heat pumps in the
Installations for producing oil and gas fall under the EU emission trading scheme “if their combustion plants have a rated thermal input exceeding 20 MW. The permit applies to both the production of energy for recovering oil and gas and the flaring of hydrocarbons on the installations” (DEA 2006, Oil and Gas Production in Denmark 2005).

80
district heating system, and components for electricity system to ensure it can withstand a heavy load from wind power production.

81
5 Scenarios for 2050
Four developments are explored for 2050: a reference projection and three scenarios: one where GHG emissions are reduced by 60 per cent and two scenarios where emissions are cut down by 80 per cent compared to 1990. 2050 scenarios:
Reference projection Red60% Red80%-CCS Red80%-RE
The basic tools in the long-term scenarios are the same as in the 2020 scenarios: energy savings, improved energy efficiency and higher utilisation of renewable energy. Wind power becomes an even more important measure compared to the 2020 and integration takes place through the use of new technologies in the transport sector, most notably hydrogen based fuel cell vehicles and electric vehicles with long range. Also, promising technologies such as wave power, solar PV and geothermal are introduced in the 2050-energy systems. In the Red80%-CCS scenario CO2 capture and storage (CCS) is applied as key means to reduce emission further.
5.1 Main results
Figure 29 shows the distribution of GHG on sources in 1990, in 2005, 2020 and in the three scenarios for 2050. In the 2050-reference total emissions increase by app. 20 % compared to 2005 though the demand for energy services becomes significantly higher over the period (by 80 – 260 %, see Figure 15, p. 53). This result is primarily obtained because existing measures to reduce emissions are continued, and because vehicles are assumed to become more efficient than today. Moreover, there are no longer emissions from oil and gas extraction in 2050 because production from the fields is expected to have expired.

82
Greenhouse gas emissions (CO2-eqv.)
-10
0
10
20
30
40
50
60
70
80
1990 2005
Reference 2020
Combi30%_2020
Combi40%_2020
Reference 2050Red60%_2050
Red80%-CCS_2050
Red80%-RE_2050
mill. tonnes CO2
wastewaterlandfillF-gassesindustrial gassesagricultureoil/gas extractiontransportenergy purposes
Figure 29: Greenhouse gases distributed on sources in 1990, 2005, 2020 and 2050. The stipulated line illustrates the Danish Kyoto target for 2008-12. In the reduction scenarios emissions are reduced by 60 and 80 % respectively compared to the 1990 level. The majority of emission reductions take place in the energy sector. The reason for this is a strong effort to reduce the demand for energy – through energy savings measures and a massive effort for greater utilization of wind power and bioenergy. In the Red80%-CCS wind power constitutes 50 per cent of total electricity production and in the Red80%-RE 70 per cent. The total fuel consumption is significantly higher in the 80 % CCS scenario for 2050 compared with the similar RE scenario. This is primarily due to the lower wind power penetration in the CCS scenario and the fact that CCS technologies consume a significant amount of energy for capturing CO2. In the scenarios it is assumed that the electric efficiency of CCS power plants are reduced by app. 10 percentage points compared to the similar plant without CCS technology.

83
Primary Energy Consumption - 2050
0
200
400
600
800
1000
1200
Reference 2050 Red60%_2050 Red80%_2050_CCS Red80%_2050_RE
PJ/Year
Solar heatingWawe energyGeothermal energyPhotovoltaicWasteBiogasBiomassWindNatural gasCoalOil
Figure 30: Gross energy consumption in the scenarios for 2050 Because of the assumed expiration of oil/gas production from the fields in the North Sea Denmark becomes a net importer of energy in all the 2050-scenarios (see Figure 31). In total the Danish import of fuels will amount to app. 54 billion DKK per annum in 2050 in the reference projection, but significantly lower in the reduction scenarios. The fuel imports are the lowest in the Red80%-RE scenario where only biomass is imported corresponding to app. 8 billion DKK annually. Because of the great use of biomass in this scenario (300 PJ, excluding biogas and municipal waste) it is necessary to import app. 220 PJ of biomass if no new domestic resources are developed. Also the wind resource is exploited to its limits in the scenario as the total off-shore capacity amounts to 14,000 MW. For comparison the resource has previously been estimated to 12,000 MW at depths below 15 m taking into consideration constraints related to physical planning (see section 2.9). The alternatives to import in the renewable energy scenario are further use of wind power or larger amounts of wave or solar power. It should be noted however, that there is a significant uncertainty as to whether wave and solar power will develop to become competitive with wind power in 2050.

84
Trade balance - 2050 scenarios
-60.000
-50.000
-40.000
-30.000
-20.000
-10.000
0
10.000
oil coal natural gas biomass total
mill. DKK
Reference 2050Red60%_2050Red80%_2050_RERed80%_2050_CCS
Figure 31: trade balance for 2050 scenarios (mill. DKK/annum). * The total also includes income from sale of surplus electricity (of minor influence). 5.1.1 Scenario economy
Based on the assumption of an oil price of 75 $/barrel and a CO2-quota price of 175 DKK/ton the economy of the scenarios is compared to the reference in Figure 32. Fuel costs are brought down considerable in the scenarios whereas investment costs are much higher. In the 60 % reduction scenario costs are approx. 6 bn DKK lower than in the reference whereas they are 2.5 bn DKK higher in the renewable energy scenario where all fossil fuels are phased out in the energy system and in the transport sector. It should be noticed, that the additional costs of the scenarios are extremely sensitive to the applied fuel prices. Assuming an oil price of 110 $/barrel in 2050 all scenarios will be competitive with the reference even when no CO2-costs are included. Another great uncertainty in the scenarios is the cost of electric and hydrogen powered cars. In the 2050 scenarios it is assumed that the investments costs of these technologies are 50-60 % higher than the costs of conventional cars using gasoline or diesel. If car manufacturers succeed in bringing down the costs of these vehicles to a level similar to conventional cars this would improve the economy of the 80 %-renewable energy scenario by app. 8 bn DKK per annum. Fuel cost savings in the scenarios are particularly great in the transport sector where the fuel economy of conventional combustion engines is improved considerable in the reduction scenarios and new technologies are applied. In total fuel cost in the transport sector are reduced from app. 23 bn DKK/annum in the reference to 2-4 bn DKK/annum in the reduction scenarios (excluding costs of generating hydrogen and electricity).

85
Additional costs compared to the reference75 $/bbl
-50.000
-40.000
-30.000
-20.000
-10.000
0
10.000
20.000
30.000
40.000
Fuel CO2 O&M Capital Total
mill. DKK p.a.
Red60%_2050Red80%-RE_2050Red80%-CCS_2050
Figure 32: Total additional annual costs in the reduction scenarios compared to the reference projection. Assuming an oil price of 75 $/barrel and an international CO2-quota price of 175 dkk. Positive figures indicate higher costs than in the reduction scenarios and vice versa. Both the 60% scenario and 80%_CCS scenario are less expensive than the reference, while the 80% scenario without CCS has the same level of costs as the reference. As for the 2020 scenarios it should be noticed, that the cost differences between scenarios and the reference are very sensitive to changes in fuel prices. Figure 33 shows the relative costs of the scenarios at an oil price of $35/barrel and $100/barrel respectively. At an oil price level of $100/barrel all three reduction scenarios are substantial less expensive than the reference.
Low fuel prices - 35 $/bblAdditional costs compared to the reference
-50.000
-40.000
-30.000
-20.000
-10.000
0
10.000
20.000
30.000
40.000
Fuel CO2 O&M Capital Total
mill. DKK p.a.
Red60%_2050Red80%-RE_2050Red80%-CCS_2050
High fuel prices - 100 $/bblAdditional costs compared to the reference
-50.000
-40.000
-30.000
-20.000
-10.000
0
10.000
20.000
30.000
40.000
Fuel CO2 O&M Capital Total
mill. DKK p.a.
Red60%_2050Red80%-RE_2050Red80%-CCS_2050
Figure 33: Sensitivity analyses. Annualised additional costs of the scenarios compared to the reference at the same time. Oil prices of $ 35/barrel and 100 $/barrel are assumed. The prices of gas, coal and biomass are assumed to match the oil price to some extent. The calculations also include a CO2 quota price of DKK 175/ton. A discount rate of 6 per cent is used. Please note that the costs have not been discounted to today’s value.

86
5.1.2 CO2 abatement costs
The economy of the scenarios may also be expressed by their average CO2 abatement costs, see Table 14. The scenario abatement costs cover a range of different measures, where some will have low or even negative abatement costs and others have relatively high abatement costs. Higher fuel prices will generally lead to lower abatements costs and vice versa. Fuel prices Red60% Red80%
RE Red80% CCS
Ref - 60/75 $/bbl 50 220 140 Low - 35 $/bbl 420 550 460
High - 100 $/bbl -190 10 -60 Table 14: Average CO2 reduction costs (DKK/ton) in the 2050 reduction scenarios compared to the references Under reference fuel prices the additional costs of reducing greenhouse gas emissions estimated to app. -0.1 – 0.3 % of GDP in 2050. Red60% Red80%
RE Red80% CCS
DKK 2.2 bn per year
DKK 13.4 bn per year
DKK 8.2 bn per year
0.1 % of GDP
0.5 % of GDP
0.3 % of GDP
Table 15: Total additional costs in the 2050 reduction scenarios compared to the reference projections (without a CO2 price). Additional costs are also shown as share of GDP. Reference fuel prices (75 $/bbl).
5.2 Energy savings measures
The end-use energy consumption in the 2050 scenarios Red60% and Red80%-CCS are assumed to be the same, while the Red80%-RE scenario includes a bigger energy saving effort in order to comply with the GHG targets. In 2050 all existing buildings has been renovated and some demolished and replaced by new buildings (see Figure 25, p. 66). In Table 16 the saving measures are compared to potentials presented in the Danish Energy Saving Plan (Energistyrelsen 2004). The “socio-economic potential” represents savings with a short pay-back time with today’s technology, while “Max potential” represents saving potentials with a reasonable pay-back time for technologies joining the market within the next 10-15 years. The reference is a fully implementation of what is called “Socio-economic potential” in the Danish Energy Saving Plan.

87
End-Use Technologies 2050
“Socio-economic potential”
“Max potential”
Reference 2050
Red60% and Red80
%-CCS
Red80%-RE
Costs Dkr./GJ/
year
Light 35 % 75 % 35 % 71 % 79% 44 Pumping 35 % 75 % 35 % 71 % 79% 97 Refrigerator/ Freezer
15 % 30 % 15 % 36 % 40% 41
Computer and electronics
40 % 80 % 40 % 75 % 83% 113
Other use of power
25 % 50 % 25 % 51 % 57% 36
Cooking 30 % 65 % 30 % 63 % 70% 41 Washing 35 % 70 % 35 % 67 % 74% 49 TV/video 30 % 65 % 30 % 63 % 70% 41 Heating 25 % 40 % 40 % 50 % 56% 143 Table 16: Households end-use energy saving potentials. Costs are in annualised 2005-Dkr. Pr GJ saved per year compared to the reference. The reference scenario is thought as a continuation of the Danish Energy Saving Plan (the plan is running to 2013) and is assumed to utilise 80% of the plan’s “Socio-economic potential”. Red80%-RE exceeds the so-called “Max potential” from the Danish Energy Saving Plan. For electrical appliances this is mainly due to an assumed further development in efficiency until 2050 compared to the savings in the plan, which are estimated for the period 2005 to 2025. For room heating the higher saving rate in all the scenarios (except from the reference) has two explanations: In 2050 all existing buildings are renovated or demolished, while the saving potential in the Danish Energy Saving Plan is based on that only a part of the building mass has been renovated when reaching 2020-25. Beside this, it is assumed that all buildings established after 2015 are constructed according to passive house standard and need therefore no direct room heating.

88
For industry and service in the Red60% and Red80%-CCS scenarios savings are implemented equalling 80 percent of the potential listed in the background material to the Danish energy saving plan. In the Red80% scenario 100 percent of the technical potential is utilised.
Process Energy
ReferenceRed60%Red80%-CCS
Red80%-RE
Costs Industry D.kr./GJ/year
Costs T&S D.kr./GJ/year
Boiler losses 32% 56 % 60% 38 40 Heating/boiling 20% 29 % 30% 23 40 Drying 20% 37 % 40% 40 40 Evaporation 32% 52 % 55% 29 Distillation 24% 42 % 45% 29 Baking 16% 28 % 30% 27 28 Smelting 16% 28 % 30% 47 Other heat above 150 Dgr. C. 16% 44 % 50% 48 Own transport 12% 27 % 30% 82 82 Other end-use energy Lighting 16% 56 % 65% 44 44 Pumping 28% 55 % 60% 97 97 Cooling / freezing 32% 52 % 55% 41 41 Ventilation 32% 72 % 80% 77 77 Compressors 28% 71 % 80% 64 64 Electric motors 12% 31 % 35% 65 65 Electronics 20% 49 % 55% 74 113 Other use of electricity 8% 22 % 25% 68 36 Heating 20% 41 % 45% 10 24 Table 17: Industry and Trade&Service (including Public Service) end-use energy saving potentials. Costs are in annualised 2005-Dkr. Pr GJ saved per year compared to the reference.
Passive houses Reducing heat demand by 80% does not mean that heat losses have to be reduced by the same amount. In any house, heat is provided by electrical appliances, artificial lighting and people, and these contributions become proportionally more important as heat losses fall. As a result, a cut in heat losses of 50% is typically enough to meet the passive house standard. Total energy consumption in a passive house is typically 15 kWh/y⋅m2 net area (incl. general electricity consumption). On the technical side, passive houses are generally characterised by:
• Solid walls and roofs with heat transfer coefficients (U1) of 0.07–0.15 W/m2K—about half of the values found in standard buildings.
• Windows with low heat losses (U values of 0.75–0.85 W/m2K for the whole window area) and high solar energy transmittance (g-values of 50–60% for the glass). The g-value is the percentage of the energy contained in the sunlight, that passes through the glass in the windows.
• Controlled ventilation with heat recovery and low electricity consumption. The temperature efficiency is typically 75–90% and electricity consumption for air transport is below 1500 J/m3.
• Construction joints with thermal bridges which are zero or negative when using outside dimensions as a reference.
• Minimal air leakage, so that the amount of air bypassing the heat recovery system is less than 4% of the building’s volume per hour. At a differential pressure of 50 Pa this corresponds to fewer than 0.6 air changes per hour.
Source: Risø Energy Report 4

89
To realise savings as massively as assumed in the Red80% scenario, new ways of providing needed energy services has to be developed. One example is diode lighting (see box) which has a potential to deliver the same service in the form of light using less than 15 percent of the electricity used by a traditional incandescent lamp.
5.3 Measures in the transport sector
In the reference scenario the energy efficiency level of the transportation means is assumed to be further improved to 15% compared to the present level. The reductions scenario includes substantial improvements of the energy efficiency level by 50-60% towards 2050, except in case of electrical drives. Also with this long time perspective more radical shifts of fuels are forwarded particularly in the case of hydrogen and electrical propulsion. In the 80 % reduction scenario focusing on renewable energy 55 percent of car transport work is covered by electric cars, 35 per cent by hydrogen based cars and the remaining share by biofuels. In the 60 % reduction scenario 25 per cent of the transport work remains covered by diesel/gasoline and in the CCS-scenario this share is 15 per cent. In all 2050 reduction scenarios the modal shifts in passenger transport are similar to the 40% reduction scenario for 2020.
A key technology in the transport sector is fuel-cells, notably in conjunction with hydrogen fuels. The fuel cell technology (most likely in the form of PEM fuel cells) is vital, but not indispensable, in conjunction with hydrogen propulsion of transport means. Hydrogen can be applied in internal combustion engines, too, albeit with considerably poorer energy efficiency and a range of operational problems still unsolved.
Fuel cells A fuel cell is an electrochemical device that combines hydrogen and oxygen to produce electricity, with water and heat as its by-product. Since the conversion of the fuel to energy takes place via an electrochemical process, not combustion, the process is clean, quiet and very efficient. Fuel cells are also scalable and can be stacked until the desired power output is reached. Fuel cells can be designed to operate also in reverse as an electrolyzer. Then electricity can be used to convert the water back into hydrogen and oxygen. This allows the fuel cell to store electricity in form of hydrogen. Source: Fuel Cells 2000 (www.fuelcells.org)
Light emitting diodes Lighting based on light emitting diodes (LEDs), also called diode lighting, has developed tremendously in recent years and is regarded as the light source of the future. LEDs are becoming more efficient year by year, and in the near future they are expected to surpass the most efficient conventional lighting available today. The best coloured LEDs today produce more than 60 lumen/W; incandescent lamps produce only 10–15 lumen/W, and much less when coloured light is required. In addition to their energy savings, LEDs have a number of other advantages. A lifetime of up to 100,000 hours cuts the cost of replacing lamps that have failed. Their solid-state nature makes LEDs almost immune to shocks and vibration. Thanks to their high efficiency they generate little heat, and they produce no infrared or ultraviolet radiation. (Source: Risø Energy Report 4)

90
Costs related to the different transport technologies systems are presented in the previous chapter.
Bio-diesel production In the reduction scenarios biodiesel is an important fuel for bus transport and freight transport by lorries. The biodiesel is assumed to be produced at facilities in Denmark using rape from the agricultural sector as the input for the processes. Key assumptions for these processes are presented below: Input of energy required to produce 1 unit of bio-diesel (units): Biomass (rape): 1.05 Electricity: 0.13 Steam: 0.02 Investments cost for the bio-diesel plant are 6 DKK/GJ-biofuel. Operation and maintenance costs amount to 10 DKK/GJ.
Petition to support the development of battery, hybrid and fuel cell electric vehicles AVERE (the European association for battery, hybrid and fuel cell electric vehicles), CITELEC (the association of European cities interested in electric vehicles) and EPE (the European power electronics and drives association have recently organized a petition to gather a large number of signatures supporting a proposition that requests the European Parliament, the Commission of the European Communities and the European Council of Ministers to set up a large programme for development and demonstration of battery-electric and hybrid electric vehicles, so as to highlight their respective and immediate benefits for energy economy and emission reduction, while eliminating the burdens restricting these technologies from real market access. Furthermore, AVERE, CITELEC and EPE ask for such measures to be taken as quickly as possible, taking into account that Europe's major commercial and technological competitors such as Japan, the United States and China are also engaged in similar programmes on a significantly large scale. The battery-electric vehicle is an available solution allowing energy savings and emission reductions of up to 50% compared with an equivalent internal combustion engine powered vehicle, while being fully zero-emission where it is used. Fitted with Lithium or NaNiCl batteries, it can cover a range of 150 to 250 km, which gives it a market share of 20 to 35%.This suits the need of most commuters, second family cars, as well as a majority of light utility vehicles. Under these market conditions it could be offered at a price normally superior to the conventional vehicle, but the low consumption would allow recovery of this extra cost in less than half of the vehicle life, making a financial profit on the whole life of the vehicle. The hybrid electric vehicle is an available solution allowing an energy saving of 20 to 30% compared with an equivalent internal combustion engine powered vehicle. This saving can even be increased when the batteries are charged from the electricity grid. Significant emission reductions will be achieved. It is fitted with NiMH or Lithium batteries, and has no limitation in range except in pure electric mode. It appeals to the same market as the internal combustion engine vehicle, and can thus, in complement with the battery-electric vehicle, cover the whole market. Under these market conditions, it could be offered at a price normally superior to the conventional vehicle, but the low consumption would allow recovery of this extra cost in less than half of the vehicle life, making a financial profit on the whole life of the vehicle. The fuel cell electric vehicle is a long term solution, not available on a commercial basis for the next 15 to 20 years. It follows the continuity of electric vehicle development, the battery being replaced wholly or partially by a fuel cell associated with or without supercapacitors. This technology is interesting since it makes use of hydrogen as an energy vector. However, its energy and environmental performances will be inferior to those attained by battery-electric vehicles, and can probably be compared to those of hybrid electric vehicles.

91
5.4 Supply side measures
Table 18 gives an overview of the electricity supply in the 2050 scenarios. In the reference projection fossil fuels still supply the greater part of the demand for electricity. In all three reduction scenarios wind power penetration is increased significantly and supplemented by limited amounts of wave and solar photovoltaic’s (PV). Only limited amounts of wave and solar power are introduced because these technologies are presumed to be still relatively costly in 2050 compared for example to wind power. If the costs of these technologies are brought down to a level comparable with wind power it would be relevant to introduce larger share amounts in the system on behalf of wind power since this would smoothen overall fluctuations. Wind, solar and wave power are all intermittent technologies having different production patterns over time. In the CCS-scenario coal and biomass with CO2-capture technologies deliver 37 % total electricity supply. CCS at biomass plants will contribute to a net reduction of CO2 emissions.
Table 18: Composition of the electricity supply in the 2050 scenarios.
5.5 Integration of wind power
Integrating the fluctuating production from wind power in the energy systems becomes a key challenge in the 2050 reduction scenarios particularly in Red80%-RE where wind power makes up 70 per cent of total electricity generation. Figure 34 shows the residual load duration curve for the electricity consumption in the Red80%-RE scenario after deducting wind power production. app. 2400 hours a year the wind power generation exceeds demand and in total some 5.3 TWh of wind power is not used in the Danish system. It should be noticed that the current exchange capacity of app. 5000 MW is only exceeded app. 150 hours per annum. The remaining load needs to be covered by thermal power plants or imported power. In the scenarios it is assumed that it is possible to sell the surplus electricity to Denmark’s neighbouring countries at a price of 150 DKK/MWh – corresponding approximately to the short run marginal costs of a coal fired base-load power plant. This relatively low export-price has been chosen to reflect that surplus electricity may have less value for the general system than electricity, which can be produced according to the needs of consumers. Moreover, massive expansion with wind power in the countries surrounding Denmark may constraint the opportunities for exporting the electricity.
2050 oil coal natural gas biomass biogas waste wind PV Wave power coal CCS biomass CCSReference 3% 46% 20% 2% 3% 6% 20% 0% 0% 0% 0%Red60% 0% 14% 1% 11% 6% 5% 60% 2% 2% 0% 0%Red80%-RE 0% 0% 0% 17% 5% 4% 70% 2% 2% 0% 0%Red80%-CCS 0% 0% 0% 0% 6% 5% 50% 1% 1% 32% 5%

92
Load duration curve
-8000
-6000
-4000
-2000
0
2000
4000
6000
8000
10000
12000
1 501 1001 1501 2001 2501 3001 3501 4001 4501 5001 5501 6001 6501 7001 7501 8001 8501
MW
Figure 34: Annual load duration curve in the Red80%-RE scenario (Electricity demand minus wind power). In order to fully benefit from the wind power Red80%-RE applies electricity (in some cases stored as hydrogen) as a main source of energy for heat production and transport purposes. This ensures a high utilization of the energy resources and provides an interaction between the different sectors which enables integration of large amounts of fluctuating energy sources. In total the electricity demand is increased to 86 TWh in Red80% - some 2.4 times more than the present consumption. In the heat sector electric heat pumps are used in connection with the district heating system as well as in households (individual systems). In Red80% 1,700 MWheat of heat pumps is installed to make benefit of the wind power production and substitute fuel for heat only boilers. The production of the heat pumps amounts to 30 PJ or roughly 20 per cent of total district heating production. At households and commercials private heat pumps supplies 25 per cent of total heat demand. Whereas private heat pumps are assumed to respond to the demand for heat without delay the collective heat pumps has the advantage of using the storage capacity in the district heating system to adjust production according to the needs of both the heating system and the electricity system. Because of the change from vehicles with combustion engines to hydrogen and electric based cars the demand for electricity in the transport sector increases dramatically. From app. 0.5 TWh today to 30 TWh in Red80%. Hydrogen and electric vehicles have the advantage of being able, to some extent, to load flexible according to the demand of the system – for example by increasing consumption at night, where demand is usually low, or at times with high wind power production. In the scenarios it assumed that 25 % of the electricity for hydrogen and electric cars is used at night, 50 % in hours where it is most beneficial for the electricity system (low demand / high wind power production) and the last 25 % inflexible (the load is evenly distributed over the year). The cars may also produce to the grid in situations where the power system is strained. These features allow hydrogen and electric cars not only adjust to the fluctuating patterns of the wind power, but also to contribute the technical stability of the power grid.
electricity surplus for export

93
Moreover, it will become important to develop demand response at consumers and industry so as to adjust consumption of electricity to the current price level or grid stability parameters (the frequency for example). This development may go hand in hand with the investments in intelligent homes and energy equipment as part of the effort to make consumption more energy efficient. In the scenarios it is assumed that 0.25 TWh can be moved from times where the electricity is strained to other hours.
5.6 Measures in the agricultural sector
The latest NERI projection for 2030 is used to estimate the emissions from the agricultural sector in 2050. In addition to the utilization of biogas in the agricultural sector no further measures are assumed.
5.7 Research, Development & Demonstration
Generally the focus of the 2050 scenarios is very similar to the 2020 scenarios. Fuel efficient buildings and appliances are fundamental in all 2050 scenarios and development of the intelligent energy and transport system for integration of wind power becomes an increasing challenge.
CCS – Carbon Capture Sequestration CCS technologies are currently in the phase of research and demonstration. Several CO2 capture technologies are being investigated, including integrated gasification combined-cycle technologies, chemical absorption and oxyfuel technologies. The IEA has recommended having at least 10 large power plants with CCS technologies operating globally by 2015 in order to advance the technology (IEA 2006, Energy Technology Perspectives), and in January 2007 the EU Commission announced that it would support the construction of 12 large-scale demonstration facilities. The long term environmental sustainability of CCS technologies has been questioned for two reasons. Firstly, it still needs to be proven that the CO2 can be safely stored underground over a longer term. Secondly, some observers are critical to CCS technologies because they will not create the needed transition away from the fossil fuel based economy. In fact CCS plants will have higher fuel consumption than conventional fossil fuel because a lot of energy is required to capture the CO2. The following assumptions on CCS technologies have been made in the 2050 scenarios CO2-capture efficiency: 85 % Cost of transporting CO2 for storage: 15 DKK/ton Cost of geological storage: 56 DKK/ton The CO2 is presumed to be stored in aquifer layers inland. CO2 may also be stored in oil-field in the North Sea as means to enhance oil recovery. However, in 2050 the oil-resource in the North Sea is expected to be exhausted and therefore this option has not been included in the scenarios. Plant specific data: Coal CCS Investment cost: 14.2 M DKK/MW (60 % higher than conventional coal) Electric efficiency: 35 % Natural gas combined cycle CCS Investment cost: 7.1 M DKK/MW (75 % higher than conventional gas CC) Electric efficiency: 45 % Biomass CCS Investment cost: 15.5 M DKK/MW (60 % higher than conventional biomass) Electric efficiency: 33 %

94
However, a range of new technologies are introduced in the 2050 scenarios, which are not expected to be commercial or cost competitive in 2020:
- Hydrogen technologies in the transport sector - Carbon Capture and Storage - Wave power - Solar photovoltaic’s - Geothermal heat and power
The further development of these technologies will to a large extent depend on a concerted international effort, and it cannot be excluded that some of these technologies will never reach a level where they become fully competitive with existing renewable and fossil fuel technologies. In the transport sector Denmark could have a unique role as a test-lab for new such technologies because of the synergies for using the storage for wind power integration. The PEM fuel cell has shown a dramatic technological and economical development over the last 15-20 years but much is required, particularly with regard to costs, to enable it to compete with conventional internal combustion engines and various hybrid technologies. The required cost reductions are in the order of a factor 10-20. There are considerable ongoing R&DD efforts involving most of the large automobile manufacturers though the expenditure in this research still only account for a few per cent of the total R&D expenditure in the automotive sector. The outcome of this R&D development is by no means certain. Moreover, in the 2050 scenarios electric vehicles and plug-in hybrids are crucial to the development, particularly in the longer term. To ensure an adequate development of these technologies – notable with regard to battery technologies and for the drive-train as such - international promotional instruments are required. In one of the scenarios for 2050 CCS (carbon capture and storage) technologies are incorporated as a possibility, including depositing CO2 in geological layers after it has been captured at central power plants. However, a number of considerable barriers related to CO2 storage need to be clarified before this technology can be used full-scale in the future. One example is high investment costs and large energy consumption for capturing CO2. In addition, even if the risk of seepage from carefully selected storage sites is considered to be negligible, the risk of leakage in connection with extraction, transport and storage processes is considerable. Furthermore, it is generally difficult to carry out long-term monitoring of leakage from storage sites under the seabed, since current satellite technologies cannot 'see through water'. It can be expected that the development of CCS technologies will be driven primarily by countries with large domestic coal or gas resources – and Denmark will have to find its role in this international setup. The scenarios indicate that CCS technologies could play a role in the future Danish energy system. It should therefore be considered to prepare new large scale power plants for retrofitting of carbon capture technologies to avoid undue costs in the future if international carbon prices surge.

95
6 References
Birch & Krogboe (2004) “Potentialevurdering Energibesparelser i husholdninger, erhverv og offentlig sektor Sammenfatning af eksisterende materiale og analyser”. Danish Energy Authority (2007), Energistatistik 2006 Danish Energy Authority (2008). Basisfremskrivning af Danmarks energiforbrug frem til 2025. EU (2006). SmartGrids. Elsam Engineering (2005). Teknologidata for halmbaseret ethanolproduktion samplaceret med kraftværk. Elsam Engineering (2005). Teknologikatalog VE-metanol i samproduktion med kraftværker. Energistyrelsen (2004). Energisparehandlingsplan Energistyrelsen (2004). "Faglig baggrundsrapport - Handlingsplan for en fornyet indsats - Energibesparelser og marked", Udkast december 2004. Energistyrelsen (2005). Technology Data for Electricity and Heat Generating Plants. Energistyrelsen (2005). Energistrategi 2025. Energinet (2006). Udredning vedrørende: Indpasning af solvarme i kraftvarme. Bilagsrapport, marts 2006. IEA (2006). World Energy Outlook 2006. IEA (2006). Energy Technology Perspectives. IEA (2006). ”Do energy saving appliances cost more?” Working Paper Series, October 2006. OECD/IEA, 2006. Miljøstyrelsen/COWI (2007). Klima 2050 - supplerende analyser for Danmark. Prepared by COWI for DEPA. NERI (2006). Fremskrivning af drivhusgasemissioner 2005 til 2030. Arbejdsnotat til Miljøstyrelsen (nov. 2006). NERI (2007). Projection of Greenhouse Gas Emissions 2005-2030 Olesen JE. (2005). Drivhusgasser fra jordbruget – reduktionsmuligheder. RECaBS (2007). Renewable Energy Costs and Benefits to Society. www.recabs.org Teknologirådet (2007). (The Danish Board of Technology). Det fremtidige danske energisystem.
96
6.1 Transport technologies
Danish Energy Authority, “Teknologikatalog for transportsektoren (in Danish). Copenhagen, 2000. Delucchi, Mark A., "A lifecycle emissions model (LEM): lifecycle emissions from transportation fuels, motor vehicles, transportation modes, electricity use, heating and cooking fuels, and materials - documentation of methods and data". Institute of Transportation Studies, UC Davis, Californien, 2003. Edwards, R. et al, "Well-to-Wheels Analysis of Future Automotive Fuels and Powertrains in the European Context (the JEC Study): CONCAWE, EUCAR and the Joint Research Centre of the EU Commission. Version 2b" Ispra, Italy, 2006. Friis Hansen, Ken et al, "Teknologiudvikling i transportsektoren. Teknologikatalog" (in Danish), Teknologisk Institut, Århus. Greene, David & Andreas Schafer, "Reducing greenhouse gas emissions from US transportation", Pew Center on Global Climate Change, Arlington, Virginia, 2003. Ministry of Transport, “Nøgletalskatalog - til brug for samfundsøkonomiske analyser på transportområdet” (in Danish). Copenhagen, June 2006. Mullin 2007, King Review: Potential for CO2 reductions in the road transport sector. Study presented at STOA-workshop in the European Parliament 20 November 2007 Ogden, Joan et al, "A comparison of hydrogen, methanol and gasoline as fuels for fuel cell vehicles: implications for vehicle design and infrastructure development", Journal of Power Sources, vol. 79, pp. 143-168, 1999. Ogden, Joan et al, "Toward a hydrogen-based transportation system", Princeton University, Center for Energy & Environmental Studies, Princeton, New Jersey, May 2001. Padró, C.E.G. & V. Putsche: "Survey of the Economics of Hydrogen Technologies" (NREL/TP-570-27079). NREL, Department of Energy, Golden, Colorado, 1999. Simbeck, D. & E.Chang, “Hydrogen supply: cost estimate for hydrogen pathways - scoping analysis”. NREL, Bolden, Colorado, 2002. Weinert, Jonathan & Timothy Lipman, “An assessment of the near-term costs of hydrogen refueling stations and station components”. Institute of Transportation Studies, University of California, Davis, 2006.

97
7 Appendix
Technology data – energy production technologies
Investment data for 2020 electricity generation technologies:
Electricity generation (2020) DKK/MW Size, MW
Expected Economic Life time
Fixed O&M, DKK/MW/annum
Var. O&M, DKK/MWh
Oil 5.000.000 20 30 80.000 15Coal 8.904.000 400 30 118.720 14Natural Gas Combined Cycle 4.081.000 250 30 92.750 11Gas turbine 3.725.000 50 30 55.875 19Micro CHP 6.705.000 0 15 333.333 22Wind, offshore (incl. grid int.) 18.500.000 1 20 0 115Wind, onshore 8.500.000 1 20 0 95Biomass 9.685.000 83 30 186.250 20Biogas 21.605.000 6 20 0 186Municipal waste 40.975.000 10 20 1.653.900 156
Investment data for 2050 electricity generation technologies:
Electricity generation (2050) DKK/MW Size, MW
Expected Economic Life time
Fixed O&M, DKK/MW/annum
Var. O&M, DKK/MWh
Oil 5.000.000 20 30 80.000 15Coal 8.904.000 400 30 118.720 14Natural Gas Combined Cycle 4.081.000 250 30 92.750 11Gas turbine 3.725.000 50 30 55.875 19Micro CHP 6.705.000 0 15 333.333 22wind, offshore (incl. grid int.) 10.950.000 1 20 0 60wind, onshore 4.097.500 1 20 0 52Biomass 9.685.000 83 30 186.250 20Biogas 21.605.000 6 20 0 186Municipal waste 40.975.000 10 20 1.653.900 156Solar PV 12.665.000 1 30 126.650 0Geothermal power 10.000.000 1 20 1 1Wave power 13.782.500 25 20 275.650 0Natural gas, w. CO2 storage 7.141.750 400 30 93.125 11Coal w. CO2 storage 14.155.000 500 30 118.720 13Biomass w. CO2 storage 15.496.000 400 30 186.250 20

98
Reference brændselspriser2020: 57 $/tønde2050: 75 $/tønde
-50.000
-40.000
-30.000
-20.000
-10.000
0
10.000
20.000
30.000
40.000
50.000
Brænd
sel
CO2
Drift
Inves
tering
Total
mio. kr. per år
Kombi30%_2020Kombi40%_2020Red60%_2050Red80%-VE_2050Red80%-CO2-lagring_2050
Lave brændselspriser35 $/tønde
-50.000
-40.000
-30.000
-20.000
-10.000
0
10.000
20.000
30.000
40.000
50.000
Brænd
sel
CO2
Drift
Inves
tering
Total
mio. kr. per år
Kombi30%_2020Kombi40%_2020Red60%_2050Red80%-VE_2050Red80%-CO2-lagring_2050
Høje brændselspriser100 $/tønde
-50.000
-40.000
-30.000
-20.000
-10.000
0
10.000
20.000
30.000
40.000
50.000
Brænd
sel
CO2
Drift
Inves
tering
Total
mio. kr. per år
Kombi30%_2020Kombi40%_2020Red60%_2050Red80%-VE_2050Red80%-CO2-lagring_2050
Reference brændselspriser2020: 57 $/tønde2050: 75 $/tønde
-50.000
-40.000
-30.000
-20.000
-10.000
0
10.000
20.000
30.000
40.000
50.000
Brænd
sel
CO2
Drift
Inves
tering
Total
mio. kr. per år
Kombi30%_2020Kombi40%_2020Red60%_2050Red80%-VE_2050Red80%-CO2-lagring_2050
Reference brændselspriser2020: 57 $/tønde, 2050: 75 $/tønde
Diskonteringsrente: 3%
-50.000
-40.000
-30.000
-20.000
-10.000
0
10.000
20.000
30.000
40.000
50.000
Brænd
sel
CO2
Drift
Inves
tering
Total
mio. kr. per år
Kombi30%_2020Kombi40%_2020Red60%_2050Red80%-VE_2050Red80%-CO2-lagring_2050
Reference brændselspriser2020: 57 $/tønde, 2050: 75 $/tøndeDobbelt pris på energibesparelser
-50.000
-40.000
-30.000
-20.000
-10.000
0
10.000
20.000
30.000
40.000
50.000
Brænd
sel
CO2
Drift
Inves
tering
Total
mio. kr. per år
Kombi30%_2020Kombi40%_2020Red60%_2050Red80%-VE_2050Red80%-CO2-lagring_2050
Figur 13: Oversigt over følsomhedsanalyser.