damien isebe, jean-philippe gineys
TRANSCRIPT
Fe
at
ur
e
Ar
ti
cl
e
74 English Edition No.39 September 2012
Feature Article
Numerical Simulation of Particle Dynamics in an Orifice-Electrode System. Application to Counting and Sizing by Impedance Measurement
Damien ISEBE, Jean-Philippe GINEYS
This paper describes how to numerically tackle the problem of counting and sizing particles by impedance measurement in an orifice-electrode system. The model allows to simulate the particle dynamics submitted to strong hydrodynamic stresses through a microorifice and to compute the voltage pulses generated by the modification of the inner dielectric medium. This approach gives important information about particles size distribution and allows to quantify the role of trajectory and orientation of particles on the size measurement.
Introduction
Counting and sizing of biological cells are often based on electrical gating through a micro aperture-electrode system. A voltage drop, generated by the particle flowing through the aperture allows to determine the volume of the par ticle. We expose here a complete numerical approach based on f luidic and electrical cross linked simulations coupled to an equivalent electrical circuit model to Figure a realistic operation of cell impedance measurement of blood cells. The model allows to compute the exact particle size distribution by taking into account trajectory and orientation of the particles through the micro-aperture. For a given particle flow, we also compute full particle size distributions for systems with and without sample hydrodynamic focusing where volume measurement errors can be derived. These numerical results are also compared to experimental measurements.
Impedance Gating and Particle Sizing Principles
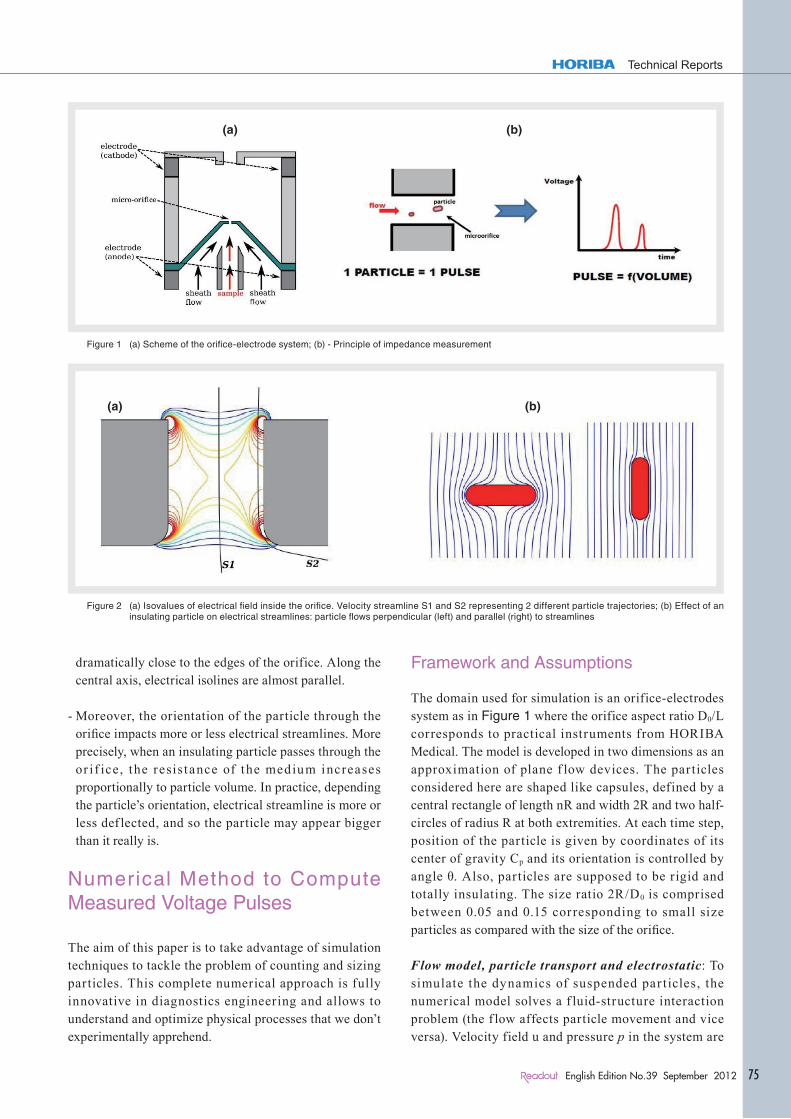
Figure 1(a) depicts the considered orif ice-electrode system with hydrodynamic focusing for the sample flow. The micro-aperture is a cylindrical aperture of length L and diameter D0 and is made of electrical insulator
material. The two electrodes, placed on each side, are platinum made with anode voltage fixed to V1 Volt. The sample arrives by an injector of diameter Di and an external sheath f low is used to focus the sample at the center of the aperture
Counting and sizing of biological cells are determined by an impedance variation measurement. This is the most popular technology, based on the well-known Coulter Principle, for volume measurement in the hematology field.[1]
More precisely, count ing is done by an elect r ical measurement through a micro-aperture. When a particle passes through the orifice, a voltage and/or voltage drop appears in the electrical f ield. The resistance of the medium is changed and this impedance var iat ion generates an electrical pulse which is directly linked to cell volume (See Figure 1(b)). Unfortunately, for a given particle, volume measurement can be distorted by its trajectory and its orientation and produce overestimations:
- Concerning the impact of particle trajectories, it is obvious that the electrical f ield experienced by the particle is not the same if the particle flows at the center or close to the edges (respectively streamlines S1 and S2 in the Figure 2(a)). Actually, in such a system, the electrical f ield is non-homogeneous and increases
Technical Reports
75English Edition No.39 September 2012
dramatically close to the edges of the orifice. Along the central axis, electrical isolines are almost parallel.
- Moreover, the orientation of the particle through the orifice impacts more or less electrical streamlines. More precisely, when an insulating particle passes through the or if ice, the resistance of the medium increases proportionally to particle volume. In practice, depending the particle’s orientation, electrical streamline is more or less def lected, and so the particle may appear bigger than it really is.
Numerical Method to Compute Measured Voltage Pulses
The aim of this paper is to take advantage of simulation techniques to tackle the problem of counting and sizing particles. This complete numerical approach is fully innovative in diagnostics engineering and allows to understand and optimize physical processes that we don’t experimentally apprehend.
Framework and Assumptions
The domain used for simulation is an orifice-electrodes system as in Figure 1 where the orifice aspect ratio D0/L corresponds to practical instruments from HORIBA Medical. The model is developed in two dimensions as an approximation of plane f low devices. The particles considered here are shaped like capsules, defined by a central rectangle of length nR and width 2R and two half-circles of radius R at both extremities. At each time step, position of the particle is given by coordinates of its center of gravity Cp and its orientation is controlled by angle θ. Also, particles are supposed to be rigid and totally insulating. The size ratio 2R/D0 is comprised between 0.05 and 0.15 corresponding to small size particles as compared with the size of the orifice.
Flow model, particle transport and electrostatic: To simulate the dynamics of suspended par t icles, the numerical model solves a f luid-structure interaction problem (the f low affects particle movement and vice versa). Velocity field u and pressure p in the system are
Feature Article
Numerical Simulation of Particle Dynamics in an Orifice-Electrode System. Application to Counting and Sizing by Impedance Measurement
Damien ISEBE, Jean-Philippe GINEYS
This paper describes how to numerically tackle the problem of counting and sizing particles by impedance measurement in an orifice-electrode system. The model allows to simulate the particle dynamics submitted to strong hydrodynamic stresses through a microorifice and to compute the voltage pulses generated by the modification of the inner dielectric medium. This approach gives important information about particles size distribution and allows to quantify the role of trajectory and orientation of particles on the size measurement.
(a) (b)
Figure 1 (a) Scheme of the orifice-electrode system; (b) - Principle of impedance measurement
(a) (b)
Figure 2 (a) Isovalues of electrical field inside the orifice. Velocity streamline S1 and S2 representing 2 different particle trajectories; (b) Effect of an insulating particle on electrical streamlines: particle flows perpendicular (left) and parallel (right) to streamlines
Fe
at
ur
e
Ar
ti
cl
e
76 English Edition No.39 September 2012
Feature Article Numerical Simulation of Particle Dynamics in an Orifice-Electrode System. Application to Counting and Sizing by Impedance Measurement
solutions to Navier-Stokes equations (the fluid is assumed to be incompressible and Newtonian and effects of Brownian motion and gravity are ignored). Particle velocity vp is a sum of a translational velocity vtr and a rotational velocity vrot. To compute these two components, we u se f lu id ic p a r a me t e r s (u , p) t o de t e r m i ne Hydrodynamic Force Fhyd and Torque T applied on the particle boundary. The force and torque exerted by the f luid are found by integrating the stress tensor over the particle surface.[2] Electrical field E is defined by E=∇. V where V is the voltage potential (∇ is the gradient ope r a to r) , solu t ion of a Lapla ce’s equ a t ion fo r electrostatics. Electric displacement D is defined by D=εE where ε is the absolute permittivity (the par ticle is supposed to be totally insulating so absolute permittivity of the medium is taken eighty times higher than absolute permittivity of the particle).
Computation of physical voltage pulses: The total energy W(t) [J] is given by integrating the energy density on the domain as follows : W(t) = ∫Ω(1/2)ε||E||2.For a small time interval ∆t = t2-t1, the instantaneous power P [J/s] in the system is defined by
p = ΔW
ΔtOn the other hand, the instantaneous electrical power P is given by P(t) = U(t).I(t) where U(t) [V] is the voltage dropt and I(t) [A] the current in the system (In our case, the current I(t) is maintained constant thanks to a constant current generator, so I(t) = I for each time t. Then, the physical voltage pulse Up is computed for each time t in the interval [t1, t2] by
Up(t) = W(t2) − W(t1)
(Δt). Iwhere t =
t1 + t2
2
Equivalent electrical model for the orifice-electrode system and for an RBC-type cell:In practice, voltage pulses Um measured by the electronic card have twice lower amplitude than physical pulses Up, par t icularly owing to polar izat ion resistance and temperature compensation. To model and compute mathematically the measured voltage pulses, the idea consists in developing an equivalent electrical model for the system and switch ing between temporal and frequential spaces by Fourier transform in order to filter pulses by t ransfer function H of the system. More precisely, in the first step, we sample physical pulse Up(t) and compute its spectrum F(Up)=F(Up)(ν) by Discrete
Fourier Transform. Then, we multiply F(Up) (ν) by the transfer function of the sensor H(ν) and we finally recover measured voltage pulse Um by Inverse Discrete Fourier Transform such as
Um(t) = F-1[H(ν).F(Up)(ν)](t).
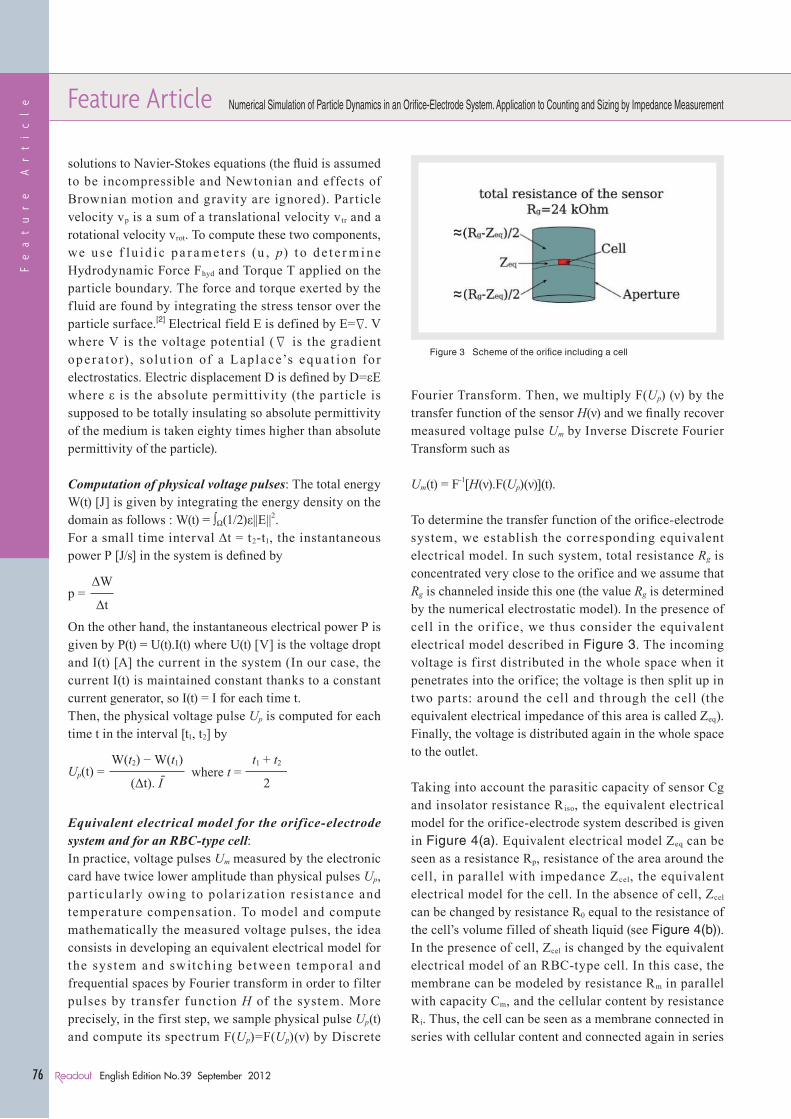
To determine the transfer function of the orifice-electrode system, we establish the corresponding equivalent electrical model. In such system, total resistance Rg is concentrated very close to the orifice and we assume that Rg is channeled inside this one (the value Rg is determined by the numerical electrostatic model). In the presence of cell in the orif ice, we thus consider the equivalent electrical model described in Figure 3. The incoming voltage is first distributed in the whole space when it penetrates into the orifice; the voltage is then split up in two par ts: around the cell and through the cell (the equivalent electrical impedance of this area is called Zeq). Finally, the voltage is distributed again in the whole space to the outlet.
Taking into account the parasitic capacity of sensor Cg and insolator resistance Riso, the equivalent electrical model for the orifice-electrode system described is given in Figure 4(a). Equivalent electrical model Zeq can be seen as a resistance Rp, resistance of the area around the cell, in parallel with impedance Zcel, the equivalent electrical model for the cell. In the absence of cell, Zcel can be changed by resistance R0 equal to the resistance of the cell’s volume filled of sheath liquid (see Figure 4(b)). In the presence of cell, Zcel is changed by the equivalent electrical model of an RBC-type cell. In this case, the membrane can be modeled by resistance Rm in parallel with capacity Cm, and the cellular content by resistance Ri. Thus, the cell can be seen as a membrane connected in series with cellular content and connected again in series
≈
≈
Figure 3 Scheme of the orifice including a cell

Feature Article Numerical Simulation of Particle Dynamics in an Orifice-Electrode System. Application to Counting and Sizing by Impedance Measurement
Technical Reports
77English Edition No.39 September 2012
with opposed membrane (see Figure 4(b)). So, the two transfer functions (with or without cell in the system) are then given by the following expressions:
Hcell (ν) = 2RmRp + RiRp(1 + 2πνCmRmJ)
2Rm + (Ri + Rp) (1 + 2πνCmRmJ)
and Hno cell (ν) = RoRp
(Ro + Rp)
Computation of Measured Voltage Pulses
Thanks to the above mentioned numerical method, we can exactly compute measured voltage pulses obtained with an orif ice-electrode system. We consider two
particles passing through the micro-aperture along velocity streamlines S1 and S2 described in Figure 2(a). In Figure 5(a), we expose physical (raw) voltage density Up a long a st reamline computed by mult iphysics numerical simulation (flow model, particle transport and electrostatic). The blue pulse refers to a particle passing at the center of the micro-aperture and the red pulse to a particle passing close to the edges. Figure 5(b) shows spectral magnitude F(Up) of these two physical pulses. The spectral magnitude referring to cells passing close the edges is non-null for high frequency. This highlights fast intensity changes in physical pulses due to electrical field peaks at the edges of the gate. The use of band pass filter in the electronic card should smooth the magnitude fo r h ig h f r e que nc ie s . Figure 5(c) ex p ose s t he corresponding measured filtered voltage pulses.
(b)
Zcel
(a)
Figure 4 Equivalent electrical model for (a) the general orifice-electrode system; (b) the resistance Zeq
Physical voltage pulses Spectrum of physical signals Measured voltage pulses
(a) (b) (c)
time [ms]1 1.1 1.2 1.3 1.4 0
2
4
3.5
3
2.5
2
1.5
1
0.5
0
1
0100 200 300 400 0.9 1 1.1 1.2 1.3
time [ms]Frequency [kHz]
Vol
tage
den
sity
Mag
nitu
de o
f the
spe
ctru
m
Vol
tage
[mV
]
UpF(Up)
Um = F-1[H·F(Up)]
Figure 5 (a) physical voltage pulses (viewed by a particle along a streamline); (b) the spectrum of the two physical voltage pulses; (c) measured voltage pulses (after electronic amplification).

Fe
at
ur
e
Ar
ti
cl
e
78 English Edition No.39 September 2012
Feature Article Numerical Simulation of Particle Dynamics in an Orifice-Electrode System. Application to Counting and Sizing by Impedance Measurement
Effect of Size, Trajectory and Particle Orientation on Voltage Pulses
The numerical method presented in the previous section is used to numerically solve the problem of counting and sizing particles in an orifice-electrode system. The results below quantify the effect of the trajectory, orientation and dimensions of the particle on measured voltage pulse and on particle size distribution.
Effect of particle size: We have seen that the impedance measurement allows to determine the size of the particle. We first simulate the direct effect of particle size on generated voltage pulses. We consider an experimental micro-aperture with an aspect ratio D0/L=0.4. Mean velocity through the orifice is around 7.6 m/s and voltage at the anode is fixed to 6 V. Radius R of the particle is fixed to 1 µm. Size parameter is nR (0.5, 1, 2 and 4 µm). In Figure 6 , we display elect r ical voltage pulses
corresponding to 4 particles with different nR. Clearly, we see that the bigger the particle, the higher the peak of the resulting voltage pulse. More precisely, the maximum level of voltage pulses is linearly correlated to size parameter nR and particle size can be directly determined by using a peak detection algorithm for the voltage pulse.
Effect of particle trajectory: Here, we study the effect of par t icle t rajector ies on result ing voltage pulses. Dimensions of the orifice are L=65 µm and D0=50 µm. Mean velocity through the orifice is around 4.25 m/s and voltage is fixed to 7.6 V. Radius R of the particle is fixed to 2.5 µm and nR=2.15 µm. The trajectory, and the resulting voltage pulse, of the particle are computed for a particle passing at the center of the orifice and a particle passing close to the edges of the orifice (see Figure 2(a) for cor responding velocity st reamlines S1 and S2). Figure 7(a) shows two voltage pulses corresponding to particles passing through the orif ice along velocity streamlines S1 and S2. Along the central axis of the orifice (streamline S1), the generated voltage pulse is of the Gaussian type. In this case, peak detection is quite easy and the size of the particle can be precisely determined. On the other hand, a particle passing close to the edges of the orifice (streamline S2) is submitted to high electrical values and the resulting voltage pulse has a distorted shape on its apex. This produces erroneous peak values and computat ion of par t icle sizes produces false estimations (until 8% of the maximum of voltage pulse depending on electronic configuration). Figure 7(b) exposes series of experimental voltage pulses obtained with an or if ice-elect rode prototype developed by HORIBA Medical. It is interesting to see that the two types of voltage pulses are experimentally obtained. For identical configurations, amplitude of pulses obtained numerically is similar to the experimental case.
(a) (b)
Figure 7 (a) Numerical voltage pulses for two different particle trajectories; (b) Series of experimental pulses.
Figure 6 Voltage pulses generated by 4 particles with different size.

Feature Article Numerical Simulation of Particle Dynamics in an Orifice-Electrode System. Application to Counting and Sizing by Impedance Measurement
Technical Reports
79English Edition No.39 September 2012
Effect of particle orientation: To quantify the effect of particle orientation on voltage pulses (and therefore on particle size measurement), we force a particle to pass through the orifice with a fixed orientation of θ=90° first, and with a fixed orientation θ=0° secondly. We consider an experimental micro-aperture with an aspect ratio D0/L=0.4. Radius R of the particle is fixed to 1 µm and nR=1 µm. Results show that, in this mechanical and f luidic configurations, the particle passing perpendicular to the flow (θ=0°) generates a voltage pulse 33% higher than a particle passing parallel to the f low (θ=90°). Voltage pulses are exposed in Figure 8 . Cont rol l ing th is phenomenon allows to avoid erroneous size measurement due to particle orientation through the orifice.
Statistic Particle Size Distribution: Role of Hydrodynamic Focusing
Given the previous results, we can compute the size of particles immerged in a liquid suspension. Dimensions of the orifice are L=65 µm and D0=50 µm. Mean velocity is approximately 4.25 m/s and voltage is fixed to 7.6 V. We consider a sample f low containing same spher ical particles of radius equal to 2 µm (to take into account manufacturing tolerances for simulation, we consider random radius to be comprised between R-є and R+є for a small є << 1 µm). The mean volume of the particle is 113 µm3. For each particle, we compute transport through the orifice and detect the peak of generated voltage pulse. Finally, we can construct statistic particle size distribution of the total sample. Here, we study and compare particle size distribution for two f luidic configurations: 1) the classical case where particle sample is evenly distributed in the whole micro-aper ture; 2) the hydrodynamic focusing case where sample rate inside the micro-aperture is controlled by a sheath flow in order to direct the particle sample f low through the gate along the central axis. We will see that, due to inhomogeneous electric field and particle trajectory, computation of the mean size is more
precise when we use a hydrodynamic focusing for the sample.
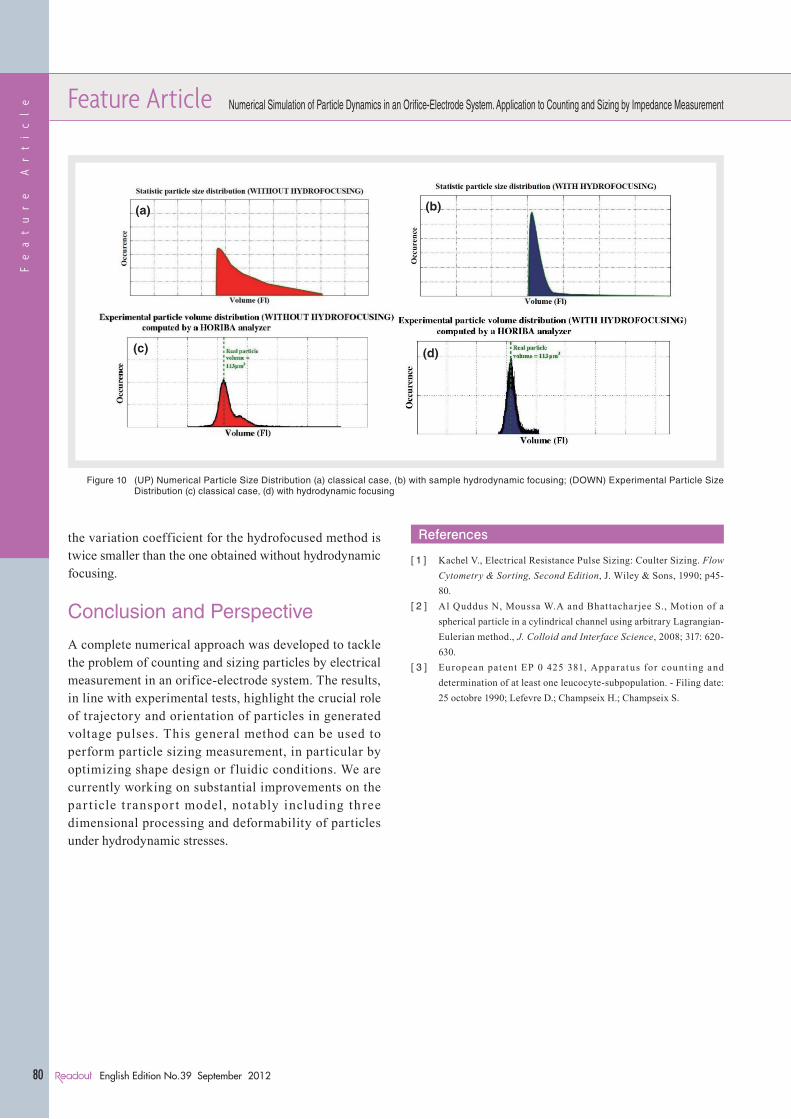
The classical case: Historically, counting and sizing of biological particles in an orifice-electrode system is done for sample evenly distributed in the system. It means that the sample is present in the whole orifice and the part passing close to the edges is subject to strong electric field variations as we said. Thus, as we can see in Figure 10(a), numerical particle size distribution is a right-skewed distribution (the mass of the distribution is concentrated on the left and the right tail is longer). So, due to edge effect, the base of the size distribution is abnormally wide around the real particle size and mean particle size value can be distorted. In Figure 10(c), we expose experimental size distribution obtained for the same configuration. In practice, we also observe a distortion due to statistical doublets. Thus, numerical distribution shape is close to the experimental distribution shape.
Improvement by sample hydrodynamic focusing: To increase resolution of particle sizing measurement by electrical gating, a sample hydrodynamic focusing can be integrated in the orifice-electrode system (see HORIBA Medical patent[3]). More precisely, the sample rate inside the orifice is controlled by a sheath flow in order to direct the sample flow along the central axis of the orifice.This allows to avoid peaks of electrical field due to edge effects. Figure 9 shows sample concentration with hydrodynamic focusing and its distribution in the orifice. Figure 10(b) exposes particle size distribution in the case of sample hydrodynamic focusing. In Figure 10(d), we expose experimental size distribution obtained for the same configuration. Contrary to the classical case, this distribution tends to be a centered Gaussian distribution, and computation of mean particle size value is more precise.Mo r e p r e c i s e ly, i f we c om p a r e nu me r ic a l a nd experimental statistical distributions for the two cases, we estimate that hydrofocused f low chamber is twice more accurate than in non-hydrofocused method. In particular,
Figure 9 Hydrofocused sample transport.
Figure 8 Two voltage pulses generated by a particle with the same size but different orientations through the aperture.
Fe
at
ur
e
Ar
ti
cl
e
80 English Edition No.39 September 2012
Feature Article Numerical Simulation of Particle Dynamics in an Orifice-Electrode System. Application to Counting and Sizing by Impedance Measurement
the variation coefficient for the hydrofocused method is twice smaller than the one obtained without hydrodynamic focusing.
Conclusion and Perspective
A complete numerical approach was developed to tackle the problem of counting and sizing particles by electrical measurement in an orifice-electrode system. The results, in line with experimental tests, highlight the crucial role of trajectory and orientation of particles in generated voltage pulses. This general method can be used to perform particle sizing measurement, in particular by optimizing shape design or f luidic conditions. We are currently working on substantial improvements on the par t icle t ranspor t model, notably including th ree dimensional processing and deformability of particles under hydrodynamic stresses.
References
[ 1 ] Kachel V., Electrical Resistance Pulse Sizing: Coulter Sizing. Flow Cytometry & Sorting, Second Edition, J. Wiley & Sons, 1990; p45-80.
[ 2 ] Al Quddus N, Moussa W.A and Bhattacharjee S., Motion of a spherical particle in a cylindrical channel using arbitrary Lagrangian-Eulerian method., J. Colloid and Interface Science, 2008; 317: 620-630.
[ 3 ] European patent EP 0 425 381, Apparatus for count ing and determination of at least one leucocyte-subpopulation. - Filing date: 25 octobre 1990; Lefevre D.; Champseix H.; Champseix S.
(b)
(d)(c)
(a)
Figure 10 (UP) Numerical Particle Size Distribution (a) classical case, (b) with sample hydrodynamic focusing; (DOWN) Experimental Particle Size Distribution (c) classical case, (d) with hydrodynamic focusing
Feature Article Numerical Simulation of Particle Dynamics in an Orifi ce-Electrode System. Application to Counting and Sizing by Impedance Measurement
Technical Reports
81English Edition No.39 September 2012
Jean-Philippe GINEYSMeasurement System DesignerResearch Dept.HORIBA ABX SAS
Damien ISEBEScientifi c Computing EngineerResearch Dept.HORIBA ABX SAS