damaging effects of deicing chemicals on concrete materials
TRANSCRIPT

www.elsevier.com/locate/cemconcomp
Cement & Concrete Composites 28 (2006) 173–188
Damaging effects of deicing chemicals on concrete materials
Kejin Wang a,*, Daniel E. Nelsen a, Wilfrid A. Nixon b
a Iowa State University, 492 Town Engineering, Ames, IA 50011, USAb University of Iowa, 4121 Seamans Center, Iowa City, IA 52242, USA
Received 17 March 2005; accepted 21 July 2005Available online 2 November 2005
Abstract
The damaging impact of various deicing chemicals and exposure conditions on concrete materials was investigated. Five deicingchemicals (sodium chloride, calcium chloride with and without a corrosion inhibitor, potassium acetate, and an agricultural product)were studied. Freezing–thawing (F–T) and wetting–drying (W–D) exposure conditions were considered. Mass loss, scaling, compressivestrength, chemical penetration, and micro-structure of the paste and concrete subjected to these deicing chemicals and exposure condi-tions were evaluated. Results indicated that the various deicing chemicals penetrated at different rates into a given paste and concrete,resulting in different degrees of damage. Among the deicing chemicals tested, two calcium chloride solutions caused the most damage.Addition of a corrosion inhibitor into the calcium chloride solution delayed the onset of damage, but it did not reduce the ultimate dam-age. Chloride-related deicing chemicals often brought about leaching of calcium hydroxide, as well as chemical alterations in concrete.Potassium acetate caused minor scaling, associated with alkali carbonation of the surface layer of concrete. Although producing a con-siderable number of micro-pores on the surface of the samples, the agricultural deicing product resulted in the least chemical penetrationand scaling damage of paste and concrete.� 2005 Elsevier Ltd. All rights reserved.
Keywords: Deicing; Wetting–drying; Freezing–thawing; Mass loss; Scaling; Strength
1. Introduction
Deicing chemicals often exacerbate concrete damageoriginating from freezing and thawing (F–T). Besides creat-ing pressures through osmosis and crystallization, deicingchemicals generally increase the degree of concrete satura-tion and keep concrete pores at or near maximum fluidsaturation, thus increasing the risk of frost damage [1].The salts in deicing solutions also decrease the freezingpoint of concrete pore solution, leading to significanthydraulic pressure [2]. Because the salt concentration varieswith the distance from the exposed concrete surfaces,various amount of ice may form in different layers underthe concrete surface, resulting in deformation of the layersand generation of pressure between the layers. Freezing ofan upper layer (such as the surface layer, which often
0958-9465/$ - see front matter � 2005 Elsevier Ltd. All rights reserved.
doi:10.1016/j.cemconcomp.2005.07.006
* Corresponding author. Tel.: +1 515 294 2152; fax: +1 515 294 8216.E-mail address: [email protected] (K. Wang).
occurs at a low deicing chemical concentration) may pro-hibit escape of the supercooled liquids from the internallayers, thus developing considerable hydraulic pressure.Therefore, the combined effect of the hydraulic, osmoticand crystallization pressures below the surface lead toscaling of the concrete [3].
Aggravated damage may also be attributed to chemicalinteractions between deicing chemicals and concrete mate-rials. Chemical deterioration of the concrete may resultfrom leaching and decomposition of cement hydrationproducts [4–6], as well as accelerated concrete carbonation[7] and alkali–silica reaction (ASR) [8,9]. Research hasdemonstrated that salt substitutes or deicing salts with acorrosion inhibitor also interact with concrete materialsand lead to precipitate production [4,10]. It is believed thatconcrete deterioration due to deicing chemicals may beginwith physical reactions, which generate micro- and macro-cracks in concrete. Because the cracks make concrete morepermeable and more vulnerable to the ingress of deicing

174 K. Wang et al. / Cement & Concrete Composites 28 (2006) 173–188
chemical ions, chemical deterioration is then provoked [11].Generally, the combined effect of physical and chemicaldeterioration is more severe than that from the simplesum of individual reaction.
Despite an ongoing awareness on deicing chemical dam-age to concrete, the relative degree of damage from differ-ent deicing chemicals under different environmentalconditions is not thoroughly documented. The presentstudy was designed to investigate the damaging effects ofvarious deicing chemicals and exposure conditions oncement paste and concrete. It was anticipated that theinvestigation would also lead to a better understanding ofdamage mechanisms of deicing chemicals.
2. Experimental work
Five deicing chemicals, calcium chloride (CaCl2), cal-cium chloride with a corrosion inhibitor (CaCl2-inhib),sodium chloride (NaCl), potassium acetate (K Acetate),
Table 1Experimental regimen
Sample Chemical Exposure No. of samples
Paste(5-cm cube)
Distilled water W–D 15 for eachchemicalNaCl
CaCl2CaCl2-inhibK AcetateAgr-deicing
Distilled water F–T 12 for eachchemicalNaCl
CaCl2CaCl2-inhibK AcetateAgr-deicing
Concrete(10-cm cube)
Distilled water W–D 12 for eachchemicalNaCl
CaCl2CaCl2-inhibK AcetateAgr-deicing
Distilled water F–T 12 for eachchemicalNaCl
CaCl2CaCl2-inhibK AcetateAgr-deicing
Concrete (9-cmcube with ponding)
Distilled water W–D 3 for eachchemicalNaCl
CaCl2CaCl2-inhibK AcetateAgr-deicing
and an agricultural deicing product (Agr-deicing), andtwo exposure conditions, wetting–drying (W–D) and freez-ing–thawing (F–T) cycles, were considered in the presentstudy. Physical (mass loss and scaling), mechanical(strength), chemical (ion penetration and crystalline reac-tion products), and micro-structural properties of the pasteand concrete were evaluated. The experimental regimen ispresented in Table 1.
2.1. Concrete and deicing materials
Portland cement (PC), Type I/II, was used for bothpaste and concrete samples. Table 2 shows the chemicalcomposition of the cement. Air entraining agent (AEA)was used in both paste and concrete samples to obtain adesignated air content of 6%. The paste had a water-to-cement ratio (w/c) of 0.4. The concrete had 2.5 cm nominalmaximum aggregate size (NMSA) limestone (LS) and riversand with a fineness modulus of 2.83. Its mixture propor-
Testing time (cycles)
Weight loss Scaling Compressivestrength
10, 20, 30, 40, 50, 60, 130 20, 40, 60, 130 20, 40, 60, 130
5, 10, 15, 20, 25, 30, 35,40, 45, 50, 55, 60
20, 40, 60 20, 40, 60
10, 20, 30, 40, 50, 60 20, 40, 60 20, 40, 60
5, 10, 15, 20, 25, 30, 35,40, 45, 50, 55, 60
20, 40, 60 20, 40, 60
Ion penetration XRD SEM/EDX
20, 60 20, 60 60

Table 2Chemical compositions of Type I/II cement
Chemical compounds %
CaO 62.32SiO2 20.75Al2O3 4.49Fe2O3 3.45MgO 2.88K2O 0.67Na2O 0.09(Na2O)eq
a 0.53SO3 2.74TiO2 0.34P2O5 0.10LOI 0.10
C3S 53.09C2S 19.44C3A 6.04C4AF 10.50
a (Na2O)eq = Na2O + 0.658K2O.
Table 4Concentrations of deicing solutions employed
Chemical Concentration (% solid, by weight)
For W–D exposure For F–T exposure
NaCl 26.5 13.3CaCl2 37.9 9.5CaCl2-inhib 39.9 10.0K Acetate 54.5 13.6Agr-deicing Not
availableDiluted(chemical:water = 1:3)
K. Wang et al. / Cement & Concrete Composites 28 (2006) 173–188 175
tion was 0.48 (water):1.00 (PC):2.17 (sand):2.76 (LS). Thehigh w/c (0.48) was used to achieve scaling damage oftested samples in a relative short time period.
The five deicing chemicals, CaCl2, CaCl2-inhib, NaCl, KAcetate, and Agr-deicing, were directly received fromsuppliers. NaCl and CaCl2 deicing chemicals were selectedbecause of their wide applications. CaCl2-inhib deicingchemical was employed to evaluate the damaging effect ofinhibitor on concrete. The corrosion inhibitor (tetraetha-nolamine (TEA), approximately 2000 ppm) was pre-mixedin the CaCl2 solution. K Acetate is a more expensive alter-native to chloride deicing chemical. It is commonly used atairfield facilities, where its lower corrosiveness makes iteconomical to the more damaging chlorides. The K Acetateused was a 50% (by weight) aqueous potassium acetatesolution with less than 1% silicate phosphate-based corro-sion inhibitor. The Agr-deicing chemical is an organicproduct derived from an agricultural by-product that has
Table 3Chemical compositions of the agricultural deicing chemical
% By weight
Component groups
Dissolved solids 74.84Ash 22.81Crude protein 19.44Nitrogen compounds (as N) 3.11Alpha-amino nitrogen compounds 0.41
Major compounds
Sucrose 13.13Raffinose 3.96Betaine 8.95Potassium 8.85Sodium 1.98Chloride 1.83Sulfate 2.10Pyrrolidone carboxylic acid 6.29
recently become available on the commercial market. Thechemical components of the Agr-deicing product can befound in Table 3. It looks more like a gelatinous paste thana solution. The pH value of the Agr-deicing product was7.8.
Table 4 shows the concentrations of the deicing solu-tions used in the present study. The chemical concentra-tions for W–D exposure were directly measured from thechemicals received. Use of the different concentrationswas primarily due to the consideration that users generallyapply the deicing chemicals received from suppliers directlyto concrete pavements. These chemical concentrations werehigh, and they could also maximize the potential chemicalinteraction between deicing chemical and paste or concrete.Diluted deicing chemical solutions were used in F–T expo-sures so that paste and concrete samples would freezeunder the designed F–T condition.
2.2. Samples and test methods
2.2.1. General samples and exposure conditions
Fifteen paste samples and 12 concrete samples wereprepared for each exposure condition (one deicing chemicalunder a given exposure condition). The paste samples had asize of 5 · 5 · 5 cm, and the concrete samples had a size of10 · 10 · 10 cm.
After 7 days of a standard curing (ASTM C192), thesamples were subjected to deicing solutions in plasticcontainers. For W–D exposure, samples were immersedin distilled water or a deicing solution in a container andstored in a refrigerator at 4.4 ± 1.5 �C for 15 h. Then, thesamples were taken out of the container and laid on apaper towel to dry in air (approximately 23 �C and 50%RH) for 9 h. Thus, one W–D cycle took a total of 24 h.
For F–T cycling, samples were immersed in water or adeicing solution in a container and stored in a freezer at�20 ± 1.0 �C for 15 h. Then, the samples were takenout of the container to be thawed for 9 h. To facilitatethawing, the containers, together with the frozen samplesand deicing solutions, were placed in a larger tub filledwith warm water so that the frozen solutions were com-pletely thawed within 4 h. The samples then remained inthe water before being frozen again. One F–T cycle alsotook a total of 24–15 h in a frozen state and 9 h in athawed state.

176 K. Wang et al. / Cement & Concrete Composites 28 (2006) 173–188
The deicing solutions in the containers were changedevery 10 cycles for F–T samples, and every 20 cycles forW–D samples.
2.2.2. Mass change, scaling damage and compressive
strength test methodsAt every five cycles, the F–T specimens were removed
and at every 10 cycles the W–D specimens were takenout of the container for mass measurement. First, the spec-imens were placed in a static tub of tap water and looseparticles on the samples were removed gently by hand.Next, the specimens were laid on a paper towel to dryand, if the sample was not too friable, blotted with papertowels. Samples were rotated periodically to facilitate evendrying of all faces. After 20–25 min of drying, samples wereweighed to the nearest hundredth of a gram.
At every 20 W–D or F–T cycles, four paste and fourconcrete samples were removed from deicing solutionsfor scaling evaluations, and three paste and three concretesamples were used for compressive strength tests. Scalingdamages were evaluated by the visual rating of the samplesurface conditions based on Table 5. Compression tests onboth paste and concrete samples were conducted accordingto ASTM C 109.
2.2.3. XRD and SEM samples and tests
Another set of concrete samples, two for each deicingchemical, was prepared for the ion penetration, X-raydiffraction (XRD) and scanning electron microscope(SEM) tests. Cubic plastic molds with a dimension of9 · 9 · 10 cm were used for casting 9-cm3 samples, thusleaving a space of 1 cm at the top of each sample as a pondfor the deicing solution. After the samples were cured in astandard curing room (ASTM C192) for 7 days, a marinesealant was applied to the edge of the sample surface soas to restrict chemical access from the sides. After 48 h dry-ing of the marine sealant, deicing solutions were pouredonto the sample surfaces (into the pond) to a depth ofapproximately 0.8 cm. The samples were then subjectedto W–D cycling. For one W–D cycle, the samples (togetherwith the deicing solution in the pond) were stored in arefrigerator (4.4 ± 1.5 �C) for 15 h. Then, the samples were
Table 5Visual rating of scaling damage
Rating Description
0 No scaling1 Slight scaling (small flakes, 61 cm2, visible on
sample surface)2 Slight to moderate scaling (large flakes visible on
sample surface and sample edge damage noticeable)3 Moderate scaling (sample edge damage and some
coarse aggregate visible)4 Moderate to severe scaling5 Severe scaling (chunks coming out of surfaces and
edges, scaling depth >0.3 cm, and coarse aggregatevisible over entire surface)
taken out of the refrigerator, the deicing solutions werepoured off, and the samples were dried in air (approxi-mately 23 �C and 50% R.H.) for 9 h.
At 20 and 60 W–D cycles, seven powder samples weretaken using a hand drill from seven uniform layers, witha total depth of 3.5 cm from the sample surface, of eachconcrete sample. The powder samples were passed througha #50 sieve and then used for ion penetration tests (IPT).Free sodium (Na) and potassium (K) ion concentrationsin the samples were estimated by a soluble cation exchangemethod. In this method, 1 M NH4OAc was used as anextraction solution. An atomic adsorption/emission spec-trometer was used, by emission, to determine the sodiumand potassium ion concentration [12]. Free chloride (Cl)concentration was measured by the saturated mercury(II)thiocyanate, Hg(SCN)2, extraction method [13]. In thismethod, 0.01 M Ca(NO3)2 Æ 4H2O, together with ferric(III)nitrate nonahydrate, was used as the extraction solution.Chloride ions displace thiocyanate, in the presence of ferriciron, to form a highly colored ferric thiocyanate complex.Chloride concentration in the extract was determined bycomparing with standard chloride working solutions, usinga silver nitrate solution as an indicator.
Another powder sample was also taken from the surfacelayer (within 0.5 cm from the surface) of each concretesample and used for XRD analysis. Siemens D500 diffrac-tometer, with CuKa radiation, 50 kV, and 27 mA, wasemployed. The goniometer ran from 5� to 70� at a speedof 0.5 deg/min. The XRD patterns/spectrums were ana-lyzed with MDI JADE 6.5 software.
SEM imaging, together with energy dispersive X-ray(EDX) analysis, was performed on the concrete samples at60 W–D cycles. A small section, 1.20 · 1.20 · 0.75 cm(w · l · d), was cut from the corner of each concrete sampleand its interior surface was polished gently with a siliconcarbide grinding without any lubricating solution. Thesepolished samples were then examined under the JEOLJSM-840A SEMat a voltage of 20 kV. It was noted that pre-cipitation and cracks might be induced during the samplepreparation. The discussions in the paper (Section 3.1.6)were made under the condition that all samples were pre-pared with minimum polishing under the same condition.
3. Results and discussion
3.1. W–D cycling
3.1.1. Mass change
Fig. 1 presents the mass changes of paste and con-crete samples subjected to different deicing solutions underW–D cycling. As observed in Fig. 1a, paste samplesimmersed in water and NaCl deicing solution experienceda slow and steady mass gain with time, while samplesexposed to other chemicals displayed a different degree ofmass loss. The mass gain of the paste and concreteimmersed in water and other deicing chemicals has beenreported by other researchers [14]. The authors considered

-8
-6
-4
-2
0
2
4
0 20 40 60 80 100 120 140
Wetting-Drying Exposure, cycles
Mas
s C
hang
e ("
-" m
ass
loss
), %
Dist. H2O CaCl
2 CaCl
2 -inhib
NaCl K. Acetate Agr-deicing
-8
-6
-4
-2
0
2
4
0 10 20 30 40 50 60 70
Wetting-Drying Exposure, cycles
Mas
s C
hang
e ("
-" m
ass
loss
), %
Dist. H2O CaCl
2 CaCl
2 -inhib
NaCl K. Acetate Agr-deicing
(b)
(a)
Fig. 1. Mass change of samples under W–D cycling: (a) paste and(b) concrete.
0
1
2
3
4
5
NaCl CaCl2 CaCl2-inhib.
KAcetate
Agr-deicing
Sca
ling
Rat
ing
20 W-D 40 W-D 60 W-D 130 W-D
(a)
(b)
0
1
2
3
4
5
Distilledwater
Distilledwater
NaCl CaCl2 CaCl2-inhib.
K Acetate Agr-deicing
Sca
ling
Rat
ing
20 W-D 40 W-D 60 W-D
Fig. 2. Scaling rating of samples under W–D cycling: (a) paste and (b)concrete. Notes: The scale rating ranged from 0 to 5, with 0 for no scalingand 5 for severe scaling (Table 5); each datum in the figure represents theaverage value of four samples; the empty bar spaces indicate the scalerating of 0.
K. Wang et al. / Cement & Concrete Composites 28 (2006) 173–188 177
that such a mass gain was closely related to the cementhydration and concrete micro-structure change with time.In the present study, a short curing time (7 days) wasselected to intensify deicing damage of tested samples soas to differentiate the degrees of damage from differentdeicing chemicals. Due to this short curing time, cementin paste and concrete would continue to hydrate whenthe samples were immersed in water or deicing solutions.The continuous cement hydration consumed pore fluid,leaving the samples in an unsaturated state. It also pro-duced more C–S–H, which had a large surface area toadsorb water. The samples therefore continued to gainmass until maximum saturation was reached. This mecha-nism accounted for the steady mass gain observed in thesamples exposed to water throughout the testing period.Mass gain of the samples exposed to deicing chemical solu-tions could also result from salt precipitation on samplesurfaces and in pore spaces. White precipitates observedon exterior surfaces of the NaCl-immersed samples at 60W–D cycles were responsible for partial mass gain of thesample.
In contrast to the water and NaCl-immersed samples, KAcetate-immersed samples displayed a steady mass lost at aslow rate, approximately 1.25% at 130 W–D cycles. CaCl2-
immersed and CaCl2-inhib-immersed samples exhibited arapid mass loss in the early W–D period (within 20 cycles).After 20 W–D cycles, the rates of mass loss in both CaCl2-immersed and CaCl2-inhib-immersed samples were signifi-cantly reduced. After 60 cycles, the rates of mass lossbecame negative although moderate scaling was observed(Fig. 2a). Due to the scaling, the volume of the samplesreduced, and thus the negative rates of mass loss indicatedthat the samples with scaling damage actually gained mass.The authors believed that such mass changes in thesesamples were associated with the scaling development.Scaling damage could influence paste/concrete masschange in two different ways: (1) mass loss might occur ifmaterials were fallen off from the body of the paste/con-crete; and (2) mass gain might take place if additional freesurfaces (such as cracks) generated in the paste/concretewithout significant loss of concrete materials. The free sur-faces would adsorb more fluid from the solution, thusincreasing sample mass. It was noticed that the mass lossof the CaCl2-inhib-immersed samples was more negativethan that of the CaCl2-immersed samples. This suggestedthat more free surfaces might exist in the CaCl2-inhib-immersed samples.
Among all deicing chemicals tested, the Agr-deicingchemical provided its pastes with the highest initial massloss, 2.2% in the first 10 W–D cycles. The mass loss contin-ued until 30 W–D cycles. After 30 W–D cycles, the samplemass loss became steady. The Agr-deicing chemical con-tained over 32% of sweet or acid substances (sucrose, raffi-nose, betaine, and pyrrolidone carboxylic acid), 8.85%potassium, 1.98% sodium, 1.83% chloride and 2.01% sul-

178 K. Wang et al. / Cement & Concrete Composites 28 (2006) 173–188
fate (Table 3) and had a pH value of 7.8. The mass losses ofthe samples were presumed due to the organic and/or acidattack of the chemical on cementitious materials. As shownlater, a considerable amount of micro-pores was observedon the sample surface, which corresponded to the samplemass loss.
Fig. 1b illustrates mass changes of concrete samplessubjected to different deicing solutions under W–D cycling.As observed in this figure, samples immersed in water, KAcetate, and NaCl solutions exhibited very limited masschange. This implied that the mass changes in pastes weresignificantly decreased by addition of aggregate into thesystem. Aggregate could assist concrete to gain mass intwo ways: (1) imbibing fluid from the solutions, and (2)resisting drying shrinkage of paste, and therefore reducingconcrete cracking and scaling. As a result, unlike pastesamples, both CaCl2- and CaCl2-inhib-immersed concretesamples gained a relatively large amount of mass underW–D cycling. Samples immersed in the CaCl2-inhib solu-tion gained more mass than the samples in the CaCl2solution. Concrete samples immersed in the Agr-deicingchemical were the only ones that lost mass significantlyunder W–D cycling. The mass loss reached an asymptoticmaximum of about 2% mass loss at 20 W–D cycles, andit remained thereafter.
3.1.2. Scaling
Fig. 2 presents the average visual scale ratings of pasteand concrete samples (four in a group) subjected to differ-ent deicing chemicals under W–D cycling. The mechanismsof concrete scaling as well as the deicing chemical effectshave been briefly discussed at the beginning of the paper.
Fig. 2a illustrates that paste samples submerged indistilled water and NaCl deicing solution showed no scal-ing damage (scale rating = 0) throughout the entire tests(up to 130 W–D cycles). Paste samples submerged in KAcetate deicing solutions displayed minor damage (scalerating = 1.0) after 60 W–D cycles. Samples immersed inthe Agr-deicing solution had a constant scaling value of1.0 from 20 to 130 cycles due to the micro-pores observedon the sample surfaces (Fig. 3). Samples immersed in CaCl2
Fig. 3. Micro-pores on a Geomelt immersed sample (paste, 60 W–Dcycles).
and CaCl2-inhib solutions demonstrated increasing scalingwith W–D cycles.
Compared with paste samples, concrete samples(Fig. 2b) immersed in CaCl2 and CaCl2-inhib solutions dis-played less scaling damage. This was probably becauseconcrete generally had a small volume percentage of pasteto react with deicing chemicals. However, the Agr-deicing-immersed samples exhibited a constant scale rating due toexistence of micro-pores. These micro-pores were observed,as shown in Fig. 3, on the surfaces of all Agr-deicing-immersed samples (paste and concrete under W–D andF–T cycling).
3.1.3. StrengthFig. 4 presents compressive strength of paste and con-
crete samples under W–D cycling. Generally, the strengthloss was associated with the scaling damage of the samples(such as that of CaCl2- and CaCl2-inhib-immersed sam-ples), but some mild scaling did not always cause pasteor concrete strength loss (such as K Acetate- and Agr-deic-ing-immersed samples).
As observed in Fig. 4a, the water-immersed pastesamples increased strength with the exposure time due tocontinuous cement hydration. Paste samples exposed toall deicing solutions showed comparable strength to thewater-immersed sample at 20 W–D cycles, but they allexhibited strength loss thereafter. The strength loss of thepaste samples at 60 W–D cycles, from the highest to thelowest, was CaCl2-inhib, CaCl2, NaCl, Agr-deicing andK Acetate-immersed samples.
Fig. 4b illustrates that all concrete samples had muchlower strength than the corresponding paste samples.This was partially due to the higher w/c used (0.48 for
Fig. 4. Compressive strength of samples under W–D cycling: (a) paste and(b) concrete.

K. Wang et al. / Cement & Concrete Composites 28 (2006) 173–188 179
concrete and 0.4 for paste). However, under W–D cycling,no significant changes in concrete strength with exposuretime occurred in any of the tested samples. Although hav-ing moderate scaling damage, the CaCl2-immersed andCaCl2-inhib-immersed samples had less than 10% strengthloss when compared with the water-immersed samples. Itinferred that the scaling damage only influenced the surfaceconcrete, where cement content was high, and it had littleeffect on the body concrete property (such as strength).The negative effect of surface scaling might also be offsetby the accelerated cement hydration in the chloride-relatedsolutions.
3.1.4. Ion penetrationAggressive chemical ion concentrations (such as chlo-
ride, sodium, and potassium ions) of samples exposed todistilled water and deicing chemicals under 20 and 60 W–D cycling were evaluated. The rate and depth of the chem-ical ion penetration were presumably related to the degreeof concrete damage resulting from the reaction between thedeicing chemical and concrete materials. Fig. 5 illustrates
20 W-D
60 W-D
0
20
40
60
80
100
0 10 20 30 40Depth from surface, mm
Cl-i
on c
once
ntra
tion,
ppm
(a)
20 W-D
60 W-D
0
20
40
60
80
100
0 10 20 30 40Depth from surface, mm
Cl-i
on c
once
ntra
tion,
ppm
(c) (d
20 W-D
60W-D
0
10000
20000
30000
40000
0 10 20 30 40
Depth from surface, mm
K-io
n co
ncen
trat
ion,
ppm
(e)
Fig. 5. Ion penetration in concrete samples: (a) chloride ions in CaCl2 samples,(d) sodium ions in NaCl samples, (e) potassium ions in K Acetate samples an
ion concentration profiles of some concrete samples underW–D cycling. Generally, for all samples immersed in deic-ing solutions, ion concentrations decreased with sampledepth and increased with exposure time. However, ionconcentrations of the water-immersed sample had a smallvariation with the sample depth and exposure time. Theaverage chloride (Cl�), sodium (Na+), and potassium(K+) ion concentrations within the layer 3.5 cm from thesurface of the water-immersed concrete sample subjected to60 W–D cycles were approximately 7, 580 and 490 ppm,respectively. These results were used as a reference to thesamples immersed in deicing chemicals.
Fig. 5a and b shows chloride ion concentrations intwo calcium chloride-related samples (without and withcorrosion inhibitor). It was observed that at 20 W–Dcycles, the chloride ion concentration in the CaCl2-inhib-immersed sample was slightly lower than that in theCaCl2-immersed sample at a given depth, especially inthe near-surface layers. At 60 W–D cycles, chloride ionconcentrations in both CaCl2-immersed and CaCl2-inhib-immersed samples appeared almost the same at a given
20 W-D
60 W-D
0
20
40
60
80
100
0 10 20 30 40
Depth from surface, mm
Cl-i
on c
once
ntra
tion,
ppm
(b)
20 W-D
60 W-D
0
2000
4000
6000
8000
0 10 20 30 40Depth from surface, mm
Na-
ion
conc
entr
atio
n, p
pm
)
9851173
K, 2770
168200
Na, 660
4.8 5.6Cl, 12.50
1000
2000
3000
0 10 20Depth from Surface, mm
Ion
Con
cent
ratio
n, p
pm
(f)
(b) chloride ions in CaCl2-inhib samples, (c) chloride ions in NaCl samples,d (f) ions in the 20 W–D Agr-deicing sample.

180 K. Wang et al. / Cement & Concrete Composites 28 (2006) 173–188
depth, and they were all higher than those in the samples at20 W–D cycles. This observation indicated that the rate ofthe chloride penetration in the CaCl2-inhib-immersed sam-ples increased more rapidly than that in the CaCl2-immersed samples with W–D cycles. At a depth greaterthan 2.6 cm, only a small alteration was observed in thetested samples. This result was consistent with some previ-ous research [4]. However, at the maximum sampling depth(average 3.1 cm), chloride concentrations in the CaCl2-immersed samples were still five times that in water-immersed sample at 60 W–D cycles. This implied that thechloride ions penetrated much deeper than the depthtested, and they might damage concrete or reinforcing steelat a greater depth.
Fig. 5c illustrates that at 20 W–D cycles, chloride ionconcentration of the NaCl-immersed sample was similarto that of the CaCl2-inhib-immersed sample (Fig. 5b). At60 W–D cycles, chloride ion concentration of the NaCl-immersed sample was lower than that of the two CaCl2-related samples, and the rate of ion penetration decreasedlinearly with sample depth. At a depth of 3.1 cm, the chlo-ride concentration was 14 ppm for the NaCl-immersedsample at 60 W–D cycles, while it was 34 ppm for theCaCl2-related samples. As a result, the damage due to chlo-ride in the NaCl deicing chemical to concrete materials waslimited when compared with the chloride damage causedby the CaCl2 and CaCl2-inhib deicing chemicals.
It was noted that sodium concentration of the NaCl-immersed sample (Fig. 5d) was also high, especially inthe near-surface layer of concrete (over 5000 and7000 ppm at 20 and 60 W–D cycles, respectively). Never-theless, it dropped considerably with sample depth. At adepth of 2.6 cm, sodium concentrations of the samples at20 and 60 W–D cycles were almost the same, all close tothat in the water-immersed sample (580 ppm). This impliedthat the NaCl deicing chemical might penetrate into theconcrete no more than 2.6 cm in depth. The limit penetra-tion depth of sodium and especially chloride ions from theNaCl deicing chemical might account for the low mass lossand low scale rating of this sample (Figs. 1 and 2). Basedon Berube et al. [15], the high sodium concentration inthe near-surface layer of the concrete might not causesevere ASR owing to a decreased OH� concentration inthis area.
Fig. 5e exhibits potassium profiles in the samplesexposed to K Acetate deicing chemical. The potassiumconcentrations were high in the surface layer (over30,000 ppm); but they dropped rapidly with the distancefrom the concrete surface. At a depth of 3.1 cm, potassiumconcentrations were only 1190 ppm and 2800 ppm for thesamples subjected to 20 and 60 W–D cycles, respectively.Previous research suggested that due to its small hydratedradius, potassium might produce less expansion in ASRor be less destructive to concrete than sodium [16]. Alsobecause the high potassium concentration decreased rap-idly with depth, the reaction between the K Acetate deicingchemical and paste or concrete might occur only on sur-
face. As a result, only minor scaling damage (scale rat-ing 6 1.0) was observed on the K Acetate-immersed pastesamples, and this scaling damage did not influence thepaste or concrete strength.
Fig. 5f displays the ion concentrations in the concretesample exposed to the Agr-deicing chemical at 60 W–Dcycles. At the depth of 0.5 cm, potassium, sodium, andchloride ion concentrations of the sample were 2770, 660,and 12.5 ppm, respectively. At a depth of 1.2 cm, theseion concentrations were reduced more than half (approxi-mately 985, 168 and 5.6 ppm for potassium, sodium, andchloride ion concentrations, respectively). At a greaterdepth (>1.2 cm), these ion concentrations changed verylittle. This implied that the Agr-deicing chemical mightpenetrate only a very limited distance from the concretesurface. Because of the relatively low chemical ion concen-trations, together with their limited penetrations, theAgr-deicing chemical had little damaging effect on concreteintegrity and strength.
3.1.5. XRD analyses
Fig. 6 displays XRD patterns of concrete samplesimmersed in distilled water and various deicing solutionsat 60 W–D cycles. As expected, the crystalline phases ofthe water-immersed sample contained quartz, calcite andfeldspathic minerals from the fine aggregate (Fig. 6a).Although albite and anorthite were identified, the actualmineral phases might differ slightly. Feldspathic mineralstypically involved solid solution intermediate phases, e.g.like that between albite and anorthite. Hydration products,calcium hydroxide (CH) and ettringite, were also clearlyidentified. This XRD pattern (Fig. 6a) was used as a refer-ence for identifying possible leaching and new crystallinereaction products in the concrete exposed to deicingchemicals.
Fig. 6b exhibits the XRD pattern of CaCl2-immersedconcrete sample, which was similar to that of CaCl2-inhib-immersed sample. CH and ettringite peaks werehardly seen in this sample (subjected to 60 W–D cycles),neither in the sample subjected to 20 W–D cycles, whichmight correspond to leaching as identified in previous stud-ies [4,6,17]. Two new peaks were observed at 8.375 A(10.554�) and at 3.85 A (23.082�) in the sample subjectedto 60 W–D cycles. These peaks were found to match thetwo most intense peaks for a calcium aluminum chloridesulfate hydrate (Ca–Al–Cl–S hydrate) mineral: Ca8-Al4O12Cl2SO4 Æ 24H2O. The peaks were not found in the20 W–D samples, suggesting that the mineral alterationand chemical reactions between CaCl2 deicing solutionand concrete constituents needed sufficient time to takeplace. It was noted that the relative intensity of Ca–Al–Cl–S hydrate (compared with intensity of quartz) of theCaCl2-inhib-immersed sample appeared higher than thatof the CaCl2-immersed sample, indicating that more Ca–Al–Cl–S hydrate might form in the CaCl2-inhib-immersedsample. The leaching of CH and ettringite in the concreteand the reaction between the deicing chemical and concrete

Fig. 6. XRD pattern of concrete samples under 60 W–D cycling.
K. Wang et al. / Cement & Concrete Composites 28 (2006) 173–188 181
materials certainly accounted for the high scale ratings ofthe samples (Fig. 2).
Fig. 6c illustrates the XRD pattern of concrete exposedto NaCl deicing chemicals. CH peaks were identified in thissample, but its relative intensity to quartz peak intensitywas very small when compared with that in the water-immersed sample. This might be due to the relatively slowchloride penetration of this deicing chemical, whichreduced the severity of the chloride attack on cementhydration products. As a result, no significant scaling wasobserved in the NaCl-immersed sample under W–D cycling(Fig. 2). Although previous research has suggested thatconcrete subjected to all chloride solutions produced chlo-roaluminate [18], there was no new XRD peak identified in
the NaCl-immersed sample. Small halite (NaCl) peaks weredetected, associated with the small amount of precipita-tions observed in some voids of the sample.
Fig. 6d and e presents the XRD patterns of the KAcetate-immersed sample and the Agr-deicing-immersedsample, respectively. In contrast to the samples immersedin the chloride-related deicing chemicals, the K Acetate-immersed sample displayed clear CH peaks. Ettringitepeaks were not detected, probably due to alkali carbon-ation [19] (Section 3.1.6). No new peaks were detected inthe two non-chloride samples.
Although the micro-pores observed on the sample sur-faces, the Agr-deicing-immersed sample displayed bothettringite and CH peaks clearly. The XRD result inferred

182 K. Wang et al. / Cement & Concrete Composites 28 (2006) 173–188
that the micro-pores might result from the organic attackof the Agr-deicing chemical on concrete surface, ratherthan leaching of the cement and hydration materials inthe acid solution. Since the Agr-deicing chemical did notpenetrate very deep, this micro-pore damage might occur
Fig. 7. Element map of concrete exposed to CaCl2 deicing
only up to a certainly depth; thus not impairing the pasteand concrete integrity. Thus, the Agr-deicing-immersedsamples demonstrated little scaling and strength loss (Figs.2 and 4). Further research is needed to study the causes ofthe micro-pores.
chemical. Element mapping at (a) 25· and (b) 100·.
2 4 6Energy (keV)
0
50
100
150
200
250
Ca
O
NaMg
Al
Si
S
Cl
ClK
Ca
Ca
Fe
2 4 6Energy (keV)
0
100
200
300
400
Ca
ONa
MgAl
SiS
Cl
ClK
Ca
CaFe
(a)
(b)
Depth=7.5 mm
Solid line: depth=3.6 mm
Dashed line: depth=2.5mm
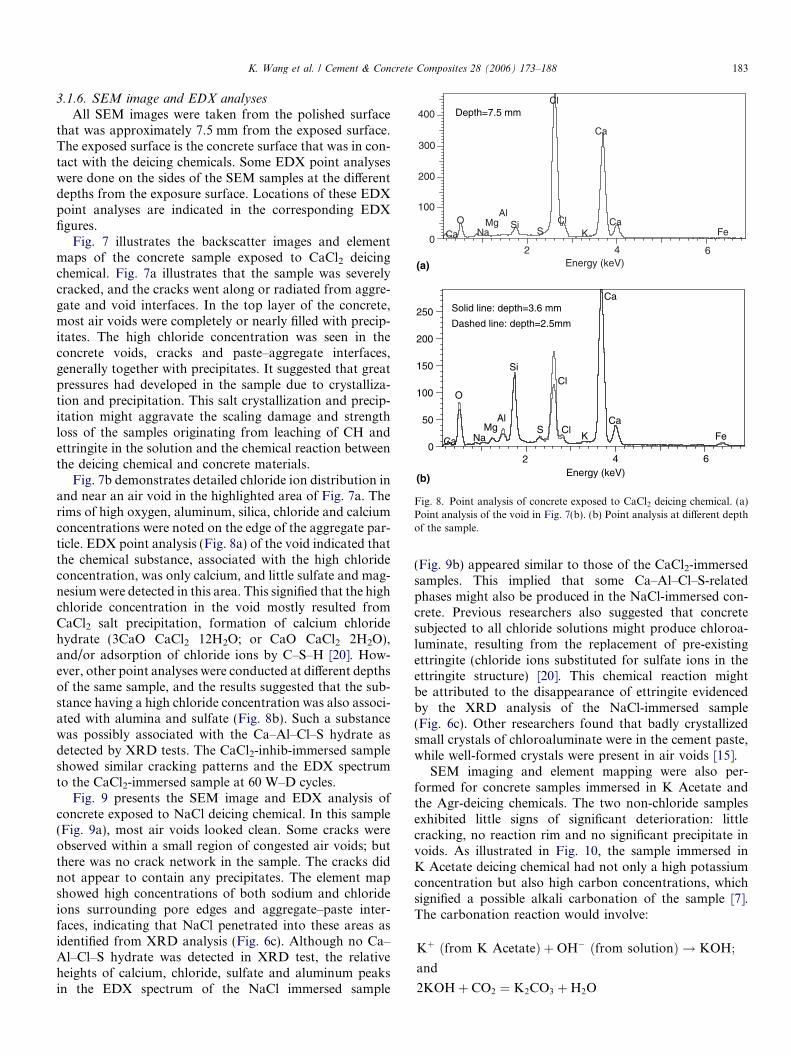
Fig. 8. Point analysis of concrete exposed to CaCl2 deicing chemical. (a)Point analysis of the void in Fig. 7(b). (b) Point analysis at different depthof the sample.
K. Wang et al. / Cement & Concrete Composites 28 (2006) 173–188 183
3.1.6. SEM image and EDX analyses
All SEM images were taken from the polished surfacethat was approximately 7.5 mm from the exposed surface.The exposed surface is the concrete surface that was in con-tact with the deicing chemicals. Some EDX point analyseswere done on the sides of the SEM samples at the differentdepths from the exposure surface. Locations of these EDXpoint analyses are indicated in the corresponding EDXfigures.
Fig. 7 illustrates the backscatter images and elementmaps of the concrete sample exposed to CaCl2 deicingchemical. Fig. 7a illustrates that the sample was severelycracked, and the cracks went along or radiated from aggre-gate and void interfaces. In the top layer of the concrete,most air voids were completely or nearly filled with precip-itates. The high chloride concentration was seen in theconcrete voids, cracks and paste–aggregate interfaces,generally together with precipitates. It suggested that greatpressures had developed in the sample due to crystalliza-tion and precipitation. This salt crystallization and precip-itation might aggravate the scaling damage and strengthloss of the samples originating from leaching of CH andettringite in the solution and the chemical reaction betweenthe deicing chemical and concrete materials.
Fig. 7b demonstrates detailed chloride ion distribution inand near an air void in the highlighted area of Fig. 7a. Therims of high oxygen, aluminum, silica, chloride and calciumconcentrations were noted on the edge of the aggregate par-ticle. EDX point analysis (Fig. 8a) of the void indicated thatthe chemical substance, associated with the high chlorideconcentration, was only calcium, and little sulfate and mag-nesiumwere detected in this area. This signified that the highchloride concentration in the void mostly resulted fromCaCl2 salt precipitation, formation of calcium chloridehydrate (3CaO Æ CaCl2 Æ 12H2O; or CaO Æ CaCl2 Æ 2H2O),and/or adsorption of chloride ions by C–S–H [20]. How-ever, other point analyses were conducted at different depthsof the same sample, and the results suggested that the sub-stance having a high chloride concentration was also associ-ated with alumina and sulfate (Fig. 8b). Such a substancewas possibly associated with the Ca–Al–Cl–S hydrate asdetected by XRD tests. The CaCl2-inhib-immersed sampleshowed similar cracking patterns and the EDX spectrumto the CaCl2-immersed sample at 60 W–D cycles.
Fig. 9 presents the SEM image and EDX analysis ofconcrete exposed to NaCl deicing chemical. In this sample(Fig. 9a), most air voids looked clean. Some cracks wereobserved within a small region of congested air voids; butthere was no crack network in the sample. The cracks didnot appear to contain any precipitates. The element mapshowed high concentrations of both sodium and chlorideions surrounding pore edges and aggregate–paste inter-faces, indicating that NaCl penetrated into these areas asidentified from XRD analysis (Fig. 6c). Although no Ca–Al–Cl–S hydrate was detected in XRD test, the relativeheights of calcium, chloride, sulfate and aluminum peaksin the EDX spectrum of the NaCl immersed sample
(Fig. 9b) appeared similar to those of the CaCl2-immersedsamples. This implied that some Ca–Al–Cl–S-relatedphases might also be produced in the NaCl-immersed con-crete. Previous researchers also suggested that concretesubjected to all chloride solutions might produce chloroa-luminate, resulting from the replacement of pre-existingettringite (chloride ions substituted for sulfate ions in theettringite structure) [20]. This chemical reaction mightbe attributed to the disappearance of ettringite evidencedby the XRD analysis of the NaCl-immersed sample(Fig. 6c). Other researchers found that badly crystallizedsmall crystals of chloroaluminate were in the cement paste,while well-formed crystals were present in air voids [15].
SEM imaging and element mapping were also per-formed for concrete samples immersed in K Acetate andthe Agr-deicing chemicals. The two non-chloride samplesexhibited little signs of significant deterioration: littlecracking, no reaction rim and no significant precipitate invoids. As illustrated in Fig. 10, the sample immersed inK Acetate deicing chemical had not only a high potassiumconcentration but also high carbon concentrations, whichsignified a possible alkali carbonation of the sample [7].The carbonation reaction would involve:
Kþ ðfrom K AcetateÞ þOH� ðfrom solutionÞ ! KOH;
and
2KOHþ CO2 ¼ K2CO3 þH2O

Fig. 9. EDAX analysis of concrete exposed to NaCl deicing chemical. (a) Elemental map at 25·. (b) Point analysis at different depth.
184 K. Wang et al. / Cement & Concrete Composites 28 (2006) 173–188
In addition to the removal of ettringite, the alkali carbon-ation reaction product, potassium carbonate (K2CO3), inthe sample might further react with CH and/or anhydrate(CaSO4) in the cement system. Small scale rating observedfrom the cement pastes exposed to the K Acetate deicingchemical might correspond to these chemical reactions(Fig. 2a).
3.2. F–T cycling
3.2.1. Mass change
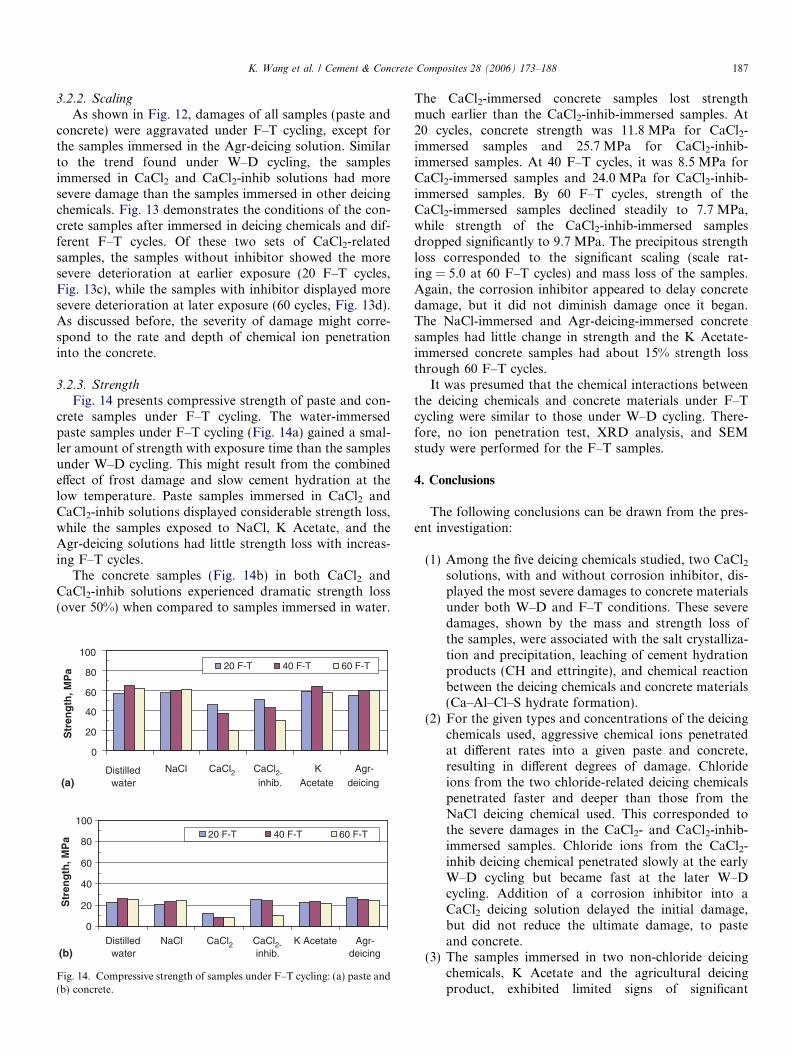
Fig. 11 presents the mass changes of paste and concretesamples subjected to deicing solutions under F–T cycling.Note that not all F–T samples behaved as same as the
W–D samples. Particularly, the two chloride-related sam-ples performed very differently from others.
Similar to those under W–D cycling, paste samples(Fig. 11a) immersed inwater andNaCl solutiongainedamin-imal amount of mass under F–T cycling (0.5% for water-immersed samples and 1.0% for NaCl-immersed samples,respectively, at 60 cycles). In contrast to those under W–Dcycling, K Acetate-submerged samples gained, rather thanlost, a very small amount of mass under F–T cycling (0.25%at 60 cycles). It was observed that the samples underwent aminor degree of scaling at 60 F–T cycles; therefore, somemass reduction via physical loss should occur. However, thismass loss might be offset by imbibed water and possible saltcrystallization, thus increasing overall mass of the samples.
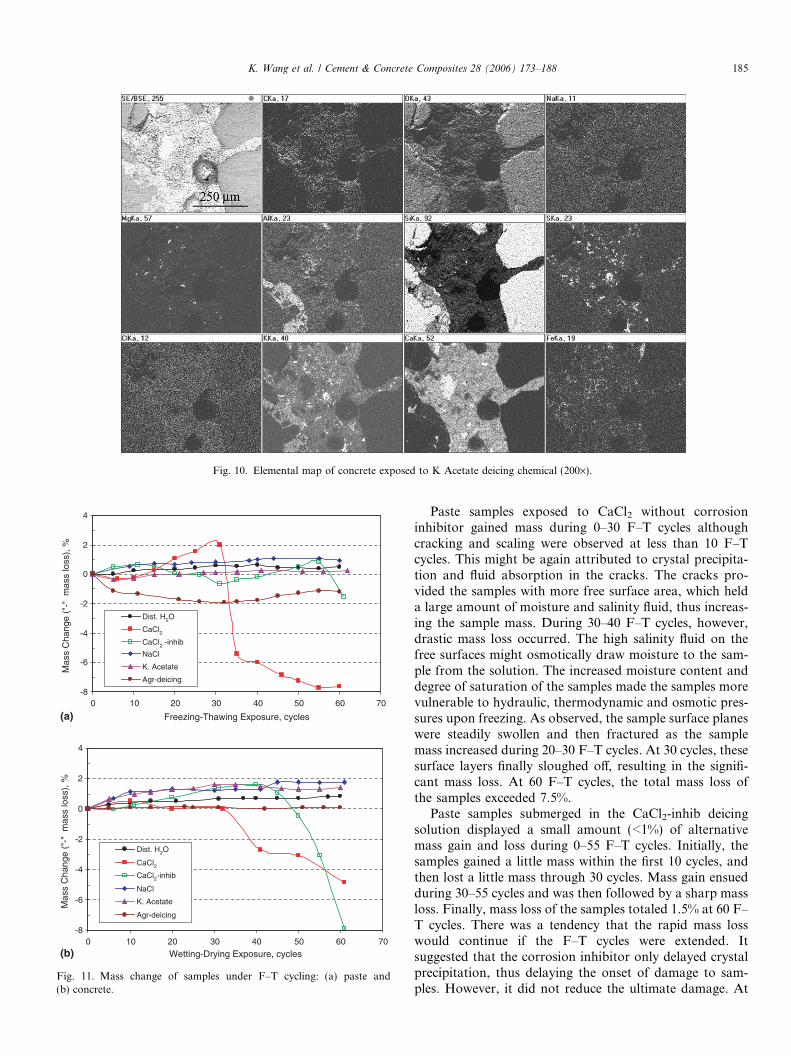
Fig. 10. Elemental map of concrete exposed to K Acetate deicing chemical (200·).
-8
-6
-4
-2
0
2
4
0 10 20 30 40 50 60 70
Freezing-Thawing Exposure, cycles
Mas
s C
hang
e ("
-" m
ass
loss
), %
Dist. H2O
CaCl2
CaCl2 -inhib
NaCl
K. Acetate
Agr-deicing
(a)
-8
-6
-4
-2
0
2
4
0 10 20 30 40 50 60 70
Wetting-Drying Exposure, cycles
Mas
s C
hang
e ("
-" m
ass
loss
), %
Dist. H2O
CaCl2
CaCl2-inhib
NaCl
K. Acetate
Agr-deicing
(b)
Fig. 11. Mass change of samples under F–T cycling: (a) paste and(b) concrete.
K. Wang et al. / Cement & Concrete Composites 28 (2006) 173–188 185
Paste samples exposed to CaCl2 without corrosioninhibitor gained mass during 0–30 F–T cycles althoughcracking and scaling were observed at less than 10 F–Tcycles. This might be again attributed to crystal precipita-tion and fluid absorption in the cracks. The cracks pro-vided the samples with more free surface area, which helda large amount of moisture and salinity fluid, thus increas-ing the sample mass. During 30–40 F–T cycles, however,drastic mass loss occurred. The high salinity fluid on thefree surfaces might osmotically draw moisture to the sam-ple from the solution. The increased moisture content anddegree of saturation of the samples made the samples morevulnerable to hydraulic, thermodynamic and osmotic pres-sures upon freezing. As observed, the sample surface planeswere steadily swollen and then fractured as the samplemass increased during 20–30 F–T cycles. At 30 cycles, thesesurface layers finally sloughed off, resulting in the signifi-cant mass loss. At 60 F–T cycles, the total mass loss ofthe samples exceeded 7.5%.
Paste samples submerged in the CaCl2-inhib deicingsolution displayed a small amount (<1%) of alternativemass gain and loss during 0–55 F–T cycles. Initially, thesamples gained a little mass within the first 10 cycles, andthen lost a little mass through 30 cycles. Mass gain ensuedduring 30–55 cycles and was then followed by a sharp massloss. Finally, mass loss of the samples totaled 1.5% at 60 F–T cycles. There was a tendency that the rapid mass losswould continue if the F–T cycles were extended. Itsuggested that the corrosion inhibitor only delayed crystalprecipitation, thus delaying the onset of damage to sam-ples. However, it did not reduce the ultimate damage. At

0
1
2
3
4
5
NaCl CaCl2 CaCl2-inhib.
KAcetate
Agr-deicing
Sca
ling
Rat
ing 20 F-T
40 F-T
60 F-T
(a)
0
1
2
3
4
5
Distilledwater
Distilledwater
NaCl CaCl2 CaCl2-inhib.
K Acetate Agr-deicing
Sca
ling
Rat
ing 20 F-T
40 F-T
60 F-T
(b)
Fig. 12. Scaling rating of samples under F–T cycling: (a) paste and (b)concrete. Notes: The scale rating ranged from 0 to 5, with 0 for no scalingand 5 for severe scaling (Table 5); each datum in the figure represents theaverage value of four samples; the empty bar spaces indicate the scalerating of 0.
186 K. Wang et al. / Cement & Concrete Composites 28 (2006) 173–188
60 F–T cycles, samples immersed in the CaCl2-inhib solu-tion were about to undergo significant mass loss similarto that observed from the samples without inhibitor. Con-crete test results discussed below confirmed this inference.
The paste samples immersed in the Agr-deicing solutionexperienced the most but steady mass loss among all sam-ples tested under F–T cycling. The final mass loss at 60 F–Tcycles was 2%, less than that observed in W–D cycling(>3%). This suggested that the rate of organic attack ofthe sample was reduced at a low F–T temperaturecondition.
Fig. 11b demonstrates the mass changes of concretesamples under F–T cycling. Before 30 F–T cycles, all sam-ples displayed a small amount of mass gain. After 30 F–Tcycles, significant mass losses were observed in both CaCl2-and CaCl2-inhib-immersed samples, while continuous massgain occurred in the samples immersed in water, NaCl, KAcetate, and the Agr-deicing chemical.
Mass loss in CaCl2-immersed samples began right after30 cycles. Coincidentally, this was the same age at whichthe CaCl2-immersed paste F–T samples began to disinte-grate. Therefore, the rapid increase in mass loss of the sam-ple might be associated with paste disintegration. Samplesimmersed in the CaCl2-inhib solution experienced precipi-tous mass loss, as considerable amounts of surface materialscaled off, after 40 cycles. The final mass losses were about5% for the CaCl2-immersed samples and nearly 8% for theCaCl2-inhib-immersed samples at 60 F–T cycles. Theseconcrete sample results once again implied that CaCl2 withcorrosion inhibitor deicing chemical could only postpone,
Fig. 13. Conditions of concrete samples (5 · 5 · 5 cm) exposed to deicing chem(d) CaCl2 with inhibitor, (e) K Acetate and (f) Agr-deicing.
not eliminate, concrete damage. Once mass loss began,the rate in CaCl2-inhib-immersed samples was significantlygreater than the rate of mass loss in CaCl2-immersedsamples.
icals under F–T cycling. (a) H2O, (b) NaCl, (c) CaCl2 without inhibitor,
K. Wang et al. / Cement & Concrete Composites 28 (2006) 173–188 187
3.2.2. Scaling
As shown in Fig. 12, damages of all samples (paste andconcrete) were aggravated under F–T cycling, except forthe samples immersed in the Agr-deicing solution. Similarto the trend found under W–D cycling, the samplesimmersed in CaCl2 and CaCl2-inhib solutions had moresevere damage than the samples immersed in other deicingchemicals. Fig. 13 demonstrates the conditions of the con-crete samples after immersed in deicing chemicals and dif-ferent F–T cycles. Of these two sets of CaCl2-relatedsamples, the samples without inhibitor showed the moresevere deterioration at earlier exposure (20 F–T cycles,Fig. 13c), while the samples with inhibitor displayed moresevere deterioration at later exposure (60 cycles, Fig. 13d).As discussed before, the severity of damage might corre-spond to the rate and depth of chemical ion penetrationinto the concrete.
3.2.3. Strength
Fig. 14 presents compressive strength of paste and con-crete samples under F–T cycling. The water-immersedpaste samples under F–T cycling (Fig. 14a) gained a smal-ler amount of strength with exposure time than the samplesunder W–D cycling. This might result from the combinedeffect of frost damage and slow cement hydration at thelow temperature. Paste samples immersed in CaCl2 andCaCl2-inhib solutions displayed considerable strength loss,while the samples exposed to NaCl, K Acetate, and theAgr-deicing solutions had little strength loss with increas-ing F–T cycles.
The concrete samples (Fig. 14b) in both CaCl2 andCaCl2-inhib solutions experienced dramatic strength loss(over 50%) when compared to samples immersed in water.
0
20
40
60
80
100
NaCl CaCl2 CaCl2-
inhib.K
AcetateAgr-
deicing
Str
eng
th, M
Pa 20 F-T 40 F-T 60 F-T
(a)
0
20
40
60
80
100
Distilledwater
Distilledwater
NaCl CaCl2 CaCl2-inhib.
K Acetate Agr-deicing
Str
eng
th, M
Pa 20 F-T 40 F-T 60 F-T
(b)
Fig. 14. Compressive strength of samples under F–T cycling: (a) paste and(b) concrete.
The CaCl2-immersed concrete samples lost strengthmuch earlier than the CaCl2-inhib-immersed samples. At20 cycles, concrete strength was 11.8 MPa for CaCl2-immersed samples and 25.7 MPa for CaCl2-inhib-immersed samples. At 40 F–T cycles, it was 8.5 MPa forCaCl2-immersed samples and 24.0 MPa for CaCl2-inhib-immersed samples. By 60 F–T cycles, strength of theCaCl2-immersed samples declined steadily to 7.7 MPa,while strength of the CaCl2-inhib-immersed samplesdropped significantly to 9.7 MPa. The precipitous strengthloss corresponded to the significant scaling (scale rat-ing = 5.0 at 60 F–T cycles) and mass loss of the samples.Again, the corrosion inhibitor appeared to delay concretedamage, but it did not diminish damage once it began.The NaCl-immersed and Agr-deicing-immersed concretesamples had little change in strength and the K Acetate-immersed concrete samples had about 15% strength lossthrough 60 F–T cycles.
It was presumed that the chemical interactions betweenthe deicing chemicals and concrete materials under F–Tcycling were similar to those under W–D cycling. There-fore, no ion penetration test, XRD analysis, and SEMstudy were performed for the F–T samples.
4. Conclusions
The following conclusions can be drawn from the pres-ent investigation:
(1) Among the five deicing chemicals studied, two CaCl2solutions, with and without corrosion inhibitor, dis-played the most severe damages to concrete materialsunder both W–D and F–T conditions. These severedamages, shown by the mass and strength loss ofthe samples, were associated with the salt crystalliza-tion and precipitation, leaching of cement hydrationproducts (CH and ettringite), and chemical reactionbetween the deicing chemicals and concrete materials(Ca–Al–Cl–S hydrate formation).
(2) For the given types and concentrations of the deicingchemicals used, aggressive chemical ions penetratedat different rates into a given paste and concrete,resulting in different degrees of damage. Chlorideions from the two chloride-related deicing chemicalspenetrated faster and deeper than those from theNaCl deicing chemical used. This corresponded tothe severe damages in the CaCl2- and CaCl2-inhib-immersed samples. Chloride ions from the CaCl2-inhib deicing chemical penetrated slowly at the earlyW–D cycling but became fast at the later W–Dcycling. Addition of a corrosion inhibitor into aCaCl2 deicing solution delayed the initial damage,but did not reduce the ultimate damage, to pasteand concrete.
(3) The samples immersed in two non-chloride deicingchemicals, K Acetate and the agricultural deicingproduct, exhibited limited signs of significant
188 K. Wang et al. / Cement & Concrete Composites 28 (2006) 173–188
deterioration: very few small and isolated cracks, nomeasurable chemical reaction, and no significantprecipitation in voids. These samples remained goodintegrity and strength throughout the tests alth-ough minor scaling was found in some K Acetate-immersed samples and significant mass loss andmicro-pores were observed from the Agr-deicing-immersed samples.
(4) Under W–D cycling, measurable damages of deicingchemicals to paste and concrete were identified.Under F–T cycling, the mass change, scaling damage,and strength loss of paste and concrete samples wereaggravated. The trends of the paste test results weresimilar to those of the concrete test results.
Acknowledgments
The present study is part of the Iowa Highway ResearchBoard (IHRB) project (No. TR-471). The authors wouldlike to acknowledge IHRB, Iowa Department of Transpor-tation (Iowa DOT) and the Center for Portland CementConcrete Pavement Technology (PCC Center) for co-spon-sorship of this research. Assistance from the MaterialAnalysis and Research Laboratory (MARL), Iowa StateUniversity, with XRD and SEM analyses is also greatlyappreciated.
References
[1] Litvan GG. Frost action in cement in the presence of deicers. CemConcr Res 1976;6(3):351–6.
[2] Setzer MJ. Action of frost and deicing chemicals. Basic phenomenaand testing. In: Marchand J, Pigeon M, Zetzer M, editors. Freeze–thaw durability of concrete. London: E&FN Spon; 1997. p. 3–21.
[3] Harnick AB, Meier V, Rosli A. Combined influence of freezing anddeicing salt on concrete: physical aspects. In: Sereda PJ, Litvan GG,editors. Durability of building materials and components. ASTMSTP 691, 1980. p. 474–84.
[4] Hoffmann DW. Changes in structure and chemistry of cementmortars stressed by a sodium chloride solution. Cem Concr Res1984;14(1):49–56.
[5] Kurdowski W, Duszak S, Trybalska B. Corrosion of tobermorite instrong chloride solution. In: Scrivener KL, Young JF, editors.Mechanisms of chemical degradation of cement-based systems. Lon-don: E&FN Spon; 1997. p. 114–21.
[6] Heukamp FH, Ulm FJ, Germaine JT. Mechanical properties ofcalcium-leached cement pastes: triaxial stress states and the influenceof the pore pressures. Cem Concr Res 2001;31(5):767–74.
[7] Brown PW, Doerr A. Chemical changes in concrete due to ingress ofaggressive species. Cem Concr Res 2000;30(3):411–8.
[8] Nixon PJ, Page CL, Canham I, Bollinghaus R. Influence of sodiumchloride on the ASR. Adv Cem Res 1988;1:99–105.
[9] Kawamura M, Takeuchi K, Sugiyama A. Mechanisms of expansionof mortars containing reactive aggregates in NaCl solution. CemConcr Res 1994;14:621–32.
[10] Jang J, Hagen MG, Engstrom GM, Iwasaki I. Cl�, SO2�4 , and PO3�
4
distribution in concrete slabs ponded by corrosion–inhibitor-addeddeicing salts. Adv Cem-Based Mater 1998;8(3–4):101–7.
[11] Mehta PK, Gerwick BC. Cracking–corrosion interaction in concreteexposed to marine environment. Concr Int 1982;4(10):45–51.
[12] Warncke D, Brown JR. Recommended chemical soil test proceduresfor the North Central Region. In: Dahnke WC, editor. North CentralRegion Publication 221. Fargo, ND: North Dakota AgricultureExperimental Station; 1980. p. 31–3.
[13] Gelderman RH, Denning JL, Goos RJ. Recommended chemical soiltest procedures for the North Central Region. In: Dahnke WC,editor. North Central Region Publication 221. Fargo, ND: NorthDakota Agriculture Experimental Station; 1980. p. 49–52.
[14] Santagata CC, Collepardi M. The effect of CMA deicers on concreteproperties. Cem Concr Res 2000;30(9):1389–94.
[15] Berube MA, Dorion JF, Duchesne J, Fournier B, Vezina D.Laboratory and field investigations of the influence of sodiumchloride on alkali–silica reactivity. Cem Concr Res 2003;33(1):77–84.
[16] Turanli L, Wenk HR, Monteiro PJM, Sposito G, Shomglin K. Theeffects of potassium and rubidium hydroxide on the alkali–silicareaction. Cem Concr Res 2003;33(11):1825–30.
[17] Chatterji S. Mechanism of CaCl2 attack on portland cement concrete.Cem Concr Res 1978;8(4):461–8.
[18] Lee H, Cody RD, Cody AM, Spry PG. Effects of various deicingchemicals on pavement and concrete deterioration. In: Proceedings,mid-continent transportation symposium, Center for TransportationResearch and Education, 2000. p. 151–5.
[19] Gaze ME, Crammond NJ. The formation of thaumasite in acement:lime:sand mortar exposed to cold magnesium and potassiumsulfate solutions. Cem Concr Compos 2000;22(3):209–22.
[20] Lee H, Cody RD, Cody AM, Spry PG. Effects of various deicingchemicals on pavement and concrete deterioration. In: Proceedings,mid-continent transportation symposium, Center for TransportationResearch and Education, 2000. p. 151–5.