dairy market study north rift, kenya
TRANSCRIPT
1
DAIRY MARKET STUDY
NORTH RIFT, KENYA
Market Opportunities for Dutch Dairy Input Suppliers, Service
Providers and Investors (ISPIs) in North Rift - Kenya
SNV Kenya/Netherlands Development Organisation
Kenya Market-led Dairy Programme (Phase 2)
Janneke Blonk, Naomi Paas, Tijs van Balen, Julius Kosgei, Lavender Simiyu,
Timothy Kiprono Kiptoo November 2017, Eldoret – Kenya

2
3
Table of Contents
Table of Contents .................................................................................... 3
Abbreviations .......................................................................................... 4
Glossary .................................................................................................. 5
1. Introduction ........................................................................................ 6
2. Methodology ........................................................................................ 8
3. Kenya and the Dairy Sector Profile ...................................................... 9 3.1 Political and Economy ......................................................................................................... 9
3.2 Kenyan Dairy Industry ..................................................................................................... 10
4. North Rift Region and the Dairy Value Chain .................................... 14 4.1 The North Rift ...................................................................................................................... 14
4.2 Dairy Value Chain Structure in the North Rift Region .......................................... 15
4.3 Market Segments and Themes for Dutch ISPIs...................................................... 17
5. North Rift Market Segments and Dutch ISPIs ................................... 18 5.1 Sampled MSFs/LSFs and Dairy Societies and Total Numbers ........................... 18
5.2 Market Segment 1: Deep Scan Medium and Large Scale Farmers ................. 19
5.3 Market Segment 2: Deep Scan Dairy Cooperatives.............................................. 25
5.4 Impressions of ISPIs Perspectives on Doing Business in Kenya ...................... 29
6. Needs Assessment and Market Opportunities .................................... 31 6.1 Feeds, Fodder, Farm Machinery & Agricultural Contracting .............................. 31
6.2 Milking and Cooling Equipment, Milk Processing ................................................... 35
6.3 Herd Improvement (genetics and young stock) .................................................... 38
6.4 Herd and Farm Management Software, ERP systems .......................................... 43
6.5 Cow House Design and Interiors .................................................................................. 46
6.6 Practical Dairy Training and Education, Dairy Advisory ...................................... 47
6.7 Finance and Fiscal Policies .............................................................................................. 49
7. Conclusion and Recommendations .................................................... 52 7.1 Conclusions ........................................................................................................................... 52
7.2 Recommendations .............................................................................................................. 54
Annex 1. Deep Scanned MSFs/LSFs in North Rift .................................. 56
Annex 2. List of Active Dairy Cooperatives in North Rift ........................ 59
Annex 3. List Dutch ISPIs Interviewed in Netherlands .......................... 61
Annex 4. List Dutch ISPIs active in Kenya ............................................. 62
Annex 5. Quick Scan .............................................................................. 63
Annex 6. Deep Scan Questionnaire MSFs and LSFs ................................ 64
Annex 7. Deep Scan Questionnaire Cooperatives .................................. 68
Annex 8. Summary Deep Scan MSFs, LSFs, Coops ................................. 71
Annex 9. Analysis Deep Scan Cooperatives ........................................... 75
Annex 10. Photo Impression MSF and LSF Farming Systems ................. 87
Annex 11. Photo Impression of Cooperatives Dairy Value Chain ........... 89
Annex 12. Photo Impression of Eldoret Agribusiness Fair 2016 ............ 92

4
Abbreviations
AI Artificial Insemination
AKEFEMA Association of Kenyan Feed Manufacturers
ASAL Arid and Semi-Arid Land
BDEA Bles Dairies East Africa
CBE Cooling and Bulking Enterprise
CET Common External Tariff
DESTEP Demographic, Economic, Social-Cultural, Technologic, Ecologic &
Politic analysis tool
DVC Dairy Value Chain
EAC East African Community
EDFA Eldoret Dairy Farmers Association
FAO Food and Agriculture Organization
GDP Gross Domestic Product
GNI Gross National Income
GRS Genetic Resource Centre
HAS HAS University of Applied Sciences Hertogenbosch (NL)
ILRI International Livestock Research Institute
ISPIs Input Suppliers, Service Providers and Investors
KALRO Kenya Agriculture and Livestock Research Organization
KAGRC Kenya Animal Genetics Resource Centre
KDB Kenya Dairy Board
KDFF Kenya Dairy Farmers Federation
KEBS Kenya Bureau of Standards
KES Kenyan Shilling
KMDP Kenya Market-led Dairy Programme
LSF Large Scale Farmer
MSF Medium Scale Farmer
MQ Main research Question
NKCC New Kenya Cooperative Society
PDTC Practical Dairy Training Centre
PUM PUM/Netherlands Senior Export Programme
SACCO Saving and Credit Cooperative Organization
SAP Structural Adjustment Programme (of IMF and World Bank)
SNV SNV Netherlands Development Organisation
SSF Small Scale Farmer
SWOT Strengths, Weaknesses, Opportunities and Threats analysis tool
VAT Value Added Tax
5
Glossary
North Rift Region The counties Uasin Gishu, Trans Nzoia, Nandi, Elgeyo Mara-
kwet, Baringo, Bungoma, West-Pokot and Turkana located in
the Rift Valley Province.
Supply Chain The stakeholders and links that connect the chain of a certain
product from inputs on to distribution to consumers (Wiggens
& Keats, 2013).
Value Chain The value chain may contain several supply chains as for every
single input product a separate supply chain can be described.
In addition to the supply chain the value chain also includes the
services and economic environment for the production of a
certain product (Wiggens & Keats, 2013).
Cooperatives Here defined as farmer groups or organizations in which
farmers are united to meet their common economic and social
needs. These are “true” cooperatives as per the Kenya
Cooperative Act and farmer groups that have registered as
public companies (> 50 shareholders) and fall under the
Companies Act.
1 USD ≈ 104 KES (November, 2017)
1 Euro ≈ 121 KES (November, 2017)
6
1. Introduction
This document is a revised and updated version of the research report by Janneke
Blonk and Naomi Paas for attainment of their BSc degree at HAS University of
Applied Sciences den Bosch (HAS), International Food and Agribusiness Course.
This revised report was compiled by Janneke Blonk with support from Tijs van
Balen of SNV’s Eldoret Team under the Kenya Market-led Dairy Programme, and
two interns Lavender Simiyu and Timothy Kiprono Kiptoo.
SNV Netherlands Development Organisation is an international not-for-profit
development organization working in 36 countries. SNV Kenya is implementing the
Kenyan Market-led Dairy Programme (KMDP) funded by the Netherlands Embassy
in Nairobi. The project goal of KMDP is to enhance the competitiveness of the
Kenyan dairy sector, to contribute to an improved business and investment climate
for local and international private sector, and to facilitate Dutch companies - Input
Suppliers, Service Providers and Investors (ISPIs) - to start business in Kenya
and/or expand market share. This is expected to contribute to fast-track transfer
of knowledge, skills, technology and innovations, and cross border investments
into Kenya, and through the involvement of private sector a more sustainable
manner of developing the dairy industry in Kenya.
In this context KMDP-2 (October 2016 – June 2019), in collaboration with HAS
Training and Consultancy and University of Applied Science, embarked on a market
study for the North Rift region of Kenya. This is one of the key dairy production
areas in the country, with ample opportunity and ambition for growth and
expansion of dairy farming due to the average size of landholdings and favorable
agro-ecological conditions.
Part 1 of the market study was carried out during the period 1 March – 1 June
2017 and focused on a sample of Medium and Large Scale Farms (MSFs and LSFs)
in three counties in North Rift, viz. Uasin Gishu, Trans Nzoia and Nandi, where
most of the medium and large dairy farms in North Rift are located. The MSFs as
per the research definition produce between 100-600 kg of milk per day. LSFs are
defined as farms with a daily milk production of 600 kg or more daily. Part 2 of
this study was implemented from July – Sept. 2017 and zoomed in on dairy
cooperatives in the North Rift counties, viz. Uasin Gishu, Trans Nzoia, Nandi,
Baringo, Bungoma, Elgeyo-Marakwet, Kakamega, and West-Pokot, that collect and
market milk and provide services for their members, who are also considered as a
“market” for Dutch ISPIs.
These MSFs and LSFs on one hand, and the dairy cooperatives (and milk proces-
sors) on the other hand, are considered as the main market segments and entry
points for Dutch ISPIs.
7
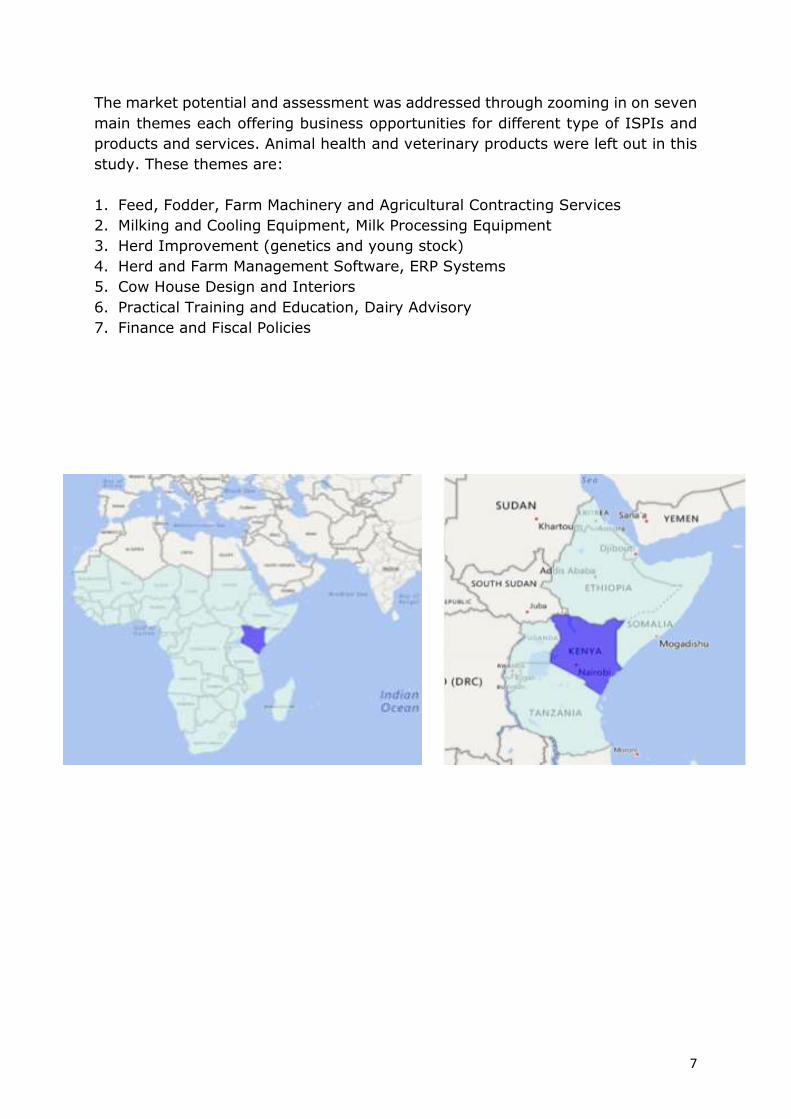
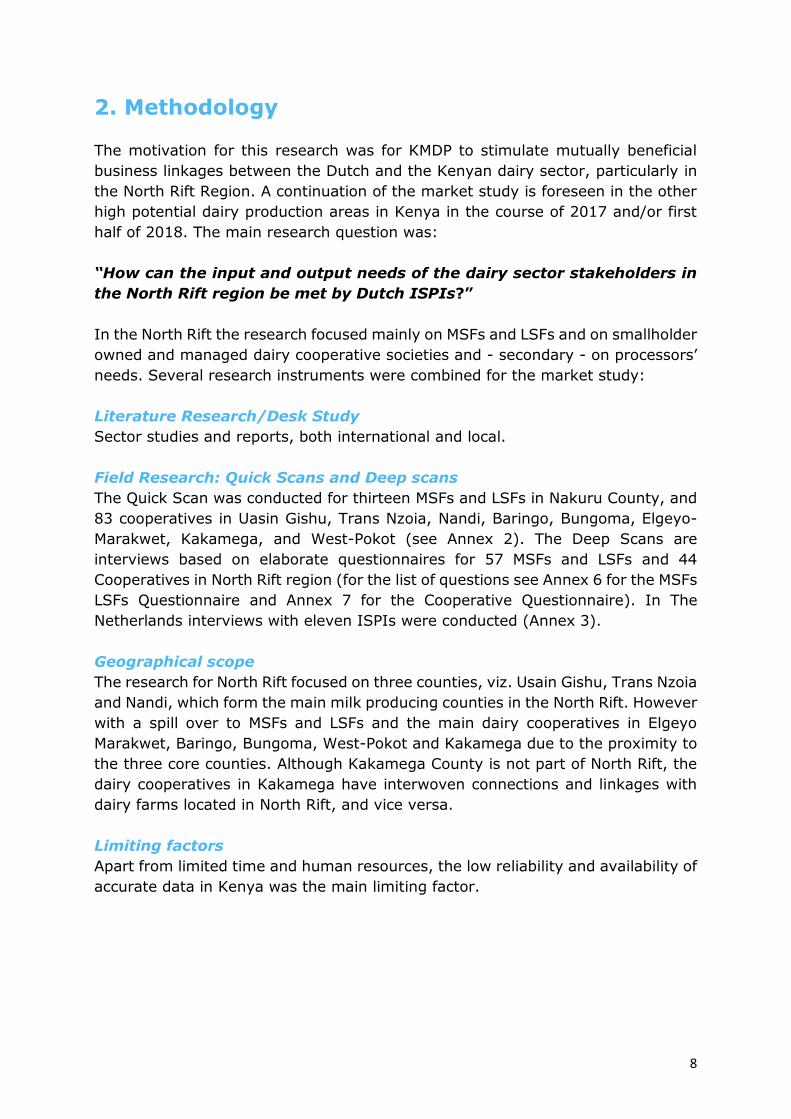
The market potential and assessment was addressed through zooming in on seven
main themes each offering business opportunities for different type of ISPIs and
products and services. Animal health and veterinary products were left out in this
study. These themes are:
1. Feed, Fodder, Farm Machinery and Agricultural Contracting Services
2. Milking and Cooling Equipment, Milk Processing Equipment
3. Herd Improvement (genetics and young stock)
4. Herd and Farm Management Software, ERP Systems
5. Cow House Design and Interiors
6. Practical Training and Education, Dairy Advisory
7. Finance and Fiscal Policies
8
2. Methodology
The motivation for this research was for KMDP to stimulate mutually beneficial
business linkages between the Dutch and the Kenyan dairy sector, particularly in
the North Rift Region. A continuation of the market study is foreseen in the other
high potential dairy production areas in Kenya in the course of 2017 and/or first
half of 2018. The main research question was:
“How can the input and output needs of the dairy sector stakeholders in
the North Rift region be met by Dutch ISPIs?”
In the North Rift the research focused mainly on MSFs and LSFs and on smallholder
owned and managed dairy cooperative societies and - secondary - on processors’
needs. Several research instruments were combined for the market study:
Literature Research/Desk Study
Sector studies and reports, both international and local.
Field Research: Quick Scans and Deep scans
The Quick Scan was conducted for thirteen MSFs and LSFs in Nakuru County, and
83 cooperatives in Uasin Gishu, Trans Nzoia, Nandi, Baringo, Bungoma, Elgeyo-
Marakwet, Kakamega, and West-Pokot (see Annex 2). The Deep Scans are
interviews based on elaborate questionnaires for 57 MSFs and LSFs and 44
Cooperatives in North Rift region (for the list of questions see Annex 6 for the MSFs
LSFs Questionnaire and Annex 7 for the Cooperative Questionnaire). In The
Netherlands interviews with eleven ISPIs were conducted (Annex 3).
Geographical scope
The research for North Rift focused on three counties, viz. Usain Gishu, Trans Nzoia
and Nandi, which form the main milk producing counties in the North Rift. However
with a spill over to MSFs and LSFs and the main dairy cooperatives in Elgeyo
Marakwet, Baringo, Bungoma, West-Pokot and Kakamega due to the proximity to
the three core counties. Although Kakamega County is not part of North Rift, the
dairy cooperatives in Kakamega have interwoven connections and linkages with
dairy farms located in North Rift, and vice versa.
Limiting factors
Apart from limited time and human resources, the low reliability and availability of
accurate data in Kenya was the main limiting factor.
9
3. Kenya and the Dairy Sector Profile
3.1 Political and Economy
Kenya is located in the East African Community and got independence in 1963.
Kenya has currently 48 million inhabitants, and this number is expected to double
to 85 million in 2050 at current population growth rates, with > 50% of people
living in urban centers. Over 50% of current population is below the age of thirty
years. Kenya is a multi-party state with an elected President. Elections are held
every five years, however power relations are largely based on tribal divisions,
representation and coalitions. Kenya has a growing middle class due to economic
growth rates in GDP of 5-6% per year over the past one and a half decade.
The private sector is the driver of the economy. The agricultural sector is
accountable for 33% of GDP and dairy for 4%. Dairy is the largest agricultural sub
sector in terms of income generated and employment creation, and therefore
bigger than tea, coffee or flowers and horticulture.
Due to its steady economic growth, Kenya has climbed to the level of lower middle
income country and is the economic hub for the East African region, with moderate
to good infrastructure as regards to roads, rail, electricity, water supply,
telecommunication and internet, education and health care. The headquarters for
Sub Sahara Africa or East Africa of many international organizations and multi-
nationals are based in Kenya. With the exception of the aftermath of the 2007
elections, Kenya has been a relatively politically stable democracy compared to
other countries is Sub Sahara Africa.
Land size : 580,367 km2 (14 x Netherlands)
Population : 2000: 31 million; 2015: 46 million; 2050: 85 million
Distribution : 80% population on 20% of land space
Urbanisation : 4.3% annually; 2015: 27% in urban centre; 2050: 50%
Nairobi : 2015: 3.5 million
Middle Class : 2014: 8% lower middle class and middle class; 2030: 18%
Dairy pockets : Kenyan highlands (> 1,400 metres), good temp., soils and rainfall
Milk production : 3.9 billion litres cow milk (2014)
Consumption : 115 litres per capita per year
Nr of smallholders : Est. 1 mln smallholders with (average) 1-5 dairy cows (cross/high breeds)
Nr of MSFs/LSFs : Est. 2-4,000 farms with > 25 dairy cows
Nr of dairy cows : 3.8 million high and cross breeds (2014)
Nr of dairy coops : > 200 (collection, bulking and marketing)
Nr of processors : 28
Big Five : Brookside, NKCC, Githunguri, Meru Union, Sameer Daima (90%)
Milk processed : 2001: 152 million litres; 2016: 625 million litres
Milk marketed : 55% of total production; ca. 70% as raw milk and 30% processed
Raw milk price : Formal market 2009: KES 2017: KES 38 farm gate
Key Figures Kenyan Demography & Dairy Sector
10
3.2 Kenyan Dairy Industry
Kenya’s dairy industry is private sector driven. The private sector took over after
the collapse of Kenya Cooperative Creameries (KCC), later the New Kenya
Cooperative Creameries (NKCC), and the withdrawal of government services and
input supply systems in the 1990s. The latter was caused by the Structural
Adjustment Programme (SAP) of IMF and World Bank.
After collapse of the sector in the nineties it started showing impressive growth
figures again from 2000 onwards. The high potential dairy areas are concentrated
in Kenya’s highlands (1,400 metres and above) which have very conducive climate
for dairy cows. The main milk producing areas are around Eldoret (Uasin Gishu,
Trans Nzoia, Nandi, Bomet Counties), Nakuru (Nakuru and Nyandarua Counties),
Kinangop area, Limuru and Kiambu areas near Nairobi and the Mount Kenya belt
running from Nyeri to Kirinyaga, Embu and Meru.
Depending on sizes of landholdings different farming systems are present, viz. free
grazing, semi zero grazing and zero grazing. Soils and climate are very suitable
for production of quality (preserved) fodders and for pastures, depending on
available skills, knowledge and technology, which is however abundantly lacking.
Hence the fodder subsector is underdeveloped, in spite of huge sales volumes of
(low quality) hay.
Yet, the sector is dynamic with high growth figures of marketed milk and
investments by farmers, dairy societies and processors, in raw milk production,
collection, the cold chain and processing of pasteurized milk, long-life products
(ESL, UHT), yoghurts, cheese, butter and milk powder. Average raw milk prices
paid to farmers by cooperatives and processors have increased from KES 28 to
KES 38 per kg over the past 7-8 years. However, there is significant fluctuation in
prices per season (dry and wet season) and depending on distance to the main
urban centres and processing sites. Farmers or dairy cooperatives who sell to
traders who operate in the raw milk market, or sell directly to consumers, get a
higher price per kg of milk. This can reach KES 60 per kg in milk deficit areas.
Currently the sector provides income and employment for over 1.5 million people
across the dairy value chain: farmers and their family members (male and female),
transporters, traders and vendors, employees of dairy societies, milk processors,
input and service providers, retailers and distributers. In terms of nutrition and
food security, milk is consumed by almost all Kenyans on a daily basis with an
average annual per capita consumption of 115 litres milk equivalents (KDB, 2012).
Total milk production was according to Kenya Dairy Board 5.2 billion litres from all
livestock in 2011. Kenya Bureau of Statistics 2009 Census estimated 3.8 billion kg
from cows, and Bulletin World Dairy Situation 2016 estimates 3.9 billion kg from
cows in 2014. Circa 80% of this is produced by smallholders the Bulletin World
Dairy Association, 2016 mentions a number of 1 million dairy farms. However,
11
knowing that most rural households keep a cow for home consumption of raw milk,
this number may be an overestimation as regards to the number of smallholders
who have commercialised dairy and see it as a core business. The same report
refers to a number of 5.9 million dairy cows in 2014 (high and mixed breeds)
compared to 11.6 million in the Netherlands (2012, FAO).
The smallholder profile of the sector poses great challenges on the industry in
terms of skills development and transfer, cost of production, ability and willingness
to invest in enhanced dairy production, collection and chilling, seasonal fluctuations
in supply, and milk quality. There is however a fast-growing segment of entre-
preneurial smallholders and MSFs and LSFs who invest in modern commercial dairy
production. An estimated 2-4,000 dairy farms have more than 20-25 cows.
Reliable data on numbers of medium and large-scale dairy farms (including a clear
definition of an MSF and LSF in terms of herd size, milk production or land area)
are however lacking.
Kenya has currently 28 active milk processors (this excludes mini dairies with
batch pasteurizers and cottage industry yoghurt production, ATM dispensers) of
which the largest are Brookside, New KCC, Githunguri, Sameer/Daima and Meru
Central Dairy Farmers Cooperative Union, who together process circa 85% of the
1.7 million kilos of milk that was processed daily in 2015. Market leader is
Brookside that applies a strategy of taking over other brands in and outside Kenya
to increase market share, with the ambitions to become a regional player. In 2014
the French dairy giant Danone took a 40% shareholding in Brookside. Other
international players have also shown interest in the Kenyan dairy sector, including
Nestle, Parmalat and FrieslandCampina from the Netherlands.
The market for processed milk and dairy products saw a steady growth over the
past fifteen years. In 2001 annual milk intake by processors was 152 million kg,
in 2009 it was 406 million kg, and in 2015 601 million kg and 2016 it was 625
million kg. Still an estimated 60-70% of all milk that is marketed is sold through
the informal sector as raw milk. This creates lack of level playing field for the
formal market and an impediment for its growth. A recent development is the
emergence of milk dispensing machines (milk ATMs) in urban centres which are
mostly operated by traders and shopkeepers, who may pasteurize the milk at a
fee per litre through a processor with over-capacity in the factory. Kenya Dairy
Board has over the past three to four years licensed more than 600 milk-ATMs but
there is hardly any control on quality of milk dispensed through these units.
The industry’s growth and competitiveness are constrained by low productivity at
farm level, seasonality in milk production, milk quality issues, a huge knowledge
and skills gap and lack of inclusiveness in the dairy value chain. Prognosis for the
next 10-20 years show that demand for milk and dairy products will outstrip (local)
supply under the current production systems and low productivity levels. This is
spurred also by growing population, from 31 million people in 2000 to 46 million
12
in 2015 up to 85 million 2050, and fast urbanisation, 4.3% per year, 2015: 27%
of population in urban areas, 2050: 50% in urban areas, and a growing middle
class and lower middle class, 2014: 8% of households and in 2030: 18% of
households (Moody’s).
Population growth, growing middle class and urbanisation are important drivers
for growth in demand and consumption of milk and dairy products. As of today,
the sector is protected by an import tariff of 60% for milk and dairy products,
which in the long run may not lead to a competitive sector and long-term
sustainability.
The policies of the government of Kenya and its priorities with regard to economic
development, agriculture and food security are framed in a number of documents,
of which Vision 2030 brings together Kenya’s overall macro-economic strategies
and ambitions. The government acknowledges that the dairy sector is a key
agricultural subsector, is private sector-led, and needs to transition to a higher
level of competitiveness for sustained growth. The ambition is to increase both
local production and consumption of milk and dairy products, and to realize a
significant growth in exports.
The government’s support to the dairy industry focuses on conducive fiscal policies
(e.g. zero rating of imported dairy equipment and VAT exemption on loose
processed milk), and protectionist measures through the imposition of a duty of
60% on imported milk and dairy products. Government involvement and
investment in dairy extension & training and in-service provision have been
reduced to a bare minimum since the World Bank’s Structural Adjustment
Programmes in the 1990s. With the liberalisation of the industry the private sector
has not been able to fill this gap.
With the devolution of power and the installation of country governments, there
are emerging opportunities for dairy through investments by counties. In over
twenty counties dairy has been identified as a key economic sector, with some
counties making direct investment in dairy through provision of dairy equipment
(processing, chilling, AI) and investments in school milk programmes. These
interventions are usually not market-led but politically motivated. The run the risk
of being unsustainable and causing market distortion.
13
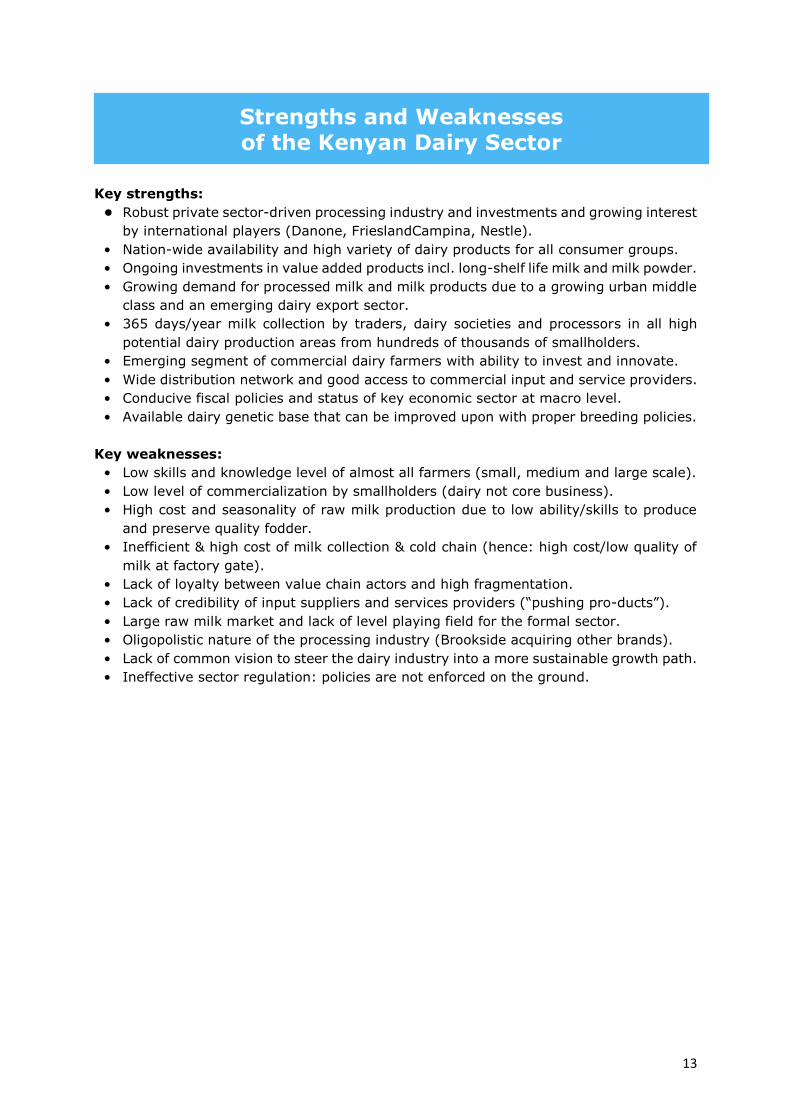
Key strengths:
• Robust private sector-driven processing industry and investments and growing interest
by international players (Danone, FrieslandCampina, Nestle).
• Nation-wide availability and high variety of dairy products for all consumer groups.
• Ongoing investments in value added products incl. long-shelf life milk and milk powder.
• Growing demand for processed milk and milk products due to a growing urban middle
class and an emerging dairy export sector.
• 365 days/year milk collection by traders, dairy societies and processors in all high
potential dairy production areas from hundreds of thousands of smallholders.
• Emerging segment of commercial dairy farmers with ability to invest and innovate.
• Wide distribution network and good access to commercial input and service providers.
• Conducive fiscal policies and status of key economic sector at macro level.
• Available dairy genetic base that can be improved upon with proper breeding policies.
Key weaknesses:
• Low skills and knowledge level of almost all farmers (small, medium and large scale).
• Low level of commercialization by smallholders (dairy not core business).
• High cost and seasonality of raw milk production due to low ability/skills to produce
and preserve quality fodder.
• Inefficient & high cost of milk collection & cold chain (hence: high cost/low quality of
milk at factory gate).
• Lack of loyalty between value chain actors and high fragmentation.
• Lack of credibility of input suppliers and services providers (“pushing pro-ducts”).
• Large raw milk market and lack of level playing field for the formal sector.
• Oligopolistic nature of the processing industry (Brookside acquiring other brands).
• Lack of common vision to steer the dairy industry into a more sustainable growth path.
• Ineffective sector regulation: policies are not enforced on the ground.
Strengths and Weaknesses of the Kenyan Dairy Sector
14
4. North Rift Region and the Dairy Value Chain
As the largest of eight provinces in Kenya, the Rift Valley consists of North Rift and
South Rift. North Rift is considered as the leading dairy region in Kenya, as the
highlands provide adequate rainfall for dairy farming and agriculture. The area has
received considerable inputs and support from dairy development programs and
projects, both public and private.
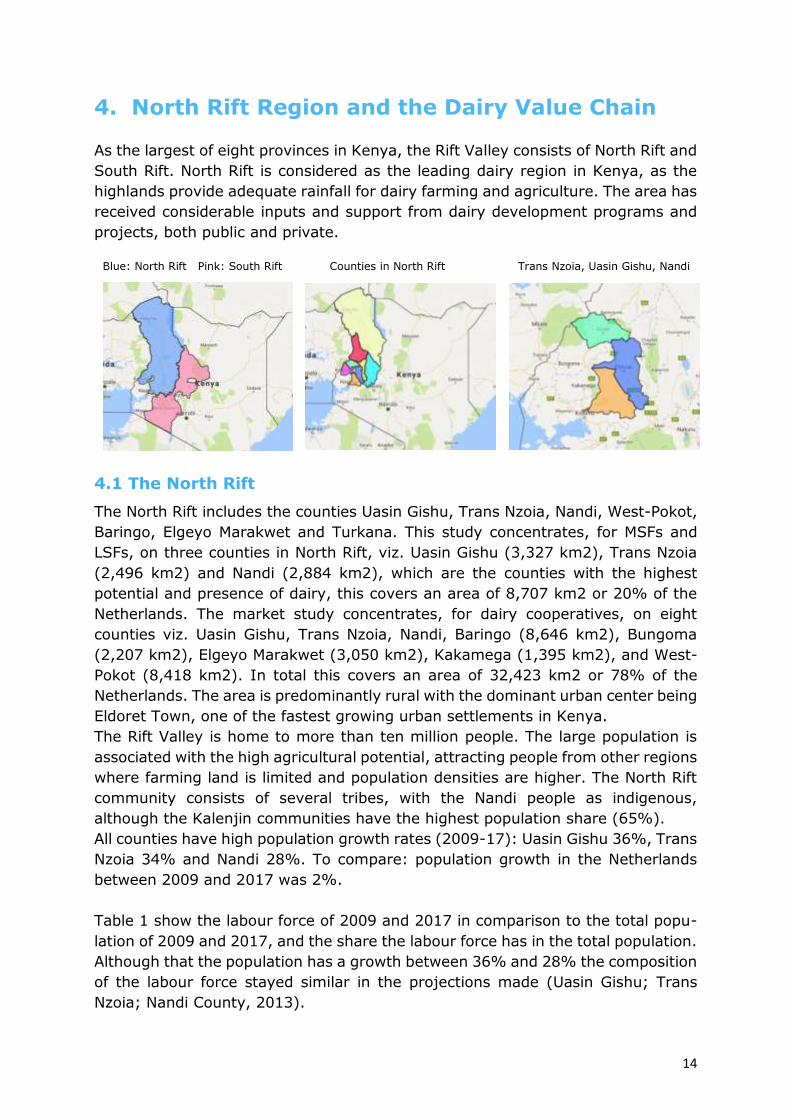
Blue: North Rift Pink: South Rift Counties in North Rift Trans Nzoia, Uasin Gishu, Nandi
4.1 The North Rift
The North Rift includes the counties Uasin Gishu, Trans Nzoia, Nandi, West-Pokot,
Baringo, Elgeyo Marakwet and Turkana. This study concentrates, for MSFs and
LSFs, on three counties in North Rift, viz. Uasin Gishu (3,327 km2), Trans Nzoia
(2,496 km2) and Nandi (2,884 km2), which are the counties with the highest
potential and presence of dairy, this covers an area of 8,707 km2 or 20% of the
Netherlands. The market study concentrates, for dairy cooperatives, on eight
counties viz. Uasin Gishu, Trans Nzoia, Nandi, Baringo (8,646 km2), Bungoma
(2,207 km2), Elgeyo Marakwet (3,050 km2), Kakamega (1,395 km2), and West-
Pokot (8,418 km2). In total this covers an area of 32,423 km2 or 78% of the
Netherlands. The area is predominantly rural with the dominant urban center being
Eldoret Town, one of the fastest growing urban settlements in Kenya.
The Rift Valley is home to more than ten million people. The large population is
associated with the high agricultural potential, attracting people from other regions
where farming land is limited and population densities are higher. The North Rift
community consists of several tribes, with the Nandi people as indigenous,
although the Kalenjin communities have the highest population share (65%).
All counties have high population growth rates (2009-17): Uasin Gishu 36%, Trans
Nzoia 34% and Nandi 28%. To compare: population growth in the Netherlands
between 2009 and 2017 was 2%.
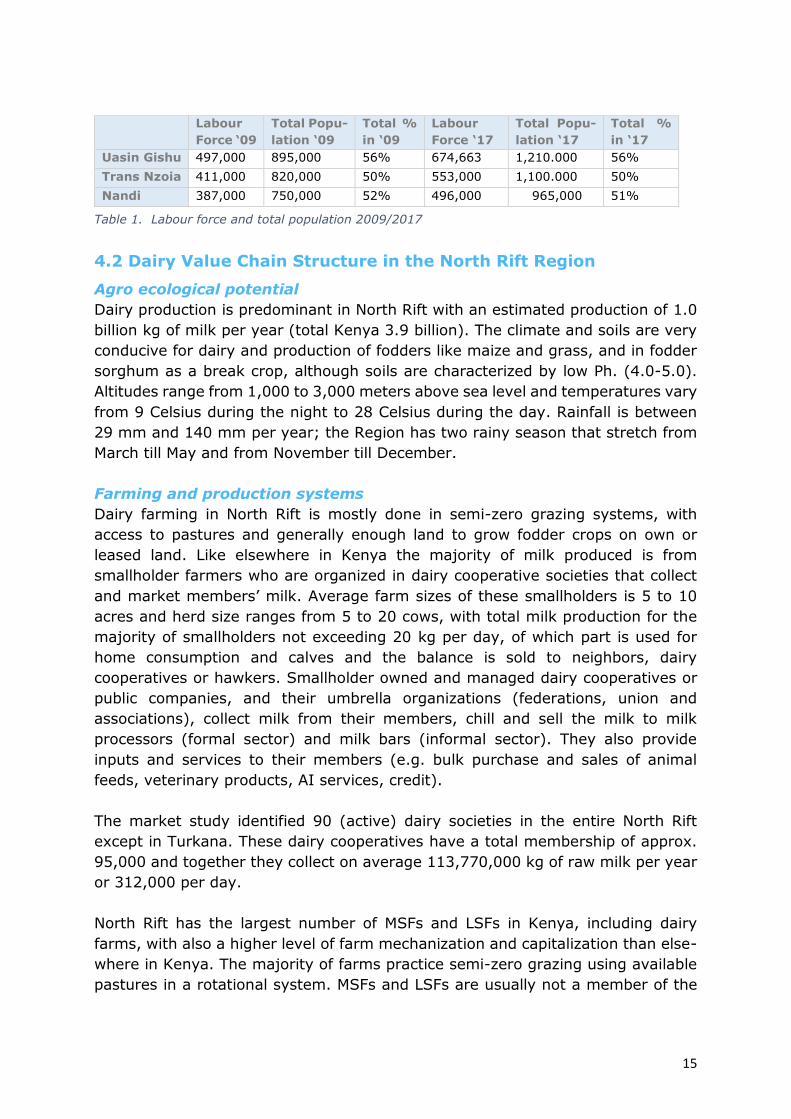
Table 1 show the labour force of 2009 and 2017 in comparison to the total popu-
lation of 2009 and 2017, and the share the labour force has in the total population.
Although that the population has a growth between 36% and 28% the composition
of the labour force stayed similar in the projections made (Uasin Gishu; Trans
Nzoia; Nandi County, 2013).
15
4.2 Dairy Value Chain Structure in the North Rift Region
Agro ecological potential
Dairy production is predominant in North Rift with an estimated production of 1.0
billion kg of milk per year (total Kenya 3.9 billion). The climate and soils are very
conducive for dairy and production of fodders like maize and grass, and in fodder
sorghum as a break crop, although soils are characterized by low Ph. (4.0-5.0).
Altitudes range from 1,000 to 3,000 meters above sea level and temperatures vary
from 9 Celsius during the night to 28 Celsius during the day. Rainfall is between
29 mm and 140 mm per year; the Region has two rainy season that stretch from
March till May and from November till December.
Farming and production systems
Dairy farming in North Rift is mostly done in semi-zero grazing systems, with
access to pastures and generally enough land to grow fodder crops on own or
leased land. Like elsewhere in Kenya the majority of milk produced is from
smallholder farmers who are organized in dairy cooperative societies that collect
and market members’ milk. Average farm sizes of these smallholders is 5 to 10
acres and herd size ranges from 5 to 20 cows, with total milk production for the
majority of smallholders not exceeding 20 kg per day, of which part is used for
home consumption and calves and the balance is sold to neighbors, dairy
cooperatives or hawkers. Smallholder owned and managed dairy cooperatives or
public companies, and their umbrella organizations (federations, union and
associations), collect milk from their members, chill and sell the milk to milk
processors (formal sector) and milk bars (informal sector). They also provide
inputs and services to their members (e.g. bulk purchase and sales of animal
feeds, veterinary products, AI services, credit).
The market study identified 90 (active) dairy societies in the entire North Rift
except in Turkana. These dairy cooperatives have a total membership of approx.
95,000 and together they collect on average 113,770,000 kg of raw milk per year
or 312,000 per day.
North Rift has the largest number of MSFs and LSFs in Kenya, including dairy
farms, with also a higher level of farm mechanization and capitalization than else-
where in Kenya. The majority of farms practice semi-zero grazing using available
pastures in a rotational system. MSFs and LSFs are usually not a member of the
Labour
Force ‘09
Total Popu-
lation ‘09
Total %
in ‘09
Labour
Force ‘17
Total Popu-
lation ‘17
Total %
in ‘17
Uasin Gishu 497,000 895,000 56% 674,663 1,210.000 56%
Trans Nzoia 411,000 820,000 50% 553,000 1,100.000 50%
Nandi 387,000 750,000 52% 496,000 965,000 51%
Table 1. Labour force and total population 2009/2017
16
“smallholder” owned dairy societies referred to above, but sell milk directly to
processors or end-consumers (schools, milk bars, ATMs).
In the market study a total 57 MSFs and LSFs farms were identified, interviewed
and screened on their farm characteristics and needs. This group of dairy farmers
is fast growing. MSFs and LSFs have sufficient land to grow and ability to invest
considerable amounts of cash in for example the herd, cow house, milking and
cooling equipment, farm machinery and herd management software. Often the
owners are (self-) employed in other sectors and invest income and profits from
other businesses in dairy. The farm is in that case run by a farm manager. For the
sake of this study a farm was considered to qualify as an MSF in case daily milk
production was on average between 100 – 600 kg per day. LSFs were defined as
farms with a milk production of 600 kg per day or more. The study listed 45 MSFs
and twelve LSFs in Uasin Gishu, Trans Nzoia and Nandi (NB: included are also LSFs
near Nakuru along the Eldoret – Nakuru corridor).
Input suppliers and service providers
The majority of the smallholder dairy farms in North Rift are still low-input, low-
output. However, the more entrepreneurial smallholders that are in dairy as core
business - and especially the more MSFs and LSFs that are in dairy as core business
– who buy a variety of inputs and use service providers as per the list below. Hence
a wide distribution network exists of so called agro vets or agro dealers, mainly
trading in dairy meals, veterinary products, seeds, fertilizers, chemicals and
genetics (AI). In general the quality of products and the knowledge level of the
supplier and the buyer on the use of the product or the service is low. The same
applies to after sales services and the needs as regards maintenance and repair.
The number of commercial dairy farms in need of quality inputs and services that
go hand in hand with knowledge transfer, is growing. The private sector is the
driver of this process. Unlike in the past where many inputs and services were
provided by the Government at subsidized rates. Off late with the emergence of
county governments, some of these counties have engaged in in free or subsidized
government services, products and equipment, although this has been erratic and
without a long term visions and financing model, this leads to market distortion.
Although veterinary and health services and products are of importance, they are
not within the scope of this research. Farm recording and herd management, dairy
advisory and cow house design are upcoming services where Dutch ISPIs off late
have shown interest to enter and develop market share in Kenya.
Milk marketing
The volume of marketed milk through informal channels is estimated at 70% (Bett,
2017). Many MSFs and LSFs also sell part of their milk through the informal
channel. There are major differences in milk prices, depending on season and
marketing and sales channel (processor, cooperative society or directly as raw milk
to hotels or restaurants, schools, milk bars, and/or milk dispensers (pasteurized)).
The overall average milk price paid to farmers (smallholders and MSFs and LSFs)
17
by cooperative societies or processors is KES 30/kg in the rainy season and KES
40 peak in the dry season. MSFs and LSFs who sell directly to processors and
deliver the milk at factory gate fetch 3-5 KES/kg more. If milk is sold directly to
consumers (schools, restaurants, milk bars) or through ATMs prices ranging from
KES 50-60 are being paid. 26% of MSFs and LSFs considered unstable milk prices
as one of their biggest threats. The study also revealed that only 7% of the farmers
supplying milk to the formal sector get payed based on quality.
Processors
The major processors that collect and/or process milk in North Rift are NKCC,
Brookside, Daima Sameer, Doinyo Lasso’s and Kabiyanga Dairies, and off late also
Bio Foods and Happy Cow Ltd. They buy milk from dairy cooperatives, traders and
directly from farmers (mainly MSFs and LSFs). NKCC has a plant in Eldoret that
has an intake and processing capacity of approx. 500,000 kg per day. However,
only 30% of this capacity is used. It also produces milk powder at this location.
Brookside and Daija have collection and bulking centers in North Rift but they
process this milk collected in Nairobi. Doinyo Lessos and Kabiyanga are two small
processors (< 50,000 kg per day) in Eldoret respectively Kericho. Happy Cow Ltd
is based in Nakuru and Bio Foods in Nairobi. Unlike dairy cooperatives, the milk
processors generally do not at all invest in the supply chain and hence lack any
significant and effective programs, that support dairy farmers through training and
extension or quality controlled input and service provision. This is one of the
reasons that productivity at farm level remains to be low, and since most proces-
sors “buy on volume” (except for Bio Foods) the same applies to milk quality.
4.3 Market Segments and Themes for Dutch ISPIs
Based on the description of the structure of the dairy sector in North Rift and the
main actors in the dairy value chain, the market study identified two segments of
potential business-to-business (B2B) clients:
a) MSFs and LSFs; this group of entrepreneurial commercial farmers is increasing
rapidly and are fully commercialized.
b) Smallholder owned and managed dairy cooperatives (or public companies) and
milk processors present in the Region.
In the next chapters, the market opportunities within the following seven themes
are described and analyzed for these two market segments:
1. Feed, Fodder, Farm Machinery and Agricultural Contracting Services
2. Milking and Cooling Equipment, Milk Processing Equipment
3. Herd Improvement (genetics and young stock)
4. Herd and Farm Management Software, ERP Systems
5. Cow House Design and Interiors
6. Practical Training and Education, Dairy Advisory
7. Finance and Fiscal Policies
18
5. North Rift Market Segments and Dutch ISPIs
The market study identified two major dairy market segments for Dutch ISPIs:
Medium and Large Scale Farms (MSFs & LSFs)
Dairy societies
MSFs are defined in this study as dairy farmers with an average daily milk
production between 100-600 kg. LSFs produce over 600 kg/day. Dairy societies
are (mainly) smallholder farmer organisations that collect, bulk and market milk
from and for their members. They are either cooperatives registered under de
Cooperative Act or public companies (more than 50 shareholders) registered under
the Companies Act. Hereinafter we use the term “cooperative” for both the
cooperative and public company model.
5.1 Sampled MSFs/LSFs and Dairy Societies and Total Numbers
There are no data available on total number of MSFs and LSFs in North Rift. The
study used various sources to get a sampling for drawing a list of MSFs/LSFs for
deep scanning (e.g. Eldoret Dairy Farmers Association, dairy societies’ member-
ship and milk procurement lists, information from milk processors, client list SNV).
The study administered a deep scan of 45 MSFs and 12 LSFs in the three main
dairy counties in North Rift, viz. Uasin Gishu, Trans Nzoia and Nandi (see par. 5.1).
However the total number of MSFs and LSFs in the entire North Rift Region is
higher but hard to determine. One method that can be used is to extrapolate data
found for MSFs/LSFs that were deep scanned as regards “cooperative member-
ship” vis-a-vis” data at cooperative level of number of MSFs and LSFs. The total
number of active cooperatives in North Rift is 90 of which 44 were deep scanned.
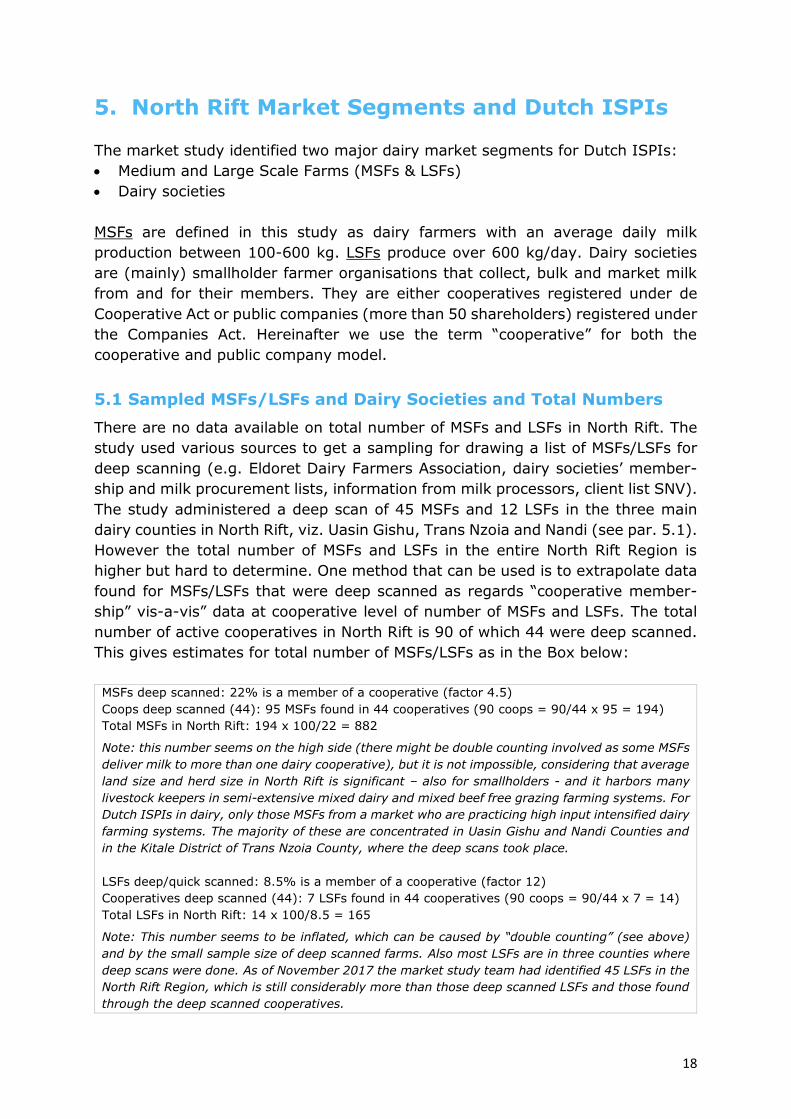
This gives estimates for total number of MSFs/LSFs as in the Box below:
MSFs deep scanned: 22% is a member of a cooperative (factor 4.5)
Coops deep scanned (44): 95 MSFs found in 44 cooperatives (90 coops = 90/44 x 95 = 194)
Total MSFs in North Rift: 194 x 100/22 = 882
Note: this number seems on the high side (there might be double counting involved as some MSFs
deliver milk to more than one dairy cooperative), but it is not impossible, considering that average
land size and herd size in North Rift is significant – also for smallholders - and it harbors many
livestock keepers in semi-extensive mixed dairy and mixed beef free grazing farming systems. For
Dutch ISPIs in dairy, only those MSFs from a market who are practicing high input intensified dairy
farming systems. The majority of these are concentrated in Uasin Gishu and Nandi Counties and
in the Kitale District of Trans Nzoia County, where the deep scans took place.
LSFs deep/quick scanned: 8.5% is a member of a cooperative (factor 12)
Cooperatives deep scanned (44): 7 LSFs found in 44 cooperatives (90 coops = 90/44 x 7 = 14)
Total LSFs in North Rift: 14 x 100/8.5 = 165
Note: This number seems to be inflated, which can be caused by “double counting” (see above)
and by the small sample size of deep scanned farms. Also most LSFs are in three counties where
deep scans were done. As of November 2017 the market study team had identified 45 LSFs in the
North Rift Region, which is still considerably more than those deep scanned LSFs and those found
through the deep scanned cooperatives.
19
Deep scanned Cooperatives Deep scanned MSFs and LSFs
Dairy societies/coops nationwide > 300 Deep scan 57 MSFs and LSFs
Active dairy coops in North Rift 90 MSFs 45 (100 - 599 kg/day)
Quick Scan 83 LSFs 12 (> 600 kg/day)
Deep Scan 44 Quick Scan 7 MSFs and LSFs (Nakuru)
Members (of 83 QS dairy coops) 87,000
Active Members (of 83 QS dairy coops) 32,000
Total Members North Rift (estimated) 95,000
Total Active Members North Rift (estimated) 35,000
Active MSFs (in 44 coops) 95
Active LSFs (in 44 coops) 7
5.2 Market Segment 1: Deep Scan Medium and Large Scale Farmers
Out of the 57 deep scanned MSFs/LSFs in Uasin Gishu, Trans Nzoia and Nandi, 45
farms produce between 100 and 600 kg per day (MSFs). 12 farms (LSFs) have an
average production above 600 kg/day.
The average peak season production is 550 kg/day for all farms (rainy season:
122 days per year), and 400 kg off-peak (dry season: 243 days per year), meaning
that there is an overall average of 450 kg for the 57 farms. This production is with
an average herd size of 116 animals, of which 37 lactating. The rest are dry cows
or young stock. The MSFs and LSFs had an average land size of 502 acre, of which
148 acres for dairy. The average cost price of the nine MSFs and LSFs who are
aware of this, was KES 29.
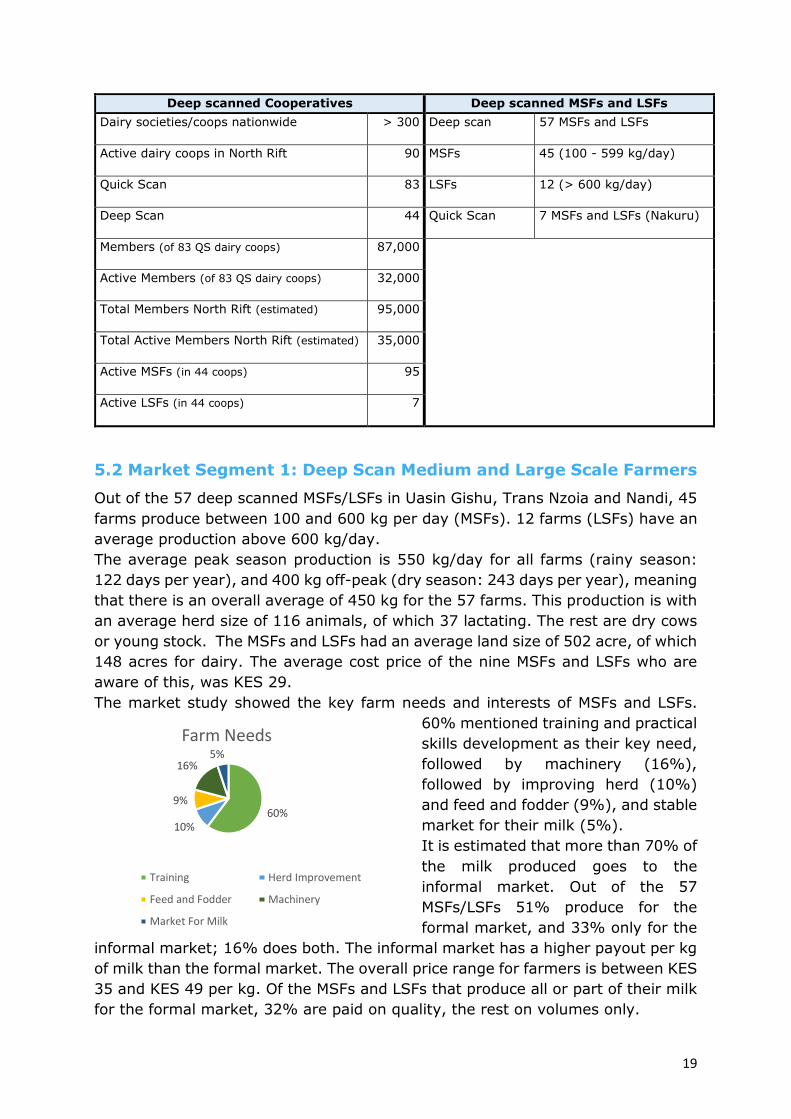
The market study showed the key farm needs and interests of MSFs and LSFs.
60% mentioned training and practical
skills development as their key need,
followed by machinery (16%),
followed by improving herd (10%)
and feed and fodder (9%), and stable
market for their milk (5%).
It is estimated that more than 70% of
the milk produced goes to the
informal market. Out of the 57
MSFs/LSFs 51% produce for the
formal market, and 33% only for the
informal market; 16% does both. The informal market has a higher payout per kg
of milk than the formal market. The overall price range for farmers is between KES
35 and KES 49 per kg. Of the MSFs and LSFs that produce all or part of their milk
for the formal market, 32% are paid on quality, the rest on volumes only.
60%10%
9%
16%5%
Farm Needs
Training Herd Improvement
Feed and Fodder Machinery
Market For Milk
20
Formal Marketing Informal Marketing Both
Out of 57 farms: 29 MSFs/LSFs 19 MSFs/LSFs 9 MSFs/LSFs
% 51% 33% 16%
Range overall price KES 35 - 43 KES 37 - 49 n/a
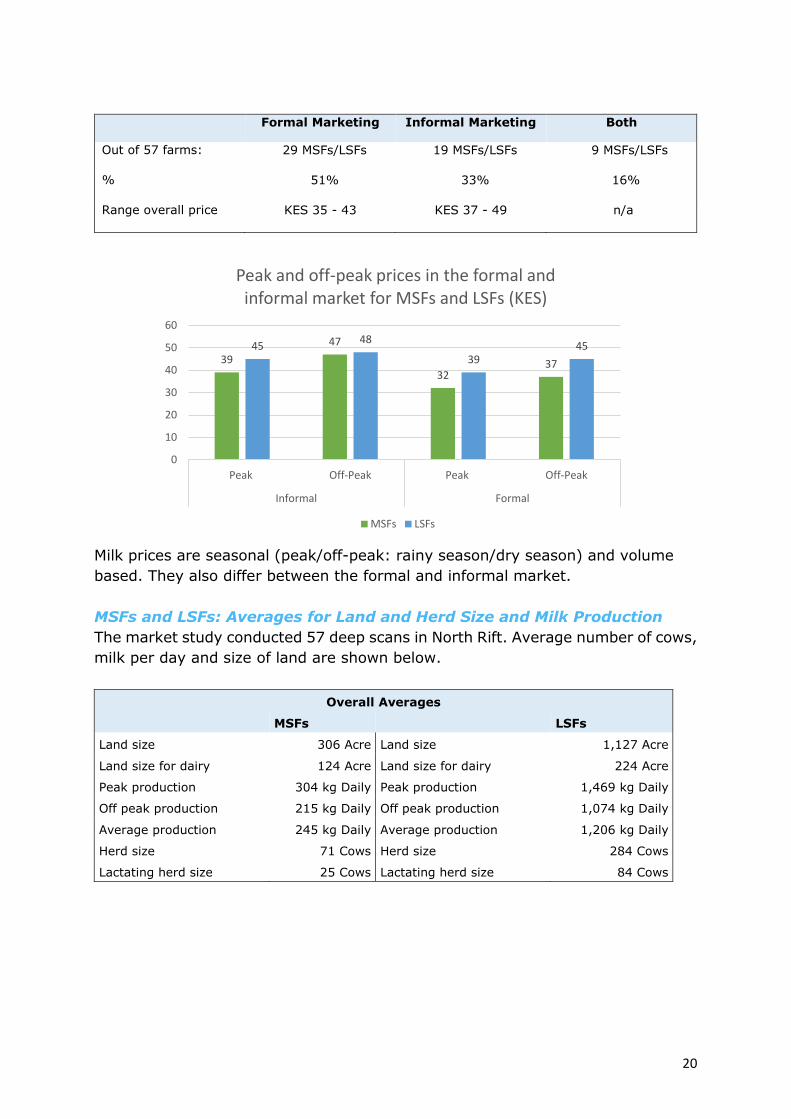
Milk prices are seasonal (peak/off-peak: rainy season/dry season) and volume
based. They also differ between the formal and informal market.
MSFs and LSFs: Averages for Land and Herd Size and Milk Production
The market study conducted 57 deep scans in North Rift. Average number of cows,
milk per day and size of land are shown below.
Overall Averages
MSFs LSFs
Land size 306 Acre Land size 1,127 Acre
Land size for dairy 124 Acre Land size for dairy 224 Acre
Peak production 304 kg Daily Peak production 1,469 kg Daily
Off peak production 215 kg Daily Off peak production 1,074 kg Daily
Average production 245 kg Daily Average production 1,206 kg Daily
Herd size 71 Cows Herd size 284 Cows
Lactating herd size 25 Cows Lactating herd size 84 Cows
39
47
3237
4548
3945
0
10
20
30
40
50
60
Peak Off-Peak Peak Off-Peak
Informal Formal
Peak and off-peak prices in the formal and informal market for MSFs and LSFs (KES)
MSFs LSFs
21
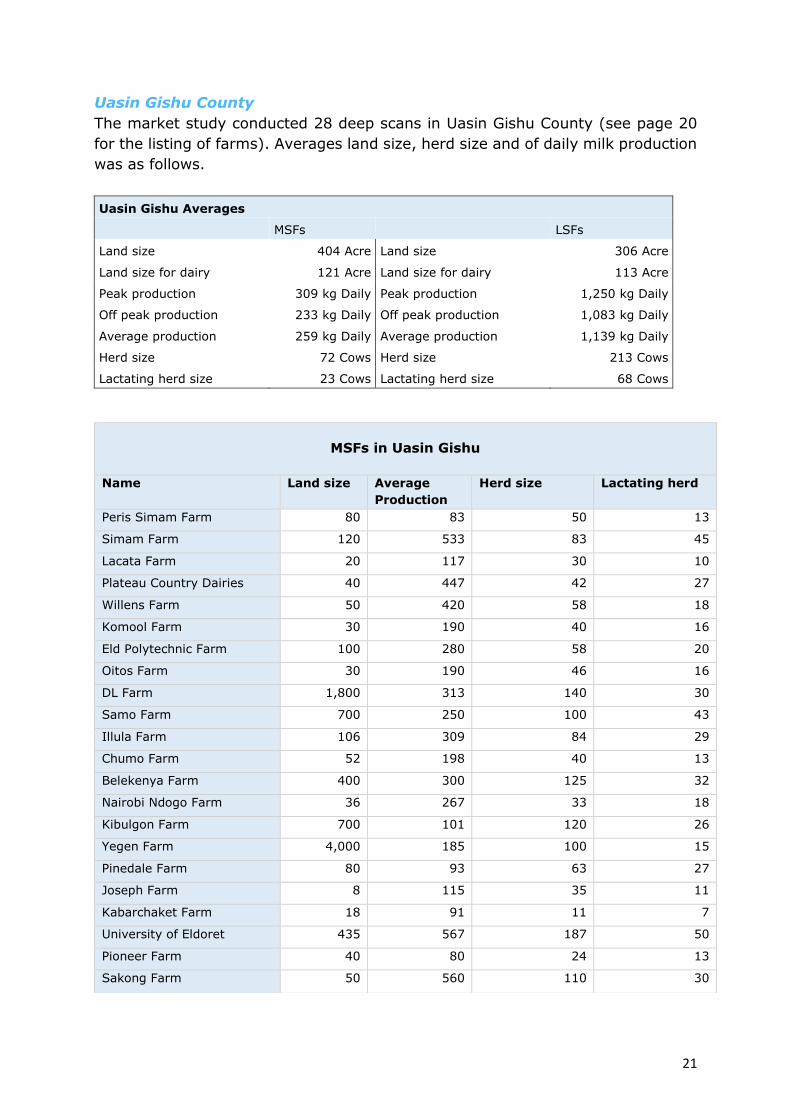
Uasin Gishu County
The market study conducted 28 deep scans in Uasin Gishu County (see page 20
for the listing of farms). Averages land size, herd size and of daily milk production
was as follows.
Uasin Gishu Averages
MSFs LSFs
Land size 404 Acre Land size 306 Acre
Land size for dairy 121 Acre Land size for dairy 113 Acre
Peak production 309 kg Daily Peak production 1,250 kg Daily
Off peak production 233 kg Daily Off peak production 1,083 kg Daily
Average production 259 kg Daily Average production 1,139 kg Daily
Herd size 72 Cows Herd size 213 Cows
Lactating herd size 23 Cows Lactating herd size 68 Cows
MSFs in Uasin Gishu
Name Land size Average
Production
Herd size Lactating herd
Peris Simam Farm 80 83 50 13
Simam Farm 120 533 83 45
Lacata Farm 20 117 30 10
Plateau Country Dairies 40 447 42 27
Willens Farm 50 420 58 18
Komool Farm 30 190 40 16
Eld Polytechnic Farm 100 280 58 20
Oitos Farm 30 190 46 16
DL Farm 1,800 313 140 30
Samo Farm 700 250 100 43
Illula Farm 106 309 84 29
Chumo Farm 52 198 40 13
Belekenya Farm 400 300 125 32
Nairobi Ndogo Farm 36 267 33 18
Kibulgon Farm 700 101 120 26
Yegen Farm 4,000 185 100 15
Pinedale Farm 80 93 63 27
Joseph Farm 8 115 35 11
Kabarchaket Farm 18 91 11 7
University of Eldoret 435 567 187 50
Pioneer Farm 40 80 24 13
Sakong Farm 50 560 110 30
22
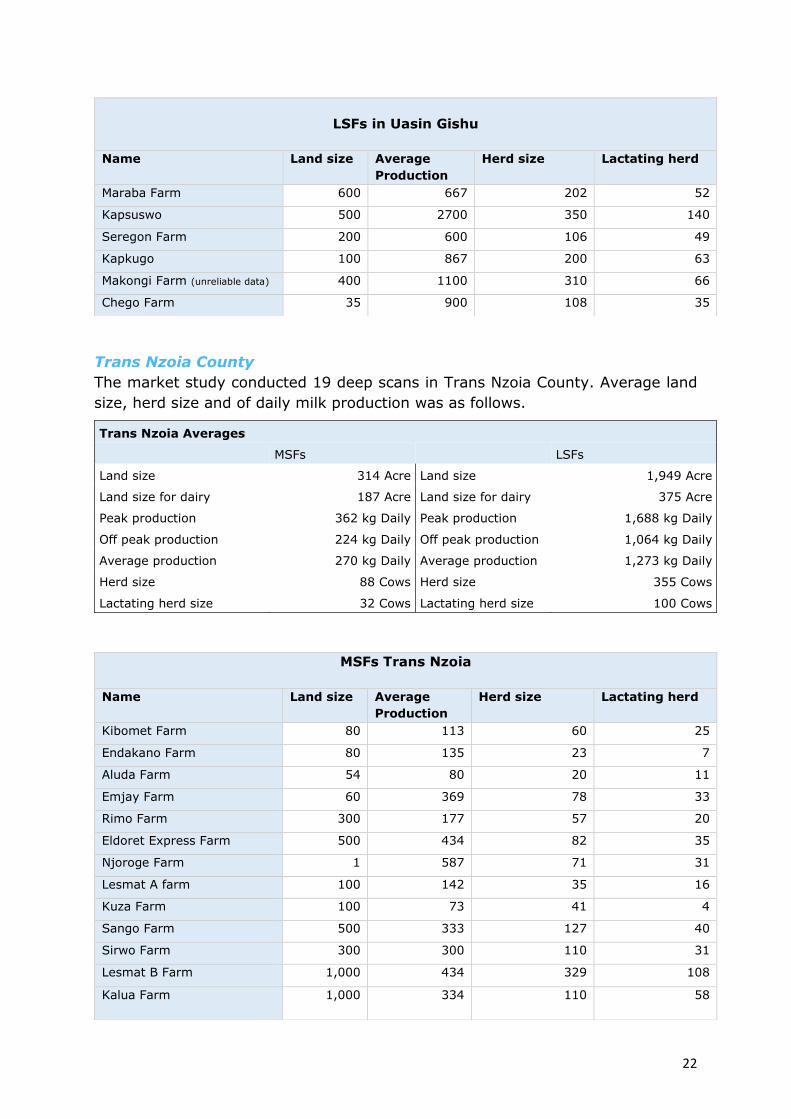
Trans Nzoia County
The market study conducted 19 deep scans in Trans Nzoia County. Average land
size, herd size and of daily milk production was as follows.
LSFs in Uasin Gishu
Name Land size Average
Production
Herd size Lactating herd
Maraba Farm 600 667 202 52
Kapsuswo 500 2700 350 140
Seregon Farm 200 600 106 49
Kapkugo 100 867 200 63
Makongi Farm (unreliable data) 400 1100 310 66
Chego Farm 35 900 108 35
Trans Nzoia Averages
MSFs LSFs
Land size 314 Acre Land size 1,949 Acre
Land size for dairy 187 Acre Land size for dairy 375 Acre
Peak production 362 kg Daily Peak production 1,688 kg Daily
Off peak production 224 kg Daily Off peak production 1,064 kg Daily
Average production 270 kg Daily Average production 1,273 kg Daily
Herd size 88 Cows Herd size 355 Cows
Lactating herd size 32 Cows Lactating herd size 100 Cows
MSFs Trans Nzoia
Name Land size Average
Production
Herd size Lactating herd
Kibomet Farm 80 113 60 25
Endakano Farm 80 135 23 7
Aluda Farm 54 80 20 11
Emjay Farm 60 369 78 33
Rimo Farm 300 177 57 20
Eldoret Express Farm 500 434 82 35
Njoroge Farm 1 587 71 31
Lesmat A farm 100 142 35 16
Kuza Farm 100 73 41 4
Sango Farm 500 333 127 40
Sirwo Farm 300 300 110 31
Lesmat B Farm 1,000 434 329 108
Kalua Farm 1,000 334 110 58
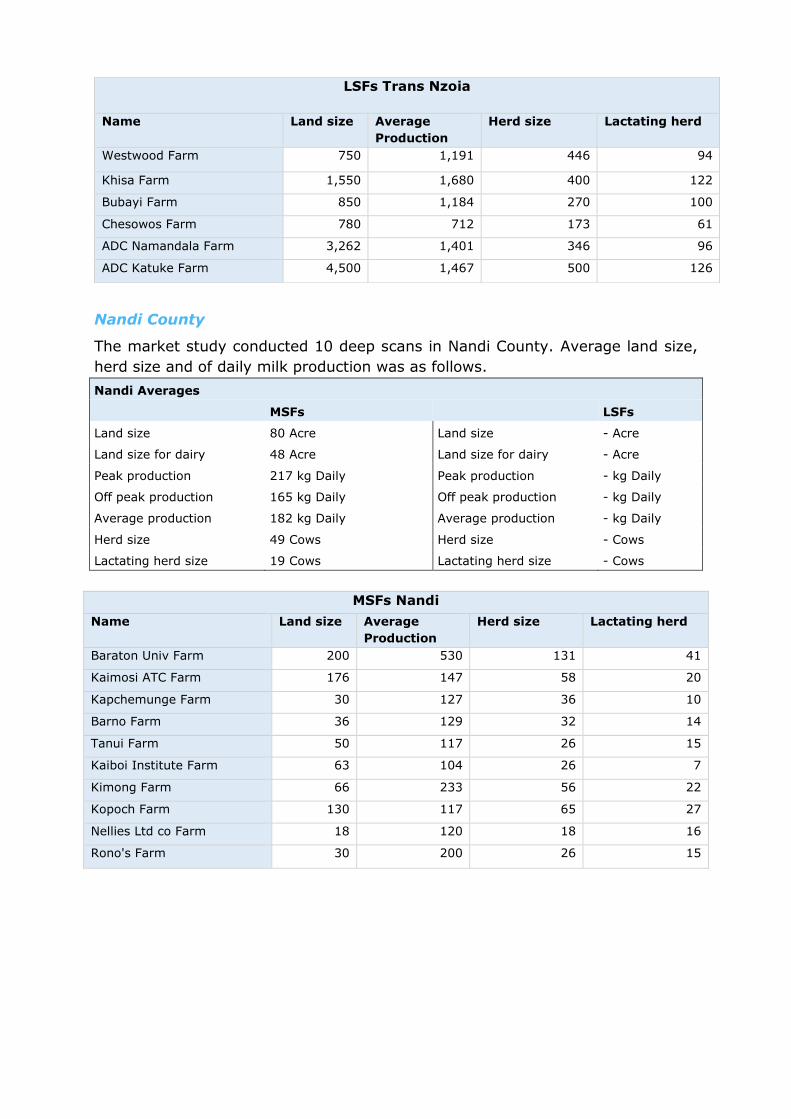
Nandi County
The market study conducted 10 deep scans in Nandi County. Average land size,
herd size and of daily milk production was as follows.
Nandi Averages
MSFs LSFs
Land size 80 Acre Land size - Acre
Land size for dairy 48 Acre Land size for dairy - Acre
Peak production 217 kg Daily Peak production - kg Daily
Off peak production 165 kg Daily Off peak production - kg Daily
Average production 182 kg Daily Average production - kg Daily
Herd size 49 Cows Herd size - Cows
Lactating herd size 19 Cows Lactating herd size - Cows
MSFs Nandi
Name Land size Average
Production
Herd size Lactating herd
Baraton Univ Farm 200 530 131 41
Kaimosi ATC Farm 176 147 58 20
Kapchemunge Farm 30 127 36 10
Barno Farm 36 129 32 14
Tanui Farm 50 117 26 15
Kaiboi Institute Farm 63 104 26 7
Kimong Farm 66 233 56 22
Kopoch Farm 130 117 65 27
Nellies Ltd co Farm 18 120 18 16
Rono's Farm 30 200 26 15
LSFs Trans Nzoia
Name Land size Average
Production
Herd size Lactating herd
Westwood Farm 750 1,191 446 94
Khisa Farm 1,550 1,680 400 122
Bubayi Farm 850 1,184 270 100
Chesowos Farm 780 712 173 61
ADC Namandala Farm 3,262 1,401 346 96
ADC Katuke Farm 4,500 1,467 500 126
24
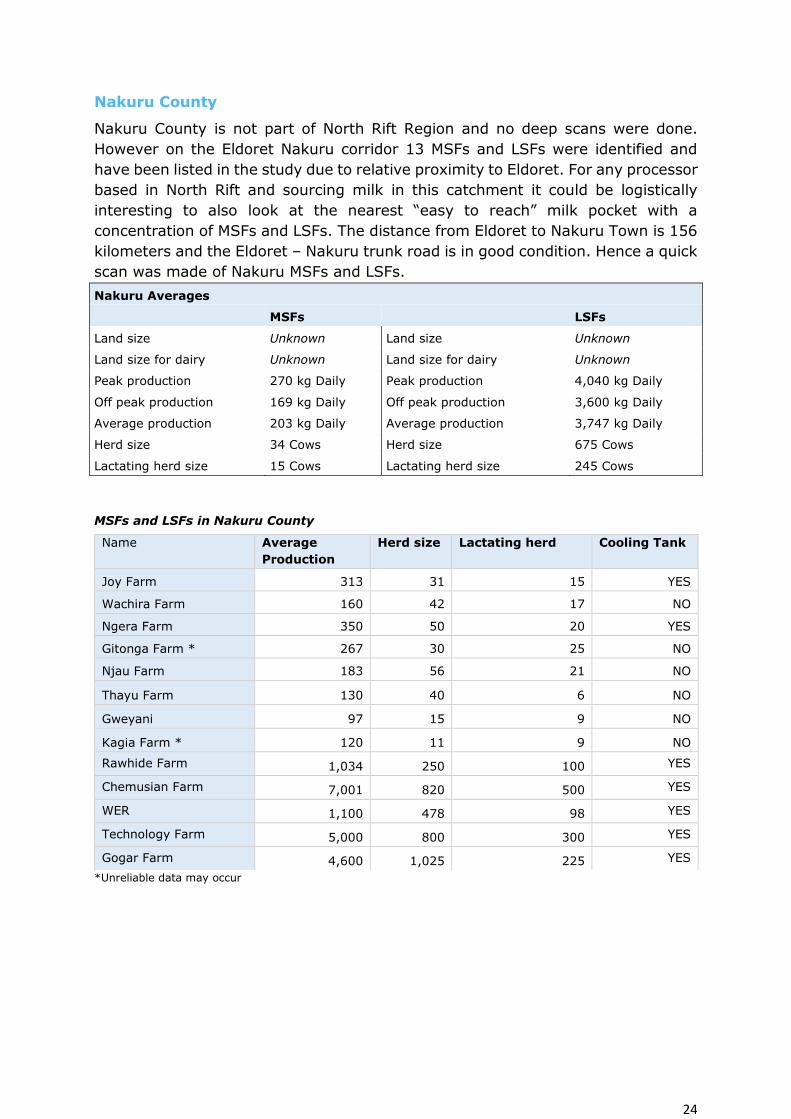
Nakuru County
Nakuru County is not part of North Rift Region and no deep scans were done.
However on the Eldoret Nakuru corridor 13 MSFs and LSFs were identified and
have been listed in the study due to relative proximity to Eldoret. For any processor
based in North Rift and sourcing milk in this catchment it could be logistically
interesting to also look at the nearest “easy to reach” milk pocket with a
concentration of MSFs and LSFs. The distance from Eldoret to Nakuru Town is 156
kilometers and the Eldoret – Nakuru trunk road is in good condition. Hence a quick
scan was made of Nakuru MSFs and LSFs.
Nakuru Averages
MSFs LSFs
Land size Unknown Land size Unknown
Land size for dairy Unknown Land size for dairy Unknown
Peak production 270 kg Daily Peak production 4,040 kg Daily
Off peak production 169 kg Daily Off peak production 3,600 kg Daily
Average production 203 kg Daily Average production 3,747 kg Daily
Herd size 34 Cows Herd size 675 Cows
Lactating herd size 15 Cows Lactating herd size 245 Cows
MSFs and LSFs in Nakuru County
*Unreliable data may occur
Name Average
Production
Herd size Lactating herd Cooling Tank
Joy Farm 313 31 15 YES
Wachira Farm 160 42 17 NO
Ngera Farm 350 50 20 YES
Gitonga Farm * 267 30 25 NO
Njau Farm 183 56 21 NO
Thayu Farm 130 40 6 NO
Gweyani 97 15 9 NO
Kagia Farm * 120 11 9 NO
Rawhide Farm 1,034 250 100 YES
Chemusian Farm 7,001 820 500 YES
WER 1,100 478 98 YES
Technology Farm 5,000 800 300 YES
Gogar Farm 4,600 1,025 225 YES
25
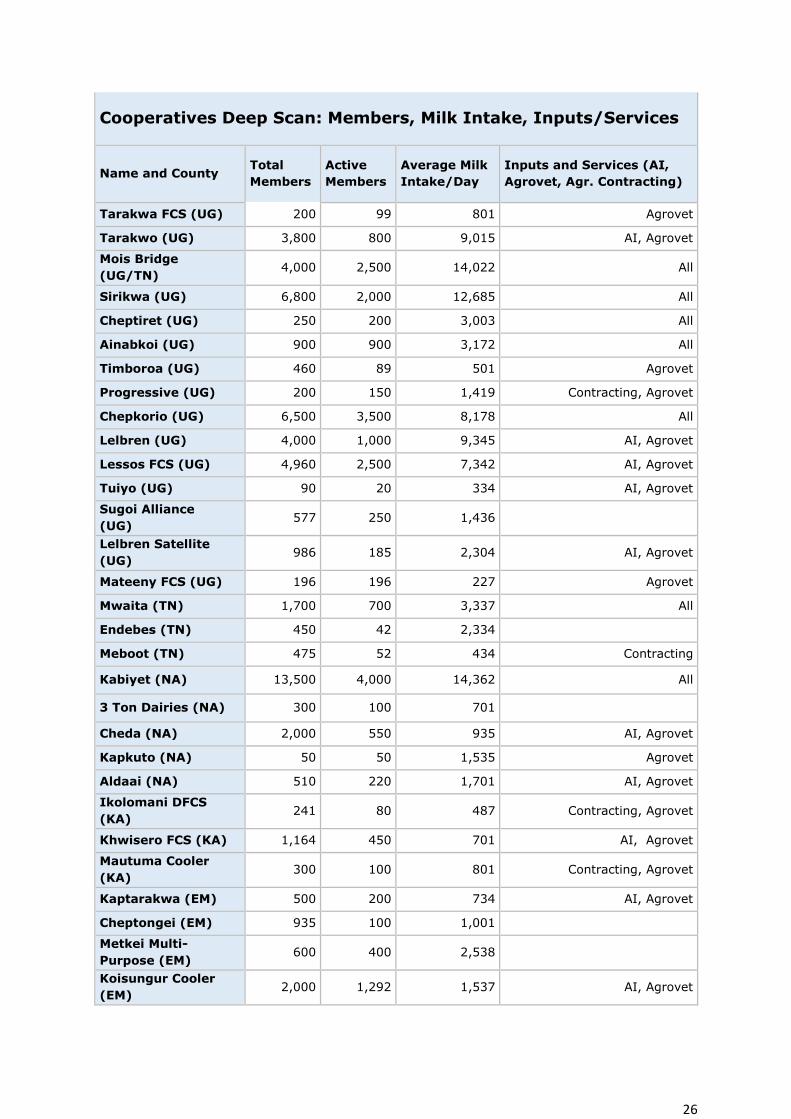
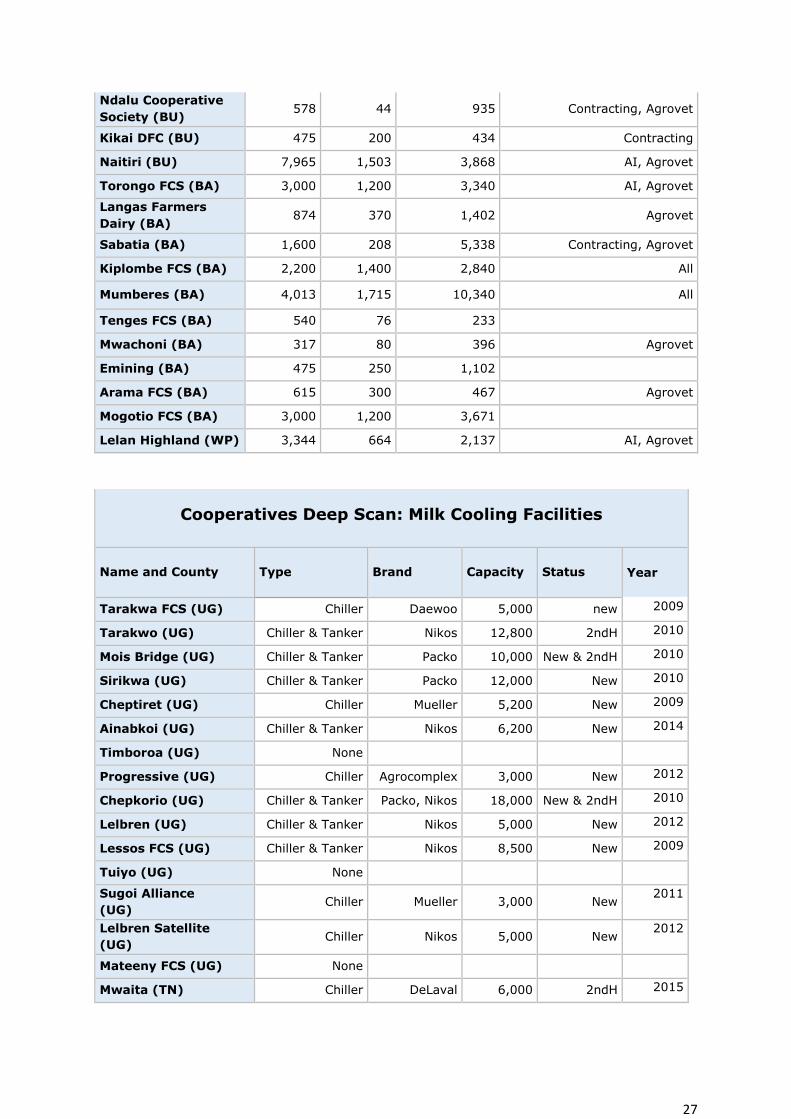
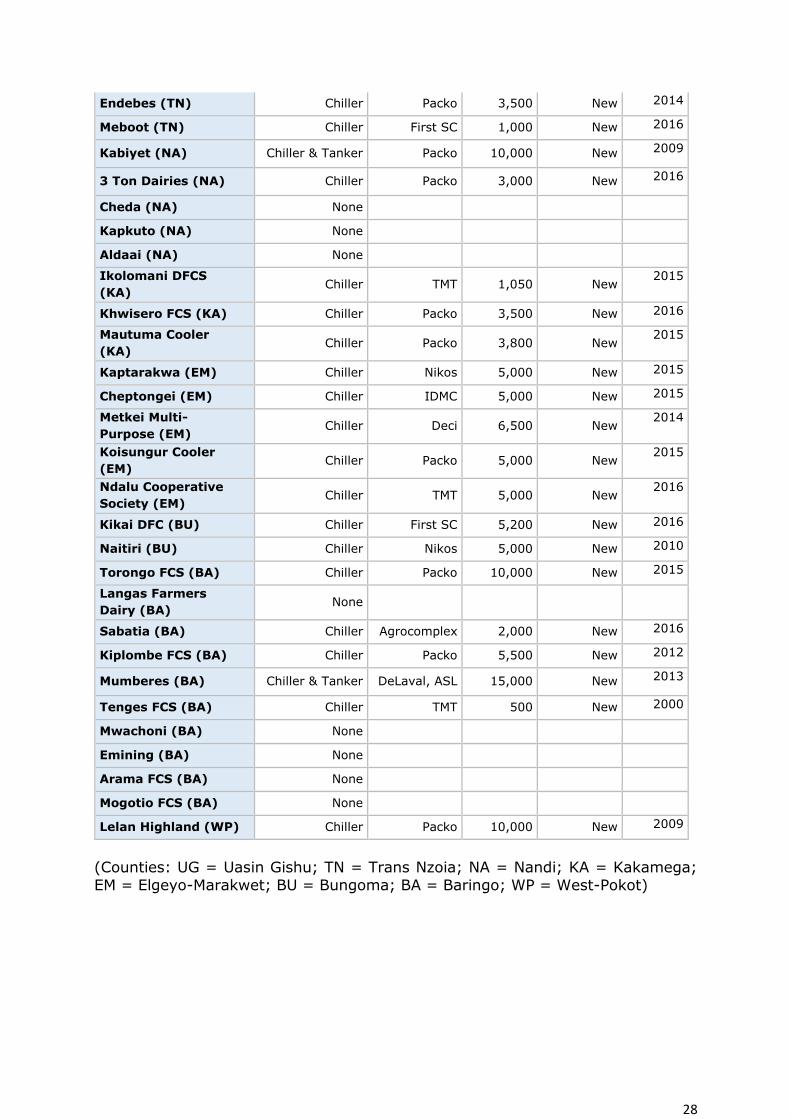
5.3 Market Segment 2: Deep Scan Dairy Cooperatives
The market study made an inventory of all cooperatives in the North Rift counties
Uasin Gishu (UG), Trans Nzoia (TN), Nandi (NA), Baringo (BA), Bungoma (BU),
Elgeyo-Marakwet (EM), Kakamega (KA) and West Pokot (WP). A list over 200 dairy
cooperatives was provided by the Kenya Dairy Board (KDB), of which 81 were
found to be active (Annex 2). 44 deep scans were conducted (50%) as per the
list below. The deep scans in the contain information on membership, average
daily milk intake, inputs and services and milk cooling equipment (see the two
tables below).
Almost all 44 cooperatives offered their farmers access to inputs and services
through check-off system, whereby active members can buy farm inputs and pay
through money deducted from their milk deliveries. This service was offered in
collaboration with a SACCO or a local bank.
All cooperatives collect milk from their members, sometimes directly but mostly
through milk collection points in the routes and hired transporters with vehicles
and motorbikes or even donkey carts.
A good number of cooperatives also provides AI services and operate an agrovet
shop where they sell amongst others seeds, dairy meals, minerals and veterinary
products. Some have farm machinery to plough land and harvest fodder crops for
their members (agricultural contracting services).
Most had staff for milk procurement and farmer training/extension. The deep scans
showed that there is a positive correlation between the number of extension
officers and the amount of milk received by the dairy cooperatives. Additionally
there is a strong positive correlation between the total number of members of a
cooperative and the total staff they employ, more important the extension officers
and the active members. Moreover, the market study showed a positive correlation
between the number of extension officers and the amount of milk sourced by the
cooperatives.
The average annual milk price paid over the year (12 months preceding the deep
scan) for the 44 cooperatives ranged from KES 26 to 70 depending on season and
the location/distance of the cooperative to the market. Also this depends on the
share of milk sold by the cooperatives to processors or directly as raw milk to
consumers/retailers. The total average for all cooperatives and over the entire 12
month period was around KES 34.
Four cooperatives were involved in mini processing: Tarakwa FCS (UG), Moi’s
Bridge Dairies (UG), Naitiri DFCS (BU) and Mogotio FCS (BA). During the deep
scan it was noted that seven cooperatives had plans to start processing: Kabiyet,
Mumberes, Sirikwa, Chepkorio, Kiplombe, Mwaita and Khwisero.
26
Cooperatives Deep Scan: Members, Milk Intake, Inputs/Services
Name and County Total
Members
Active
Members
Average Milk
Intake/Day
Inputs and Services (AI,
Agrovet, Agr. Contracting)
Tarakwa FCS (UG) 200 99 801 Agrovet
Tarakwo (UG) 3,800 800 9,015 AI, Agrovet
Mois Bridge
(UG/TN) 4,000 2,500 14,022 All
Sirikwa (UG) 6,800 2,000 12,685 All
Cheptiret (UG) 250 200 3,003 All
Ainabkoi (UG) 900 900 3,172 All
Timboroa (UG) 460 89 501 Agrovet
Progressive (UG) 200 150 1,419 Contracting, Agrovet
Chepkorio (UG) 6,500 3,500 8,178 All
Lelbren (UG) 4,000 1,000 9,345 AI, Agrovet
Lessos FCS (UG) 4,960 2,500 7,342 AI, Agrovet
Tuiyo (UG) 90 20 334 AI, Agrovet
Sugoi Alliance
(UG) 577 250 1,436
Lelbren Satellite
(UG) 986 185 2,304 AI, Agrovet
Mateeny FCS (UG) 196 196 227 Agrovet
Mwaita (TN) 1,700 700 3,337 All
Endebes (TN) 450 42 2,334
Meboot (TN) 475 52 434 Contracting
Kabiyet (NA) 13,500 4,000 14,362 All
3 Ton Dairies (NA) 300 100 701
Cheda (NA) 2,000 550 935 AI, Agrovet
Kapkuto (NA) 50 50 1,535 Agrovet
Aldaai (NA) 510 220 1,701 AI, Agrovet
Ikolomani DFCS
(KA) 241 80 487 Contracting, Agrovet
Khwisero FCS (KA) 1,164 450 701 AI, Agrovet
Mautuma Cooler
(KA) 300 100 801 Contracting, Agrovet
Kaptarakwa (EM) 500 200 734 AI, Agrovet
Cheptongei (EM) 935 100 1,001
Metkei Multi-
Purpose (EM) 600 400 2,538
Koisungur Cooler
(EM) 2,000 1,292 1,537 AI, Agrovet
27
Ndalu Cooperative
Society (BU) 578 44 935 Contracting, Agrovet
Kikai DFC (BU) 475 200 434 Contracting
Naitiri (BU) 7,965 1,503 3,868 AI, Agrovet
Torongo FCS (BA) 3,000 1,200 3,340 AI, Agrovet
Langas Farmers
Dairy (BA) 874 370 1,402 Agrovet
Sabatia (BA) 1,600 208 5,338 Contracting, Agrovet
Kiplombe FCS (BA) 2,200 1,400 2,840 All
Mumberes (BA) 4,013 1,715 10,340 All
Tenges FCS (BA) 540 76 233
Mwachoni (BA) 317 80 396 Agrovet
Emining (BA) 475 250 1,102
Arama FCS (BA) 615 300 467 Agrovet
Mogotio FCS (BA) 3,000 1,200 3,671
Lelan Highland (WP) 3,344 664 2,137 AI, Agrovet
Cooperatives Deep Scan: Milk Cooling Facilities
Name and County Type Brand Capacity Status
Year
Tarakwa FCS (UG) Chiller Daewoo 5,000 new 2009
Tarakwo (UG) Chiller & Tanker Nikos 12,800 2ndH 2010
Mois Bridge (UG) Chiller & Tanker Packo 10,000 New & 2ndH 2010
Sirikwa (UG) Chiller & Tanker Packo 12,000 New 2010
Cheptiret (UG) Chiller Mueller 5,200 New 2009
Ainabkoi (UG) Chiller & Tanker Nikos 6,200 New 2014
Timboroa (UG) None
Progressive (UG) Chiller Agrocomplex 3,000 New 2012
Chepkorio (UG) Chiller & Tanker Packo, Nikos 18,000 New & 2ndH 2010
Lelbren (UG) Chiller & Tanker Nikos 5,000 New 2012
Lessos FCS (UG) Chiller & Tanker Nikos 8,500 New 2009
Tuiyo (UG) None
Sugoi Alliance
(UG) Chiller Mueller 3,000 New
2011
Lelbren Satellite
(UG) Chiller Nikos 5,000 New
2012
Mateeny FCS (UG) None
Mwaita (TN) Chiller DeLaval 6,000 2ndH 2015
28
Endebes (TN) Chiller Packo 3,500 New 2014
Meboot (TN) Chiller First SC 1,000 New 2016
Kabiyet (NA) Chiller & Tanker Packo 10,000 New 2009
3 Ton Dairies (NA) Chiller Packo 3,000 New 2016
Cheda (NA) None
Kapkuto (NA) None
Aldaai (NA) None
Ikolomani DFCS
(KA) Chiller TMT 1,050 New
2015
Khwisero FCS (KA) Chiller Packo 3,500 New 2016
Mautuma Cooler
(KA) Chiller Packo 3,800 New
2015
Kaptarakwa (EM) Chiller Nikos 5,000 New 2015
Cheptongei (EM) Chiller IDMC 5,000 New 2015
Metkei Multi-
Purpose (EM) Chiller Deci 6,500 New
2014
Koisungur Cooler
(EM) Chiller Packo 5,000 New
2015
Ndalu Cooperative
Society (EM) Chiller TMT 5,000 New
2016
Kikai DFC (BU) Chiller First SC 5,200 New 2016
Naitiri (BU) Chiller Nikos 5,000 New 2010
Torongo FCS (BA) Chiller Packo 10,000 New 2015
Langas Farmers
Dairy (BA) None
Sabatia (BA) Chiller Agrocomplex 2,000 New 2016
Kiplombe FCS (BA) Chiller Packo 5,500 New 2012
Mumberes (BA) Chiller & Tanker DeLaval, ASL 15,000 New 2013
Tenges FCS (BA) Chiller TMT 500 New 2000
Mwachoni (BA) None
Emining (BA) None
Arama FCS (BA) None
Mogotio FCS (BA) None
Lelan Highland (WP) Chiller Packo 10,000 New 2009
(Counties: UG = Uasin Gishu; TN = Trans Nzoia; NA = Nandi; KA = Kakamega;
EM = Elgeyo-Marakwet; BU = Bungoma; BA = Baringo; WP = West-Pokot)
29
5.4 Impressions of ISPIs Perspectives on Doing Business in Kenya
In March 2017, twelve Dutch ISPIs were interviewed in the Netherlands. Others
were interviewed in Kenya during the field research. These interviews provided
insight in the perception and strategies of Dutch ISPIs as regards doing business
in Kenya/North Rift. For the list of ISPIs interviewed in March 2017: see Annex 3.
A list of all ISPIs currently doing business in Kenya, either through local presence,
agents or directly from the Netherlands is provided in Annex 4.
5.4.1 Perspective on Kenya / Kenya Dairy Sector Dutch ISPIs had both negative and positive perspectives on Kenya, the North Rift,
and the Kenyan dairy sector. These perspectives do not necessarily reflect the
reality on the ground. Dutch ISPIs have in general a rather negative perspective
on the Kenyan market. They seem not to realize or appreciate sufficiently that –
compared to the Netherlands - the level of development is different, as is the
(business) culture. Critical is the low knowledge and skills level throughout the
whole value chain, with in addition a lower work ethics compared to the Nether-
lands. How to deal with a semi-formalized sector and nosiness environment is also
a challenge for Dutch ISPIs. On the other hand they see the potential and
opportunities of the Kenyan dairy sector. One of the interviewees selling cooling
and milking equipment to Kenya noted:
‘’I think the Kenyan dairy sector is at the brink of a revolution, the demand for fresh milk
is high. In Nairobi you can sell your milk in plastic bags on the side of the road for prices
that are higher than in Holland’’.
Most ISPIs recognize the fast-growing economy and middle-class, and Kenya being
the economic hub in East Africa. On the other hand the general perception is that
Kenyan farmers lack the financial means to invest, especially in more capital
intensive farm machinery, equipment and services.
5.4.2 Strategies used by Dutch ISPIs in Kenya
All ISPIs interviewed have their own strategy to enter the Kenya market. What is
a profitable business model for one, would not be successful for another. The below
is merely a summary of the strategies used by the ISPIs. The market study showed
a clear difference between ISPIs that are locally present, and those working via
agents or distributors.
Local presence
These ISPIs have a local network and are close to the clients. They understand the
market better, the needs and cultural factors, and the dynamics at play in the
enabling environment. They get direct feedback from their clients being close to
them and in direct contact. This allows them also to tailor make products, services,
contracts and give after sales services and advise.
30
Working via a distributor/agent
This strategy requires less upfront investment. In addition the ISPI can benefit
from the market insight, experience and the network of the distributor and the
network of the distributor can be used. This is often the arrangement for relative
low priced bulk products (feed, pre-mixes, semen) that are sold into the markets
via agents or distributors. The products require relatively low training for sales and
marketing and low adaptation to the Kenyan market.
Client Selection
Some ISPIs apply strict selection criteria regarding sales of their products and
clients. In this strategy, it is not uncommon for ISPIs to decline clients who are
not ‘ready’ for the product or service. This to ensure client satisfaction and proper
use of the product to avoid reputational damage and bad press.
After sales care
Several ISPIs have a strong focus on after sales care to ensure the right use of
their products and satisfied clients.
Demos
This is a way to introduce products and show the impact on business profitability
and product quality for the client. All ISPIs believe this is an important strategy to
enter the market. In Kenya ‘seeing is believing’.
5.4.3 North Rift Dairy Stakeholder and Dutch ISPI Needs
Kenyan clients/stakeholders expressed the following needs and requirements for
doing business with suppliers of inputs and services:
Local presence
Total Package: (provide products that are fitted/tailored to the local needs, and
which go with training, after sales service, good supply of spare parts, etc.)
Consistent Supply: make sure the product or service is always available.
Dutch ISPIs expressed the need for reliable and accurate information and data on
the sector, specific for their products or services. Current information is often
unreliable or not available at all and too general (national data and trends). This
makes strategic decision making difficult.
31
6. Needs Assessment and Market Opportunities (Results from the deep scans)
As explained before this study identified 2 types of potential B2B clients:
a) Medium and Large Scale dairy Farmers (MSFs/LSFs). This group of farmers is
increasing rapidly and are fully commercialized.
b) Smallholder dairy societies (cooperatives) that collect, bulk and market milk to
processors and provide inputs to their members.
Based on the results of the deep scans, characterization of potential clients was
done, and a needs assessment was made for MSFs/LSFs on one hand, and for
cooperatives on the other hand, also reflecting the market opportunities for Dutch
ISPIs. This is done according to the pre-determined themes:
1. Feed, Fodder, Farm Machinery and Agricultural Contracting Services
2. Milking and Cooling Equipment, Milk Processing Equipment
3. Herd Improvement (genetics and young stock)
4. Herd and Farm Management Software, ERP Systems
5. Cow House Design and Interiors
6. Practical Training and Education, Dairy Advisory
7. Finance and Fiscal Policies
6.1 Feeds, Fodder, Farm Machinery & Agricultural Contracting
North Rift – and Kenya dairy sector in general - forms a huge market for feeds in
form of concentrates and dairy meals, pre-mixes and minerals, and of late also
milk replacers for calf rearing were introduced. The feed manufacturing sector in
Kenya is robust with strong brands like Unga Feeds, Twiga Feeds, Pioneer and
many others – some operating regional and others at a national level. Information
on feed manufacturers and major brands can be derived from the BLGG/SNV Feed
and Fodder Study that can be downloaded from www.cowsoko.com/KMDP
Studies by BLGG/SNV and others show that dairy meals are usually of low quality
and below the (Kenya Bureau of Standards/KEBS and international) standards as
regards main nutrients (especially protein and with high crude ash %). A rule of
thumb is that 1 kg of dairy meal in Kenya under good management will give the
farmer 1.5-1.6 liters of milk, whereas in Europe this is 2.0 liters of milk.
Most smallholder farmers buy ready-made dairy meals. A large part of MSFs and
LSFs buy feed ingredients such as cotton seed or sun flower press cakes, fishmeal,
maize bran, soy and others, and they mix their own dairy meals. Most of these
feedstuffs are imported from neighboring countries (please see the SNV/BLGG
study for raw materials/ingredients in the market).
Farmers sourcing raw materials/feed ingredients for making their own dairy meals
are prone to large fluctuation in availability and consistency in quality of different
batches. Also the risk of aflatoxin contamination is high in these by-products that
32
are not quality controlled. Yet mixing one’s own dairy meal is generally much
cheaper than buying ready-made dairy meal from the feed manufacturers.
The need for year round access to good quality high energy and protein fodder is
huge. The lack of this presents the largest problem for most dairy farmers in Kenya
to run a profitable dairy enterprise. This also applies to North Rift where land sizes
are generally larger than in other high potential dairy areas in Kenya.
Pastures for (rotational) grazing are available but not well managed. Commercial
hay production is big in Kenya but of poor quality. Grass (for pastures and for hay
and mainly Boma Rhodes, Star grass and Kikuyu grass) is not fertilized and
managed well. Harvesting is at the wrong time with as a result grass hay being
low in protein and high in non-digestible fibers.
Production of maize silage (and also silages of oaths and fodder sorghum) are
practiced by most MSFs and LSFs, and increasingly also by entrepreneurial
smallholders. But quantitates (fodder planning!) and quality is usually insufficient
and low. Grass silage is largely unknown. Lucerne as a commercial fodder hay is
grown mainly around Naivasha but in short supply and also not of prime quality
(currently several investors are looking at the feasibility of upscaling lucerne
production under pivot irrigation systems).
In addition to that Kenya has poor access to high yielding hybrid fodder seeds for
almost all fodder crops, be it fodder maize, sorghum, lucerne, grasses and other
crops. This is largely due to the long and cumbersome process of registration of
new seed varieties in the country, however the demand for new and improved
fodder seed varieties is large and growing.
In spite of this, and partly as a result of KMDP, there is a fast growing awareness
of the importance of good quality fodder amongst farmers, small and large. The
market for both agricultural contractors who provide on-farm fodder production
and preservation (silaging, baling) services, and for commercial fodder production
is growing. As for the latter, the grass hay market and scope for improved quality
is huge, but alongside there is a segment of farmers that is in need and are aware
of the importance of quality fodders like lucerne hay and baled silages (e.g. maize,
sorghum, grass). These are very competitive compared with the price and quality
of hay.
Several pilots were – or are being - started under SNV KMDP for improved (quality)
hay production and marketing, agricultural contracting services (Nundoroto,
Dejirene, others) and baling of maize and other silages (Gogar, FIT Ltd, AgVenture
Group). Compared to other dairy pockets in Kenya, North Rift consists of larger
farms, making fodder production and mechanization more common. The demand
for professional agricultural contracting services for maize silage is big. The market
response is that the number of agricultural contractors is increasing, which has a
positive influence on productivity and quality of fodder. Demand for farm
machinery for fodder production and preservation is therefore growing amongst
agricultural contractors, MSFs and LSFs, but also dairy cooperatives started
providing this service to their members.
33
Currently, second hand and refurbished machinery are dominating the market,
mainly imported from outside Africa, sometimes subsidized by the government.
The quality of the machinery is often low and rarely offered with service or training.
However, the market for new machinery is emerging, as specialization and increa-
sing farm sizes and level of professionalism are rising. North Rift is known for being
the major crop producing region of Kenya and the highest in farm mechanization.
6.1.1 MSFs and LSFs
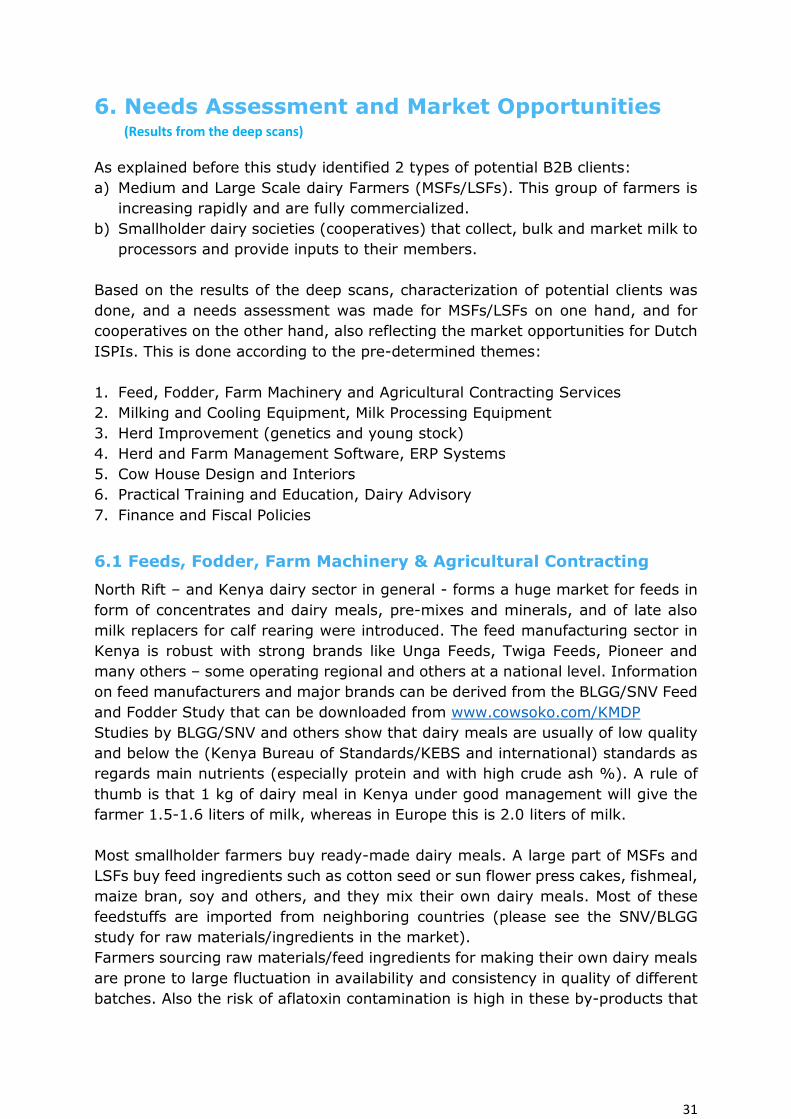
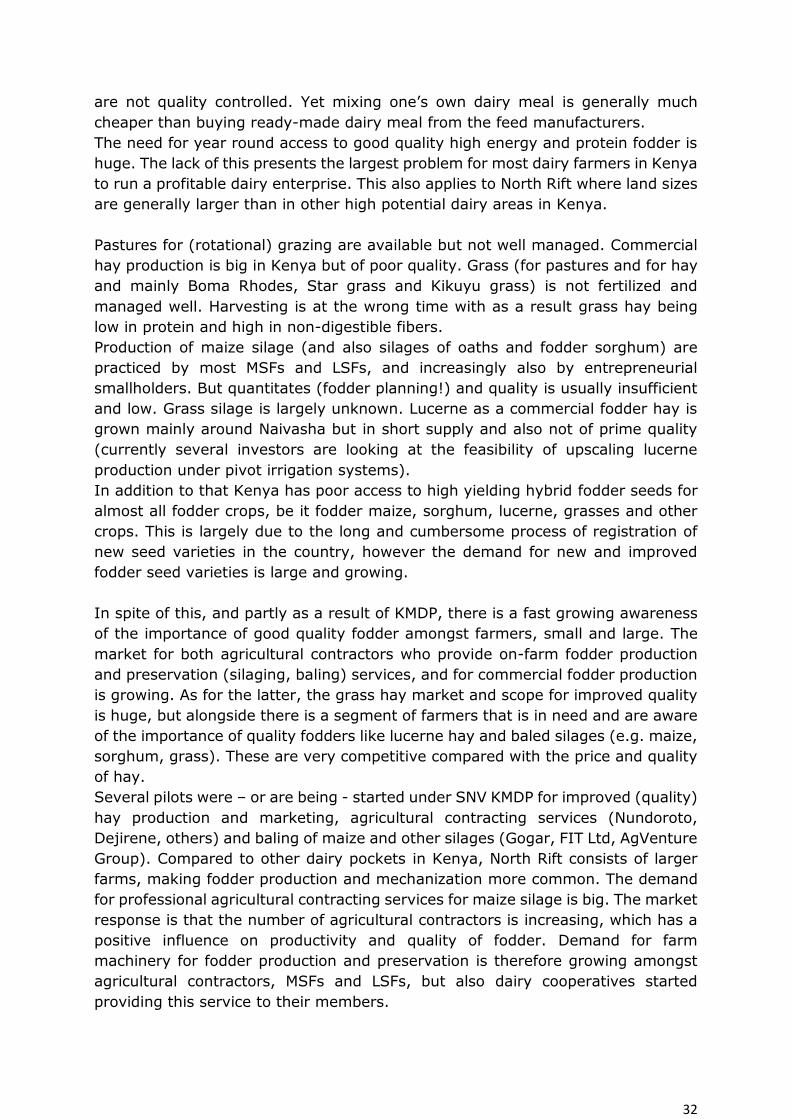
Use of Agricultural Contractors
42% of the MSFs and 33% of the LSFs employ contractors for different services
e.g. land preparation, seeding and silage making. 4% of the MSFs offer them-
selves agricultural contracting services to others.
Strength Weakness
- Demand for used and refurbished machinery - Emerging market for new machinery
- Increasing awareness for quality feed and fodder.
- Professionalising agricultural contractors. - Common use of dairy meal, pre-mixes,
minerals. Increasing use of milk replacers.
- Low quality of feed and fodder and inputs. - Poor availability of mechanics, spares and
tools. - Fluctuating production of feed and fodder - Preference of MSFs and LSFs for low cost, low
quality products and machinery (e.g. from
China). - Knowledge gap in feed rationing.
Opportunity Threat
- Large plots compared to the rest of Kenya.
- Fodder production by MSFs and LSFs is common.
- Crop producing area with favourable climate conditions and possibilities.
- Need/awareness to reduce cost of production
through enhanced feed/ fodder quality
- Seasonality.
- Tedious and costly procedures for import duties and other costs involved.
- Weak regulation of quality standards. - Market distortions through donor and
government investments.
42%
29%
4%
24%
Contractor use by MSFs
Use contractor No contractor use
Contract themselves Unknown
33%
33%
0%
33%
Contractor use by LSFs
Use contractor No contractor Use
Contract themselves Unknown
34
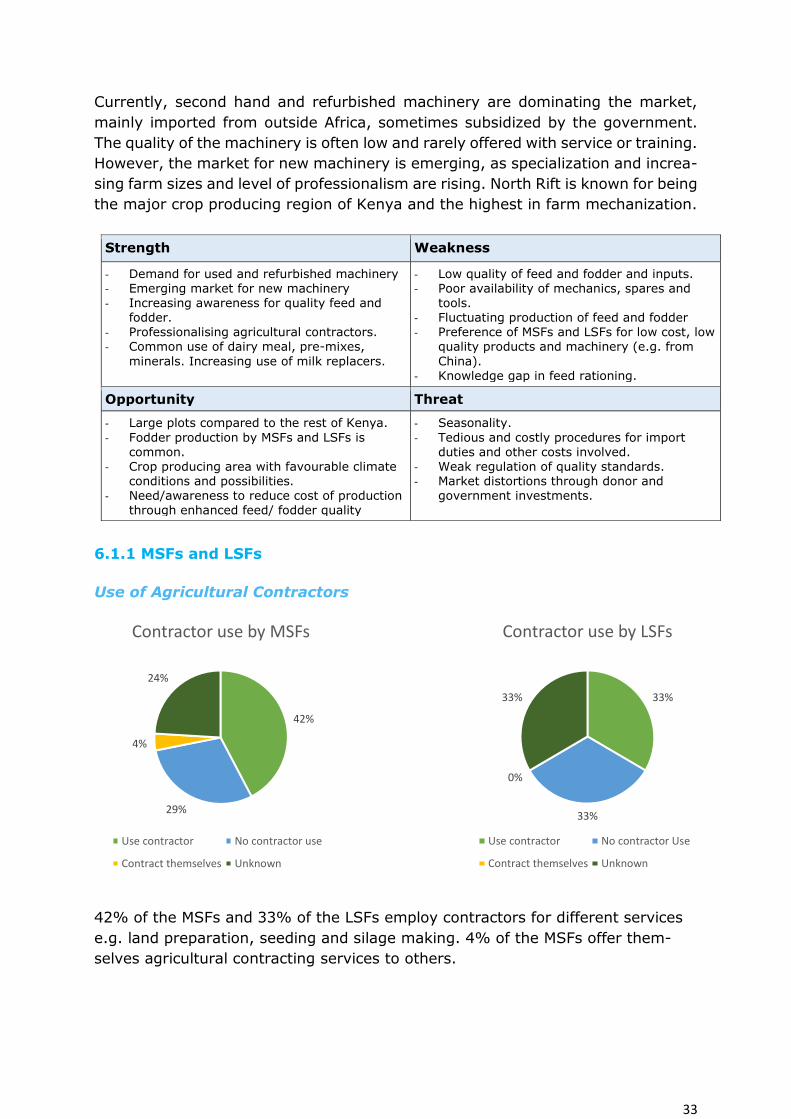
Farm Machinery
The majority of MSFs/LSFs (93%) own farm machinery such as tractors, ploughs.
Other machinery owned are different types of harvesters, choppers and so on.
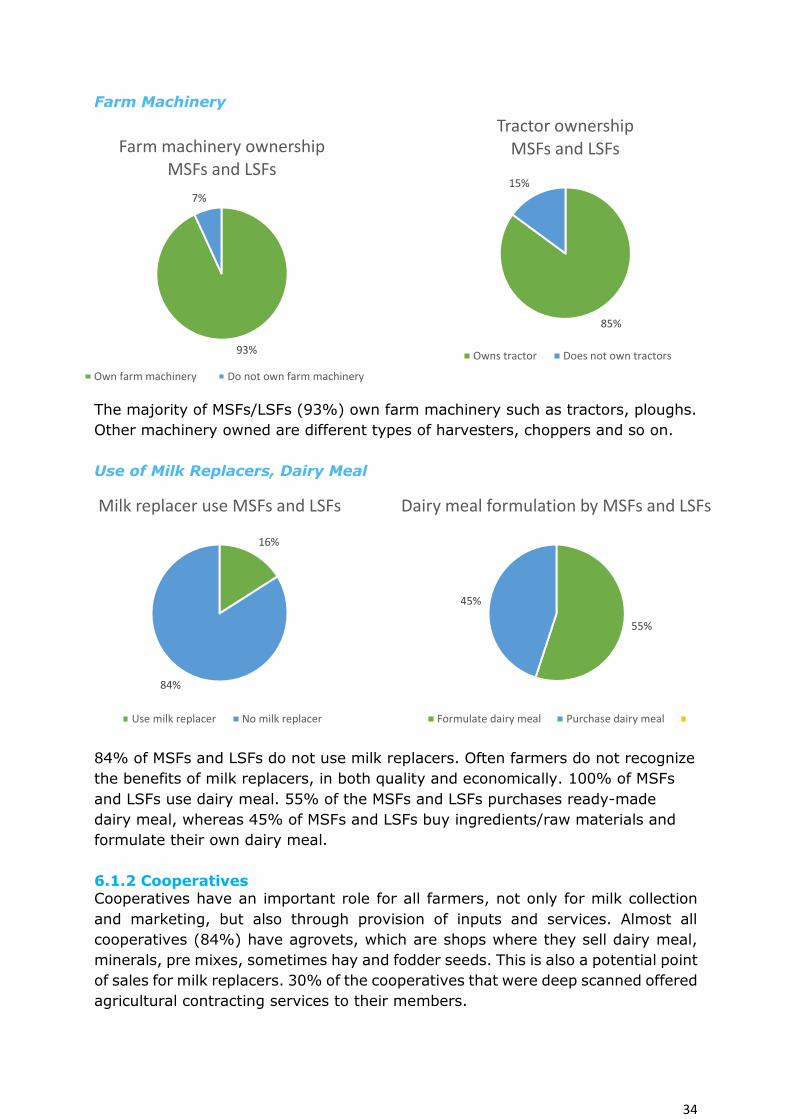
Use of Milk Replacers, Dairy Meal
84% of MSFs and LSFs do not use milk replacers. Often farmers do not recognize
the benefits of milk replacers, in both quality and economically. 100% of MSFs
and LSFs use dairy meal. 55% of the MSFs and LSFs purchases ready-made
dairy meal, whereas 45% of MSFs and LSFs buy ingredients/raw materials and
formulate their own dairy meal.
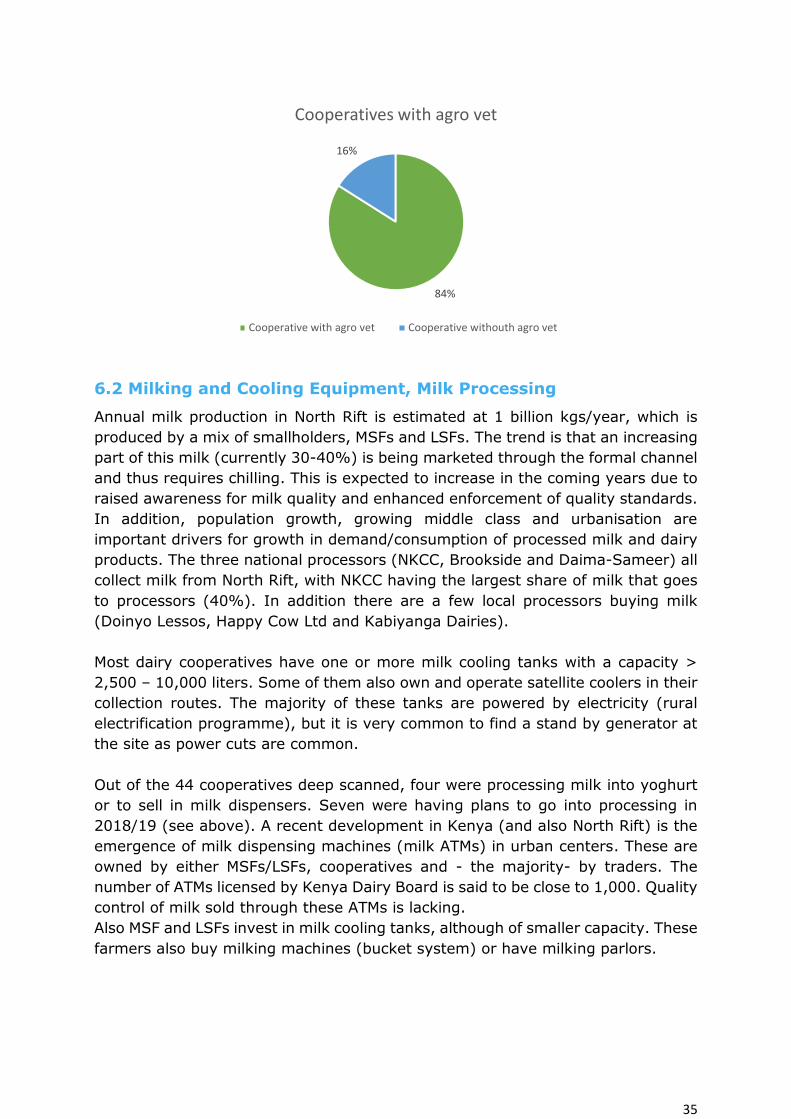
6.1.2 Cooperatives Cooperatives have an important role for all farmers, not only for milk collection
and marketing, but also through provision of inputs and services. Almost all
cooperatives (84%) have agrovets, which are shops where they sell dairy meal,
minerals, pre mixes, sometimes hay and fodder seeds. This is also a potential point
of sales for milk replacers. 30% of the cooperatives that were deep scanned offered
agricultural contracting services to their members.
93%
7%
Farm machinery ownership MSFs and LSFs
Own farm machinery Do not own farm machinery
85%
15%
Tractor ownership MSFs and LSFs
Owns tractor Does not own tractors
16%
84%
Milk replacer use MSFs and LSFs
Use milk replacer No milk replacer
55%
45%
Dairy meal formulation by MSFs and LSFs
Formulate dairy meal Purchase dairy meal
35
6.2 Milking and Cooling Equipment, Milk Processing
Annual milk production in North Rift is estimated at 1 billion kgs/year, which is
produced by a mix of smallholders, MSFs and LSFs. The trend is that an increasing
part of this milk (currently 30-40%) is being marketed through the formal channel
and thus requires chilling. This is expected to increase in the coming years due to
raised awareness for milk quality and enhanced enforcement of quality standards.
In addition, population growth, growing middle class and urbanisation are
important drivers for growth in demand/consumption of processed milk and dairy
products. The three national processors (NKCC, Brookside and Daima-Sameer) all
collect milk from North Rift, with NKCC having the largest share of milk that goes
to processors (40%). In addition there are a few local processors buying milk
(Doinyo Lessos, Happy Cow Ltd and Kabiyanga Dairies).
Most dairy cooperatives have one or more milk cooling tanks with a capacity >
2,500 – 10,000 liters. Some of them also own and operate satellite coolers in their
collection routes. The majority of these tanks are powered by electricity (rural
electrification programme), but it is very common to find a stand by generator at
the site as power cuts are common.
Out of the 44 cooperatives deep scanned, four were processing milk into yoghurt
or to sell in milk dispensers. Seven were having plans to go into processing in
2018/19 (see above). A recent development in Kenya (and also North Rift) is the
emergence of milk dispensing machines (milk ATMs) in urban centers. These are
owned by either MSFs/LSFs, cooperatives and - the majority- by traders. The
number of ATMs licensed by Kenya Dairy Board is said to be close to 1,000. Quality
control of milk sold through these ATMs is lacking.
Also MSF and LSFs invest in milk cooling tanks, although of smaller capacity. These
farmers also buy milking machines (bucket system) or have milking parlors.
84%
16%
Cooperatives with agro vet
Cooperative with agro vet Cooperative withouth agro vet
36
For cooling tanks, milking machines and milking parlors, there is both a market for
new and refurbished. Dairy processing equipment and milk dispensers are mainly
sold as new products. It is common to find cheap and low quality equipment in the
market sourced from China, India and Turkey. On the other hand, top brands like
DeLaval, Packo, Mueller and others manufacturers are being sold in Kenya and all
have local offices.
Strength Weakness
- Relatively large number of processors, dairy
cooperatives, MSF/LSFs
- Growing awareness and demand for better
quality equipment.
- Increasing demand for processed milk and
value added dairy products
- Strong rural electrification programme
- Good market for used & refurbished products
- Lack of maintenance and high costs - Availability of trained mechanics
- Availability of spare parts and tools - European equipment more expensive than
India, China, Turkey made, preference of farmers to relatively low quality low cost products
Opportunity Threat
- Growing awareness and demand for food safety and qulaity milk
- Maintenance and repairs support services and spare parts supply
- Growing demand for equipment for mini
processing from cooperatives and LSFs
- Market for used and new equipment
- Tedious and costly procedures for import duties and other costs involved.
- Many players in the market - High energy costs and unstable supply - Water scarcity and unsecured water access
- Weak quality regulation
- Danger of market distortion through donor and government investments
- Informal milk trade, seasonality of supply
6.2.1 MSFs and LSFs
Machine Milking
64%
of
MSFs milk manually. Whereas the majority of LSFs (58%) milks with a milking
machine. An explanation could be that for MSFs labour costs are not outweighing
the cost of a milking machine, whereas it does for LSFs due to production volume.
64%
36%
Machine Milking MSFs
Manual Milking machine
42%
58%
Machine Milking LSFs
Manual Milking machine
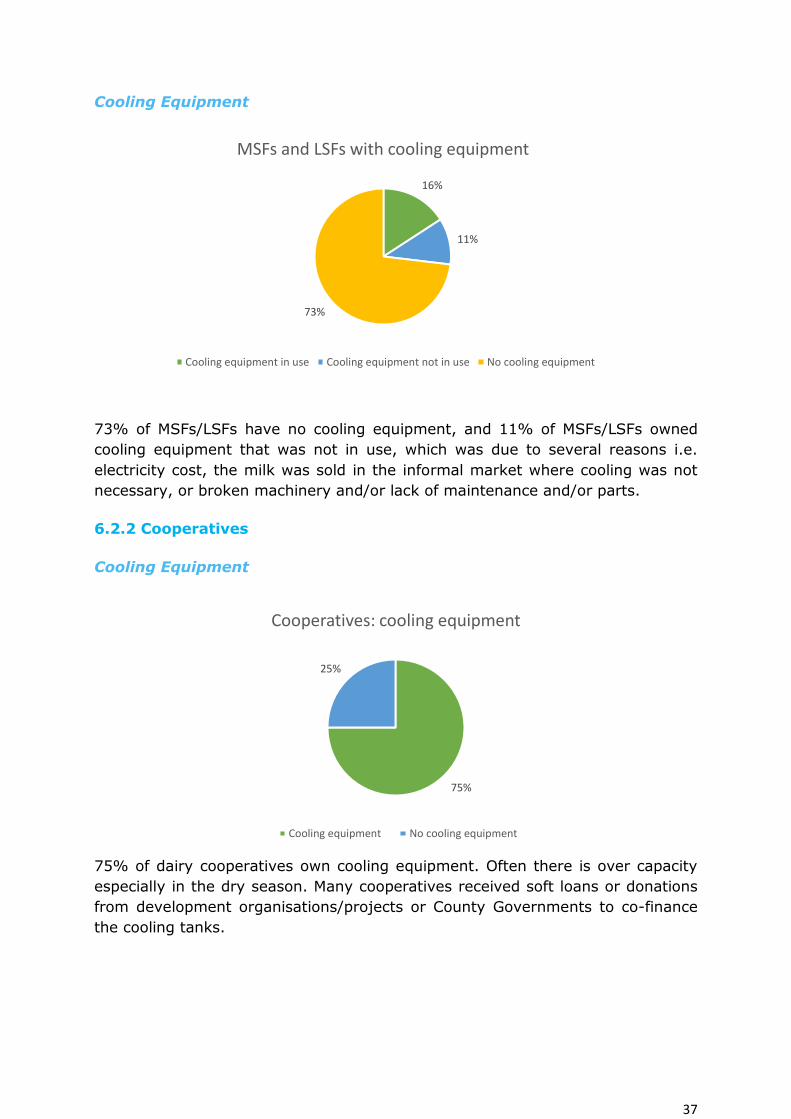
37
Cooling Equipment
73% of MSFs/LSFs have no cooling equipment, and 11% of MSFs/LSFs owned
cooling equipment that was not in use, which was due to several reasons i.e.
electricity cost, the milk was sold in the informal market where cooling was not
necessary, or broken machinery and/or lack of maintenance and/or parts.
6.2.2 Cooperatives
Cooling Equipment
75% of dairy cooperatives own cooling equipment. Often there is over capacity
especially in the dry season. Many cooperatives received soft loans or donations
from development organisations/projects or County Governments to co-finance
the cooling tanks.
75%
25%
Cooperatives: cooling equipment
Cooling equipment No cooling equipment
16%
11%
73%
MSFs and LSFs with cooling equipment
Cooling equipment in use Cooling equipment not in use No cooling equipment
38
6.3 Herd Improvement (genetics and young stock)
Kenya has by far the largest herd of improved dairy cattle on the continent with
an estimated 4.2 million heads. There is a growing demand for better breeding
services nationally through Artificial Insemination (AI), which is driven by the
desire for better dairy genetics. The demand for better genetics is in turn driven
by the demand for more milk and dairy products to feed a growing and urbanizing
population.
Despite increasing AI adoption rates, farmers as consumers remain underserved
and register a lot of challenges in regard to heat detection, access to information
on appropriate breed choice, bull selection and quality and reliability of AI services.
The key cost drivers for an AI service are bull semen, arm service and transport.
The cost of semen ranges from KES 300 to KES 1,500 for local semen and from
1,000 to 7,000 for imported semen (conventional and sexed semen).
The national bull stud KAGRC dominates bull semen business. Last year KAGRC
produced over 1.1 mln doses of semen and distributed it through its 60 agents
spread over 40 counties. In 2016 KAGRC’s total sales stood at 718,000 doses of
semen. Private suppliers, mainly dealing with imported genetics, distribute either
through the KAGRC appointed distributors or independently, and at times directly
to AI service providers SPs, farmers and Agrovet shops that act as their agents.
The annual estimated imported semen that is recorded stands at 483,000 straws
(2015).
International semen sources and local distributors (Makoni, 2015)
Local Company ORIGIN: Genetic Company
ABSTCM ABS Global Inc. Genus USA
AI Total AI Total, The Netherlands
Bles Dairies East Africa Ltd Bles Dairies BV, The Netherlands
Bimeda/Assia Alta Genetics, Netherlands and Semen
from Israel
Coopers Kenya Limited CRV (The Netherlands former Holland
Genetics)
DETF Cogent Semen, Company, UK
Fleckvieh Genetics EA. Fleckvieh-Germany
Highchem Cooperative Resources International, USA
Indicus Evolution, Serbia
Pokea Osnabrouk, Germany
Taurus Taurus, South Africa
Twiga Chemicals Semex, Canada
World Wide Sires (East Africa) World Wide Sires (Select Sires
Genex),USA
Gogar Farm (Hamish Grant) Viking, Denmark
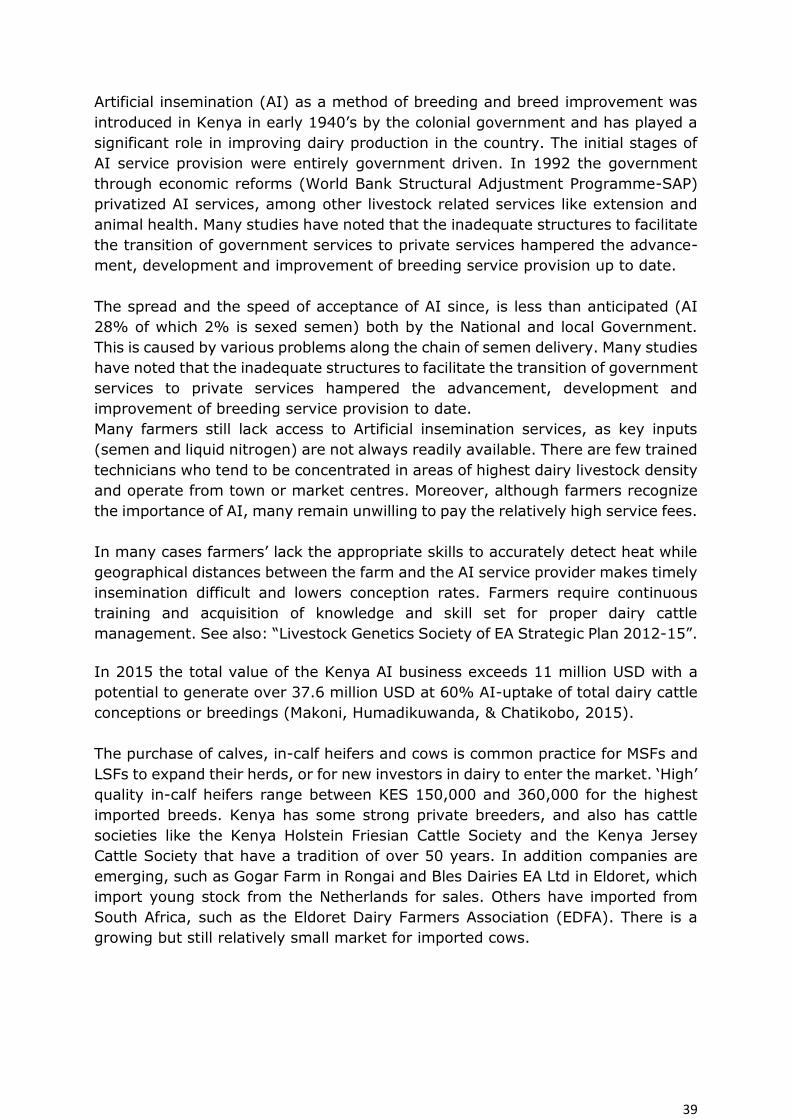
39
Artificial insemination (AI) as a method of breeding and breed improvement was
introduced in Kenya in early 1940’s by the colonial government and has played a
significant role in improving dairy production in the country. The initial stages of
AI service provision were entirely government driven. In 1992 the government
through economic reforms (World Bank Structural Adjustment Programme-SAP)
privatized AI services, among other livestock related services like extension and
animal health. Many studies have noted that the inadequate structures to facilitate
the transition of government services to private services hampered the advance-
ment, development and improvement of breeding service provision up to date.
The spread and the speed of acceptance of AI since, is less than anticipated (AI
28% of which 2% is sexed semen) both by the National and local Government.
This is caused by various problems along the chain of semen delivery. Many studies
have noted that the inadequate structures to facilitate the transition of government
services to private services hampered the advancement, development and
improvement of breeding service provision to date.
Many farmers still lack access to Artificial insemination services, as key inputs
(semen and liquid nitrogen) are not always readily available. There are few trained
technicians who tend to be concentrated in areas of highest dairy livestock density
and operate from town or market centres. Moreover, although farmers recognize
the importance of AI, many remain unwilling to pay the relatively high service fees.
In many cases farmers’ lack the appropriate skills to accurately detect heat while
geographical distances between the farm and the AI service provider makes timely
insemination difficult and lowers conception rates. Farmers require continuous
training and acquisition of knowledge and skill set for proper dairy cattle
management. See also: “Livestock Genetics Society of EA Strategic Plan 2012-15”.
In 2015 the total value of the Kenya AI business exceeds 11 million USD with a
potential to generate over 37.6 million USD at 60% AI-uptake of total dairy cattle
conceptions or breedings (Makoni, Humadikuwanda, & Chatikobo, 2015).
The purchase of calves, in-calf heifers and cows is common practice for MSFs and
LSFs to expand their herds, or for new investors in dairy to enter the market. ‘High’
quality in-calf heifers range between KES 150,000 and 360,000 for the highest
imported breeds. Kenya has some strong private breeders, and also has cattle
societies like the Kenya Holstein Friesian Cattle Society and the Kenya Jersey
Cattle Society that have a tradition of over 50 years. In addition companies are
emerging, such as Gogar Farm in Rongai and Bles Dairies EA Ltd in Eldoret, which
import young stock from the Netherlands for sales. Others have imported from
South Africa, such as the Eldoret Dairy Farmers Association (EDFA). There is a
growing but still relatively small market for imported cows.
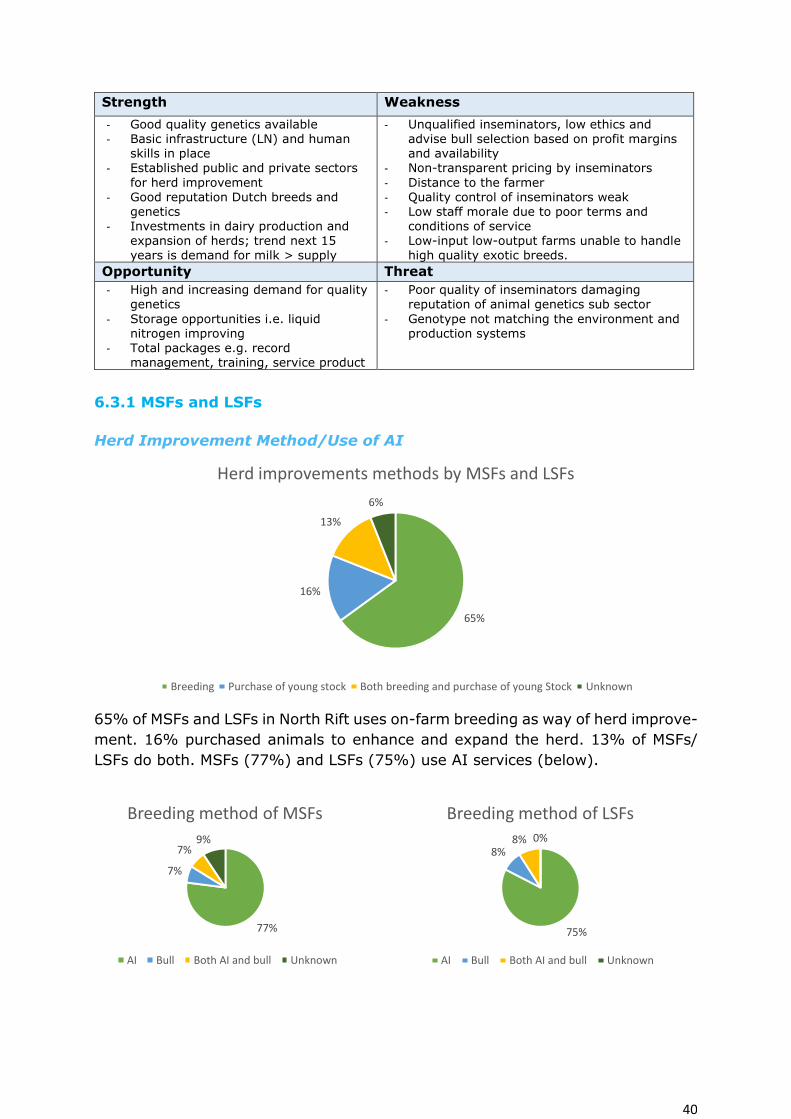
40
Strength Weakness
- Good quality genetics available - Basic infrastructure (LN) and human
skills in place - Established public and private sectors
for herd improvement - Good reputation Dutch breeds and
genetics - Investments in dairy production and
expansion of herds; trend next 15 years is demand for milk > supply
- Unqualified inseminators, low ethics and advise bull selection based on profit margins and availability
- Non-transparent pricing by inseminators
- Distance to the farmer - Quality control of inseminators weak - Low staff morale due to poor terms and
conditions of service - Low-input low-output farms unable to handle
high quality exotic breeds.
Opportunity Threat
- High and increasing demand for quality
genetics
- Storage opportunities i.e. liquid nitrogen improving
- Total packages e.g. record management, training, service product
- Poor quality of inseminators damaging
reputation of animal genetics sub sector
- Genotype not matching the environment and production systems
6.3.1 MSFs and LSFs
Herd Improvement Method/Use of AI
65% of MSFs and LSFs in North Rift uses on-farm breeding as way of herd improve-
ment. 16% purchased animals to enhance and expand the herd. 13% of MSFs/
LSFs do both. MSFs (77%) and LSFs (75%) use AI services (below).
65%
16%
13%
6%
Herd improvements methods by MSFs and LSFs
Breeding Purchase of young stock Both breeding and purchase of young Stock Unknown
77%
7%
7%9%
Breeding method of MSFs
AI Bull Both AI and bull Unknown
75%
8%8% 0%
Breeding method of LSFs
AI Bull Both AI and bull Unknown
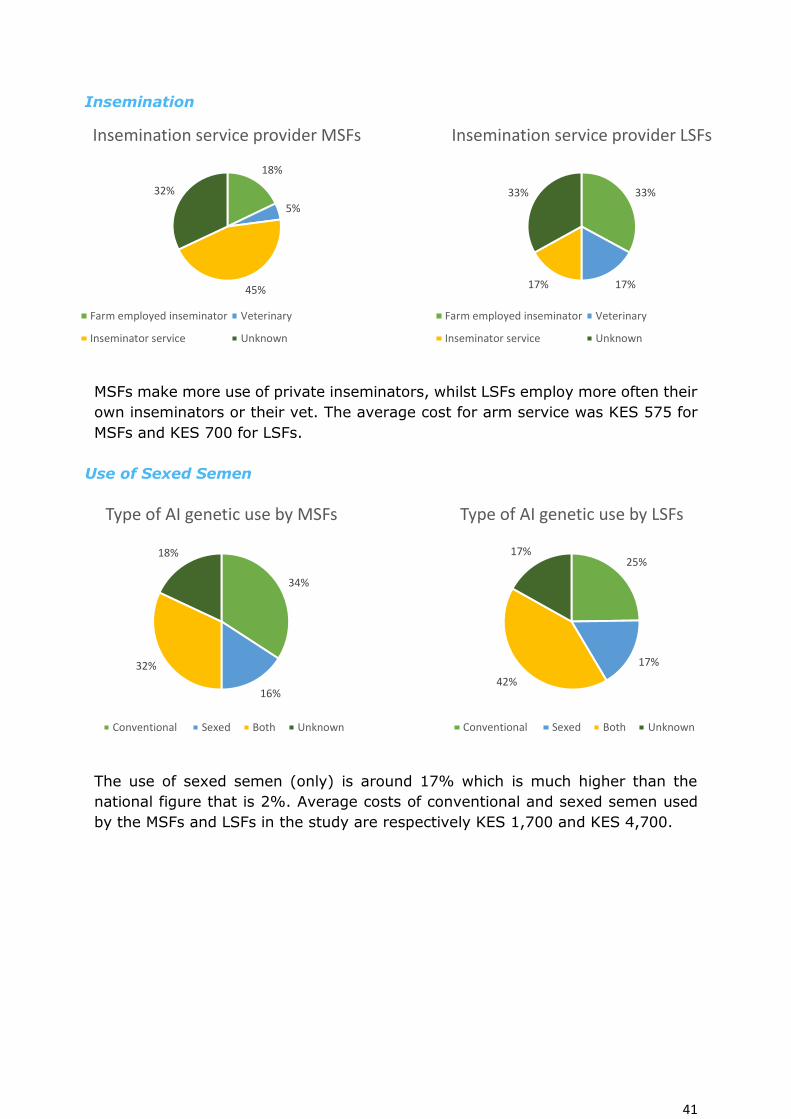
41
Insemination
MSFs make more use of private inseminators, whilst LSFs employ more often their
own inseminators or their vet. The average cost for arm service was KES 575 for
MSFs and KES 700 for LSFs.
Use of Sexed Semen
The use of sexed semen (only) is around 17% which is much higher than the
national figure that is 2%. Average costs of conventional and sexed semen used
by the MSFs and LSFs in the study are respectively KES 1,700 and KES 4,700.
18%
5%
45%
32%
Insemination service provider MSFs
Farm employed inseminator Veterinary
Inseminator service Unknown
34%
16%
32%
18%
Type of AI genetic use by MSFs
Conventional Sexed Both Unknown
25%
17%
42%
17%
Type of AI genetic use by LSFs
Conventional Sexed Both Unknown
33%
17%17%
33%
Insemination service provider LSFs
Farm employed inseminator Veterinary
Inseminator service Unknown
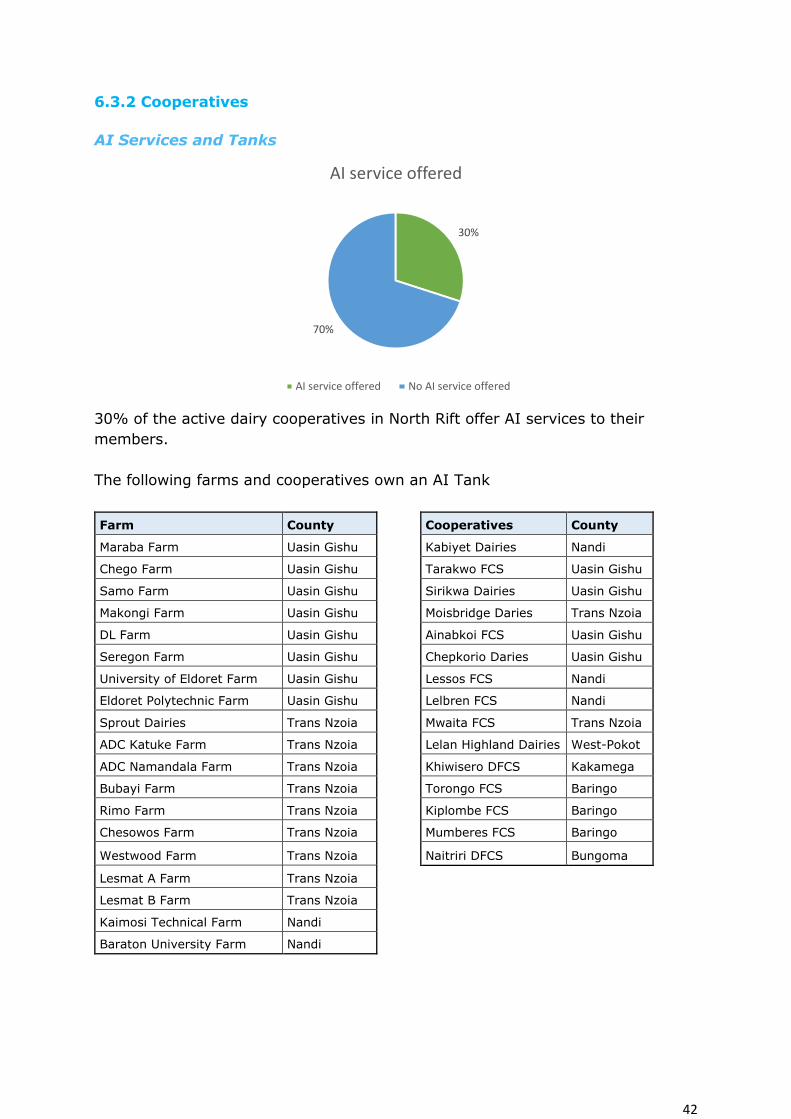
42
6.3.2 Cooperatives
AI Services and Tanks
30% of the active dairy cooperatives in North Rift offer AI services to their
members.
The following farms and cooperatives own an AI Tank
Farm County Cooperatives County
Maraba Farm Uasin Gishu Kabiyet Dairies Nandi
Chego Farm Uasin Gishu Tarakwo FCS Uasin Gishu
Samo Farm Uasin Gishu Sirikwa Dairies Uasin Gishu
Makongi Farm Uasin Gishu Moisbridge Daries Trans Nzoia
DL Farm Uasin Gishu Ainabkoi FCS Uasin Gishu
Seregon Farm Uasin Gishu Chepkorio Daries Uasin Gishu
University of Eldoret Farm Uasin Gishu Lessos FCS Nandi
Eldoret Polytechnic Farm Uasin Gishu Lelbren FCS Nandi
Sprout Dairies Trans Nzoia Mwaita FCS Trans Nzoia
ADC Katuke Farm Trans Nzoia Lelan Highland Dairies West-Pokot
ADC Namandala Farm Trans Nzoia Khiwisero DFCS Kakamega
Bubayi Farm Trans Nzoia Torongo FCS Baringo
Rimo Farm Trans Nzoia Kiplombe FCS Baringo
Chesowos Farm Trans Nzoia Mumberes FCS Baringo
Westwood Farm Trans Nzoia Naitriri DFCS Bungoma
Lesmat A Farm Trans Nzoia Lesmat B Farm Trans Nzoia Kaimosi Technical Farm Nandi Baraton University Farm Nandi
30%
70%
AI service offered
AI service offered No AI service offered
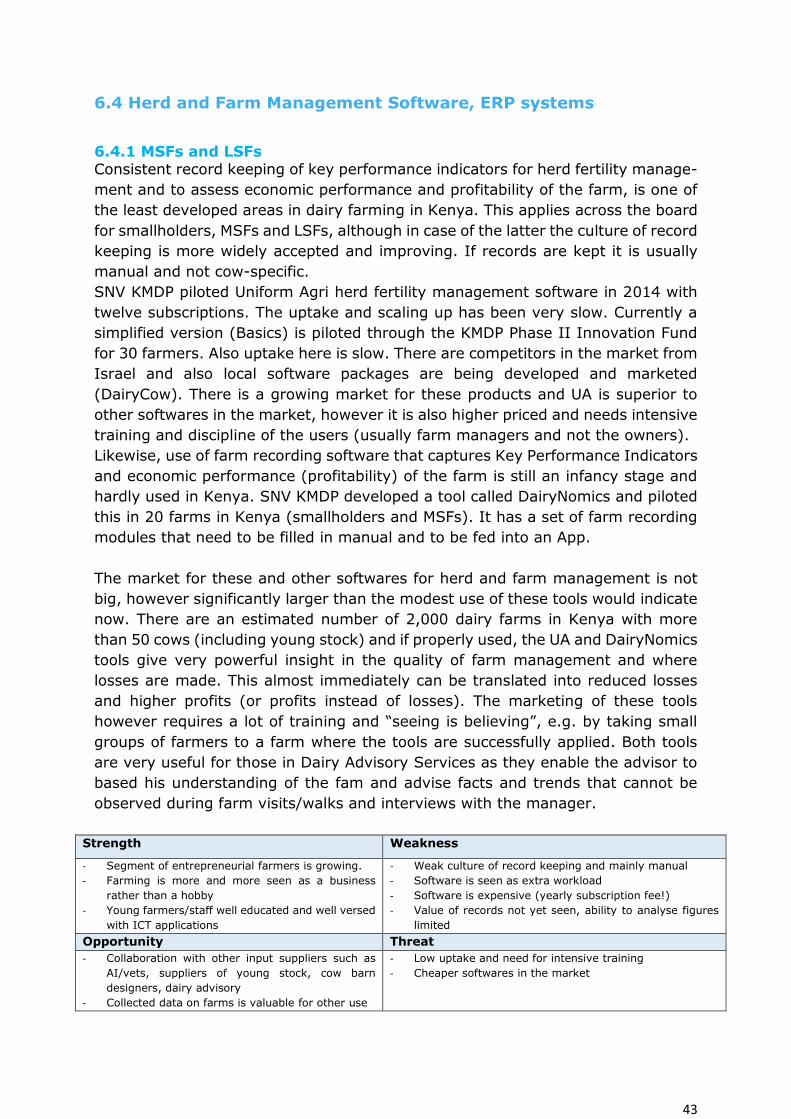
43
6.4 Herd and Farm Management Software, ERP systems
6.4.1 MSFs and LSFs Consistent record keeping of key performance indicators for herd fertility manage-
ment and to assess economic performance and profitability of the farm, is one of
the least developed areas in dairy farming in Kenya. This applies across the board
for smallholders, MSFs and LSFs, although in case of the latter the culture of record
keeping is more widely accepted and improving. If records are kept it is usually
manual and not cow-specific.
SNV KMDP piloted Uniform Agri herd fertility management software in 2014 with
twelve subscriptions. The uptake and scaling up has been very slow. Currently a
simplified version (Basics) is piloted through the KMDP Phase II Innovation Fund
for 30 farmers. Also uptake here is slow. There are competitors in the market from
Israel and also local software packages are being developed and marketed
(DairyCow). There is a growing market for these products and UA is superior to
other softwares in the market, however it is also higher priced and needs intensive
training and discipline of the users (usually farm managers and not the owners).
Likewise, use of farm recording software that captures Key Performance Indicators
and economic performance (profitability) of the farm is still an infancy stage and
hardly used in Kenya. SNV KMDP developed a tool called DairyNomics and piloted
this in 20 farms in Kenya (smallholders and MSFs). It has a set of farm recording
modules that need to be filled in manual and to be fed into an App.
The market for these and other softwares for herd and farm management is not
big, however significantly larger than the modest use of these tools would indicate
now. There are an estimated number of 2,000 dairy farms in Kenya with more
than 50 cows (including young stock) and if properly used, the UA and DairyNomics
tools give very powerful insight in the quality of farm management and where
losses are made. This almost immediately can be translated into reduced losses
and higher profits (or profits instead of losses). The marketing of these tools
however requires a lot of training and “seeing is believing”, e.g. by taking small
groups of farmers to a farm where the tools are successfully applied. Both tools
are very useful for those in Dairy Advisory Services as they enable the advisor to
based his understanding of the fam and advise facts and trends that cannot be
observed during farm visits/walks and interviews with the manager.
Strength Weakness
- Segment of entrepreneurial farmers is growing.
- Farming is more and more seen as a business
rather than a hobby
- Young farmers/staff well educated and well versed
with ICT applications
- Weak culture of record keeping and mainly manual
- Software is seen as extra workload
- Software is expensive (yearly subscription fee!)
- Value of records not yet seen, ability to analyse figures
limited
Opportunity Threat
- Collaboration with other input suppliers such as
AI/vets, suppliers of young stock, cow barn
designers, dairy advisory
- Collected data on farms is valuable for other use
- Low uptake and need for intensive training
- Cheaper softwares in the market
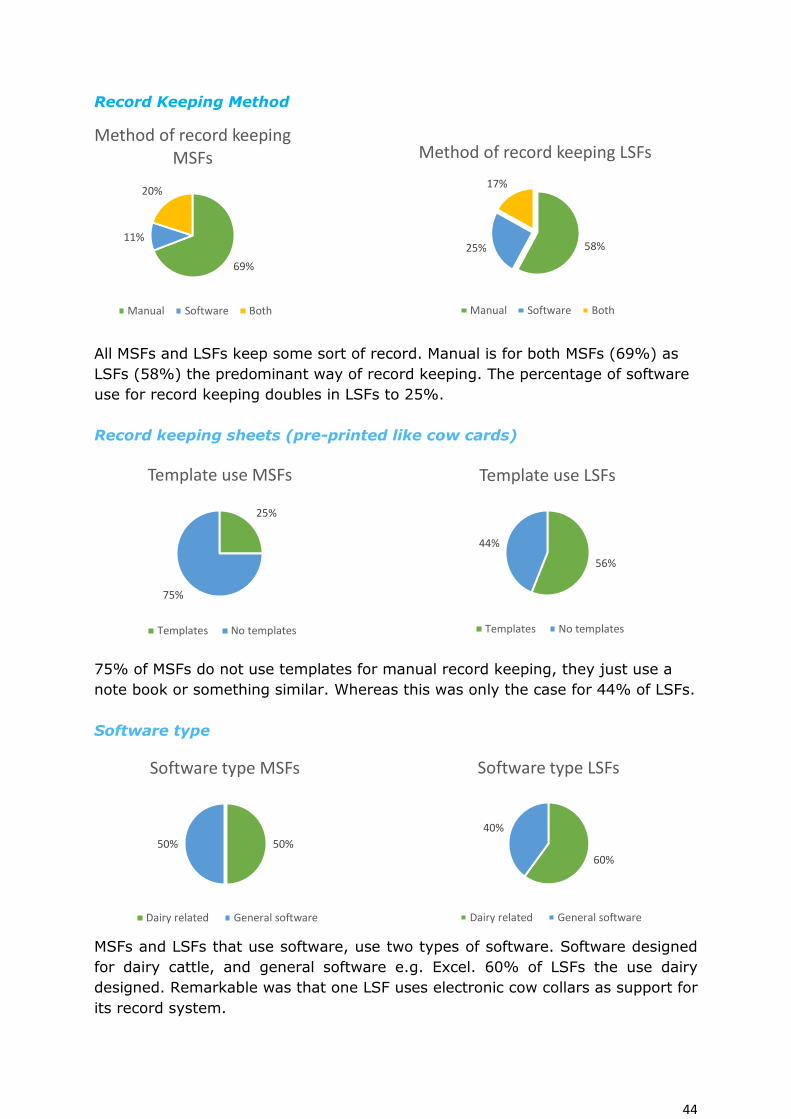
44
Record Keeping Method
All MSFs and LSFs keep some sort of record. Manual is for both MSFs (69%) as
LSFs (58%) the predominant way of record keeping. The percentage of software
use for record keeping doubles in LSFs to 25%.
Record keeping sheets (pre-printed like cow cards)
75% of MSFs do not use templates for manual record keeping, they just use a
note book or something similar. Whereas this was only the case for 44% of LSFs.
Software type
MSFs and LSFs that use software, use two types of software. Software designed
for dairy cattle, and general software e.g. Excel. 60% of LSFs the use dairy
designed. Remarkable was that one LSF uses electronic cow collars as support for
its record system.
58%25%
17%
Method of record keeping LSFs
Manual Software Both
69%
11%
20%
Method of record keeping MSFs
Manual Software Both
25%
75%
Template use MSFs
Templates No templates
56%
44%
Template use LSFs
Templates No templates
50%50%
Software type MSFs
Dairy related General software
60%
40%
Software type LSFs
Dairy related General software
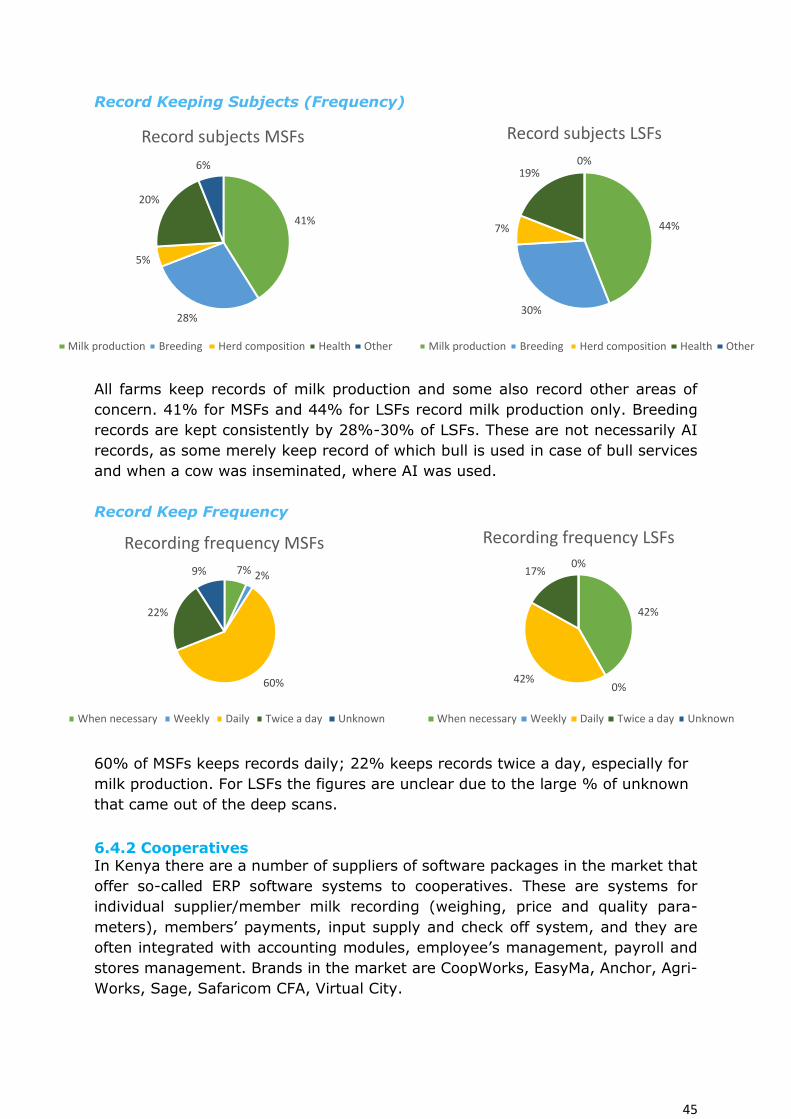
45
Record Keeping Subjects (Frequency)
All farms keep records of milk production and some also record other areas of
concern. 41% for MSFs and 44% for LSFs record milk production only. Breeding
records are kept consistently by 28%-30% of LSFs. These are not necessarily AI
records, as some merely keep record of which bull is used in case of bull services
and when a cow was inseminated, where AI was used.
Record Keep Frequency
60% of MSFs keeps records daily; 22% keeps records twice a day, especially for
milk production. For LSFs the figures are unclear due to the large % of unknown
that came out of the deep scans.
6.4.2 Cooperatives In Kenya there are a number of suppliers of software packages in the market that
offer so-called ERP software systems to cooperatives. These are systems for
individual supplier/member milk recording (weighing, price and quality para-
meters), members’ payments, input supply and check off system, and they are
often integrated with accounting modules, employee’s management, payroll and
stores management. Brands in the market are CoopWorks, EasyMa, Anchor, Agri-
Works, Sage, Safaricom CFA, Virtual City.
41%
28%
5%
20%
6%
Record subjects MSFs
Milk production Breeding Herd composition Health Other
44%
30%
7%
19%0%
Record subjects LSFs
Milk production Breeding Herd composition Health Other
7% 2%
60%
22%
9%
Recording frequency MSFs
When necessary Weekly Daily Twice a day Unknown
42%
0%42%
17%0%
Recording frequency LSFs
When necessary Weekly Daily Twice a day Unknown
46
6.5 Cow House Design and Interiors
The market for Dutch ISPIs that specialize in cow house design and interiors is
predominantly with MSFs and LSFs. Especially those that have zero or semi zero
grazing systems, which are the vast majority. Under KMDP two publications were
released for cow housed design: Modular Cow House Design for MSFs and Modular
Cow House Design for Smallholder Dairy Entrepreneurs.
(www.cowsoko.com/KMDP)
In general it is safe to conclude that cow house design in Kenya has huge problems
as regards to understanding and implementing the basic principles of good cow
house design. This applies e.g. to the siting of the cow house vis a vis other
structures on the farm, the fields, road access, topography, wind direction and
logical the flows in the farm (labour, machinery, manure, feed, milk etc.), ventila-
tion, hygiene, labour efficiency, size and material of cubicles and cow comfort, and
so on and so forth.
Specialist cow house advisory services are largely an unknown phenomenon in
Kenya, and architects and contractors are not aware of the functionality require-
ments of the cow house. Farm owners and investors have a tendency to copy paste
what they find on the internet, and then to change the design again to suit their
needs or wallet. In practice amongst MSFs and LSFS many avoidable mistakes are
found; the wrong and faulty design that is eventually constructed often costs more
than if an experienced and knowledgeable cow bar designer had been engaged.
The need for specialist cow barn design is as obvious however as the lack of
awareness on the same. Yet MSFs and LSFS, amongst them many new investors
and entries in the sector (often telephone farmers with high paying non-agricul-
tural jobs) invest millions of Kenyan shillings in cow houses. Changing this mind-
set requires exposure, demos and training.
The demand for cow house advisory services and interiors is at 2 levels: existing
farms that wish to later or expand structures, and new investors that start from
scratch in a zero situation. This market is not big but still significant looking at the
existing number of MSF/LSFs in Kenya and of new entrants/investors in the sector.
Combining cow house design services with general Dairy Advisory is a way to fast
track introduction of good cow barn design in the sector.
47
6.6 Practical Dairy Training and Education, Dairy Advisory
Skills of farmers (farm owners and farm managers) and other workers in the farm
is generally low. This applies across the board for smallholders, medium and large
scale farms, with few positive exceptions. This knowledge gap is wide and cuts
across all farm management topics (feeding, fodder production/preservation, calf
rearing and young stock management, housing, farm recording, fertility
management, etc.). It is the major cause for low productivity and profitability of
dairy farming in Kenya.
Kenya lacks adequate infrastructure to provide practical training at all levels:
farmers, farm managers and farm workers, training and extensions workers from
cooperatives and processors, private dairy advisors, students. The Government
extension service has been minimized to a bare minimum during the Structural
Adjustment Programmes in the 1990-ies. Many Universities include dairy
production and processing in their curriculum but this is academic and not
practically oriented. The quality is low and in no way up the standards and
requirements that the market demands for.
With the growing demand for milk and dairy products in Kenya and the region,
relatively good prices paid per liter of milk and ready market, and awareness of
the low competitiveness of the Kenyan dairy sector internationally, the need for
practical training and education and the current gap to address has become more
and more clear to all sector players. In theory therefore there is a huge market for
those ready to invest in - and offer - practical skills development training and
education. Yet willingness to pay for training (farmers, managers, consultants) and
to finance/invest in training (private sector: cooperatives, processors and industry
associations, Universities) is still low. This is partly because training and education
is seen as a public good to be provided for by government (which fails to do so) or
donors free of charge.
Initiatives at the bottom to fill this gap are provided by dairy farmers who use their
farms to train or expose others at a fee, some in a structured manner (Practical
Dairy Training Farms). In addition private Dairy Advisory or dairy consultants have
emerged that advice farms on total farm management or on certain aspects like
fodder production, cow house design, or herd fertility management. Often a
combination is thought providing training together with selling a product. In this
case input suppliers do part of dairy advisory and training.
This model is slowly making entry amongst the MSF and LSF farms, whose
willingness to pay commercial rates for dairy advisory services is still modest but
growing. At cooperative level there is a trend that dairy cooperatives set up and
finance Training & Extension Departments to give support to their members. These
staff however are often unqualified and need to be trained as well.
In this scenario there are opportunities at various levels for Dutch service provi-
ders. At the MSF/LSF level – but this also applies to an extent to T&E staff and
lead farmers of cooperatives - there is opportunity for Dairy Advisory/Extension
and Practical Training, e.g. through the model of Practical Dairy Training Centres
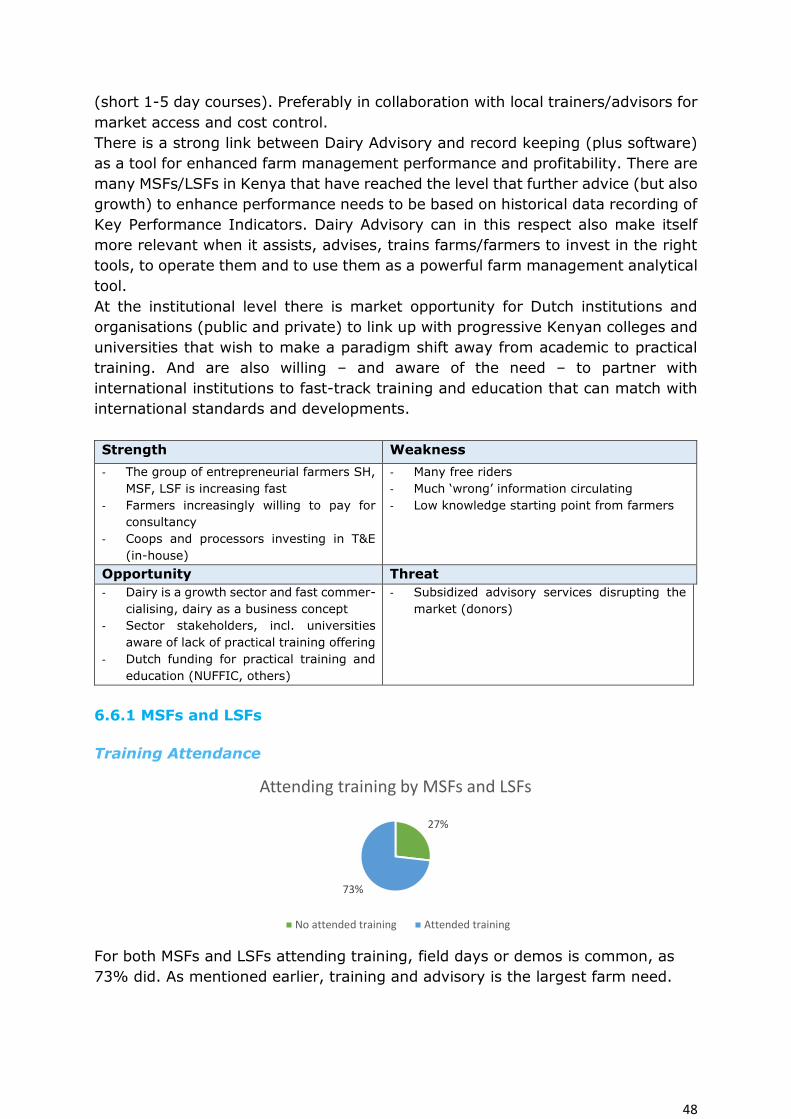
48
(short 1-5 day courses). Preferably in collaboration with local trainers/advisors for
market access and cost control.
There is a strong link between Dairy Advisory and record keeping (plus software)
as a tool for enhanced farm management performance and profitability. There are
many MSFs/LSFs in Kenya that have reached the level that further advice (but also
growth) to enhance performance needs to be based on historical data recording of
Key Performance Indicators. Dairy Advisory can in this respect also make itself
more relevant when it assists, advises, trains farms/farmers to invest in the right
tools, to operate them and to use them as a powerful farm management analytical
tool.
At the institutional level there is market opportunity for Dutch institutions and
organisations (public and private) to link up with progressive Kenyan colleges and
universities that wish to make a paradigm shift away from academic to practical
training. And are also willing – and aware of the need – to partner with
international institutions to fast-track training and education that can match with
international standards and developments.
Strength Weakness
- The group of entrepreneurial farmers SH,
MSF, LSF is increasing fast
- Farmers increasingly willing to pay for
consultancy
- Coops and processors investing in T&E
(in-house)
- Many free riders
- Much ‘wrong’ information circulating
- Low knowledge starting point from farmers
Opportunity Threat
- Dairy is a growth sector and fast commer-
cialising, dairy as a business concept
- Sector stakeholders, incl. universities
aware of lack of practical training offering
- Dutch funding for practical training and
education (NUFFIC, others)
- Subsidized advisory services disrupting the
market (donors)
6.6.1 MSFs and LSFs
Training Attendance
For both MSFs and LSFs attending training, field days or demos is common, as
73% did. As mentioned earlier, training and advisory is the largest farm need.
27%
73%
Attending training by MSFs and LSFs
No attended training Attended training
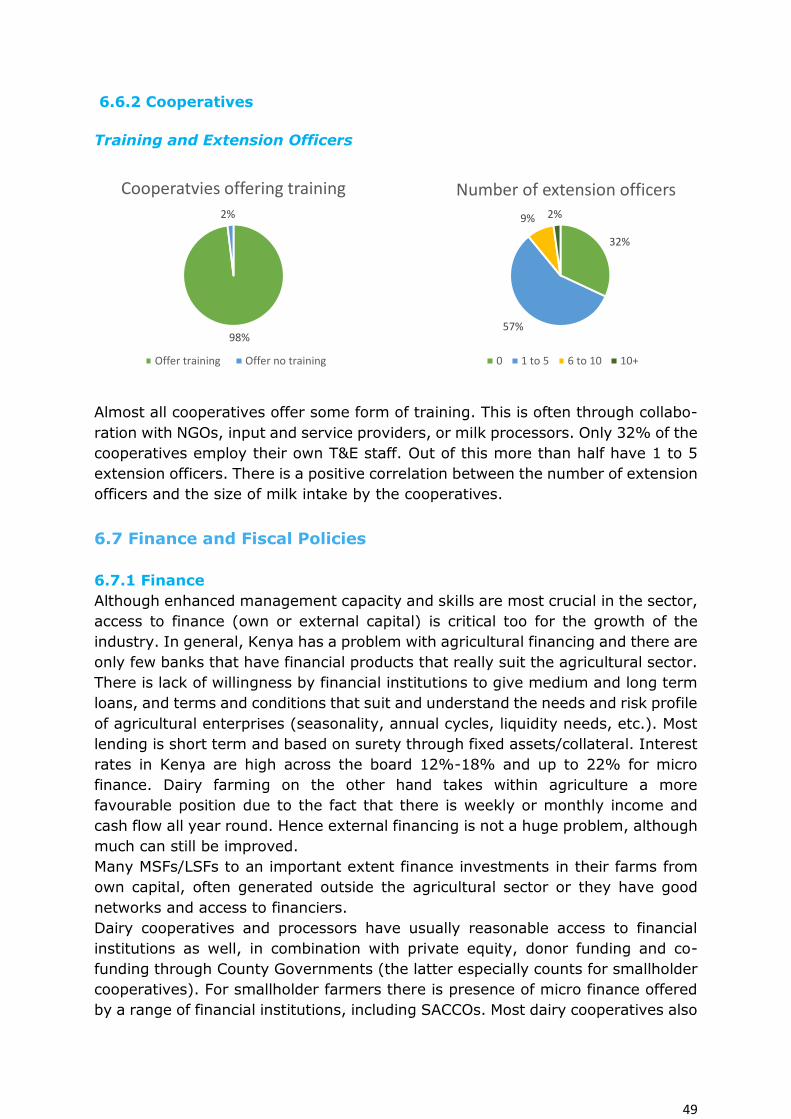
49
6.6.2 Cooperatives
Training and Extension Officers
Almost all cooperatives offer some form of training. This is often through collabo-
ration with NGOs, input and service providers, or milk processors. Only 32% of the
cooperatives employ their own T&E staff. Out of this more than half have 1 to 5
extension officers. There is a positive correlation between the number of extension
officers and the size of milk intake by the cooperatives.
6.7 Finance and Fiscal Policies
6.7.1 Finance
Although enhanced management capacity and skills are most crucial in the sector,
access to finance (own or external capital) is critical too for the growth of the
industry. In general, Kenya has a problem with agricultural financing and there are
only few banks that have financial products that really suit the agricultural sector.
There is lack of willingness by financial institutions to give medium and long term
loans, and terms and conditions that suit and understand the needs and risk profile
of agricultural enterprises (seasonality, annual cycles, liquidity needs, etc.). Most
lending is short term and based on surety through fixed assets/collateral. Interest
rates in Kenya are high across the board 12%-18% and up to 22% for micro
finance. Dairy farming on the other hand takes within agriculture a more
favourable position due to the fact that there is weekly or monthly income and
cash flow all year round. Hence external financing is not a huge problem, although
much can still be improved.
Many MSFs/LSFs to an important extent finance investments in their farms from
own capital, often generated outside the agricultural sector or they have good
networks and access to financiers.
Dairy cooperatives and processors have usually reasonable access to financial
institutions as well, in combination with private equity, donor funding and co-
funding through County Governments (the latter especially counts for smallholder
cooperatives). For smallholder farmers there is presence of micro finance offered
by a range of financial institutions, including SACCOs. Most dairy cooperatives also
98%
2%
Cooperatvies offering training
Offer training Offer no training
32%
57%
9% 2%
Number of extension officers
0 1 to 5 6 to 10 10+
50
apply a check off system where inputs can be bought on credit in their agrovets
and deductions are made from milk payments.
The landscape therefore is not “barren” such that there is no own capital to invest
at all, and lack or total absence of financial institutions or products. Certainly there
is scope for improvements and financial institutions that specialise in agricultural
financing and have more adequate products. Perhaps the most problematic aspect
of agricultural finance available, is that it almost solely works on basis of collateral
rather than financial performance and ability to repay, and interest rates are high
as the IRR in agricultural investments seldom exceeds 10-12%.
One of the most pressing problems of the agricultural sector, including the dairy
sector, is delayed payment by retailers, in particular the larger supermarket
chains. Nakumat which is the largest supermarket in Kenya with branches across
East Africa went into a state of pre-receivership in 2017 and closed most of its
operations owing the dairy sector (processors!) a claimed KES 1 billion in arrear
payments. This was aggravated by a prolonged drought that saw milk intakes of
most processors and cooperatives drop by 30% or more during the 2nd quarter of
this year. These “external” factors make an otherwise dynamic growth sector
vulnerable. But in the long run the vulnerability of the sector and thus its competiti-
veness lies with the high cost of raw milk production and the low quality of milk
(food safety related). In addition the lack of loyalty between farmers and
cooperatives/processors is another weak spot in the sector, as farmers need stable
and reliable market/prices for their milk (preferably also linked to quality) to be
willing to invest. Whereas for financial institutions strong lasting seller-buyer
relationships – preferable backed up by farmer training and input supply – are key
to beef up financing of the sector.
6.7.2 Fiscal Policies
As of today, the dairy sector is protected by an import tariff of 60% for milk and
dairy products that originate from outside the East African Community.
Importation of farm machinery and equipment, and milk cooling and processing
equipment, is zero rated (no import duties).
Strength Weakness
- Strong financial capacity of MSFs/LSFs
- May financial institutions and products
- Strong SACCO Sector
- Dairy generates income daily (cash flow)
- Financial products not tailored to the needs of
the agricultural sector
- Mainly short term financing and with collateral
only
Opportunity Threat
- Develop suitable agricultural financial
products.
- Combine finance with training practical
skills incl. farm recording
-
- High interest rates
- Lending to unskilled investors (indebting
farmers)
- Low competitiveness of the dairy sector in
view of ability to compete at the world market
if import duty of 60% is reduced
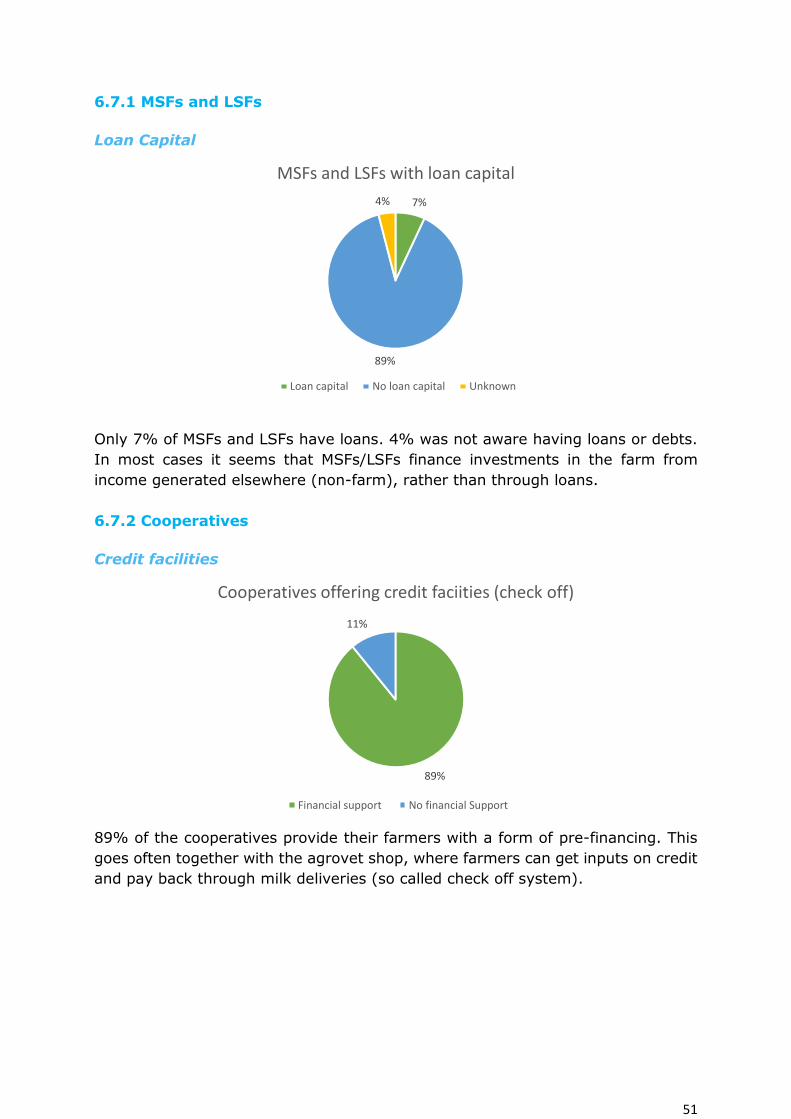
51
6.7.1 MSFs and LSFs
Loan Capital
Only 7% of MSFs and LSFs have loans. 4% was not aware having loans or debts.
In most cases it seems that MSFs/LSFs finance investments in the farm from
income generated elsewhere (non-farm), rather than through loans.
6.7.2 Cooperatives
Credit facilities
89% of the cooperatives provide their farmers with a form of pre-financing. This
goes often together with the agrovet shop, where farmers can get inputs on credit
and pay back through milk deliveries (so called check off system).
7%
89%
4%
MSFs and LSFs with loan capital
Loan capital No loan capital Unknown
89%
11%
Cooperatives offering credit faciities (check off)
Financial support No financial Support
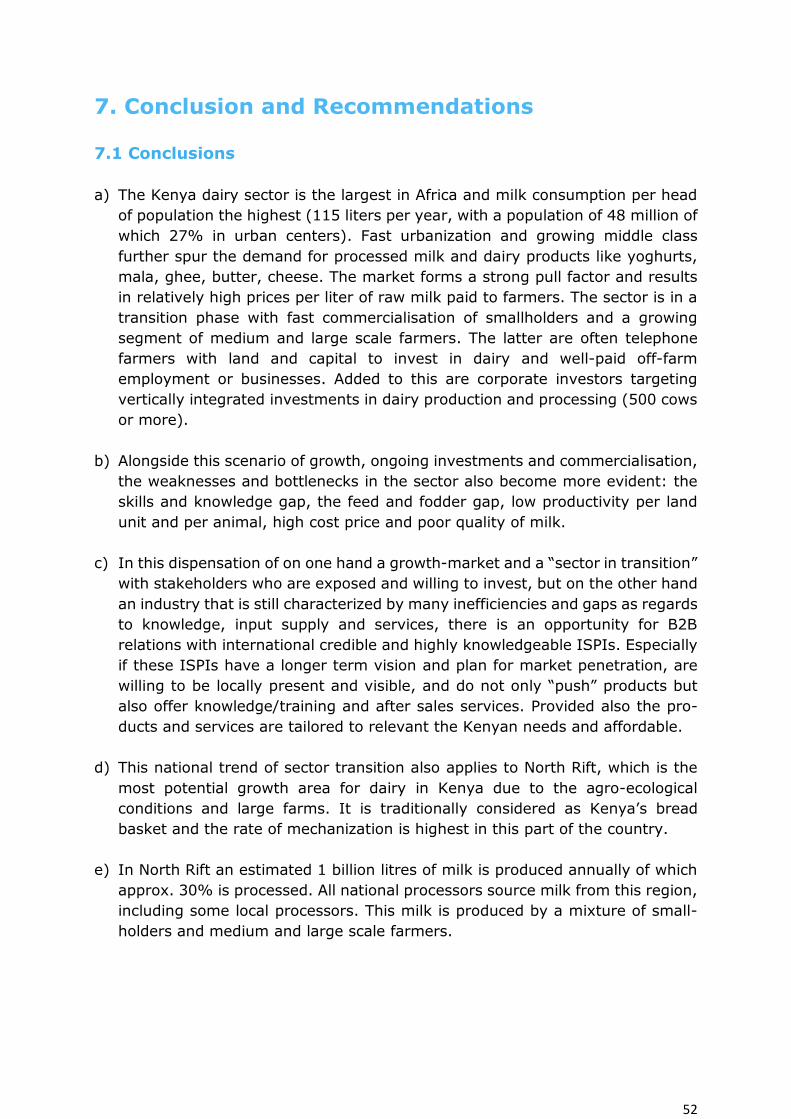
52
7. Conclusion and Recommendations
7.1 Conclusions
a) The Kenya dairy sector is the largest in Africa and milk consumption per head
of population the highest (115 liters per year, with a population of 48 million of
which 27% in urban centers). Fast urbanization and growing middle class
further spur the demand for processed milk and dairy products like yoghurts,
mala, ghee, butter, cheese. The market forms a strong pull factor and results
in relatively high prices per liter of raw milk paid to farmers. The sector is in a
transition phase with fast commercialisation of smallholders and a growing
segment of medium and large scale farmers. The latter are often telephone
farmers with land and capital to invest in dairy and well-paid off-farm
employment or businesses. Added to this are corporate investors targeting
vertically integrated investments in dairy production and processing (500 cows
or more).
b) Alongside this scenario of growth, ongoing investments and commercialisation,
the weaknesses and bottlenecks in the sector also become more evident: the
skills and knowledge gap, the feed and fodder gap, low productivity per land
unit and per animal, high cost price and poor quality of milk.
c) In this dispensation of on one hand a growth-market and a “sector in transition”
with stakeholders who are exposed and willing to invest, but on the other hand
an industry that is still characterized by many inefficiencies and gaps as regards
to knowledge, input supply and services, there is an opportunity for B2B
relations with international credible and highly knowledgeable ISPIs. Especially
if these ISPIs have a longer term vision and plan for market penetration, are
willing to be locally present and visible, and do not only “push” products but
also offer knowledge/training and after sales services. Provided also the pro-
ducts and services are tailored to relevant the Kenyan needs and affordable.
d) This national trend of sector transition also applies to North Rift, which is the
most potential growth area for dairy in Kenya due to the agro-ecological
conditions and large farms. It is traditionally considered as Kenya’s bread
basket and the rate of mechanization is highest in this part of the country.
e) In North Rift an estimated 1 billion litres of milk is produced annually of which
approx. 30% is processed. All national processors source milk from this region,
including some local processors. This milk is produced by a mixture of small-
holders and medium and large scale farmers.
53
f) The region has 90 active dairy cooperatives with a membership of 95,000 of
which 35,000 are active milk suppliers, most of them smallholders. This number
is likely to be significantly larger as not all smallholders deliver milk to these
cooperatives. Some sell directly to processors, others to traders who operate
in the informal sector. In total these 90 cooperatives collect daily 312,000 litres
of milk from 35,000 active milk suppliers. Almost all have agrovet shops and
sell dairy meals, seeds, fertilizers and veterinary products; many provide AI
services and some also provide agricultural contracting services.
g) In addition, the North Rift and especially the Counties Uasin Gishu, Nandi and
Trans Nzoia (Kitale District) is home to large number of Medium and Large
Scale farmers of which the exact number is not known but estimates are over
500 MSFs and 50-100 LSFs.
h) The deep scans for MSFs (45) and LSFs (12) concentrated on Uasin Gishu,
Trans Nzoia and Nandi County, were commercialisation of dairy is highest.
Average land holdings for the deep scanned MSFs and LSFs were respectively
306 acres and 1,127 acres, average daily milk production 245 versus 1,206
litres and average herd size 71 for MSFs and 284 cows for LSFs. The total
number of MSFs and LSFs in these three counties is considerable higher than
the number used for the deep scan and further inventarisation is still ongoing.
i) For a processor based in Eldoret (or Nakuru) that is interested to source milk
in Uasin Gishu and Nandi Counties and Kitale District, nearness to Nakuru is an
advantage as in Nakuru County - along the Eldoret-Nakuru corridor towards
the direction of Eldoret – a cluster of MSFs and LSFs is present. Here 8 MSFs
and 5 LSFs are found within a radius of 50 km who together have 3,648 cows
and produce daily 20,354 kg of milk.
j) The aggregated demand for inputs and services by these farmers, their coope-
ratives, milk processors, and the local input and service providers is
tremendous. However largely as a result of lack of knowledge and availability
in the market, often the “cheapest” solutions are being sought and Dutch ISPIs
need to compete with sometimes sub-standard products imported from
countries such as India, China, Turkey and Brazil, or locally fabricated and
imitated. Awareness however for quality products and services is on the rise
and through demos, pilots, field days, exposure visits, training and targeted
marketing, the concept of “seeing is believing” has proven so far to be effective
in changing the mindsets of professional (or professionalizing) dairy entre-
preneurs.
k) A cluster of Dutch ISPIs working together on different inputs and services, as
is already to some extent the case in Eldoret/North Rift and is also emerging
around Nairobi in Central Kenya, is instrumental for cross-fertilization, mutually
reinforcing fast tracking penetration of Dutch Kenyan B2B.
54
l) Professionalising Kenyan dairy farmers, farmer organisations and processors
lack consistent supply of quality inputs and services supply. Farmers prefer
ISPIs who are locally present – thus who do not work solely via a distributor
but have international expertise on the ground.
m) There is a misconception on part of most Dutch ISPIs that Kenyan dairy stake-
holders across the board lack financial resources or have no access to financial
sources, to invest in dairy and to purchase quality inputs and services.
7.2 Recommendations
When entering the Kenyan market, strategy is as important as the product or the
service offered.
a) The market study showed that local presence is important for Dutch ISPIs to
start and scale-up business. It assures better understanding of the local needs
and business culture, it creates stronger connections and trust with clients, and
– also – it enhances the ability to adapt the product, service or business model
to the local situation/needs. This all helps to minimize “wrong” use of products,
services and advise and – hence - “bad press”. Dutch ISPIs with local presence
by an international expert, beefed up with local staff, distributors or sales
agents, are at a great advantage as compared to those doing business from
the Netherlands – with or without having a local agent.
b) In Kenya many local and international companies provide inputs and services
for the dairy sector. The market to some extent is crowded, however most
companies “push” products without giving much advice, training, and after
sales service. The business culture in Kenya is very much to sell what is good
for the supplier (sales person), rather than to think in the interest of the client
and to build up a long term business relationship. This of course varies from
product to product and client group to client group, but this culture of “hit and
run” is much embedded in the Kenya way of doing business. Also “dairy”
knowledge is often lacking abundantly by those who push these products. At
the same time the culture of Kenyan investors on the other hand is that they
often prefer and go for low price low quality, partly however because of lack of
knowledge on the functional use of the product, quality and durability.
Here is an opportunity for Dutch ISPIs to differentiate themselves by offering
complete packages: needs assessment, tailor made products/ services, training
and advisory. This model however is relatively costly and therefore needs to
focus on a clear target group and pre-assessment whether the clients
appreciate and acknowledge the need for such approach, and are willing (and
able) to pay for it. It also requires demonstration and awareness raising and
often speaking to clients or groups of clients “who don’t know what they don’t
know”.
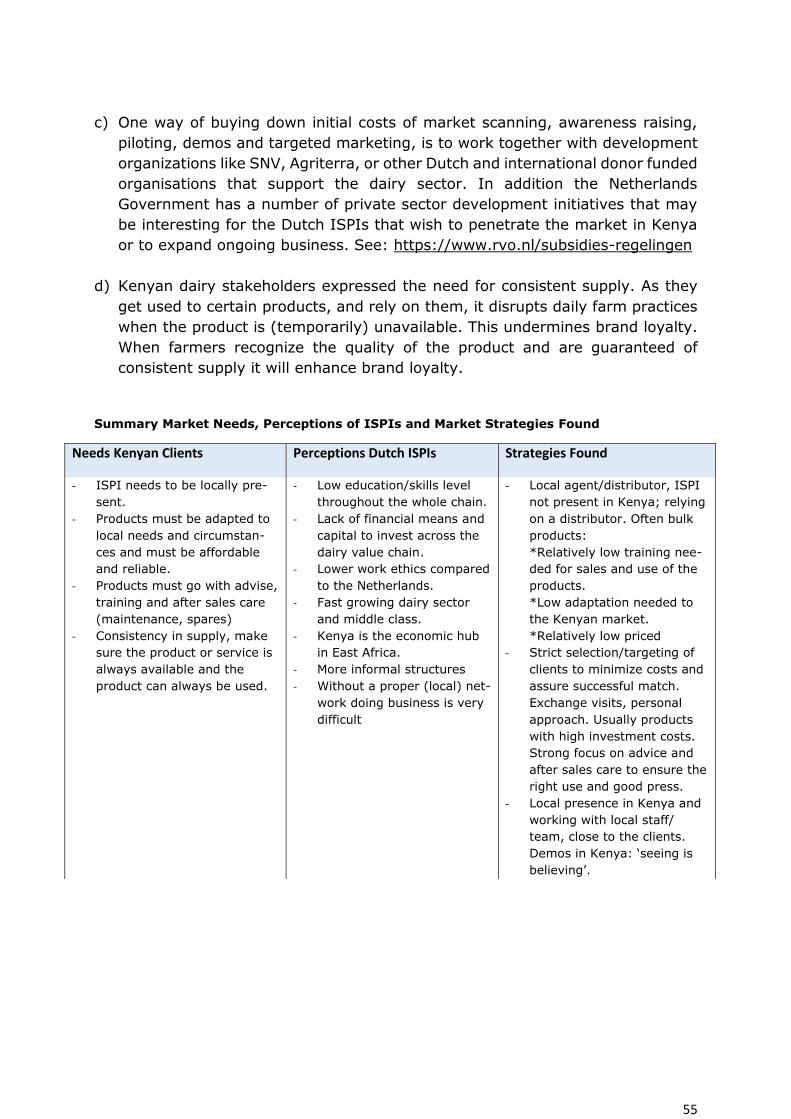
55
c) One way of buying down initial costs of market scanning, awareness raising,
piloting, demos and targeted marketing, is to work together with development
organizations like SNV, Agriterra, or other Dutch and international donor funded
organisations that support the dairy sector. In addition the Netherlands
Government has a number of private sector development initiatives that may
be interesting for the Dutch ISPIs that wish to penetrate the market in Kenya
or to expand ongoing business. See: https://www.rvo.nl/subsidies-regelingen
d) Kenyan dairy stakeholders expressed the need for consistent supply. As they
get used to certain products, and rely on them, it disrupts daily farm practices
when the product is (temporarily) unavailable. This undermines brand loyalty.
When farmers recognize the quality of the product and are guaranteed of
consistent supply it will enhance brand loyalty.
Summary Market Needs, Perceptions of ISPIs and Market Strategies Found
Needs Kenyan Clients Perceptions Dutch ISPIs Strategies Found
- ISPI needs to be locally pre-
sent.
- Products must be adapted to
local needs and circumstan-
ces and must be affordable
and reliable.
- Products must go with advise,
training and after sales care
(maintenance, spares)
- Consistency in supply, make
sure the product or service is
always available and the
product can always be used.
- Low education/skills level
throughout the whole chain.
- Lack of financial means and
capital to invest across the
dairy value chain.
- Lower work ethics compared
to the Netherlands.
- Fast growing dairy sector
and middle class.
- Kenya is the economic hub
in East Africa.
- More informal structures
- Without a proper (local) net-
work doing business is very
difficult
- Local agent/distributor, ISPI
not present in Kenya; relying
on a distributor. Often bulk
products:
*Relatively low training nee-
ded for sales and use of the
products.
*Low adaptation needed to
the Kenyan market.
*Relatively low priced
- Strict selection/targeting of
clients to minimize costs and
assure successful match.
Exchange visits, personal
approach. Usually products
with high investment costs.
Strong focus on advice and
after sales care to ensure the
right use and good press.
- Local presence in Kenya and
working with local staff/
team, close to the clients.
Demos in Kenya: ‘seeing is
believing’.
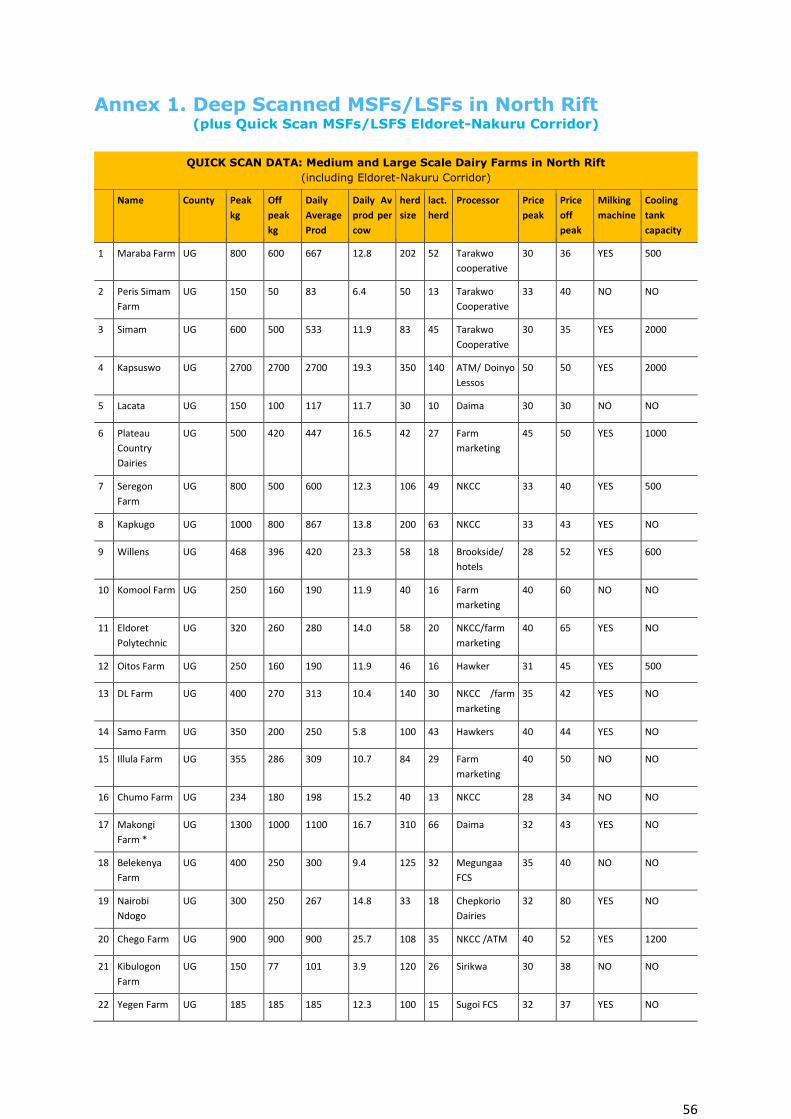
56
Annex 1. Deep Scanned MSFs/LSFs in North Rift (plus Quick Scan MSFs/LSFS Eldoret-Nakuru Corridor)
QUICK SCAN DATA: Medium and Large Scale Dairy Farms in North Rift
(including Eldoret-Nakuru Corridor)
Name County Peak
kg
Off
peak
kg
Daily
Average
Prod
Daily Av
prod per
cow
herd
size
lact.
herd
Processor Price
peak
Price
off
peak
Milking
machine
Cooling
tank
capacity
1 Maraba Farm UG 800 600 667 12.8 202 52 Tarakwo
cooperative
30 36 YES 500
2 Peris Simam
Farm
UG 150 50 83 6.4 50 13 Tarakwo
Cooperative
33 40 NO NO
3 Simam UG 600 500 533 11.9 83 45 Tarakwo
Cooperative
30 35 YES 2000
4 Kapsuswo UG 2700 2700 2700 19.3 350 140 ATM/ Doinyo
Lessos
50 50 YES 2000
5 Lacata UG 150 100 117 11.7 30 10 Daima 30 30 NO NO
6 Plateau
Country
Dairies
UG 500 420 447 16.5 42 27 Farm
marketing
45 50 YES 1000
7 Seregon
Farm
UG 800 500 600 12.3 106 49 NKCC 33 40 YES 500
8 Kapkugo UG 1000 800 867 13.8 200 63 NKCC 33 43 YES NO
9 Willens UG 468 396 420 23.3 58 18 Brookside/
hotels
28 52 YES 600
10 Komool Farm UG 250 160 190 11.9 40 16 Farm
marketing
40 60 NO NO
11 Eldoret
Polytechnic
UG 320 260 280 14.0 58 20 NKCC/farm
marketing
40 65 YES NO
12 Oitos Farm UG 250 160 190 11.9 46 16 Hawker 31 45 YES 500
13 DL Farm UG 400 270 313 10.4 140 30 NKCC /farm
marketing
35 42 YES NO
14 Samo Farm UG 350 200 250 5.8 100 43 Hawkers 40 44 YES NO
15 Illula Farm UG 355 286 309 10.7 84 29 Farm
marketing
40 50 NO NO
16 Chumo Farm UG 234 180 198 15.2 40 13 NKCC 28 34 NO NO
17 Makongi
Farm *
UG 1300 1000 1100 16.7 310 66 Daima 32 43 YES NO
18 Belekenya
Farm
UG 400 250 300 9.4 125 32 Megungaa
FCS
35 40 NO NO
19 Nairobi
Ndogo
UG 300 250 267 14.8 33 18 Chepkorio
Dairies
32 80 YES NO
20 Chego Farm UG 900 900 900 25.7 108 35 NKCC /ATM 40 52 YES 1200
21 Kibulogon
Farm
UG 150 77 101 3.9 120 26 Sirikwa 30 38 NO NO
22 Yegen Farm UG 185 185 185 12.3 100 15 Sugoi FCS 32 37 YES NO
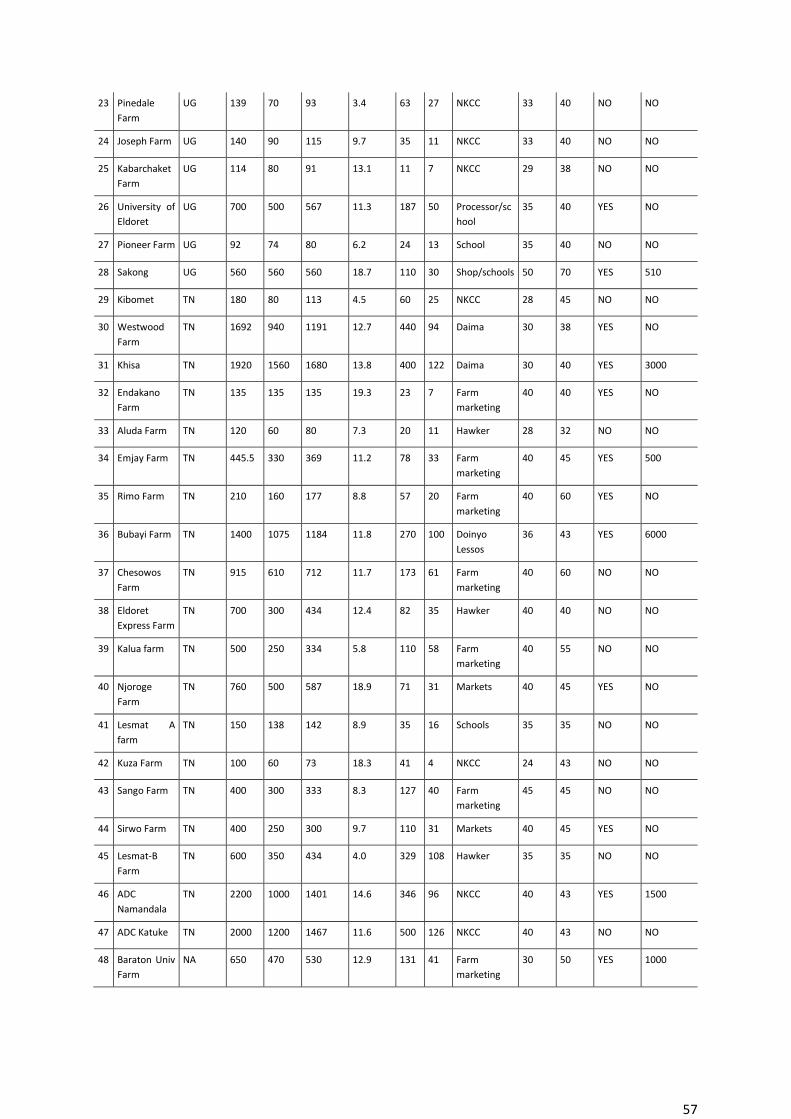
57
23 Pinedale
Farm
UG 139 70 93 3.4 63 27 NKCC 33 40 NO NO
24 Joseph Farm UG 140 90 115 9.7 35 11 NKCC 33 40 NO NO
25 Kabarchaket
Farm
UG 114 80 91 13.1 11 7 NKCC 29 38 NO NO
26 University of
Eldoret
UG 700 500 567 11.3 187 50 Processor/sc
hool
35 40 YES NO
27 Pioneer Farm UG 92 74 80 6.2 24 13 School 35 40 NO NO
28 Sakong UG 560 560 560 18.7 110 30 Shop/schools 50 70 YES 510
29 Kibomet TN 180 80 113 4.5 60 25 NKCC 28 45 NO NO
30 Westwood
Farm
TN 1692 940 1191 12.7 440 94 Daima 30 38 YES NO
31 Khisa TN 1920 1560 1680 13.8 400 122 Daima 30 40 YES 3000
32 Endakano
Farm
TN 135 135 135 19.3 23 7 Farm
marketing
40 40 YES NO
33 Aluda Farm TN 120 60 80 7.3 20 11 Hawker 28 32 NO NO
34 Emjay Farm TN 445.5 330 369 11.2 78 33 Farm
marketing
40 45 YES 500
35 Rimo Farm TN 210 160 177 8.8 57 20 Farm
marketing
40 60 YES NO
36 Bubayi Farm TN 1400 1075 1184 11.8 270 100 Doinyo
Lessos
36 43 YES 6000
37 Chesowos
Farm
TN 915 610 712 11.7 173 61 Farm
marketing
40 60 NO NO
38 Eldoret
Express Farm
TN 700 300 434 12.4 82 35 Hawker 40 40 NO NO
39 Kalua farm TN 500 250 334 5.8 110 58 Farm
marketing
40 55 NO NO
40 Njoroge
Farm
TN 760 500 587 18.9 71 31 Markets 40 45 YES NO
41 Lesmat A
farm
TN 150 138 142 8.9 35 16 Schools 35 35 NO NO
42 Kuza Farm TN 100 60 73 18.3 41 4 NKCC 24 43 NO NO
43 Sango Farm TN 400 300 333 8.3 127 40 Farm
marketing
45 45 NO NO
44 Sirwo Farm TN 400 250 300 9.7 110 31 Markets 40 45 YES NO
45 Lesmat-B
Farm
TN 600 350 434 4.0 329 108 Hawker 35 35 NO NO
46 ADC
Namandala
TN 2200 1000 1401 14.6 346 96 NKCC 40 43 YES 1500
47 ADC Katuke TN 2000 1200 1467 11.6 500 126 NKCC 40 43 NO NO
48 Baraton Univ
Farm
NA 650 470 530 12.9 131 41 Farm
marketing
30 50 YES 1000
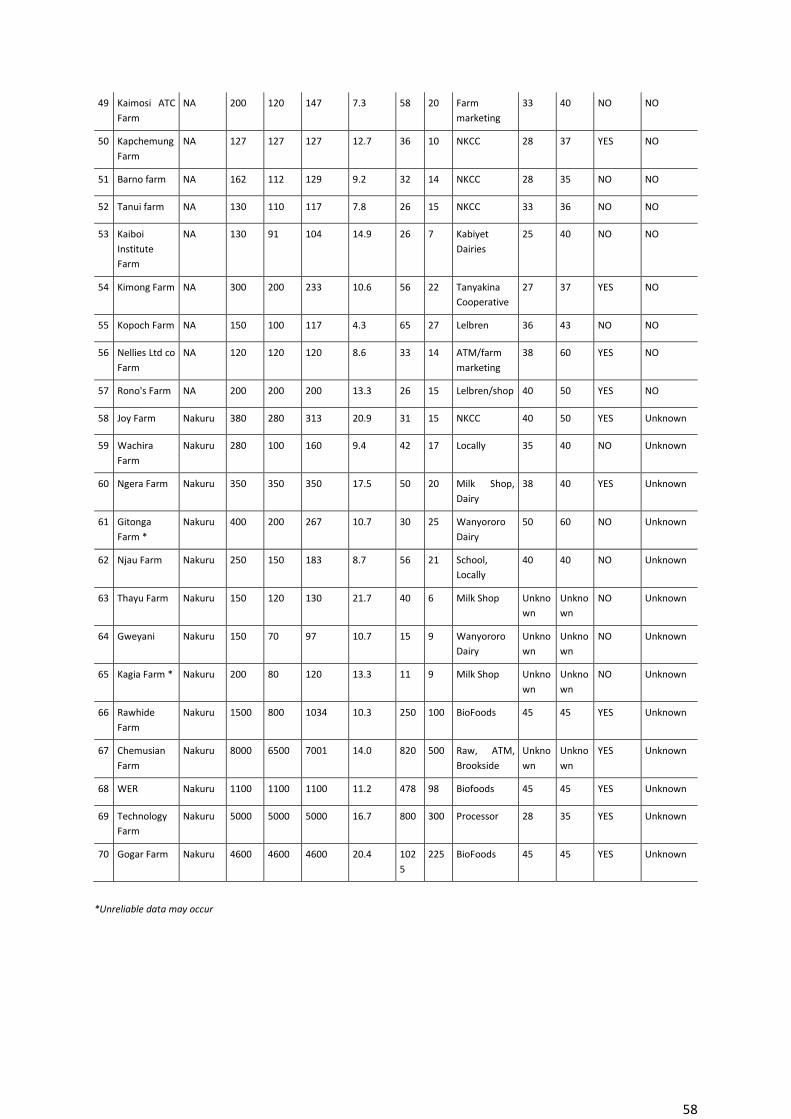
58
49 Kaimosi ATC
Farm
NA 200 120 147 7.3 58 20 Farm
marketing
33 40 NO NO
50 Kapchemung
Farm
NA 127 127 127 12.7 36 10 NKCC 28 37 YES NO
51 Barno farm NA 162 112 129 9.2 32 14 NKCC 28 35 NO NO
52 Tanui farm NA 130 110 117 7.8 26 15 NKCC 33 36 NO NO
53 Kaiboi
Institute
Farm
NA 130 91 104 14.9 26 7 Kabiyet
Dairies
25 40 NO NO
54 Kimong Farm NA 300 200 233 10.6 56 22 Tanyakina
Cooperative
27 37 YES NO
55 Kopoch Farm NA 150 100 117 4.3 65 27 Lelbren 36 43 NO NO
56 Nellies Ltd co
Farm
NA 120 120 120 8.6 33 14 ATM/farm
marketing
38 60 YES NO
57 Rono's Farm NA 200 200 200 13.3 26 15 Lelbren/shop 40 50 YES NO
58 Joy Farm Nakuru 380 280 313 20.9 31 15 NKCC 40 50 YES Unknown
59 Wachira
Farm
Nakuru 280 100 160 9.4 42 17 Locally 35 40 NO Unknown
60 Ngera Farm Nakuru 350 350 350 17.5 50 20 Milk Shop,
Dairy
38 40 YES Unknown
61 Gitonga
Farm *
Nakuru 400 200 267 10.7 30 25 Wanyororo
Dairy
50 60 NO Unknown
62 Njau Farm Nakuru 250 150 183 8.7 56 21 School,
Locally
40 40 NO Unknown
63 Thayu Farm Nakuru 150 120 130 21.7 40 6 Milk Shop Unkno
wn
Unkno
wn
NO Unknown
64 Gweyani Nakuru 150 70 97 10.7 15 9 Wanyororo
Dairy
Unkno
wn
Unkno
wn
NO Unknown
65 Kagia Farm * Nakuru 200 80 120 13.3 11 9 Milk Shop Unkno
wn
Unkno
wn
NO Unknown
66 Rawhide
Farm
Nakuru 1500 800 1034 10.3 250 100 BioFoods 45 45 YES Unknown
67 Chemusian
Farm
Nakuru 8000 6500 7001 14.0 820 500 Raw, ATM,
Brookside
Unkno
wn
Unkno
wn
YES Unknown
68 WER Nakuru 1100 1100 1100 11.2 478 98 Biofoods 45 45 YES Unknown
69 Technology
Farm
Nakuru 5000 5000 5000 16.7 800 300 Processor 28 35 YES Unknown
70 Gogar Farm Nakuru 4600 4600 4600 20.4 102
5
225 BioFoods 45 45 YES Unknown
*Unreliable data may occur
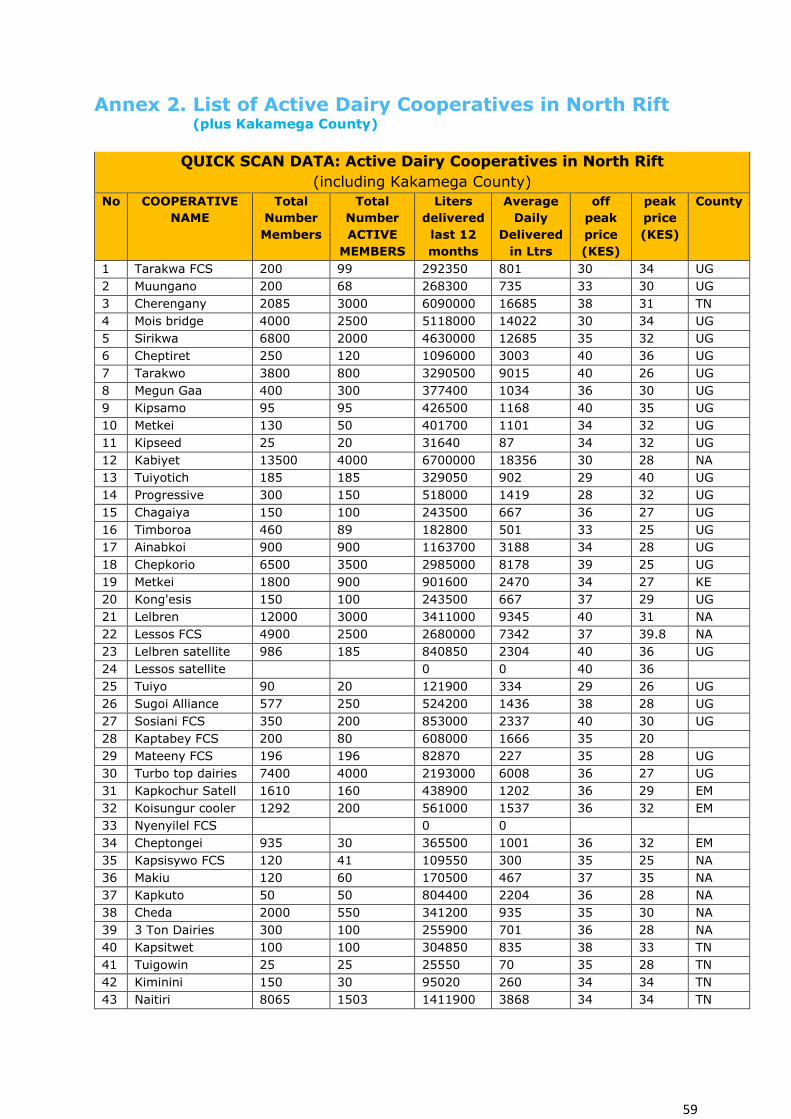
59
Annex 2. List of Active Dairy Cooperatives in North Rift (plus Kakamega County)
QUICK SCAN DATA: Active Dairy Cooperatives in North Rift
(including Kakamega County)
No COOPERATIVE
NAME
Total
Number
Members
Total
Number
ACTIVE
MEMBERS
Liters
delivered
last 12
months
Average
Daily
Delivered
in Ltrs
off
peak
price
(KES)
peak
price
(KES)
County
1 Tarakwa FCS 200 99 292350 801 30 34 UG
2 Muungano 200 68 268300 735 33 30 UG
3 Cherengany 2085 3000 6090000 16685 38 31 TN
4 Mois bridge 4000 2500 5118000 14022 30 34 UG
5 Sirikwa 6800 2000 4630000 12685 35 32 UG
6 Cheptiret 250 120 1096000 3003 40 36 UG
7 Tarakwo 3800 800 3290500 9015 40 26 UG
8 Megun Gaa 400 300 377400 1034 36 30 UG
9 Kipsamo 95 95 426500 1168 40 35 UG
10 Metkei 130 50 401700 1101 34 32 UG
11 Kipseed 25 20 31640 87 34 32 UG
12 Kabiyet 13500 4000 6700000 18356 30 28 NA
13 Tuiyotich 185 185 329050 902 29 40 UG
14 Progressive 300 150 518000 1419 28 32 UG
15 Chagaiya 150 100 243500 667 36 27 UG
16 Timboroa 460 89 182800 501 33 25 UG
17 Ainabkoi 900 900 1163700 3188 34 28 UG
18 Chepkorio 6500 3500 2985000 8178 39 25 UG
19 Metkei 1800 900 901600 2470 34 27 KE
20 Kong'esis 150 100 243500 667 37 29 UG
21 Lelbren 12000 3000 3411000 9345 40 31 NA
22 Lessos FCS 4900 2500 2680000 7342 37 39.8 NA
23 Lelbren satellite 986 185 840850 2304 40 36 UG
24 Lessos satellite 0 0 40 36
25 Tuiyo 90 20 121900 334 29 26 UG
26 Sugoi Alliance 577 250 524200 1436 38 28 UG
27 Sosiani FCS 350 200 853000 2337 40 30 UG
28 Kaptabey FCS 200 80 608000 1666 35 20
29 Mateeny FCS 196 196 82870 227 35 28 UG
30 Turbo top dairies 7400 4000 2193000 6008 36 27 UG
31 Kapkochur Satell 1610 160 438900 1202 36 29 EM
32 Koisungur cooler 1292 200 561000 1537 36 32 EM
33 Nyenyilel FCS 0 0
34 Cheptongei 935 30 365500 1001 36 32 EM
35 Kapsisywo FCS 120 41 109550 300 35 25 NA
36 Makiu 120 60 170500 467 37 35 NA
37 Kapkuto 50 50 804400 2204 36 28 NA
38 Cheda 2000 550 341200 935 35 30 NA
39 3 Ton Dairies 300 100 255900 701 36 28 NA
40 Kapsitwet 100 100 304850 835 38 33 TN
41 Tuigowin 25 25 25550 70 35 28 TN
42 Kiminini 150 30 95020 260 34 34 TN
43 Naitiri 8065 1503 1411900 3868 34 34 TN
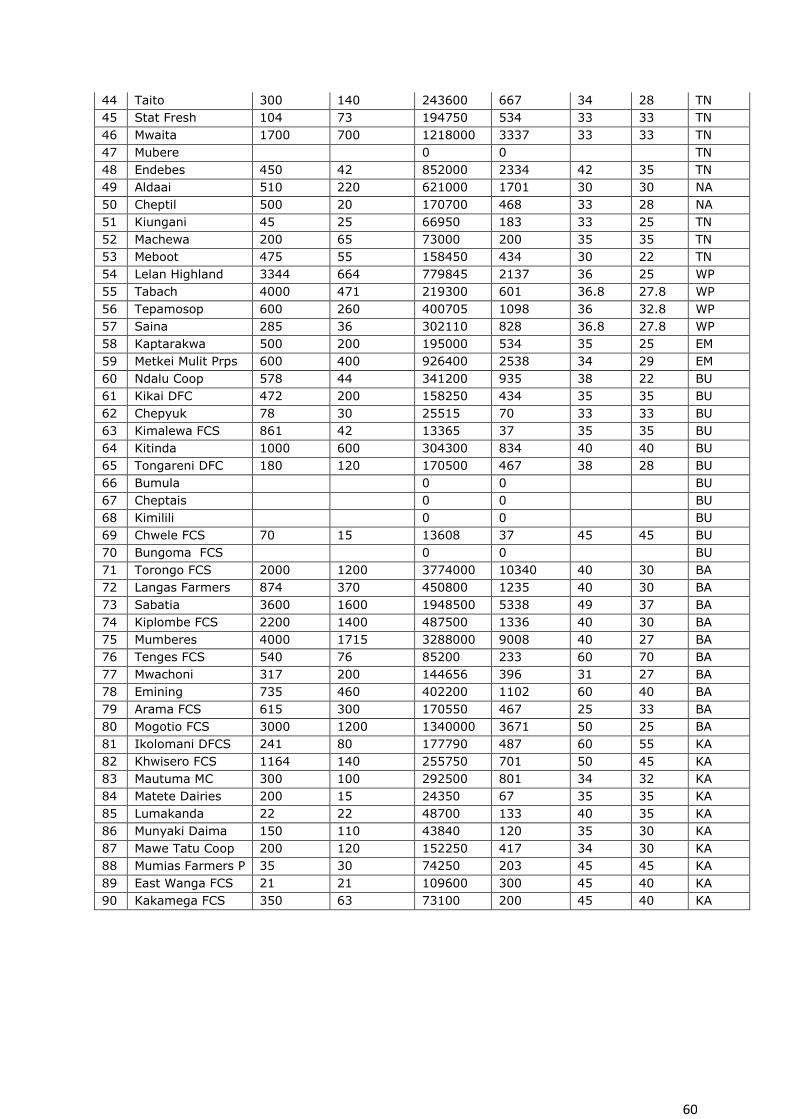
60
44 Taito 300 140 243600 667 34 28 TN
45 Stat Fresh 104 73 194750 534 33 33 TN
46 Mwaita 1700 700 1218000 3337 33 33 TN
47 Mubere 0 0 TN
48 Endebes 450 42 852000 2334 42 35 TN
49 Aldaai 510 220 621000 1701 30 30 NA
50 Cheptil 500 20 170700 468 33 28 NA
51 Kiungani 45 25 66950 183 33 25 TN
52 Machewa 200 65 73000 200 35 35 TN
53 Meboot 475 55 158450 434 30 22 TN
54 Lelan Highland 3344 664 779845 2137 36 25 WP
55 Tabach 4000 471 219300 601 36.8 27.8 WP
56 Tepamosop 600 260 400705 1098 36 32.8 WP
57 Saina 285 36 302110 828 36.8 27.8 WP
58 Kaptarakwa 500 200 195000 534 35 25 EM
59 Metkei Mulit Prps 600 400 926400 2538 34 29 EM
60 Ndalu Coop 578 44 341200 935 38 22 BU
61 Kikai DFC 472 200 158250 434 35 35 BU
62 Chepyuk 78 30 25515 70 33 33 BU
63 Kimalewa FCS 861 42 13365 37 35 35 BU
64 Kitinda 1000 600 304300 834 40 40 BU
65 Tongareni DFC 180 120 170500 467 38 28 BU
66 Bumula 0 0 BU
67 Cheptais 0 0 BU
68 Kimilili 0 0 BU
69 Chwele FCS 70 15 13608 37 45 45 BU
70 Bungoma FCS 0 0 BU
71 Torongo FCS 2000 1200 3774000 10340 40 30 BA
72 Langas Farmers 874 370 450800 1235 40 30 BA
73 Sabatia 3600 1600 1948500 5338 49 37 BA
74 Kiplombe FCS 2200 1400 487500 1336 40 30 BA
75 Mumberes 4000 1715 3288000 9008 40 27 BA
76 Tenges FCS 540 76 85200 233 60 70 BA
77 Mwachoni 317 200 144656 396 31 27 BA
78 Emining 735 460 402200 1102 60 40 BA
79 Arama FCS 615 300 170550 467 25 33 BA
80 Mogotio FCS 3000 1200 1340000 3671 50 25 BA
81 Ikolomani DFCS 241 80 177790 487 60 55 KA
82 Khwisero FCS 1164 140 255750 701 50 45 KA
83 Mautuma MC 300 100 292500 801 34 32 KA
84 Matete Dairies 200 15 24350 67 35 35 KA
85 Lumakanda 22 22 48700 133 40 35 KA
86 Munyaki Daima 150 110 43840 120 35 30 KA
87 Mawe Tatu Coop 200 120 152250 417 34 30 KA
88 Mumias Farmers P 35 30 74250 203 45 45 KA
89 East Wanga FCS 21 21 109600 300 45 40 KA
90 Kakamega FCS 350 63 73100 200 45 40 KA
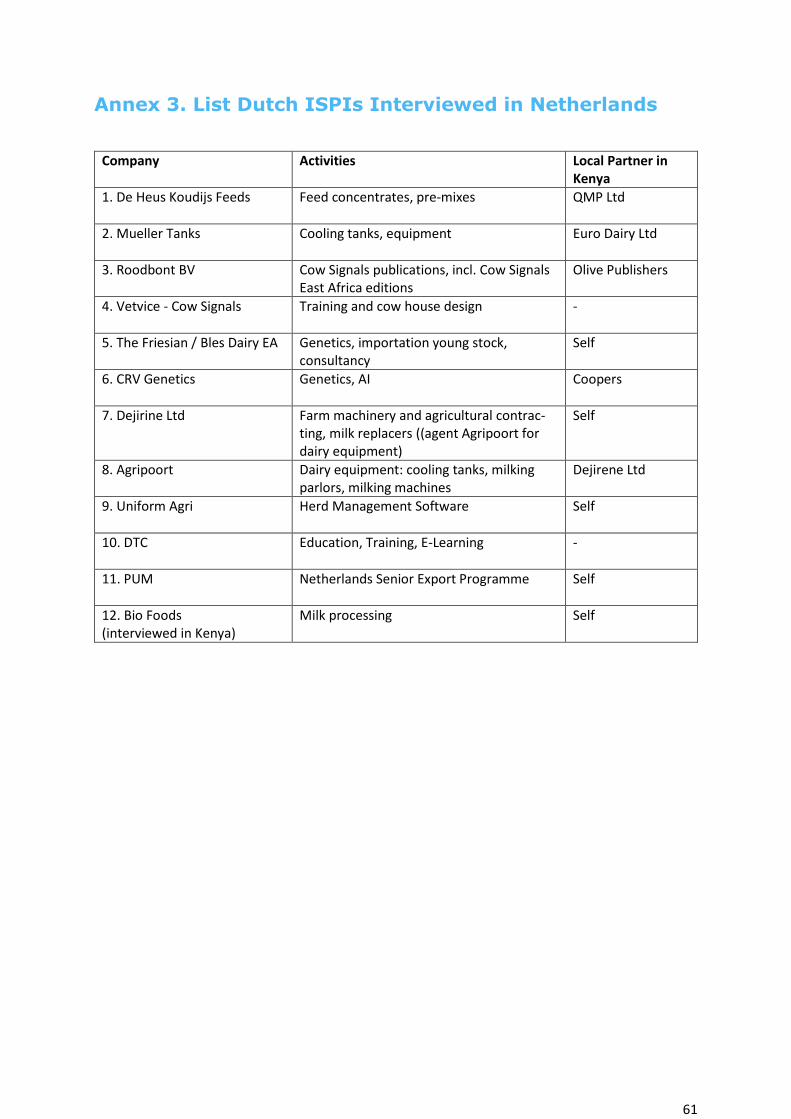
61
Annex 3. List Dutch ISPIs Interviewed in Netherlands
Company Activities Local Partner in Kenya
1. De Heus Koudijs Feeds Feed concentrates, pre-mixes
QMP Ltd
2. Mueller Tanks Cooling tanks, equipment
Euro Dairy Ltd
3. Roodbont BV Cow Signals publications, incl. Cow Signals East Africa editions
Olive Publishers
4. Vetvice - Cow Signals Training and cow house design
-
5. The Friesian / Bles Dairy EA Genetics, importation young stock, consultancy
Self
6. CRV Genetics Genetics, AI
Coopers
7. Dejirine Ltd Farm machinery and agricultural contrac-ting, milk replacers ((agent Agripoort for dairy equipment)
Self
8. Agripoort Dairy equipment: cooling tanks, milking parlors, milking machines
Dejirene Ltd
9. Uniform Agri Herd Management Software
Self
10. DTC Education, Training, E-Learning
-
11. PUM Netherlands Senior Export Programme
Self
12. Bio Foods (interviewed in Kenya)
Milk processing Self
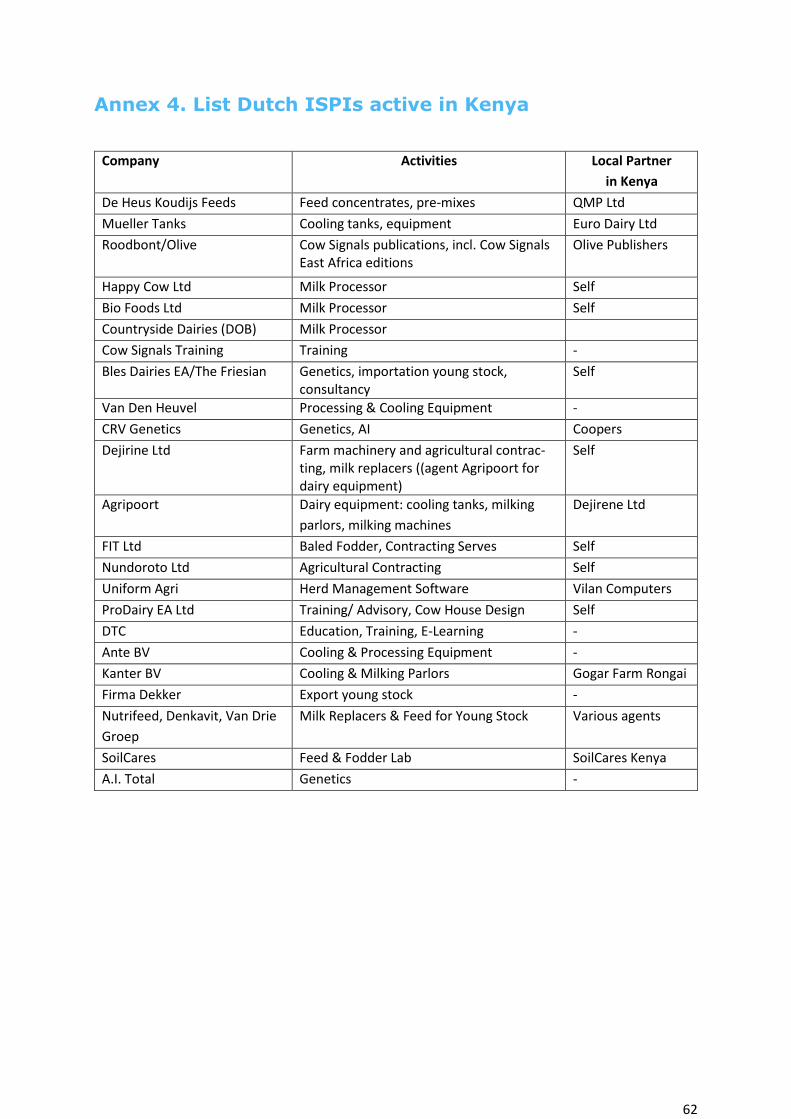
62
Annex 4. List Dutch ISPIs active in Kenya
Company Activities Local Partner
in Kenya
De Heus Koudijs Feeds Feed concentrates, pre-mixes QMP Ltd
Mueller Tanks Cooling tanks, equipment Euro Dairy Ltd
Roodbont/Olive
Cow Signals publications, incl. Cow Signals East Africa editions
Olive Publishers
Happy Cow Ltd Milk Processor Self
Bio Foods Ltd Milk Processor Self
Countryside Dairies (DOB) Milk Processor
Cow Signals Training Training -
Bles Dairies EA/The Friesian Genetics, importation young stock, consultancy
Self
Van Den Heuvel Processing & Cooling Equipment -
CRV Genetics Genetics, AI Coopers
Dejirine Ltd Farm machinery and agricultural contrac-ting, milk replacers ((agent Agripoort for dairy equipment)
Self
Agripoort
Dairy equipment: cooling tanks, milking
parlors, milking machines
Dejirene Ltd
FIT Ltd Baled Fodder, Contracting Serves Self
Nundoroto Ltd Agricultural Contracting Self
Uniform Agri Herd Management Software Vilan Computers
ProDairy EA Ltd Training/ Advisory, Cow House Design Self
DTC Education, Training, E-Learning -
Ante BV Cooling & Processing Equipment -
Kanter BV Cooling & Milking Parlors Gogar Farm Rongai
Firma Dekker Export young stock -
Nutrifeed, Denkavit, Van Drie
Groep
Milk Replacers & Feed for Young Stock Various agents
SoilCares Feed & Fodder Lab SoilCares Kenya
A.I. Total Genetics -
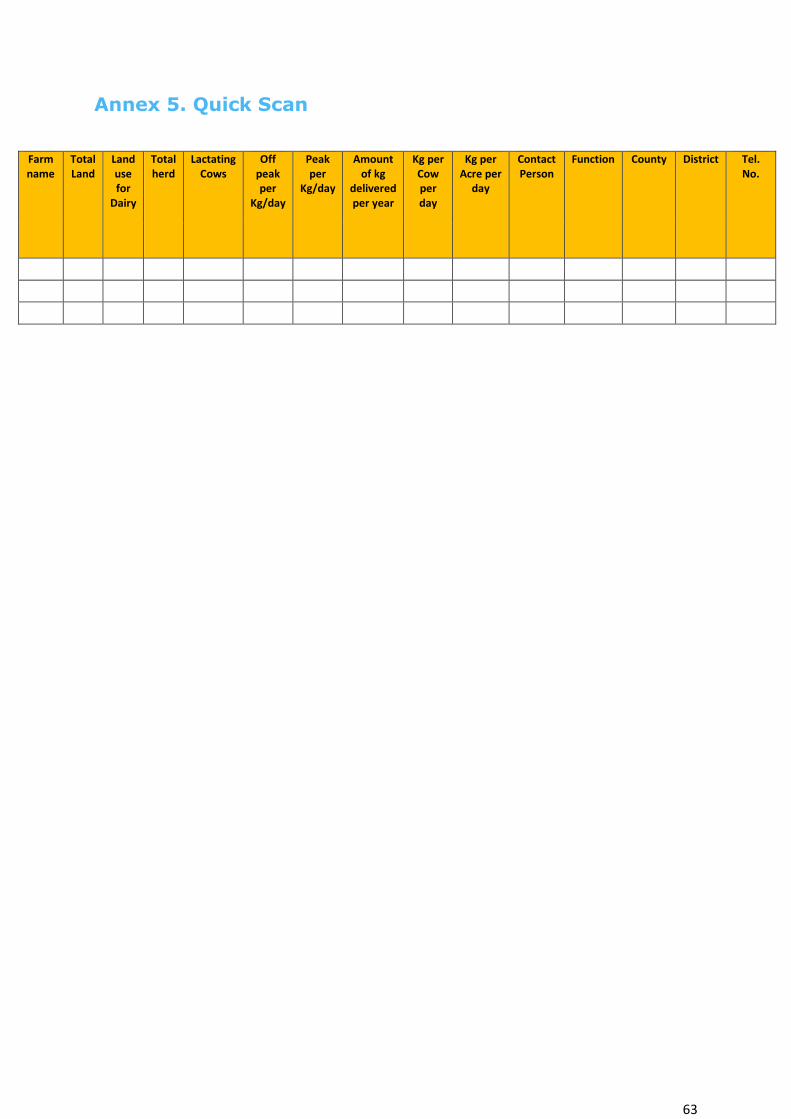
63
Annex 5. Quick Scan
Farm name
Total Land
Land use for
Dairy
Total herd
Lactating Cows
Off peak per
Kg/day
Peak per
Kg/day
Amount of kg
delivered per year
Kg per Cow per day
Kg per Acre per
day
Contact Person
Function County District Tel. No.
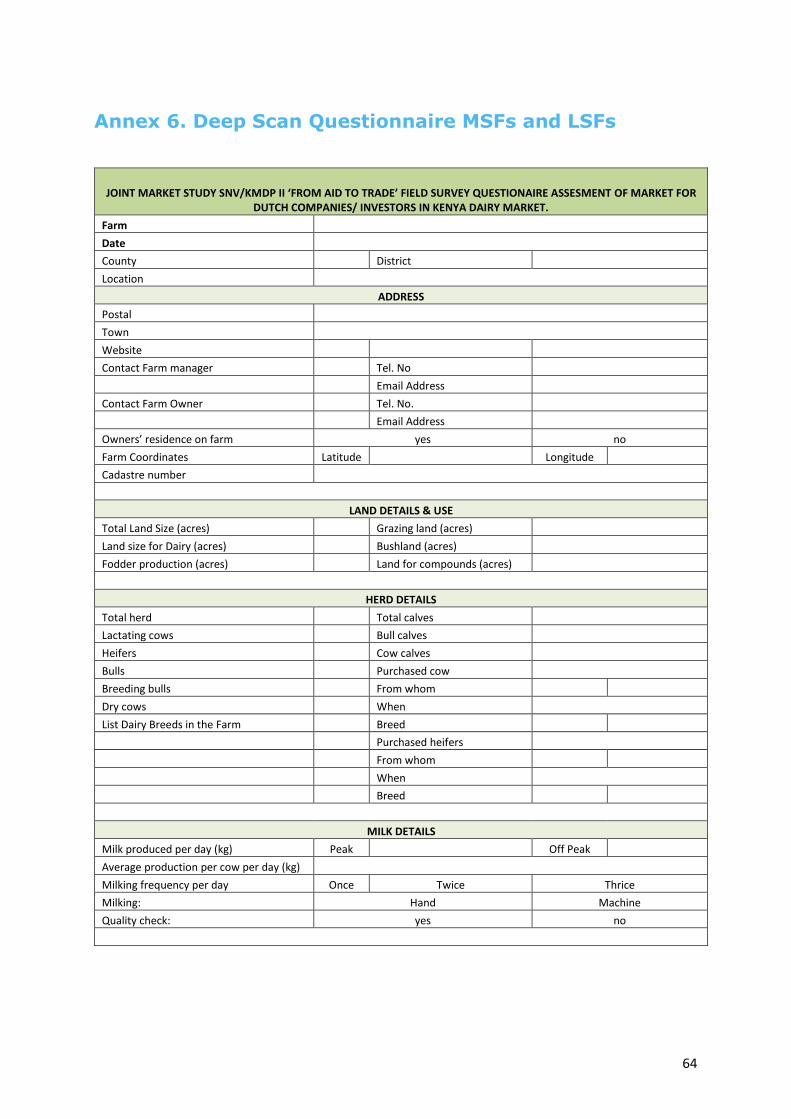
64
Annex 6. Deep Scan Questionnaire MSFs and LSFs
JOINT MARKET STUDY SNV/KMDP II ‘FROM AID TO TRADE’ FIELD SURVEY QUESTIONAIRE ASSESMENT OF MARKET FOR DUTCH COMPANIES/ INVESTORS IN KENYA DAIRY MARKET.
Farm
Date
County District
Location
ADDRESS
Postal
Town
Website
Contact Farm manager Tel. No
Email Address
Contact Farm Owner Tel. No.
Email Address
Owners’ residence on farm yes no
Farm Coordinates Latitude Longitude
Cadastre number
LAND DETAILS & USE
Total Land Size (acres) Grazing land (acres)
Land size for Dairy (acres) Bushland (acres)
Fodder production (acres) Land for compounds (acres)
HERD DETAILS
Total herd Total calves
Lactating cows Bull calves
Heifers Cow calves
Bulls Purchased cow
Breeding bulls From whom
Dry cows When
List Dairy Breeds in the Farm Breed
Purchased heifers
From whom
When
Breed
MILK DETAILS
Milk produced per day (kg) Peak Off Peak
Average production per cow per day (kg)
Milking frequency per day Once Twice Thrice
Milking: Hand Machine
Quality check: yes no
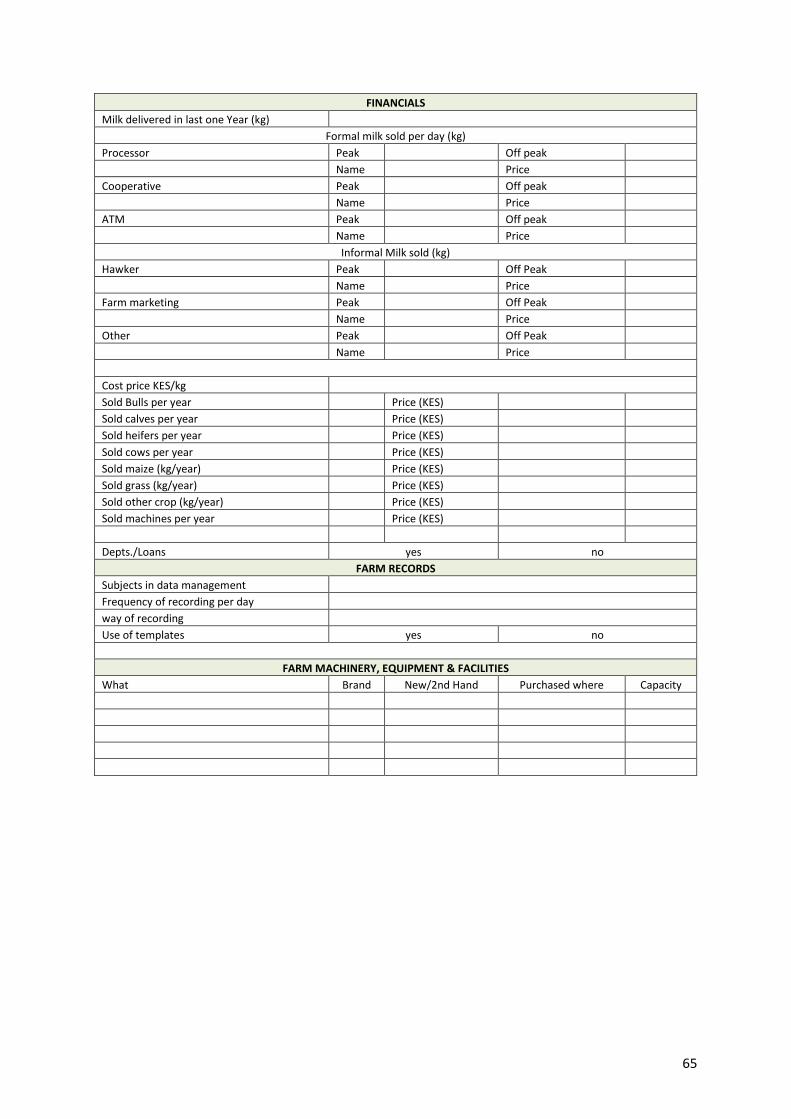
65
FINANCIALS
Milk delivered in last one Year (kg)
Formal milk sold per day (kg)
Processor Peak Off peak
Name Price
Cooperative Peak Off peak
Name Price
ATM Peak Off peak
Name Price
Informal Milk sold (kg)
Hawker Peak Off Peak
Name Price
Farm marketing Peak Off Peak
Name Price
Other Peak Off Peak
Name Price
Cost price KES/kg
Sold Bulls per year Price (KES)
Sold calves per year Price (KES)
Sold heifers per year Price (KES)
Sold cows per year Price (KES)
Sold maize (kg/year) Price (KES)
Sold grass (kg/year) Price (KES)
Sold other crop (kg/year) Price (KES)
Sold machines per year Price (KES)
Depts./Loans yes no
FARM RECORDS
Subjects in data management
Frequency of recording per day
way of recording
Use of templates yes no
FARM MACHINERY, EQUIPMENT & FACILITIES
What Brand New/2nd Hand Purchased where Capacity
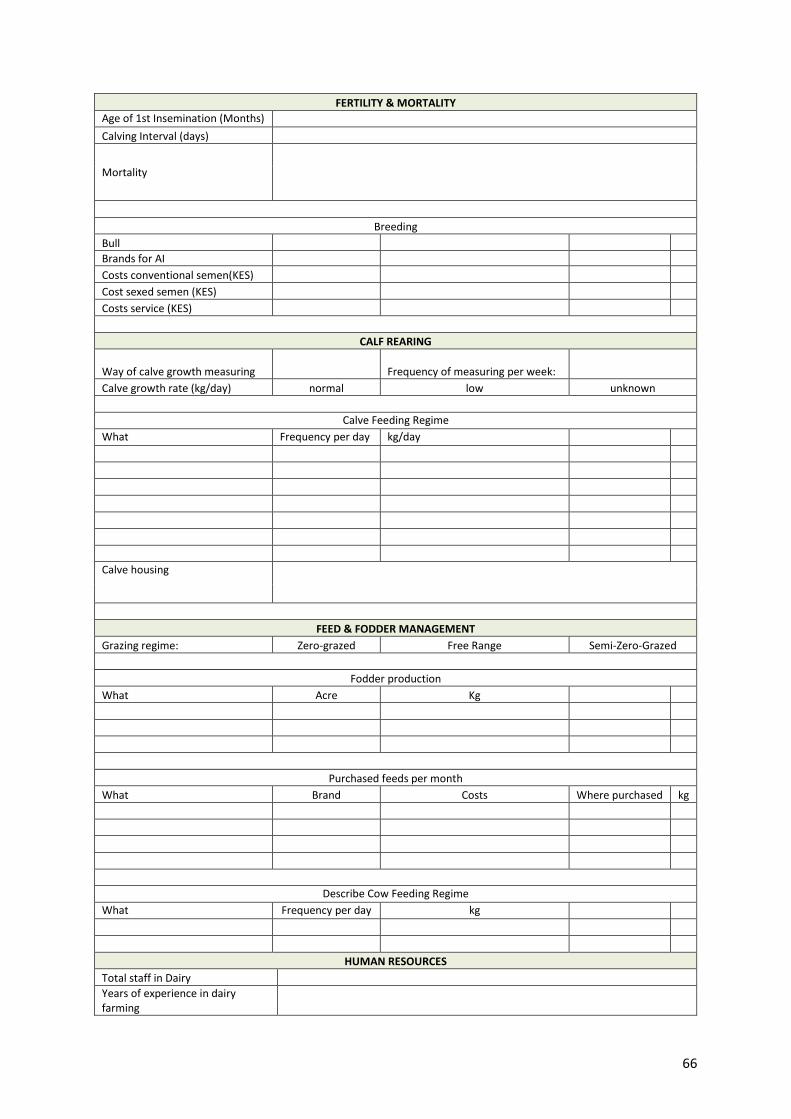
66
FERTILITY & MORTALITY
Age of 1st Insemination (Months)
Calving Interval (days)
Mortality
Breeding
Bull
Brands for AI
Costs conventional semen(KES)
Cost sexed semen (KES)
Costs service (KES)
CALF REARING
Way of calve growth measuring Frequency of measuring per week:
Calve growth rate (kg/day) normal low unknown
Calve Feeding Regime
What Frequency per day kg/day
Calve housing
FEED & FODDER MANAGEMENT
Grazing regime: Zero-grazed Free Range Semi-Zero-Grazed
Fodder production
What Acre Kg
Purchased feeds per month
What Brand Costs Where purchased kg
Describe Cow Feeding Regime
What Frequency per day kg
HUMAN RESOURCES
Total staff in Dairy
Years of experience in dairy farming
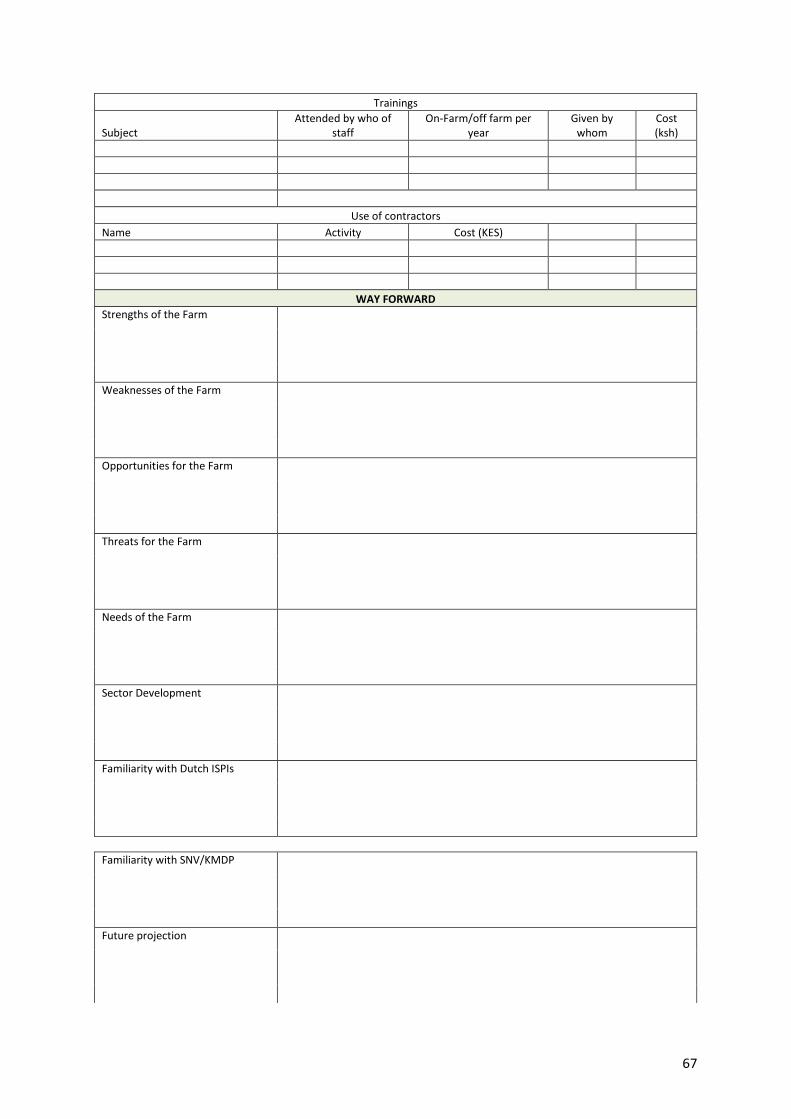
67
Trainings
Subject Attended by who of
staff On-Farm/off farm per
year Given by
whom Cost (ksh)
Use of contractors
Name Activity Cost (KES)
WAY FORWARD
Strengths of the Farm
Weaknesses of the Farm
Opportunities for the Farm
Threats for the Farm
Needs of the Farm
Sector Development
Familiarity with Dutch ISPIs
Familiarity with SNV/KMDP
Future projection
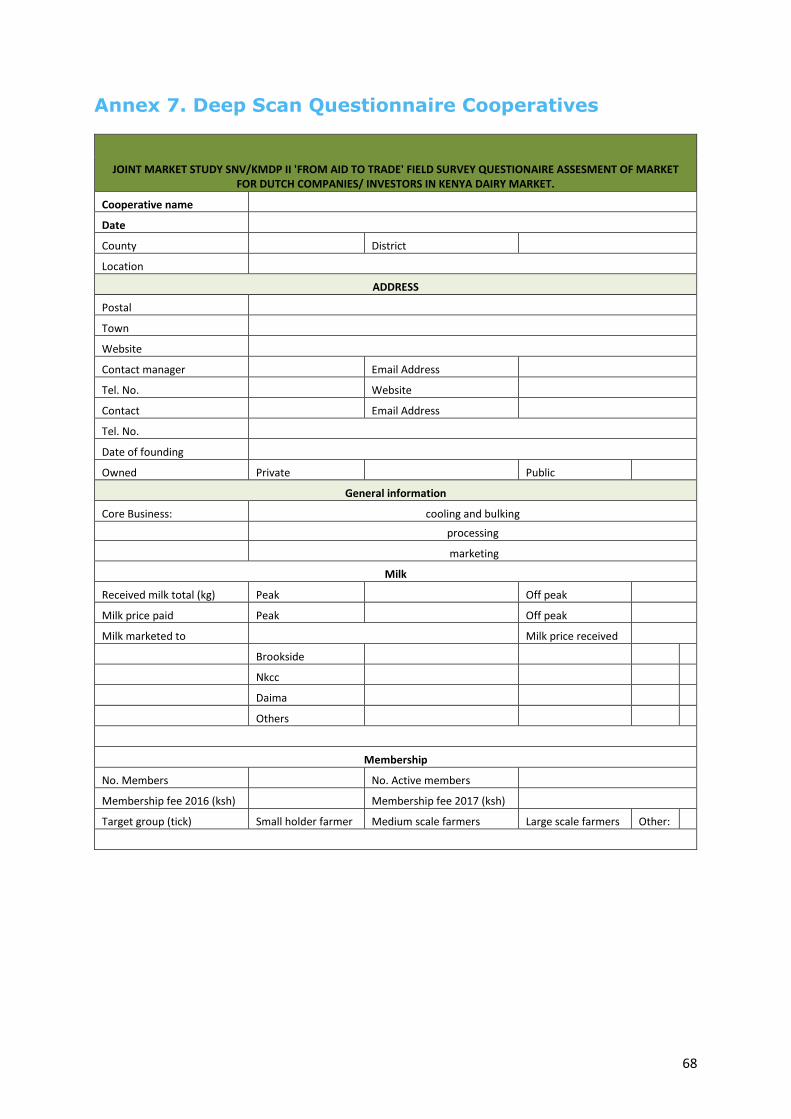
68
Annex 7. Deep Scan Questionnaire Cooperatives
JOINT MARKET STUDY SNV/KMDP II 'FROM AID TO TRADE' FIELD SURVEY QUESTIONAIRE ASSESMENT OF MARKET FOR DUTCH COMPANIES/ INVESTORS IN KENYA DAIRY MARKET.
Cooperative name
Date
County District
Location
ADDRESS
Postal
Town
Website
Contact manager Email Address
Tel. No. Website
Contact Email Address
Tel. No.
Date of founding
Owned Private Public
General information
Core Business: cooling and bulking
processing
marketing
Milk
Received milk total (kg) Peak Off peak
Milk price paid Peak Off peak
Milk marketed to Milk price received
Brookside
Nkcc
Daima
Others
Membership
No. Members No. Active members
Membership fee 2016 (ksh) Membership fee 2017 (ksh)
Target group (tick) Small holder farmer Medium scale farmers Large scale farmers Other:
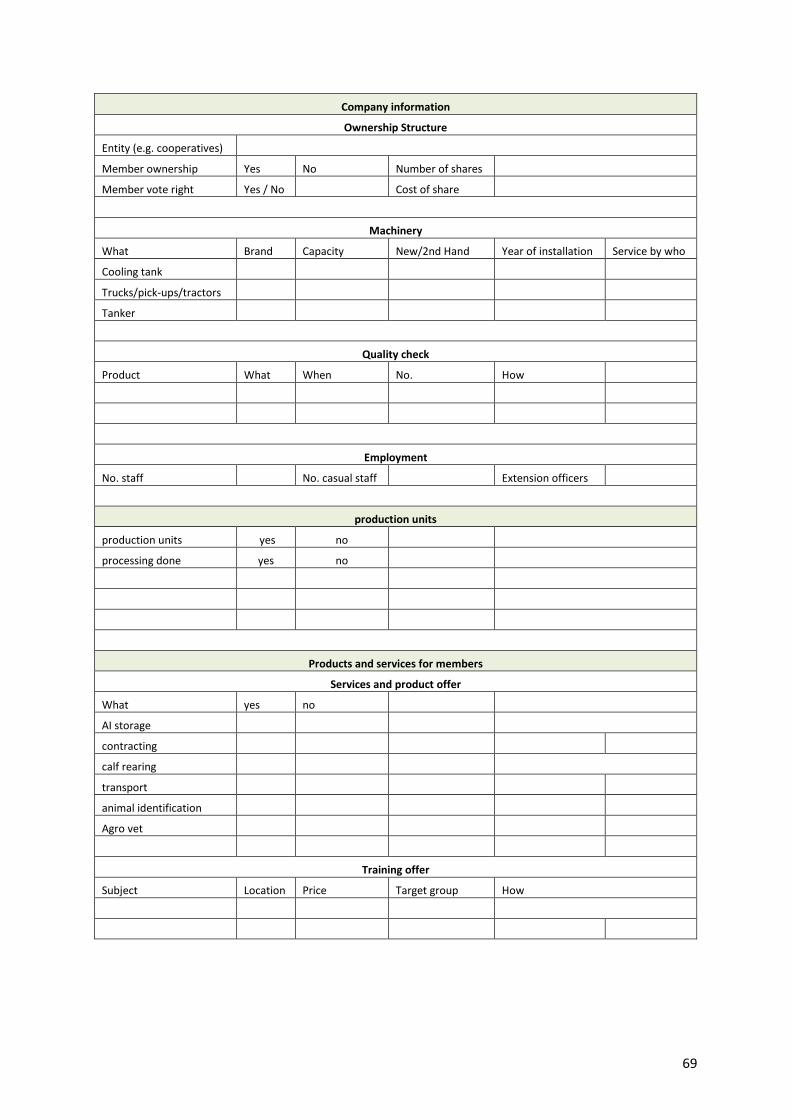
69
Company information
Ownership Structure
Entity (e.g. cooperatives)
Member ownership Yes No Number of shares
Member vote right Yes / No Cost of share
Machinery
What Brand Capacity New/2nd Hand Year of installation Service by who
Cooling tank
Trucks/pick-ups/tractors
Tanker
Quality check
Product What When No. How
Employment
No. staff No. casual staff Extension officers
production units
production units yes no
processing done yes no
Products and services for members
Services and product offer
What yes no
AI storage
contracting
calf rearing
transport
animal identification
Agro vet
Training offer
Subject Location Price Target group How
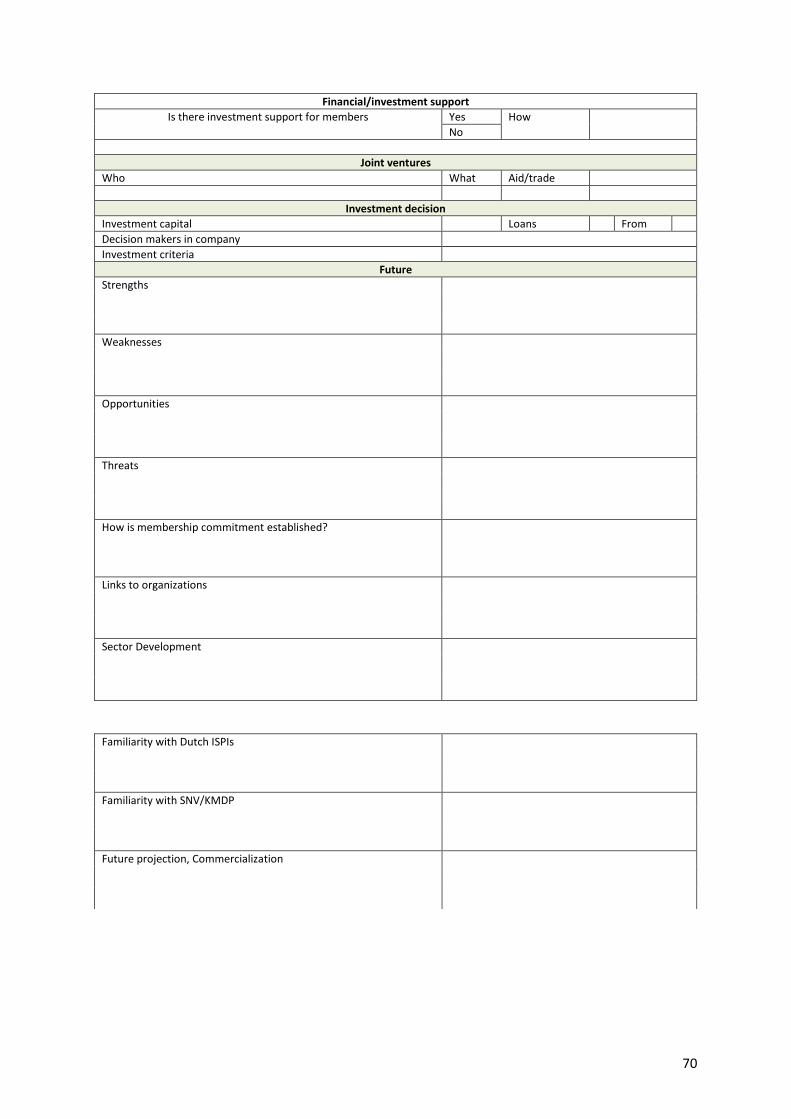
70
Financial/investment support
Is there investment support for members Yes How
No
Joint ventures
Who What Aid/trade
Investment decision
Investment capital Loans From
Decision makers in company
Investment criteria
Future
Strengths
Weaknesses
Opportunities
Threats
How is membership commitment established?
Links to organizations
Sector Development
Familiarity with Dutch ISPIs
Familiarity with SNV/KMDP
Future projection, Commercialization
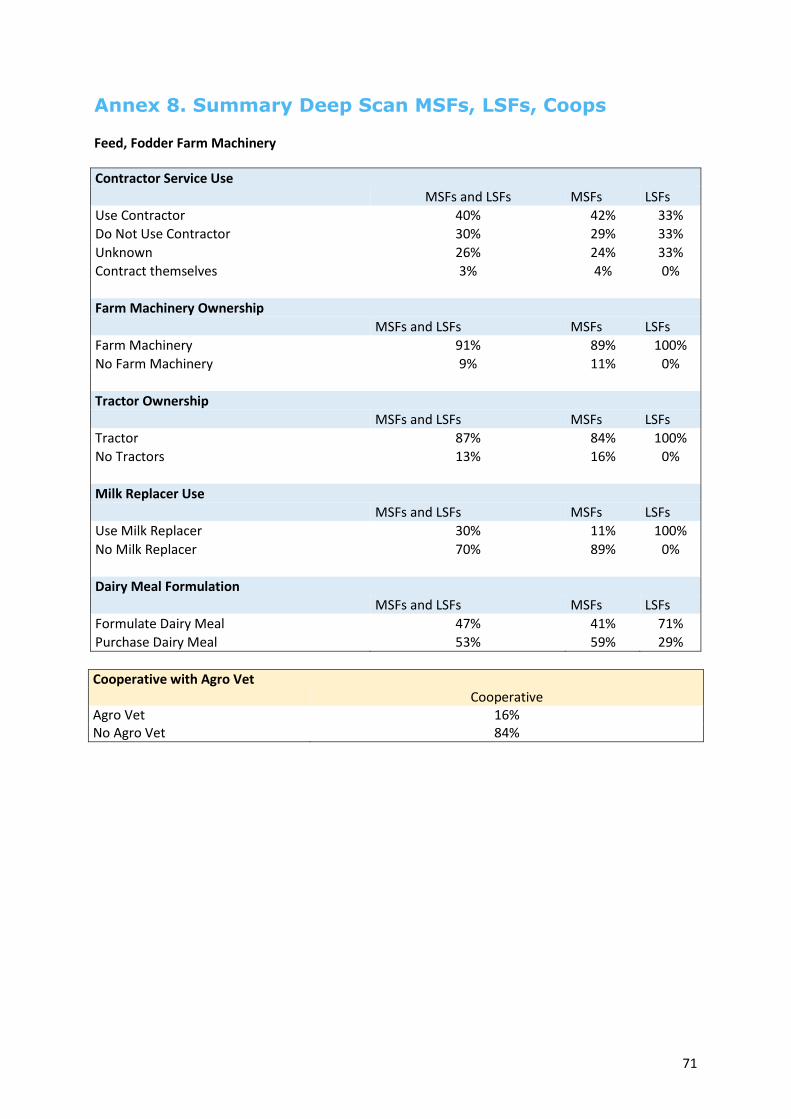
71
Annex 8. Summary Deep Scan MSFs, LSFs, Coops Feed, Fodder Farm Machinery
Contractor Service Use
MSFs and LSFs MSFs LSFs
Use Contractor 40% 42% 33%
Do Not Use Contractor 30% 29% 33%
Unknown 26% 24% 33%
Contract themselves 3% 4% 0%
Farm Machinery Ownership
MSFs and LSFs MSFs LSFs
Farm Machinery 91% 89% 100%
No Farm Machinery 9% 11% 0%
Tractor Ownership
MSFs and LSFs MSFs LSFs
Tractor 87% 84% 100%
No Tractors 13% 16% 0%
Milk Replacer Use
MSFs and LSFs MSFs LSFs
Use Milk Replacer 30% 11% 100%
No Milk Replacer 70% 89% 0%
Dairy Meal Formulation
MSFs and LSFs MSFs LSFs
Formulate Dairy Meal 47% 41% 71%
Purchase Dairy Meal 53% 59% 29%
Cooperative with Agro Vet Cooperative Agro Vet 16% No Agro Vet 84%
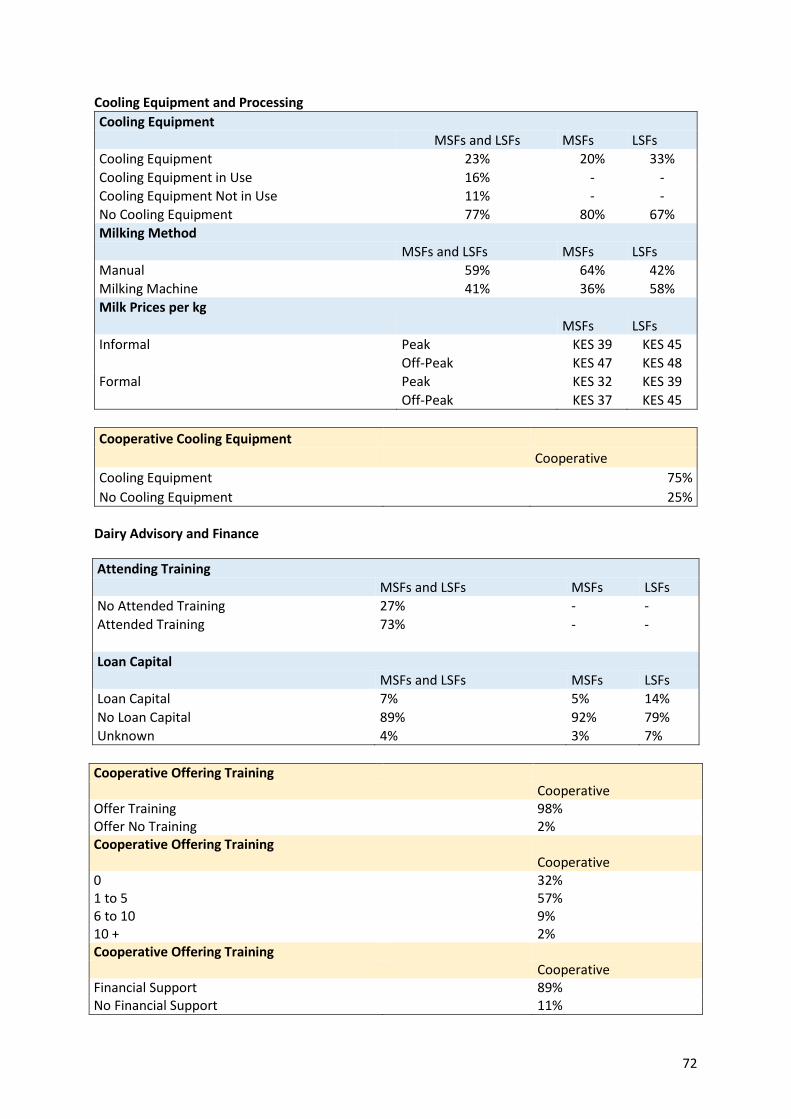
72
Cooling Equipment and Processing
Cooling Equipment
MSFs and LSFs MSFs LSFs
Cooling Equipment 23% 20% 33%
Cooling Equipment in Use 16% - -
Cooling Equipment Not in Use 11% - -
No Cooling Equipment 77% 80% 67%
Milking Method
MSFs and LSFs MSFs LSFs
Manual 59% 64% 42%
Milking Machine 41% 36% 58%
Milk Prices per kg
MSFs LSFs
Informal Peak KES 39 KES 45
Off-Peak KES 47 KES 48
Formal Peak KES 32 KES 39
Off-Peak KES 37 KES 45
Cooperative Cooling Equipment
Cooperative
Cooling Equipment 75%
No Cooling Equipment 25%
Dairy Advisory and Finance
Attending Training
MSFs and LSFs MSFs LSFs
No Attended Training 27% - -
Attended Training 73% - -
Loan Capital
MSFs and LSFs MSFs LSFs
Loan Capital 7% 5% 14%
No Loan Capital 89% 92% 79%
Unknown 4% 3% 7%
Cooperative Offering Training Cooperative Offer Training 98% Offer No Training 2% Cooperative Offering Training Cooperative 0 32% 1 to 5 57% 6 to 10 9% 10 + 2% Cooperative Offering Training Cooperative Financial Support 89% No Financial Support 11%
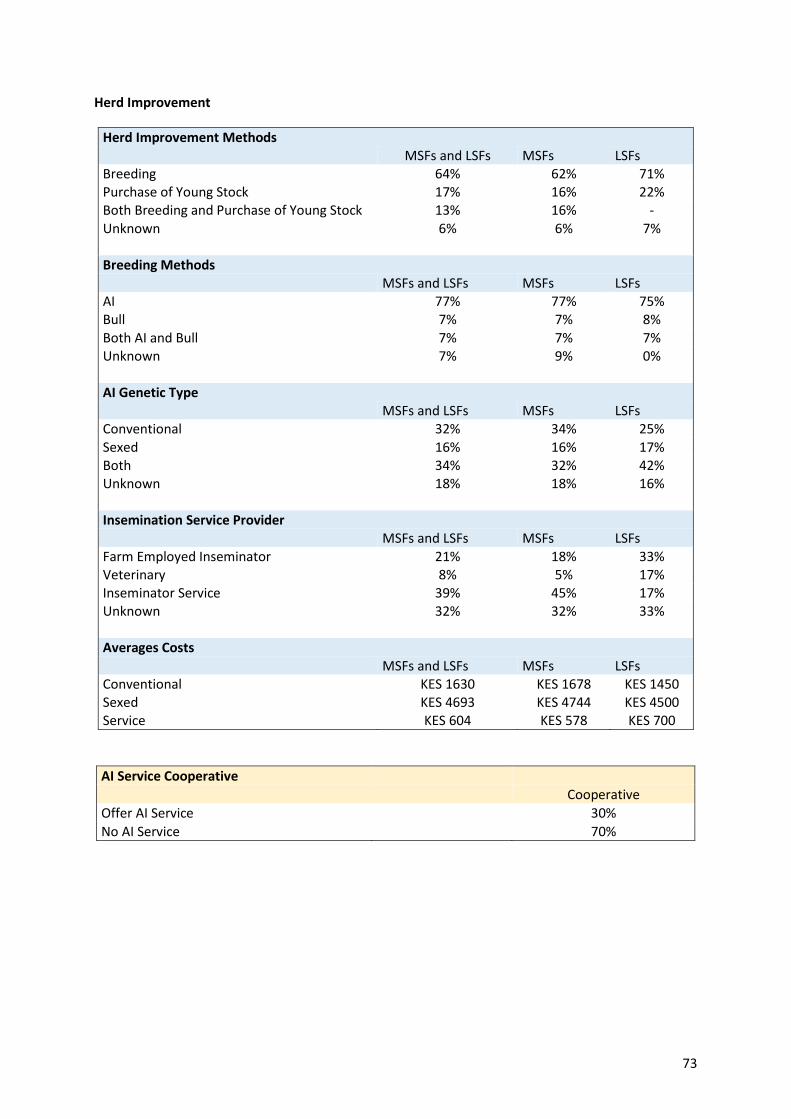
73
Herd Improvement
Herd Improvement Methods MSFs and LSFs MSFs LSFs Breeding 64% 62% 71% Purchase of Young Stock 17% 16% 22% Both Breeding and Purchase of Young Stock 13% 16% -
Unknown 6% 6% 7% Breeding Methods MSFs and LSFs MSFs LSFs AI 77% 77% 75% Bull 7% 7% 8% Both AI and Bull 7% 7% 7% Unknown 7% 9% 0% AI Genetic Type MSFs and LSFs MSFs LSFs Conventional 32% 34% 25% Sexed 16% 16% 17% Both 34% 32% 42% Unknown 18% 18% 16% Insemination Service Provider MSFs and LSFs MSFs LSFs Farm Employed Inseminator 21% 18% 33% Veterinary 8% 5% 17% Inseminator Service 39% 45% 17% Unknown 32% 32% 33% Averages Costs MSFs and LSFs MSFs LSFs Conventional KES 1630 KES 1678 KES 1450 Sexed KES 4693 KES 4744 KES 4500 Service KES 604 KES 578 KES 700
AI Service Cooperative
Cooperative
Offer AI Service 30%
No AI Service 70%
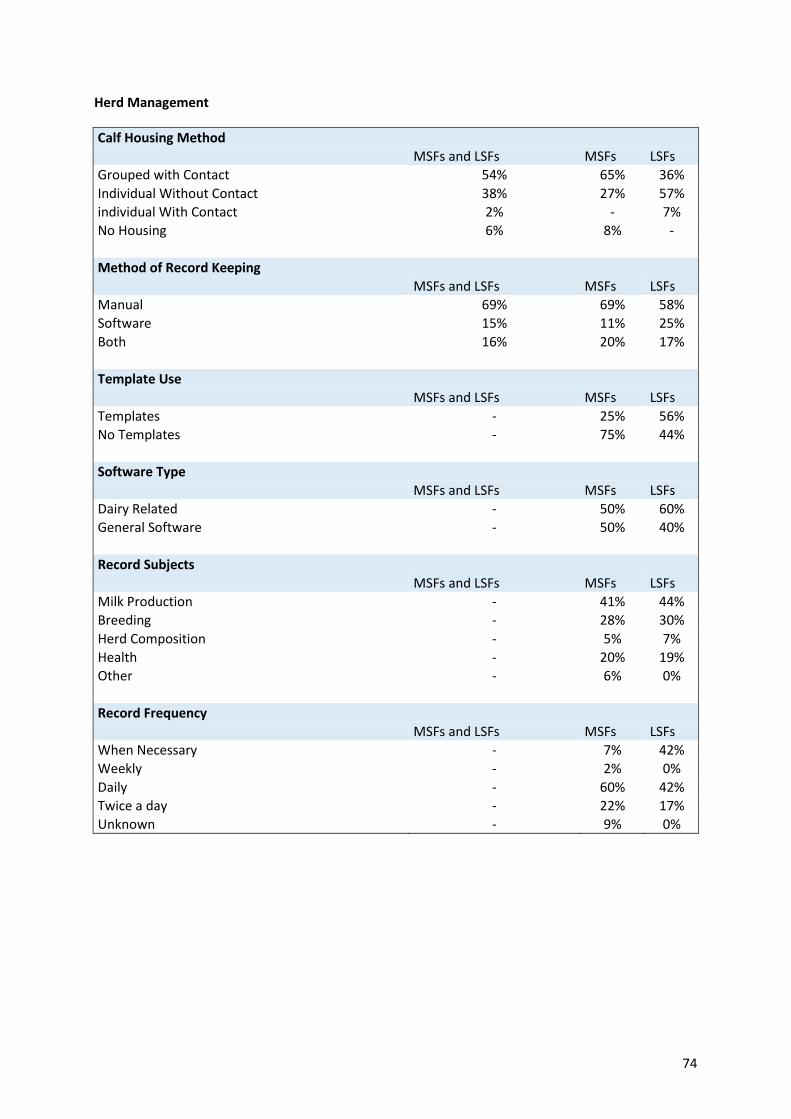
74
Herd Management
Calf Housing Method
MSFs and LSFs MSFs LSFs
Grouped with Contact 54% 65% 36%
Individual Without Contact 38% 27% 57%
individual With Contact 2% - 7%
No Housing 6% 8% -
Method of Record Keeping
MSFs and LSFs MSFs LSFs
Manual 69% 69% 58%
Software 15% 11% 25%
Both 16% 20% 17%
Template Use
MSFs and LSFs MSFs LSFs
Templates - 25% 56%
No Templates - 75% 44%
Software Type
MSFs and LSFs MSFs LSFs
Dairy Related - 50% 60%
General Software - 50% 40%
Record Subjects
MSFs and LSFs MSFs LSFs
Milk Production - 41% 44%
Breeding - 28% 30%
Herd Composition - 5% 7%
Health - 20% 19%
Other - 6% 0%
Record Frequency
MSFs and LSFs MSFs LSFs
When Necessary - 7% 42%
Weekly - 2% 0%
Daily - 60% 42%
Twice a day - 22% 17%
Unknown - 9% 0%
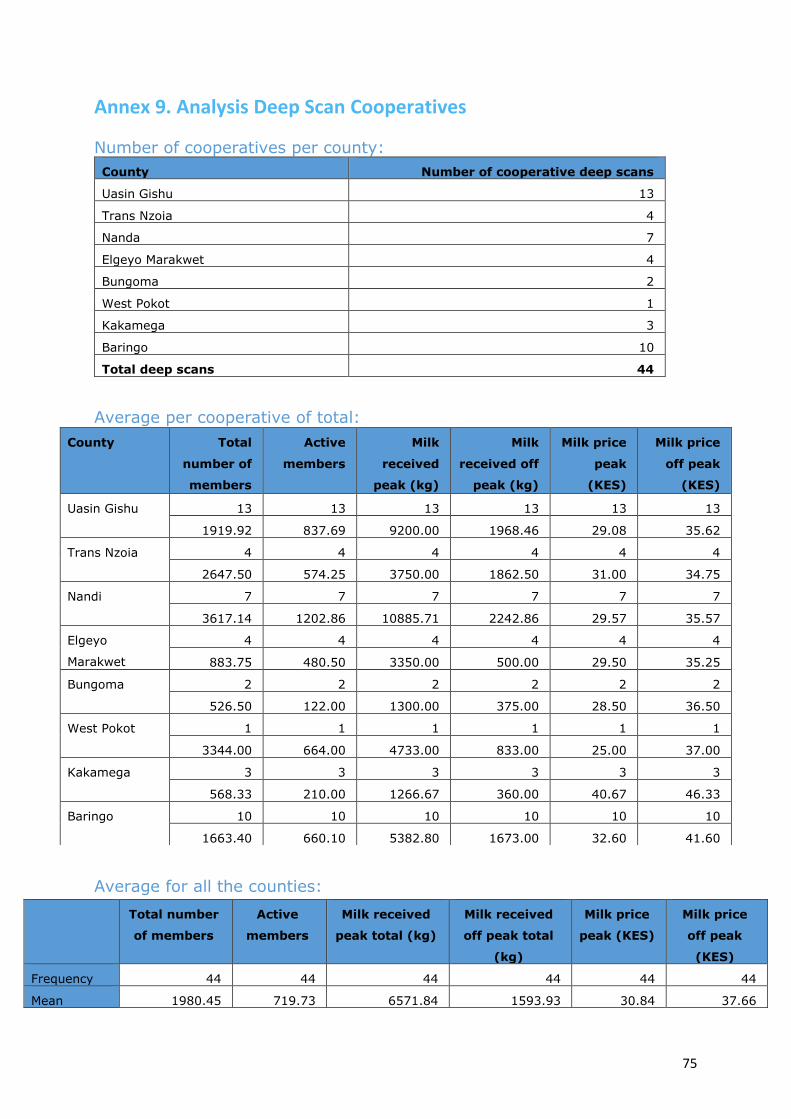
75
Annex 9. Analysis Deep Scan Cooperatives
Number of cooperatives per county:
County Number of cooperative deep scans
Uasin Gishu 13
Trans Nzoia 4
Nanda 7
Elgeyo Marakwet 4
Bungoma 2
West Pokot 1
Kakamega 3
Baringo 10
Total deep scans 44
Average per cooperative of total:
Average for all the counties:
County Total
number of
members
Active
members
Milk
received
peak (kg)
Milk
received off
peak (kg)
Milk price
peak
(KES)
Milk price
off peak
(KES)
Uasin Gishu 13 13 13 13 13 13
1919.92 837.69 9200.00 1968.46 29.08 35.62
Trans Nzoia 4 4 4 4 4 4
2647.50 574.25 3750.00 1862.50 31.00 34.75
Nandi 7 7 7 7 7 7
3617.14 1202.86 10885.71 2242.86 29.57 35.57
Elgeyo
Marakwet
4 4 4 4 4 4
883.75 480.50 3350.00 500.00 29.50 35.25
Bungoma 2 2 2 2 2 2
526.50 122.00 1300.00 375.00 28.50 36.50
West Pokot 1 1 1 1 1 1
3344.00 664.00 4733.00 833.00 25.00 37.00
Kakamega 3 3 3 3 3 3
568.33 210.00 1266.67 360.00 40.67 46.33
Baringo 10 10 10 10 10 10
1663.40 660.10 5382.80 1673.00 32.60 41.60
Total number
of members
Active
members
Milk received
peak total (kg)
Milk received
off peak total
(kg)
Milk price
peak (KES)
Milk price
off peak
(KES)
Frequency 44 44 44 44 44 44
Mean 1980.45 719.73 6571.84 1593.93 30.84 37.66
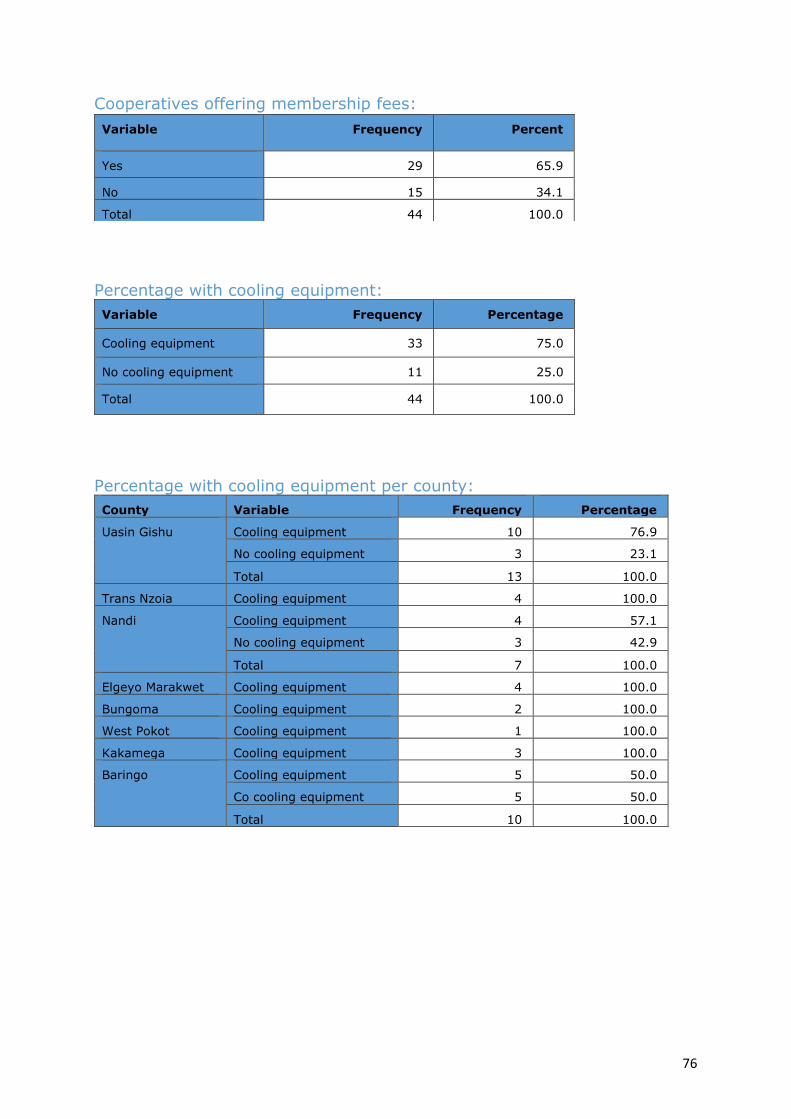
76
Cooperatives offering membership fees:
Percentage with cooling equipment:
Variable Frequency Percentage
Cooling equipment 33 75.0
No cooling equipment 11 25.0
Total 44 100.0
Percentage with cooling equipment per county:
County Variable Frequency Percentage
Uasin Gishu Cooling equipment 10 76.9
No cooling equipment 3 23.1
Total 13 100.0
Trans Nzoia Cooling equipment 4 100.0
Nandi Cooling equipment 4 57.1
No cooling equipment 3 42.9
Total 7 100.0
Elgeyo Marakwet Cooling equipment 4 100.0
Bungoma Cooling equipment 2 100.0
West Pokot Cooling equipment 1 100.0
Kakamega Cooling equipment 3 100.0
Baringo Cooling equipment 5 50.0
Co cooling equipment 5 50.0
Total 10 100.0
Variable Frequency Percent
Yes 29 65.9
No 15 34.1
Total 44 100.0
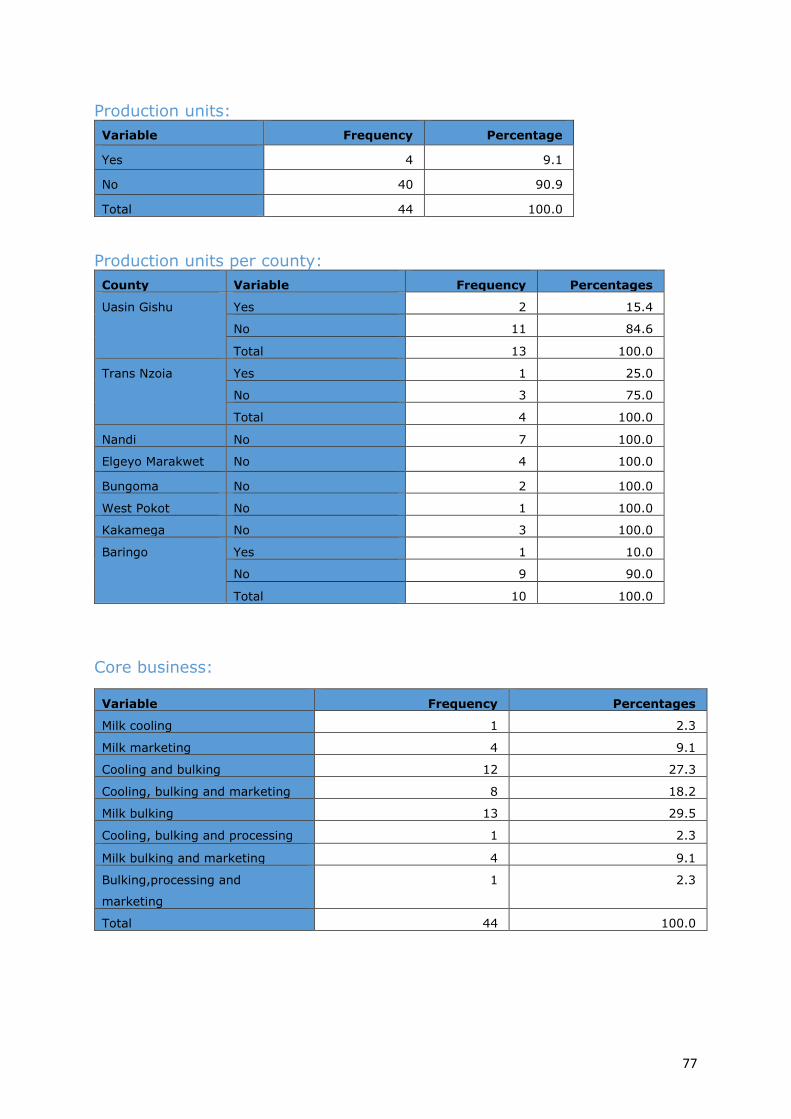
77
Production units:
Variable Frequency Percentage
Yes 4 9.1
No 40 90.9
Total 44 100.0
Production units per county:
County Variable Frequency Percentages
Uasin Gishu Yes 2 15.4
No 11 84.6
Total 13 100.0
Trans Nzoia Yes 1 25.0
No 3 75.0
Total 4 100.0
Nandi No 7 100.0
Elgeyo Marakwet No 4 100.0
Bungoma No 2 100.0
West Pokot No 1 100.0
Kakamega No 3 100.0
Baringo Yes 1 10.0
No 9 90.0
Total 10 100.0
Core business:
Variable Frequency Percentages
Milk cooling 1 2.3
Milk marketing 4 9.1
Cooling and bulking 12 27.3
Cooling, bulking and marketing 8 18.2
Milk bulking 13 29.5
Cooling, bulking and processing 1 2.3
Milk bulking and marketing 4 9.1
Bulking,processing and
marketing
1 2.3
Total 44 100.0
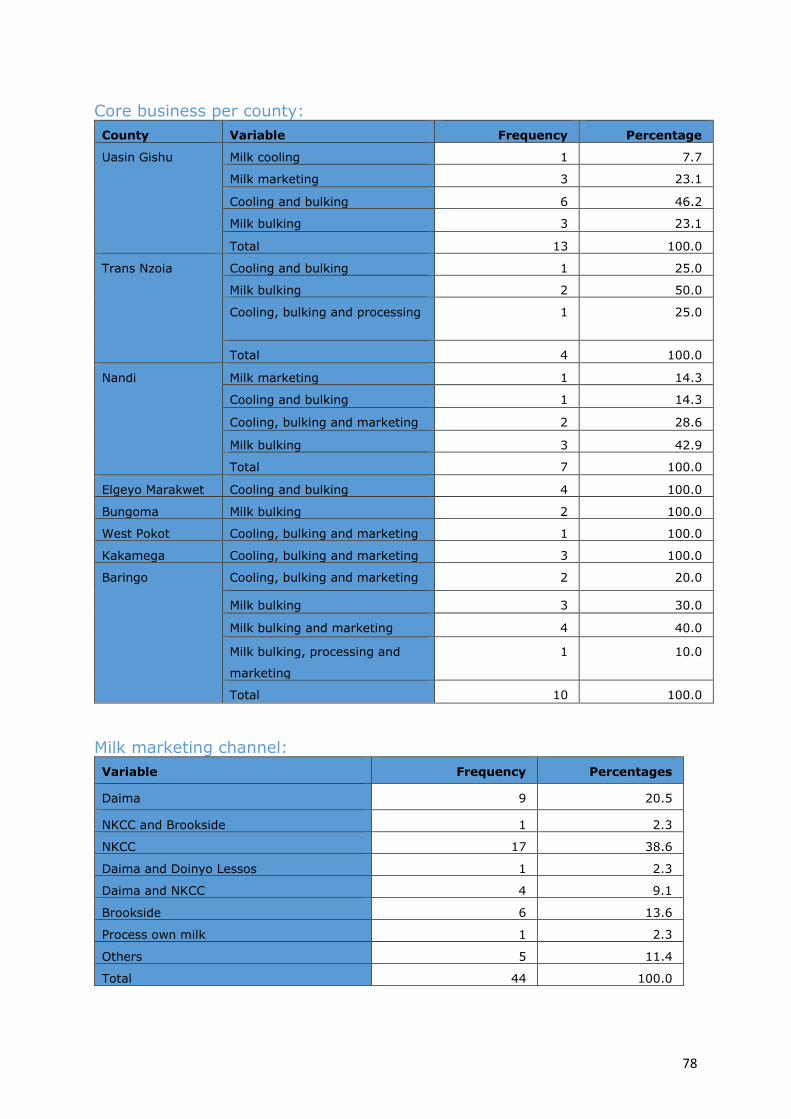
78
Core business per county:
County Variable Frequency Percentage
Uasin Gishu Milk cooling 1 7.7
Milk marketing 3 23.1
Cooling and bulking 6 46.2
Milk bulking 3 23.1
Total 13 100.0
Trans Nzoia Cooling and bulking 1 25.0
Milk bulking 2 50.0
Cooling, bulking and processing 1 25.0
Total 4 100.0
Nandi Milk marketing 1 14.3
Cooling and bulking 1 14.3
Cooling, bulking and marketing 2 28.6
Milk bulking 3 42.9
Total 7 100.0
Elgeyo Marakwet Cooling and bulking 4 100.0
Bungoma Milk bulking 2 100.0
West Pokot Cooling, bulking and marketing 1 100.0
Kakamega Cooling, bulking and marketing 3 100.0
Baringo Cooling, bulking and marketing 2 20.0
Milk bulking 3 30.0
Milk bulking and marketing 4 40.0
Milk bulking, processing and
marketing
1 10.0
Total 10 100.0
Milk marketing channel:
Variable Frequency Percentages
Daima 9 20.5
NKCC and Brookside 1 2.3
NKCC 17 38.6
Daima and Doinyo Lessos 1 2.3
Daima and NKCC 4 9.1
Brookside 6 13.6
Process own milk 1 2.3
Others 5 11.4
Total 44 100.0
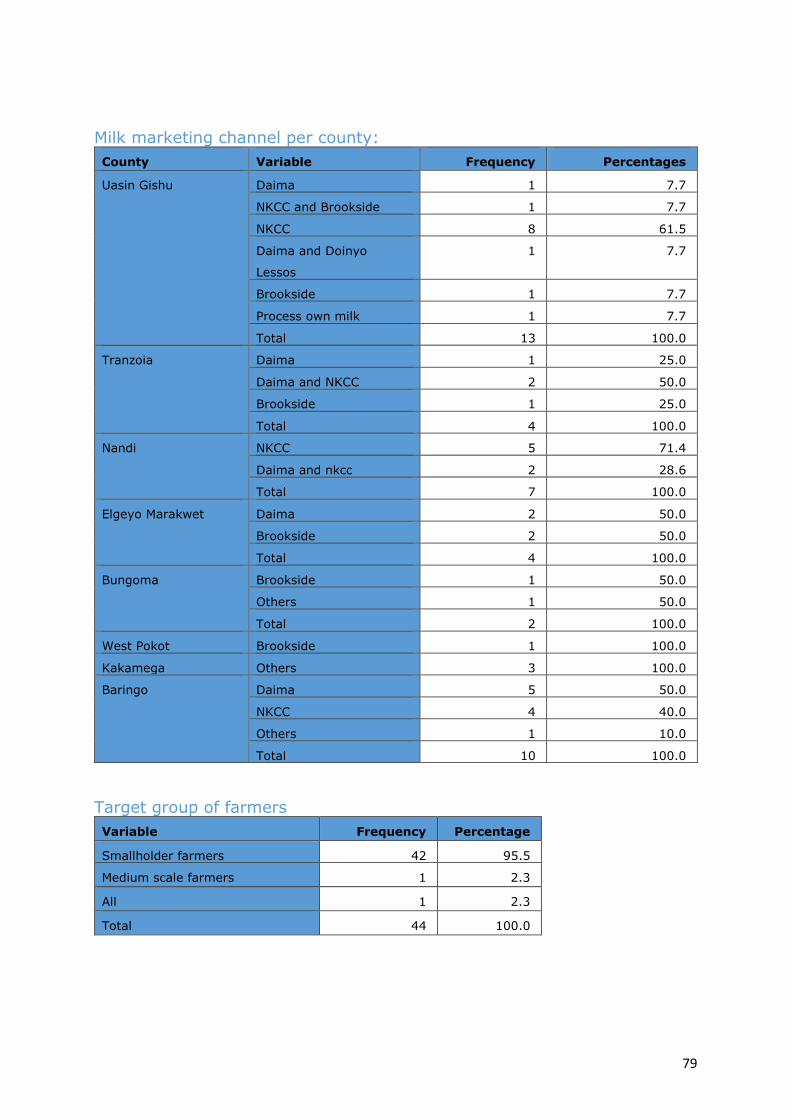
79
Milk marketing channel per county:
County Variable Frequency Percentages
Uasin Gishu Daima 1 7.7
NKCC and Brookside 1 7.7
NKCC 8 61.5
Daima and Doinyo
Lessos
1 7.7
Brookside 1 7.7
Process own milk 1 7.7
Total 13 100.0
Tranzoia Daima 1 25.0
Daima and NKCC 2 50.0
Brookside 1 25.0
Total 4 100.0
Nandi NKCC 5 71.4
Daima and nkcc 2 28.6
Total 7 100.0
Elgeyo Marakwet Daima 2 50.0
Brookside 2 50.0
Total 4 100.0
Bungoma Brookside 1 50.0
Others 1 50.0
Total 2 100.0
West Pokot Brookside 1 100.0
Kakamega Others 3 100.0
Baringo Daima 5 50.0
NKCC 4 40.0
Others 1 10.0
Total 10 100.0
Target group of farmers
Variable Frequency Percentage
Smallholder farmers 42 95.5
Medium scale farmers 1 2.3
All 1 2.3
Total 44 100.0
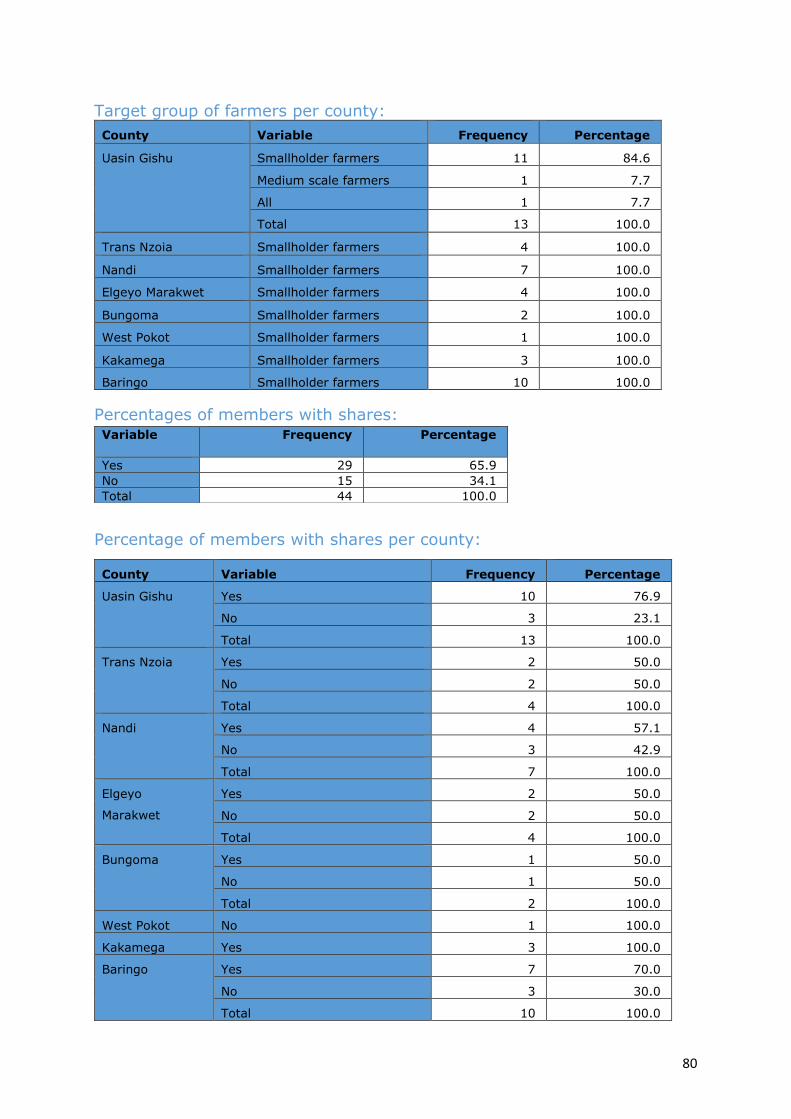
80
Target group of farmers per county:
County Variable Frequency Percentage
Uasin Gishu Smallholder farmers 11 84.6
Medium scale farmers 1 7.7
All 1 7.7
Total 13 100.0
Trans Nzoia Smallholder farmers 4 100.0
Nandi Smallholder farmers 7 100.0
Elgeyo Marakwet Smallholder farmers 4 100.0
Bungoma Smallholder farmers 2 100.0
West Pokot Smallholder farmers 1 100.0
Kakamega Smallholder farmers 3 100.0
Baringo Smallholder farmers 10 100.0
Percentages of members with shares:
Percentage of members with shares per county:
County Variable Frequency Percentage
Uasin Gishu Yes 10 76.9
No 3 23.1
Total 13 100.0
Trans Nzoia Yes 2 50.0
No 2 50.0
Total 4 100.0
Nandi Yes 4 57.1
No 3 42.9
Total 7 100.0
Elgeyo
Marakwet
Yes 2 50.0
No 2 50.0
Total 4 100.0
Bungoma Yes 1 50.0
No 1 50.0
Total 2 100.0
West Pokot No 1 100.0
Kakamega Yes 3 100.0
Baringo Yes 7 70.0
No 3 30.0
Total 10 100.0
Variable Frequency Percentage
Yes 29 65.9
No 15 34.1
Total 44 100.0
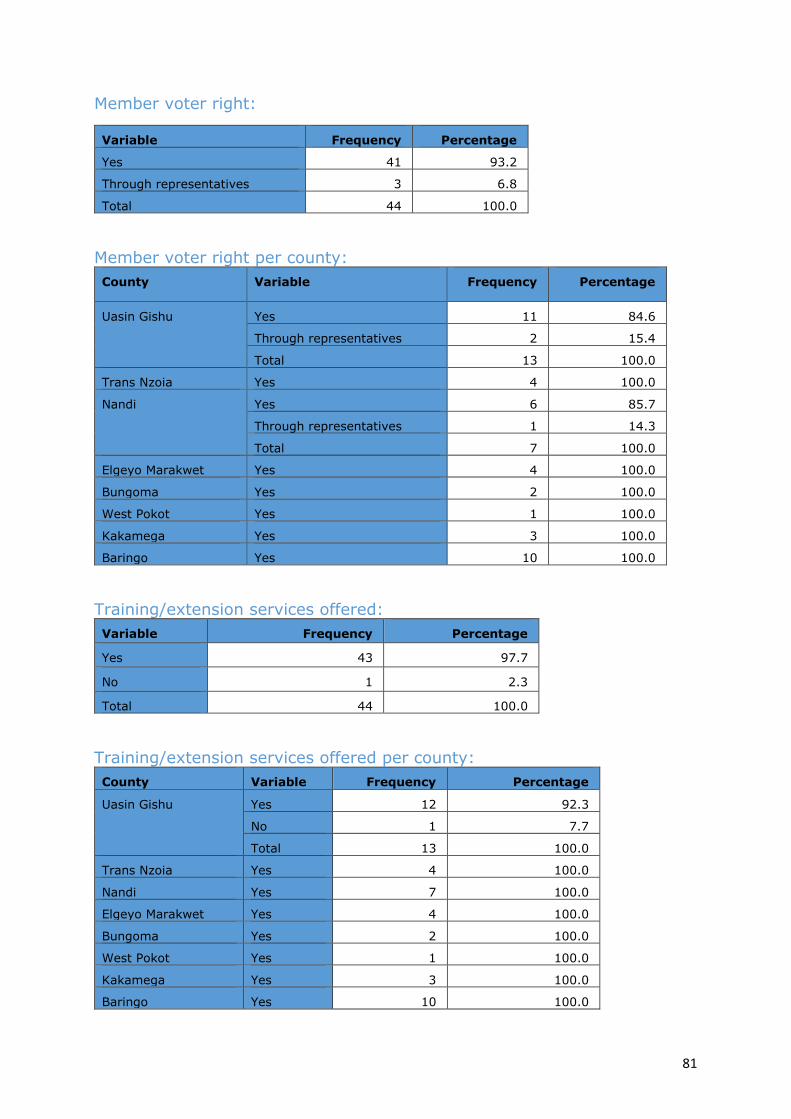
81
Member voter right:
Variable Frequency Percentage
Yes 41 93.2
Through representatives 3 6.8
Total 44 100.0
Member voter right per county:
County Variable Frequency Percentage
Uasin Gishu Yes 11 84.6
Through representatives 2 15.4
Total 13 100.0
Trans Nzoia Yes 4 100.0
Nandi Yes 6 85.7
Through representatives 1 14.3
Total 7 100.0
Elgeyo Marakwet Yes 4 100.0
Bungoma Yes 2 100.0
West Pokot Yes 1 100.0
Kakamega Yes 3 100.0
Baringo Yes 10 100.0
Training/extension services offered:
Variable Frequency Percentage
Yes 43 97.7
No 1 2.3
Total 44 100.0
Training/extension services offered per county:
County Variable Frequency Percentage
Uasin Gishu Yes 12 92.3
No 1 7.7
Total 13 100.0
Trans Nzoia Yes 4 100.0
Nandi Yes 7 100.0
Elgeyo Marakwet Yes 4 100.0
Bungoma Yes 2 100.0
West Pokot Yes 1 100.0
Kakamega Yes 3 100.0
Baringo Yes 10 100.0
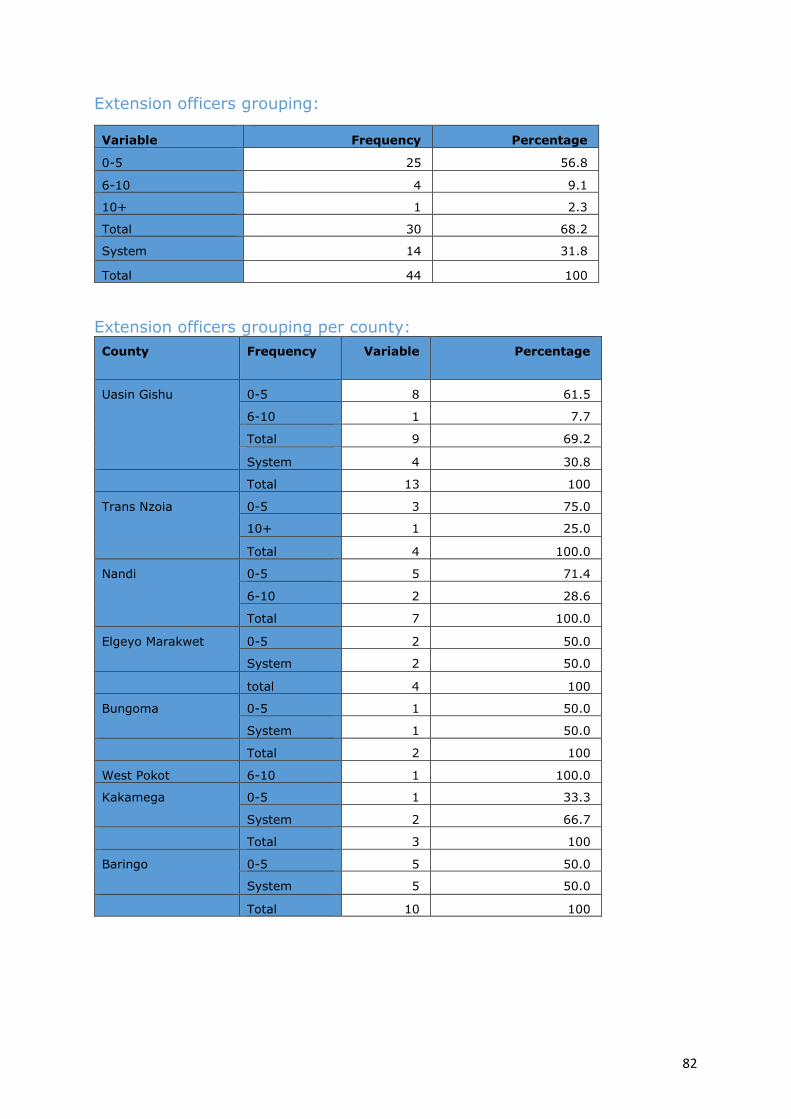
82
Extension officers grouping:
Variable Frequency Percentage
0-5 25 56.8
6-10 4 9.1
10+ 1 2.3
Total 30 68.2
System 14 31.8
Total 44 100
Extension officers grouping per county:
County Frequency Variable Percentage
Uasin Gishu 0-5 8 61.5
6-10 1 7.7
Total 9 69.2
System 4 30.8
Total 13 100
Trans Nzoia 0-5 3 75.0
10+ 1 25.0
Total 4 100.0
Nandi 0-5 5 71.4
6-10 2 28.6
Total 7 100.0
Elgeyo Marakwet 0-5 2 50.0
System 2 50.0
total 4 100
Bungoma 0-5 1 50.0
System 1 50.0
Total 2 100
West Pokot 6-10 1 100.0
Kakamega 0-5 1 33.3
System 2 66.7
Total 3 100
Baringo 0-5 5 50.0
System 5 50.0
Total 10 100
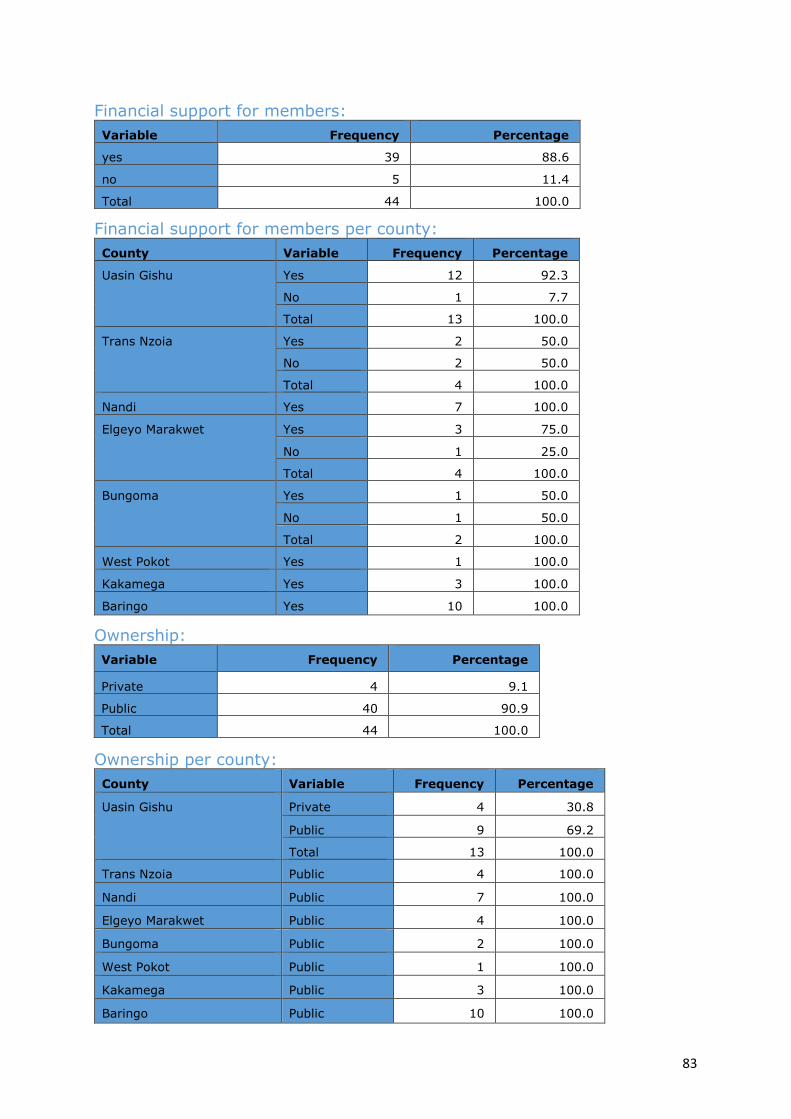
83
Financial support for members:
Variable Frequency Percentage
yes 39 88.6
no 5 11.4
Total 44 100.0
Financial support for members per county:
County Variable Frequency Percentage
Uasin Gishu Yes 12 92.3
No 1 7.7
Total 13 100.0
Trans Nzoia Yes 2 50.0
No 2 50.0
Total 4 100.0
Nandi Yes 7 100.0
Elgeyo Marakwet Yes 3 75.0
No 1 25.0
Total 4 100.0
Bungoma Yes 1 50.0
No 1 50.0
Total 2 100.0
West Pokot Yes 1 100.0
Kakamega Yes 3 100.0
Baringo Yes 10 100.0
Ownership:
Variable Frequency Percentage
Private 4 9.1
Public 40 90.9
Total 44 100.0
Ownership per county:
County Variable Frequency Percentage
Uasin Gishu Private 4 30.8
Public 9 69.2
Total 13 100.0
Trans Nzoia Public 4 100.0
Nandi Public 7 100.0
Elgeyo Marakwet Public 4 100.0
Bungoma Public 2 100.0
West Pokot Public 1 100.0
Kakamega Public 3 100.0
Baringo Public 10 100.0
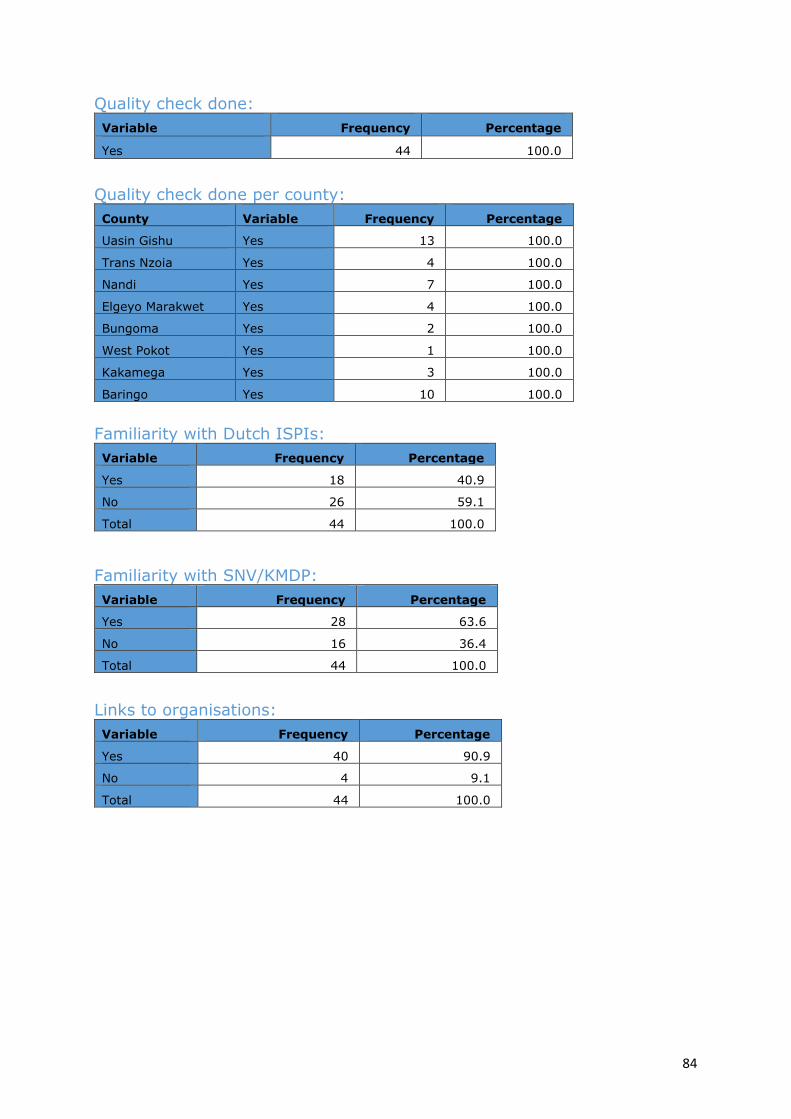
84
Quality check done:
Variable Frequency Percentage
Yes 44 100.0
Quality check done per county:
County Variable Frequency Percentage
Uasin Gishu Yes 13 100.0
Trans Nzoia Yes 4 100.0
Nandi Yes 7 100.0
Elgeyo Marakwet Yes 4 100.0
Bungoma Yes 2 100.0
West Pokot Yes 1 100.0
Kakamega Yes 3 100.0
Baringo Yes 10 100.0
Familiarity with Dutch ISPIs:
Variable Frequency Percentage
Yes 18 40.9
No 26 59.1
Total 44 100.0
Familiarity with SNV/KMDP:
Variable Frequency Percentage
Yes 28 63.6
No 16 36.4
Total 44 100.0
Links to organisations:
Variable Frequency Percentage
Yes 40 90.9
No 4 9.1
Total 44 100.0
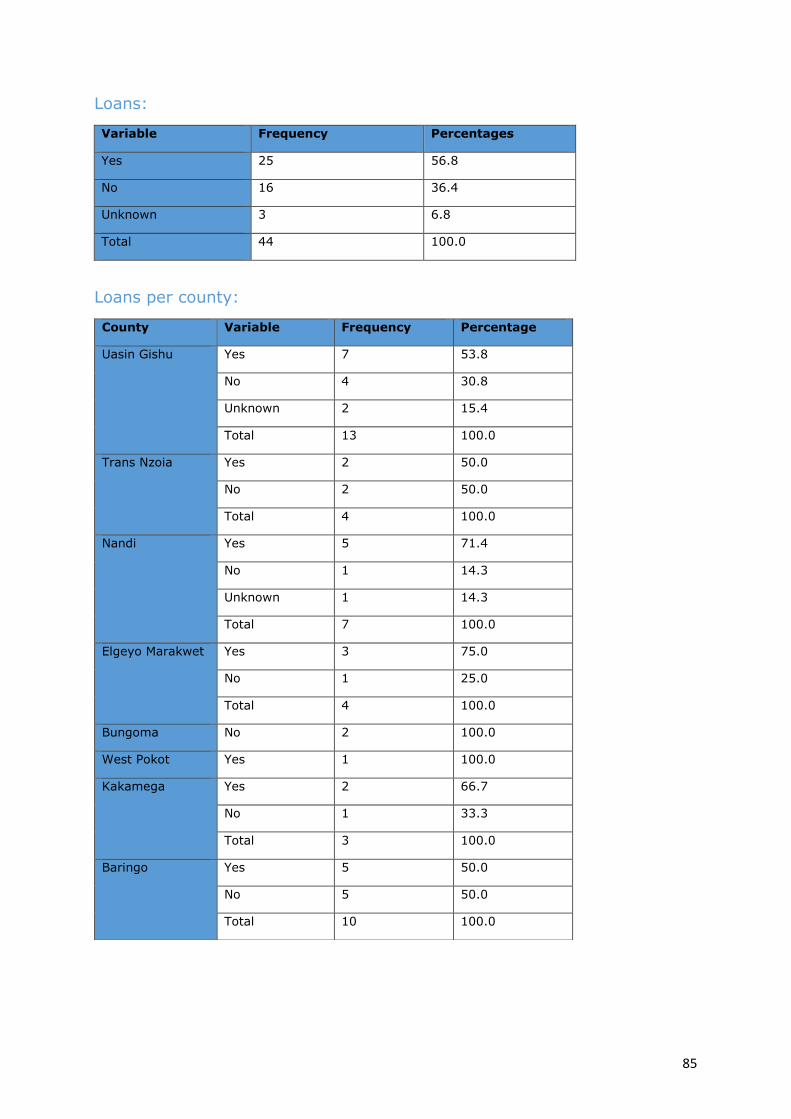
85
Loans:
Variable Frequency Percentages
Yes 25 56.8
No 16 36.4
Unknown 3 6.8
Total 44 100.0
Loans per county:
County Variable Frequency Percentage
Uasin Gishu Yes 7 53.8
No 4 30.8
Unknown 2 15.4
Total 13 100.0
Trans Nzoia Yes 2 50.0
No 2 50.0
Total 4 100.0
Nandi Yes 5 71.4
No 1 14.3
Unknown 1 14.3
Total 7 100.0
Elgeyo Marakwet Yes 3 75.0
No 1 25.0
Total 4 100.0
Bungoma No 2 100.0
West Pokot Yes 1 100.0
Kakamega Yes 2 66.7
No 1 33.3
Total 3 100.0
Baringo Yes 5 50.0
No 5 50.0
Total 10 100.0
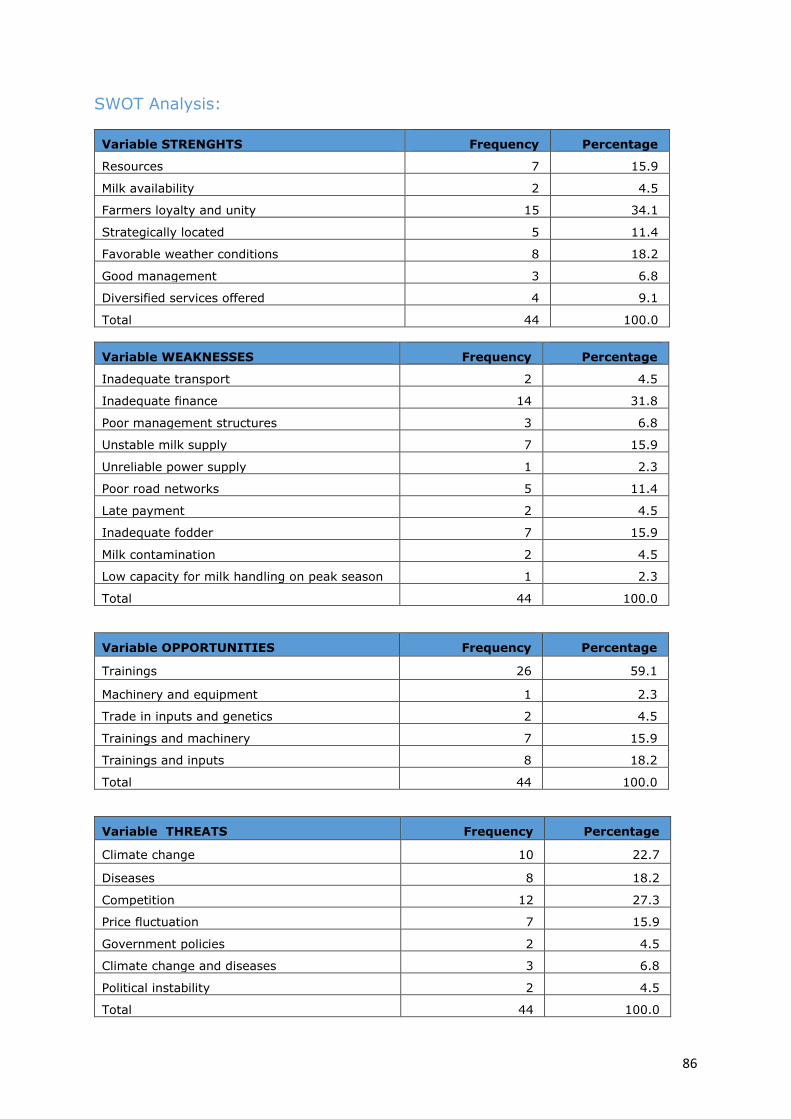
86
SWOT Analysis:
Variable STRENGHTS Frequency Percentage
Resources 7 15.9
Milk availability 2 4.5
Farmers loyalty and unity 15 34.1
Strategically located 5 11.4
Favorable weather conditions 8 18.2
Good management 3 6.8
Diversified services offered 4 9.1
Total 44 100.0
Variable WEAKNESSES Frequency Percentage
Inadequate transport 2 4.5
Inadequate finance 14 31.8
Poor management structures 3 6.8
Unstable milk supply 7 15.9
Unreliable power supply 1 2.3
Poor road networks 5 11.4
Late payment 2 4.5
Inadequate fodder 7 15.9
Milk contamination 2 4.5
Low capacity for milk handling on peak season 1 2.3
Total 44 100.0
Variable OPPORTUNITIES Frequency Percentage
Trainings 26 59.1
Machinery and equipment 1 2.3
Trade in inputs and genetics 2 4.5
Trainings and machinery 7 15.9
Trainings and inputs 8 18.2
Total 44 100.0
Variable THREATS Frequency Percentage
Climate change 10 22.7
Diseases 8 18.2
Competition 12 27.3
Price fluctuation 7 15.9
Government policies 2 4.5
Climate change and diseases 3 6.8
Political instability 2 4.5
Total 44 100.0
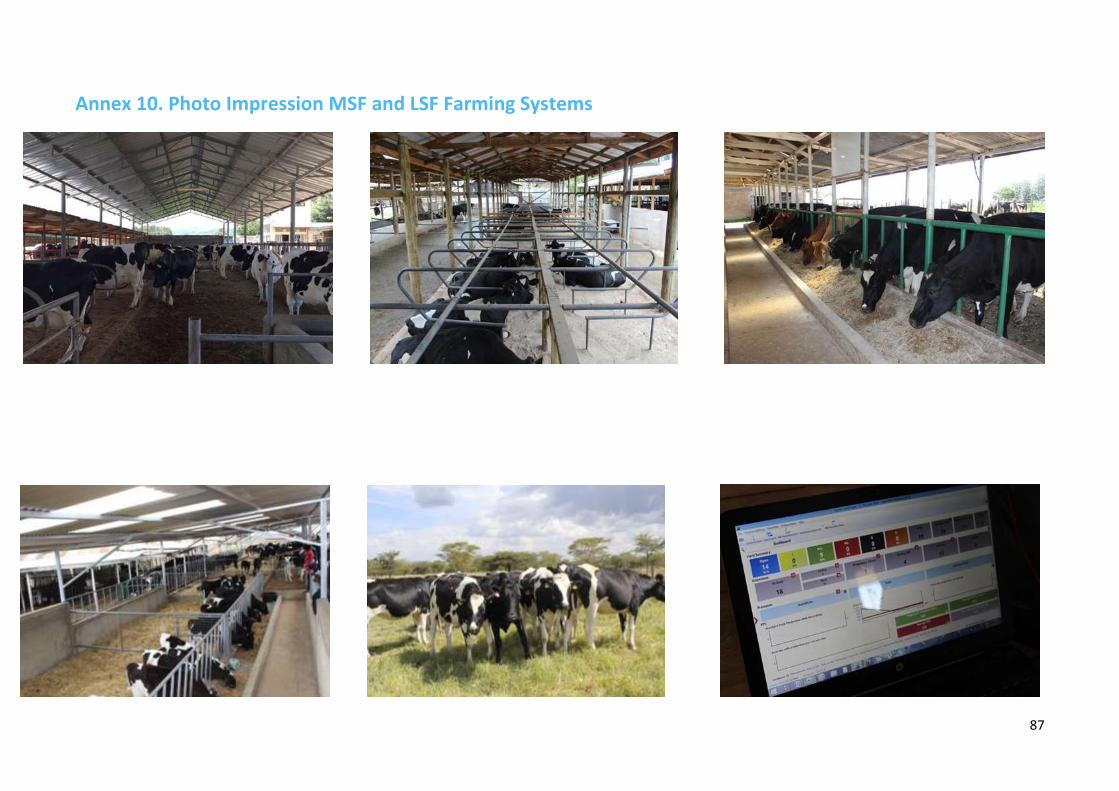
87
Annex 10. Photo Impression MSF and LSF Farming Systems
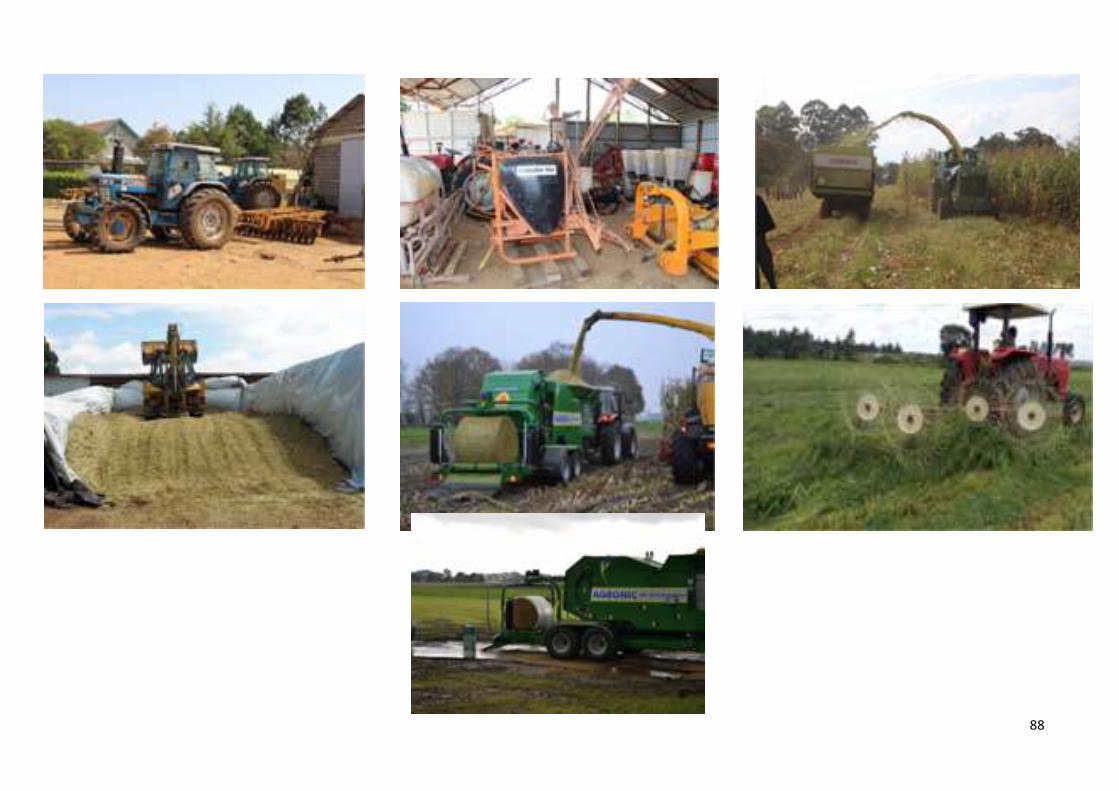
88
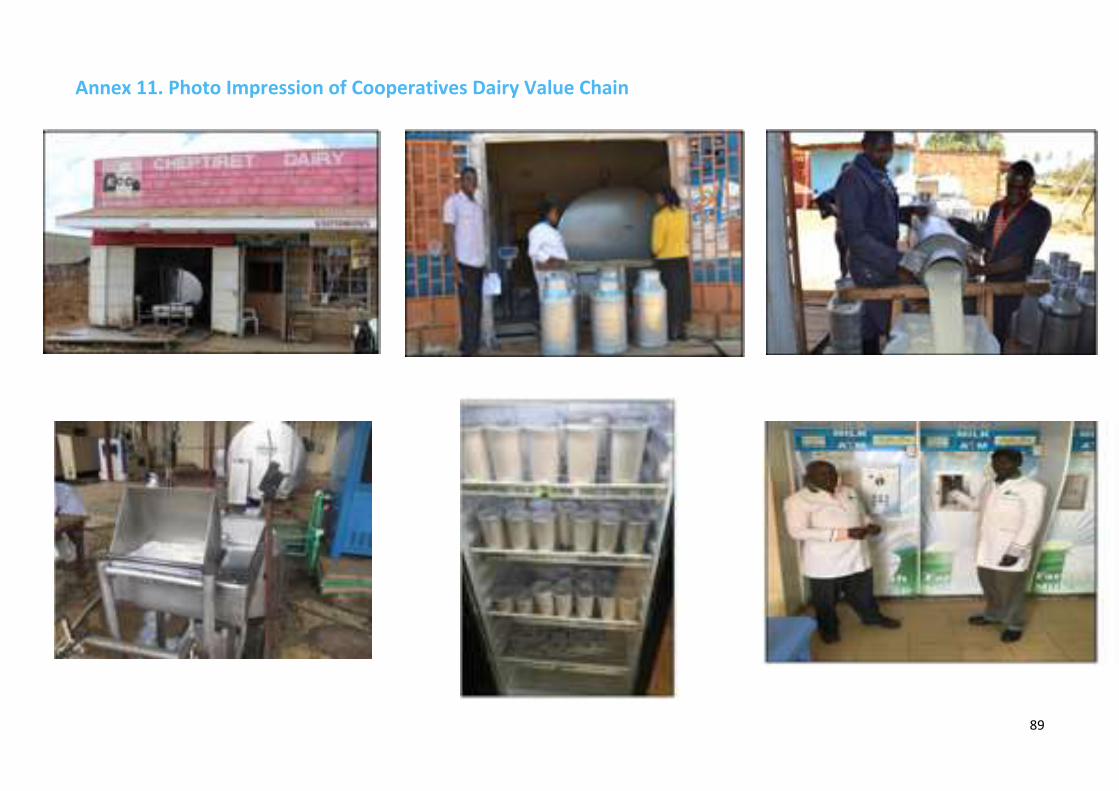
89
Annex 11. Photo Impression of Cooperatives Dairy Value Chain
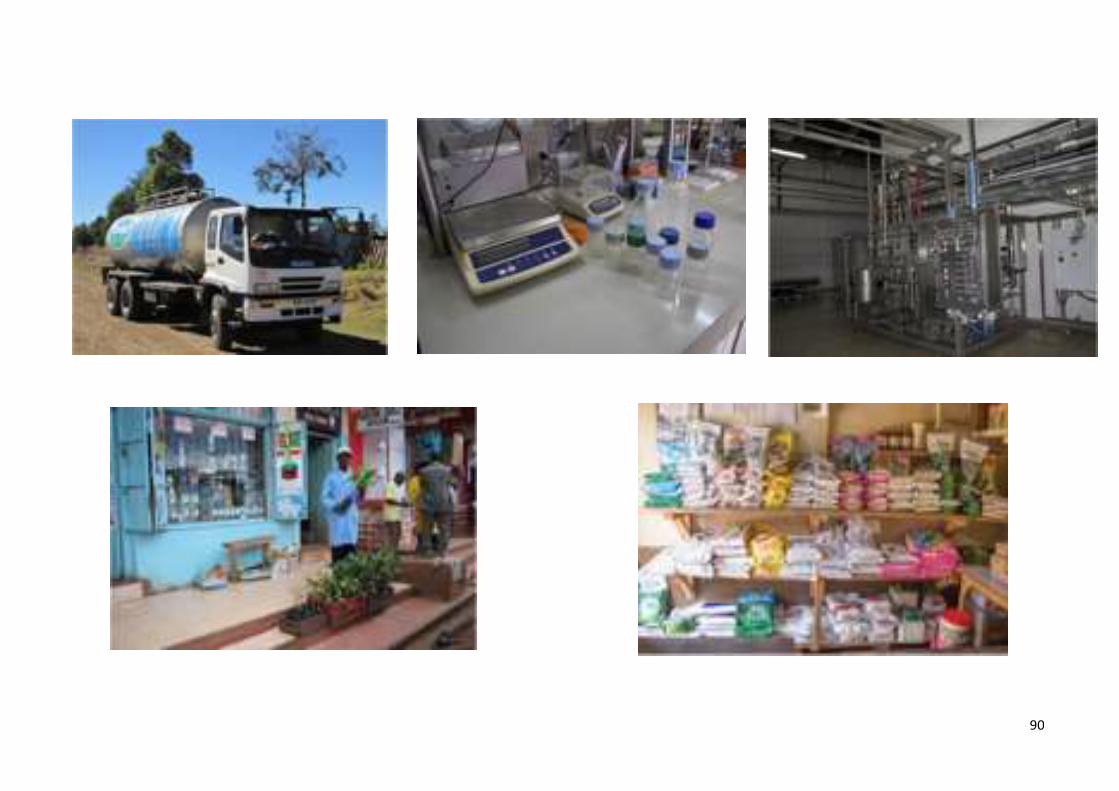
90
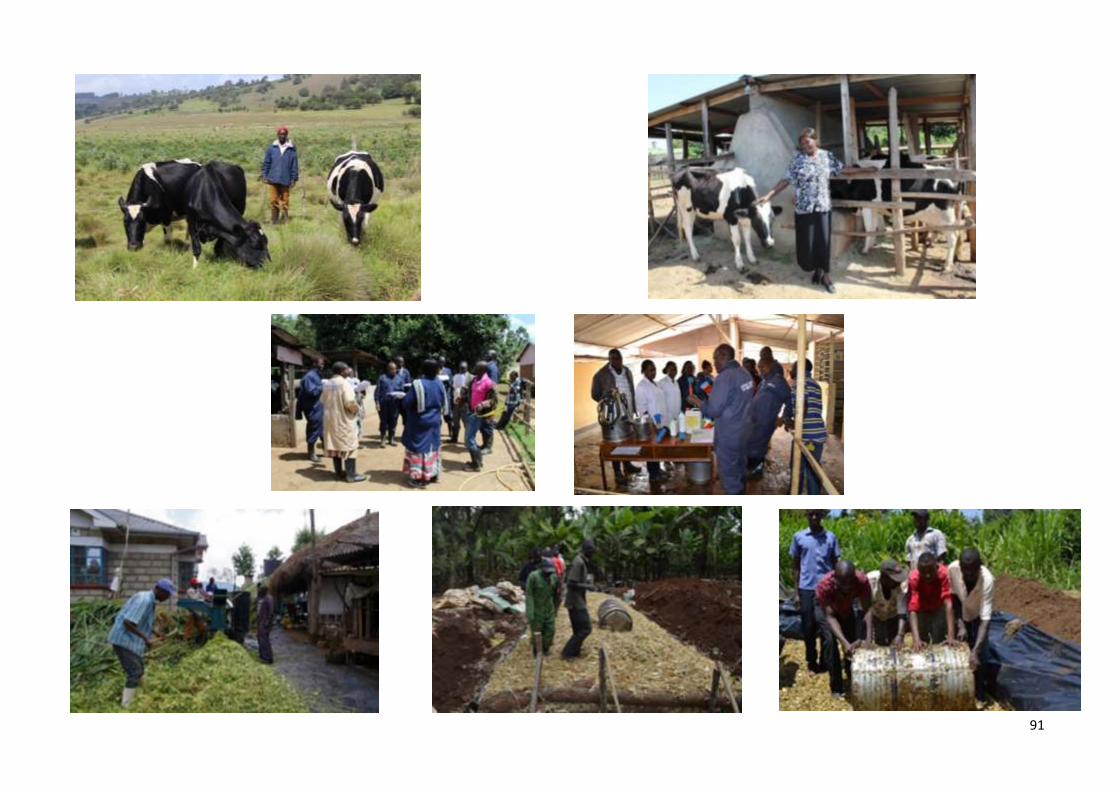
91
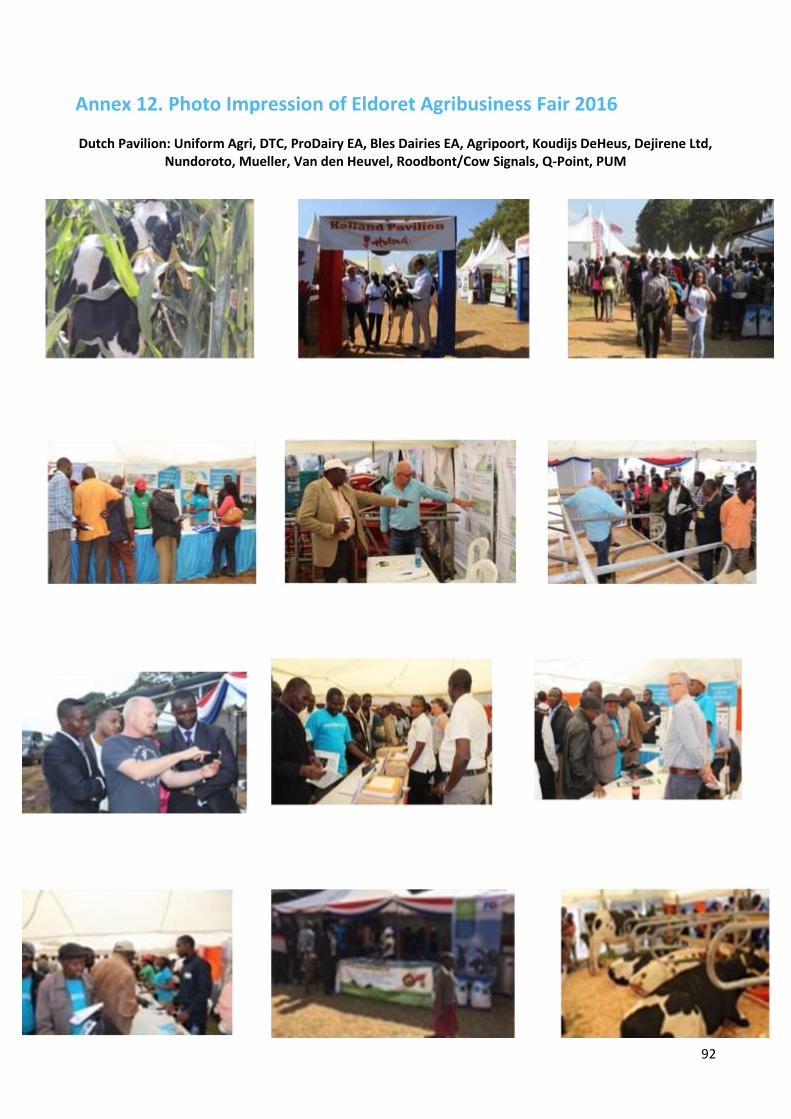
92
Annex 12. Photo Impression of Eldoret Agribusiness Fair 2016
Dutch Pavilion: Uniform Agri, DTC, ProDairy EA, Bles Dairies EA, Agripoort, Koudijs DeHeus, Dejirene Ltd, Nundoroto, Mueller, Van den Heuvel, Roodbont/Cow Signals, Q-Point, PUM
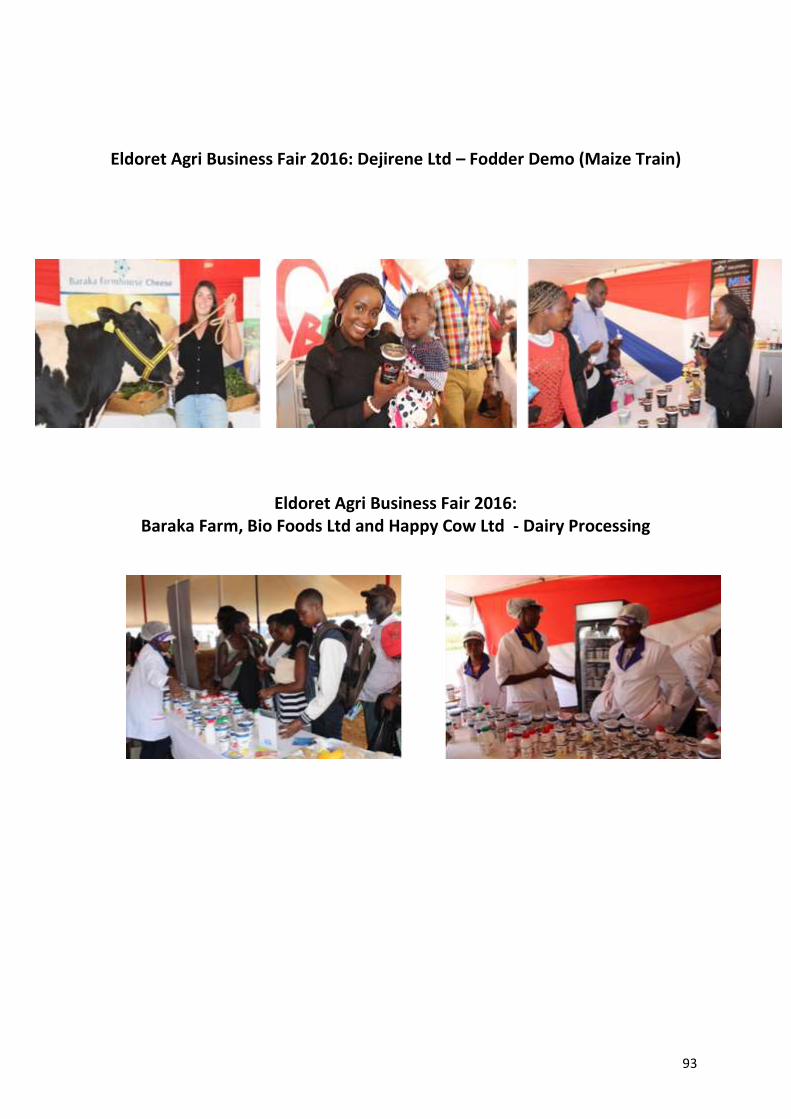
93
Eldoret Agri Business Fair 2016: Dejirene Ltd – Fodder Demo (Maize Train)
Eldoret Agri Business Fair 2016: Baraka Farm, Bio Foods Ltd and Happy Cow Ltd - Dairy Processing