d7.7 brand-specific influenza vaccine effectiveness in
TRANSCRIPT

777363 – DRIVE – WP7 – IVE report, Season 2019/20
1
D7.7 Brand-specific influenza vaccine effectiveness in Europe
Season 2019/20
REPORT
777363 - DRIVE
Development of robust and innovative vaccine
effectiveness
WP7 - IVE studies Lead contributor Anke Stuurman (P95)
Other contributors
Jorne Biccler (P95)
Margarita Riera (P95)
Tom De Smedt (P95)
Kaatje Bollaerts (P95)
Caterina Rizzo (OPBG)
Alexandre Descamps (INSERM)
Bruno Lina (UCBL)
Reviewers
Antonio Carmona (FISABIO)
Uy Hoang (Oxford University)
Jose Angel Rodrigo (VHUH)
Stefano Mosca (CIRI-IT)
Ainara Mira-Iglesias (FISABIO)
Miriam Levi (AUSL Toscana Centro)
Cintia Muñoz-Quiles (FISABIO)
Due date 30 JUL 2020

777363 – DRIVE – WP7 – IVE report, Season 2019/20
2
Delivery date 10 SEP 2020
Deliverable type R
Dissemination level PU

777363 – DRIVE – WP7 – IVE report, Season 2019/20
3
Document History Version Date Contribution Description
V0 26/06/2020 Based on the mock report. Text by AS,
AD, CR. Analyses by JB. Annexes: Impact
of COVID-19 by AC and Cintia Muñoz-
Quiles; Lockdown and healthcare seeking
behavior by AC; SARS-CoV2
epidemiology by AC and completed by
AD, CR, ML, AS, Hanna Nohynek,
Harshana Liyanage, and Alfredo
Vannacci. Data quality reports by JB.
Local study reports by sites. Vaccine
recommendations by Harshana Liyanage.
For sharing with WP7 and sites
V1 03/07/2020 Reviewed by AC, UH, JAR, SM, AMI, ML.
Updated by AS, JB, AD and TDS.
Incorporated review from WP7 and
sites. Data from Luxembourg
excluded.
V2 01/09/2020 Revised text by AS, BL. Revised analyses
by JB. Revised WebAnnex tool by TDS.
Review by MR, AD, CM and AC.
Incorporated review from EFPIA and
ISC. Subtype information for LPUH
added.
V2.1 10/09/2020 Revised text by MR and JB Incorporated feedback from EFPIA

777363 – DRIVE – WP7 – IVE report, Season 2019/20
4
TABLE OF CONTENTS
Executive Summary ............................................................................................................................................. 6
Milestones ............................................................................................................................................................ 9
List of figures, tables, abbreviations .................................................................................................................. 10
1 Background ................................................................................................................................................ 15
1.1 WebAnnex ............................................................................................................................................ 16
2 Objectives .................................................................................................................................................. 16
2.1 Primary objective .................................................................................................................................. 16
2.2 Secondary objective ............................................................................................................................. 16
3 Methods ..................................................................................................................................................... 17
3.1 Study sites ............................................................................................................................................ 17
3.2 Study design ......................................................................................................................................... 18
3.3 Statistical methods ................................................................................................................................ 19
3.4 Quality control ....................................................................................................................................... 20
3.5 Ethics .................................................................................................................................................... 21
3.6 Deviations from protocol or SAP .......................................................................................................... 21
4 Results ....................................................................................................................................................... 21
4.1 Influenza vaccines in Europe, 2019/20................................................................................................. 21
4.2 Influenza epidemiology in Europe, 2019/20 ......................................................................................... 23
4.3 Descriptive analysis .............................................................................................................................. 31
4.4 Primary objective: overall IVE and IVE by brand .................................................................................. 54
4.5 Secondary objective: influenza vaccine effectiveness by type ............................................................. 67
5 Discussion.................................................................................................................................................. 71
5.1 Estimation of IVE for any vaccine ......................................................................................................... 71
5.2 Estimation of brand-specific IVE ........................................................................................................... 72
5.3 Precision ............................................................................................................................................... 73
5.4 COVID-19 ............................................................................................................................................. 73
5.5 Parsimonious confounder adjustment .................................................................................................. 73
5.6 Strenghts and limitations ...................................................................................................................... 74
6 Conclusions ............................................................................................................................................... 74

777363 – DRIVE – WP7 – IVE report, Season 2019/20
5
6.1 Recommendations ................................................................................................................................ 75
7 Funding ...................................................................................................................................................... 75
8 Study team ................................................................................................................................................. 75
9 ANNEXES .................................................................................................................................................. 76
10 References ........................................................................................................................................... 78

777363 – DRIVE – WP7 – IVE report, Season 2019/20
6
Executive Summary
Background The Development of Robust and Innovative Vaccine Effectiveness (DRIVE) project is a public-private
partnership aiming to build capacity in Europe for estimating brand-specific influenza vaccine effectiveness
(IVE). The DRIVE Project, which is funded by the Innovative Medicines Initiative (IMI), was initiated as a
response to the new guidance on influenza vaccines by the European Medicines Agency (EMA) that came
into effect in the beginning of 2017.
The DRIVE platform is constantly expanding, and the 2019/20 season constitutes the network’s third influenza
season. Newly added sites included one hospital network in France and two hospitals in Spain.
Objectives The main objectives were to estimate confounder-adjusted seasonal (1) overall and brand-specific and (2) type-specific IVE against laboratory-confirmed influenza stratified by setting (primary care, hospital-based or
mixed setting in case the source of the cases cannot be obtained) and age group (6m - 17yr, 18 - 64yr, ≥ 65yr),
by type of outcome: any laboratory-confirmed influenza; laboratory-confirmed influenza A, overall and by
subtype (A(H1N1)pdm09, A(H3N2)); laboratory-confirmed influenza B, overall and by lineage (B/Victoria,
B/Yamagata).
Methods TND studies were conducted in primary care (four networks) and hospital settings (five individual hospitals and
three hospital networks) in seven European countries. Swabs were collected from subjects presenting with
influenza-like illness (ILI) in primary care setting or severe acute respiratory infection (SARI) in hospital setting.
The study population consisted of non-institutionalized subjects ≥6 months of age, with no contraindication for
influenza vaccination, no prior positive influenza test in the same season, and with a swab taken < 8 days after
ILI/SARI onset. In hospital settings, subjects hospitalized <48h prior to symptom onset or with symptom onset
≥48h after hospital admission were excluded (to exclude nosocomial infection).
One register-based cohort study was conducted at THL Finland, by linking five national registers through
personal identifiers. The study population consisted of all registered Finnish residents aged 6m-6y and 65-
100y. Cases with laboratory-confirmed influenza were identified from the National Infectious Diseases
Register.
Data collected at the study sites was transferred to the DRIVE Research Server where it was analysed
centrally by P95. Site-specific IVE was calculated using logistic regression (TND studies) or Poisson
regression (cohort study). Estimates were stratified by age and adjusted for age, sex, and calendar time. Site-
specific IVE estimates from the TND studies were pooled through random-effects meta-analysis. In the
register-based cohort it was not possible to differentiate between primary care and hospital cases, therefore
estimates were not pooled with the TND studies.
777363 – DRIVE – WP7 – IVE report, Season 2019/20
7
Results Influenza epidemiology in DRIVE-represented European countries (2019/20): Influenza A(H1N1)pm09,
A(H3N2) and B/Victoria co-circulated in Europe. The number of influenza A cases exceeded the number of
influenza B cases at all TND sites (range 52.8% to 95.8%), except at the Italy CIRI GP site (42.9%). The
highest proportion of influenza A compared to influenza B cases was found at Finland HUS (95.8%). Among
influenza A cases with a known subtype, the most frequently identified subtype was A(H1N1)pdm09 at the
sites in Finland, France and Spain (range 71.7% to 91.3%), and A(H3N2) at the sites in Austria, Italy and
Romania (range 56.9% to 62.6%). Differences between the circulating influenza strains and the vaccine
strains may have impacted IVE.
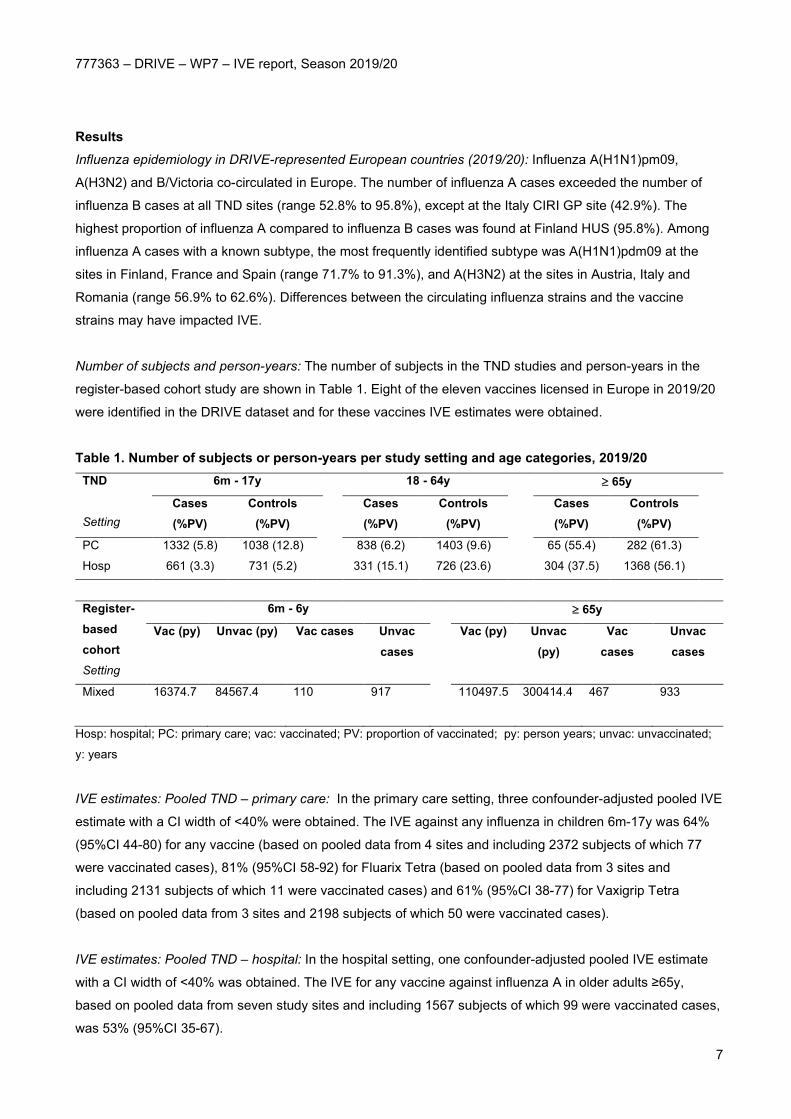
Number of subjects and person-years: The number of subjects in the TND studies and person-years in the
register-based cohort study are shown in Table 1. Eight of the eleven vaccines licensed in Europe in 2019/20
were identified in the DRIVE dataset and for these vaccines IVE estimates were obtained.
Table 1. Number of subjects or person-years per study setting and age categories, 2019/20 TND Setting
6m - 17y
18 - 64y
≥ 65y
Cases (%PV)
Controls (%PV)
Cases (%PV)
Controls (%PV)
Cases (%PV)
Controls (%PV)
PC 1332 (5.8) 1038 (12.8)
838 (6.2) 1403 (9.6)
65 (55.4) 282 (61.3)
Hosp 661 (3.3) 731 (5.2)
331 (15.1) 726 (23.6)
304 (37.5) 1368 (56.1)
Register-based cohort Setting
6m - 6y
≥ 65y
Vac (py) Unvac (py) Vac cases Unvac cases
Vac (py) Unvac (py)
Vac cases
Unvac cases
Mixed 16374.7
84567.4 110
917
110497.5
300414.4
467
933
Hosp: hospital; PC: primary care; vac: vaccinated; PV: proportion of vaccinated; py: person years; unvac: unvaccinated;
y: years
IVE estimates: Pooled TND – primary care: In the primary care setting, three confounder-adjusted pooled IVE
estimate with a CI width of <40% were obtained. The IVE against any influenza in children 6m-17y was 64%
(95%CI 44-80) for any vaccine (based on pooled data from 4 sites and including 2372 subjects of which 77
were vaccinated cases), 81% (95%CI 58-92) for Fluarix Tetra (based on pooled data from 3 sites and
including 2131 subjects of which 11 were vaccinated cases) and 61% (95%CI 38-77) for Vaxigrip Tetra
(based on pooled data from 3 sites and 2198 subjects of which 50 were vaccinated cases).
IVE estimates: Pooled TND – hospital: In the hospital setting, one confounder-adjusted pooled IVE estimate
with a CI width of <40% was obtained. The IVE for any vaccine against influenza A in older adults ≥65y,
based on pooled data from seven study sites and including 1567 subjects of which 99 were vaccinated cases,
was 53% (95%CI 35-67).

777363 – DRIVE – WP7 – IVE report, Season 2019/20
8
IVE estimates: Register-based cohort: All IVE estimates against any influenza and influenza A from the
Finland THL register-based cohort have a CI width of less than 40%. The IVE estimate of Fluenz Tetra is
64.3% (95%CI 53.5- 72.7) against influenza A and 80.4% (95%CI 55.4-91.4) against influenza B in children
aged 2-6y. The IVE estimates of Vaxigrip Tetra are 70.6% (95%CI 56.1-80.4) against any influenza and
70.6% (95%CI 54.3; 81.0) against influenza A in children aged 6m-6y, and 28.5% (95%CI 19.8-36.2) against
any influenza and 27.0% (95%CI 18.0-35.0) against influenza A in older adults aged ≥65y. Discussion and conclusion In the 2019/20 season, the DRIVE network has expanded from five to eight TND hospital sites, including one
new country, in addition to the existing TND primary care sites and the register-based cohort. Eight of eleven
brands licensed and marketed in Europe were captured in the DRIVE data. Precise brand-specific estimates
were obtained from the register-based cohort for the two vaccine brands used in Finland. Four precise
estimates were obtained for the primary objectives from the TND studies, up from three in the previous
season, and included two brand-specific estimates. This was achieved despite the start of the COVID-19
pandemic during the influenza season and the subsequent lockdown measures which interfered with and
capped the 2019-20 influenza circulation and impacted data collection. All precise estimates showed a
protective effect with point estimates varying between 26% and 81%.
Improvements were made to the method and the reporting. The list of confounders considered was simplified
based on post hoc analysis from the 2018/19 data (only including age, sex and date of symptom onset),
consequently all TND study sites were able to collect data on all confounders. Results of all site-specific,
pooled, and register-based analyses are available in a WebAnnex, which is in line with DRIVE long-term
sustainability, as it is less resource intensive to report on the results and makes the project outcomes and
data FAIR (Findable, Accessible, Interoperable, Reusable).
Recommendations
For the 2020/2021 season, efforts should be focused on increasing the sample size for the adult and older
adult population in hospital setting, to advance towards obtaining more precise IVE estimates for these strata
where vaccination can have most impact on morbidity and mortality. In addition, as influenza and SARS-CoV-
2 are expected to co-circulate in the 2020/21 season, the TND protocol has been adapted to encompass
some COVID-19 components in the operations data collection and analysis.

777363 – DRIVE – WP7 – IVE report, Season 2019/20
9
Milestones
Expected date Actual date Start of surveillance period
End of surveillance period 30.04.2020 (expected before study
start)
28.02.2020 (main analysis),
30.04.2020 (sensitivity analysis)
Data received 5.06.2020 09.06.2020 (all sites uploaded
data)
Data quality reports completed 11.06.2020 17.06.2020 (first version circulated
to the sites)
Database freeze 14.08.2020
First IVE results available 26.06.2020 26.06.2020
Report submission to IMI 10.09.2020 10.09.2020

777363 – DRIVE – WP7 – IVE report, Season 2019/20
10
List of figures, tables, abbreviations
List of figures Figure 1. Distribution of virus types and subtypes and percentage positive over time, from sentinel
surveillance in the European Region, 2019/20. Source: Flu News Europe [9] ................................................. 24 Figure 2. Pattern of circulation of the influenza viruses in Europe, by week. Source: ECDC [10] .................... 25 Figure 3. Intensity of influenza activity by country over time, 2019/20 Source: ECDC Annual epidemiological
report [10] The levels of intensity were defined as follows: Baseline or below epidemic threshold: ILI or ARI
rates that are very low and at levels usually seen throughout the inter-epidemic period. Low: ILI or ARI rates
that are relatively low compared to rates from historical data but higher than the baseline. Influenza virus
detections have been reported. Medium: ILI or ARI rates that are similar to rates usually observed, based on
historical data. Influenza virus detections have been reported. High: ILI or ARI rates that are higher than rates
usually observed, based on historical data. Influenza virus detections have been reported. Very high: ILI/ARI
rates that are much higher than rates usually observed, based on historical data. Influenza virus detections
have been reported. ........................................................................................................................................... 28 Figure 4. Distribution of ILI/SARI cases over time; TND studies, 2019/20 ........................................................ 49 Figure 5. Distribution of percentage of influenza cases among tested ILI/SARI subjects over time, TND
studies, 2019/20 ................................................................................................................................................ 50 Figure 6. Number of vaccinated subjects among enrolled subjects and distribution of vaccine brands; TND
studies, 2019/20 ................................................................................................................................................ 51 Figure 7. Data visualizations, Finland THL register-based cohort study, 2019/20. ........................................... 54 Figure 8. Any influenza vaccine: pooled confounder-adjusted (age, sex and calendar time) influenza vaccine
effectiveness against laboratory confirmed influenza, overall and per type and subtype/lineage, by setting and
age group, 2019/20 ............................................................................................................................................ 56 Figure 9. Agrippal (Seqirus): pooled confounder-adjusted (age, sex and calendar time) influenza vaccine
effectiveness against laboratory confirmed influenza, overall and per type and subtype/lineage, by setting and
age group, 2019/20 ............................................................................................................................................ 57 Figure 10. Fluad (Seqirus): pooled confounder-adjusted (age, sex and calendar time) influenza vaccine
effectiveness against laboratory confirmed influenza, overall and per type and subtype/lineage, by setting and
age group, 2019/20 ............................................................................................................................................ 58 Figure 11. Fluarix Tetra (GlaxoSmithKline): pooled confounder-adjusted (age, sex and calendar time)
influenza vaccine effectiveness against laboratory confirmed influenza, overall and per type and
subtype/lineage, by setting and age group, 2019/20 ......................................................................................... 59 Figure 12. Flucelvax Tetra (Seqirus): pooled confounder-adjusted (age, sex and calendar time) influenza
vaccine effectiveness against laboratory confirmed influenza, overall and per type and subtype/lineage, by
setting and age group, 2019/20 ......................................................................................................................... 60 Figure 13. Fluenz Tetra (AstraZeneca): pooled confounder-adjusted (age, sex and calendar time) influenza
vaccine effectiveness against laboratory confirmed influenza, overall and per type and subtype/lineage, by
setting and age group, 2019/20 ......................................................................................................................... 61

777363 – DRIVE – WP7 – IVE report, Season 2019/20
11
Figure 14. Influvac (Abbott): pooled confounder-adjusted (age, sex and calendar time) influenza vaccine
effectiveness against laboratory confirmed influenza, overall and per type and subtype/lineage, by setting and
age group, 2019/20 ............................................................................................................................................ 62 Figure 15. Influvac Tetra (Abbott): pooled confounder-adjusted (age, sex and calendar time) influenza vaccine
effectiveness against laboratory confirmed influenza, overall and per type and subtype/lineage, by setting and
age group, 2019/20 ............................................................................................................................................ 63 Figure 16. Vaxigrip Tetra (Sanofi Pasteur): pooled confounder-adjusted (age, sex and calendar time) influenza
vaccine effectiveness against laboratory confirmed influenza, overall and per type and subtype/lineage, by
setting and age group, 2019/20 ......................................................................................................................... 64 Figure 17. Distribution of ILI/SARI cases over time, until April 30; TND studies, 2019/20 ................................ 66 Figure 18. Quadrivalent inactivated egg-based influenza vaccines: pooled confounder-adjusted (age, sex and
calendar time) influenza vaccine effectiveness against laboratory confirmed influenza, overall and per type
and subtype/lineage, by setting and age group, 2019/20 .................................................................................. 69 Figure 19. Trivalent non-adjuvanted influenza vaccines: pooled confounder-adjusted (age, sex and calendar
time) influenza vaccine effectiveness against laboratory confirmed influenza, overall and per type and
subtype/lineage, by setting and age group, 2019/20 ......................................................................................... 70

777363 – DRIVE – WP7 – IVE report, Season 2019/20
12
List of tables Table 1. Primary care and hospital sites where TND studies were conducted, 2019/20 .................................. 17 Table 2. Dates of first and last swab and study period, by site, TND studies, 2019/20 .................................... 19 Table 3. Vaccine characteristics and age indications by vaccine brand, 2019/20 ............................................ 22 Table 4. Influenza epidemiology and influenza cases in the DRIVE dataset, 2019/20 ..................................... 30 Table 5. Number of subjects per study setting and age categories, TND studies, 2019/20 ............................. 31 Table 6. Number of vaccinated and unvaccinated person-years and influenza cases by age category, register-
based cohort study, 2019/20 ............................................................................................................................. 31 Table 7. Study population characteristics, 6m - 17y, primary care TND studies, 2019/20 ............................... 33 Table 8. Study population characteristics, 18 - 64y, primary care TND studies, 2019/20 ................................ 35 Table 9. Study population characteristics, ≥ 65, primary care TND studies, 2019/20....................................... 37 Table 10. Study population characteristics, 6m - 17y, hospital TND studies, 2019/20 ..................................... 40 Table 11. Study population characteristics, 18 - 64y, hospital TND studies, 2019/20 ...................................... 43 Table 12. Study population characteristics, ≥ 65y, hospital TND studies, 2019/20 .......................................... 46 Table 13. Study population characteristics, Finland THL register-based cohort study, 2019/20 ...................... 53 Table 14. Influential and outlying studies and their adjusted IVE estimates, 2019/20 ...................................... 65 Table 15. Confounder-adjusted influenza vaccine effectiveness of any vaccine and by vaccine brand against
any influenza, influenza A and influenza B, Finland THL register-based cohort, 2019/20 ................................ 67

777363 – DRIVE – WP7 – IVE report, Season 2019/20
13
List of abbreviations and acronyms
aTIV Adjuvanted trivalent influenza vaccine
BIVE Italian Hospital Network
DRIVE Development of Robust and Innovative Vaccine Effectiveness
CI Confidence Interval
CIRI Centro Interuniversitario di Ricerca sull’Influenza e sulle altre infezioni trasmissibili
COVID-19 Coronavirus disease 2019
ECDC European Centre for Disease Prevention and Control
EMA European Medicines Agency
ENCEPP European Network of Centres for Pharmacoepidemiology and Pharmacovigilance
EU European Union
FISABIO Fundación para el Fomento de la Investigación Sanitaria y Biomédica de la Comunitat
Valenciana
GDPR General Data Protection Regulation
GP General practitioner
GTPUH Germans Trias i Pujol University Hospital
HUS Helsinki University Hospital, Jorvi Hospital
ILI Influenza-like illness
IMI Innovative Medicines Initiative
INSERM Institut national de la santé et de la recherche médicale
ISS Istituto Superiore di Sanita
IVE Influenza vaccine effectiveness
LAIV Live attenuated influenza vaccine
LCI Laboratory confirmed influenza
LNS Laboratoire National de Santé
LPUH La Paz University Hospital
m Months
MUV Medical University Vienna
NIID National Institute for Infectious Disease “Prof. Dr. Matei Bals”
OR Odds ratio
QCAC Quality Control and Audit Committee
QIVc Quadrivalent influenza vaccine cell-based
QIVe Quadrivalent influenza vaccine egg-based
RCGP RSC Royal College of General Practitioners Research and Surveillance Centre
IRR Incidence rate ratio
RT-PCR Reverse transcription polymerase chain reaction
SAP Statistical analysis plan
SARI Severe acute respiratory infection

777363 – DRIVE – WP7 – IVE report, Season 2019/20
14
SARS-CoV-2 Severe acute respiratory syndrome coronavirus 2
THL The Finnish Institute for Health and Welfare
TIV Trivalent influenza vaccine cat
TIV-HD Trivalent influenza vaccine high dose
TND Test-negative design
UK United Kingdom
VCM Vaccine Composition Meeting
VE Vaccine effectiveness
VHUH Vall d’Hebron University Hospital
y year

777363 – DRIVE – WP7 – IVE report, Season 2019/20
15
1 Background
The Development of Robust and Innovative Vaccine Effectiveness (DRIVE) project is a public-private
partnership aiming to build capacity in Europe for estimating brand-specific influenza vaccine effectiveness
(IVE). The DRIVE Project, which is funded by the Innovative Medicines Initiative (IMI), was initiated as a
response to the changes for licensing of influenza vaccines in Europe. The new guidance on influenza
vaccines by the European Medicines Agency (EMA) came into effect in the beginning of 2017. This guidance
states that the performance of influenza vaccines should no longer be assessed based on serological assays,
but should be based on post-authorization effectiveness studies [1].
DRIVE seeks to establish a sufficiently sized network for robust, high quality, brand-specific effectiveness
estimates for all influenza vaccines used in the European Union (EU) each season. In DRIVE, data from
several independently operating national or regional study sites is analysed jointly to increase geographical
coverage and sample size for brand-specific IVE estimates.
In 2017/18, a pilot study was performed to test the different operational aspects of the DRIVE project,
including the IT infrastructure, the DRIVE governance for conducting IVE studies and to streamline key
processes such as data collection, statistical analyses and dissemination of study results [2]. In 2018/19, five
primary care based test-negative design (TND) studies, five hospital-based TND studies and one register-
based cohort study were conducted in Europe to assess brand-specific seasons IVE by health care setting
and age group [3]. The DRIVE network is still expanding. The study conducted in 2019/20 season builds upon
tools and processes developed, and lessons learned in the previous two seasons.
Similar to 2018/19, the main objective of the 2019/20 season was to estimate brand-specific seasonal IVE in
Europe by health care setting and age group. Site-specific IVE were calculated and estimates were pooled
across sites. For the 2019/20 season, a parsimonious set of confounders (sex, age, date of symptom onset)
will be used for the main analysis, as post-hoc analysis of the 2018/19 TND data showed that this performed
equally well to a more extended set of confounders.
Due to the COVID-19 outbreak, the study period was limited to the time prior to widespread SARS-CoV-2
circulation in Europe (i.e. up to February 29, 2020). The COVID-19 outbreak affected influenza surveillance
and data collection at the sites, and changed healthcare seeking behaviour. At some DRIVE sites, data
collection stopped in early March; other sites continued to include patients in April with a common triage
strategy and simultaneous tests for Influenza and SARS-CoV-2; and in others still, inclusion of influenza
cases in DRIVE were conditional to SARS-CoV-2 negative test results. The lockdown measures imposed
across Europe to prevent the spread of SARS-CoV-2 likely impacted influenza circulation too. The COVID-19
outbreak and its impact are described in more detail in the WebANNEX (COVID-19).
This Study Report lists the participating study sites, summarizes the methods used, and describes the IVE
estimates obtained for the 2019/20 influenza season, as well as the challenges and proposed

777363 – DRIVE – WP7 – IVE report, Season 2019/20
16
recommendations for next season. Further details on the characteristics of the study sites and the methods
used are available in the statistical analysis plan (SAP) (WebANNEX – SAP). The SAP has been registered in
the ENCEPP register, registration number EUPAS35685.
1.1 WebAnnex
Additional results are available in the WebANNEX. The WebAnnex is accessible at: https://apps.p-
95.com/drivewebapp/ (username: DRIVE_user; password: 6;40rv57P3Z85YC). An overview of the tables and
figures available in the WebAnnex is given in ANNEXES.
2 Objectives
2.1 Primary objective
To estimate confounder-adjusted seasonal overall and brand-specific IVE against laboratory-confirmed
influenza stratified by setting (primary care, hospital-based or mixed setting in case the source of the cases
cannot be obtained) and age group (6m - 17yr, 18 - 64yr, ≥ 65yr), by type of outcome: • any laboratory-confirmed influenza;
• laboratory-confirmed influenza A, overall and by subtype (A(H1N1)pdm09, A(H3N2));
• laboratory-confirmed influenza B, overall and by lineage (B Victoria, B Yamagata).
2.2 Secondary objective
To estimate confounder-adjusted seasonal vaccine-type IVE against laboratory-confirmed influenza stratified
by setting (primary care, hospital-based or mixed) and age group (6m - 17yr, 18 - 64yr, ≥ 65yr), by type of
outcome:
• any laboratory-confirmed influenza;
• laboratory-confirmed influenza A, overall and by subtype (A(H1N1)pdm09, A(H3N2));
• laboratory-confirmed influenza B, overall and by lineage (B Victoria, B Yamagata).
The following vaccine types will be considered:
• Trivalent non-adjuvanted influenza vaccine (TIV).
• Trivalent adjuvanted influenza vaccine (aTIV).
• Trivalent high-dose influenza vaccine (TIV-HD).
• Quadrivalent live attenuated influenza vaccine (LAIV).
• Quadrivalent inactivated egg-based influenza vaccine (QIVe).
• Quadrivalent inactivated cell-based influenza vaccine (QIVc).

777363 – DRIVE – WP7 – IVE report, Season 2019/20
17
3 Methods
3.1 Study sites
For the 2019/20 season, data is available from four primary care-based TND studies, eight hospital-based TND
studies (Table 1) and one register-based cohort. For details on the study sites see the SAP section 4.1
(WebANNEX – SAP).
Table 1. Primary care and hospital sites where TND studies were conducted, 2019/20
Country Site name Number of primary care physicians or hospitals where subjects are identified
New site for season 2019/20
Primary care Austria Medical University Vienna (MUV), Austria 96 No
Italy Centro Interuniversitario di Ricerca sull’Influenza e
sulle altre infezioni trasmissibili (CIRI-GP)
35 No
Italy Istituto Superiore di Sanita (ISS) 245 No
UK Royal College of General Practitioners Research and
Surveillance Centre (RCGP RSC) & University of
Oxford (OX)
12 No
Hospital Finland Helsinki University Hospital (HUS), Jorvi Hospital 1 No
France Institut National de la Sante et de la Recherche
Medicale (INSERM)
5 Yes
Italy Italian Hospital Network (BIVE) 5 No
Romania National Institute for Infectious Disease “Prof. Dr. Matei
Balș”, Bucharest
1 No
Spain Vall d’Hebron University Hospital (VHUH), Barcelona 1 No
Spain Fundación para el Fomento de la Investigación
Sanitaria y Biomédica de la Comunitat Valenciana
(FISABIO)
4 No
Spain Hospital Universitario La Paz (LPUH), Madrid 1 Yes
Spain Hospital Universitario Germans Trias i Pujol (GTPUH),
Badalona
1 Yes

777363 – DRIVE – WP7 – IVE report, Season 2019/20
18
3.2 Study design
The studies are based on the core protocols for TND studies and population-based database cohort studies [4]
[5]. The study design of TND studies and the register-based cohort study are briefly described below. Further
details including site specific exceptions are available from the SAP sections 5-14 (WebANNEX - SAP).
For the TND studies, patients with ILI or SARI were identified by the sites in primary care or hospital,
respectively. ILI was defined by the ECDC case definition as an individual that presented with a sudden onset
of symptoms AND at least one of four systemic symptoms (fever or feverishness, malaise, headache, myalgia)
AND at least one of three respiratory symptoms (cough, sore throat, shortness of breath). SARI was defined by
the IMOVE+ 2017/18 case definition as a hospitalized person with at least one systemic symptom (fever or
feverishness, malaise, headache, myalgia, deterioration of general condition ((asthenia or loss of weight or
anorexia or confusion or dizziness)) AND at least one of three respiratory symptoms or signs (cough, sore
throat, shortness of breath) at admission or within 48 hours of admission. Only patients with suspected infection
were screened for SARI. Any exceptions are described in the SAP section 9 (WebANNEX - SAP).
Subjects presenting with ILI or SARI aged < 6 months at the time of symptom onset were excluded. Other
exclusion criteria were a contraindication for influenza vaccine, a prior positive influenza test in the 2019/20
season, being institutionalized, and unwillingness to participate or to give consent. In addition, SARI patients
who were previously hospitalized < 48 hours prior to SARI onset or with onset ≥ 48 hours after hospital
admission were excluded (to exclude nosocomial infection). A respiratory specimen was taken for patients with
ILI or SARI that was tested for influenza through molecular or antigen detection tests. Specimens taken 8 days
or more after ILI/SARI onset were excluded. Information on covariates (at least: age, sex, date of onset) and
vaccination status was collected. Cases and controls were classified as vaccinated if they received seasonal
influenza vaccination > 14 days before ILI/SARI symptom onset and as unvaccinated if they did not receive
seasonal influenza vaccination in the 2019/20 season. The way vaccination status, vaccine brand and
vaccinatation data were ascertained at each site is described in the SAP section 11.2 (WebANNEX - SAP).
The start of the study period was defined as the first week of two consecutive weeks when influenza viruses
were detected at the study site level (based on the data as provided to DRIVE), and the end as the week prior
to the first of two consecutive weeks when no influenza viruses are detected at the study site level (based on
the data as provided to DRIVE) or February 29th 2020, whichever occurred first. The study period at site level
is shown in Table 2.

777363 – DRIVE – WP7 – IVE report, Season 2019/20
19
Table 2. Dates of first and last swab and study period, by site, TND studies, 2019/20
Site First swab Last swab Study period start Study period end* Primary care
Austria MUV 9-11-2019 13-3-2020 20-11-2019 29-2-2020
Italy CIRI-GP 4-11-2019 13-3-2020 18-11-2019 29-2-2020
Italy ISS 24-10-2019 7-4-2020 11-11-2019 29-2-2020
UK RCGP RSC 4-11-2019 12-3-2020 12-11-2019 27-2-2020
Hospital
Finland HUS 1-12-2019 29-4-2020 26-11-2019 29-2-2020
France INSERM 11-12-2019 16-3-2020 16-12-2019 29-2-2020
Italy CIRI-BIVE 12-11-2019 15-4-2020 18-11-2019 29-2-2020
Romania NIID 19-11-2019 16-3-2020 26-11-2019 29-2-2020
Spain FISABIO 9-12-2019 13-3-2020 4-12-2019 29-2-2020
Spain GTPUH 21-12-2019 12-3-2020 20-12-2019 29-2-2020
Spain LPUH 18-1-2020 24-2-2020 16-1-2020 2-2-2020
Spain VHUH 22-11-2019 16-3-2020 21-11-2019 29-2-2020
*In a sensitivity analysis the study period was extended to April 30, 2020.
The register-based cohort was conducted in Finland among children (6m - 6y) and elderly (65 - 100y) by linking
five national registers through personal identifiers. The cohort consisted of individuals registered in the
Population Information System. Laboratory-confirmed influenza cases were identified through the National
Infectious Diseases Register and vaccination status was retrieved from the National Vaccination Register.
Information on covariates was retrieved from the Register of Primary Health Care Visits and the Care Register
for Health Care. Subjects with presumably incomplete vaccination records in 2019/20 and 2018/19 were
excluded1. The study period was defined a priori from week 40/2019 to February 29th 2020.
3.3 Statistical methods
The statistical methods are briefly described below. Further details are available from the SAP section 15
(WebANNEX - SAP).
For the TND studies, individual-level data were transferred from the study sites to the GDPR-compliant DRIVE
Research Server. Site-specific crude and confounder-adjusted IVE and 95% confidence intervals were
estimated as VE = (1 – OR) x 100%, where OR denotes the odds ratio, comparing the odds of vaccination
among influenza-positive study participants to the odds of vaccination among influenza-negative study
1 Completeness of vaccination data is routinely monitored every month for each health care center; only HCCs meeting the criterion for
data completeness for all the months covered by the observation period of interest are included [6] Baum U, Sundman J, Jääskeläinen S,
Nohynek H, Puumalainen T, Jokinen J. Establishing and maintaining the National Vaccination register in Finland. Eurosurveillance.
2017;22:30520.
777363 – DRIVE – WP7 – IVE report, Season 2019/20
20
participants. Confounder-adjusted IVE estimates were derived from logistic regression models. Complete case
analysis was performed. Site-specific IVE estimates were pooled through random-effects meta-analysis.
For the register-based cohort study, aggregated data were transferred from the study site to the DRIVE
Research Server. As it concerns an open cohort, the unit of measure are person-years. Site-specific semi-crude
(adjusted only for calendar time) and confounder-adjusted IVE and 95% confidence intervals were estimated
as VE = (1 – IRR) x 100%, where IRR denotes the incidence rate ratio comparing the influenza incidence
among the vaccinated subjects to the influenza incidence among the unvaccinated subjects. Confounder-
adjusted IVE estimates were derived from Poisson regression models. Estimates obtained from the register-
based cohort study were not pooled with the TND studies as it was not possible to differentiate between primary
care and hospital cases.
A parsimonious set of confounders was used (age, sex, date of symptom onset), similar to Lane et al. [7]. Based
on a post-hoc analysis of the 2018/19 TND data, it has been shown that this parsimonious confounder-
adjustment performs equally well. A major advantage of parsimonious confounder-adjustment is that the fewer
records need to be discarded from the analysis due to missing covariate information.
The main analysis considered in this study is a pooled analysis. The VE estimates from the different TND studies
are pooled by use of a random effects meta-analysis. Further details are given in SAP section 15 (WebANNEX
- SAP).
Five sensitivity analyses were considered. First, an analysis considering partially vaccinated subjects as 1)
unvaccinated and 2) vaccinated was performed. Second, for the TND studies, a sensitivity analysis was
conducted excluding subjects with a respiratory specimen taken ≥ 4 days after ILI/SARI onset. Third, for the
pooled estimates, any studies that are both outlying and influential were included in the meta-analysis. Fourth,
an analysis with the study period extended to April 30th was considered. Fifth, a model including all available
confounders was analysed. See the WebANNEX (Add. Confounders) for a site-specific overview of the
covariates that were adjusted for in the analyses.
All data management and statistical analyses were conducted in R version 3.6.2. GitHub was used for version
control. For each site, a data quality report (describing data quality checks and corrections, an attrition diagram,
and a summary of data retained for analysis) was produced centrally. The reports for each site are presented
in (WebANNEX - Data Quality Report).
3.4 Quality control
Procedures for quality control are described in the SAP section 19 (WebANNEX - SAP). The findings and
conclusions of the Quality Control and Audit Committee (QCAC) will be made available in a separate report.

777363 – DRIVE – WP7 – IVE report, Season 2019/20
21
3.5 Ethics
Each local study was approved by national, regional or institutional ethics committees, as appropriate. In the
case of ISS, the study was submitted to the ethics committee for information, but approval was not required as
the study is nested in the National Influenza Surveillance Scheme. Similarly, for the Finnish register-based
cohort study, an ethical evaluation was not mandatory, however an evaluation from an institutional ethical review
group was requested.
3.6 Deviations from protocol or SAP
Deviations from the local protocols are described in the local study reports (WebANNEX – Local Study
Reports). Local protocols are available upon request from [email protected].
The following deviations from the SAP took place:
• Spain LPUH recruited patients with ILI and patients with SARI from the emergency department. Only
SARI patients were included in the analysis, ILI patients were excluded as ILI patients seeking care at
the emergency department may not be comparable to ILI patients seeking care in the primary care
setting..
• No information on influenza A subtypes or B lineage was available for Spain LPUH.
• No data from LNS Luxembourg was included as approval from the National Research Ethical was not
obtained in time.
• The sensitivity analysis regarding partially vaccinated subjects was included for all sites irrespective of
whether the 5% cut-off was met (in the WebAnnex).
4 Results
4.1 Influenza vaccines in Europe, 2019/20
4.1.1 Vaccine recommendations
National or regional vaccine recommendations by target group and recommendations for the use of specific
vaccines types are summarized in the WebANNEX (Vaccine Recommendations).
4.1.2 Vaccine indications
Twelve influenza vaccines were licensed in the EU for the season 2019/20. Details on vaccine characteristics,
the approved age indication and, for each age group, the sites that reported the vaccine brand in the 2019/20
studies are listed in Table 3. Eight of the vaccines were reported in the DRIVE dataset.

777363 – DRIVE – WP7 – IVE report, Season 2019/20
22
Table 3. Vaccine characteristics and age indications by vaccine brand, 2019/20
Vaccine brand Manufacturer Valency Inactivated or live-attenuated
Non-adjuvanted or adjuvanted
Egg- or cell-based
Non-high or high dose
Approved age indication
Countries (Sites if >1 in the country) in which the vaccine brand was observed*
6m - 17y 18 - 64y ≥ 65y
Afluria Seqirus 3 Inactivated Non-adjuvanted Egg Non-high ≥5y - - -
Agrippal Seqirus 3 Inactivated Non-adjuvanted Egg Non-high ≥6m Italy 1, Spain 2,3
Spain 2,3,4 Spain 4
Fluad Seqirus 3 Inactivated Adjuvanted Egg Non-high ≥65y - - Italy 5,6, Spain 2,3,4,7
Fluarix Tetra GSK 4 Inactivated Non-adjuvanted Egg Non-high ≥6m Italy 1,6 Italy 1,5,6 Italy 5,6
Flucelvax Tetra Seqirus 4 Inactivated Non-adjuvanted Cell Non-high ≥9y Italy 1 Spain 7, UK Austria, Spain 7
Fluenz Tetra AstraZeneca 4 Live Non-adjuvanted Egg Non-high ≥2y to 18y Finland 8
Romania, UK
- -
Influvac Abbott 3 Inactivated Non-adjuvanted Egg Non-high ≥6m - - France.
Influvac Tetra Abbott 4 Inactivated Non-adjuvanted Egg Non-high ≥3y Italy 1,
Romania.
UK, Romania,
France.
France,
Romania
Vaxigrip Sanofi Pasteur 3 Inactivated Non-adjuvanted Egg Non-high ≥6m - - -
Vaxigrip Tetra Sanofi Pasteur 4 Inactivated Non-adjuvanted Egg Non-high ≥6m Austria,
Finland 8, Italy 1,5,6, Romania
Finland 9,
France,
Italy 5,6,
Romania
Finland 8,9,
France, Italy 5,6
.
TIV High Dose Sanofi Pasteur 3 Inactivated Non-adjuvanted Egg High ≥65y - - -
*and for which sufficient data was available to calculate a site-specific brand-specific estimate for the relevant age group 1 CIRI-GP, 2 GTPUH, 3 VHUH, 4 LPUH, 5 CIRI-BIVE, 6 ISS, 7 FISABIO, 8 THL, 9 HUS
GSK: GlaxoSmithKline; m: months; QIV: quadrivalent influenza vaccine; TIV: trivalent influenza vaccine; UK: United Kingdom; y: years

777363 – DRIVE – WP7 – IVE report, Season 2019/20
23
4.1.3 Composition of influenza vaccines
The 2019/20 Northern hemisphere trivalent vaccines contained the following strains [8]:
• an A/Brisbane/02/2018 (H1N1)pdm09-like virus;
• an A/Kansas/14/2017 (H3N2)-like virus;
• a B/Colorado/06/2017-like virus (B/Victoria/2/87 lineage); and
Quadrivalent vaccines contained additionally:
• a B/Phuket/3073/2013-like virus (B/Yamagata/16/88 lineage)
4.2 Influenza epidemiology in Europe, 2019/20
4.2.1 Influenza epidemiology in Europe and vaccine match
In the European Region, the influenza activity began earlier compared to the previous season and the positivity
rate of 10% was exceeded in 47/2019 and returned to baseline in week 13/2020 [9]. Compared to the previous
five seasons, the only season in which the 10% threshold was crossed earlier by one week was in the 2016/17
season.
The peak was observed in week 05/2020 (Figure 1), reaching a maximum positivity rate of 55%. The peak
phase with positivity levels above 50% lasted for just two weeks, 05/2020 and 06/2020. After that, reporting in
subsequent weeks has been affected by the COVID-19 pandemic. In the previous influenza season, the
influenza positivity rate exceeded 50% for six weeks.

777363 – DRIVE – WP7 – IVE report, Season 2019/20
24
Figure 1. Distribution of virus types and subtypes and percentage positive over time, from sentinel surveillance in the
European Region, 2019/20. Source: Flu News Europe [9]
Both influenza A and B types co-circulated in Europe, with patterns of dominant type and A subtypes among
the countries (Figure 2). There was an early circulation of A(H3N2) followed by increased proportions of
A(H1N1)pdm09 and B/Victoria viruses later in the season. A(H1N1)pdm09 has acquired three additional
substitutions (N129D, D187A and Q189E related to the 6B.1A5A clade) that had an impact on virus antigenicity
and as a consequence may have also impacted VE . Regarding A(H3) viruses, two H3N2 lineages with different
antigenicity have co-circulated in Europe (3C.3a and 3C.2a1b) (personal communication Bruno Lina). Of the
circulating B viruses, the majority belonged to the B/Victoria lineage (triple deleted).

777363 – DRIVE – WP7 – IVE report, Season 2019/20
25
Figure 2. Pattern of circulation of the influenza viruses in Europe, by week. Source: ECDC [10]

777363 – DRIVE – WP7 – IVE report, Season 2019/20
26
Based on these information, the substitutions observed in A(H1N1)pdm09 viruses have led to a reduction in
vaccine effectiveness, and required a change in the vaccine composition to adapt the vaccine to this antigenic
change. This switch to the 6B.5A5A clade with A/Guangdong-Maonan/SWL1536/2019 (egg-based) or
A/Hawaii/70/2019 (H1N1)pdm09-like (cell-based) as prototypes was proposed during the Vaccine
Composition Meeting (VCM) in February.
Regarding A(H3N2), it has been showed that post vaccination human serum panels raised against 3C.3a
viruses recognise 3C.2a1b viruses somewhat less well. As a consequence, patients vaccinated with the
A/Kansas/14/17 virus and exposed to 3C.2a1b viruses were less protected, leading to a measurable reduced
vaccine effectiveness.
For the B viruses, there were no changes in the B/Yamagata lineage, but these viruses were barely circulating
during this winter. The vast majority of the circulating B viruses belonged to the B/Victoria lineage. However,
the circulating strains harboured a triple deletion in the HA, leading to antigenic differences as compared to
the vaccine strain (B/Colorado6/2017) that had a double deletion. As a consequence of this mismatch, the VE
was likely to be decreased, and a change was proposed in the VCM with a switch to the
B/Washington/02/2019 triple deleted strain.
In Europe overall influenza activity remained low in most countries, but started to increase sharply in several
countries from mid to late January (Figure 3). Until week 49/2019, the United Kingdom (Northern Ireland)
reported medium intensity activity and five countries (Finland, Latvia, Portugal and the United Kingdom (UK)
[Northern Ireland and Scotland]) reported geographically widespread influenza activity.
The circulation of the SARS-CoV-2 associated to the different measures taken during the first weeks of March
(weeks 10, 11 and 12) Europe-wide had an impact on the epidemiology of the influenza viruses, reducing their
circulation very rapidly. In addition, some community-based networks stopped their surveillance when the
lockdowns were implemented.

777363 – DRIVE – WP7 – IVE report, Season 2019/20
27

777363 – DRIVE – WP7 – IVE report, Season 2019/20
28
Figure 3. Intensity of influenza activity by country over time, 2019/20 Source: ECDC Annual epidemiological report [10] The levels of intensity were defined as follows: Baseline
or below epidemic threshold: ILI or ARI rates that are very low and at levels usually seen throughout the inter-epidemic period. Low: ILI or ARI rates that are relatively low
compared to rates from historical data but higher than the baseline. Influenza virus detections have been reported. Medium: ILI or ARI rates that are similar to rates usually
observed, based on historical data. Influenza virus detections have been reported. High: ILI or ARI rates that are higher than rates usually observed, based on historical data.
Influenza virus detections have been reported. Very high: ILI/ARI rates that are much higher than rates usually observed, based on historical data. Influenza virus detections
have been reported.

777363 – DRIVE – WP7 – IVE report, Season 2019/20
29
4.2.2 Influenza epidemiology by site
Table 4 describes the epidemic period, the peak, and the number of influenza cases by type and subtype in the
DRIVE dataset for each site. The number of influenza A cases exceeded the number of influenza B cases at all
TND sites (range 52.8% to 95.8%), except at the Italy CIRI GP site (42.9%). The highest proportion of influenza
A compared to influenza B cases was found at Finland HUS (95.8%). Among influenza A cases with a known
subtype, the most frequently identified subtype was A(H1N1)pdm09 at the sites in Finland, France and Spain
(range 71.7% to 91.3%), and A(H3N2) at the sites in Austria, Italy and Romania (range 56.9% to 62.6%). In
each of the countries, most influenza B cases were of the B/Victoria lineage.
Additional information on influenza epidemiology in countries of participating sites can be found in the local
study reports (WebANNEX – Local Study Reports).

777363 – DRIVE – WP7 – IVE report, Season 2019/20
30
Table 4. Influenza epidemiology and influenza cases in the DRIVE dataset, 2019/20
Epidemic period (week)
Peak (week 2020)
All influenza cases
N
Influenza A
n (% of total)
Influenza A(H1N1)pmd09 n (% of A with
known subtype)
Influenza A(H3N2)
n (% of A with known
subtype)
Influenza B n (% of total)
Influenza B/Victoria n (%of B with
known lineage)
Influenza B/Yamagata n
(%of B with known lineage)
Austria
MUV 3-14/2020 6 779 634 (81%) 273 (43%) 361 (57%) 145 (19%) 145 (100%) 0 (0%)
Finland
HUS 3-12/2020 9 24 23 (96%) 21 (91%) 2 (9%) 1 (4%) 1 (100%) 0 (0%)
THL 3-12/2020 9
France
INSERM 2-11/2020 5-8 81 63 (78%) 42 (81%) 10 (19%) 18 (22%) 2 (67%) 1 (33%)
Italy
CIRI-IT GP 49/2019-12/2020 5 513 220 (43%) 82 (37%) 137 (63%) 293 (57%) 212 (90%) 23 (10%)
CIRI-IT BIVE 49/2019-12/2020 5 473 355 (75%) 135 (41%) 194 (59%) 118 (25%) 52 (98%) 1 (2%)
ISS 46/2019-17/2020 5 862 481 (56%) 180 (40%) 267 (60%) 381 (44%) 147 (100%) 0 (0%)
Romania
NIID 47/2019-11/2020 5 405 214 (53%) 77 (41%) 110 (59%) 191 (47%) 181 (100%) 0 (0%)
Spain
FISABIO 50/2019-11/2020 5-6 60 54 (90%) 41 (89%) 5 (11%) 6 (10%) 6 (100%) 0 (0%)
GTPUH 52/2019-11/2020 6 85 72 (85%) 38 (72%) 15 (28%) 13 (15%) 7 (100%) 0 (0%)
LPUH 48/2019-10/2020 5 22 18 (82%) 9 (100%) 0 (0%) 4 (18%) 3 (100%) 0 (0%)
VHUH 3-11/2020 5 146 110 (75%) 74 (85%) 13 (15%) 36 (25%) 28 (100%) 0 (0%)
UK
RCGP RSC 51/2019 1 81 63 (78%) - - 18 (22%) - -
777363 – DRIVE – WP7 – IVE report, Season 2019/20
31
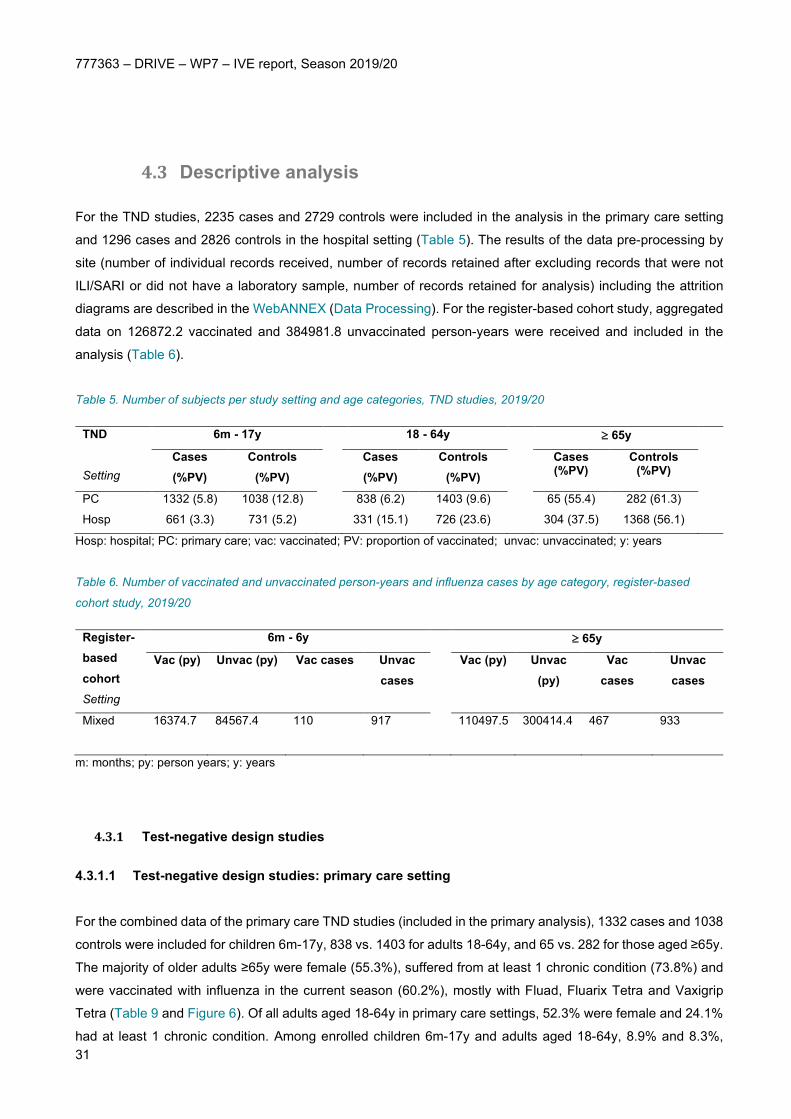
4.3 Descriptive analysis
For the TND studies, 2235 cases and 2729 controls were included in the analysis in the primary care setting
and 1296 cases and 2826 controls in the hospital setting (Table 5). The results of the data pre-processing by
site (number of individual records received, number of records retained after excluding records that were not
ILI/SARI or did not have a laboratory sample, number of records retained for analysis) including the attrition
diagrams are described in the WebANNEX (Data Processing). For the register-based cohort study, aggregated
data on 126872.2 vaccinated and 384981.8 unvaccinated person-years were received and included in the
analysis (Table 6).
Table 5. Number of subjects per study setting and age categories, TND studies, 2019/20
TND Setting
6m - 17y
18 - 64y
≥ 65y
Cases (%PV)
Controls (%PV)
Cases (%PV)
Controls (%PV)
Cases (%PV)
Controls (%PV)
PC 1332 (5.8) 1038 (12.8)
838 (6.2) 1403 (9.6)
65 (55.4) 282 (61.3)
Hosp 661 (3.3) 731 (5.2)
331 (15.1) 726 (23.6)
304 (37.5) 1368 (56.1)
Hosp: hospital; PC: primary care; vac: vaccinated; PV: proportion of vaccinated; unvac: unvaccinated; y: years
Table 6. Number of vaccinated and unvaccinated person-years and influenza cases by age category, register-based
cohort study, 2019/20
Register-based cohort Setting
6m - 6y
≥ 65y
Vac (py) Unvac (py) Vac cases Unvac cases
Vac (py) Unvac (py)
Vac cases
Unvac cases
Mixed 16374.7
84567.4 110
917
110497.5
300414.4
467
933
m: months; py: person years; y: years
4.3.1 Test-negative design studies
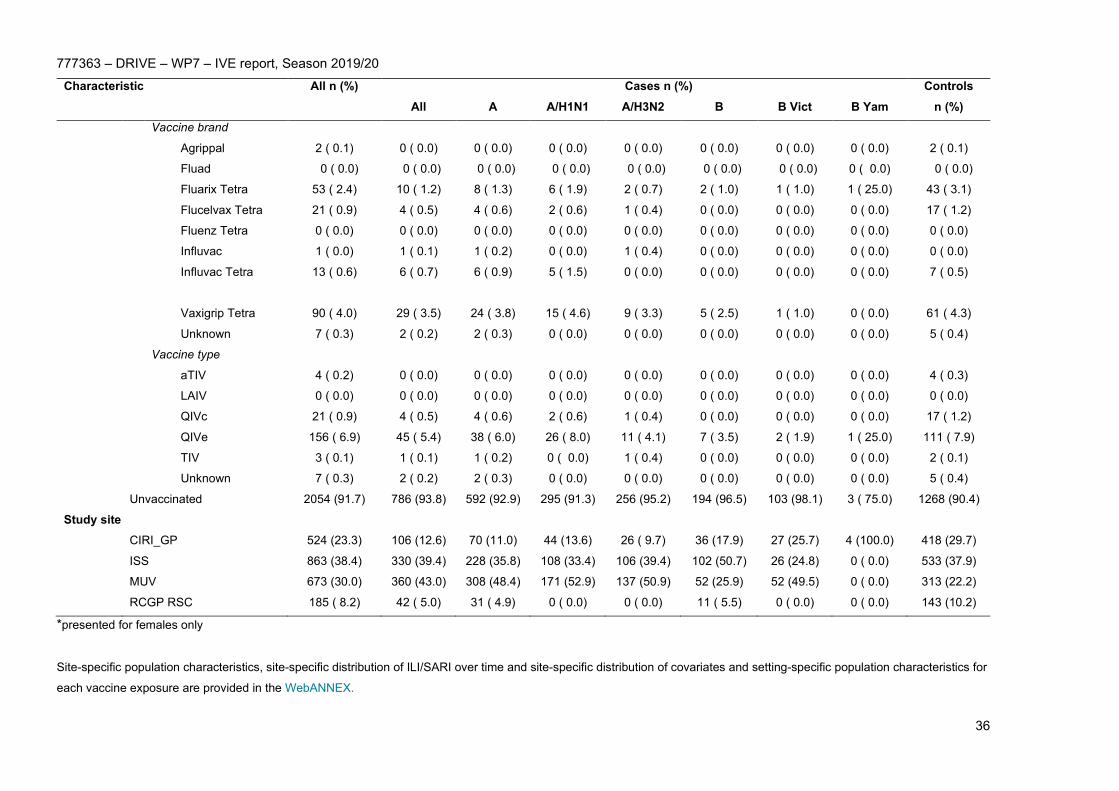
4.3.1.1 Test-negative design studies: primary care setting
For the combined data of the primary care TND studies (included in the primary analysis), 1332 cases and 1038
controls were included for children 6m-17y, 838 vs. 1403 for adults 18-64y, and 65 vs. 282 for those aged ≥65y.
The majority of older adults ≥65y were female (55.3%), suffered from at least 1 chronic condition (73.8%) and
were vaccinated with influenza in the current season (60.2%), mostly with Fluad, Fluarix Tetra and Vaxigrip
Tetra (Table 9 and Figure 6). Of all adults aged 18-64y in primary care settings, 52.3% were female and 24.1%
had at least 1 chronic condition. Among enrolled children 6m-17y and adults aged 18-64y, 8.9% and 8.3%,

777363 – DRIVE – WP7 – IVE report, Season 2019/20
32
respectively, were vaccinated with influenza in the current season. The vaccine brand used among these age
groups were mostly Fluarix Tetra and Vaxigrip Tetra (Table 7 and Table 8). Among all vaccinated patients in
primary care TND studies, the vaccine types used were primarily trivalent adjuvanted influenza and quadrivalent
inactivated egg-based influenza vaccines. Graphical summaries of primary care settings and site-specific brand
distribution are provided in Figure 4-Figure 6. The distribution of the controls and laboratory-confirmed influenza
infections (by type and subtype/lineage) stratified by age group (6m-17y, 18-64 y, ≥65y) over time is given in
Figure 3, showing a much lower influenza B proportion reported among older adults with laboratory‐confirmed
influenza this season. The percentage of subjects that tested positive for influenza over time is shown in Figure
5. Site-specific population characteristics, distribution of ILI/SARI over time, distribution of covariates and
setting-specific population characteristics for each vaccine exposure are provided in the WebANNEX. All
primary care TND studies used an unmatched design.

777363 – DRIVE – WP7 – IVE report, Season 2019/20
33
Table 7. Study population characteristics, 6m - 17y, primary care TND studies, 2019/20
Characteristic All n (%) Cases n (%) Controls n (%) All A A/H1N1 A/H3N2 B B Vict B Yam
Total 2370 1332 705 198 459 627 395 19 1038
Sex
Female 1140 (48.1) 646 (48.5) 359 (50.9) 102 (51.5) 228 (49.7) 287 (45.8) 175 (44.3) 7 ( 36.8) 494 (47.5)
Male 1230 (51.9) 686 (51.5) 346 (49.1) 96 (48.5) 231 (50.3) 340 (54.2) 220 (55.7) 12 ( 63.2) 544 (52.4)
At least 1 chronic condition
Yes 167 ( 7.0) 94 ( 7.1) 53 ( 7.5) 15 ( 7.6) 31 ( 6.8) 41 ( 6.5) 22 ( 5.6) 0 ( 0.0) 73 ( 7.0)
No 2188 (92.3) 1231 (92.4) 645 (91.5) 181 (91.4) 423 (92.2) 586 (93.5) 373 (94.4) 19 (100.0) 957 (92.2)
Unknown 15 ( 0.6) 7 ( 0.5) 7 ( 1.0) 2 ( 1.0) 5 ( 1.1) 0 ( 0.0) 0 ( 0.0) 0 ( 0.0) 8 ( 0.8)
Pregnancy*
Yes 0 ( 0.0) 0 ( 0.0) 0 ( 0.0) 0 ( 0.0) 0 ( 0.0) 0 ( 0.0) 0 ( 0.0) 0 ( 0.0) 0 ( 0.0)
No 672 (58.9) 393 ( 60.8) 238 ( 66.3) 67 ( 65.7) 154 ( 67.5) 155 ( 54.0) 117 ( 66.9) 7 (100.0) 279 ( 56.5)
Unknown 468 ( 41.1) 253 ( 39.2) 121 ( 33.7) 35 ( 34.3) 74 ( 32.5) 132 ( 46.0) 58 ( 33.1) 0 ( 0.0) 215 ( 43.5)
Number of GP visits in the previous 12 months
0 270 (11.4) 147 (11.0) 67 ( 9.5) 15 ( 7.6) 49 (10.7) 80 (12.8) 35 ( 8.9) 9 ( 47.4) 123 (11.8)
1 - 5 1127 (47.5) 635 (47.7) 255 (36.2) 74 (37.4) 165 (35.9) 380 (60.6) 218 (55.2) 10 ( 52.6) 492 (47.3)
> 5 210 ( 8.9) 100 ( 7.5) 41 ( 5.8) 14 ( 7.1) 27 ( 5.9) 59 ( 9.4) 43 (10.9) 0 ( 0.0) 110 (10.6)
Unknown 763 (32.2) 450 (33.8) 342 (48.5) 95 (48.0) 218 (47.5) 108 (17.2) 99 (25.1) 0 ( 0.0) 313 (30.2)
Number of hospitalizations in the previous 12 months
0 1476 (62.2) 809 (60.7) 345 (48.9) 90 (45.5) 237 (51.6) 464 (74.0) 259 (65.6) 19 (100.0) 667 (64.1)
1 - 2 35 ( 1.5) 21 ( 1.6) 11 ( 1.6) 4 ( 2.0) 7 ( 1.5) 10 ( 1.6) 1 ( 0.3) 0 ( 0.0) 14 ( 1.3)
> 2 5 ( 0.2) 0 ( 0.0) 0 ( 0.0) 0 ( 0.0) 0 ( 0.0) 0 ( 0.0) 0 ( 0.0) 0 ( 0.0) 5 ( 0.5)
Unknown 854 (36.0) 502 (37.7) 349 (49.5) 104 (52.5) 215 (46.8) 153 (24.4) 135 (34.2) 0 ( 0.0) 352 (33.9)
Influenza vaccination status in current season
Vaccinated 210 ( 8.9) 77 ( 5.8) 42 ( 6.0) 12 ( 6.1) 27 ( 5.9) 35 ( 5.6) 25 ( 6.3) 0 ( 0.0) 133 (12.8)
Vaccine brand

777363 – DRIVE – WP7 – IVE report, Season 2019/20
34
Characteristic All n (%) Cases n (%) Controls n (%) All A A/H1N1 A/H3N2 B B Vict B Yam
Agrippal 9 ( 0.4) 4 ( 0.3) 2 ( 0.3) 0 ( 0.0) 2 ( 0.4) 2 ( 0.3) 2 ( 0.5) 0 ( 0.0) 5 ( 0.5)
Fluad 0 ( 0.0) 0 ( 0.0) 0 ( 0.0) 0 ( 0.0) 0 ( 0.0) 0 ( 0.0) 0 ( 0.0) 0 ( 0.0) 0 ( 0.0)
Fluarix Tetra 50 ( 2.1) 11 ( 0.8) 9 ( 1.3) 5 ( 2.5) 4 ( 0.9) 2 ( 0.3) 2 ( 0.5) 0 ( 0.0) 39 ( 3.8)
Flucelvax Tetra 7 ( 0.3) 3 ( 0.2) 1 ( 0.1) 0 ( 0.0) 1 ( 0.2) 2 ( 0.3) 1 ( 0.3) 0 ( 0.0) 4 ( 0.4)
Fluenz Tetra 16 ( 0.7) 3 ( 0.2) 2 ( 0.3) 0 ( 0.0) 0 ( 0.0) 1 ( 0.2) 0 ( 0.0) 0 ( 0.0) 13 ( 1.2)
Influvac 1 ( 0.0) 1 ( 0.1) 0 ( 0.0) 0 ( 0.0) 0 ( 0.0) 1 ( 0.2) 0 ( 0.0) 0 ( 0.0) 0 ( 0.0)
Influvac Tetra 7 ( 0.3) 4 ( 0.3) 1 ( 0.1) 0 ( 0.0) 1 ( 0.2) 3 ( 0.5) 3 ( 0.8) 0 ( 0.0) 3 ( 0.3)
Vaxigrip Tetra 117 ( 4.9) 50 ( 3.8) 27 ( 3.8) 7 ( 3.5) 19 ( 4.1) 23 ( 3.7) 16 ( 4.1) 0 ( 0.0) 67 ( 6.4)
Unknown 3 ( 0.1) 1 ( 0.1) 0 ( 0.0) 0 ( 0.0) 0 ( 0.0) 1 ( 0.2) 1 ( 0.3) 0 ( 0.0) 2 ( 0.2)
Vaccine type
aTIV 0 ( 0.0) 0 ( 0.0) 0 ( 0.0) 0 ( 0.0) 0 ( 0.0) 0 ( 0.0) 0 ( 0.0) 0 ( 0.0) 0 ( 0.0)
LAIV 16 ( 0.7) 3 ( 0.2) 2 ( 0.3) 0 ( 0.0) 0 ( 0.0) 1 ( 0.2) 0 ( 0.0) 0 ( 0.0) 13 ( 1.2)
QIVc 7 ( 0.3) 3 ( 0.2) 1 ( 0.1) 0 ( 0.0) 1 ( 0.2) 2 ( 0.3) 1 ( 0.3) 0 ( 0.0) 4 ( 0.4)
QIVe 174 ( 7.3) 65 ( 4.9) 37 ( 5.2) 12 ( 6.1) 24 ( 5.2) 28 ( 4.5) 21 ( 5.3) 0 ( 0.0) 109 (10.5)
TIV 10 ( 0.4) 5 ( 0.4) 2 ( 0.3) 0 ( 0.0) 2 ( 0.4) 3 ( 0.5) 2 ( 0.5) 0 ( 0.0) 5 ( 0.5)
Unknown 3 ( 0.1) 1 ( 0.1) 0 ( 0.0) 0 ( 0.0) 0 ( 0.0) 1 ( 0.2) 1 ( 0.3) 0 ( 0.0) 2 ( 0.2)
Unvaccinated 2160 (91.1) 1255 (94.2) 663 (94.0) 186 (93.9) 432 (94.1) 592 (94.4) 370 (93.7) 19 (100.0) 905 (87.0)
Study site
CIRI-GP 698 (29.4) 397 (29.8) 142 (20.1) 37 (18.7) 104 (22.7) 255 (40.7) 183 (46.3) 19 (100.0) 301 (28.9)
ISS 938 (39.5) 502 (37.7) 229 (32.5) 66 (33.3) 145 (31.6) 273 (43.5) 119 (30.1) 0 ( 0.0) 436 (41.9)
MUV 637 (26.9) 398 (29.9) 305 (43.3) 95 (48.0) 210 (45.8) 93 (14.8) 93 (23.5) 0 ( 0.0) 239 (23.0)
RCGP RSC 97 ( 4.1) 35 ( 2.6) 29 ( 4.1) 0 ( 0.0) 0 ( 0.0) 6 ( 1.0) 0 ( 0.0) 0 ( 0.0) 62 ( 6.0)
*presented for females only
Site-specific population characteristics, site-specific distribution of ILI/SARI over time and site-specific distribution of covariates and setting-specific population characteristics for
each vaccine exposure are provided in the WebANNEX.

777363 – DRIVE – WP7 – IVE report, Season 2019/20
35
Table 8. Study population characteristics, 18 - 64y, primary care TND studies, 2019/20
Characteristic All n (%) Cases n (%) Controls n (%) All A A/H1N1 A/H3N2 B B Vict B Yam
Total 2241 838 637 323 269 201 105 4 1403
Sex
Female 1172 (52.3) 399 (47.6) 307 (48.2) 140 (43.3) 142 (52.8) 92 (45.8) 50 (47.6) 4 (100.0) 773 (55.1)
Male 1069 (47.7) 439 (52.4) 330 (51.8) 183 (56.7) 127 (47.2) 109 (54.2) 55 (52.4) 0 ( 0.0) 630 (44.9)
At least 1 chronic condition
Yes 541 (24.1) 162 (19.3) 127 (19.9) 65 (20.1) 55 (20.4) 35 (17.4) 19 (18.1) 1 ( 25.0) 379 (27.0)
No 1668 (74.4) 661 (78.9) 499 (78.3) 249 (77.1) 212 (78.8) 162 (80.6) 82 (78.1) 3 ( 75.0) 1007 (71.8)
Unknown 32 ( 1.4) 15 ( 1.8) 11 ( 1.7) 9 ( 2.8) 2 ( 0.7) 4 ( 2.0) 4 ( 3.8) 0 ( 0.0) 17 ( 1.2)
Pregnancy*
Yes 16 ( 1.4)
9 ( 2.3)
7 ( 2.3)
3 ( 2.1)
4 ( 2.8)
2 ( 2.2)
2 ( 4.0)
0 ( 0.0)
7 ( 0.9)
No 662 (56.3) 204 (51.1) 165 (53.7) 76 ( 54.3) 75 ( 52.8) 39 ( 42.4) 29 ( 58.0) 4 (100.0)
458 (59.0)
Unknown 497 (42.3) 186 (46.6) 135 (44.0) 61 ( 43.6) 63 ( 44.4) 51 ( 55.4) 19 ( 38.0) 0 ( 0.0)
311 (40.1)
Number of GP visits in the previous 12 months
0 356 (15.9) 130 (15.5) 83 (13.0) 41 (12.7) 40 (14.9) 47 (23.4) 14 (13.3) 1 ( 25.0) 226 (16.1)
1 - 5 845 (37.7) 274 (32.7) 188 (29.5) 100 (31.0) 77 (28.6) 86 (42.8) 37 (35.2) 3 ( 75.0) 571 (40.7)
> 5 109 ( 4.9) 25 ( 3.0) 24 ( 3.8) 9 ( 2.8) 15 ( 5.6) 1 ( 0.5) 0 ( 0.0) 0 ( 0.0) 84 ( 6.0)
Unknown 931 (41.5) 409 (48.8) 342 (53.7) 173 (53.6) 137 (50.9) 67 (33.3) 54 (51.4) 0 ( 0.0) 522 (37.2)
Number of hospitalizations in the previous 12 months
0 1325 (59.1) 424 (50.6) 291 (45.7) 149 (46.1) 128 (47.6) 133 (66.2) 51 (48.6) 4 (100.0) 901 (64.2)
1 - 2 46 ( 2.1) 10 ( 1.2) 5 ( 0.8) 2 ( 0.6) 3 ( 1.1) 5 ( 2.5) 2 ( 1.9) 0 ( 0.0) 36 ( 2.6)
> 2 2 ( 0.1) 0 ( 0.0) 0 ( 0.0) 0 ( 0.0) 0 ( 0.0) 0 ( 0.0) 0 ( 0.0) 0 ( 0.0) 2 ( 0.1)
Unknown 868 (38.7) 404 (48.2) 341 (53.5) 172 (53.3) 138 (51.3) 63 (31.3) 52 (49.5) 0 ( 0.0) 464 (33.0)
Influenza vaccination status in current season
Vaccinated 187 ( 8.3) 52 ( 6.2) 45 ( 7.1) 28 ( 8.7) 13 ( 4.8) 7 ( 3.5) 2 ( 1.9) 1 ( 25.0) 135 ( 9.6)
777363 – DRIVE – WP7 – IVE report, Season 2019/20
36
Characteristic All n (%) Cases n (%) Controls n (%) All A A/H1N1 A/H3N2 B B Vict B Yam
Vaccine brand
Agrippal 2 ( 0.1) 0 ( 0.0) 0 ( 0.0) 0 ( 0.0) 0 ( 0.0) 0 ( 0.0) 0 ( 0.0) 0 ( 0.0) 2 ( 0.1)
Fluad 0 ( 0.0) 0 ( 0.0) 0 ( 0.0) 0 ( 0.0) 0 ( 0.0) 0 ( 0.0) 0 ( 0.0) 0 ( 0.0) 0 ( 0.0)
Fluarix Tetra 53 ( 2.4) 10 ( 1.2) 8 ( 1.3) 6 ( 1.9) 2 ( 0.7) 2 ( 1.0) 1 ( 1.0) 1 ( 25.0) 43 ( 3.1)
Flucelvax Tetra 21 ( 0.9) 4 ( 0.5) 4 ( 0.6) 2 ( 0.6) 1 ( 0.4) 0 ( 0.0) 0 ( 0.0) 0 ( 0.0) 17 ( 1.2)
Fluenz Tetra 0 ( 0.0) 0 ( 0.0) 0 ( 0.0) 0 ( 0.0) 0 ( 0.0) 0 ( 0.0) 0 ( 0.0) 0 ( 0.0) 0 ( 0.0)
Influvac 1 ( 0.0) 1 ( 0.1) 1 ( 0.2) 0 ( 0.0) 1 ( 0.4) 0 ( 0.0) 0 ( 0.0) 0 ( 0.0) 0 ( 0.0)
Influvac Tetra 13 ( 0.6) 6 ( 0.7) 6 ( 0.9) 5 ( 1.5) 0 ( 0.0) 0 ( 0.0) 0 ( 0.0) 0 ( 0.0) 7 ( 0.5)
Vaxigrip Tetra 90 ( 4.0) 29 ( 3.5) 24 ( 3.8) 15 ( 4.6) 9 ( 3.3) 5 ( 2.5) 1 ( 1.0) 0 ( 0.0) 61 ( 4.3)
Unknown 7 ( 0.3) 2 ( 0.2) 2 ( 0.3) 0 ( 0.0) 0 ( 0.0) 0 ( 0.0) 0 ( 0.0) 0 ( 0.0) 5 ( 0.4)
Vaccine type
aTIV 4 ( 0.2) 0 ( 0.0) 0 ( 0.0) 0 ( 0.0) 0 ( 0.0) 0 ( 0.0) 0 ( 0.0) 0 ( 0.0) 4 ( 0.3)
LAIV 0 ( 0.0) 0 ( 0.0) 0 ( 0.0) 0 ( 0.0) 0 ( 0.0) 0 ( 0.0) 0 ( 0.0) 0 ( 0.0) 0 ( 0.0)
QIVc 21 ( 0.9) 4 ( 0.5) 4 ( 0.6) 2 ( 0.6) 1 ( 0.4) 0 ( 0.0) 0 ( 0.0) 0 ( 0.0) 17 ( 1.2)
QIVe 156 ( 6.9) 45 ( 5.4) 38 ( 6.0) 26 ( 8.0) 11 ( 4.1) 7 ( 3.5) 2 ( 1.9) 1 ( 25.0) 111 ( 7.9)
TIV 3 ( 0.1) 1 ( 0.1) 1 ( 0.2) 0 ( 0.0) 1 ( 0.4) 0 ( 0.0) 0 ( 0.0) 0 ( 0.0) 2 ( 0.1)
Unknown 7 ( 0.3) 2 ( 0.2) 2 ( 0.3) 0 ( 0.0) 0 ( 0.0) 0 ( 0.0) 0 ( 0.0) 0 ( 0.0) 5 ( 0.4)
Unvaccinated 2054 (91.7) 786 (93.8) 592 (92.9) 295 (91.3) 256 (95.2) 194 (96.5) 103 (98.1) 3 ( 75.0) 1268 (90.4)
Study site
CIRI_GP 524 (23.3) 106 (12.6) 70 (11.0) 44 (13.6) 26 ( 9.7) 36 (17.9) 27 (25.7) 4 (100.0) 418 (29.7)
ISS 863 (38.4) 330 (39.4) 228 (35.8) 108 (33.4) 106 (39.4) 102 (50.7) 26 (24.8) 0 ( 0.0) 533 (37.9)
MUV 673 (30.0) 360 (43.0) 308 (48.4) 171 (52.9) 137 (50.9) 52 (25.9) 52 (49.5) 0 ( 0.0) 313 (22.2)
RCGP RSC 185 ( 8.2) 42 ( 5.0) 31 ( 4.9) 0 ( 0.0) 0 ( 0.0) 11 ( 5.5) 0 ( 0.0) 0 ( 0.0) 143 (10.2)
*presented for females only
Site-specific population characteristics, site-specific distribution of ILI/SARI over time and site-specific distribution of covariates and setting-specific population characteristics for
each vaccine exposure are provided in the WebANNEX.

777363 – DRIVE – WP7 – IVE report, Season 2019/20
37
Table 9. Study population characteristics, ≥ 65, primary care TND studies, 2019/20
Characteristic All n (%) Cases n (%) Controls n (%) All A A/H1N1 A/H3N2 B B Vict B Yam
Total 347 65 56 14 37 9 4 0 ( 0.0) 282
Sex
Female 192 (55.3) 37 (56.9) 31 (55.4) 9 (64.3) 19 (51.4) 6 (66.7) 2 (50.0) 0 ( 0.0) 155 (55.0)
Male 155 (44.7) 28 (43.1) 25 (44.6) 5 (35.7) 18 (48.6) 3 (33.3) 2 (50.0) 0 ( 0.0) 127 (45.0)
At least 1 chronic condition
Yes 256 (73.8) 39 (60.0) 32 (57.1) 6 (42.9) 24 (64.9) 7 (77.8) 3 (75.0) 0 ( 0.0) 217 (77.0)
No 89 (25.6) 24 (36.9) 22 (39.3) 6 (42.9) 13 (35.1) 2 (22.2) 1 (25.0) 0 ( 0.0) 65 (23.0)
Unknown 2 ( 0.6) 2 ( 3.1) 2 ( 3.6) 2 (14.3) 0 ( 0.0) 0 ( 0.0) 0 ( 0.0) 0 ( 0.0) 0 ( 0.0)
Number of GP visits in the previous 12 months
0 18 ( 5.2) 3 ( 4.6) 2 ( 3.6) 0 ( 0.0) 2 ( 5.4) 1 (11.1) 1 (25.0) 0 ( 0.0) 15 ( 5.3)
1 - 5 146 (42.1) 22 (33.8) 17 (30.4) 4 (28.6) 11 (29.7) 5 (55.6) 3 (75.0) 0 ( 0.0) 124 (44.0)
> 5 75 (21.6) 15 (23.1) 13 (23.2) 3 (21.4) 10 (27.0) 2 (22.2) 0 ( 0.0) 0 ( 0.0) 60 (21.3)
Unknown 108 (31.1) 25 (38.5) 24 (42.9) 7 (50.0) 14 (37.8) 1 (11.1) 0 ( 0.0) 0 ( 0.0) 83 (29.4)
Number of hospitalizations in the previous 12 months
0 231 (66.6) 35 (53.8) 28 (50.0) 6 (42.9) 20 (54.1) 7 (77.8) 3 (75.0) 0 ( 0.0) 196 (69.5)
1 - 2 30 ( 8.6) 4 ( 6.2) 3 ( 5.4) 1 ( 7.1) 2 ( 5.4) 1 (11.1) 1 (25.0) 0 ( 0.0) 26 ( 9.2)
> 2 3 ( 0.9) 0 ( 0.0) 0 ( 0.0) 0 ( 0.0) 0 ( 0.0) 0 ( 0.0) 0 ( 0.0) 0 ( 0.0) 3 ( 1.1)
Unknown 83 (23.9) 26 (40.0) 25 (44.6) 7 (50.0) 15 (40.5) 1 (11.1) 0 ( 0.0) 0 ( 0.0) 57 (20.2)
Influenza vaccination status in current season
Vaccinated 209 (60.2) 36 (55.4) 31 (55.4) 6 (42.9) 21 (56.8) 5 (55.6) 2 (50.0) 0 ( 0.0) 173 (61.3)
Vaccine brand
Agrippal 2 ( 0.6) 0 ( 0.0) 0 ( 0.0) 0 ( 0.0) 0 ( 0.0) 0 ( 0.0) 0 ( 0.0) 0 ( 0.0) 2 ( 0.7)
Fluad 88 (25.4) 17 (26.2) 15 (26.8) 2 (14.3) 10 (27.0) 2 (22.2) 0 ( 0.0) 0 ( 0.0) 71 (25.2)
Fluarix Tetra 52 (15.0) 6 ( 9.2) 5 ( 8.9) 0 ( 0.0) 4 (10.8) 1 (11.1) 1 (25.0) 0 ( 0.0) 46 (16.3)
Flucelvax Tetra 6 ( 1.7) 0 ( 0.0) 0 ( 0.0) 0 ( 0.0) 0 ( 0.0) 0 ( 0.0) 0 ( 0.0) 0 ( 0.0) 6 ( 2.1)
Fluenz Tetra 0 ( 0.0) 0 ( 0.0) 0 ( 0.0) 0 ( 0.0) 0 ( 0.0) 0 ( 0.0) 0 ( 0.0) 0 ( 0.0) 0 ( 0.0)
Influvac 0 ( 0.0) 0 ( 0.0) 0 ( 0.0) 0 ( 0.0) 0 ( 0.0) 0 ( 0.0) 0 ( 0.0) 0 ( 0.0) 0 ( 0.0)

777363 – DRIVE – WP7 – IVE report, Season 2019/20
38
Characteristic All n (%) Cases n (%) Controls n (%) All A A/H1N1 A/H3N2 B B Vict B Yam
Influvac Tetra 10 ( 2.9) 3 ( 4.6) 2 ( 3.6) 2 (14.3) 0 ( 0.0) 1 (11.1) 1 (25.0) 0 ( 0.0) 7 ( 2.5)
Vaxigrip Tetra 46 (13.3) 9 (13.8) 8 (14.3) 1 ( 7.1) 7 (18.9) 1 (11.1) 0 ( 0.0) 0 ( 0.0) 37 (13.1)
Unknown 5 ( 1.4) 1 ( 1.5) 1 ( 1.8) 1 ( 7.1) 0 ( 0.0) 0 ( 0.0) 0 ( 0.0) 0 ( 0.0) 4 ( 1.4)
Vaccine type
aTIV 88 (25.4) 17 (26.2) 15 (26.8) 2 (14.3) 10 (27.0) 2 (22.2) 0 ( 0.0) 0 ( 0.0) 71 (25.2)
LAIV 0 ( 0.0) 0 ( 0.0) 0 ( 0.0) 0 ( 0.0) 0 ( 0.0) 0 ( 0.0) 0 ( 0.0) 0 ( 0.0) 0 ( 0.0)
QIVc 6 ( 1.7) 0 ( 0.0) 0 ( 0.0) 0 ( 0.0) 0 ( 0.0) 0 ( 0.0) 0 ( 0.0) 0 ( 0.0) 6 ( 2.1)
QIVe 108 (31.1) 18 (27.7) 15 (26.8) 3 (21.4) 11 (29.7) 3 (33.3) 2 (50.0) 0 ( 0.0) 90 (31.9)
TIV 2 ( 0.6) 0 ( 0.0) 0 ( 0.0) 0 ( 0.0) 0 ( 0.0) 0 ( 0.0) 0 ( 0.0) 0 ( 0.0) 2 ( 0.7)
Unknown 5 ( 1.4) 1 ( 1.5) 1 ( 1.8) 1 ( 7.1) 0 ( 0.0) 0 ( 0.0) 0 ( 0.0) 0 ( 0.0) 4 ( 1.4)
Unvaccinated 138 (39.8) 29 (44.6) 25 (44.6) 8 (57.1) 16 (43.2) 4 (44.4) 2 (50.0) 0 ( 0.0) 109 (38.7)
Study site
CIRI-GP 146 (42.1) 10 (15.4) 8 (14.3) 1 ( 7.1) 7 (18.9) 2 (22.2) 2 (50.0) 0 ( 0.0) 136 (48.2)
ISS 119 (34.3) 30 (46.2) 24 (42.9) 6 (42.9) 16 (43.2) 6 (66.7) 2 (50.0) 0 ( 0.0) 89 (31.6)
MUV 47 (13.5) 21 (32.3) 21 (37.5) 7 (50.0) 14 (37.8) 0 ( 0.0) 0 ( 0.0) 0 ( 0.0) 26 ( 9.2)
RCGP RSC 35 (10.1) 4 ( 6.2) 3 ( 5.4) 0 ( 0.0) 0 ( 0.0) 1 (11.1) 0 ( 0.0) 0 ( 0.0) 31 (11.0)
Site-specific population characteristics, site-specific distribution of ILI/SARI over time and site-specific distribution of covariates and setting-specific population characteristics for
each vaccine exposure are provided in the WebANNEX.

777363 – DRIVE – WP7 – IVE report, Season 2019/20
39
4.3.1.2 Test-negative design studies: hospital setting
For the combined data hospital-based TND studies (included in the primary analysis), 661 cases and 731
controls were included for children 6m-17y, 331 vs. 726 for adults 18-64y, and 304 vs. 1368 for those aged
≥65y. Of all older adults ≥65y, 91.7% suffered from at least 1 chronic condition, 54.2% were male and 52.7%
were vaccinated with influenza in the current season, mostly with Fluad, Vaxigrip Tetra and Flucelvax (Table 12
and Figure 6). The majority of hospitalised adults aged 18-64y were female and had at least 1 chronic condition
(51.8% and 62.6%). Children 6m-17y and adults 18-64y were less likely to be vaccinated compared to older
adults, 4.3% and 20.9%, respectively (Table 10 and Table 11). The vaccine types used among all age groups
were primarily trivalent adjuvanted, quadrivalent inactivated egg-based, and quadrivalent inactivated cell-based
influenza vaccines. Graphical summaries of hospital-based studies and site-specific brand distribution are
provided in Figure 4-Figure 6. The distribution of the controls and laboratory-confirmed influenza infections (by
type and subtype/lineage) stratified by age group (6m-17y, 18-64 y, ≥65y) over time is given in Figure 4, showing
a much lower influenza B proportion reported among older adults with laboratory‐confirmed influenza this
season. The percentage of subjects that tested positive for influenza over time is shown in Figure 5. Comparing
the number of vaccinated subjects and distribution of vaccine brands of the hospital based TND studies with
those of the primary care based TND studies (Figure 6), shows that from some brands information was
predominantly collected within one type of health care setting (e.g. information on Agrippal was mainly collected
in hospital based studies, Fluarix Tetra in primary care based studies, and was restricted geographically). Site-
specific population characteristics, distribution of ILI/SARI over time, distribution of covariates and setting-
specific population characteristics for each vaccine exposure are provided in the WebANNEX. For Spain VHUH
and Spain GTPUH, the data collection followed a matched 1:1 case-control design, where information on
exposure and covariates was obtained only for controls that could be matched to a case by epidemiological
week (same or adjacent week) and age group (6m–17y, 18-64y, and 65-74 and 75+y). Additionally, Spain
GTPUH matched for sex. All other studies used an unmatched design.

777363 – DRIVE – WP7 – IVE report, Season 2019/20
40
Table 10. Study population characteristics, 6m - 17y, hospital TND studies, 2019/20
Characteristic All n (%) Cases n (%) Controls n (%) All A A/H1N1 A/H3N2 B B Vict B Yam
Total 1392 661 382 132 213 281 208 0 731
Sex
Female 621 (44.6) 295 (44.6) 166 (43.5) 52 (39.4) 93 (43.7) 130 (46.3) 92 (44.2) 0 (0) 326 (44.6)
Male 771 (55.3) 366 (55.4) 216 (56.5) 80 (60.6) 120 (56.3) 151 (53.7) 116 (55.8) 0 ( 0.0) 405 (55.3)
At least 1 chronic condition
Yes 191 (13.7) 103 (15.6) 56 (14.7) 16 (12.1) 32 (15.0) 48 (17.1) 29 (13.9) 0 ( 0.0) 88 (12.0)
No 1201 (86.3) 558 (84.4) 326 (85.3) 116 (87.9) 181 (85.0) 233 (82.9) 179 (86.1) 0 (0) 643 (88.0)
Pregnancy*
Yes 3 ( 0.5)
3 ( 1.0)
2 ( 1.2)
0 ( 0.0)
1 ( 1.1)
1 ( 0.8)
1 ( 1.1)
0 ( 0.0)
0 ( 0.0)
No 139 ( 22.3) 83 ( 28.1) 34 ( 20.5) 12 ( 23.1) 15 ( 16.1) 50 ( 38.5) 45 ( 48.9) 0 ( 0.0)
56 ( 17.1)
Unknown 480 (77.2) 209 (70.8) 130 (78.3) 40 ( 76.9) 77 ( 82.8) 79 ( 60.8) 46 ( 50.0) 0 ( 0.0)
271 (82.9)
Number of GP visits in the previous 12 months
0 49 ( 3.5) 38 ( 5.7) 15 ( 3.9) 4 ( 3.0) 9 ( 4.2) 23 ( 8.2) 10 ( 4.8) 0 ( 0.0) 11 ( 1.5)
1 - 5 209 (15.0) 117 (17.7) 58 (15.2) 14 (10.6) 27 (12.7) 59 (21.0) 13 ( 6.2) 0 ( 0.0) 92 (12.6)
> 5 38 ( 2.7) 14 ( 2.1) 10 ( 2.6) 2 ( 1.5) 3 ( 1.4) 4 ( 1.4) 3 ( 1.4) 0 ( 0.0) 24 ( 3.3)
Unknown 1096 (78.7) 492 (74.4) 299 (78.3) 112 (84.8) 174 (81.7) 195 (69.4) 182 (87.5) 0 (0) 604 (82.6)
Number of hospitalizations in the previous 12 months
0 381 (27.4) 225 (34.0) 118 (30.9) 42 (31.8) 62 (29.1) 108 (38.4) 102 (49.0) 0 (0) 156 (21.3)
1 - 2 248 (17.8) 136 (20.6) 70 (18.3) 31 (23.5) 34 (16.0) 66 (23.5) 55 (26.4) 0 ( 0.0) 112 (15.3)
> 2 66 ( 4.7) 35 ( 5.3) 10 ( 2.6) 4 ( 3.0) 5 ( 2.3) 26 ( 9.3) 17 ( 8.2) 0 ( 0.0) 31 ( 4.2)
Unknown 697 (50.1) 265 (40.1) 184 (48.2) 55 (41.7) 112 (52.6) 81 (28.8) 34 (16.3) 0 ( 0.0) 432 (59.0)
Influenza vaccination status in current season
Vaccinated 60 ( 4.3) 22 ( 3.3) 18 ( 4.7) 3 ( 2.3) 12 ( 5.6) 4 ( 1.4) 4 ( 1.9) 0 (0) 38 ( 5.2)
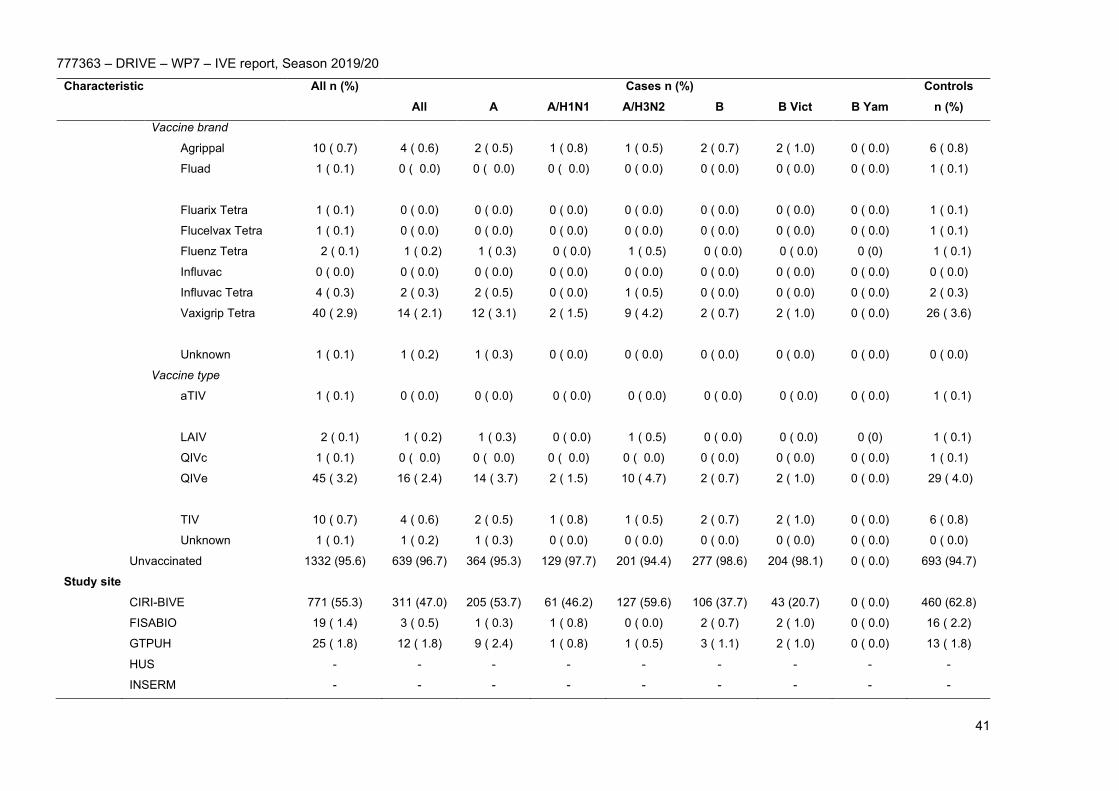
777363 – DRIVE – WP7 – IVE report, Season 2019/20
41
Characteristic All n (%) Cases n (%) Controls n (%) All A A/H1N1 A/H3N2 B B Vict B Yam
Vaccine brand
Agrippal 10 ( 0.7) 4 ( 0.6) 2 ( 0.5) 1 ( 0.8) 1 ( 0.5) 2 ( 0.7) 2 ( 1.0) 0 ( 0.0) 6 ( 0.8)
Fluad 1 ( 0.1)
0 ( 0.0)
0 ( 0.0)
0 ( 0.0)
0 ( 0.0)
0 ( 0.0)
0 ( 0.0)
0 ( 0.0)
1 ( 0.1)
Fluarix Tetra 1 ( 0.1) 0 ( 0.0) 0 ( 0.0) 0 ( 0.0) 0 ( 0.0) 0 ( 0.0) 0 ( 0.0) 0 ( 0.0) 1 ( 0.1)
Flucelvax Tetra 1 ( 0.1) 0 ( 0.0) 0 ( 0.0) 0 ( 0.0) 0 ( 0.0) 0 ( 0.0) 0 ( 0.0) 0 ( 0.0) 1 ( 0.1)
Fluenz Tetra 2 ( 0.1) 1 ( 0.2) 1 ( 0.3) 0 ( 0.0) 1 ( 0.5) 0 ( 0.0) 0 ( 0.0) 0 (0) 1 ( 0.1)
Influvac 0 ( 0.0) 0 ( 0.0) 0 ( 0.0) 0 ( 0.0) 0 ( 0.0) 0 ( 0.0) 0 ( 0.0) 0 ( 0.0) 0 ( 0.0)
Influvac Tetra 4 ( 0.3) 2 ( 0.3) 2 ( 0.5) 0 ( 0.0) 1 ( 0.5) 0 ( 0.0) 0 ( 0.0) 0 ( 0.0) 2 ( 0.3)
Vaxigrip Tetra 40 ( 2.9)
14 ( 2.1) 12 ( 3.1) 2 ( 1.5)
9 ( 4.2)
2 ( 0.7)
2 ( 1.0)
0 ( 0.0)
26 ( 3.6)
Unknown 1 ( 0.1) 1 ( 0.2) 1 ( 0.3) 0 ( 0.0) 0 ( 0.0) 0 ( 0.0) 0 ( 0.0) 0 ( 0.0) 0 ( 0.0)
Vaccine type
aTIV 1 ( 0.1)
0 ( 0.0)
0 ( 0.0)
0 ( 0.0)
0 ( 0.0)
0 ( 0.0)
0 ( 0.0)
0 ( 0.0)
1 ( 0.1)
LAIV 2 ( 0.1) 1 ( 0.2) 1 ( 0.3) 0 ( 0.0) 1 ( 0.5) 0 ( 0.0) 0 ( 0.0) 0 (0) 1 ( 0.1)
QIVc 1 ( 0.1) 0 ( 0.0) 0 ( 0.0) 0 ( 0.0) 0 ( 0.0) 0 ( 0.0) 0 ( 0.0) 0 ( 0.0) 1 ( 0.1)
QIVe 45 ( 3.2)
16 ( 2.4) 14 ( 3.7) 2 ( 1.5)
10 ( 4.7) 2 ( 0.7)
2 ( 1.0)
0 ( 0.0)
29 ( 4.0)
TIV 10 ( 0.7) 4 ( 0.6) 2 ( 0.5) 1 ( 0.8) 1 ( 0.5) 2 ( 0.7) 2 ( 1.0) 0 ( 0.0) 6 ( 0.8)
Unknown 1 ( 0.1) 1 ( 0.2) 1 ( 0.3) 0 ( 0.0) 0 ( 0.0) 0 ( 0.0) 0 ( 0.0) 0 ( 0.0) 0 ( 0.0)
Unvaccinated 1332 (95.6) 639 (96.7) 364 (95.3) 129 (97.7) 201 (94.4) 277 (98.6) 204 (98.1) 0 ( 0.0) 693 (94.7)
Study site
CIRI-BIVE 771 (55.3) 311 (47.0) 205 (53.7) 61 (46.2) 127 (59.6) 106 (37.7) 43 (20.7) 0 ( 0.0) 460 (62.8)
FISABIO 19 ( 1.4) 3 ( 0.5) 1 ( 0.3) 1 ( 0.8) 0 ( 0.0) 2 ( 0.7) 2 ( 1.0) 0 ( 0.0) 16 ( 2.2)
GTPUH 25 ( 1.8) 12 ( 1.8) 9 ( 2.4) 1 ( 0.8) 1 ( 0.5) 3 ( 1.1) 2 ( 1.0) 0 ( 0.0) 13 ( 1.8)
HUS - - - - - - - - -
INSERM - - - - - - - - -

777363 – DRIVE – WP7 – IVE report, Season 2019/20
42
Characteristic All n (%) Cases n (%) Controls n (%) All A A/H1N1 A/H3N2 B B Vict B Yam
LPUH - - - - - - - - -
NIID 499 (35.8) 296 (44.8) 145 (38.0) 54 (40.9) 80 (37.6) 153 (54.4) 148 (71.2) 0 (0) 203 (27.8)
VHUH 78 ( 5.6) 39 ( 5.9) 22 ( 5.8) 15 (11.4) 5 ( 2.3) 17 ( 6.0) 13 ( 6.2) 0 ( 0.0) 39 ( 5.3)
*presented for females only
Site-specific population characteristics, site-specific distribution of ILI/SARI over time and site-specific distribution of covariates and setting-specific population characteristics for
each vaccine exposure are provided in the WebANNEX.
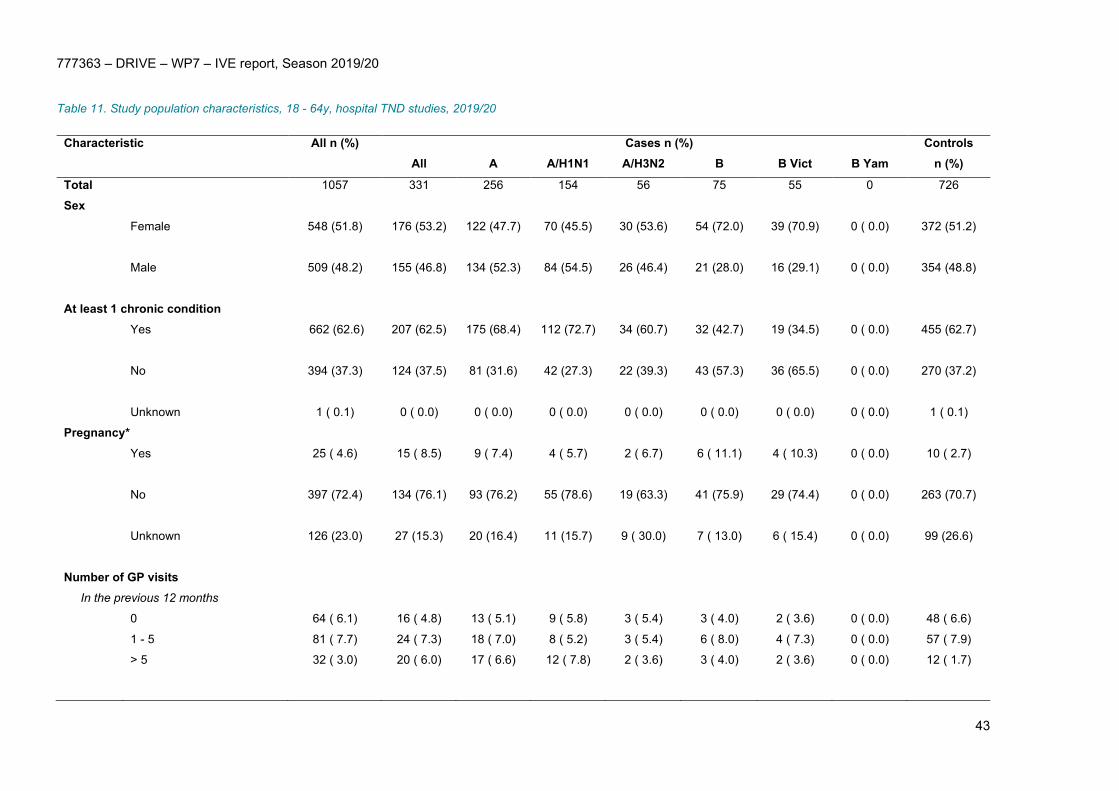
777363 – DRIVE – WP7 – IVE report, Season 2019/20
43
Table 11. Study population characteristics, 18 - 64y, hospital TND studies, 2019/20
Characteristic
All n (%)
Cases n (%) Controls n (%) All A A/H1N1 A/H3N2 B B Vict B Yam
Total 1057 331 256 154 56 75 55 0 726
Sex
Female 548 (51.8) 176 (53.2) 122 (47.7) 70 (45.5) 30 (53.6) 54 (72.0) 39 (70.9) 0 ( 0.0)
372 (51.2)
Male 509 (48.2) 155 (46.8) 134 (52.3) 84 (54.5) 26 (46.4) 21 (28.0) 16 (29.1) 0 ( 0.0)
354 (48.8)
At least 1 chronic condition
Yes 662 (62.6) 207 (62.5) 175 (68.4) 112 (72.7) 34 (60.7) 32 (42.7) 19 (34.5) 0 ( 0.0)
455 (62.7)
No 394 (37.3) 124 (37.5) 81 (31.6) 42 (27.3) 22 (39.3) 43 (57.3) 36 (65.5) 0 ( 0.0)
270 (37.2)
Unknown 1 ( 0.1) 0 ( 0.0) 0 ( 0.0) 0 ( 0.0) 0 ( 0.0) 0 ( 0.0) 0 ( 0.0) 0 ( 0.0) 1 ( 0.1)
Pregnancy*
Yes 25 ( 4.6)
15 ( 8.5) 9 ( 7.4) 4 ( 5.7)
2 ( 6.7)
6 ( 11.1)
4 ( 10.3)
0 ( 0.0)
10 ( 2.7)
No 397 (72.4) 134 (76.1) 93 (76.2) 55 (78.6) 19 (63.3) 41 (75.9) 29 (74.4) 0 ( 0.0)
263 (70.7)
Unknown 126 (23.0) 27 (15.3) 20 (16.4) 11 (15.7) 9 ( 30.0) 7 ( 13.0) 6 ( 15.4) 0 ( 0.0)
99 (26.6)
Number of GP visits In the previous 12 months
0 64 ( 6.1) 16 ( 4.8) 13 ( 5.1) 9 ( 5.8) 3 ( 5.4) 3 ( 4.0) 2 ( 3.6) 0 ( 0.0) 48 ( 6.6)
1 - 5 81 ( 7.7) 24 ( 7.3) 18 ( 7.0) 8 ( 5.2) 3 ( 5.4) 6 ( 8.0) 4 ( 7.3) 0 ( 0.0) 57 ( 7.9)
> 5 32 ( 3.0) 20 ( 6.0) 17 ( 6.6) 12 ( 7.8) 2 ( 3.6) 3 ( 4.0) 2 ( 3.6) 0 ( 0.0) 12 ( 1.7)

777363 – DRIVE – WP7 – IVE report, Season 2019/20
44
Characteristic
All n (%)
Cases n (%) Controls n (%) All A A/H1N1 A/H3N2 B B Vict B Yam
In the previous 3 months**
0 45 ( 4.3) 19 ( 5.7) 14 ( 5.5) 10 ( 6.5) 0 ( 0.0) 5 ( 6.7)
1 ( 1.8)
0 ( 0.0) 26 ( 3.6)
1 - 2 49 ( 4.6) 10 ( 3.0) 9 ( 3.5) 7 ( 4.5)
0 ( 0.0) 1 ( 1.3)
0 ( 0.0) 0 ( 0.0) 39 ( 5.4)
> 2 39 ( 3.7) 8 ( 2.4) 5 ( 2.0)
4 ( 2.6)
1 ( 1.8) 3 ( 4.0)
0 ( 0.0) 0 ( 0.0) 31 ( 4.3)
Unknown 747 (70.7) 234 (70.7) 180 (70.3) 104 (67.5) 47 (83.9) 54 (72.0) 46 (83.6) 0 ( 0.0) 513 (70.7)
Number of hospitalizations in the previous 12 months
0 501 (47.4) 158 (47.7) 115 (44.9) 68 (44.2) 22 (39.3) 43 (57.3) 32 (58.2) 0 ( 0.0) 343 (47.2)
1 - 2 275 (26.0) 104 (31.4) 83 (32.4) 51 (33.1) 16 (28.6) 21 (28.0) 15 (27.3) 0 ( 0.0) 171 (23.6)
> 2 63 ( 6.0) 13 ( 3.9) 11 ( 4.3) 8 ( 5.2) 1 ( 1.8) 2 ( 2.7) 1 ( 1.8) 0 ( 0.0) 50 ( 6.9)
Unknown 218 (20.6) 56 (16.9) 47 (18.4) 27 (17.5) 17 (30.4) 9 (12.0) 7 (12.7) 0 ( 0.0) 162 (22.3)
Influenza vaccination status in current season
Vaccinated 221 (20.9) 50 (15.1) 37 (14.5) 21 (13.6) 9 (16.1)
13 (17.3) 9 (16.4)
0 ( 0.0)
171 (23.6)
Vaccine brand
Agrippal 43 ( 4.1)
14 ( 4.2) 12 ( 4.7) 5 ( 3.2)
1 ( 1.8)
2 ( 2.7)
2 ( 3.6)
0 ( 0.0)
29 ( 4.0)
Fluad 2 ( 0.2) 0 ( 0.0) 0 ( 0.0) 0 ( 0.0) 0 ( 0.0) 0 ( 0.0) 0 ( 0.0) 0 ( 0.0) 2 ( 0.3)
Fluarix Tetra 19 ( 1.8) 4 ( 1.2) 4 ( 1.6) 2 ( 1.3) 2 ( 3.6) 0 ( 0.0) 0 ( 0.0) 0 ( 0.0) 15 ( 2.1)
Flucelvax Tetra 45 ( 4.3) 3 ( 0.9) 2 ( 0.8) 1 ( 0.6) 1 ( 1.8) 1 ( 1.3) 1 ( 1.8) 0 ( 0.0) 42 ( 5.8)
Fluenz Tetra - - - - - - - - -
Influvac 2 ( 0.2) 0 ( 0.0) 0 ( 0.0) 0 ( 0.0) 0 ( 0.0) 0 ( 0.0) 0 ( 0.0) 0 ( 0.0) 2 ( 0.3)
Influvac Tetra 37 ( 3.5) 11 ( 3.3) 6 ( 2.3) 4 ( 2.6) 2 ( 3.6) 5 ( 6.7) 2 ( 3.6) 0 ( 0.0) 26 ( 3.6)
Vaxigrip Tetra 72 ( 6.8) 18 ( 5.4) 13 ( 5.1) 9 ( 5.8) 3 ( 5.4) 5 ( 6.7) 4 ( 7.3) 0 ( 0.0) 54 ( 7.4)
Unknown 1 ( 0.1) 0 ( 0.0) 0 ( 0.0) 0 ( 0.0) 0 ( 0.0) 0 ( 0.0) 0 ( 0.0) 0 ( 0.0) 1 ( 0.1)
Vaccine type

777363 – DRIVE – WP7 – IVE report, Season 2019/20
45
Characteristic
All n (%)
Cases n (%) Controls n (%) All A A/H1N1 A/H3N2 B B Vict B Yam
aTIV 2 ( 0.2) 0 ( 0.0) 0 ( 0.0) 0 ( 0.0) 0 ( 0.0) 0 ( 0.0) 0 ( 0.0) 0 ( 0.0) 2 ( 0.3)
LAIV - - - - - - - - -
QIVc 45 ( 4.3) 3 ( 0.9) 2 ( 0.8) 1 ( 0.6) 1 ( 1.8) 1 ( 1.3) 1 ( 1.8) 0 ( 0.0) 42 ( 5.8)
QIVe 128 (12.1) 33 (10.0) 23 ( 9.0) 15 ( 9.7) 7 (12.5) 10 (13.3) 6 (10.9) 0 ( 0.0) 95 (13.1)
TIV 45 ( 4.3) 14 ( 4.2) 12 ( 4.7) 5 ( 3.2) 1 ( 1.8) 2 ( 2.7) 2 ( 3.6) 0 ( 0.0) 31 ( 4.3)
Unknown 1 ( 0.1) 0 ( 0.0) 0 ( 0.0) 0 ( 0.0) 0 ( 0.0) 0 ( 0.0) 0 ( 0.0) 0 ( 0.0) 1 ( 0.1)
Unvaccinated 836 (79.1) 281 (84.9) 219 (85.5) 133 (86.4) 47 (83.9) 62 (82.7) 46 (83.6) 0 ( 0.0)
555 (76.4)
Study site
CIRI-BIVE 296 (28.0) 73 (22.1) 64 (25.0) 36 (23.4) 23 (41.1) 9 (12.0)
7 (12.7)
0 ( 0.0) 223 (30.7)
FISABIO 157 (14.9) 20 ( 6.0) 18 ( 7.0) 14 ( 9.1) 1 ( 1.8) 2 ( 2.7) 2 ( 3.6)
0 ( 0.0) 137 (18.9)
GTPUH 68 ( 6.4) 32 ( 9.7) 25 ( 9.8) 17 (11.0) 3 ( 5.4) 7 ( 9.3)
4 ( 7.3)
0 ( 0.0) 36 ( 5.0)
HUS 56 ( 5.3) 15 ( 4.5) 14 ( 5.5) 14 ( 9.1) 0 ( 0.0) 1 ( 1.3)
1 ( 1.8)
0 ( 0.0) 41 ( 5.6)
INSERM 134 (12.7) 37 (11.2) 28 (10.9) 21 (13.6) 1 ( 1.8) 9 (12.0)
1 ( 1.8)
0 ( 0.0) 97 (13.4)
LPUH 15 ( 1.4)
11 ( 3.3) 9 ( 3.5) 6 ( 3.9)
0 ( 0.0)
2 ( 2.7)
2 ( 3.6)
0 ( 0.0)
4 ( 0.6)
NIID 221 (20.9) 84 (25.4) 50 (19.5) 16 (10.4) 23 (41.1) 34 (45.3) 30 (54.5) 0 ( 0.0) 137 (18.9) VHUH 110 (10.4) 59 (17.8) 48 (18.8) 30 (19.5) 5 ( 8.9) 11 (14.7) 8 (14.5)
0 ( 0.0) 51 ( 7.0)
*presented for females only
**for INSERM, only the number of GP visits in the previous 3 months was available. This variable was categorized as “0”, “1 to 2” and “more than 2”.
Site-specific population characteristics, site-specific distribution of ILI/SARI over time and site-specific distribution of covariates and setting-specific population characteristics for
each vaccine exposure are provided in the WebANNEX.

777363 – DRIVE – WP7 – IVE report, Season 2019/20
46
Table 12. Study population characteristics, ≥ 65y, hospital TND studies, 2019/20
Characteristic All n (%) Cases n (%) Controls n (%) All A A/H1N1 A/H3N2 B B Vict B Yam
Total 1672 304 271 151 80 34 18 2 1368 Sex Female 765 (45.8)
147
127 (46.9) 70 (46.4) 37 (46.2) 21 (61.8) 10 (55.6) 0 ( 0.0) 618 (45.2) Male 907 (54.2)
157
144 (53.1) 81 (53.6) 43 (53.8) 13 (38.2) 8 (44.4) 2 (100.0) 750 (54.8) At least 1 chronic condition Yes 1534 (91.7) 285
255 (94.1) 144
74 (92.5) 31 (91.2) 15 (83.3) 2 (100.0) 1249 (91.3) No 138 ( 8.3) 19 ( 6.2) 16 ( 5.9) 7 ( 4.6) 6 ( 7.5) 3 ( 8.8) 3 (16.7) 0 ( 0.0) 119 ( 8.7)
Number of GP visits In the previous 12 months*
0 121 ( 7.2)
19 ( 6.2) 17 ( 6.3)
6 ( 4.0)
10 (12.5) 2 ( 5.9)
1 ( 5.6) 1 ( 50.0) 102 ( 7.5)
1 - 5 201 (12.0)
28 ( 9.2) 27 (10.0) 12 ( 7.9) 6 ( 7.5) 1 ( 2.9) 0 ( 0.0) 0 ( 0.0) 173 (12.6) > 5 100 ( 6.0)
33 (10.9) 31 (11.4) 18 (11.9) 9 (11.2) 3 ( 8.8) 1 ( 5.6) 0 ( 0.0) 67 ( 4.9) In the previous 3 months*
0 40 ( 2.4)
11 ( 3.6) 8 ( 3.0) 4 ( 2.6) 2 ( 2.5) 3 ( 8.8) 1 ( 5.6) 0 ( 0.0) 29 ( 2.1)
1 - 2 114 ( 6.8)
25 ( 8.2) 20 ( 7.4) 13 ( 8.6) 5 ( 6.2) 5 (14.7) 0 ( 0.0) 1 ( 50.0) 89 ( 6.5)
> 2 89 ( 5.3)
8 ( 2.6) 7 ( 2.6) 4 ( 2.6) 2 ( 2.5) 1 ( 2.9) 0 ( 0.0) 0 ( 0.0) 81 ( 5.9)
Unknown 1007 (60.2)
180
161 (59.4) 94 (62.3) 46 (57.5) 19 (55.9) 15 (83.3) 0 ( 0.0) 827 (60.5) Number of hospitalizations in the previous 12 months
0 830 (49.6) 153
(50.3)
136 (50.2) 79 (52.3) 35 (43.8) 18 (52.9) 7 (38.9) 2 (100.0) 677 (49.5)
1 - 2 496 (29.7) 80 (26.3) 69 (25.5) 41 (27.2) 15 (18.8) 11 (32.4) 7 (38.9) 0 ( 0.0) 416 (30.4)
> 2 134 ( 8.0) 17 ( 5.6) 15 ( 5.5) 6 ( 4.0) 5 ( 6.2) 2 ( 5.9) 2 (11.1) 0 ( 0.0) 117 ( 8.6)
Unknown 212 (12.7) 54 (17.8) 51 (18.8) 25 (16.6) 25 (31.2) 3 ( 8.8) 2 (11.1) 0 ( 0.0) 158 (11.5)
Influenza vaccination status in current season

777363 – DRIVE – WP7 – IVE report, Season 2019/20
47
Characteristic All n (%) Cases n (%) Controls n (%) All A A/H1N1 A/H3N2 B B Vict B Yam
Vaccinated 881 (52.7) 114
(37.5)
103 (38.0) 60 (39.7) 27 (33.8) 11 (32.4) 3 (16.7) 2 (100.0) 767 (56.1)
Vaccine brand
Agrippal 1 ( 0.1) 0 ( 0.0) 0 ( 0.0) 0 ( 0.0) 0 ( 0.0) 0 ( 0.0) 0 ( 0.0) 0 ( 0.0) 1 ( 0.1)
Fluad 432 (25.8) 63 (20.7) 59 (21.8) 34 (22.5) 15 (18.8) 4 (11.8) 3 (16.7) 1 ( 50.0) 369 (27.0)
Fluarix
Tetra
68 ( 4.1) 5 ( 1.6) 5 ( 1.8) 5 ( 3.3) 0 ( 0.0) 0 ( 0.0) 0 ( 0.0) 0 ( 0.0) 63 ( 4.6)
Flucelvax
Tetra
124 ( 7.4) 8 ( 2.6) 8 ( 3.0) 5 ( 3.3) 1 ( 1.2) 0 ( 0.0) 0 ( 0.0) 0 ( 0.0) 116 ( 8.5)
Fluenz
Tetra
- - - - - - - - -
Influvac 10 ( 0.6) 2 ( 0.7) 1 ( 0.4) 0 ( 0.0) 0 ( 0.0) 1 ( 2.9) 0 ( 0.0) 0 ( 0.0) 8 ( 0.6)
Influvac
Tetra
76 ( 4.5) 9 ( 3.0) 8 ( 3.0) 3 ( 2.0) 3 ( 3.8) 1 ( 2.9) 0 ( 0.0) 1 ( 50.0) 67 ( 4.9)
Vaxigrip
Tetra
168 (10.0) 26 ( 8.6) 21 ( 7.7) 12 ( 7.9) 8 (10.0) 5 (14.7) 0 ( 0.0) 0 ( 0.0) 142 (10.4)
Unknown 2 ( 0.1) 1 ( 0.3) 1 ( 0.4) 1 ( 0.7) 0 ( 0.0) 0 ( 0.0) 0 ( 0.0) 0 ( 0.0) 1 ( 0.1)
Vaccine type
aTIV 432 (25.8) 63 (20.7) 59 (21.8) 34 (22.5) 15 (18.8) 4 (11.8) 3 (16.7) 1 ( 50.0) 369 (27.0)
LAIV - - - - - - - - -
QIVc 124 ( 7.4) 8 ( 2.6) 8 ( 3.0) 5 ( 3.3) 1 ( 1.2) 0 ( 0.0) 0 ( 0.0) 0 ( 0.0) 116 ( 8.5)
QIVe 312 (18.7) 40 (13.2) 34 (12.5) 20 (13.2) 11 (13.8) 6 (17.6) 0 ( 0.0) 1 ( 50.0) 272 (19.9)
TIV 11 ( 0.7) 2 ( 0.7) 1 ( 0.4) 0 ( 0.0) 0 ( 0.0) 1 ( 2.9) 0 ( 0.0) 0 ( 0.0) 9 ( 0.7)
Unknown 2 ( 0.1) 1 ( 0.3) 1 ( 0.4) 1 ( 0.7) 0 ( 0.0) 0 ( 0.0) 0 ( 0.0) 0 ( 0.0) 1 ( 0.1)
Unvaccinated 791 (47.3) 190
(62.5)
168 (62.0) 91 (60.3) 53 (66.2) 23 (67.6) 15 (83.3) 0 ( 0.0) 601 (43.9)
Study site
CIRI-BIVE 583 (34.9) 89 (29.3) 86 (31.7) 38 (25.2) 44 (55.0) 3 ( 8.8) 2 (11.1) 1 ( 50.0) 494 (36.1)

777363 – DRIVE – WP7 – IVE report, Season 2019/20
48
Characteristic All n (%) Cases n (%) Controls n (%) All A A/H1N1 A/H3N2 B B Vict B Yam
FISABIO 486 (29.1) 37 (12.2) 35 (12.9) 26 (17.2) 4 ( 5.0) 2 ( 5.9) 2 (11.1) 0 ( 0.0) 449 (32.8)
GTPUH 89 ( 5.3) 41 (13.5) 38 (14.0) 20 (13.2) 11 (13.8) 4 (11.8) 1 ( 5.6)
0 ( 0.0) 48 ( 3.5)
HUS 69 ( 4.1) 9 ( 3.0) 9 ( 3.3) 7 ( 4.6)
2 ( 2.5) 0 ( 0.0) 0 ( 0.0) 0 ( 0.0) 60 ( 4.4)
INSERM 246 (14.7) 44 (14.5) 35 (12.9) 21 (13.9) 9 (11.2) 9 (26.5) 1 ( 5.6)
1 ( 50.0) 202 (14.8)
LPUH 21 ( 1.3) 11 ( 3.6) 9 ( 3.3) 3 ( 2.0) 0 ( 0.0) 2 ( 5.9) 1 ( 5.6) 0 ( 0.0) 10 ( 0.7)
NIID 78 ( 4.7) 25 ( 8.2) 19 ( 7.0) 7 ( 4.6)
7 ( 8.8) 6 (17.6) 4 (22.2)
0 ( 0.0) 53 ( 3.9)
VHUH 100 ( 6.0) 48 (15.8) 40 (14.8) 29 (19.2) 3 ( 3.8) 8 (23.5) 7 (38.9) 0 ( 0.0) 52 ( 3.8)
*for INSERM, only the number of GP visits in the previous 3 months was available. This variable was categorized as “0”, “1 to 2” and “more than 2”.
Site-specific population characteristics, site-specific distribution of ILI/SARI over time and site-specific distribution of covariates and setting-specific population characteristics for
each vaccine exposure are provided in the WebANNEX.

777363 – DRIVE – WP7 – IVE report, Season 2019/20
49
Figure 4. Distribution of ILI/SARI cases over time; TND studies, 2019/20

777363 – DRIVE – WP7 – IVE report, Season 2019/20
50
Figure 5. Distribution of percentage of influenza cases among tested ILI/SARI subjects over time, TND studies, 2019/20

777363 – DRIVE – WP7 – IVE report, Season 2019/20
51
PV: proportion vaccinated; y: years
Figure 6. Number of vaccinated subjects among enrolled subjects and distribution of vaccine brands; TND studies, 2019/20

777363 – DRIVE – WP7 – IVE report, Season 2019/20
52
4.3.2 Register-based cohort study, Finland
The Finland THL register-based cohort includes children 6m-6y (100,942 person years) and older adults 65-
100y (410,911 person years). Tabular and graphical summaries of the data are provided in Table 13 and Figure
7. The season was dominated by influenza virus A (Figure 7, top left). The vaccine brands used were Fluenz
Tetra (for children 2-6 years of age) and Vaxigrip Tetra (all ages) (Figure 7, bottom left). Similar to the 2018/19
season, older adults, persons with at least one chronic condition and persons vaccinated with influenza in the
previous season were more likely to be vaccinated compared to their counterparts (Figure 7, bottom right).

777363 – DRIVE – WP7 – IVE report, Season 2019/20
53
Table 13. Study population characteristics, Finland THL register-based cohort study, 2019/20
Characteristic 6m - 6y ≥ 65y
Vaccinated Unvaccinated Vaccinated Unvaccinated Number of
influenza infections
Person years Number of influenza infections
Person years Number of influenza infections
Person years Number of influenza infections
Person years
Total 110 16,375 917 84,567 467 110,497 933 300,414
Sex
female 42 8043 409 41,224 247 62,683 518 167,943
male 68 8331 508 43,344 220 47814 415 132471
At least 1 chronic condition Yes 10 1659 98 7415 439 84,809 819 207,684
No 100 14,715 819 77,153 28 25,688 114 92,730
Number of primary care visits in the previous 12 months 0 41 6117 324 32,120 91 33,020 289 123,156
1 - 5 61 9458 522 48,192 259 62,187 480 148,183
> 5 8 799 71 4255 117 15,290 164 29,075
Number of hospitalizations in 2018 0 98 15102 833 78,764 270 89,365 576 248,566
1 -2 9 1185 74 5509 162 18,311 287 44,882
> 2 3 87 10 294 35 2821 70 6966
Influenza vaccination status in previous season
Vaccinated 70 11,683 96 17,107 371 93,229 236 95,348
Unvaccinated 40 4691 821 67,460 96 17,269 697 205,067
Vaccine brand
Any 110 16,375 - - 467 110,497 - -
Vaxigrip Tetra 25 4044 - - 451 108,124 - -
Fluenz Tetra 64 10,276 - - - - - -
Population characteristics for each vaccine exposure are provided in the WebAnnex.

777363 – DRIVE – WP7 – IVE report, Season 2019/20
54
Number of influenza cases by type, by week
Percentage of vaccinated person time, by week
Distribution of vaccine brands
Distribution of covariates among exposed and
unexposed
Figure 7. Data visualizations, Finland THL register-based cohort study, 2019/20.
4.4 Primary objective: overall IVE and IVE by brand
4.4.1 Test-negative design studies
The IVE estimates for each primary care TND study separately are given in the WebANNEX.
4.4.1.1 Pooled analysis
The pooled confounder-adjusted IVE estimates for every exposure of interest (any vaccine, by brand)
stratified by age group and healthcare setting are provided in Figure 8 to Figure 16. Wide confidence intervals

777363 – DRIVE – WP7 – IVE report, Season 2019/20
55
(with a confidence interval width > 40%) are colored light grey to emphasise that estimates with wide
confidence intervals are not considered precise. Forest plots without estimates indicate that no data was
available for that specific age group and setting. Blank squares indicate that the vaccine brand is not indicated
for use in that specific age group.
Four estimates with a narrow confidence interval are available. For children 6m-17y in the primary care
setting, IVE against any flu was 64% (95%CI 44-80) for any vaccine, 81% (95%CI 58-92) for Fluarix Tetra and
61% (95%CI 38-77) for Vaxigrip Tetra. In the hospital setting, the IVE estimate for any vaccine against
influenza A in those aged ≥65y was 53% (95%CI 35-67).
Figures with pooled crude IVE estimates and tables with pooled crude and pooled adjusted IVE estimates are
provided in the WebANNEX. To aid the interpretation of the pooled estimates, the corresponding forest plots
with the site-specific estimates are also provided in the WebANNEX.

777363 – DRIVE – WP7 – IVE report, Season 2019/20
56
Dark grey diamond: precise results (width of CI < 40%). Light grey diamond: non-precise results.
Figure 8. Any influenza vaccine: pooled confounder-adjusted (age, sex and calendar time) influenza vaccine effectiveness against laboratory confirmed influenza, overall and
per type and subtype/lineage, by setting and age group, 2019/20

777363 – DRIVE – WP7 – IVE report, Season 2019/20
57
Dark grey diamond: precise results (width of CI < 40%). Light grey diamond: non-precise results.
Figure 9. Agrippal (Seqirus): pooled confounder-adjusted (age, sex and calendar time) influenza vaccine effectiveness against laboratory confirmed influenza, overall and per
type and subtype/lineage, by setting and age group, 2019/20

777363 – DRIVE – WP7 – IVE report, Season 2019/20
58
Dark grey diamond: precise results (width of CI < 40%). Light grey diamond: non-precise results.
Figure 10. Fluad (Seqirus): pooled confounder-adjusted (age, sex and calendar time) influenza vaccine effectiveness against laboratory confirmed influenza, overall and per
type and subtype/lineage, by setting and age group, 2019/20

777363 – DRIVE – WP7 – IVE report, Season 2019/20
59
Dark grey diamond: precise results (width of CI < 40%). Light grey diamond: non-precise results.
Figure 11. Fluarix Tetra (GlaxoSmithKline): pooled confounder-adjusted (age, sex and calendar time) influenza vaccine effectiveness against laboratory confirmed influenza,
overall and per type and subtype/lineage, by setting and age group, 2019/20

777363 – DRIVE – WP7 – IVE report, Season 2019/20
60
Dark grey diamond: precise results (width of CI < 40%). Light grey diamond: non-precise results.
Figure 12. Flucelvax Tetra (Seqirus): pooled confounder-adjusted (age, sex and calendar time) influenza vaccine effectiveness against laboratory confirmed influenza, overall
and per type and subtype/lineage, by setting and age group, 2019/20

777363 – DRIVE – WP7 – IVE report, Season 2019/20
61
Dark grey diamond: precise results (width of CI < 40%). Light grey diamond: non-precise results. Only children aged 2-17y are considered to reflect the age group for which the
vaccine is licensed.
Figure 13. Fluenz Tetra (AstraZeneca): pooled confounder-adjusted (age, sex and calendar time) influenza vaccine effectiveness against laboratory confirmed influenza, overall
and per type and subtype/lineage, by setting and age group, 2019/20

777363 – DRIVE – WP7 – IVE report, Season 2019/20
62
Dark grey diamond: precise results (width of CI < 40%). Light grey diamond: non-precise results.
Figure 14. Influvac (Abbott): pooled confounder-adjusted (age, sex and calendar time) influenza vaccine effectiveness against laboratory confirmed influenza, overall and per
type and subtype/lineage, by setting and age group, 2019/20

777363 – DRIVE – WP7 – IVE report, Season 2019/20
63
Dark grey diamond: precise results (width of CI < 40%). Light grey diamond: non-precise results.
Figure 15. Influvac Tetra (Abbott): pooled confounder-adjusted (age, sex and calendar time) influenza vaccine effectiveness against laboratory confirmed influenza, overall and
per type and subtype/lineage, by setting and age group, 2019/20

777363 – DRIVE – WP7 – IVE report, Season 2019/20
64
Dark grey diamond: precise results (width of CI < 40%). Light grey diamond: non-precise results.
Figure 16. Vaxigrip Tetra (Sanofi Pasteur): pooled confounder-adjusted (age, sex and calendar time) influenza vaccine effectiveness against laboratory confirmed influenza,
overall and per type and subtype/lineage, by setting and age group, 2019/20
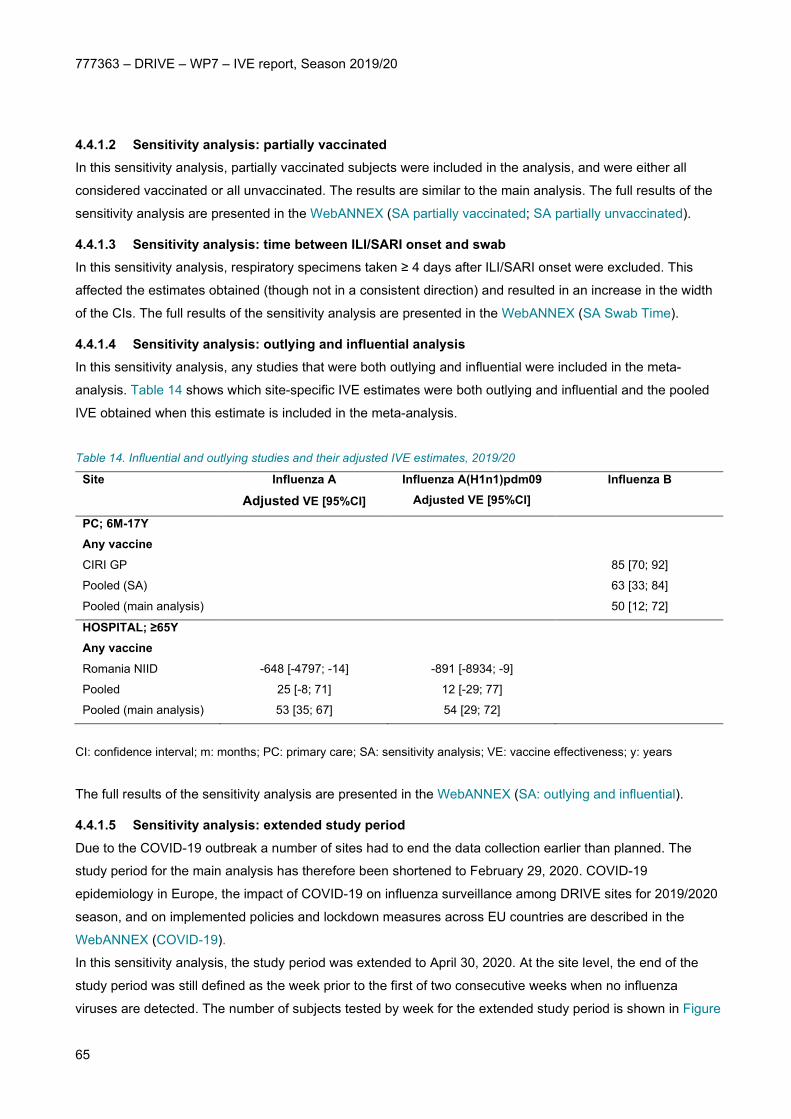
777363 – DRIVE – WP7 – IVE report, Season 2019/20
65
4.4.1.2 Sensitivity analysis: partially vaccinated In this sensitivity analysis, partially vaccinated subjects were included in the analysis, and were either all
considered vaccinated or all unvaccinated. The results are similar to the main analysis. The full results of the
sensitivity analysis are presented in the WebANNEX (SA partially vaccinated; SA partially unvaccinated).
4.4.1.3 Sensitivity analysis: time between ILI/SARI onset and swab In this sensitivity analysis, respiratory specimens taken ≥ 4 days after ILI/SARI onset were excluded. This
affected the estimates obtained (though not in a consistent direction) and resulted in an increase in the width
of the CIs. The full results of the sensitivity analysis are presented in the WebANNEX (SA Swab Time).
4.4.1.4 Sensitivity analysis: outlying and influential analysis In this sensitivity analysis, any studies that were both outlying and influential were included in the meta-
analysis. Table 14 shows which site-specific IVE estimates were both outlying and influential and the pooled
IVE obtained when this estimate is included in the meta-analysis.
Table 14. Influential and outlying studies and their adjusted IVE estimates, 2019/20
Site Influenza A
Adjusted VE [95%CI]
Influenza A(H1n1)pdm09 Adjusted VE [95%CI]
Influenza B
PC; 6M-17Y
Any vaccine
CIRI GP 85 [70; 92]
Pooled (SA) 63 [33; 84]
Pooled (main analysis) 50 [12; 72]
HOSPITAL; ≥65Y
Any vaccine
Romania NIID -648 [-4797; -14] -891 [-8934; -9]
Pooled 25 [-8; 71] 12 [-29; 77]
Pooled (main analysis) 53 [35; 67] 54 [29; 72]
CI: confidence interval; m: months; PC: primary care; SA: sensitivity analysis; VE: vaccine effectiveness; y: years
The full results of the sensitivity analysis are presented in the WebANNEX (SA: outlying and influential).
4.4.1.5 Sensitivity analysis: extended study period Due to the COVID-19 outbreak a number of sites had to end the data collection earlier than planned. The
study period for the main analysis has therefore been shortened to February 29, 2020. COVID-19
epidemiology in Europe, the impact of COVID-19 on influenza surveillance among DRIVE sites for 2019/2020
season, and on implemented policies and lockdown measures across EU countries are described in the WebANNEX (COVID-19).
In this sensitivity analysis, the study period was extended to April 30, 2020. At the site level, the end of the
study period was still defined as the week prior to the first of two consecutive weeks when no influenza
viruses are detected. The number of subjects tested by week for the extended study period is shown in Figure

777363 – DRIVE – WP7 – IVE report, Season 2019/20
66
17. All local study periods effectively ended before April 30, as no more influenza positive tests were reported
after week 12.
Figure 17. Distribution of ILI/SARI cases over time, until April 30; TND studies, 2019/20
The estimates with a CI width of <40% in the main analysis were similar in the sensitivity analysis.
Furthermore, two additional estimates with a CI width of <40% were obtained: for older adults ≥65y in hospital
setting, IVE for any vaccine against influenza A was 54% (95%CI 32-70), and IVE for Fluad against any
influenza was 52% (95%CI 29-68). The full results of the sensitivity analysis with the extended study period
(up to April 30, 2020) are presented in the WebANNEX (SA Full Season).
4.4.1.6 Sensitivity analysis: extended confounder adjustment In this sensitivity analysis, an extended set of confounders was used, that included sex, a smooth function
of age, a smooth function of calendar time, pregnancy, presence of at least one chronic condition and number
of GP visits/hospitalizations. The number of subjected included in this analysis was reduced compared to the
main analysis. The precise estimates in the main analysis are similar in this meta-analysis. Point estimates
were impacted (though not in a consistent direction). The full results of the sensitivity analysis are presented
in the WebANNEX (SA Additional Confounders).

777363 – DRIVE – WP7 – IVE report, Season 2019/20
67
4.4.2 Register-based cohort study
All IVE estimates against any influenza and influenza A from the Finland THL register-based cohort have a CI
width of less than 40% (Table 15). The IVE estimate of Fluenz Tetra is 64.3 (95%CI 53.5- 72.7) against
influenza A and in 80.4 (95%CI 55.4-91.4) against influenza B in children aged 2-6y. The IVE estimates of
Vaxigrip Tetra against influenza A are 70.6 (95%CI 54.3; 81.0) in children aged 6m-6y and 27.0 (95%CI 18.0-
35.0) in older adults aged ≥65y.
Estimates for any virus subtype/lineage include in the vaccine are not available for this data.
Table 15. Confounder-adjusted influenza vaccine effectiveness of any vaccine and by vaccine brand against any
influenza, influenza A and influenza B, Finland THL register-based cohort, 2019/20
Any influenza VE [95%CI]
A VE [95%CI]
B VE [95%CI]
6m - 6y
Any vaccine 66.3 [58.8; 72.4] 63.4 [54.9; 70.4] 75.9 [57.3; 86.4]
Vaccine brand
Vaxigrip Tetra 70.6 [56.1; 80.4] 70.6 [54.3; 81.0] 64.4 [11.6; 85.6]
Fluenz Tetra* 67.7 [58.3; 75.0] 64.3 [53.5; 72.7] 80.4 [55.4; 91.4]
≥ 65y
Any vaccine 27.7 [19.1; 35.4] 26.4 [17.5; 34.4] 63.6 [23.5; 82.7]
Vaccine brand
Vaxigrip Tetra 28.5 [19.8; 36.2] 27.0 [18.0; 35.0] 66.9 [27.9; 84.8]
*only children 2y – 6y
Influenza vaccine effectiveness estimates adjusted only for calendar time for the THL register-based cohort
study are given in the WebANNEX. These semi-crude IVE estimates are similar to the confounder-adjusted
IVE estimates.
4.5 Secondary objective: influenza vaccine effectiveness by type
Vaccine type specific IVE estimates were calculated only for vaccine types for which a minimum of two brands
were available, i.e.QIVe and TIV.
4.5.1 Test-negative design studies
The IVE estimates for each primary care TND study separately are given in the WebANNEX.

777363 – DRIVE – WP7 – IVE report, Season 2019/20
68
4.5.1.1 Pooled analysis The pooled confounder-adjusted IVE estimates by vaccine type stratified by age group and healthcare setting
are provided in Figure 18 (for QIVe) and Figure 19 (for TIV). Wide CI (with a CI width > 40%) are colored light
grey to emphasise that estimates with wide confidence intervals are not considered precise.
For QIVe, two estimates had a CI width of <40%. For children 6m-17y in primary care setting, IVE against any
influenza was 64% (95%CI 41-81) and IVE against influenza A was 58% (95%CI 34-74). None of the
estimates for TIV had a CI width of <40%. All the pooled crude and adjusted influenza vaccine effectiveness
estimates by vaccine type are provided in the WebANNEX.
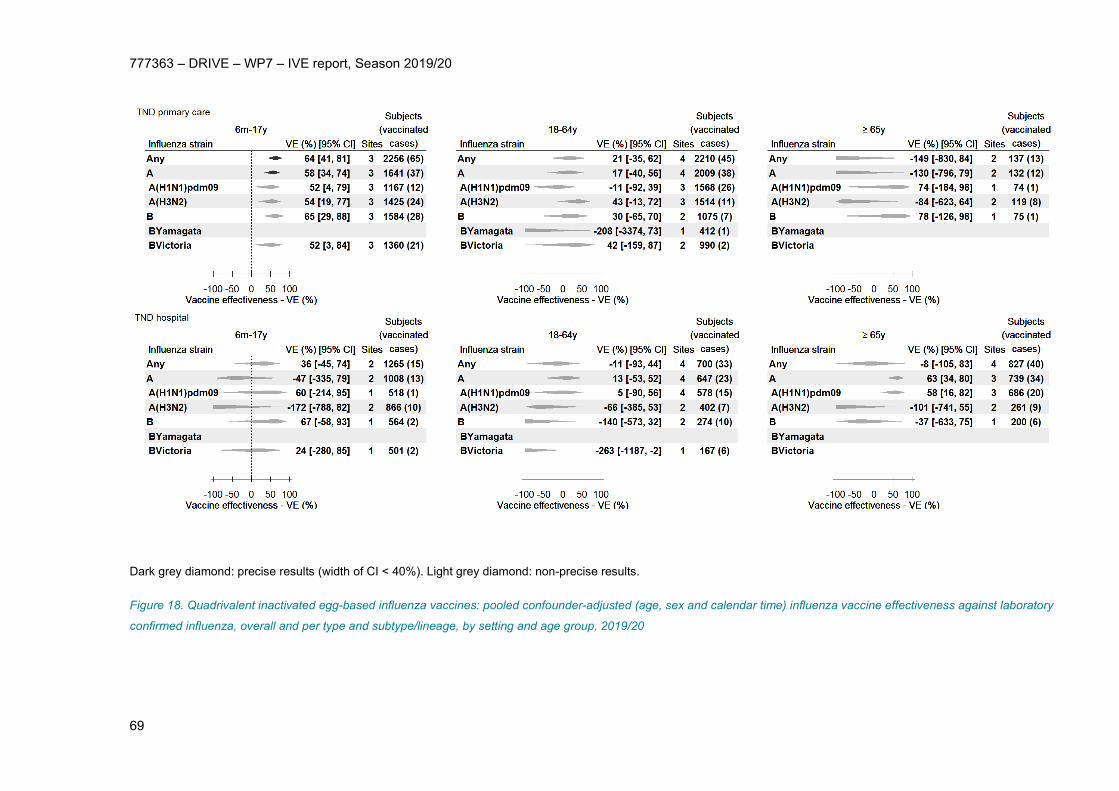
777363 – DRIVE – WP7 – IVE report, Season 2019/20
69
Dark grey diamond: precise results (width of CI < 40%). Light grey diamond: non-precise results.
Figure 18. Quadrivalent inactivated egg-based influenza vaccines: pooled confounder-adjusted (age, sex and calendar time) influenza vaccine effectiveness against laboratory
confirmed influenza, overall and per type and subtype/lineage, by setting and age group, 2019/20

777363 – DRIVE – WP7 – IVE report, Season 2019/20
70
Dark grey diamond: precise results (width of CI < 40%). Light grey diamond: non-precise results.
Figure 19. Trivalent non-adjuvanted influenza vaccines: pooled confounder-adjusted (age, sex and calendar time) influenza vaccine effectiveness against laboratory confirmed
influenza, overall and per type and subtype/lineage, by setting and age group, 2019/20

777363 – DRIVE – WP7 – IVE report, Season 2019/20
71
4.5.2 Register-based cohort study, Finland
Only one vaccine brand per vaccine type was available.
5 Discussion
In the 2019/20 season, the DRIVE network encompassed twelve TND study sites, up from nine in the
previous season, and one register-based cohort. Of the three hospital sites that joined, one is located in a
country that was not previously represented (France). Data from 9079 subjects, of which 3531 were cases,
were analyzed in the TND studies, and 511,854 person-years were included in the register-based cohort. Four
precise estimates were obtained for the primary objectives from the TND studies, up from three in the
previous season, and this included two precise brand-specific estimates, for Vaxigrip Tetra and Fluarix Tetra.
One strength of the DRIVE network is that estimates from individual TND sites (none of which were precise)
are pooled to increase precision. Additionally, estimates from the THL register-based cohort were precise. All
precise estimates showed a protective effect, with point estimates varying between 26% and 81%.
The 2019/20 influenza season in Europe was characterized by co-circulation of influenza A A(H1N1)pdm09
and A(H3N2) and to a lesser extent B/Victoria. This was reflected in the TND studies, where influenza A was
the dominant type (65.3% of all influenza), and both A(H1N1)pdm09 (46.4% of A with known subtype) and
A(H3N2) (53.9% of A with known subtype) were identified. The peak of reported cases was reached in week 5
2020. Differences between the circulating influenza A(H1N1)pdm09, A(H3N2) and B/Vicotria strains and the
vaccine strains may have impacted IVE.
5.1 Estimation of IVE for any vaccine
In the 2019/20 season, point estimates for pooled TND IVE estimates for any vaccine against any influenza
ranged from -34 to 64% in the primary care setting and from 29% to 36% in the hospital setting. The pooled
TND IVE estimates for any vaccine with a width of <40% were 64% (95%CI 44-80) against any influenza
among children in primary care and 53% (95%CI 35-67) against influenza A in hospitalized patients ≥65y. IVE
estimates from the Finland THL register-based cohort for any vaccine against any influenza was 66.3%
(95%CI 58.8-72.5) in children 6m-6y and 27.7% (95%CI 19.1-35.4) in older adults ≥65y. This data includes
influenza cases from both primary care and hospital setting and were therefore not pooled with the TND
studies.
Finland has a general child vaccine recommendation whereas the countries where the TND studies took place
do not (except UK); therefore, the populations ≥65y from the register-based cohort and TND studies are more
comparable than the respective children populations. Nevertheless, the point estimates for any vaccine

777363 – DRIVE – WP7 – IVE report, Season 2019/20
72
against any influenza in children (aged 6m-17y in the primary care TND studies and aged 6m-6y in the
register-based cohort study) are very similar.
Another European network estimated interim IVE based on data from multiple study sites until January 29,
2020 [11]. The DRIVE estimates for any influenza in children in primary care are similar to the IVE estimates
from the EU I-MOVE multi-country network (64% (95% CI 16-85)) [11]. Another IVE estimate obtained from
primary care setting in Denmark was 95% (95% CI: 67 to 99) [11]. The DRIVE estimate for influenza A in
hospitalized patients ≥65y is also in line with interim estimates from two study sites in Europe, where IVE was
reported as 37% (95%CI 19-50) and 62% (95%CI 41-76) [11].
In the United States, interim IVE against outpatient medically-attended influenza of any type among children
6m-17y from the U.S. Flu VE Network was 55% (95%CI 42-65) [12]. The proportion of influenza type and
subtype viruses differed from Europe. The majority of viruses were influenza B viruses (65% of influenza with
known type) and few A(H3N2) viruses were identified (3% of A with known subtype).
5.2 Estimation of brand-specific IVE
Eleven influenza vaccine brands were licensed and marketed in the European Union (EU) in the 2019/20
season: Of the eleven brands, brand-specific estimates for eight vaccines were obtained (Agrippal, Fluad,
Fluarix Tetra, Flucelvax Tetra, Fluenz Tetra, Influvac, Influvac Tetra, Vaxigrip Tetra).This included estimates
for all quadrivalent vaccines for all approved age indications; whereas no estimates were reported for three of
the six trivalent vaccines. This difference reflects the current transition to quadrivalent influenza vaccines in
Europe. In light of this transition and the arrival of new vaccine types (such as cell-based and high dose
influenza vaccines), a strong network is key to capture an increasing number of brands.
Precise estimates were obtained for Fluarix Tetra in children (TND studies), Vaxigrip Tetra in children (TND
studies and THL register-based cohort) and in older adults ≥65y (THL register-based cohort), and for Fluenz
Tetra (THL register-based cohort).
Reporting brand-specific estimates is unique to DRIVE, and no other studies were found that reported brand-
specific estimates.
Public Health England has calculated type-specific IVE estimates for vaccines aTIV, LAIV, QIVc and QIVe; a
single brand is available for the first three types listed, although the brands are not reported in their
publication. The PHE estimates are 16.2 (-58.7-55.7) for aTIV in those aged ≥65y; 45.4% (12.6-65.9) for LAIV
in children 2-17y; 63.9% (26.9-82.2) and 31.7 (-81.5-74.3) for QIVc in adults 18-64y and older adults aged
≥65y, respectively, and 38.9% (-4.5-64.3) for QIVe in adults 18-64y [13]. The confidence intervals of these
estimates are wide and overlap with the confidence intervals of the respective DRIVE TND primary care
estimates.

777363 – DRIVE – WP7 – IVE report, Season 2019/20
73
5.3 Precision
Multiple factors affect the precision of estimates, such as sample size, vaccine coverage, and the influenza
attack rate, but also the true VE, test sensitivity and specificity, statistical methods, the variance of site-
specific VE estimates etc. DRIVE is making efforts to increase sample size. However, many of the other
factors (and in particular influenza attack rate) cannot be controlled. We recognize that defining estimates as
precise when the absolute width of the CI is <40% is arbitrary. This was done to help with the interpretation of
the vast number of estimates obtained in the study.
5.4 COVID-19
The COVID-19 pandemic and subsequently lockdown measures interfered with and capped the 2019-20
influenza circulation and impacted data collection. Therefore, the study period for the main analysis was
truncated at February 29, 2020. This was two months earlier than originally expected, consequently fewer ILI
and SARI subjects were included hampering options to obtain more precise brand-specific VE estimates. In
the sensitivity analysis that included date up to April 30th, two additional precise brand-specific VE estimates
were obtained.
The COVID-19 is likely to significantly impact the 2020-21 season, both in terms of epidemiology, as
measures that prevent SARS-CoV-2 transmission can prevent transmission of other respiratory viruses, as in
terms of data collection, as healthcare seeking and testing pathways have been adapted in many countries
(e.g. influenza testing conditional to a negative SARS-CoV-2 test, parallel testing, etc). A good understanding
of the latter at all DRIVE sites will be important to accurately describe the study population.
5.5 Parsimonious confounder adjustment
Using a simplified approach to adjust for confounding and with that defining a minimum confounder
adjustment, we aim to avoid discarding data due to missing values, permit participation of sites who have
limited data on confounders, and avoid potential over-adjustment based on the results of the ad-hoc analysis
conducted in season 1018/19. However, the tradeoff of this simplified adjustment is that residual confounding
may be present in the VE estimates and limitations may apply to their interpretation. For sites that are able to
collect a larger set of confounding variables we will continue to do so to permit the conduct of sensitivity
analysis which will help to understand the potential and the extent of the effects of the simplified adjustment.

777363 – DRIVE – WP7 – IVE report, Season 2019/20
74
5.6 Strenghts and limitations
Improvements to the analyses and reporting of results compared to the 2018/19 season
• The list of confounders considered was simplified based on post hoc analysis from the 2018/19 data.
All TND study sites were able to collect data on confounders adjusted for in the main analysis (age,
sex, date of onset).
• Reporting of DRIVE results was improved compared to the previous seasons. A mock report was
developed and agreed upon between the partners prior to the availability of the study results and
readability of figures was improved. Furthermore, a WebANNEX was developed which enables easier
access to the full results (all site-specific and pooled analyses) to support data interpretation and
improves the speed of report, as the report is more concise. Importantly, this also makes the project
more sustainable for the future, as it is less resource intensive to report on the results, and makes the
project outcomes and data FAIR (Findable, Accessible, Interoperable, Reusable) [14].
Limitations related to the data
• It was not possible to distinguish between influenza cases from primary care and hospital settings in
the Finland THL register-based cohort study. Consequently, it was decided to not pool this data with
the TND studies.
• Whilst the influenza type was available for all included datasets, subtype and lineage was not
available for influenza cases from the Finland THL register-based cohort and the UK RCGP
RSC TND primary care study.
• All TND studies included in the main analysis closely followed the generic TND study protocol.
However, the study sites were still different in several aspects, including the sampling strategy and
matching of controls.
• In the THL register based cohort, the swabbing is not “active” but based on routine physicians'
assessment.
6 Conclusions
• DRIVE provided the first precise brand-specific IVE estimates in season 2019-2020.
• The number of precise estimates was increased compared to the 2018/19 season despite the mild
influenza season and the shortening of the season due to the COVID-19 outbreak, which reflects
network growth.
• The DRIVE network has expanded from five to eight TND hospital sites, including one new country, in
addition to the existing TND primary care sites and the register-based cohort.
• Eight out of eleven brands licensed and marketed in Europe were captured in the DRIVE data. Due to
the transition to QIV, the total number of subjects exposed to the conventional TIV vaccines was low,

777363 – DRIVE – WP7 – IVE report, Season 2019/20
75
however two precise brand-specific estimates were obtained for the QIVe vaccines Fluarix Tetra and
Vaxigrip Tetra.
6.1 Recommendations
• An approach focused on the older age groups, in which a relatively high vaccine coverage is
observed and where vaccination can have most impact on morbidity and mortality, combined with the
hospital setting, where the proportion of older age groups is higher than in primary care, would
increase the efficiency and feasibility of the network and is consistent with most influenza vaccine
recommendations applicable in Europe. This would also enhance the homogeneity across sites,
better permitting to pool the data from different sites in a given season. However, the tradeoff is that
the coverage of some vaccine brands is low in the older age groups, the data won’t be representative
for the licensed age indication of all influenza vaccines and may not encompass exposure to all
vaccine brands available in EU. In addition, the hospital setting is likely to reflect protection against
more severe illness. The call for tenders for the 2020/21 season focused on the adults and older adult
population in hospital setting. It is noted that national and regional public health institutes in Europe
are still encouraged to join DRIVE, regardless of age groups covered and regardless of whether they
have access to primary care or hospital data.
• Influenza and SARS-CoV-2 are expected to co-circulate in the 2020/21 season and DRIVE needs to
account for this co-circulation in the operations’ data collection and analysis. The COVID-19 and
influenza testing strategy at the sites has to be understood, ideally all ILI and SARI patients would be
tested for both viruses. In addition, the generic protocol for TND studies has been adapted to
encompass some COVID-19 components in the operations data collection and analysis, more
specifically to estimate COVID-19 impact on IVE and to compare clinical and laboratory features of
COVID-19 and influenza cases at the time of hospital admission.
7 Funding
The DRIVE project has received funding from the Innovative Medicines Initiative 2 Joint Undertaking under
grant agreement No 777363. This Joint Undertaking receives support from the European Union’s Horizon
2020 research and innovation programme and EFPIA.
8 Study team
The study team is described in the SAP (WebANNEX – SAP).

777363 – DRIVE – WP7 – IVE report, Season 2019/20
76
9 ANNEXES
The WebAnnex is accessible at: https://apps.p-95.com/drivewebapp/ (username: DRIVE_user; password:
6;40rv57P3Z85YC). The results of all the analyses are available there. In addition, the following documents
are accessible:
• Statistical analysis plan
• COVID-19 (Impact of COVID-19; Lockdown policies and healthcare seeking behavior; SARS-Cov-2
epidemiology in Europe)
• Local study protocols (including deviations from protocol, if any)
• National or regional vaccine recommendations
WebAnnex hierarchy
• TND site-specific analyses o Main analysis / all sensitivity analyses
Descriptive
• Histogram of covariates
o By age group
• Histogram of cumulative number of vaccinations over time
o By ge group
• Histogram of infections over time
o By age group
• Vaccination plot
o By age group
• Table of outcome by covariates
VE adjusted / VE crude
• Site_adjusted/crude_IVE
Data quality report
• TND pooled analyses o Main analysis / all sensitivity analyses
Descriptive
• Influenza over time
o By setting and age group
• Vaccination plot
o By setting and age group
• Table of outcomes by covariate
o By setting and age group
• Table of vaccine type by covariate
o By setting and age group

777363 – DRIVE – WP7 – IVE report, Season 2019/20
77
VE adjuvated / VE crude
• Pooled VE
o Any vaccine / all vaccine brands / vaccine type
Vaccine_clean (multipanel plots)
Vaccine_setting_age group ( forest plots for each
estimates in the multipanel plots)
resultsClean ( IVE results in table format including 2x2
tables)
• Outlying and influential (excluded from main analysis)
• Register-based cohort o Descriptive
Histogram of covariates THLCohort
Histogram of Cumulative number of vaccinations over time THLCohort
Histogram of infections over time THLCohort
Vaccine brands
Table of outcome by covariates
• Age group
o VE results
o THL_Adjusted_IVE_Report
o THL_Crude_IVE_Report
• Additional documents o Data processing ( info on the number of records retained during the data processing)
o COVID-19: SARS-Cov2 Epidemiology in Europe 2019/2020
o COVID-19: Impact of COVID-19 on influenza surveillance 2019/20
o COVID-19: policies and lockdown measures, and healthcare seeking behavior 2019/20
o Vaccine recommendations: target groups and vaccine types
o Vaccine recommendations: webpage ( references for the vaccine recommendations)
o Local Study Reports 2019/20
o Statistical Analysis Plan 2019/20

777363 – DRIVE – WP7 – IVE report, Season 2019/20
78
10 References
[1] Committee for Medicinal Products for Human Use. Guideline on Influenza Vaccines - Non-clinical and Clinical Module. EMA/CHMP/BWP/310834/2012. http://www.ema.europa.eu/docs/en_GB/document_library/Scientific_guideline/2016/07/WC500211324.pdf. Accessed: May 10, 2019. [2] DRIVE consortium. D7.4 Setting up brand-specific influenza vaccine effectiveness studies in Europe – results of the pilot season 2017/18. Accessible from: https://www.drive-eu.org/wp-content/uploads/2018/12/D7_4_Report-pilot-season-201718_v1.0.pdf. October 2018. [3] Stuurman A, Bollaerts K, Riera M, Alexandridou M, Biccler J, DeSmedt T, et al. D7.6 Brand-specific influenza vaccine effectiveness in Europe Season 2018/19 https://www.drive-eu.org/index.php/results/results-2018-19-season/. [4] Rizzo C, Alfonsi V, Bollaerts K, Riera M, Stuurman A, Turunen T. D7.1 Core protocol for type/brand-specific influenza vaccine effectiveness studies (test-negative design studies). 2018. https://www.drive-eu.org/wp-content/uploads/2018/12/DRIVE_D7.1_Core-protocol-for-test-negative-design-studies_1.1.pdf. [5] Syrjänen R, Baum U, Nohynek H, Levi M, Riera M, Bollaerts K, et al. D7.2 Core protocol for type/brand-specific influenza vaccine effectiveness studies (tpopulation-based database cohort studies). 2018. https://www.drive-eu.org/wp-content/uploads/2018/12/DRIVE_D7.2_Core-protocol-for-population-based-database-cohort-studies_V1.1.pdf. [6] Baum U, Sundman J, Jääskeläinen S, Nohynek H, Puumalainen T, Jokinen J. Establishing and maintaining the National Vaccination register in Finland. Eurosurveillance. 2017;22:30520. [7] Lane C, Carville KS, Pierse N, Kelly H. Seasonal influenza vaccine effectiveness estimates: Development of a parsimonious case test negative model using a causal approach. Vaccine. 2016;34:1070-6. [8] WHO. Recommended composition of influenza virus vaccines for use in the 2019-2020 northern hemisphere influenza season. https://www.who.int/influenza/vaccines/virus/recommendations/2019_20_north/en/. Accessed: November 21, 2019. [9] Flu News Europe. 2019/20 season overview https://flunewseurope.org/. [10] European Centre for Disease Prevention and Control. Seasonal influenza 2019-2020. Annual epidemiological report for 2019. Stockholm: ECDC; 2020. [11] Rose A, Kissling E, Emborg H-D, Larrauri A, McMenamin J, Pozo F, et al. Interim 2019/20 influenza vaccine effectiveness: six European studies, September 2019 to January 2020. Eurosurveillance. 2020;25:2000153. [12] Dawood FS, Chung JR, Kim SS, Zimmerman RK, Nowalk MP, Jackson ML, et al. Interim estimates of 2019–20 seasonal influenza vaccine effectiveness—United States, February 2020. Morbidity and Mortality Weekly Report. 2020;69:177. [13] Public Health England. Surveillance of influenza and other respiratory viruses in the UK: Winter 2019 to 2020. https://assets.publishing.service.gov.uk/government/uploads/system/uploads/attachment_data/file/895233/Surveillance_Influenza_and_other_respiratory_viruses_in_the_UK_2019_to_2020_FINAL.pdf. Accessed: August 28, 2020. [14] GoFAIR. FAIR Principles. https://www.go-fair.org/fair-principles/. Accessed: July 3, 2020.