d4 mobi-roma final report v1 - trimis · 2016-06-08 · deliverable nr 4 – mobi-roma final report...
TRANSCRIPT

This joint research programme was initiated by ERA-NET ROAD.
MOBI-ROMA
Mobile Observation Methods for Road Maintenance Assessments
MOBI-ROMA Final Report Deliverable Nr 4
March 2013
Foreca Ltd
Semcon AB
Klimator AB
Pöyry Deutschland GmbH
Design:
Rapid and Durable Maintenance Methods and Techniques
Cross-border funded Joint Research Programme
by Belgium, Germany, Denmark, Finland, France, Netherlands, Norway, Sweden, Slovenia and United Kingdom

This joint research programme was initiated by ERA-NET ROAD.
Project Nr. 832702
Project acronym: MOBI-ROMA
Project title:
Mobile Observation Methods for Road Maintenance Assessments
is a research project of the cross-border funded joint research programme
“ENR2011 DESIGN – Rapid and durable Maintenance Method and Techniques”
“ENR2011 DESIGN – Rapid and durable Maintenance Method and Techniques” is a trans- national joint research programme that was initiated by “ERA-NET ROAD II – Coordination and Implementation of Road Research in Europe” (ENR2), a Coordination Action in the 7th Framework Programme of the EC. The funding partners of this cross-border funded Joint Research Programme are the National Road Administrations (NRA) of Belgium, Germany, Denmark, Finland, France, Netherlands, Norway, Sweden, Slovenia and United Kingdom.
Deliverable Nr 4 – MOBI-ROMA Final Report
Due date of deliverable: 31.03.2013
Actual submission date: 19.03.2013
Start date of project: 01.09.2011 End date of project: 31.03.2013
Authors of this deliverable:
Pirkko Saarikivi, Foreca Ltd, Finland
Stephanie Müller, Pöyry Deutschland GmbH
Magnus Andersson, Semcon AB, Sweden
Pär Ekström, Semcon AB, Sweden
Eric Zachrisson, Klimator AB, Sweden
Torbjörn Gustavsson, Klimator AB, Sweden
Version: 1.0

This joint research programme was initiated by ERA-NET ROAD.
Executive summary
MOBI-ROMA stands for Mobile Observation Methods for Road Maintenance Assessments. The key objectives are to develop, test and evaluate improved, affordable and moderate-cost road condition and performance assessment techniques, which offer new effective tools for monitoring and assessing maintenance needs across Europe.
Since the advent of satellite navigation systems that allow vehicle tracking, there has been considerable research and development of monitoring systems that use intelligent cars as sensors. In FCD systems (Fleet Car Data) several such cars form a fleet to monitor, collect and transmit specific information to the central data base for analysis and further service.
Most previous studies have concentrated on the use of FCD for the analysis of the traffic state and to develop better traffic information and telematics services. In MOBI-ROMA, the emphasis of the study is on road surface condition monitoring using data coming from vehicle’s internal sensors through the CAN-bus, or simple devices mounted on the vehicle. Similar techniques with suitable sensors can be used also for assessing strength of road bed or need for winter maintenance. This Final Report summarises the results of The MOBI-ROMA Project, which started in September 2011 and finished in March 2013. The key target user sector of MOBI-ROMA is road maintenance.
MOBI-ROMA started with state of the art analysis of road monitoring devices and methods, which are summarized in the first project report D1 State-of-the-art of Floating Car Measurements. [1] The pros and cons of the present methods compared to FCD systems were analysed. The data collection phase for the MOBI-ROMA maintenance tool pilot followed. The data collection from several sources as well as data analysis and fusion methods are presented in the second report D2 Report on Data Collection, Fusion and Analysis. [2] The use of data with the MOBI-ROMA maintenance tool is discussed for various road maintenance needs.
In order to demonstrate the applicability of FCD in road maintenance, a Graphical User Interface (GUI) has been developed to be used as a maintenance tool. The aim with the tool is that the maintenance personnel will be able to have updated knowledge of the road status, to identify needs for maintenance, to perform the proper action that is needed, and geographically map the distribution of the maintenance needs. The tool can be used further to obtain input for cost and time calculation and planning.
The GUI, the programming methods and functionality of the maintenance tool are described in D3 Development of Graphical User Interface. [3] The development of MOBI-ROMA maintenance tool required input data from all seasons and from varying traffic conditions. The three main data types used in MOBI-ROMA pilot were spring thaw detection, winter road conditions and pavement quality estimation. All three types are collected using the floating car data methodology. Spring thaw data is generated in the on-going project BiFi (II) and data regarding winter road conditions are collected from the SRIS project.
Project BiFi (II) - Load bearing capacity through vehicle intelligence - analyses the load bearing capacity of gravel roads, often related to surface softness or spring thaw. The floating car data is retrieved from the CAN-bus outlet or by a purpose-built hardware which is designed to imitate standard sensors equipped in modern vehicles. Floating car data together with data from fixed measuring field stations generate geographically positioned information regarding the roads surface characteristics. The same methodology is performed in another project named SRIS – Slippery Road Information System. The aim of SRIS is to estimate winter road conditions by
This joint research programme was initiated by ERA-NET ROAD.
combining data from a fleet of cars with fixed measuring stations. The project housed a pilot that took place in the Gothenburg area during the winter 2007/2008. A fleet of 100 cars was used to collect several data parameters from the CAN-bus outlet, such as ABS. The data collected during this period was fed into the MOBI-ROMA maintenance tool.
The third source of data are pavement condition measurements performed in a five-stage campaign from autumn 2011 to end of summer 2012 covering roads in Sweden, Denmark, Norway, Germany and Czech Republic. The measuring vehicle was equipped with necessary purpose-built hardware and software to record all data available on the CAN-bus. An external GPS that provides CAN-signals was added to the setup which allowed accurate positioning. To perform algorithms validation, data were collected and compared with data from laser equipped vehicles provided by the Swedish Transport Administration. The final output grade (0-10) was computed by letting the vibration signal pass through several filters and algorithms.
During MOBI-ROMA data collection phase data from three external frameworks has been fed successfully into the maintenance tool. Validation of the collected data set proved data to be relevant and accurate enough for user evaluation. The amount of data was also large enough to validate the system performance.
To evaluate the MOBI-ROMA maintenance tool, the self-evaluation of results has been performed with advanced evaluation and validation method Evaserve, a meta-tool for evaluation of information services. User evaluation with stakeholders was organised, first and foremost national road administrations. A general cost/benefit analysis of the use of FCD in road maintenance is included as well as an assessment of the national and trans-national benefits compared to the present methods.
The key results and recommendations of the MOBI-ROMA project are:
MOBI-ROMA has a complementary character and will not substitute laser measurements. The maintenance tool needs further development, should be simple to use and tailored exactly to the user needs.
To develop FCD systems, the remaining accessibility problems to CAN-bus data must be solved. This may require a concerted European-wide action such as the implementation of the eCall system.
MOBI-ROMA service could be used for national or trans-national road maintenance and road transport needs, but the needs differ in various parts of Europe depending on local road climate conditions.
Large fleet of vehicles would be necessary for the coverage of major roads in Europe. It should be decided what would be the best body to organize and run a European-wide mobile monitoring system.
Standards for data should be developed and agreed on the European (or international) level so that it is possible to mix data from different type of vehicles and mobile measuring equipment.
Low cost of communication between vehicles and road side equipment as well as data analysis centres is required.
FCD fleets can be run with reasonable costs if relying on existing road transport systems, making the mobile monitoring system beneficial for road maintenance.
There is even greater potential in development of road user warnings based on mobile monitoring data. Just a small reduction of accidents (1%) due to improved road condition data can lead to substantial benefits (100 fold) in both national and European scale.

ENR2011 DESIGN MOBI-ROMA D4 Final Report
Page 5 of 101
Table of content 1 Introduction ............................................................................................................................ 10
2 State of art.............................................................................................................................. 11
3 Objectives of MOBI-ROMA data collection ............................................................................ 13
4 Data collection........................................................................................................................ 14
4.1 Measurement devices and techniques ............................................................................ 14
4.2 Pavement condition measurements ................................................................................ 15
4.2.1 Algorithms Validation Measurements ....................................................................... 16
4.2.2 Maintenance Tool Validation Measurements ........................................................... 16
4.2.3 Additional measurements ......................................................................................... 16
4.3 Spring thaw measurements from BiFi ............................................................................. 18
4.4 Slipperiness measurements from SRIS ........................................................................... 21
5 Data fusion and analysis ........................................................................................................ 23
5.1 Method for pavement analysis ......................................................................................... 23
4.1.1 Validation .................................................................................................................. 24
5.2 Method for spring thaw analysis ...................................................................................... 30
5.2.1 Validation .................................................................................................................. 34
5.3 Method for slipperiness analysis ..................................................................................... 36
5.3.1 Validation .................................................................................................................. 38
6. Development of the Graphical User Interface ........................................................................ 40
6.1 MOBI-ROMA maintenance tool in brief ........................................................................... 40
6.2 Contents of the maintenance tool .................................................................................... 42
7 Assessing needs of maintenance with MOBI-ROMA ............................................................. 50
7.1 Pavement quality maintenance ....................................................................................... 50
7.2 Dynamic regulations of load restrictions .......................................................................... 50
7.3 Winter maintenance needs .............................................................................................. 51
7.4 Other MOBI-ROMA benefits ............................................................................................ 51
8. Evaluation .............................................................................................................................. 53
8.1 Introduction ...................................................................................................................... 53
8.2 Methodology .................................................................................................................... 54
8.3 Findings ........................................................................................................................... 56
8.3.1 Self-evaluation with AINO Work Sheets ................................................................... 56
8.3.2 User evaluation ........................................................................................................ 66
8.4 Cost assessment and monetized benefits ....................................................................... 80

ENR2011 DESIGN MOBI-ROMA D4 Final Report
Page 6 of 101
8.4.1 Costs of mobile monitoring systems ......................................................................... 80
8.4.2 Monetized benefits to road maintenance ................................................................. 82
8.4.3 Monetized benefits to road users ............................................................................. 82
9 Exploitation of results ............................................................................................................. 83
9.1 As a new information source ........................................................................................... 83
9.2 As a tool for information to maintenance personal .......................................................... 84
9.3 As a tool for information to road users ............................................................................. 84
9.4 Why to use mobile data ................................................................................................... 86
10 Summary and key recommendations ..................................................................................... 87
11 References ............................................................................................................................. 89
Annex 1 AINO worksheets template ............................................................................................ 91
Annex 2 User Interview guideline ................................................................................................. 99

ENR2011 DESIGN MOBI-ROMA D4 Final Report
Page 7 of 101
List of figures
Figure 1 Data sources time table ................................................................................................... 14 Figure 2, Pavement measurements time plan ............................................................................... 15 Figure 3, Measurement distribution for a two days collection period (taken from the measurement tool). ............................................................................................................................................... 17 Figure 4, Measurement distribution cover several countries (taken from the maintenance tool). .. 18 Figure 5 A schematic description of the different stages of the spring thaw process. ................... 19 Figure 6 Reported incoming signals from an area South West of Arvika in Värmland, Sweden. Green dots indicate a hard road surface and Red/orange dots indicate soft road surface. As is seen in the progression from the 21 of March to the 4th of May, the roads start out with an even spread of soft indications. As the roads dry the soft signals become fewer and fewer until those finally go away. .............................................................................................................................. 20 Figure 7, Road in Sweden that is affected by spring thaw, severely limiting the load bearing capacity of the road ........................................................................................................................ 21 Figure 8, Slippery situations recorded during one season, in western Sweden. Each red dot represents an ABS or traction control system event. ..................................................................... 22 Figure 9, Detected as high quality pavement ................................................................................. 23 Figure 10, Detected as very low quality pavement ........................................................................ 23 Figure 11, Gothenburg-Nossebro .................................................................................................. 25 Figure 12, Gothenburg-Nossebro with selection ............................................................................ 25 Figure 13, Gothenburg-Nossebro with magnified section .............................................................. 25 Figure 14, Gothenburg-Nossebro. Repeatability ........................................................................... 26 Figure 15, Halmstad-Gothenburg. Repeatability ............................................................................ 26 Figure 16, Correlation between Grade, IRI and Color scale .......................................................... 27 Figure 17, BiFi system overview .................................................................................................... 30 Figure 18, Purpose built hardware with front connections visible .................................................. 30 Figure 19, Purpose built hardware with back connections visible .................................................. 30 Figure 20, Centrifugal force generating lateral acceleration that creates vibrations in the vehicle 31 Figure 21, Hardware unit model overview ..................................................................................... 31 Figure 22, Surface softness result generated and uploaded by the hardware unit ........................ 32 Figure 23, Road weather forecast squares covering Sweden ....................................................... 33 Figure 24, Final result generated by the interpreter model ............................................................ 33 Figure 25 shows average surface CBR values on left axis and percentage of signals that indicated soft surface. The CBR values are calculated as the average of 7 measurement points along the 5km long test road. ........................................................................................................................ 35 Figure 26, Schematic of distribution of high risk signals over a season and risk categories As the risk categories are defined in the current version of BiFi, green<12%, Yellow between 12-22% and Red >22%. ..................................................................................................................................... 36 Figure 27, SRIS model overview ................................................................................................... 37 Figure 28, Validation measurements. Amount of event indications registered during different weather conditions. ........................................................................................................................ 39 Figure 29, Network layout and functionality used in the Mobi-Roma GUI ..................................... 41 Figure 30, Pavement quality color scale, where each color represents a grade ........................... 43 Figure 31, Mobi-Roma maintenance tool GUI ............................................................................... 43 Figure 32, Overview of GUI with the Pavement Quality tab selected ............................................ 44

ENR2011 DESIGN MOBI-ROMA D4 Final Report
Page 8 of 101
Figure 33, a) Spring thaw conditions settings, b) My cars settings, and c) Pavement quality settings ........................................................................................................................................... 45 Figure 34, a) Winter road conditions settings, b) Weather settings ............................................. 46 Figure 35, The 25th of March 2008, Snowfall in Gothenburg causes slippery conditions. ............ 47 Figure 36, Information window ....................................................................................................... 48 Figure 37, Link to application walkthrough ..................................................................................... 49 Figure 38, An example of mobile measurements of NO2 in Gothenburg, Sweden. ....................... 52 Figure 39: Principle scheme of the service .................................................................................... 64 Figure 40: This is an example of the pilot web application’s representation of the pavement quality. ....................................................................................................................................................... 65 Figure 41, The level of monitoring information with present technologies and future systems including mobile monitoring methods. ............................................................................................ 84 Figure 42, One very bad future vision of road user information systems, to be strictly avoided. ... 85 Figure 43, The growth in information level/products from introducing a new concept of data. ...... 86
List of tables
Table 1, Schematic analysis of the spatial and temporal detection capability of different road monitoring methods. ...................................................................................................................... 12 Table 2, IRI Thresholds defined by the Swedish Transport Administration. .................................. 28 Table 3, Example of a sub-table that aims to define the correlation between the MOBI-ROMA pavement quality grade and IRI. .................................................................................................... 28 Table 4 CBR% values for a range of materials. There is an overlap between materials and conditions of same materials. A saturated gravel road can be as soft as clay. Values where obtained during BiFi (I), and more information can be found in BiFi Project report appendix. [11] 34 Table 5 Definitions of the BiFi warning categories. Currently the limits are defined as the ratio between soft/hard vehicle signals: green<12%, Yellow between 12-22% and Red >22%. ........... 35 Table 6, Distribution of event and background data in relation to weather conditions. A z-value calculated by a two-proportion z-test greater than 2.6 shows that the difference is significant on the 99%-level. ................................................................................................................................ 39 Table 7: List of partners who filled in an AINO worksheet for the self-evaluation .......................... 55 Table 8: List of user interviews carried out .................................................................................... 55 Table 9: Expected impacts and related targets of the service (*number of entries from all self-evaluation worksheets) .................................................................................................................. 64
ENR2011 DESIGN MOBI-ROMA D4 Final Report
Page 9 of 101
List of Abbreviations
AADT Average Annual Daily Traffic
ABS Anti-lock Braking System
BiFi Bearing Information Through Vehicle Intelligence
CAN Control Area Network
CBR California Bearing Ratio
ENR ERA-NET ROAD
EPS Electronic Power Steering
FCD Floating Car Data
FWD Falling Weight Deflectometer
GPS Global Positioning System
GPRS General Packet Radio Service
GUI Graphical User Interface
IRI International Roughness Index
MPD Mean Profile Depth
NVDB Swedish National Road Database
OBD2 On-board Diagnostics 2
PMSv3 Swedish Pavement Management System version 3
RWIS Road Weather Information System
SRIS Slippery Road Information System

ENR2011 DESIGN MOBI-ROMA D4 Final Report
Page 10 of 101
D4 MOBI-ROMA Final Report
1 Introduction
“ERA-NET ROAD – Coordination and Implementation of Road Research in Europe” was a Coordination Action funded by the 6th Framework Programme of the EC. The partners in ERA-NET ROAD (ENR) were United Kingdom, Finland, Netherlands, Sweden, Germany, Norway, Switzerland, Austria, Poland, Slovenia and Denmark (www.road-era.net). Within the framework of ENR this joint research project was initiated. The funding National Road Administrations (NRA) in this joint research project are Belgium, Denmark, Germany, France, Finland, Netherlands, Norway, Slovenia, Sweden and United Kingdom.
MOBI-ROMA stands for Mobile Observation Methods for Road Maintenance Assessments. The project’s key objectives are to develop, test and evaluate improved affordable and moderate-cost road condition and performance assessment techniques, which offer new effective tools for monitoring and assessing maintenance needs across Europe.
In order to have information about road condition and traffic data for road stretches it is necessary to have access to comprehensive and reliable data that are frequently updated. However, financial constraints mean that this requirement cannot be satisfied for much of the road network. For this reason, road traffic engineers are making increasing use of intelligent vehicles as mobile sensors, so-called “floating cars”, to determine the actual condition that is prevailing. In modern vehicles, the data available include a wide variety of variables that can be acquired in digital form from the vehicle’s data buses, namely the CAN-bus. It stands for Controller Area Network, a vehicle bus standard, which allows microcontrollers, sensors, etc. to communicate without a host computer. Vehicles can also be instrumented with light-weight measuring devices to turn those into moving monitoring platforms.
In MOBI-ROMA, the emphasis of the study is on road surface condition monitoring using data coming from the vehicle’s internal sensors or simple devices mounted on the vehicle. Similar techniques with suitable sensors can be used also for assessing the strength of the road bed or need for winter maintenance. This Final Report gives first a brief outlook on the state of art of mobile monitoring methods. The data collection from several sources including data analysis and fusion and validation methods are presented. A graphical user interface was developed to demonstrate the use of FCD as a road maintenance tool. This was evaluated first with Evaserve, an advanced validation and evaluation methods including a general cost-benefit assessment. Results of the user evaluation with stakeholders are presented. It was organised with experts from national road administrations and road maintenance companies. Finally, the key results and recommendations of MOBI-ROMA are summarised.

ENR2011 DESIGN MOBI-ROMA D4 Final Report
Page 11 of 101
2 State of art
Several base research projects and developing work using Floating Car Data have been carried out around Europe. The aim of the previous work has been in most cases to develop better traffic information and new telematics services which contribute to increasing road safety and driver convenience. A good summary is available e.g. in the report “Road Traffic Data: Collection Methods and Applications” [4]. While research and development on traffic monitoring and ITS applications has been very active in recent years, there is less done for the development of services using such techniques for road management.
The first MOBI-ROMA report D1 State-of-the-art of Floating Car Measurements [1] presents the principles of satellite tracking, CAN-bus data retrieval and Floating Car Data systems, assuming that this could be a new cost-effective source of monitoring data for road management assessments. Current practices and techniques, i.e. laser measurements with profilographs, friction monitoring with various methods, and recent research projects are presented in this report as well.
Floating car data as such is not a new concept. It has been tested and studied for a number of years, and has mostly focused on traffic flow in and around cities. In the last decade there has been a fair bit of research in the area of utilizing floating car data. The majority of publications are on using floating car data for traffic flow, examples of this is Turksma, 2000, and Schäfer et al., 2002, the latter utilizing taxis to produce data on traffic flow. [5] [6]
Although the majority of tests have concentrated on traffic flow and travel times, there have been projects where FCD is utilized for other applications. In the United States there have been some smaller field trials using CAN-bus data; the standouts being Koller et al., 2012 and Drobot et al., 2012, both using the onboard capabilities of cars with the objective to detect slipperiness and weather conditions. However, compared to the SRIS project utilized in MOBI-ROMA, they are still relatively small scale tests. [7] [8]
INTRO (Intelligent Roads) was active in 2005-2008 and co-financed by the EC in the 6th Framework Programme. [9][10] Objective was to study several technologies to add intelligence to roads for increased safety, better road operations and maintenance. Floating car data was chosen as alternative data source and tested for better monitoring of friction and pavement condition. Tests using CAN-bus output were performed in urban as well as rural areas and on bridges, using two probe vehicles in Sweden and two in the UK. The outcome of INTRO field tests was that the concept was not well suited for urban and inner city environments due to misconceptions arising from not real road defects but also from road junctions, parked cars, etc. Trials on rural roads gave better and more consistent results.
In future scenario discussion, INTRO concluded that road status monitoring is expected to increase significantly by means of in situ measurements combined with floating car data for disturbed statistic patterns. This would cover both primary and secondary roads, thus enhancing the feasibility of conventional methods that can normally be justified on busy and strategic routes. It was also concluded that monitoring by means of probe vehicles will be a cost-effective measure, enabling more effective target maintenance, leading to road authorities optimizing their resources. FCD can be used further to estimate the performance of the network, e.g. congestion level, amount of emission and travel time. Road operators can use this information to select best management strategy.

ENR2011 DESIGN MOBI-ROMA D4 Final Report
Page 12 of 101
Table 1 analyses how the different monitoring techniques reveal different temporal and spatial phenomena affecting the road network. A fixed station network has good temporal detection capability (typically few minutes), but due to its high investment cost, the spatial resolution is poor (typically 50-100 kilometers at best). Profilometers and other heavy equipment have good spatial detection capability, but again due to economic constraints, road stretches can be monitored with these once per year at best. Thus changes shorter than this period are missed.
FCD methods which are focused on in MOBI-ROMA complement these two sources by offering moderate-cost way to monitor roads with high spatial as well as temporal resolution. As investment costs are low per unit, the system can be built having several units measuring the roads regularly.
Table 1, Schematic analysis of the spatial and temporal detection capability of different road monitoring methods.
Detection method
Temporal resolution
Spatial resolution
Pros Cons
Fixed road stations
10-30 min typically
50-100 km at best
Good detection quality if well calibrated. Multiple instruments.
Expensive per unit. Network does not reveal local effects, which may be dangerous to drivers.
Profilometers and other heavy monitoring equipment
Continuous during the monitoring drive, but repeated only ~ annually
Continuous along highways on selected paths
Good detection quality of specific road conditions
Expensive and thus cannot be repeated often.
Light monitoring equipment (e.g. for friction)
Continuous during the monitoring drive, but repeated only ~ weekly.
Continuous along highways on selected paths
Good enough detection quality with reasonable price.
Expensive to use continuously on the road network.
FCD using CAN-bus data
Continuous during the monitoring drive, can be repeated
~ daily
Continuous along highways and lesser road network on selected paths
Can be organized with reasonable costs using ordinary cars, and with good coverage
Accessibility to CAN-bus is presently limited by most of car manufacturers.

ENR2011 DESIGN MOBI-ROMA D4 Final Report
Page 13 of 101
3 Objectives of MOBI-ROMA data collection
The objective of MOBI-ROMA is to introduce a new tool for cost effective road management. The approach is to combine and process available data from fixed measuring field stations with floating car data (FCD). Data from several sources therefore has to be collected and fed into the MOBI-ROMA maintenance tool pilot.
The development of the maintenance tool requires input from data collected during various times of a year and in various traffic conditions. Due to this, data from other on-going projects are continuously ingested into MOBI-ROMA, used to ease both development and evaluation of the maintenance tool.
One of the on-going research projects is BiFi (II)1. The project aims to compute the load bearing capacity of gravel roads, often related to surface softness or spring thaw. The floating car data is retrieved from the CAN-bus outlet or by a purpose-built hardware, which is designed to imitate standard sensors equipped in modern vehicles. The purpose-built hardware is developed due to the restrictions car manufacturers add on CAN-bus data. Floating car data together with data from fixed measuring field stations generate geographically positioned information regarding the roads surface characteristics. All data collected during BiFi (II) will be fed into MOBI-ROMA and used to develop and evaluate the maintenance tool. [11]
The same methodology is performed in another framework named SRIS2. The aim of SRIS is to estimate winter road conditions by combining data from a fleet of cars with fixed measuring stations. The project housed a pilot that took place in the Gothenburg area during the winter 2007/2008. A fleet of 100 cars was used to collect several data parameters from the CAN-bus outlet, such as ABS. The data collected during this period will be ingested and used to develop and evaluate the MOBI-ROMA maintenance tool. [12]
The above mentioned research project BiFi (II) includes a functionality to determine whether the vehicle is located on a gravel road. The algorithm has been re-developed to also determine the roads pavement quality. The system is partly broken out of its original project and aims to use floating car data to provide, amongst others, several road administrations with spatially distributed pavement quality information. Collection of data, used to further develop the pavement analysis algorithms, was performed parallel with MOBI-ROMA and fed into the maintenance tool.
Data is thereby collected and fed into the MOBI-ROMA maintenance tool from three different projects/frameworks, each estimating a specific problem area. Namely: spring thaw detection, winter road conditions and pavement quality estimation.
The objective of the data collection is to format data sets suitable for validating the pavement quality algorithms and to test performance of the MOBI-ROMA web base maintenance tool.
1 Load bearing capacity through vehicle intelligence. More information, reports and presentations available on the project web page: http://bifi.se. 2 Slippery Road Information System, more information and a final report available on http://www.sris.nu.
ENR2011 DESIGN MOBI-ROMA D4 Final Report
Page 14 of 101
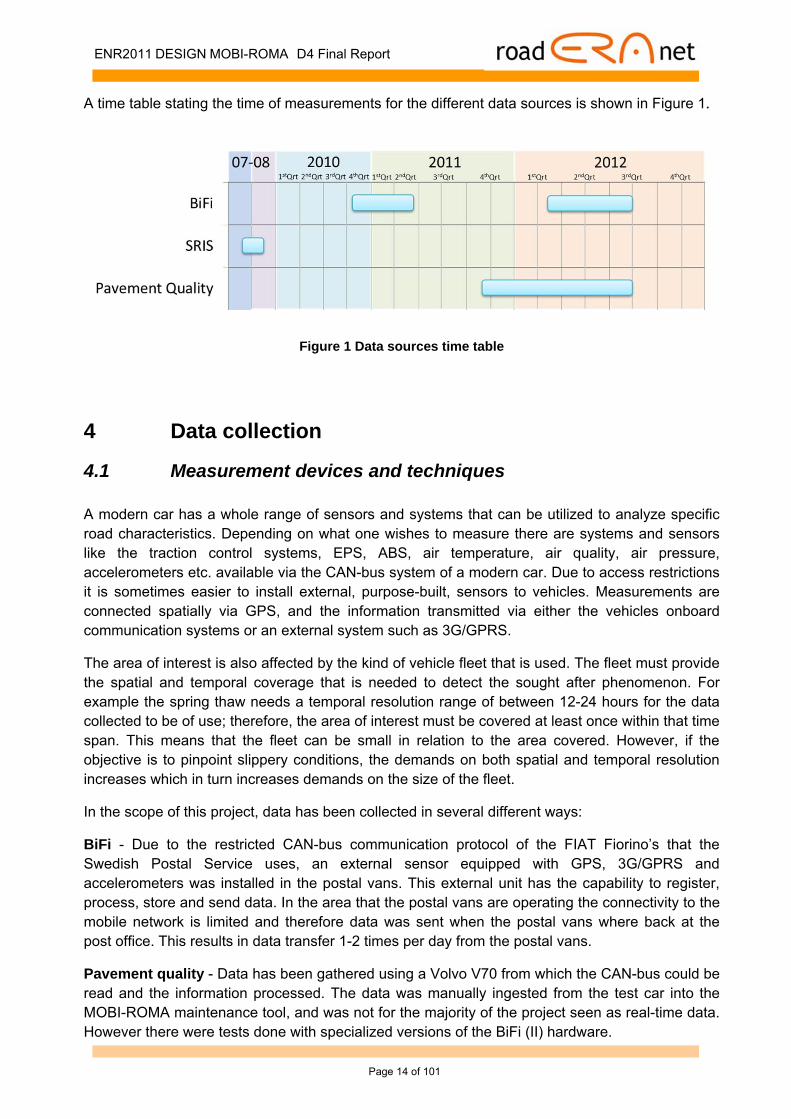
A time table stating the time of measurements for the different data sources is shown in Figure 1.
Figure 1 Data sources time table
4 Data collection
4.1 Measurement devices and techniques
A modern car has a whole range of sensors and systems that can be utilized to analyze specific road characteristics. Depending on what one wishes to measure there are systems and sensors like the traction control systems, EPS, ABS, air temperature, air quality, air pressure, accelerometers etc. available via the CAN-bus system of a modern car. Due to access restrictions it is sometimes easier to install external, purpose-built, sensors to vehicles. Measurements are connected spatially via GPS, and the information transmitted via either the vehicles onboard communication systems or an external system such as 3G/GPRS.
The area of interest is also affected by the kind of vehicle fleet that is used. The fleet must provide the spatial and temporal coverage that is needed to detect the sought after phenomenon. For example the spring thaw needs a temporal resolution range of between 12-24 hours for the data collected to be of use; therefore, the area of interest must be covered at least once within that time span. This means that the fleet can be small in relation to the area covered. However, if the objective is to pinpoint slippery conditions, the demands on both spatial and temporal resolution increases which in turn increases demands on the size of the fleet.
In the scope of this project, data has been collected in several different ways:
BiFi - Due to the restricted CAN-bus communication protocol of the FIAT Fiorino’s that the Swedish Postal Service uses, an external sensor equipped with GPS, 3G/GPRS and accelerometers was installed in the postal vans. This external unit has the capability to register, process, store and send data. In the area that the postal vans are operating the connectivity to the mobile network is limited and therefore data was sent when the postal vans where back at the post office. This results in data transfer 1-2 times per day from the postal vans.
Pavement quality - Data has been gathered using a Volvo V70 from which the CAN-bus could be read and the information processed. The data was manually ingested from the test car into the MOBI-ROMA maintenance tool, and was not for the majority of the project seen as real-time data. However there were tests done with specialized versions of the BiFi (II) hardware.

ENR2011 DESIGN MOBI-ROMA D4 Final Report
Page 15 of 101
SRIS - The SRIS project utilized the onboard hardware of at most 100 vehicles, 60 Volvos and 40 SAABs. The car models used in the test were Volvo V70s and Saab 9-5s. The vehicles were both company cars and taxis to get a high frequency of usage and driving distance of the cars. The project was operative in the winters of 2006-2007 and 2007-2008; consequently the data is not seen as real-time and has therefore been ingested off-line. However, if SRIS were to go operational at a later date, the floating car data would be transmitted in real time to a database were the data could be utilized for modeling and visualization. For SRIS, a short response time is critical for the system to be as effective as possible. Slippery situations can appear quickly and therefore minimizing the time from vehicle measurement to responsible road authorities and other drivers must be as short as possible.
The strength of the systems above is that drivers who carry out the data collection do not need any specific system knowledge. This allows for people unrelated to the technicalities to collect data during weekend trips, daily commute, etc.
For further information regarding previous projects BiFi and SRIS see referenced reports [11] and [12].
4.2 Pavement condition measurements
The pavement condition measurements were performed with focus on validation of both the pavement quality algorithms and the web based maintenance tool.
To perform algorithms validation, data were collected and compared with data from laser equipped vehicles provided by the Swedish Transport Administration. This limits the possibility to choose specific road stretches and seasons, but provides an accurate data set suitable for validation of the algorithms.
Validating the maintenance tool demands a different type of data set with focus on quantity. This data set does not have any restrictions regarding road stretches or season. Data could therefore be collected in several countries in all four seasons.
The measurements are therefore divided into two categories and were measured according to the measurement schedule, seen in Figure 2.
Figure 2, Pavement measurements time plan
2011 2012
Algortihm Validation
Maintenance Tool Validation
SeptemberSeptember November January Mars May July

ENR2011 DESIGN MOBI-ROMA D4 Final Report
Page 16 of 101
4.2.1 Algorithms Validation Measurements
Validation of the pavement quality algorithms was done against data from laser equipped measuring vehicles, provided by the Swedish Transport Administration. Parameters available for validation were:
International Roughness Index, IRI (mm/m)
Rutting depth (mm)
Macro texture, MPD, Right (mm)
Macro texture, MPD, Center (mm)
Macro texture, MPD, Left (mm)
Four stretches containing the above mentioned parameters were selected to validate the algorithms. One of these stretches, 28 km in Norrleden near Gothenburg, was used in an early stage of the project for algorithm development. Easy access of was also important at this stage of the project. This initial validation stretch was not seen as part of the final validation data set.
The three remaining stretches on E6, V41 and V190 near Gothenburg were selected due to their variation in quality and size. Each stretch with a length of 140, 178 and 282 km was measured three times in each direction. If the stretch has more than two lanes, only the right lane was measured. In total 1800 km of algorithms validation measurements were performed.
4.2.2 Maintenance Tool Validation Measurements
In addition to the measurements performed to evaluate the pavement algorithms a lot of data were collected to evaluate the performance of the maintenance tool. These measurements were done within all four seasons, on various pavement qualities, in different weather conditions and in several countries. The aim of these measurements was not to improve or validate the algorithms, but to illustrate the usability and test the performance of the web based maintenance tool. These measurements were done sporadically during the project and the measured distance was well over 7000 km.
4.2.3 Additional measurements
In addition to the two previous measurement categories several other measurements were performed in Sweden, Germany and Norway. These shorter measurements aimed to increase the accuracy of the pavement algorithms by testing them on odd road surfaces, such as cobble stone, concrete and deep snow. Details of all measurements are available in [2].
All pavement measurements were done using a Volvo V70. The vehicle was equipped with necessary hardware (CANcaseXL developed by Vector) to record all relevant data available on the CAN-bus. An external GPS that provides CAN-signals was added to the setup, which allowed accurate geographical positioning. Constantly using the same measurement vehicle eases evaluation of algorithms, as the measuring setup is kept close to constant.

ENR2011 DESIGN MOBI-ROMA D4 Final Report
Page 17 of 101
Performance testing of the web based measurement tool requires larger quantities of data. Therefore a purpose-built hardware developed in the BiFi (II) project was used. The external hardware unit is equipped with sensors necessary to analyze surface characteristics. This allows for other vehicles than the previously used Volvo V70 to perform measurements. The downside is that no raw data is stored or uploaded to any database, as only the geographical position, timestamp and the system output is stored. This removes the possibility to perform any in-depth analysis on the collected data sets.
Since the measurements are performed in normal traffic speeds the system covers large areas, about 600-900 km per vehicle per day.
Figure 3 presents an example view taken from the maintenance tool, presenting both CAN based data and data measured with the external hardware unit collected during two days. Figure 4 shows the geographical distribution of all collected pavement quality data. Measurements reached several countries allowing evaluation of the trans-national use of MOBI-ROMA.
Figure 3, Measurement distribution for a two days collection period (taken from the
measurement tool).

ENR2011 DESIGN MOBI-ROMA D4 Final Report
Page 18 of 101
Figure 4, Measurement distribution cover several countries (taken from the maintenance tool).
4.3 Spring thaw measurements from BiFi
In BiFi (II) – Bearing information through vehicle intelligence - information about the load bearing capacity of gravel roads is collected using a fleet of vehicles carrying purpose-built sensors. The system aims to detect bearing capacity reduction associated with the spring thaw process.
In colder climates the roads freeze during the winter months when temperatures plummet below freezing for extended periods of time. As spring approaches the temperatures rise and the spring thaw sets in. The spring thaw process is initiated when air temperatures reach over 0°C and melting of the road surface begins. An excess of water trapped by the frozen road beneath the thawed surface causes the load bearing capacity to decrease and can lead to collapse of the road when under stress. There is often a period when the daytime temperatures are well above 0°C,
but fall below 0°C during the night time, causing a freeze-thaw process. This makes the road surface hard during the night into the early morning and soft as the temperature rises and the road surface thaws out.

ENR2011 DESIGN MOBI-ROMA D4 Final Report
Page 19 of 101
Figure 5 A schematic description of the different stages of the spring thaw process. 1. Unaffected dry/wet road. 2. Surface temperature sinks below freezing. The initial stages of the ground frost period. 3. The road is frozen solid below the depth of the road structure. 4. Initial surface melting and surface softness. The road still has a high bearing capacity thanks to the frozen subsurface. 5. Refreezing during cold nights lead to refrozen surface. Risk of collapse since the surface seems stable. 6. Heavy thawing, surface saturated with melt water. The frozen subsurface acts like a barrier, preventing drainage of excess water. Low bearing capacity, with heavy rutting. 7. Dry road bank with remnant rutting and pot-holes.
In the BiFi (II) project a total of 13 sensors were mounted in postal delivery vans in two separate areas: 5 sensors in Kramfors municipality in Västernorrland, and 8 in the municipalities of Arvika and Sunne in Värmland, Sweden. The routes chosen were picked to get the maximum coverage of dirt roads possible.
In total the eight vehicles in Värmland have delivered just above 57000 measurements during a two-month period which breaks down to about 1000 signals per day. The five vehicles in Kramfors uploaded around 25000 indications during the same period. The amount of dirt road covered varies from day to day depending on the post office driving schedule, but on average a normal route is around 100km. In total the eight vehicles manage to cover about one third of the total area of Värmland. In both Värmland and Kramfors the vehicles are out and delivering mail between 08:00 and 16:00 on weekdays. In addition to this, several postal vehicles are used to deliver the morning newspapers. This is done around 05:00 on weekdays.
Figure 6 shows the indications of spring thaw and its development between a period between the 21st of March 2012 and the 4th of May the same year, as detected by the vehicle fleet in Värmland, and as seen in the MOBI-ROMA web base maintenance tool.
Figure 7 shows a typical spring thaw affected gravel road in the same area.

ENR2011 DESIGN MOBI-ROMA D4 Final Report
Page 20 of 101
21 March, South West of Arvika, Ratio of soft signals 37%
4 April, South West of Arvika, Ratio of soft signals 13%
11 April: South West of Arvika, Ratio of soft signals 10%
4 May, South West of Arvika, Ratio of soft signals 0%
Figure 6 Reported incoming signals from an area South West of Arvika in Värmland, Sweden. Green dots indicate a hard road surface and Red/orange dots indicate soft road surface. As is seen in the progression from the 21 of March to the 4th of May, the roads start out with an even spread of soft indications. As the roads dry the soft signals become fewer and fewer until those finally go away.

ENR2011 DESIGN MOBI-ROMA D4 Final Report
Page 21 of 101
Figure 7, Road in Sweden that is affected by spring thaw, severely limiting the load bearing capacity of the road
4.4 Slipperiness measurements from SRIS
Slippery situations are one of the most important factors associated with road deaths and injuries. Those are also notoriously hard to predict. To date many countries plagued by weather which causes slippery road conditions have invested in some kind of road weather information system (RWIS) that comprises of a network of weather stations placed throughout the road network. These systems warn when atmospheric conditions are likely to yield slippery conditions, such as snowfall or rain on cold road surface. However these systems are limited by the information the weather stations deliver, and that data may not always reflect the road surface conditions accurately. [12] There is therefore a need for something to fill the gaps between the weather stations and to measure parameters that correlate to road friction and slipperiness in some way. From this need the idea of SRIS or Slippery Road Information System was conceived.
SRIS uses the onboard system in a fleet of vehicles to pinpoint slippery situations in real time. The system listens for activation of the vehicles ABS and EPS systems and, when triggered, sends a positioned action via the vehicles onboard communication system to a database. As the vehicle moves along the road it also sends out a signal telling the system where it is every 30 seconds, giving the system information about how many vehicles are active and where they are at any given time. This is seen as background information where no indications of slipperiness have been reported.

ENR2011 DESIGN MOBI-ROMA D4 Final Report
Page 22 of 101
Slippery situations are associated with several different weather phenomena such as frost, black ice and snowfall. These phenomena are often local in nature and can appear quickly which makes it difficult to predict them. Therefore, the vehicle fleet must be large enough to enable a significant portion of the road network to be covered at any given time. It is also important that this coverage has a high enough temporal resolution (vehicles/kilometer road/hour) to be able to capture slippery situations as they form and are remediated. The size of the vehicle fleet is directly connected to the size of the road network and the diversity of roads within the same network.
SRIS has run operationally for two seasons in 2007 and 2008. During the winter of 2007 there were 60 cars active in and around the Gothenburg area. In 2008 SRIS was extended to 100 cars (60 Volvos and 40 Saabs) in the same area. [12]
The SRIS project managed convincingly to show how vehicle data could be used to pinpoint when and where slippery situations occur. However a GUI for the system was not developed. MATLAB, a programming environment for algorithm development, data analysis, visualization and numerical computation, developed by MathWorks, was used instead (Figure 8).
Figure 8, Slippery situations recorded during one season, in western Sweden. Each red dot represents an ABS or traction control system event.

ENR2011 DESIGN MOBI-ROMA D4 Final Report
Page 23 of 101
5 Data fusion and analysis
5.1 Method for pavement analysis
The pavement quality is detected using the vehicles own vibrations. The vibrations can be retrieved in two ways, either by using the vehicles internal accelerometer or by adding an external sensor. If the internal accelerometer is used, the data is available on the CAN-bus and is retrieved through the OBD2-outlet. OBD2 is a vehicle diagnostics standard, where CAN is one of five protocols used. The fetched data is converted to a known format using CANalyzer, a universal software analysis tool for ECU networks and distributed software, developed by Vector. Finally data is exported to MATLAB where it is analyzed.
The second method is based on a purpose-built hardware, developed in the parallel project BiFi (II), which houses several sensors, communication and storage facilities. The processing is done in the hardware’s embedded processor and the data is transferred by 3G/GPRS to a central database. Both methods use an external GPS to detect the geographical position.
In an early stage the output was compared to general road roughness. It was clear that a higher Pavement Quality grade represented a poor road surface, as seen in Figure 9 and Figure 10.
Figure 9, Detected as high quality pavement
Figure 10, Detected as very low quality pavement
The final output, generated by the algorithms, is a grade from zero to ten, ten being good quality. The grade is computed by letting the vibration signal pass through several filters and algorithms developed in the parallel projects SRIS and BiFi (II). The grade, geographical coordinate and timestamp are sent to a central database. This is done automatically when the vehicles ignition is turned off.
If the data is fetched from the CAN-bus using the OBD2-outlet all information has to be transferred manually from the vehicle and uploaded to the database using a personal computer.

ENR2011 DESIGN MOBI-ROMA D4 Final Report
Page 24 of 101
4.1.1 Validation
Validation of the pavement quality algorithms was performed on three algorithm validation stretches. All three stretches were measured by MOBI-ROMA in June of 2012 using a Volvo V70 equipped with hardware necessary for logging CAN-bus data. The five validation parameters provided by the Swedish Transport Administration were International Roughness Index (IRI), Rutting depth, and Macro texture (MPD) Right, Center and Left.
All validation operations were performed using MATLAB and a significant similarity could only be found between the MOBI-ROMA Pavement Quality and IRI. In the evaluation, if there was a correlation between the MOBI-ROMA grade and IRI the signals were plotted against each other. To ease validation all signals were filtered over 100, 400 and 1000 meter. In the following Figures 11-13 only signals filtered over 1000 meters are shown from one stretch. MOBI-ROMA Report D2 Error! Reference source not found. contains more results and also filtered with a higher resolution, 100, 400 and 1000 m. [2]
The outputs from the algorithms are a mean value of the three measurements performed on each stretch. In all plots the grade computed by the pavement quality algorithms are represented by a blue line and IRI measured by the Swedish Road Administration are represented by a red line. Dotted lines represent requirements of IRI between 50-120 km/h set by the Swedish Transport Administration (see referenced maintenance report [13] for further details). In this case all IRI requirements are based on a traffic flow over 2000 vehicles per day.
During evaluation there were no signs of correlation between other parameters than IRI. Due to this focus was set to only analyze correlation with IRI.

ENR2011 DESIGN MOBI-ROMA D4 Final Report
Page 25 of 101
Stretch v.190 – Gothenburg-Nossebro
The gap in the red line is there due to lack of IRI. The signals follow each other well and small differences in amplitude are seen in correlation to peaks with high IRI values.
Figure 11, Gothenburg-Nossebro
To get a better understanding of how well the signals match a section has been selected and magnified.
Figure 12, Gothenburg-Nossebro with selection
The enlarged section shown in Figure 13 shows a good match between the two curves. A clear sign of this is that all peaks match. A difference in amplitude can be detected in several sections.
Figure 13, Gothenburg-Nossebro with magnified
section
0 10 20 30 40 50 600
0.5
1
1.5
2
2.5
3
3.5
4
4.5
5
kmIR
I [m
m/m
]
Sträcka: Göteborg − Nossebro, Fil: O190F 10 010531 H, Filter: 1000 meter
SemconIRIIRI−Krav (50−120 km/h)
0 10 20 30 40 50 600
0.5
1
1.5
2
2.5
3
3.5
4
4.5
5
km
IRI [
mm
/m]
Sträcka: Göteborg − Nossebro, Fil: O190F 10 010531 H, Filter: 1000 meter
SemconIRIIRI−Krav (50−120 km/h)
44 46 48 50 52 54 56 580
0.5
1
1.5
2
2.5
3
3.5
4
4.5
5
km
IRI [
mm
/m]
Sträcka: Göteborg − Nossebro, Fil: O190F 10 010531 H, Filter: 1000 meter
SemconIRIIRI−Krav (50−120 km/h)

ENR2011 DESIGN MOBI-ROMA D4 Final Report
Page 26 of 101
Repeatability
Each stretch was measured three times, in order to evaluate the repeatability of measurements performed by a vehicle driven by untrained personnel.
Stretch V190 – Gothenburg-Nossebro, Figure 14, shows a small difference between the three individual measurements. Parameters such as velocity, position on the road, etc. could contribute to the small differences.
Figure 15 shows the stretch E6 – Halmstad-Gothenburg. The graph show more differences between each measurement, especially ~23 km into the measurement. The peak in the green line is due to heavy traffic caused by a traffic incident. The velocity is too low for the algorithms to perform a reliable result and is normally discarded. In this case the result is kept to ease filtering. Also this measurement is affected by overtaking, position on the road, etc.
Figure 14, Gothenburg-Nossebro. Repeatability
Figure 15, Halmstad-Gothenburg. Repeatability
In a FCD measuring system such as MOBI-ROMA pilot demonstration, the repeatability and mean correlation to laser measurements can be assessed with confidence only after extensive measuring samples from large car fleets. MOBI-ROMA has not yet large enough data sets to derive the mean values with confidence. Figure 14 and Figure 15 above show that there is large variation from case to case due to external factors. However, the key objective of MOBI-ROMA is to provide complementary measurements with high spatial and temporal resolution, though with less accuracy compared to present laser measurement methods. We assume that larger car fleet providing FCD will increase the amount of measurements in any given point along the road, thus increasing the correlation with IRI.
0 10 20 30 40 50 600
0.5
1
1.5
2
2.5
3
3.5
4
4.5
5
km
[]
Sträcka: Göteborg − Nossebro, Fil: O190F 10 010531 H, Filter: 1000 meter
Semcon (1)Semcon (2)Semcon (3)Semcon (medel)
0 20 40 60 80 100 1200
0.5
1
1.5
2
2.5
3
3.5
4
4.5
5
km
[]Sträcka: Halmstad − Göteborg, Fil: NE6F 10 060529 H, Filter: 1000 meter
Semcon (1)Semcon (2)Semcon (3)Semcon (medel)

ENR2011 DESIGN MOBI-ROMA D4 Final Report
Page 27 of 101
Correlation
The correlation between the pavement quality grade and national IRI requirements depends on several pre-set road variables. Connecting specific measurements with the set of road variables is the key in providing a reliable scale of results which are shown as a set of colors on the web based maintenance tool.
In the following example, the validation stretch Gothenburg-Nossebro has been chosen. The stretch has an average speed limit of 70 km/h with an average traffic flow of over 2000 vehicles/day. The IRI requirement of this road category, set by the Swedish Transport Administration, is: < 4.1 mm/m. The outputted color scale would then correlate all pavement quality grades over 4.1 as bad pavement (purple). Values that span 20% below the requirement are seen as moderate quality (light purple to yellow), which in this case correlate to pavement quality values between 3.28 and 4.1. Values below 3.28 will be seen as good quality (green) as shown in Figure 16. No pavement quality above 3.5 has been detected and therefore cannot be graded accurately.
Figure 16, Correlation between Grade, IRI and Color scale
The above example is only valid for this specific stretch in Sweden, which has an average speed limit of 70 km/h. Since measurements are made on all possible road types, in various speeds and in several countries the limits has to be dynamic. A proper scale for all these cases hasn’t been developed, mainly because there were no easy way to access road specific data when only knowing the latitude and longitude of the measurement. In Sweden the National Road Database (NVDB) could be used to attach MOBI-ROMA measurements to specific road data segments, however this is not an easy task. The next generation of pavement management system, PMSv3, is more detailed and therefore also more suited for measurements based on geographical coordinates. But there will still be a harsh implementation task to perform for several countries.

ENR2011 DESIGN MOBI-ROMA D4 Final Report
Page 28 of 101
Another approach is to set up grade tables for each country based on annual average daily traffic (AADT) and the actual vehicle speed. In Table 2 thresholds defined by the Swedish Transport Administration are shown. [13]
Table 2, IRI Thresholds defined by the Swedish Transport Administration.
Vehicle speedAADT 120 110 100 90 80 70 60 50 0-250 ≤ 4.3 ≤ 4.7 ≤ 5.2 ≤ 5.9 ≤ 6.7 ≤ 6.7 ≤ 6.7
250-500 ≤ 4.0 ≤ 4.4 ≤ 4.9 ≤ 5.5 ≤ 6.3 ≤ 6.3 ≤ 6.3 500-1000 ≤ 3.7 ≤ 4.1 ≤ 4.5 ≤ 5.1 ≤ 5.8 ≤ 5.8 ≤ 5.8
1000-2000 ≤ 3.0 ≤ 3.3 ≤ 3.7 ≤ 4.2 ≤ 4.8 ≤ 5.2 ≤ 5.2 2000-4000 ≤ 2.4 ≤ 2.6 ≤ 2.9 ≤ 3.2 ≤ 3.6 ≤ 4.1 ≤ 4.9 ≤ 4.9 4000-8000 ≤ 2.4 ≤ 2.6 ≤ 2.9 ≤ 3.2 ≤ 3.6 ≤ 4.1 ≤ 4.9 ≤ 4.9
>8000 ≤ 2.4 ≤ 2.6 ≤ 2.9 ≤ 3.2 ≤ 3.6 ≤ 4.1 ≤ 4.9 ≤ 4.9
The above table has to be divided into sub-tables, where each sub-table represents a specific AADT/Vehicle speed entry. Table 3 presents one such case.
Table 3, Example of a sub-table that aims to define the correlation between the MOBI-ROMA pavement quality grade and IRI.
70 / 2000-4000 (km/h / vehicles/day) MOBI-ROMA
color MOBI-ROMA
grade IRI (mm/m)
≤ 1 ≤ 2.2 2 ≤ 3.3 3 ≤ 3.4 4 ≤ 3.6 5 ≤ 3.9 6 ≤ 4.1 ≥ 7 > 4.1
The tables above are examples that use IRI thresholds defined by the Swedish Transport Administration. The only correlation between the MOBI-ROMA grade and the IRI is where the MOBI-ROMA grade is set to higher than 7, which correlates to the IRI threshold. By assigning MOBI-ROMA grade 3-6 linearly over the 20% below the IRI threshold a warning level is defined. Values below the 20% are assigned MOBI-ROMA grade ≤ 2.
Each MOBI-ROMA grade is attached to a color representation that aims to illustrate the need of maintenance.
Interesting pre-set road variables useful for correlating a specific pavement quality or IRI with the maintenance tool color grade are:
Road type (Highway, Normal road, City road) Road category (The importance of the road regarding delivery of goods) Speed limit Traffic flow (Vehicles per day) Country standard (Each country has different pavement quality standards)

ENR2011 DESIGN MOBI-ROMA D4 Final Report
Page 29 of 101
To attach specific measurements with the above stated road variables demand close collaboration with the involved countries’ road administrations. Because the pre-set road variables differ between countries, national road databases have to be integrated with the web based maintenance tool. National road databases currently contain most of the above stated variables, but lack in segment resolution, which makes it hard to connect geographical positioned measurements with segments. To accurately connect pavement quality measurements with segments a resolution of under ~150 meter is necessary.
In the current system set up the MOBI-ROMA quality grade is defined according to a non-linear representation of worst pavement quality found in the Gothenburg area and a newly paved highway in the same area, measured using data from the CAN-bus from a Volvo V70.
The outcome of the validation of the pavement quality algorithms show that the pavement quality grade is closely related to IRI. Since the main input parameter to the pavement algorithms is lateral vibrations, deep rutting might affect the pavement quality grade to some extent, but no further investigations regarding this could be performed due to hardware restrictions. This is due to restriction in the CAN-bus signal list, as of now no vertical acceleration signals are available for retrieval through the OBD2 outlet.
Signal comparison is affected negatively by a significant difference in time between measurements provided by the Swedish Transport Administration and measurements performed within the MOBI-ROMA project. This means that maintenance work could have been performed during the one year time difference. Another source that affects the results negatively is the coordinate matching. All MOBI-ROMA measurements are attached to a geographical coordinate and the validation set provided by the Swedish Transport Administration is attached to a distance (meter) from start variable. Converting the GPS positions into distance was done using the Haversine formula between each coordinate, using a start and end coordinate. [14] [15]
Each stretch was measured in the right drive lane and in the stated speed limit of the specific road stretch. The MOBI-ROMA measurements have a resolution of one value per second, due to hardware limitations. Measurements provided by the Swedish Transport Administration have a resolution of one value per 20 meters. In clear terms this means that results generated by the algorithms have a lower resolution in velocities over 72 km/h. [14] [15]
The correlation between the MOBI-ROMA quality grade together with its color representations and IRI is not trivial. Several parameters influence on how the exact values should be mapped together. The mapping mainly depends on country specific IRI-thresholds, vehicle velocity and AADT. Other factors also affect the correlation, such as repeatability, road type, road category and filtering affects. An approach where all MOBI-ROMA values that lie above the IRI-threshold are seen as of poor quality and are represented by a MOBI-ROMA quality grade over 7. The values that are within 20% under the IRI-threshold are seen as average quality, a MOBI-ROMA quality grade of 3-6. All values below 20% are seen as good quality (green).
It is clear that presently used alternative methods provide more exact results. However, the strength of the MOBI-ROMA method is that it is very cheap, does not need a specialized measurement truck and cover large geographical areas. At the same time it is shown that in-vehicle sensors are able to deliver results comparable with IRI data measured with laser equipped measurement vehicles.

ENR2011 DESIGN MOBI-ROMA D4 Final Report
Page 30 of 101
5.2 Method for spring thaw analysis
Road weather information together with indications from an advanced, purpose-built hardware are collected and stored in a central database. By using meteorological information the road weather model classifies the risk of spring thaw within an area of 20x20 km. The risk is divided into three classes: low, medium and high risk of decreased load bearing capacity. An overview of the system is shown in Figure 17.
Figure 17, BiFi system overview
The hardware unit placed in the vehicle feet is equipped with a powerful processor, accelerometer, gyro, modem, GPS, battery and SD-card (Figure 18 and Figure 19). The main sensor is the accelerometer, which is used to detect lateral vibrations. The vibrations are then run through several filters and algorithms, developed in BiFi (II), before a result is put out. The result consists of a classification grade, coordinates and a timestamp. When the vehicle is turned off the battery takes over and the data is transferred, using 3G/GPRS, to a central database.
Figure 18, Purpose built hardware with front connections visible
Figure 19, Purpose built hardware with back connections visible

ENR2011 DESIGN MOBI-ROMA D4 Final Report
Page 31 of 101
As the vehicle drives through corners on a dirt road the hardware unit records the data coming from the accelerometers. This data is then processed and a judgment is made to whether the road is hard or soft. The result, together with a timestamp and GPS coordinates, is stored on the SD card until it can be transmitted. Due to lack of 3G/GPRS coverage in rural and forest regions and interference from other systems active in the vehicle the data is stored until the vehicle has come to a rest and the ignition is turned off. The hardware’s internal battery supplies power as the data is uploaded to a central database from where it is accessed and analyzed.
The vehicle algorithm uses the vehicle’s vibrations to detect whether the road surface is soft or not. For example, lateral acceleration occurs when the vehicle drives through a corner and the centrifugal force applies a lateral force on the vehicle, pushing it outwards as in Figure 20. The roughness or softness of the road then affects the vibrations of the vehicle.
Figure 20, Centrifugal force generating lateral acceleration that creates vibrations in the vehicle
The vibrations are analyzed and different road surface characteristics can be found. Tests in BiFi have shown that relatively small vibrations are enough to generate a good result.
The algorithm contains four main parts that all have veto when a spring thaw indication is generated. The four parts use different parts of the vibration signal together with the vehicles velocity.
Figure 21, Hardware unit model overview

ENR2011 DESIGN MOBI-ROMA D4 Final Report
Page 32 of 101
Part one analyzes how much energy the vibration signal contains after passing through a number of filters. The second part is activated when the vehicles lateral force is large enough and part three decides whether the vehicle is located on a gravel road. The last part decides whether the vehicle is within a reasonable velocity interval. For a more in detail description of the hardware unit model see referenced BiFi report [11].
The output from the hardware units are available in the MOBI-ROMA web based maintenance tool as color coded indication attached to the geographical position where the measurement took place. An example of the output is shown in Figure 22, where the orange/red markers indicate that there is high risk of decreased load bearing capacity and the green markers represent low risk of the decreased capacity.
Figure 22, Surface softness result generated and uploaded by the hardware unit
The next major step in the BiFi system is to compare data generated by the hardware units with data from fixed weather stations and weather forecasts. In Sweden, this is done in a road weather model which is based on a modified energy balance model. The road weather model collects data from fixed weather stations and weather forecast data from national weather providers to compute a road weather forecast. The output is given as around 30 000 squares (4x4 km), seen in Figure 23, where each square contains a computed risk of surface softness within the square.
Data from the hardware units are then attached to the 4x4 km squares and an interpreter model generates more accurate results. The interpreter takes into account data from the vehicle fleet and merges it with the road weather forecasts.

ENR2011 DESIGN MOBI-ROMA D4 Final Report
Page 33 of 101
Figure 23, Road weather forecast squares covering Sweden
To increase reliability and ease work load on the web based maintenance tool all squares are merged into 20x20, 40x40 and 200x200 km squares. Each square is assigned a color; green, orange or red. Where red squares indicate high risk of surface softness within the area, orange medium risk and green low risk. An example taken from the web based maintenance tool is shown in Figure 24.
Figure 24, Final result generated by the interpreter model

ENR2011 DESIGN MOBI-ROMA D4 Final Report
Page 34 of 101
5.2.1 Validation
The vehicle signals have been tested against a dynamic cone penetrator, DCP. Which is a hand held device that consists of a rod on which a cone is repeatedly forced into the road material by the action of a hammer weight being dropped from a constant height. The results can then be computed into a load bearing value; California Bearing Ratio (CBR) and compared with the system output generated by the interpreter model. DCP has been recommended as a functional and effective method for measuring bearing capacity in unbound materials.[16] During the first BiFi project tests were also performed using fall weight deflectometer (FWD) as an alternative method, it was however not found to be suited to measurements in saturated gravel.
CBR values are proportional to the shear strength of the material, a property which is controlled by several factors: grain size, grain shape and water content. In the context of ground frost, the water content plays a very important role in reducing the shear strength of the material. As the amount of pore water increases so does pore pressure and the water effectively forces the particles apart, thus reducing contact between grains and therefore the shear strength of the material. As the ground begins to thaw from the surface and down, water is trapped in the surface layer by the frozen material below. The effect of this is that the surface layer is saturated with water, decreasing the shear strength and the bearing capacity of this layer.
Table 4 CBR% values for a range of materials. There is an overlap between materials and conditions of same materials. A saturated gravel road can be as soft as clay. Values where obtained during BiFi (I), and more information can be found in BiFi Project report appendix. [11]
Materialtype CBR%
Clay 0‐10%
Sand 10‐20%
Saturatedgravelroad 10‐40%
Unpackedgravelroad 20‐50%
Wet packed gravel road (Wheeltracks)
50‐100%
Dry packed gravel road (Wheeltracks)
80‐170%
Frozengravelroad 140‐600%
When considering a network of gravel road there is a large variability within the road network as to the timing and severity of the spring thaw. This means that any method of determining the severity of the spring thaw that uses point measurements is limited to the amount of measurement points. For the purpose of BiFi we used the average CBR value from a set number of points as reference value. The outcome was also compared with historical weather information. And the results show that when we have an increase in the ratio of soft/hard indications from the vehicles there was a corresponding decrease in CBR values, see Figure 25. At the point when the ratio of vehicle signals reached 40% the CBR values for the same area had dropped below 30%.

ENR2011 DESIGN MOBI-ROMA D4 Final Report
Page 35 of 101
Figure 25 shows average surface CBR values on left axis and percentage of signals that indicated soft surface. The CBR values are calculated as the average of 7 measurement points along the 5km long test road.
Determining the limits for red, yellow and green to be used in a situation as is shown in the schematic in Figure 26, was done by comparing CBR values with vehicle signal ratios. When the ratio is more than 22% the system classes the area as red on the map, warning for the risk of low bearing capacity. There is a baseline ratio between soft and hard signals of ca. 5-8%, meaning that the vehicles as they were equipped during the last trials give false positive indications for surface softness. See Appendix A.3 of Report D2 for more details regarding reference measurements. [2]
At this point in the development of the system the limits are set low intentionally to ensure that the system should be within the margins of error.
During the winter season (2012-2013) a demonstration project funded by the Swedish Transport Administration will seek to test the system in an operational environment and to better establish the connection between the BiFi warning categories and the bearing capacity of the gravel roads.
Table 5 Definitions of the BiFi warning categories. Currently the limits are defined as the ratio between soft/hard vehicle signals: green<12%, Yellow between 12-22% and Red >22%.
Surface softening in large parts of the area. Heavy vehicles are advised not to operate in the area.
Surface softening in parts of the area, alternatively no information. Heavy vehicles should use caution when operating in the area.
Surface softening not indicated in area. Heavy vehicles can operate in area.

ENR2011 DESIGN MOBI-ROMA D4 Final Report
Page 36 of 101
Figure 26, Schematic of distribution of high risk signals over a season and risk categories As the risk categories are defined in the current version of BiFi, green<12%, Yellow between 12-22% and
Red >22%.
5.3 Method for slipperiness analysis
A SRIS system model is used to process weather and vehicle information to produce useful output information. Road weather information together with indications from vehicles standard safety systems are registered and stored in a central database. The vehicle data is fetched from the CAN-bus network through the OBD2-outlet. By combining these two data types reliable information about winter road conditions are collected.
The SRIS system model is built up by three main parts:
Vehicle model Road weather model Interpreter model
For the SRIS system model to work the road network has to be divided into smaller segments that are connected to nearby road weather stations. By using meteorological information the road weather model classifies the slipperiness of each segment. The classification is divided into three risk categories: not slippery, slippery and very slippery. The output from the road weather model is then compared with the output of the vehicle model. The number of vehicle indications per segment then decides whether to discard or strengthen the road weather models classification.
The final result is presented by the interpreter model. The interpreter model also allows several parameter adjustments.

ENR2011 DESIGN MOBI-ROMA D4 Final Report
Page 37 of 101
Figure 27 shows a schematic view of the SRIS system model. Data used as input by the model comes from two main sources, floating car data and weather related data:
1. Floating car data is delivered in real-time from the vehicles into the interpreter model; data includes air temperature, event data and spatial data. The data is weighed against the RWIS system.
2. The road weather model collects external RWIS data and weather forecasts. It also uses floating car data that has been processed by the interpreter. The road weather model produces a forecast which is sent back to the interpreter. Air temperature data from vehicles is used to iteratively adjust the road weather model as new data is delivered. Furthermore event data is used to amend the road status, producing a more accurate forecast.
Figure 27, SRIS model overview

ENR2011 DESIGN MOBI-ROMA D4 Final Report
Page 38 of 101
5.3.1 Validation
Validation was performed analysing the relation between signals from the vehicle fleet and actual road conditions. The data collected from the vehicles are classified as “event data”, and are parameters that directly or indirectly are connected to road friction; the anti-lock brake system and the traction control system. When either of these is activated a signal is sent with the action and position. These systems can be provoked by aggressive driving when the road is dry and not slippery. However these false positive signals are few in number and add up to 0.84% of signals in dry non-slippery conditions.
In summary, the active systems in the car that helps the driver can be triggered in two ways:
Through aggressive driving, i.e. driving too fast. Through reduced friction between the car and pavement.
In the early stages of SRIS there where several small scale tests, to test the hypothesis that vehicle data could give information concerning road weather status. A Volvo V70 was equipped with a CAN-Bus logger and the signal pattern was compared during different weather conditions. As seen in Figure 28 the amount of “event signals” correspond closely to the road conditions. This is also mirrored by the statistics from the season of 2007–2008 seen in Table 6.
For the statistical analysis, road weather data was collected from road weather stations during the seasons of 2007-2008 and was then sorted using an expert system to classify the different types of slipperiness. [17] The signals from the vehicles were sorted with regard to the type of slipperiness that was registered at the closest road weather station.
Table 6 shows the allocation of event data and background data, based on type of slipperiness. As Background data is sampled every 30 seconds, the variable Events per hour can be calculated. It is noticeable that the difference between the event rate during slippery situations and non-slippery situations is large. To test if the difference (i.e difference between dry conditions and the other weather conditions) is significant, a two-proportion z-test was conducted. If the z-value is larger than 2.6, the difference is significant on the 99%-level. The z-test shows that there is no significant different difference between the event frequency during dry and rainy conditions, which indicates that the roads were not slippery. For the weather types that suggest that the roads were slippery (Rain on cold road, Snow and Frost), the difference of event frequency compared to the dry conditions was significant.
Not only was the vehicle data good at mirroring the prevailing road conditions but the data also showed that the vehicles could detect situations that the RWIS system failed to predict. In report D2 some illustrative cases are shown. [2] These cases show that with road weather stations as the only data source it is difficult to predict what the conditions on the roads actually are. They also show that the SRIS floating car data can detect slippery conditions when the road weather stations do not catch the slipperiness. However there are limitations to the SRIS approach, and the main limitation is framed by the amount of vehicles that are connected in a given area at a given time, this means that the fleet that is supplying data must be sufficiently large so that it covers the area of interest.

ENR2011 DESIGN MOBI-ROMA D4 Final Report
Page 39 of 101
Figure 28, Validation measurements. Amount of event indications registered during different weather conditions.
Table 6, Distribution of event and background data in relation to weather conditions. A z-value calculated by a two-proportion z-test greater than 2.6 shows that the difference is significant on the 99%-level.
DRY / NON-SLIPPERY
RAIN RAIN ON COLD ROAD
SNOW-SLIPPERY
FROST SLIPPERY
Events 10861 1512 1126 3256 789
Background 1291426 174314 13459 27764 30659
Events per hour 1,0 1,0 10,1 14,4 3,1 z-value 0,0 0,2 11,8 23,2 4,2

ENR2011 DESIGN MOBI-ROMA D4 Final Report
Page 40 of 101
6. Development of the Graphical User Interface
6.1 MOBI-ROMA maintenance tool in brief
The combination of different sources of data gives a novel opportunity for efficient monitoring and detection of variations in surface conditions, both before and after various maintenance works. The approach of using floating car data together with fixed measurement stations from various data sources is the core of Mobi-Roma. The collected data should be available in one coherent maintenance tool. The maintenance tool can be of several forms and shapes, depending on the data types. Since all data in the Mobi-Roma pilot are geographically positioned a Graphical User Interface based on a map application is the logic choice. Using a map as the application base eases the ability for operators to quickly and efficiently estimate pavement quality, load bearing capacity and winter road conditions of a road. A maintenance tool of this type provides objective information that aids decision making of often costly maintenance work.
The maintenance tool GUI is developed so that several data types can be fed into the same system; thus, allowing operators to use one tool for different road types and data types. The GUI also makes it possible to show long term effects on the road network; therefore, it is possible to compare current measurements with data collected last year. This allows operators in road maintenance stations to see trends, for example that a specific corner on a dirt road is affected by decreased load bearing capacity every year. In this example it could be an indication that the underlying road bed is weakened and has to be strengthened.
A graphical user interface, GUI, is the space where human-machine interaction occurs. The GUI allows users to manipulate application content, alter the application setup, to decide what information to show and much more. The GUI also displays the effects of a user’s actions/manipulations. [18]
The information utilised in Mobi-Roma is of such extent that an extensive GUI had to be developed. Alternative representation methods, such as text, tables and graphs, simply would not cope with the large amount of data. Since all data used in Mobi-Roma is geographically positioned the logic choice was to use a map as the main method of presentation. Surrounding functionality was then added to ease interaction with the map. Due to the extensive amount of data several methods that aim to ease the computation load on the map were developed.
The MOBI-ROMA framework encompassing database and graphical user interface is unique in its capacity to ingest and display in meaningful ways, different types of floating car data. The web based platform allows users to access the service independently from what type of hardware platform they are using, be it Windows, iOS, Android, MacOSX, Linux etc. Furthermore, the flexibility of the MOBI-ROMA framework enables easy additions of new types of data, thus expanding the utility of the tool.

ENR2011 DESIGN MOBI-ROMA D4 Final Report
Page 41 of 101
Figure 29, Network layout and functionality used in the Mobi-Roma GUI
The GUI can be divided into three main blocks: Client-side, Server-side, and Database.
In computer networking the client-side refers to operations performed at the client. Scripts on the client-side often run on a user’s web browser, either on a standard desktop computer or on a smart-phone/tablet. In this case the client-side handles most of the functionality related to presenting graphical information, such as the map, buttons and images. The programming
languages used on the client-side are JavaScript3, HTML4 and CSS5. A couple of external
libraries eased development; the two main libraries are jQuery6 and Google Maps JavaScript
API7.
The server-side, on the other hand, handles operations performed by a server. In this case the server is located in an external web hotel. The server-side holds data processing methods, database logic and a web service used to retrieve information from the vehicle fleet. The server also houses the climate model and the interpreter, which runs every third hour, generating and
interpreting new spring thaw forecasts. All server-side functionalities are built upon C#/.NET8.
3 JavaScript is a prototype-based scripting language that is dynamic, weakly typed and has first-class functions. 4 HTML is short for HyperText Markup Language and is the main markup language for displaying information in a web browser, such as web pages, images, buttons, etc. 5 CSS is short for Cascading Style Sheet and describes presentation semantics of a document written in a markup language, such as HTML. 6 jQuery is a JavaScript library that simplifies HTML document traversing, event handling, animating, etc. 7 Google Maps JavaScript API allows developers to embed Google Maps on web pages. It also includes methods for adding objects on top of the map. 8 The .NET framework provides a comprehensive and consistent programming model for building desktop- and web-applications. C# is one of several programming language within the .NET framework.

ENR2011 DESIGN MOBI-ROMA D4 Final Report
Page 42 of 101
The database, located on the server-side, holds all data used in the Mobi-Roma pilot project. It keeps track of independent vehicles and the data collected by each vehicle and at the same time all information regarding load bearing capacity, pavement quality and winter road conditions. Due to privacy regulations no information is stored that connects a specific vehicle directly with individual measurements. The database also holds weather information, used by the climate
model, downloaded from external sources. The database is built upon a MySQL9 database.
Communication between the client-side and the server-side is handled using HTTP10 and
JSON11.
6.2 Contents of the maintenance tool
The Mobi-Roma maintenance tool GUI currently consists of four main data types, collected from several parallel projects.
Load bearing capacity generated by combining floating car data with weather data and
information collected from fixed measuring stations along the road net. The computations result in about 30.000 4x4 km squares that currently cover Sweden. The outputted result in each square contains a timestamp and can take three colours: green, orange or red. Green means that the risk finding a soft gravel road within that square is very low. An orange square means that roads within the square could be affected by spring thaw and thereby a possible decreased load bearing capacity. Red squares represent high risk of decreased load bearing capacity, several road segments within the square are affected by spring thaw. The squares are interpolated to three square sizes; 20x20, 40x40 or 200x200 km. Thus allowing the opportunity for specific users to see less detailed information.
Load bearing capacity information generated directly in the sensor equipped vehicles. The
data in this category can be used to see exactly in which corner of a road spring thaw is occurring. It is also possible to see the relationship between soft and dry/frozen indications. This data type is presented as geographically positioned indications/markers. In this mode there are two types of indications; red/yellow markers indicate that a soft segment of the road has been identified and a green marker that the road segment is dry or frozen.
Pavement quality is presented as indications/markers. Vehicles automatically upload new
information to the database and it is in real-time available on the map. A scale from zero to ten indicates the pavement quality, ten being good/smooth pavement. Each grade is represented by a color, going from purple (bad) to green (good). This allows maintenance operators to easily detect stretches with a low quality grade. See Figure 30 on the next page.
9 MySQL is an open source relational database. SQL stands for Structured Query Language and is a programming language designed for managing data in relational database management systems, RDBMS. 10 HTTP stands for Hypertext Transfer Protocol and is an application protocol used in distributed, collaborative and hypermedia information systems. HTTP is the foundation of data communication on the World Wide Web, WWW. 11 JSON stands for JavaScript Object Notation and is a data-interchange format that is easy to read/write and parse/generate for both humans and machines.
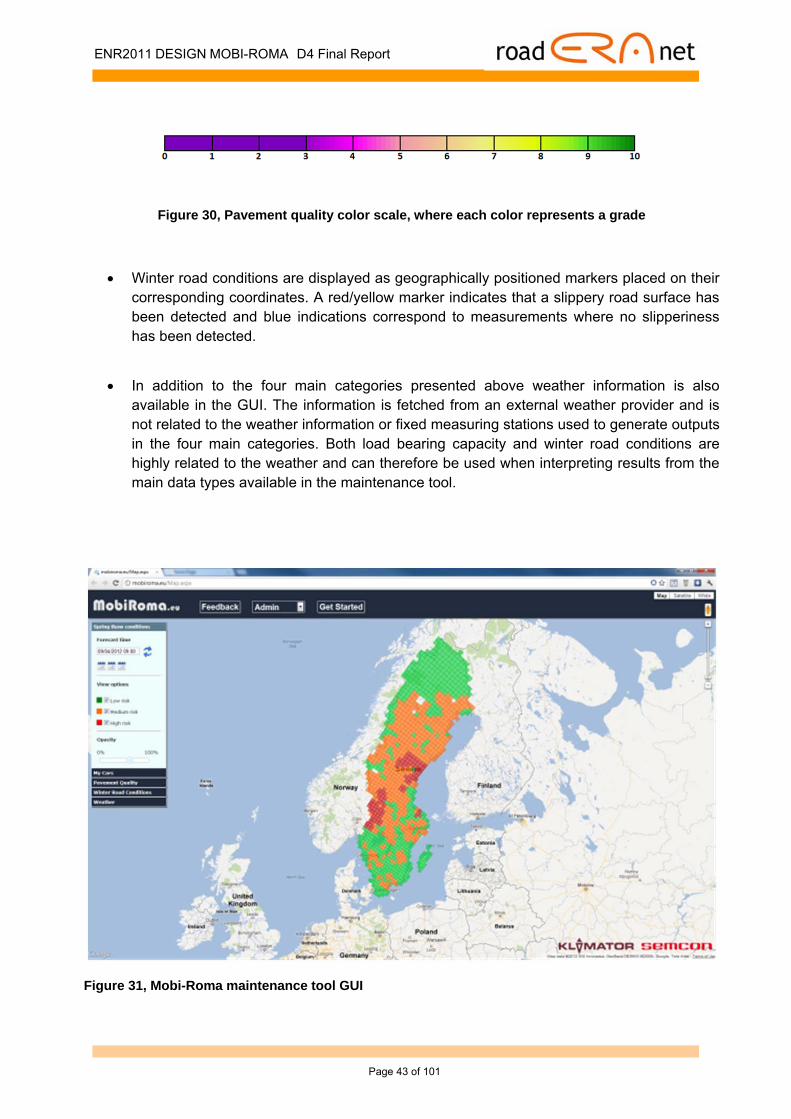
ENR2011 DESIGN MOBI-ROMA D4 Final Report
Page 43 of 101
Figure 30, Pavement quality color scale, where each color represents a grade
Winter road conditions are displayed as geographically positioned markers placed on their corresponding coordinates. A red/yellow marker indicates that a slippery road surface has been detected and blue indications correspond to measurements where no slipperiness has been detected.
In addition to the four main categories presented above weather information is also
available in the GUI. The information is fetched from an external weather provider and is not related to the weather information or fixed measuring stations used to generate outputs in the four main categories. Both load bearing capacity and winter road conditions are highly related to the weather and can therefore be used when interpreting results from the main data types available in the maintenance tool.
Figure 31, Mobi-Roma maintenance tool GUI

ENR2011 DESIGN MOBI-ROMA D4 Final Report
Page 44 of 101
Each data type has its own section with corresponding settings and customization possibilities attached to it. When a new section/tab is selected the map is cleared and information for that specific section/tab is shown on the map. The new information is shown with suitable settings. As seen in Figure 32, the Pavement Quality tab is selected and data regarding other tabs is hidden while pavement quality data is displayed. The graphics of the underlying map can be changed and currently there are three map modes: normal map, satellite map or a white map. To change the map type, use the buttons in the top right corner of the GUI.
Figure 32, Overview of GUI with the Pavement Quality tab selected
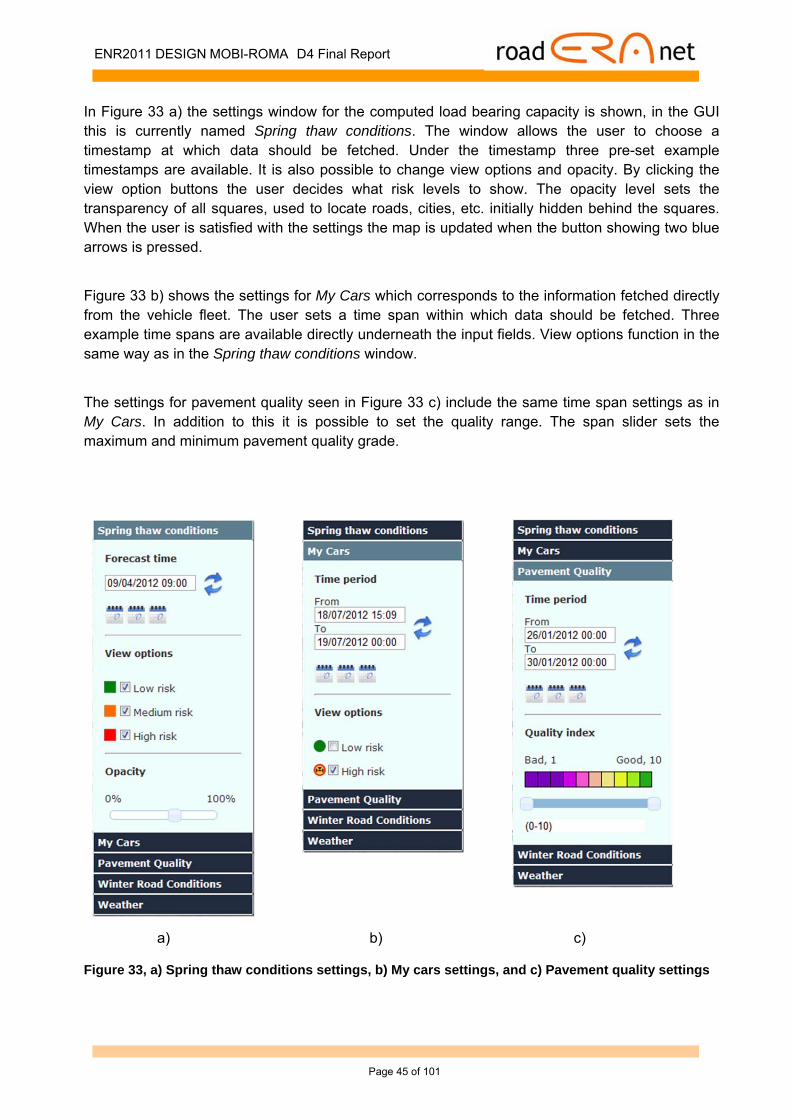
ENR2011 DESIGN MOBI-ROMA D4 Final Report
Page 45 of 101
In Figure 33 a) the settings window for the computed load bearing capacity is shown, in the GUI this is currently named Spring thaw conditions. The window allows the user to choose a timestamp at which data should be fetched. Under the timestamp three pre-set example timestamps are available. It is also possible to change view options and opacity. By clicking the view option buttons the user decides what risk levels to show. The opacity level sets the transparency of all squares, used to locate roads, cities, etc. initially hidden behind the squares. When the user is satisfied with the settings the map is updated when the button showing two blue arrows is pressed.
Figure 33 b) shows the settings for My Cars which corresponds to the information fetched directly from the vehicle fleet. The user sets a time span within which data should be fetched. Three example time spans are available directly underneath the input fields. View options function in the same way as in the Spring thaw conditions window.
The settings for pavement quality seen in Figure 33 c) include the same time span settings as in My Cars. In addition to this it is possible to set the quality range. The span slider sets the maximum and minimum pavement quality grade.
a) b) c)
Figure 33, a) Spring thaw conditions settings, b) My cars settings, and c) Pavement quality settings

ENR2011 DESIGN MOBI-ROMA D4 Final Report
Page 46 of 101
In Figure 34 a) the user can set display options for Winter road conditions. The timestamp has the resolution of one day, and all data between 00:00 and 24:00 on the chosen day is fetched. In addition to setting a date the user can set whether markers indicating slippery road surface should be shown or not. The same option is available for the non-slippery indications.
The standard weather information is always shown, but the user can show/hide an overlaying cloud cover, as seen in the settings window shown in Figure 34 b).
Figure 34, a) Winter road conditions settings, b) Weather settings
SRIS data ingested into the maintenance tool
The ingestion in the MOBI-ROMA GUI gives the user the ability to access the data in a way that the original SRIS project never enabled. The background data was collected from vehicles at regular intervals, delivering the location and air temperature. In the GUI the temperature as well as the position is displayed enabling the user to get an overview of the amount of events as well as the temperature interval that the fleet is experiencing (Figure 35). The Google Maps environment also enables detailed zooming, letting the user to accurately see where the event data is coming from. As with the GUI for the pavement quality there is the possibility of adding more detail, as well as producing averages and statistics for stretches of roads and areas, features that are valuable for the end user wishing to optimize their winter maintenance operation or the local road authority given the task of oversight.

ENR2011 DESIGN MOBI-ROMA D4 Final Report
Page 47 of 101
Figure 35, The 25th of March 2008, Snowfall in Gothenburg causes slippery conditions.
Almost all indications contain information windows which are displayed when a marker is clicked. The information window contains additional measurement information such as timestamp, coordinates and sensor imei id. The imei id is used to connect the sensor units with its corresponding measurements stored in the central database. See Figure 36 on the next page.

ENR2011 DESIGN MOBI-ROMA D4 Final Report
Page 48 of 101
Figure 36, Information window
The maintenance tool is available online on http://mobiroma.eu. The GUI is found under the link
Map in the web page or at its direct link http://mobiroma.eu/Map.aspx. An application walkthrough is available within the GUI, seen in
Figure 37, or at http://mobiroma.eu/Help.aspx. If changes are made in the maintenance tool, the walkthrough will be updated accordingly.

ENR2011 DESIGN MOBI-ROMA D4 Final Report
Page 49 of 101
Figure 37, Link to application walkthrough
ENR2011 DESIGN MOBI-ROMA D4 Final Report
Page 50 of 101
7 Assessing needs of maintenance with MOBI-ROMA
The European road administrations can use FCD as a novel source to provide information on the road network to allow and to increase the amount of data on which assessment of maintenance needs are based. Methods applied today focus on accuracy, which for practical and economic reasons decrease the total amount of roads that are measured. MOBI-ROMA provides a complimentary source of information to help the decision making in various specific road maintenance needs.
7.1 Pavement quality maintenance
Presently pavement quality is measured with laser equipped measuring vehicles, which is very exact but an expensive method. In Sweden the aim is to measure all roads with road number < 100, including the European road network, once every year. Roads with AADT > 4000 are also measured every year. This is in most of the cases done in the right lane in one direction. The average sized roads are measured every fourth year, in one lane and direction. It is clear that the present method provides a limited information base on which maintenance decisions are based. To cover the majority of the road network, measurements in all lanes, and in both directions have to be done using vehicles that are already there driving for other purposes; e.g. while going to work, to the gym, to the holiday cabin, etc. This is where the strength of MOBI-ROMA and its use of FCD come into play, proving the road administrations with data for the complete road network with reasonable extra costs. MOBI-ROMA would in this case provide post-season information, which makes it possible to find degradation of specific roads that differ from the pre-set maintenance plans. [13] Road managers are also able to adjust the tool to their own specific needs and quality thresholds according to national maintenance practices. In validation Chapter 4.1.1., the threshold table adjusted to the operational use for the Swedish Transport Administration is shown, but other countries and Road Administrations could tailor the scale and limits to better fit to their local practices.
7.2 Dynamic regulations of load restrictions
Information related to spring thaw can be divided into real-time and post-season. The real-time information allows for an objective and dynamic regulation of gravel roads to decide which of those should have a downgraded load bearing capacity. In a fully operational version of MOBI-ROMA system, the situation could be analysed on a daily basis at local level, covering the gravel road network extensively. As with the previous pavement quality application, the load bearing capacity thresholds can be adjusted according to local regulations and practices.

ENR2011 DESIGN MOBI-ROMA D4 Final Report
Page 51 of 101
The decision making is today done based on measurements by road maintenance personnel using experience and visual inspection as methods for determining weight restrictions. However, as experience varies from person to person and visual inspection is notoriously difficult, this method can be very subjective and ambiguous. In present economic situation the old method is also too inefficient. This leaves gravel roads closed for too long periods and as a consequence the lumber industry is cut off from their products, causing delays and economic losses. With MOBI-ROMA however, the decision making can be improved both in temporal and spatial scale, minimizing the negative effects of spring thaw.
The post-season spring thaw information could be used to find problem areas, which then could be addressed before the road degrades to a limit where it has to be closed.
7.3 Winter maintenance needs
Slipperiness is difficult to forecast if only based on weather information from fixed station network and thus the use of FCD information is of high importance. By combining the two sources of information a much more accurate picture can be found, allowing traffic to travel more safely on the road network. It also provides the road administrations with an information base upon which decision regarding timely winter maintenance measures can be set and planned. However, the quality of mobile information depends on the size of the vehicle fleets. In operational road weather forecasting, early warnings of slipperiness are the most valuable ones. Winter maintenance actions should be pre-emptive rather than reactive. Thus MOBI-ROMA system having very high spatial and temporal resolution on the road network provides a new beneficial source of slipperiness warning information that is readily exploitable in daily road weather services. In addition, slipperiness data gathered from FCD system can be used in historical analysis evaluating the actions of maintenance contractors and how they have fulfilled the respective quality levels in winter road maintenance. Archived data can also be used to analyse and find the problem spots on the road network, those that freeze more often and earlier than the average. These can then be treated proactively using the appropriate winter road maintenance measures.
7.4 Other MOBI-ROMA benefits
As stated above, there are mainly two types of data; real time and season based. The real time information supports road administrations and their subcontractors in the daily maintenance work, indicating possible problems before there are real noticeable flaws on either dirt or paved roads. The season based information can be used in long term maintenance planning, where MOBI-ROMA information provides information that could cover a country’s complete road

ENR2011 DESIGN MOBI-ROMA D4 Final Report
Page 52 of 101
network. The road administrations can then do season-by-season or month-by-month comparisons and see if the degradation follows the pre-set maintenance plan. Comparing MOBI-ROMA with existing methods is not straightforward, mainly since the alternative methods differ to such extent that it is hard to find methods of how to compare the different data types. Pavement quality however has alternative measurement methods in form of laser equipped measurement vehicles. In today’s MOBI-ROMA system the laser measurements win in almost all categories; resolution, accuracy, number of parameters, etc. But the fact that FCD uses existing vehicles that already fill the complete road network allows for a complete coverage, which is something that laser equipped vehicles won’t achieve. This allows for less accurate measurements focused on the road network with average/low sized roads or roads with low AADT. MOBI-ROMA both complements existing information gathering techniques and provides novel techniques in new areas. It is also possible to ingest other measurements in addition to the three applications described earlier. As an example, collection of air quality data has been tested in small scale, one case shown in Figure 38. Once applied to a larger vehicle fleet, this would result in a fourth data type that could easily be inserted in a MOBI-ROMA service application. And it would be relatively easy to add any new FCD parameters to the system, once they become part of the operational measuring routine. In summary, MOBI-ROMA provides both real-time and season-based information upon which road administrations can take decisions about maintenance needs both during and after the current season. The information is combined and presented without any manual work; therefore all gathered information can be seen as objective.
Figure 38, An example of mobile measurements of NO2 in Gothenburg, Sweden.

ENR2011 DESIGN MOBI-ROMA D4 Final Report
Page 53 of 101
8. Evaluation
8.1 Introduction
Evaluation is an integral part of every research project. It is important for basic research just as it is for applied research, as both serve a higher purpose, which is to develop things further, e.g. to deepen the knowledge about something, improve a service or an applications. There may be one principal question leading the research activities. In the evaluation it is then further split into more specific questions.
For setting up an evaluation scheme, the first question is what is the subject of evaluation. Is it something that has been developed or implemented or built, or is it an idea or innovation, a new technology or a remedy for some problem and we want to know if it’ll work before we spend a lot of money and effort on its development and implementation. The latter is usually referred to as ex ante evaluation, as opposed to ex post evaluation, which looks at the effects of something after its implementation.
Ex ante evaluation means that the value of something is being assessed from what is there before. In most cases it involves a number of assumptions. Typically, this is being done for innovations such as new technologies, services or business concepts. It’s tricky, because we evaluate an idea or in the best case a pilot, but not a full service or application yet. This means we evaluate the potential of something, to see whether it is worth digging deeper and to invest more money.
In MOBI-ROMA we did exactly this – we had an idea for a new way to collect data for road maintenance assessments, i.e. by floating cars, and wanted to know if this was a good idea. There are two aspects to evaluate: first, is the new method reliable and feasible, and can we practically produce a tool that can be used by road administrations? And second, does anybody need this service or what would it have to be like to be usable and beneficial? Therefore, the evaluation was divided into a self-evaluation and a user evaluation.
The objective of this research is to introduce a new tool for cost effective road management. The approach is to combine and process available data from fixed measuring field stations and floating cars. The combination of different sources of data gives a novel opportunity for efficient monitoring and detection of variations in surface condition both before and after different maintenance works. This approach enables development of maintenance tools for road conditions during various times of a year and various traffic conditions. This project intends to demonstrate the applicability of MOBI-ROMA in a pilot project.
The basic hypothesis is that in-vehicle information from the CAN-bus outlet provides several kinds of mobile observations that can be used in combination with data from fixed stations to assess road surface conditions and other parameters that are considered as important for road maintenance planning. This seems possible since the variation of road surface conditions is related to the signal from the vehicle.

ENR2011 DESIGN MOBI-ROMA D4 Final Report
Page 54 of 101
Our further hypothesis is that we can use information from normal car sensors that can be refined to estimate the condition of a single road section. This information will then be gathered from several cars to give a picture of the status of the complete road network. In a future system, we believe, it will be possible to follow the changes in the road network on a week-to-week basis. The tool would need no further development of existing road information infrastructure or equipment, since the can be accessed from standard personal computers with an Internet connection.
In MOBI-ROMA we carried out basic research, the results of which might be valuable for a wider range of applications that need to be further specified yet. In other words, we evaluated an idea for new technology, i.e. the use of floating car data for road management assessment.
The subject of our evaluation was the application http://mobiroma.eu/Map.aspx, its appearance and its functionalities based on the technological innovation of using floating car data for road maintenance assessment. At the time being the website is a pilot containing a very limited amount of data, but showing in principle what such an application could look like.
Validation of data and algorithms has been dealt with in other projects, e.g. BiFi, SRIS. [11] [12]
It is important to stress here what we did not do. We did not evaluate the quality of the data or the algorithms that are being used to generate the information displayed in the pilot application. As stated in the MOBI-ROMA project application this evaluation and quality control is being dealt with in other projects that are closely related to MOBI-ROMA and the data of which we have been using for our purposes, namely BiFi and SRIS.
8.2 Methodology
The evaluation task in MOBI-ROMA is that of an ex ante evaluation. And it is a qualitative assessment. Nobody understands better what the development will be like than the developer; but for the self-evaluation you have to ask the right questions in order to minimise the bias. We chose to use an adapted version of the AINO worksheet evaluation tool (see Annex 1) to make sure we cover all the important aspects of the development. The tool was developed in 2006-2007 by VTT Technical Research Centre of Finland in the EVASERVE12 project. It was designed for evaluation of information services in the fields of transport and logistics, but it is suitable also for other information services. The AINO programme (2004-2007) was a research and development programme on real-time transport information initiated by The Ministry of Transport and Communications Finland13.
In the attempt to provide a most realistic picture, several of the project partners (see Table 7) filled in the worksheet and the results were then combined.
12 http://partnet.vtt.fi/evaserve/index.html 13 http://www.lvm.fi/fileserver/LVM45_2007.pdf

ENR2011 DESIGN MOBI-ROMA D4 Final Report
Page 55 of 101
Table 7: List of partners who filled in an AINO worksheet for the self-evaluation
Name of partner Organisation Country Magnus Andersson Semcon SE Pär Ekström Anders Johansson
Semcon SE
Eric Zachrisson Jörgen Bogren Esben Almkvist Torbjörn Gustavsson
Klimator SE
Pirkko Saarikivi Foreca FI
For the user evaluation we asked potential users, all experts in their own field, for their opinion on such a method for data collection and on the potential tool to improve their maintenance management connected to the new type of data.
The difficulty with user interviews in ex ante evaluation is that you ask the interviewee questions about something that is not there yet, or not in its final form. You describe it to them and ask them to imagine and to think what it would be like, but innovations are not easy to describe or imagine. Therefore, a great deal of what they answer depends on the input from the interviewer. To facilitate the user evaluation in MOBI-ROMA, the pilot has been developed to show what the tool could look like. Interviewees have been sent an interview guideline (Annex 2) and have been asked to browse through the MOBI-ROMA website prior to the interview. Four out of seven interviews have been carried out face-to-face; the others were telephone interviews. They have been recorded and transcribed to text afterwards.
Table 8: List of user interviews carried out
Name of interviewee Organisation Country Dr. Olaf Weller Bavarian Ministry of the Interior DE Udo Reincke LSBG Hamburg (municipal road administration) DE Tuomas Toivonen Finnish Transport Agency FIN Sami Petäjä Finnish Transport Agency FIN Henry Tennberg YIT (service provider for winter road maintenance) FIN Sandra Erkens Rijkswaterstaat (Dutch Transport Agency) NL Thomas Asp Trafikverket (Swedish Transport Agency) SE
A difficulty that we were facing in the course of the user evaluation was to find the right experts who were a) competent to answer our questions and b) willing to contribute to our evaluation. Fortunately, we found that it matters more to whom you speak to and to what extent the persons are ready to think outside the box, trying to understand what MOBI-ROMA is about and imagine the application and the service than having a large number of interviews.
The evaluation procedure was flexible enough to allow for adaptations, based on what earlier interviewees had said. Thus, the list of experts has been extended from exclusively national representatives to include regional and local representatives, and from representatives from public authorities to include representatives from private companies too. As a consequence we believe to have gathered a much broader and at the same time more objective overall picture for the assessment.
ENR2011 DESIGN MOBI-ROMA D4 Final Report
Page 56 of 101
8.3 Findings
8.3.1 Self-evaluation with AINO Work Sheets
The outcomes of the self-evaluation are the consolidated results of the AINO worksheets from the members of the consortium and are following the same structure (Annex 1).
Service description
A.1 Background and objectives
There is a user need for more precise information on the road surface condition for highways as well as gravel roads and including pavement quality as well as slipperiness and for gravel roads information on the quality of the road bed during spring thaw season. Moreover, this information should be available in a joint maintenance tool into which the different types of road information can be fed. This effective management tool should be user-friendly and support real-time and season-based maintenance planning.
The problems to be solved are various. A poor overview of the paved road network makes it difficult to perform good maintenance planning; this decreases the maintenance efficiency and ultimately the pavement quality. For the lumber industry reliable spring thaw detection is important. There are times when they cannot reach their products due to inefficient classification of gravel roads (unnecessary speed limits and road closures).
Pavement and roadbed information are mainly an economic issue, but especially wintertime slipperiness causes severe road accidents (in Chapter 8.4.3 you will find a brief analysis of accident costs). In all European countries the traffic volume in general has been increasing slowly but steadily. This means that the impact of a single incident on the traffic flow is higher. An increase in traffic volume will entail more wearing and damages such as deformation and rutting too. Moreover, independent of the traffic volume, severe accidents will always occur due to severe weather conditions when driving conditions worsen unexpectedly. Therefore, reliable short-time data is needed to warn drivers of changes with regard to slipperiness or vision.
The objective of the MOBI-ROMA project is to provide an economical way of getting high-resolution observation data of the road surface condition and make it available for users. This is to be realised with FCD which is transmitted via mobile networks to a web interface for professionals and possibly also for ordinary road users.
This Internet platform should be capable of displaying different types of FCD (processed and aggregated) and other types of information. As a tool it aims at quantifying the need for maintenance, thus supporting maintenance management. Increasing productivity of road maintenance personnel through better data availability would mean a reduction of the costs for maintenance management and planning.

ENR2011 DESIGN MOBI-ROMA D4 Final Report
Page 57 of 101
A.2 Service content and dissemination channels
The pilot service currently provides three types of road information: spring thaw detection and classification on gravel roads, pavement quality estimation correlating with the IRI on paved roads and slipperiness detection on paved roads. The information is based on a very dense network of point measurements, and data is being updated as often as the measuring vehicles are driving on the roads. All three types of information are displayed in one single maintenance tool. In addition, the tool would be able to show traffic flow information and traffic warnings.
Access to the service is via the Internet, so it is available on PCs, tablets and mobile phones. In principle, data can be extracted to other formats and shown in other devices (e.g. navigation systems, car terminals).
The service can be tailored to fit users’ needs. The application layout and language can be modified and the information displayed can be defined for different user groups.
As new types of data, e.g. information on poor visibility, may become available from floating cars or any other new measuring device, these can be inserted into the tool. One of the strengths of the tool is that it is modular, thus different data sources can be integrated easily without affecting existing channels. New technologies like smart vehicles open up for new channels of dissemination, drivers can be reached with relevant information in relation to their present location straight into the vehicle.
A.3 Service provision concept
The tool is not operational yet, so there are several alternatives as to how the service provision is organised. First, if governments wish (as this is a safety related service), service could be organised with public resources – such as fixed station RWIS nowadays. Measuring vehicles could be postal cars, milk collecting cars, road management vehicles etc., contracted by the road authority. Service could be hosted and distributed by the road authority or outsourced. Second, service could be fully private, if there are interested companies, e.g. vehicle industry, insurance companies, ICT companies, media.
If the service is run privately, ownership, hosting, maintenance and liability issues should be clarified in a service contract. Service availability must be guaranteed (uptime). Even though the pilot is now operated by Semcon, their long-term strategy is not to own the product, as their focus is on R&D.
The technology used for the pilot is MySQL and ASP/.NET. For data storage and software platforms subcontractors are being involved. At an operational stage of the service this may be different.
The data processing into information and service differs depending on the data source. When it comes to spring thaw detection, data from the vehicle fleet is combined with data from the road weather model to form a classification grade. This is done in real time. Slipperiness data are integrated in their final form. All data are stored in a joint database located on a server.
The tool itself can display different kinds of information, but data processing takes place outside the tool and can thus be provided by a third party.

ENR2011 DESIGN MOBI-ROMA D4 Final Report
Page 58 of 101
The availability of source data is dependent on the number of vehicles providing input information to the system. For the pilot, source data varies in origin depending on the type of information provided by the online tool. Basically, data is being taken from three different projects, where two are still ongoing: spring thaw detection and pavement quality estimation. FCD is at the time of writing (March 2013) relatively sparse, however, this will change and the availability of datasets will increase. Potentially, the availability of FCD is per se very high. The raw data in the database is not accessible for the end users; most of the raw data isn’t stored anyway, due to size limitations.
The road weather model depends on external weather forecasts. The raw data from floating cars is fetched from sensors, which is high resolution spatial information. Together with the data from fixed road weather stations it is possible to detect variations in road conditions. The quality depends on the number of vehicles and will increase with the number of floating cars that provide input to the database. This is valid both for temporal and for spatial resolution. However, the dependence of the data quality on the temporal resolution varies with the variable in question, e.g. pavement quality assessment is not very sensitive to low temporal resolution, whereas for weather related phenomena a high temporal resolution is crucial. The quality of the data for pavement conditions is not quite as good as that measured with laser profilometers or friction and road condition devices. However, quality is high enough to get a general view of the road condition and to find hot spots quickly.
A.4 Costs, resource needs and financing
In the following, some general facts on costs, resource needs and financing are presented. For monetized cost assessment, please see also discussion in Chapter 8.4.1.
Investments, annual maintenance and operation costs related to the service are for the measuring instruments, their installation and annual maintenance, data collection fees and telecom fees. Who pays depends on the solution for the service concept. Road administrations and maintenance companies are the potential primary investors. Most likely the decision maker would be the national Ministry of Transport and Communications.
The data is currently collected using external hardware that needs to be maintained and kept up to date. The cost associated with this is development and manufacturing of the hardware, software development and support/maintenance of the software/hardware on site. If a vehicle fleet is being used to collect data as part of their other operational function, there will be some costs for coordination too. If a large number of cars collect data automatically while driving, there are hardly any other costs, except for telecommunication costs which will occur in any case, but which are low nowadays. If the external hardware is replaced with existing in-vehicle components the cost associated with data collection could be decreased.
There are several possible business models here. One is that the public transport administration pays for the collection and distribution of all measurements on the public road network. Municipalities pay for the collection and distribution on their network. Other users such as the lumber industry can then add additional financing to increase the resolution in specific areas.
A first step would probably be within Sweden, but the service is just as suitable for surrounding countries. Regarding spring thaw detection Norway, Finland and Canada have similar problems and could benefit from the service. Pavement quality and slipperiness could be implemented within all countries in Europe. The maintenance tool itself could be implemented in any country where user-friendly road information based on FCD could ease maintenance planning.

ENR2011 DESIGN MOBI-ROMA D4 Final Report
Page 59 of 101
The data collection could be public duty, but both public and private players could provide services.
To widen a commercial exploitation of the tool, additional areas of its applications, i.e. service information, are important. Plenty of potential exists to promote the service as part of other services. Marketing and promotion of the service can be compared with that for weather services: private companies include all costs in the prices. The market of ITS services is now much smaller than that of weather services, but has started to expand. Prospects are large. Dissemination of the idea and the tool to the public authorities could be done through seminars, meetings and conferences to the public administrations. At this stage, marketing costs have not been assessed.
A.5 Potential market users
The potential primary customers are road administrations, lumber industry, transport industry and local municipalities. Perhaps insurance companies have some interest in the service too.
There could be a business case also when the contractors are using the information and paying for using it. In the end it is a matter of how the roles are defined and organised between authorities and private companies.
The geographic spread of potential customers depends on the service element: whereas slipperiness and spring thaw are limited to Nordic countries, pavement quality is potentially interesting for public authorities worldwide and at different administrative levels (national, regional, local). Most of the private companies are large. How many organisations (public and private) will eventually use the service cannot be said at this point. It takes some three years from the start to invade the market.
A.6 Relationship to other activities
The service can be integrated with other weather service portals or route planning in car navigation systems to warn drivers of slippery conditions. It could be integrated with on-board systems to reduce energy consumption, as in bad road conditions friction between the surface and the tiers increases, leading into higher energy consumption. Existing systems and services operated and used by national road administrations can be incorporated into MOBI-ROMA, these include but are not limited to traffic information systems, MDSS, RWIS. An integration of these systems can bring about synergies.
The tool enables more efficient operations through a decreased need for personnel manually surveying the road network. Moreover, it decreases the level of technical skills needed to interpret the road information. More efficient road management operations would improve the general quality of road conditions. As a result road safety would improve, leading to less accidents and fatalities.

ENR2011 DESIGN MOBI-ROMA D4 Final Report
Page 60 of 101
Description of impact information
B.1 Impact on travel
Timber transport companies can do more precise planning when to stop and start transport of timber on forest roads during spring thaw season.
The service does not reduce need for travel. However, it could disperse it over longer periods and thus reduce the peak levels. This could happen if the information which is available is used to pick and select situations suitable for travel. Moreover, it could reduce noise pollution, as there is an impact on the noise distribution depending on traffic volumes.
B.2 Impact on transport system efficiency
The service will have an impact on journey time and route choice with regard to slipperiness and load bearing capacity, but not pavement quality. Drivers may choose another, safer route, if they find that a certain road is in very bad or slippery condition, especially for the lumber industry route choice and journey times may be influenced by the service.
As it provides information on slipperiness, voiding these areas or taking precautions would decrease both incident occurrence and impacts. An online accident map could be integrated into the tool and support incident management. If observations are comprehensive, and if the service update and delivery were made very fast and data shown inside cars on navigation systems or other on-board computers, then even the risk of chain collisions could be reduced.
B.3 Impact on special groups
The service will increase the level of comfort due to better-maintained roads, both, paved and gravel roads. Elderly and disabled could avoid risky parts of the road network. However, this is mainly a service for professionals to keep the road in better condition. Besides public administration transport companies would benefit most, also insurance companies, when accident numbers and costs are reduced.
B.4 Impacts on safety, environment and community structure
The service has potentially a large effect on traffic safety. It is available and accessible for everyone online. A possible social issue would be if, in cities, it revealed that streets in poor housing areas were generally in a worse state than in areas where rich people live, but that is very unlikely. By making the maintenance planning more efficient it has a potential positive impact on the environment.
B.5 Impacts on transport system development and management, other impacts?
MOBI-ROMA provides a cost effective way to collect, process and display different types of information connected to road maintenance of different types. It is possible to display warnings, showing where the conditions on the road are dangerous. The service provides an information base on which decisions regarding improvement and maintenance can be formed. Maintenance needs can be identified easier at lesser expenses and the planning becomes more effective with this new economical way of collecting data on the road network. Effective road maintenance, winter service and slipperiness warnings will lower the costs for public transport operators too.

ENR2011 DESIGN MOBI-ROMA D4 Final Report
Page 61 of 101
A possible impact on health issues could be reduced bumpiness of roads with an effect on professional drivers (lorries, busses, taxies) and reduced noise pollution. As a result of better pavement conditions material usage can possibly be reduced (tyres).
B.6 Service impact assessment plan
Users should be involved in the development phase in order to meet their needs. Once the service is up and running, conducting user surveys and regular expert interviews could monitor the service. At the time being feedback meetings, continuous collaboration with users and usability evaluations are taking place.
With regard to spring thaw detection the number and time of closed roads could be compared with the previous year in order to analyse the impact the service had.
Service assessment
C.1 Usefulness, innovation and economic efficiency
The service provides an overview of maintenance needs, thus enabling a more efficient summer and winter road management as well as spring thaw monitoring. It shows the quality of the road surface coating and the status of gravel roads by converting hard-to-use raw data into easy-to-use map information.
The added value of the service is more efficient collection of network data with a higher resolution; ultimately, this leads to better knowledge for users based on which they can take decisions regarding road safety and maintenance; both, real-time as well as season-based planning is possible. A benefit of the interface is that it is possible to incorporate different types of data from different sources, e.g. FCD, static data from RWIS, into one single system. The web-based interface also cuts down on other types of costs like software updates at the front-end as these are carried out at the back-end.
The innovative aspect of the tool is the mobile observation technology and the fact that it combines FCD with weather information and traffic warnings; this creates a powerful tool for road administrators of all sorts enabling them to take proper action.
No other services or tools that we know function in the same manner. In similar applications data has to be handled manually and processed in several steps from measurement to user. In Finland there were pilots recently that used mobile slipperiness measurements, e.g. HDENIQ-project of VTT and Oulu University. 25 trucks sent their data to a central system to warn other drivers. FCD is being used in service applications dealing with traffic flow monitoring and congestion warning.
The service helps to achieve the policy objectives of more efficient and safe driving. Social benefits of the service could be expressed in monetary terms with regard to the savings in costs for laser measurements, e.g. at local level, and in the long-term also in maintenance costs, savings through optimised transport on forest roads, and most remarkably in savings due to less wintertime road accidents.

ENR2011 DESIGN MOBI-ROMA D4 Final Report
Page 62 of 101
The costs for the service cannot be defined in detail, as it is not operational yet. A preliminary cost assessment has been performed in Chapter 8.4.1. In principle, the costs are very low and there is great potential to serve large numbers of users once the service has been up and running for some time. Vehicles that are using the road network collect FCD automatically, decreasing the need for expensive measurement personnel and/or devices/vehicles. The business case could be improved if several customers/users share the cost related to FCD collection. Costs presently incurred by the need to carry out software updates in the collecting hardware could be reduced if automatic updates were enabled.
C.2 Technical performance and quality assurance
Reliability of the service depends on the amount of data coming in from floating cars. For the pilot there have not been any particular problems. However, as handling of large amounts of data can be problematic, reliability could possibly go down with increasing amounts of FCD. There is a threshold up to which the quality of the information will get better with increasing amounts of dataset coming in from floating cars, but from a certain point the data handling gets too difficult. Too many different sources of data would decrease the usability/simplicity of the tool. But it is really up to the “model” to be able to handle different sources of data and combine them in an optimal way.
Positioning of the FCD is correct and the pavement quality assessments correlate with the IRI. The pilot shows that correctness is sufficient to start the service. The tool is not considering correctness of external data.
Once the service is operational its quality should be monitored by comparing with laser measurements, thaw reports and other slipperiness measurements, e.g. field observations. Both, current developers and potential users initiate further development through regular feedback meetings and collaboration. Further input can be taken from the user evaluation (see 8.3.2). In the future, user feedback could be collected through a web interface questionnaire.
C.3 Accessibility and user centered design
As the service is available on the Internet there is no limit as to how many people can use it. The number of users depends on how the service is organised. If it is set up for professionals, there could be tens to hundreds of users per country per day depending on the season. If it addresses the general public, several thousands to tens of thousands per day could be reached.
The user interface has been tested with user interviews (see 8.3.2). It is comprehensible and easy to use. For the pilot there is a menu item ‘Get started’ that provides an introduction to the tool (Figure 37).
No special skills are required to use the interface. However, presupposed skillsets are required to use the information provided by MOBI-ROMA effectively.
Usability has been considered to some extent during development of the interface, but it varies with the user. Some use the service on a tablet and others on their desktop computer. Basically, the service has been developed for use on a computer for use in the office of public road administrations. It is also possible to access the interface via a smartphone, but at this time the interface is not modified specifically to suite smartphones. A lot of effort has been made to make the service cross-platform and cross-browser compatible. Thoughts have been put into the design of the tool, but no specific evaluation has been performed.

ENR2011 DESIGN MOBI-ROMA D4 Final Report
Page 63 of 101
The pilot has been developed for expert users, but can be further developed to suit the needs of other specific user groups if need be. Special needs of the colour blind have been considered. It is hard for them to differentiate between green, yellow and red. These are the main colours the service uses to display road information. So for the moment their special needs have not been considered, but in the future this is a place for improvement.
The users’ willingness to pay for the service has been investigated in the user evaluation (see 8.3.2.).
C.4 Opportunities and threats
In Sweden there are two competitive technologies regarding pavement quality assessment. The first one is based on a smartphone technology and the other one is based on heavily equipped vehicles, using lasers and cameras to measure longitudinal and transversal evenness, cracking and road grip. Regarding spring thaw detection no similar service has been found. Slipperiness detection using FCD is competing with weather forecasts, but can be integrated just as well.
Financing of the service can be clarified once it is operational. Different business cases are possible. The same applies for hosting of the service.
In its pilot stage the service is not compatible with existing system architectures, but it could easily be modified to fulfil this requirement. The key organisations have been involved in the development of the service. However, this is limited to public authorities, as it is too early to involve other parties.
Legal issues such as privacy and data security need special attention when organising the operational system. These issues can be solved with existing regulations. The service does not link the identity of drivers delivering FCD input to the information collected and displayed. Even though there are no concerns from our side, the public discussion about these issues continues and might lead to restrictions.
The service could be organised via competitive tendering for those parts that can be outsourced. At the moment the service is geared towards road administrations; however, it is flexible and future applications can involve other user groups. The service could easily be expanded and exported. New types of data could be incorporated. Alternatively, some of the data could be incorporated into existing platforms, e.g. www.bayerninfo.de or Google Traffic.
There are some threats to the service and the adaptability and usability of the tool, e.g. competitive maintenance tools containing similar information or lack of interest from road authorities. Large amounts of data could increase the complexity of the system.
The technology needed at the front-end is commonly used computer hardware, a web browser and an Internet connection. At the back-end FCD is momentarily collected with an external sensor. 20 of these sensors exist at the moment. Production costs are low and more of them could easily be manufactured. However, in the future FCD for pavement quality assessment and slipperiness will possibly be collected from the on-board unit existing in every car (CAN-bus) instead of from an external device. Regarding the maintenance tool, increasing amounts of data can become a problem.

ENR2011 DESIGN MOBI-ROMA D4 Final Report
Page 64 of 101
As the service is accessible through the Internet there are no restrictions regarding communication between the GUI and the end user. Users can have individual logins and user accounts if need be. Different solutions for licensing are possible. Data transfer from the sensor to the server is performed over the cellular network, but if the network is poor or expensive this would affect the service.
All raw data are in digital form; however, sensor data are not available due to the large data size. The results from the measurements are available for download on the GUI in form of spread sheets.
C.5 Impact mechanisms and targets (table)
Table 9: Expected impacts and related targets of the service (*number of entries from all self-evaluation worksheets)
Target of impact
Se
rvic
e le
vel a
nd
perf
orm
ance
of
tr
ansp
ort s
yste
m
Co
sts
of
tran
spor
t sys
tem
Pre
requ
isite
s fo
r bu
sine
ss
Tra
ffic
saf
ety
Oth
ers
– sp
ecify
:
Change in transport infrastructure or vehicle fleet investment 1* 1 1 2
Improved public transport incident management or route choice
3 1 3
More efficient public transport operations 2 1 1
More efficient use of transport infrastructure 3 2 1 2
More efficient transport network incident management 3 1 3
Improved driver and vehicle support 1 2 2 1, driving
accessibility
Promotion of non-motorised transports 1 1 1
Improved logistics chains and deliveries 2 3 2 1
Improved service provision prerequisites and tendering 2 1 2
Promotion of standardised and generic solutions 1 1 1
Development and piloting of innovative solutions 2 3 2 3
Service overview
D.1 Principle scheme of the service
Figure 39: Principle scheme of the service
Road information
• Spring thaw
• Pavement quality
• Slipperiness
Web interface
Processing
• Database
• Data handling
Presentation
• Map
• Excel
User
• Road administrations
• Transport industries
• Normal drivers

ENR2011 DESIGN MOBI-ROMA D4 Final Report
Page 65 of 101
Figure 40: This is an example of the pilot web application’s representation of the pavement quality.
D.2 Summary of service description
The service provides real-time road information from FCD. Currently, three types of information are available: spring thaw detection and classification, pavement quality assessment and slipperiness detection. The information is presented in a map on the Internet.
D.3 Cost and price of service
There is no information on the cost efficiency of the service at present, it largely depends on how the service is organised. See general discussion in Chapter 8.4.
D.4 Summary of primary impacts
The main impact of the tool would be with regard to road safety, especially in those countries with problems related to winter weather. Economic and operational impacts can be expected on road maintenance management and transport on gravel roads.
D.5 Service production model
Financers of service can be public or private. The provision of the user service can be outsourced to service companies. Organisations involved in the planning process are public road authorities, engineering companies and service providers. A production model does not exist yet, but there are several alternatives.
D.6 Summary of service assessment
The service is not operational yet, but a pilot application. Therefore, assessment is based on estimations and cannot go into detail. If the service is implemented throughout the country and reaches the key players in the public and private road transport sector the potential improvement of road safety can lead to remarkable savings.

ENR2011 DESIGN MOBI-ROMA D4 Final Report
Page 66 of 101
8.3.2 User evaluation
For the user evaluation members of the MOBI-ROMA consortium have developed guidelines for semi-structured expert interview (annex 2) that were sent to relevant persons prior to the interviews (face-to-face or telephone). The outcomes are structured accordingly. However, there was plenty of room for the interviewees to include whatever they wanted to add and might otherwise not have been covered by the guiding questions.
The selection of experts with whom interviews have been carried out represents national road administrations, a regional road administration, a municipal road administration and a privately owned service company responsible for winter road maintenance in Finland.
A. State of the art in maintenance management
A.1 We assume you are interested in the status of your road network, but are you aware of the actual surface coating status of all of your roads?
To this introductory and rather provocative question all interviewees answered with ‘yes’, but with some restrictions. The national road authorities are usually responsible for the highway network, but commission the monitoring and maintenance to the Bundesländer. Regional authorities are responsible, and thus have an overview of the status of their parts of the main roads. Lastly, local authorities administer the road network within their municipality and are responsible for its maintenance.
In Finland, similar to the other Scandinavian countries, they have a large number of privately owned gravel roads. The state has 28,000 km of gravel roads under surveillance, but there are some 200,000 km of private roads that are not monitored at all. Forest roads that belong to the lumber industry may be in better condition, as they have to carry heavy traffic. Nowadays, weight limits affect only some 1500 km of roads about one month per year (in the past almost all gravel roads were affected). The Finnish Transport Agency does not only know the current state of the roads’ surfaces, but needs to know how it develops. They have a general picture, but are missing many important details. This may cause problems, when the government suggests allowing the heavy super trucks (maximum weight from presently 60 tons to 76 tons) to use the Finnish road network. They don’t know yet what effect that would have on the network as they don’t have adequate monitoring means that provide information about what is happening inside the road structure.
The YIT road weather centre is responsible for following the condition on the road network on the contracted areas year round. All three parameters of MOBI-ROMA are included: winter road maintenance, road surface condition (asphalt and gravel) and spring thaw. With their present systems they get a rough idea of the status of the road network, but a MOBI-ROMA type of service would give a better general view, continuously and economically.
In the Netherlands Rijkswaterstaat is aware of all the highways and main roads. Provinces control the other parts of the national roads and municipalities control their roads.
The Swedish transport agency Trafikverket knows the road status quite well. They have a long history of measurements. Since 1987 they have been measuring every year.

ENR2011 DESIGN MOBI-ROMA D4 Final Report
Page 67 of 101
The Free State Bavaria as one of the 16 German Länder (states) is responsible for the state roads. From the federal government they are commissioned to administer the motorways and the federal roads too. Municipalities are responsible for their communal roads. From motorways down to state roads the regional authority has a good overview, including the development of the road surface quality. They know the overall value of their roads, but also distinguish between the present utilisation value and the asset value of a road. The first is with regard to grip and other parameters that are important for the drivers and for safety. The asset value combines parameters that are important for the responsible agency; those include cracks, patches, roughness and ruts.
A.2 How do you get this information today?
Regular test drives are standard in all countries at national level, normally once a year in spring after the winter. In Germany the extensive measurement campaign runs over the course of four years. Finland has a three-year cycle.
To what extent regional and local authorities carry out regular inspections varies between countries. There is a tendency that regional authorities do regular inspections whereas municipalities start repairing when damage occurs, as they cannot afford systematic (prior) assessment. The City of Hamburg has so-called fulltime network attendants (Wegewarte) who patrol defined areas of the network on foot in a fortnightly cycle, taking notes also of the road surface quality and, where applicable, report on potholes, cracks or rutting. This allows for an acute remedial action. If the grip of the pavement is so bad that an accident hotspot develops, then the police know that very quickly and inform the road authority.
In Finland contracted companies undertake annual test drives. They have lasers and accelerometers for pavement quality monitoring. Spring thaw is monitored visually.
In addition, the road authority gets quite a few phone calls from the public, reporting on damages. The road weather centre of YIT does visual inspections of the road conditions once a week at minimum during wintertime. Point measurement information (friction, amount of snow, road surface evenness) comes from the road maintenance department.
The Netherlands have annual inspections of all roads on skid resistance, longitudinal and transverse evenness, ravelling and cracking. These standard measurements are carried out by trained inspectors, but with increasing speed it becomes more dangerous. They are developing laser measurements. Currently, measurements are being undertaken partly by their own agency and partly by external contractors.
Trafikverket mostly relies on the laser beam measurements. They measure the main roads with road numbers below 100 (including the European road network) and all roads with AADT of >4,000 every year. The medium network they are measuring every second year and the smallest roads are being measured every third year. They have a data beam with 17 lasers that is used for measurement. And there are a number of pavement engineers who look on site for extra check. They do get notifications from the public by telephone; this information is being forwarded to the contractors of the area in question. They are responsible for their area, but it is always extra trips. They are using their own cars and are travelling on all the roads. It would be much cheaper, more efficient and better for the environment if they could get the data from post cars or other delivery cars that are driving there anyway. Trafikverket sees a big potential if the data was transferred automatically.

ENR2011 DESIGN MOBI-ROMA D4 Final Report
Page 68 of 101
The measurement campaign of the Free State of Bavaria is being put out to tender at national level. There are only a handful of engineering companies who are capable of carrying out the measurements according to the given standards. They measure with special vehicles for longitudinal and transverse evenness, for grip and for surface characteristics (potholes, cracks etc.). As a result, they determine a present utilisation value and an asset value for each road section. For motorways measurements are being carried out on all lanes in both directions. Double-lane federal roads are being measured on one lane only and single-lane federal or state roads in one direction only. They assume that the traffic volume is the same in both directions. For two-lane federal roads that is not possible as the right-hand lane is usually more heavily used due to freight traffic. Motorways are being repaired by lane.
Three measurement campaigns are being compared in order to get a picture of the development of specific condition characteristics.
At municipal level road surface quality assessment is being done by visual inspections, very few municipalities use laser equipment, and some of their quality criteria differ from those applied at national and regional level. This is because they don’t have intercity transport, but traffic-calmed zones instead, which results in different requirements with regard to grip. Municipal authorities normally get notifications of concrete damages from the public.
A.3 Can you please describe the current measurement procedure (what/when/how often etc.)?
In Finland they focus on measuring transversal unevenness. It is important to know the precise depth of the ruts in millimetre. This is done with laser measurements as in most other countries too. Main roads are being inspected every spring after the winter, smaller roads every three years on average.
The contract of YIT does not include measurements of the pavement condition, just visual checks. Gravel roads are being classified according to their driving comfort on a scale from 1 to 5, with 5 being the smoothest and 1 being very bumpy with “laptops falling”.
In the Netherlands they are planning for having laser measurements; at the time being specially trained personnel are doing the inspections, which are usually done on the right hand lane in both directions. Future plans foresee to include measuring the noise level in the campaigns too.
The local roads in the City of Hamburg are being looked after by the local authorities (boroughs), this is taken care of by so-called network attendants who patrol their defined area once completely in a fortnight. They report to their local authority. The main road network is being assessed with laser measurements every four years in the same measurement campaign together with the national motorways that run through the city. Hamburg as a so-called city state as well as Bavaria as territorial state are commissioned to organise and carry out the measurement campaign on behalf of the national government who pays for it. A national measurement campaign runs for four years. It is divided up by federal state (Bundesland). In the first year the motorways in 8 out of 16 states are being measured, in the second year the motorways of the remaining 8 states. In the third year they are measuring the federal roads in the states 1-8 and in the last year those in states 9-16.

ENR2011 DESIGN MOBI-ROMA D4 Final Report
Page 69 of 101
The measurement campaign in Sweden is being offered to consultancies every four years through competitive tendering procedure. 80% of the network is given to one consultant and 20% to another one. The consultant is only responsible for the measurement and delivery of the raw data. This is being fed into the pavement management system at Trafikverket that contains 30 different parameters, calculated or measured.
A.4 How do you use this information (maintenance planning, funding applications)?
The information gained from inspections is being used mainly for maintenance planning, but also to report to politics and to justify budget needs. Most national authorities have a maintenance planning system in place. In addition to the measurement data it includes information on the type of wearing course and substructure, the year of construction and repair works as well as the street furniture.
In Finland they use the information for maintenance control, to decide how to do the annual repairs in the right places and at the right time. Local ELY centres are responsible for carrying out the repair works for pavement, bridges, gravel roads etc. Information from phone calls is being stored in the database too. If need be, a sign can be put up, but normally, there is no real danger due to any damages in the road surface.
At Rijkswaterstaat the information from measurements and visual inspections is stored in a database and exported to the maintenance planning system. Together with information on wearing course and year of construction it is possible to determine a maintenance prediction year. The road status is being displayed in maps with categories green, yellow and red and the budget is allocated accordingly. Repair works are being contracted and the status is checked and updated after the works have been carried out.
In Hamburg the information is used for fixing holes, patching, renewal of the wearing course and keeping up the maintenance planning programme for complete repaving. This programme is being updated each year. Larger works are being spread over two or more years for budget reasons. New information is being incorporated and the order of the programme is being updated according to urgency of the repair. Safety-relevant issues have the highest priority.
In addition to funding applications, Trafikverket uses the information to evaluate the work of the contractors, e.g. if the contract allows a maximum of 8mm rutting in seven years. Furthermore, measurement information is used for providing statements on the road network to the government. However, the main purpose is the maintenance planning.
The measurement data are a common tool for maintenance planning in Bavaria too. There are a number of algorithms the application of which leads to suggestions for sections that are in need for repair. These suggestions are then incorporated into the planning. The information is being used to inform politics too, and to claim money. Over the last years the budget for road maintenance has been increased. The information is also used to allocate the money to the local authorities for the maintenance of their state roads according to their quality status rather than by kilometres. Raw data is being further processed and aggregated to condition values from 1-5 where 1 is very good. Within this scale there are two characteristic values: the threshold value 4.5 and the warning value 3.5 from which on intensive inspections and an analysis of the damage have to be carried out. Within built-up (urban) areas both values are higher.

ENR2011 DESIGN MOBI-ROMA D4 Final Report
Page 70 of 101
A.5 What are the costs (per year)?
What is common to all authorities that have been interviewed is that the need for maintenance exceeds the available budget. Money is being spent according to need rather than spread equally. Unfortunately, most interviewees were not able to provide numbers. Hamburg tried with a rough estimate, but no actual costs.
In Finland the total budget for maintenance in 2012 was 413 million EUR, of which 100 million were for winter maintenance, 128 million for pavement and road construction, 37 million for gravel road maintenance, 50 million for bridges, 79 million for traffic environment maintenance and 20 million for energy (electricity). The measurements that YIT is carrying out on the roads are done on the job and do not cause extra costs (except the cost for the equipment). However, the contracting authority has indicated that presently there are too few friction measurements made and the future contracts will require much higher density (even every 10km). According to YIT this sounds very impractical, as friction should be measured where there is need for that.
The City of Hamburg has a network of 3,900 kilometres of local roads, 550 kilometres of main roads and 82 kilometres of motorway running through the city. Of course, motorways have several lanes, which means that the surface in square metres is relevant when it comes to repair or repaving. Moreover, the safety aspect of the road surface quality is more important at an average speed of 100km/h than at 30km/h. Nonetheless, for a local authority the costs for maintaining their local network are proportionally high. The annual costs for measurements on local road and main roads (these are under the responsibility of the city) are estimated to easily amount to more than 50,000 EUR for the measurement drives alone. Personnel costs for the network attendants amount to approx. 2 million EUR. This does not include the engineers who are analysing the incoming information to make it usable for maintenance planning. The network attendants do have other responsibilities too, e.g. to report on the state of traffic signs (line-of-sight obstruction due to vegetation, damages, need for cleaning etc.) and regulatory offences. Therefore, it is impossible to say how much the monitoring of the road surface costs.
In Sweden the costs for the measurements amount to approx. 2.3 million EUR: a large share for the contractors (2 million) and a small amount (0.3 million) for Trafikverket for preparing the tendering procedure. This does not include the costs to run the PMS as this is independent of the measurements and therefore has a different budget.
A.6 Does the knowledge of who are the users of certain roads influence the decision on where maintenance works is being prioritised?
At city level (Hamburg) prioritisation is being made according to traffic volume and to whether the network section in question is used by public transport (busses). Freight transport also plays a role for prioritisation, as it does in causing damage. The share of freight vehicles on a specific road is a crucial factor in the maintenance management for estimating the life expectancy of the road surface.
The Finnish road network is being classified based on traffic volumes and functional significance. On the main highways the pavement quality must be kept high and repaving is typically done every 4 years. On gravel roads repairs can be done as seldom as every 25 years, leading to very bad conditions at times. For winter maintenance YIT prioritises following the pre-defined winter maintenance classes for the roads. More emphasis is given as needed, based on road weather conditions.

ENR2011 DESIGN MOBI-ROMA D4 Final Report
Page 71 of 101
Traffic volumes are not so much a criterion in the Netherlands now, but as resources are limited this will be taken into account in the future. Presently, the type of damage (skid resistance and rutting) is the main criterion for prioritisation of maintenance action as they affect safety. If a threshold is reached, warning signs have to be up immediately and the speed limits are set down. Repair has to be carried out within two months or at least some remedial action, to ensure safety for the road users. For ravelling Rijkswaterstaat differentiates between mild, medium and severe, and usually a section will appear as mildly damaged first, then medium and then severe, gradually increasing. And depending on how the sections before and after are behaving they may maintain a section which is only mildly damaged. They try to group as much as possible to get cost effective maintenance schemes. If they have severe damage on a long stretch then it might be replaced entirely.
The decisions of Trafikverket are based on the PMS as well as on the verdict from pavement engineers. But they try to use the measurement data more and more, because they don’t have the resources for manual inspections. Maintenance management has to rely more and more on the PMS. It becomes more important that the measurements are good and reliable. The experience is that they are good. There are only three companies who are actually capable of doing the measurements in a sufficiently high quality, and that is Rambøll, Destia and Vectura. Other people have tried to do it, but upon checks their quality turned out not to be good enough. Budget is being allocated to the different network sections for maintenance according to the maintenance standard in Sweden and that is related to the AADT, but it could also be that a road is prioritised by industry or some other reason. The second criterion is the rutting, for big roads the threshold is 13mm and for the small roads it is 22mm.
In the Free State of Bavaria prioritisation is being done by condition, i.e. worst state gets the highest priority. The computer does the prioritisation automatically, and traffic volumes play a role too.
B. Added-value of floating car data (FCD)
B.1 What is your understanding of the use of FCD for maintenance planning?
Some interviewees had never heard about the concept of FCD before, neither in the context of maintenance management nor in any other. Some had heard the term in connection with traffic flow monitoring. The representative of Trafikverket knew about it, as he is involved in BiFi. However, colleagues who are not involved in the project hadn’t heard about FCD and were unaware of its potential. At Trafikverket they are not sure if the data they get from floating cars is sufficiently accurate. The Finnish interviewees reported some tests for winter maintenance based on accelerometers on mobile phones made in Oulu and another pilot with Teconer Ltd.’s “liukasta.info”.
Most interesting was what Sandra Erkens from Rijkswaterstaat said: she had heard about it once before, six or seven years ago from a Canadian company that used information of the car’s system on the use of the windscreen wipers (on/off, which level) to give an indication on the amount of snow or rain that was falling on various sections of their highway system. That was at a conference, they were just trying to see what the possibilities were to use information from individual cars. Unfortunately, she didn’t know if they took it any further, she hadn’t heard anything more about it since that time.

ENR2011 DESIGN MOBI-ROMA D4 Final Report
Page 72 of 101
B.2 If you look at the website and the representation of information do you think this type of information would be useful for maintenance management?
The Finnish Transport Agency considers this information very good for the road owner, not only for maintenance planning, but for putting up speed limits too. The problem with spring thaw is to inspect the road at the right, critical time when frost damages appear. Continuous mobile monitoring would be a solution for this problem. Time series would be valuable too, as the visual surveillance is only done once a year. It would be most useful for the contractors who do the actual maintenance on the roads. The FTA needs information on the general status, and needs to assess e.g. what is the quality of winter maintenance and how has it changed from year to year. There is no good information on this available nowadays. If a MOBI-ROMA type of service were operational with a large fleet of cars, it would provide a good new data source, and it could reliably monitor just those parameters that are needed, that would be very useful.
However, it would not replace the present measurement system.
For YIT it would bring added value for road maintenance and transport information services. Road information services are needed particularly in emergency conditions. They see room for improvement, as the tool should not just explain the conditions, but how they are affecting the drivers, e.g. snow storage areas are filling up, roads are getting narrower. And one should not be afraid to tell that it can actually be slippery, regardless of the maintenance measures.
Rijkswaterstaat considers the service useful too. Especially, if the information is linked to how drivers perceive that road. It is sometimes hard to go from objective assessment and damage to the effect that it has on the driver. The MOBI-ROMA technology would allow to get a much better understanding of how drivers experience the roads and their quality and where thresholds with regard to road maintenance levels can be less strict or where they need to be stricter. Especially with roughness and rutting, certain patterns get noticed by drivers and others don’t. It would be useful to be able to distinguish between them.
With regard to the slipperiness warnings provided by MOBI-ROMA Hamburg pointed out that if the information were applicable for surface grip too it would be an important indicator for the quality of the pavement. However, if it were applicable only for ice and snow then it would be more interesting for the public cleansing service that is responsible for winter maintenance on all the city roads. For the motorways in the city the traffic operations centre is responsible, and the federal government gives out the rule that a 40-kilometre section has to be ploughed and salted within 3 hours if need be. In some cases, when they know that temperatures are falling, they spread salt beforehand. Weather data are coming from the DWD (Deutscher Wetterdienst) and from fixed road stations. Altogether, the traffic operations centres have a good overview of what is happening with regard to slipperiness. MOBI-ROMA could be helping with the surface quality assessment and evaluation. Generally, there will be a difference in assessing the added value of a service like MOBI-ROMA depending on whether we ask somebody from the ministry or someone at local level. At local level they have to economise their budget and a tool like MOBI-ROMA could be very valuable for them. At national level they probably do not see a need for it.
Trafikverket sees an uncertainty in the quality of the data the new service produces, but if the data is accurate they see a big potential for FCD in maintenance planning. And although they say that the tests that have been carried out are not enough yet, they believe that it must be possible to use all the data that can be obtained from modern cars, like accelerometer etc., a lot more than today.

ENR2011 DESIGN MOBI-ROMA D4 Final Report
Page 73 of 101
The data could be used in Apps. They mention an available app for IRI and admit that they don’t know if it is good or bad, but it simply shows that it is possible to use such data, which is the reason why Trafikverket is interested in these projects like BiFi and MOBI-ROMA. They think there is a very big potential to have very cheap measurements.
This opinion is quite the opposite of the Bavarian state authority. They don’t see the added value of MOBI-ROMA. It could be an additional source of information, but a direct link to the existing systems would be difficult. FCD is difficult if the road has more than one lane. The measurement standards that have been established in their present system over time cannot be applied for MOBI-ROMA. This makes it difficult to use the information. The time aspect is not an issue. They consider the information they have sufficient.
B.3 Do you see a potential for complementing the current type of data?
Up-to-date data would be useful for FTA, but it must be tailored to their user need. Rambøll and other contractors have their own map solutions to show their data. The user interface should be easy and simple, not too complicated. In Finland they had a very complicated programme for pavement maintenance that has now been replaced by a simpler solution. YIT definitely sees a potential to complement the current type of data with that from MOBI-ROMA, but point out the need to improve spatial accuracy.
The main advantage of the service for Rijkswaterstaat is that by allowing the data to be used through the internet one could also involve people more in pavement management, give them an idea of the highway quality and have them participate, show them that on those sections they are driving they are providing the administration with information and helping them to optimise the maintenance scheme and the quality of the network.
Mobile data is unlikely to substitute visual inspections in Hamburg. MOBI-ROMA is not seen to be able to assess the damage without engineering expertise. However, at the moment assessment is not sufficiently standardised, e.g. through photo analysis; it is very much influenced by subjective judgement. They say it would be good to test MOBI-ROMA to see what added value it offers. The developer would have to know better and more specific what the requirements from road administrations are and they can then look into what the service can do for them.
If the FCD reached the set standards it could possibly complement the data from present measurements in the Free State of Bavaria with the benefit that it is very up-to-date. However, the four-year cycle that they have now is considered sufficient; the available financial means are limited anyway and they are lagging behind with repairing everything. Road attendants, who patrol the network in a two-day cycle, report severe damages so that action can be taken. They are part of the road operations service that is responsible not only for controlling the network with regard to road surface maintenance needs, but at the same time maintain the green areas along the roads, clear away dead animals and to carry out winter maintenance. So, those guys are out on the roads anyway. And winter maintenance is quite well organised too. They use weather data form fixed road stations. At critical times, scouts are out at night and if need be they call the maintenance service. Outsourcing to private companies whose vehicles are then especially equipped for winter service is increasing capacity. A weakness of the MOBI-ROMA service is seen in the fact that it aggregates data to one value and does not give any specific information on single parameters.

ENR2011 DESIGN MOBI-ROMA D4 Final Report
Page 74 of 101
B.4 What would be the benefit of FCD for public road administrations?
In Hamburg, that is a local authority and a federal state (Bundesland) at the same time, the benefit of FCD could be to reduce the need for laser measurements on main roads and to cut down on costs for road surface assessment on local roads. Moreover, the current assessment method bears a risk of subjectivity, i.e. two network attendants might classify the same road section differently. There is need for a catalogue with common criteria for an objective assessment. Another benefit of FCD is that it could provide information on the road surface quality very quickly. Depending on how the data is being processed the maintenance management could react to deficits more quickly.
The benefit for public road administration in Finland is that the condition of the pavement is available online for planning. However, they see a larger benefit for the maintenance contractors. One of them is YIT. They consider it as an extra help in road information services. It would show in a crude but economic way the problem spots on the road network and would help in planning.
The representative from Rijkswaterstaat says that she could imagine that the perceived quality level varies due to the speed people are driving, e.g. roughness, and that kind of information is not generally available from the standard inspections, because they are done at a given speed. Another thing that would be interesting is that car drivers tend to use all the lanes of the highway, not only the right one. So the maintenance management would get extra information on the other lanes too. She could imagine that FCD information would be interesting for municipalities, as they are unlikely to develop anything on their own, but if the system was available for them, it could allow them to set up a PMS without having to do actual inspections. It would give them a more objective reference frame.
The data would not play a big role in the planned regular maintenance in Sweden, but in the daily maintenance; moreover, in the thaw season, when the ice is melting. During that time it is considered to be very useful. That is why Trafikverket started the BiFi project. From the beginning it was because they thought they could have measurements for use in the thaw season to see if the capacity of the road is good enough to send out the heavy truck on the road or not. In addition, they would like to be able to measure what they call texture in order to see potholes, which in the thaw season come very quickly. Retrieving this information from FCD would provide immediately knowledge on where they occur and enable them to send out a repair service. They need this information on a day-to-day basis, and this can obviously not be done with laser beams.
In the Free State of Bavaria the need for repair and maintenance exceeds the available budget, as it does in other countries and other public authorities too. Therefore, if more information on maintenance needs was available they still could not realise it.
Their applied road surface assessment procedure is complex and the measurements technically sophisticated, the knowledge of maintenance need good and the planning system mature. There is no added value of FCD at the level of the regional authority.

ENR2011 DESIGN MOBI-ROMA D4 Final Report
Page 75 of 101
C. Improvements?
C.1 How much do you like what you see? Please rate (1 = very much, 6 = not at all)
FINLAND: 3
YIT: 2
NETHERLANDS: 3
HAMBURG: 3
SWEDEN: 1-2
BAYERN: 3
C.2 What else would you like to see in this application/interface?
The Finnish Transport Agency thinks it would be good to have a video showing the very bad roads. The tool should be more specific on what has actually been measured. There is no information on that now. YIT suggests that the system could be used on gravel roads covered with packed snow and with deep wheel paths. As bumpiness is a combination of both lateral and vertical vibrations, they suggest developing a new analysis scheme. This would indeed be possible with MOBI-ROMA.
The representative from Rijkswaterstaat reports that she was on holiday in Sweden one summer and they had maps with warning of road flooding; this could be a good additional information in MOBI-ROMA. Except for the roughness there could be other parameters that can be collected. Nowadays ordinary cars register quite a bit and a combination would be useful. She considers roughness to be a good start, but there could be information on traffic intensity too. It would be nice to see the effect of their maintenance on speed and traffic jams. What they, as a public authority, are trying to do now is to give their road users more information on the surface of the roads, especially in combination with weather information. Planned reconstructions, maintenance projects and planned delays could be included into the service, so that people could have quite a good overview and check before their trip which is going to be the most convenient and safest trip for them, especially in winter conditions, when some roads can be more slippery than others.
The City of Hamburg says they need most, in order to be able to judge the tool, is a German translation.
Trafikverket would have to use it more and on a regular basis and with full real data to see what other information they would like to have in the tool. Now, that it is only a pilot version they find it difficult to judge.
For the representative of the Free State of Bavaria the web service seems interesting, but there was no urge for him to use the information professionally. A number of tools are already available in their operative units, and every staff member down to the local level has access to the Bavarian road information system.
C.3 Do you think a seasonal resolution would be useful?

ENR2011 DESIGN MOBI-ROMA D4 Final Report
Page 76 of 101
FTA would like to have a seasonal resolution; nobody needs winter data in summer. The possibility to assess longer time spans is good too.
A seasonal resolution would be good for Hamburg too, especially after winter, so they could see the changes.
Trafikverket needs the information mostly on a day-to-day basis; that is the big advantage of the tool for them.
C.4 Do you think a combination of road weather data and pavement quality would provide added value?
According to FTA spring thaw is interesting for gravel roads only, but not so much for paved roads that are under their responsibility. There is uncertainty as to whether a combination of road weather data and pavement quality would provide added value. More precise information could be useful; however, the number of interested users is very small. FTA issues a map on their website for users, indicating weight limits each year.
For YIT the weather effect must be included in the measurements, as the weather conditions define how quickly the pavement degrades. With weather forecasts one can even forecast how the pavements will last in the future. Asphalt patching is done also during wintertime, if necessary. Assessments are needed in a 1-to-2-year span. More studies on this issue are needed.
In Hamburg this information would be interesting for the winter maintenance services.
In Sweden this combination of data would not be important, only for the thaw season. Spring thaw is not only a problem on gravel roads, but for the paved roads even more. They are cracking and repair costs a lot of money.
C.5 Do you think a correlation with speed would be useful?
In Finland neither FTA nor YIT are interested in a correlation with speed.
In the Netherlands they measure at 80km/h, but in order to learn something about the comfort of driving it would be nice to get that information from cars driving at higher speed.
It could be useful in the context of research and development, but not so much in the daily work of Trafikverket. As heavy traffic damages the pavement more if it goes slowly than driving at normal speed, it would be interesting to do some research as to how much money the public authority could save if the trucks are driving 50km/h instead of 10km/h, which is the case at the moment in some areas during rush hours. At the moment this is being measured in another way. But in any case they get the speed information from another source, so there is no particular need to display it in the MOBI-ROMA tool.
C.6 What would be the scale of information you were interested in (city level, county level etc.)?
All interviewees said that the information needs to be scalable and that all scales are interesting.

ENR2011 DESIGN MOBI-ROMA D4 Final Report
Page 77 of 101
C.7 How would you use this information in your everyday work?
In Finland there are three years warranty on pavement works’ contracts. And normally the contractor is charged for paving works within this time, for repair of cracks and potholes, and if there are bigger problems they have to pay for a complete new pavement. But what happens after three years is more to do with the climate during that time then with the quality of the paving work. Why there are potholes and cracks is because of the ravelling of stones, and that is related to bad quality of paving work. But MOBI-ROMA is not considered good enough to analyse the quality of paving work. For the people responsible for maintenance it would be good to compare the present situation with the status a year ago and see where quality is decreasing rapidly.
FTA would use the information to follow how the status of the road network is changing on a national scale. Sometimes there is an urgent need to assess the condition of a specific road stretch and report to ministry. For this particular need MOBI-ROMA could be useful. Google Street View would be a very useful tool if the pictures were up-to-date.
In the YIT road weather centre the information could be visible on a big screen on the wall. It would be used a) as an indicator map for road maintenance, b) in quality assurance and control; the system shows the problem spots, and maintenance operations can be planned accordingly, and c) to follow the spring thaw situation.
In the Netherlands the information would possibly be used check and follow changes at specific times of the year. By doing a scan at the beginning and at the end of every season Rijkswaterstaat could see seasonal effects on their pavement condition.
If MOBI-ROMA information was available on the web exact to the day the road authority of the City of Hamburg would be using it as reference now and then, but not every day. They could have a list of sections they would monitor weekly and some others monthly. In order to be able to use the information on a daily basis they would have to know what exactly the quality levels 1-10 are. Does the scale represent parameters that they normally use in their maintenance management? They do not need to know the calculation, but they want to know what is in it.
For Trafikverket the service could be interesting because they have specific contractors for several areas; they are responsible for that area over 3 or 4 years. Trafikverket could have a look what medium IRI or rut depth do they get over these years. Thus, in the future they could develop different standards when putting these contracts out to tender. They could have a medium rut depth over the contract period. In summertime the tool could be used to monitor asphalt melting.
C.8 Do you see a potential for a conflict between the interests of measurement companies (procurement contractors) and FCD measurements?
FTA doesn’t see a conflict between the interests of measurement companies and FCD measurements, because they are always developing their system and what kind of data they want. So the companies have to adapt. Nothing lasts forever. MOBI-ROMA would not be competing with the measurements they are doing now because it is not measuring ruts. The contractor YIT sees a risk that the kind of information generated by MOBI-ROMA could be interpreted and used by the contracting authority as a new way to provide more fines for falling short of the quality standards, i.e. as a stick, but not as a carrot.

ENR2011 DESIGN MOBI-ROMA D4 Final Report
Page 78 of 101
The contracts in the Netherlands are based on standard measurements with quite specific protocols and it is expected that the FCD will vary, e.g. with regard to the speed. So that would be an overall indication with the benefit that it is continuously measured, but the contracts will still to be dealing with the specific inspections. Over time, if there is more experience with FCD, competition of the two assessment methods could become an issue, but Rijkswaterstaat does not expect that to happen during the next 10-15 years.
The City of Hamburg as a public authority commissions the engineering companies, so there cannot be any conflict of interests. There can only be a professional conflict in that their information is competing with that gathered from FCD. Future will show if mobile data is sufficient for quality assessment or whether additional measurement campaigns are needed.
Trafikverket sees the information as a good complement. For the laser beam measurements there is a large number of regulations how exactly it should be placed on the road etc. Therefore, it is used differently.
A conflict is very unlikely in Bavaria, as the present measurement procedure has established over time and the standards used today are mature; one wouldn’t veer away from that very easily.
D. Potential for private users?
D.1 The potential user group are the road administrations, rather than private persons. Do you see a potential of this information to be developed further into applications with added value for private users (e.g. for navigation systems)?
The Finnish Transport Agency considers slipperiness data useful to be fed into navigation systems provided it is being updated automatically. But for private users information must be such that they understand it. Information on surface thawing hot spots would be a useful new service for Finns going to their summer cottages.
As a service provider, YIT believes that there is a potential that the information may reduce the feedback that is now coming from the road users (because the users would know the situation better while following the MOBI-ROMA service). Spring thaw is a big risk and expense for transport companies, and the service should be useful for their managers while planning operations.
For the Netherlands, MOBI-ROMA is seen as a potential additional value for drivers if data is fed into their in-car-systems. They already have information on traffic jams, and that could be extended by warnings about the state of the road, e.g. risk of flooding, risk of skidding; it could provide additional service for the diver to decide which route to take.
The road authority in Hamburg states that private users only need to know which roads are free, with regard to traffic flow and road works as well as snow and ice. But this information is already available. “Personally, I would not make my route decision dependant on the quality of the road surface.”

ENR2011 DESIGN MOBI-ROMA D4 Final Report
Page 79 of 101
The representative of Trafikverket suggests that the service might not be interesting for private users, but for municipalities. Even bigger cities like Gothenburg have much less money for measurements with laser beams, so they will have even more use for this kind of information. Cities don’t have a PMS like Trafikverket does. It would be very good to have this FCD in municipalities. They might be very interested in having these measurements. For private users it could be interesting too. Maybe in the future, road quality information could be used for calculations in route planners that offer you the shortest, the fastest and the cheapest route from one point to another. However, right now the biggest potential is seen in the smaller cities, for them to plan their road maintenance activities. At Trafikverket they only measure state owned roads, they are not measuring roads in the cities. They have to measure their own road network. And it is very uncommon that they do that because they don’t have money for that. In Sweden there are 290 different municipalities and 280 of them don’t do any measurements. For them, MOBI-ROMA could be useful.
The representative of the Free State of Bavaria does not see any relevance for private users and assumes that they would not show much interest.
D.2 Do you think private users would be willing to pay for this information?
With regard to the question whether private persons would be willing to pay for the additional information all interviewees had the same opinion: individual persons would not want to pay, they would expect the information to be free as it is no crucial information with regard to route choice or safety. For private users the information would have to be attached to some other service. It could be a bonus paid by some safety related company, e.g. insurances. It could be a standard service attached to a certain type of car. Paying for Internet content tends to be difficult; most people don’t seem to be willing to pay for that. A potential willingness to pay might be with private companies, provided they see an economic benefit. The service would have to come as part of the equipment (e.g. navigation system).
D.3 Would you want this information to be publicly available?
One of the representatives of FTA predicts that in the future there will be much more information available than there is now, but that is not necessarily a positive development. In Finland, if the information on the road status were available no one would drive 50 kilometres more if they knew that there were potholes. There is simply no alternative – one could take the train, though. In Germany the situation might be different: one might want to choose another road if there is a traffic jam. He doesn’t think it is important for people to know the status of the road; more important is whether there are road works ongoing. Generally, as a public authority, FTA has no objections to the publication of the information. As the data is collected with public funds it must be available for all. From the perspective of a service provider like YIT it is seen that the information could be publicly available if the system is run as a public investment. However, if private companies collect the data, they may not want to give it out for free. Moreover, one should be careful with safety-related information that is shown openly to the general public as it may be interpreted wrongly. If the information is out-dated then this should be shown (e.g. coloured in grey shades). MOBI-ROMA information is more targeted at the professional user. A better solution for the common drivers would be another kind of service tailored to their specific needs.

ENR2011 DESIGN MOBI-ROMA D4 Final Report
Page 80 of 101
For Rijkswaterstaat the publication of the information wouldn’t be a problem. They are already working along the lines of providing as much information as they can. This would be one step further to providing up-to-date information and make it transparent what exactly they do as pavement managers. The only problem that could arise here is that if they have contractors responsible for specific sections of pavement linked to their actual performance. One has to be careful with that.
For the City of Hamburg there would be no problem at all to publish this information. The roads are public, so everyone can see in which state they are anyway.
In Sweden there are no restrictions either. Almost all information stored in the PMS is publicly available. Though, some data is not published.
As a public authority the Ministry for the Interior in the Free State of Bavaria supports transparency and says that there is nothing to hide.
8.4 Cost assessment and monetized benefits
As the demonstrated MOBI-ROMA service pilot is still on a concept level and not implemented anywhere operationally, a detailed cost-benefit analysis cannot be performed yet. Thus in the following, a general discussion on the issue and some crude assumptions are presented. Those are based on several service models and some known costs figures of the present road transport system in Europe. See also some earlier comments in Chapter 8.3.1, point A4.
8.4.1 Costs of mobile monitoring systems
The basic assumption of MOBI-ROMA is that the service is implemented on vehicles that are driving on the road network for other reasons, not just for the sake of mobile monitoring. As already discussed, various service provisioning concepts can be envisioned. For instance, postage cars were used in the spring thaw monitoring pilot. Other alternatives could be e.g. taxis in urban areas, buses or milk collecting cars in the countryside, and various road maintenance vehicles. In this way there would be no extra costs for the driver, the vehicle or the fuel.
With this assumption, the main cost factors of an operational mobile monitoring system are:
investment costs of monitoring instruments one-time installation costs running maintenance costs training of drivers the data collection and analysis centre: software systems, implementation and running
costs data transmission costs
The instrumentation costs depend on whether the vehicle CAN-bus data or several kinds of mounted monitoring instruments are used. In reality, it is probable that the system is a combination of several kinds of solutions: part of data is analysed from the CAN-bus output, some comes from purpose built hardware such as those used in MOBI-ROMA, and some originate from more complicated instruments, such as those described in the first MOBI-ROMA report. [1]

ENR2011 DESIGN MOBI-ROMA D4 Final Report
Page 81 of 101
A simple first-guess for the average instrumentation cost per annum per monitoring vehicle could be 1000 €, applying 3-5 years amortization period. Installation, maintenance and training could amount to a similar value.
Some 5-10 years ago mobile data transmission used to be very expensive and a true barrier to service implementations, but this is no longer true. With present 3G and 4G networks data transmission is cost effective and mobile networks cover quite well the countries, the main road network especially.
The system service contract would be most probably outsourced to a third party already collecting and analyzing large volumes of observational data, i.e. public or private information service providers in the road or weather sector. Thus the data transmission, collection and analysis would be a part of the earlier routine, with reasonable extra costs. Taking into account amortized product development costs, a third 1000 € cost per vehicle could be a first-guess for this third and last cost group.
In conclusion, with the above mentioned assumptions, a crude estimate for the mobile monitoring system could be of the order of 3000 € per annum per monitoring vehicle, and thus the total costs would depend mostly on the size of the monitoring fleet. A fleet of hundred cars would cost some 300 k€ annually, corresponding roughly to total costs of three fixed observing stations.
If monitoring vehicles dedicated for just this purpose and with specific personnel would be included in the system, the total costs would naturally rise considerably. Three such units would cost easily as much as the above mentioned fleet of 100 vehicles. On the other hand, effective use of the vehicle sensors through CAN-bus is finally becoming feasible (see Chapter 9 on exploitation), allowing monitoring fleets without additional instrumentation needs or costs. This would lower the costs per monitoring unit even further.
Weather and road condition observing is usually considered public duty due to the strong safety aspects involved. Mobile monitoring systems would develop as a natural expansion of the present observing networks which already consist of a multitude of data sources from fixed observing stations, radars, satellites, ships, instrumented balloons, airplanes etc. Thus the National Weather Services and Road Authorities should judge the potential benefits versus reasonable costs of mobile monitoring systems that could be installed and maintained with public funds. However, considering the present economic constraints, it will not be an easy task to add new cost items to public budgets.
There are also other modern business models which are becoming popular along with social media services. With automatic CAN-bus exploitation and fixed monthly telecommunication fees, private car drivers could be invited to community road network observers. They could send their mobile data to a specific data collection center, and in return would be able to use its products and services. In this kind of a system calibration of observations may become a problem, but sophisticated crowd sourcing methods can be used to filter out wrong observations. As with most present web services, this kind of business model could be enhanced with advertising and sponsoring contracts to become more sustainable.

ENR2011 DESIGN MOBI-ROMA D4 Final Report
Page 82 of 101
8.4.2 Monetized benefits to road maintenance
In Chapter 7, applicability and benefits of MOBI-ROMA system to road maintenance were discussed in the three demonstrated pilots: pavement surface maintenance, controlling load restrictions due to spring thaw, and winter road maintenance. In these cases, can we also assess the monetized benefits versus the running costs?
The MOBI-ROMA system has not been developed to replace the existing, very exact though more expensive monitoring methods. Its role would be to complement the other measurements and give not so precise but precise enough view of the road conditions, with very good temporal and spatial accuracy. Thus there is no idea to compare the costs and benefits of the two systems, as there is no intention necessarily to save direct running costs of the existing monitoring system with the new mobile method.
The assessment of monetized benefits cannot be done very accurately. Those would derive from the more effective, better timed and placed maintenance activities. Road managers would see the problem points on the road network earlier and save some maintenance costs, as well as optimise the maintenance schedule. Gravel roads could be maintained, closed and opened optimally during spring thaw. Winter maintenance would become more effective when slippery road stretches would be revealed earlier and with better spatial resolution. Salting could be minimised to the problem spots.
In this way the optimised road maintenance activities would result in higher quality road network, ensuring more fluent, effective and less polluting road transport. Considering the reasonably low costs of the mobile monitoring network, it may be safe to say that the derived monetized benefits for road maintenance will cover the running costs. Increased safety for road users is however the most important effect, to be discussed next.
8.4.3 Monetized benefits to road users
MOBI-ROMA will be beneficial to road users through its capability to improve and optimise maintenance of the road network. The economic value of drivers’ comfort is difficult to assess but should not be belittled. For instance, private drivers could avoid roads with poor surface coating, and in springtime plan a better schedule to reach their holiday sites behind gravel roads. For professional users such as logging and logistics industry these are matters of concrete potential economic gains.
However, the most beneficial feature of MOBI-ROMA is its potential to reveal and express with great precision existing problems on the road network, which are causing discomfort but in particular safety risks to road users. In the future (near future we hope), this feature together with effective, fast and targeted information flow including warnings will form a basis for a family of very beneficial new road user services.
The great potential of benefits of improved safety services for road transport is easy to understand by looking at road accident costs. Those differ regionally depending on the climate, national driving culture and other demographic effects. In Northern Europe harsh wintertime driving conditions form an elevated risk almost half of the year.

ENR2011 DESIGN MOBI-ROMA D4 Final Report
Page 83 of 101
Finland alone has approx. 100 persons killed on slippery roads annually (30% of all road fatalities round the year), causing approximately 250 million EUR annual costs. Almost 1,000 persons are injured and related costs are huge amounting to almost 4 billion EUR per year. [19] [20]
In Europe, in countries with milder climate the proportional costs are not quite as high as in Finland. But nevertheless, for EU-25 the corresponding figures are substantial. According to Eurostat, in 2007 there were 49,000 killed and 1.9 million injured in traffic accidents. Economic and social losses are so large that any new means to reduce these figures result in considerable benefits.
MOBI-ROMA has potential to reduce at least weather related accidents. The recent FP7 Transport project EWENT - Extreme weather impacts on European transport - estimated the total weather related costs that comprise of increased travel time, road accidents causing fatalities and injuries (in three classes according to their severity), and costs to maintenance and infrastructure. [21] Total weather-induced costs for road transport were estimated to amount to a stunning 41 billion Euros annually.
Thus the economic significance of MOBI-ROMA can be very high, if the number of accidents and fatalities can be reduced with more precise and timely traffic warnings. In Finland alone a reduction of wintertime accidents by 1% would imply annual benefits of some 40 million EUR, which is more than 100 times of the estimated costs of a 100 car monitoring fleet.
9 Exploitation of results
9.1 As a new information source
In the following we discuss the next steps, i.e. how to make use of mobile data produced by new mobile monitoring systems such as MOBI-ROMA.
One of the key results of the project is that FCD is a potential and feasible technology for much improved monitoring of road conditions. When the techniques demonstrated in this project are mature enough for operational use, it will be a boost and a large step forward increasing the data coverage of roads and the quality of information that can be used by maintenance personal or road users.
Today most of the information used for giving out data about present road condition comes from costly road side installations or specially designed measuring vehicles. As shown in the schematic figure below, the mobile techniques will facilitate a new, higher level of information development regarding the present road situation and also give better possibilities for more precise prediction for the future and follow-ups of the road development.
Even though the road sector as a whole will be the main beneficiary and exploiter of mobile monitoring data, those have potential in the general weather service use as well. The modern high-resolution weather models require high-resolution observations for the initial analysis and there is a constant lack of precise enough data, both in time and place. Mobile road monitoring data including additional parameters such as air and surface temperature, air pressure and rainfall would be of great use in general weather service and would improve the quality of present local weather forecasts.

ENR2011 DESIGN MOBI-ROMA D4 Final Report
Page 84 of 101
Figure 41, The level of monitoring information with present technologies and future systems including mobile monitoring methods.
9.2 As a tool for information to maintenance personal
Maintenance of roads is very costly and today many of the activities are performed with little or sparse information of the actual road conditions. This could be related to such a factor as the present asphalt quality – what is the present level of a specific road? To be able to answer that question detailed measurements are needed. However, how long time can I relay on the data? Only the next measurement will be able to give you an answer to that.
The technique demonstrated in MOBI-ROMA shows that it is possible to use data from ordinary cars to receive good enough information of the present situation. By use of this technique it is not only possible to receive information of the actual road status but also with a short time resolution see any changes that take place. This will give the maintenance personal a good possibility to plan their activities and a way of knowing more about the present situation.
Chapter 7 discussed the use of MOBI-ROMA in pavement quality maintenance, spring thaw monitoring, and winter maintenance. Other parameters, such as air quality, could be monitored with similar methods just altering the monitoring instruments. Thus the method has potential to be developed for several other maintenance needs, as soon as the monitoring technology provides a suitable device for mobile use.
9.3 As a tool for information to road users
Road users need better information about several factors of road conditions such as:
‐ road weather, ‐ traffic situation, ‐ travel time, ‐ road conditions, etc.

ENR2011 DESIGN MOBI-ROMA D4 Final Report
Page 85 of 101
Today most of this information is based on measurements and calculations from fixed field stations. By use of data from vehicles travelling along the roads a more detailed and precise information can be obtained. Ideally, this information would be collected and analysed in real-time, and processed into user-friendly products. Those would be disseminated to drivers along their indicated needs and driving on those areas where there are observations of interest or causing alarm. Especially those parameters that are strongly linked with drivers’ safety (such as slipperiness or poor visibility) should have timely and effective dissemination systems.
Today there are no standards and no ways of - in an easy way - presenting the information to the road users. In the MOBI-ROMA project we have demonstrated that it possible to produce better data by use of mixing mobile and fixed measuring platforms. However in order to make really good use of this type of data it is necessary that a large extent of the car fleet is equipped with communication means to send and receive data. The systems must be user friendly and such that they do not cause an extra safety risk for the drivers. What we really want to avoid is a horror vision of Figure 42, resulting in mixing of various necessary platforms in order to be able to use the data that is needed.
Figure 42, One very bad future vision of road user information systems, to be strictly avoided.
Some other bottle necks also exist and must be solved for the proper implementation of the next generation of road information system:
‐ Large fleet of vehicles are necessary for the coverage of major roads in Europe, ‐ standards for data should be developed and agreed on the European (or international)
level so that it is possible to mix data from different type of vehicles and mobile measuring equipment,
‐ low cost of communication between vehicles and road side equipment as well as data analysis centres is required.

ENR2011 DESIGN MOBI-ROMA D4 Final Report
Page 86 of 101
9.4 Why to use mobile data
From the discussion above some obvious conclusions can be drawn regarding the usefulness of car fleet data for the improvement of road maintenance. However, as the Figure 43 schematically depicts, there is the real benefit to come. New data, especially if it is free and openly available, will automatically lead to new development and new type of products and services.
A comparison with the development within smart phones services is worth making. The developments that have taken place since the introduction of service applications - the Apps - are just tremendous. This has been achieved by inventing a platform where new type of applications and products can be marketed and made available for different kind of users.
The same type of development can be possible in the road sector by starting up the use of monitoring data and launching demonstration projects utilising the techniques presented in the MOBI-ROMA project.
The cars today are equipped with plenty of sensors that should be exploited for important users’ needs such as road maintenance or driver safety. However, until recently this data has been proprietary and manufacturer specific, and not available to service developers. It has been a serious bottle-neck, but now finally showing signs of removal. In 2012 Ford was the first car manufacturer to announce its OpenXC program (see http://openxcplatform.com) to allow developers to access metrics from its cars’ internal network. Just after few months after the release, Ford announces that more than 2500 developers have registered to its developer programme (https://developer.ford.com/). This is another success story of open data policy and most probably other car manufacturers cannot but follow. The exploitation of CAN-bus data is now truly starting and will lead into numerous new user applications, including service such as those demonstrated in MOBI-ROMA.
Figure 43, The growth in information level/products from introducing a new concept of data.
To implement, run and exploit mobile monitoring networks still requires plenty of planning and standardization work. In national scale the Road administrations are the natural body to organize monitoring networks to complement the existing systems. However, MOBI-ROMA pilot extended to several EU countries and the results were shown on the web interface. This kind of information would be valuable for trans-national traffic chains. But what would be the best body to organize and run a European-wide monitoring system?
ENR2011 DESIGN MOBI-ROMA D4 Final Report
Page 87 of 101
10 Summary and key recommendations
MOBI-ROMA project has demonstrated a web-based pilot service for mobile road condition monitoring. Validation of the collected data set from three different sources proved data to be relevant and accurate enough for user evaluation. The amount of data was also large enough to validate the system performance.
To evaluate the MOBI-ROMA maintenance tool, the self-evaluation of results was performed with advanced evaluation and validation method Evaserve, a meta-tool for evaluation of information services. User evaluation with stakeholders was organised, first and foremost with national road administrations. At this early stage of service development it was possible to do a general cost/benefit analysis of the use of FCD in road maintenance and road user services. This revealed the great potential in development of road user warnings based on mobile monitoring data. Even a small reduction of accidents can lead to substantial benefits in national and European scale.
Some technical bottle-necks still exist for the effective deployment of MOBI-ROMA kind of mobile monitoring systems in Europe.
‐ The remaining accessibility problems to CAN-bus data must be solved. Even though just recently first concrete actions to open CAN-bus for applications have taken place, a concerted European-wide action may be required, such as the implementation of the eCall system.
‐ Standards for data should be developed and agreed on the European (or international) level so that it is possible to mix data from different type of vehicles and mobile measuring equipment.
‐ Large fleet of vehicles is necessary for the coverage of major roads in Europe. ‐ In national scale the Road administrations are the natural body to organize the mobile
monitoring network to complement the existing systems. What would be the body to organize and run a European-wide mobile monitoring system?
‐ Low cost of communication between vehicles and road side equipment as well as data analysis centres is required.
The outcomes of the evaluation activities are various. In retrospection, the combination of self-evaluation and expert user interviews has proven to be most valuable. The project partners’ assessment of the tool provides information of what the service is actually capable of delivering and what further potential it has from a technical point of view. The user evaluation showed the experts’ understanding of FCD, it revealed some weak spots in the maintenance managements and gave a clearer picture of the users’ needs for a service like MOBI-ROMA. In some points the interviewees shared the same view, but in others they had opposing opinions.
With regard to spring thaw with an effect on the load bearing capacity of gravel roads MOBI-ROMA services have much more relevance in the Nordic countries. Their share of gravel roads in the entire road network is much larger; in Finland the national authority is responsible for 28,000 kilometres of gravel roads, but there are some 200,000 kilometres of private roads that are momentarily not being monitored. The majority belongs to the lumber industry. They are the potential primary private beneficiaries of the planning tool.
Representatives from the Netherlands as well as from state authorities in Hamburg and Bavaria did not see any relevance of this information for their purposes. This might be due to the different climate, but also to a non-relevant share of gravel roads.

ENR2011 DESIGN MOBI-ROMA D4 Final Report
Page 88 of 101
Interviewees from Germany did not see any relevance of the MOBI-ROMA service for improving winter maintenance, whereas representatives from Sweden and especially from Finland found the tool very helpful in this context.
When it comes to the service’s potential for improving maintenance management through information on pavement quality from FCD the replies differed depending on what level of administration we asked. At national level the added value of the service was considered relatively small, because the measurements would not comply with the existing standards. Another picture can be drawn for municipal administrations. The Swedish national road authority Trafikverket suggested that MOBI-ROMA could be of greater added value for municipalities; the Dutch Rijkswaterstaat indicated the same. Their assumptions were indeed confirmed by the representative of the City of Hamburg. As local authorities do not have sufficient financial resource to carry out test drives with measurement vehicles, MOBI-ROMA could be a valuable source of information for their maintenance management.
All interviewees agreed that any additional tool would only make sense if it were simple to use and tailored exactly to the user needs.
At the Finnish Ministry for Transport there are plans for a centralised database. Today, FTA and the contractors have different user interfaces. However, in practice it is not so easy to insert FCD as used in MOBI-ROMA into existing systems as the road register is still widely used and it is based on road addresses and meters, not on geographic coordinates.
Due to the climate in the Nordic countries potholes and cracks in the road surface are a big issue. However, the information generated from FCD in the context of MOBI-ROMA has a complementary character and will not substitute laser measurements. MOBI-ROMA alone does not intend to cover the needs of road administrations and it cannot detect potholes and cracks, only roughness. However, its strength lies in its short-time availability at very low cost. Furthermore, as the measurements come directly and in large numbers from the vehicles themselves it is a good source of information how the roughness is perceived by the car and what effect short waves have on the driving quality. This information is otherwise not available (e.g. from laser measurements).
Generally speaking, all interviewees found it difficult to imagine the tool fully operational; thus, an assessment of its potential was difficult too. However, as the budgets of public road authorities are limited, maintenance planning has an increasingly important role. And even though some of the potential users had doubts about the quality of the data and if it was sufficiently exact, most of the experts showed an interest in the further development and believed that there is a potential for such a service.

ENR2011 DESIGN MOBI-ROMA D4 Final Report
Page 89 of 102
11 References
[1] ERA-NET Road 2011, MOBI-ROMA Deliverable No. 1 State of the Art of Floating Car Measurements. http://www.eranetroad.org.
[2] ERA-NET Road 2012, MOBI-ROMA Deliverable No. 2 Report on Data Collection,
Fusion and Analysis. http://www.eranetroad.org. [3] ERA-NET Road 2012, MOBI-ROMA Deliverable No. 3 Development of Graphical User
Interface. http://www.eranetroad.org. [4] Leduc, G., 2008: Road Traffic Data: Collection Methods and Applications. JRC
Technical Notes, JRC 47967 – 2008, European Communities, Luxembourg
[5] Turksma, S., 2000, The Various Uses of Floating Car Data, Road transport information and control, 2000, Tenth international conference on (Conf. Publ. No. 472) Page. 51-52
[6] Schäfer, R.-P., Thiessenhusen, K.-U., Brockfeld, E. and Wagner, P., 2002, A traffic information system by means of real-time floating-car data. ITS World Congress 2002 , 2002-10-11 - 2002-10-14 , Chicago (USA).
[7] Drobot, S., Chapman, M.B., Anderson, A., Lambi, B., Pisano, P.A., Guevara, G., 2012, Tomorrow’s Forecast: Informed Drivers, Transportation Research Circular, April 2012, Winter Maintenance and Surface Transportation Weather, Page. 560-572. Transport Research Board of National Academies.
[8] Koller, D., Hersey, B.W., Mewes, J.J., McCellan, A.K., 2012, New Methods to Quality Check Road and Weather Observations for Vehicle Data, Transportation Research Circular, April 2012, Winter Maintenance and Surface Transportation Weather, Page. 349-362. Transport Research Board of National Academies.
[9] http://intro.fehrl.org
[10] INTRO Intelligent Roads, Final Summary Report. http://intro.fehrl.org/?m=7&id_directory=108
[11] Fordonsstrategisk Forskning och Innovation, FFI 2011, Slutrapport BiFi del 1, http://www.vinnova.se/en/
[12] SRIS – Final report. IVSS 2008. [13] Swedish Transport Administration, Trafikverket 2012, Underhållsstandard belagd väg
2011, ISBN: 978-91-7467-272-5 [14] Vägytemätning med mätbil; vägnästmätning 2009, Metodbeskrivning 121:2009, VV publ. Nr. 2009-05-11 [15] Svenska vägtillståndsmått då, nu och imorgon Del 2: Nu – år 2005-2009, 2011: Leif
Sjögren, Thomas Lundberg, VTI rapport 718, www.vti.se/publikationer

ENR2011 DESIGN MOBI-ROMA D4 Final Report
Page 90 of 102
[16] Saarenketo, T., Aho, S., 2005: Managing Spring Thaw Weakening on Low Volume
Roads: Problem description, road restriction policies, monitoring and
rehabilitation. Roadex II Northern Periphery. Page. 47-48. [17] Norrman, J., Eriksson, M., and Lindqvist, S., 2000: Relationships between road
slipperiness, traffic, accident risk and winter road maintenance activity. Climate research, 15:185-193.
[18] Professional Windows GUI programming using C#, Choudhury, Wahid, ISBN: 1861007663
[19] Sarjamo, S. and Malmivuo, M. 2004: Talviliikenteen turvallisuus Suomessa ja Ruotsissa (Wintertime traffic safety in Finland and Sweden). In Finnish, 87 pp. LINTU Reports 5A/2004, Ministry of Transport and Communications. ISBN 951-723-748-0.
[20] Hiltunen, L. 2006: Liikenneonnettomuuskustannusten muodostuminen ja kohden-tuminen (The structure and distribution of traffic accident costs). In Finnish, 117 pp. Finnish Road Administration, Finnra Reports 50/2006. ISBN 978-951-803-821-7.
[21] The costs of extreme weather for the European transport system. EWENT project deliverable D4, VTT Technology 36, http://ewent.vtt.fi/Deliverables/D4/T36.pdf

ENR2011 DESIGN MOBI-ROMA D4 Final Report
Page 91 of 102
Annex 1 AINO worksheets template
ITS service assessment sheet
Name of project/service MOBI-ROMA
Assessment information
Date
Name and affiliation of evaluator
Assessment phase
1 SERVICE DESCRIPTION
Background and objectives
What is the user need behind the service and the problem to be solved with the service?
What is the development trend and severity of the background problem (e.g. the current and future number of accidents, incidents or delays, and their effect on the society)?
What are the objectives of the service?
Service content and dissemination channels
What kind of information or control does the service produce? Via which channels can users access the service? Can the service be tailored to fit user's needs? How will the service content and dissemination channels change when new
technology solutions are developed and taken into use?
Service provision concept
How is service provision organised? Who hosts the service? Who distributes it? Which are the responsibilities of the organisations involved? How are the service ownership and host issues solved? How are the maintenance and liability issues solved? Upon which data bases and technology solutions are the service provision and user
access built? How is the data processed further to information and service? What is the availability of source data? What is the quality of primary source data?

ENR2011 DESIGN MOBI-ROMA D4 Final Report
Page 92 of 102
Costs, resource needs and financing
What investments, annual maintenance and operational costs as well as fees does the service require in total and from the public sector as a purchaser/supporter?
Who are the primary investors? What is the price of or cost associated with the data needed? What actors/organisations finance the service and in which manner and proportions? What is the potential for wider commercial exploitation of the service? How is the service to be marketed or promoted, and have the marketing costs been
considered in the calculations?
Potential market and users
Who are the potential primary customers of the service? How large, concentrated or diversified are these customers? Which is the estimated number of persons, companies or organisations using the
service (e.g. estimated number of service subscribers) and how is the estimate calculated?
Relationships to other activities
Description of how the service can possibly be related to other services (integrated services, service packages)
Does the service enable new or more efficient operations, and what is the economic significance of such operations?

ENR2011 DESIGN MOBI-ROMA D4 Final Report
Page 93 of 102
2 DESCRIPTION OF IMPACT INFORMATION
Impacts on travel
How does the service affect the number, time and modal choice of journeys and their costs?
Does the service reduce need of travel?
Impacts on transport system efficiency
How does the service affect route choices, journey times, congestion and traffic flow? How does the service affect incident occurrence, incident impacts and possibilities for
incident management?
Impacts on special groups
How does the service affect the travel and other possibilities of specific user groups, such as the elderly and disabled?
How does the service affect the business possibilities and welfare of some types of enterprises?
Impacts on safety, environment and community structure
How does the service affect traffic safety, security, environment, climate change, landscape, city scape and community structure?
Does the service have any impacts on gender, age or other social issues?
Impacts on transport system development and management; other impacts?
How does the service affect e.g. the needs to build and improve transport infrastructure?
How does the service affect transport infrastructure maintenance and operational costs?
How does the service affect public transport operational costs? What other impacts does the service have (e.g. health)?
Service impact assessment plan
How can the impacts of the service be studied and monitored (e.g. user acceptance and user interfaces)?
What assessment methods can and will be applied (e.g. user tests, questionnaires)?

ENR2011 DESIGN MOBI-ROMA D4 Final Report
Page 94 of 102
3 SERVICE ASSESSMENT
Usefulness, innovation and economic efficiency
What new or more efficient operations does the service enable? What relevant information does the service produce? What is the added value for operations due to the service? What are the innovative aspects in service provision? Are there experiences from similar services or technology applications from
elsewhere? How does the service cater for fulfilment of transport or other policy objectives? Which are the social benefits that can be expressed in monetary terms in relation to
investment and maintenance costs (if estimation is possible)? Which are the total costs and fees for the service life cycle against the number of user
groups, users or use occasions? Which are the prerequisites for the business profitability of the service? Sensitivity to
central assumptions made?
Technical performance and quality assurance
How reliably does the service function (as estimated or measured)? Correctness of the information provided by the service (as estimated or studied)? How is the quality of the service ensured and/or monitored? How is user needs and feedback utilised in the further development of the service?
Accessibility and user centred design
How many users can use the service? What is the estimated number of users of service? Is the user interfaces unambiguous, clear and comprehensible? Has the HMI been
tested? Does the use require special skills, investments or actions? How have user requirements been considered in design of human machine
interaction? Has use context been considered (in vehicle/at home/etc.)? Have the needs of special groups been considered? Has the users' willingness to pay been investigated or tested? Are there user instructions and support services?
Opportunities and threats
Do similar services exist elsewhere? How many users exist for competing services? Is service financing settled and clear? Is the service compatible to existing system architectures (standard solutions, open
interfaces, generic platforms, etc.) Is service hosting (maintenance, development) settled? Have the key organisations in the service value network been identified and involved? Have legal issues (privacy, data security, etc.) been solved? Are new or modified
regulations required? Can the service be organised via competitive tendering? Can the service be extended with regard to content or user groups (service
integration, e.g. with tourism, entertainment)?

ENR2011 DESIGN MOBI-ROMA D4 Final Report
Page 95 of 102
Can the service be expanded and exported (markets, competition, business opportunities)?
What threats exist with regard to service comprehensibility, adaptability and usability? Which is the required hardware (e.g. terminals), how many exist today, what is their
price, future trends? Possibility of new competing technologies? Is the communication solution restricting use (e.g. number of users at same time,
many different terminals at same time)? Are all raw data available in electronic form?
Impact mechanisms and targets
(Please tick the appropriate boxes)
Target of impact
Ser
vice
leve
l an
d pe
rfor
man
ce
of tr
ansp
ort
syst
em
Cos
ts o
f tr
ansp
ort s
yste
m
Pre
requ
isite
s fo
r bu
sine
ss
Tra
ffic
safe
ty
Oth
ers
– sp
ecify
:
Change in transport infrastructure or vehicle fleet investment
Improved public transport incident management or route choice
More efficient public transport operations
More efficient use of transport infrastructure
More efficient transport network incident management
Improved driver and vehicle support
Promotion of non-motorised transports
Improved logistics chains and deliveries
Improved service provision prerequisites and tendering
Promotion of standardised and generic solutions
Development and piloting of innovative solutions
Others – specify:

ENR2011 DESIGN MOBI-ROMA D4 Final Report
Page 96 of 102
4 SERVICE OVERVIEW
Principle scheme of service or map
Summary of service description
Costs and price of service
(To be filled for appropriate parts specified in section 1)
Costs for planning and specification EUR
Investment costs EUR
Technical maintenance costs EUR/year
Operational costs EUR/year
Service pilot month EUR
Actual service price EUR/month
Public sector funding support EUR
Public sector personnel resources required person-months/year
Cost efficiency of service
Potential service users
Number of service users
Cost/price for subscriber over whole service life cycle (life cycle length is assumed to be 5 years) EUR/year
EUR/user

ENR2011 DESIGN MOBI-ROMA D4 Final Report
Page 97 of 102
Summary of primary impacts
Service production model
Financers of service
Providers of user service
Actors/organisations involved in planning
Overview of production model
Additional information
Contact information for additional information on assessment Essential literature references
Summary of service assessment
For instance, estimated cost-benefit ratio, multiple-criteria analysis (MCA) or rating for comparison of different projects

ENR2011 DESIGN MOBI-ROMA D4 Final Report
Page 98 of 102
5 ADDITONAL INFORMATION
Persons involved in assessment
Names, affiliations, organisation, phone numbers and e-mail addresses.
Literature references
All literature and other material used in evaluation in such a form that they can be obtained on the basis of the information given.
Additional information to calculations and assessments
Additional or background information, calculations etc. behind the information given in parts 1-4, preferably specifying the section and calculation/estimate referred to.
Other additional information
All other additional information related to the assessment such as e.g. reason for assessment, context within which made, inspectors/verifiers of assessment

ENR2011 DESIGN MOBI-ROMA D4 Final Report
Page 99 of 102
Annex 2 User Interview guideline
MOBI-ROMA
Questionnaire for the user evaluation of MOBI-ROMA
project results
March 2012
Foreca Ltd
Semcon AB
Klimator AB
Pöyry Infra GmbH
This image cannot currently be displayed.
ENR2011 DESIGN MOBI-ROMA D4 Final Report
Page 100 of 102
Introduction
MOBI-ROMA stands for Mobile Observation Methods for Road Maintenance Assessments. The key objectives are to develop, test and evaluate improved, affordable and moderate-cost road condition and performance assessment techniques, which offer new effective tools for monitoring and assessing maintenance needs across Europe.
Since the advent of satellite navigation systems and mobile communication, both allowing vehicle tracking, there has been considerable research and development of monitoring systems that use intelligent cars as sensors to collect data – so called floating car data (FCD). Most previous studies have concentrated on the use of FCD for the analysis of the traffic situation to provide better information and for the development of new ITS services.
In MOBI-ROMA, the emphasis of the study is on road surface condition monitoring using data coming from vehicles’ internal sensors through the CAN-bus or from simple devices mounted on the vehicle. Similar techniques with suitable sensors can be used also for assessing the strength of the road bed or the need for winter maintenance. The key user sector of MOBI-ROMA research is road maintenance.
For the evaluation of our research results there are two evaluation tasks in MOBI-ROMA: in addition to having a critical look at the findings ourselves, this questionnaire is part of the user evaluation we are carrying out in order to get a better view on how the users see the potential value of FCD in general and of this particular method for the purpose of road maintenance planning in particular.
This questionnaire is the basis for a face-to-face interview at the TRA 2012 in Athens.
First results of driving a test car in several European countries and collecting data from the CAN-bus and from an additional sensor can be viewed on the project website www.mobiroma.eu.
Should you have any questions, please do not hesitate to contact us.
For the interviews
Stephanie Müller Pöyry Infra GmbH [email protected] T. +49 40 40196031 M. +49 160 5912787
For the website / technical aspects
Magnus Andersson Semcon Caran AB [email protected] T. +46736840983 M. +46736840983

ENR2011 DESIGN MOBI-ROMA D4 Final Report
Page 101 of 102
1 State-of-the-art in maintenance management
1.1 Are you interested in the status of your road network?
1.2 Are you aware of the actual surface coating status of all of your roads?
1.3 How do you get this information today?
1.4 Can you please describe the current measurement procedure (what/when/how often etc.)?
1.5 How do you use this information (maintenance planning, funding applications)?
1.6 What are the costs (per year)?
1.7 Does the knowledge of who are the users of certain roads influence the decision on where maintenance works is being prioritised?
2 Added-value of floating car data (FCD)
2.1 What is your understanding of the use of FCD for maintenance planning?
2.2 If you look at the website and the representation of information do you think this type of information would be useful for maintenance management?
2.3 Do you see a potential for complementing the current type of data?
2.4 What would be the benefit of FCD for public road administrations?
3 Improvements?
3.1 How much do you like what you see? Please rate
(1 = very much, 6 = not at all)
3.2 What else would you like to see in this application/interface?
3.3 Do you think a seasonal resolution would be useful?
3.4 Do you think a combination of road weather data and pavement quality would provide added value?
3.5 Do you think a correlation with speed would be useful (if everyone drives slowly because of the poor pavement quality a road section can become a bottleneck)?
3.6 What would be the scale of information you were interested in (city level, county level etc.)?
3.7 With a higher frequency of measurements would allow for an ex post evaluation of the paving work (how long did it last?). Do you think this information would be useful?
3.8 How would you use this information in your everyday work?
3.9 Do you see a potential for a conflict of interests between measurement companies (procurement contractors) and FCD measurements?
1 2 3 4 5 6

ENR2011 DESIGN MOBI-ROMA D4 Final Report
Page 102 of 102
4 Potential for private users?
4.1 The potential user group are the road administrations, rather than private persons. Do you see a potential of this information to be developed further into applications with added value for private users (e.g. for navigation systems)?
4.2 Do you think private users would be willing to pay for this information?
4.3 Would you want this information to be publicly available?
Thank you very much for your cooperation!