d3.2 rvf/malaria study site analysis
TRANSCRIPT

HEALTHY FUTURES FP7:266327 – D 3.2 RVF/malaria study site analysis and major findings for RVF & malaria transmission
i
HEALTHY FUTURES
Health, environmental change and adaptive capacity; mapping, examining & anticipating future risks of water-related vector-borne
diseases in eastern Africa
Collaborative Project Seventh Framework Programme
Cooperation
Deliverable D3.2
RVF/malaria study site analysis and major
findings for RVF & malaria transmission
Grant Agreement no. 266327
The research leading to these results has received funding from the European Community’s Seventh Framework Programme (FP7/2007-
2013) under grant agreement no 266327. This publication reflects the views only of the author, and the European Union cannot be held
responsible for any use which may be made of the information contained therein.
www.healthyfutures.eu

HEALTHY FUTURES FP7:266327 – D 3.2 RVF/malaria study site analysis and major findings for RVF & malaria transmission
ii
Work Package 3
Task 3.1b
Dissemination level Public
Restricted to other programme partners (including the
Commission Service)
Restricted to a group specified by the consortium (including
the Commission Service)
Confidential, only for members of the consortium (including
the Commission Service)
Publishing date Contractual: M24 Actual: M32
Deliverable D3.2 Version Draft Final
WP/Task Leader Mark Booth (UDUR)/Bernard Bett (ILRI)
Contact person Bernard Bett (ILRI)
Contributors Bernard Bett, John Gachohi, Debborah Mbotha
Short summary This deliverable gives provisional results of the on-going analyses on RVF and malaria transmission studies in Kenya. Analyses on RVF are based on historical data on RVF outbreaks recorded in the study site between 1961 and 2007, initial outputs from the RVF dynamical model that is being developed, and data collected from participatory studies. All the analyses on malaria are based on hospital records covering the period 2006 – 2011.
Keywords Malaria, Rift Valley fever, climate, transmission
Document name HEALTHY FUTURES Deliverable 3.2 RVF/malaria study site analysis

HEALTHY FUTURES FP7:266327 – D 3.2 RVF/malaria study site analysis and major findings for RVF & malaria transmission
iii
History Chart
Issue Date Changed page (s) Cause of change Implemented by
v.1
All rights reserved
This document may not be copied, reproduced or modified in whole or in part for any
purpose without the written permission from the HEALTHY FUTURES Consortium. In
addition to such written permission to copy, reproduce or modify this document in whole or
part, an acknowledgement of the authors of the document and all applicable portions of the
copyright must be clearly referenced.

HEALTHY FUTURES FP7:266327 – D 3.2 RVF/malaria study site analysis and major findings for RVF & malaria transmission
iv
Table of Contents
Table of Contents ...................................................................................................................... iv
List of Tables ............................................................................................................................. vi List of Figures .......................................................................................................................... viii List of Plates ............................................................................................................................ viii List of terms and abbreviations ................................................................................................ ix
Summary .................................................................................................................................... x
1 Ijara district – location and physical features ..................................................................... 2
1.1 Position and size .......................................................................................................... 2
1.2 Administrative and political units ............................................................................... 3
1.3 Ecological zone and topographic features .................................................................. 3
1.4 Climate ........................................................................................................................ 3
1.5 Human population density and settlement patterns ................................................. 4
1.6 Agriculture ................................................................................................................... 5
1.6.1 Wildlife resources and forestry............................................................................ 6
2 Rift Valley Fever .................................................................................................................. 7
2.1 Background .................................................................................................................. 7
2.2 Methodology ............................................................................................................... 8
2.2.1 Analytical framework ........................................................................................... 8
2.2.2 RVFV transmission model .................................................................................... 9
2.2.3 Empirical Studies ................................................................................................ 19
2.3 Results ....................................................................................................................... 26
2.3.1 Analyses of the historical data on RVF outbreaks ............................................. 26
2.3.2 Community-based participatory research survey ............................................. 28
2.3.3 Cross sectional surveys ...................................................................................... 34
2.3.4 Preliminary predictions ...................................................................................... 34
2.4 Discussion .................................................................................................................. 37
3 Malaria .............................................................................................................................. 41
3.1 Background ................................................................................................................ 41
HEALTHY FUTURES FP7:266327 – D 3.2 RVF/malaria study site analysis and major findings for RVF & malaria transmission
v
3.2 Methodology ............................................................................................................. 42
3.3 Results ....................................................................................................................... 43
3.3.1 Descriptive analyses ........................................................................................... 43
3.3.2 Results of statistical analyses ............................................................................. 44
3.4 Discussion .................................................................................................................. 45
4 Way forward on RVF work ................................................................................................ 46
5 References ........................................................................................................................ 48

HEALTHY FUTURES FP7:266327 – D 3.2 RVF/malaria study site analysis and major findings for RVF & malaria transmission
vi
List of Tables
Table 2.1. Projected population distributions of Ijara district by age groups for the period:
2008-2012 .................................................................................................................................. 5
Table 2.2. Types of livestock species kept in Ijara and their respective population sizes ......... 6
Table 2.3. Quantities of products generated from livestock in Ijara district in 2008 and their
market values in Kenya shillings ................................................................................................ 6
Table 3.1. Parameters used to initialize the RVFV transmission model .................................. 10
Table 3.2. Parameters used to simulate population dynamics and RVFV transmission in the
vectors ...................................................................................................................................... 15
Table 3.3. Parameters used to simulate livestock population dynamics in the RVFV
transmission model .................................................................................................................. 16
Table 3.4. RVFV transmission parameters in the hosts ........................................................... 17
Table 3.5. Total number of and selected sub-locations by division in Ijara District ................ 21
Table 3.6. A summary of the type of information collected using each of the three PE
techniques during participatory surveys conducted in Ijara District, August-November 2012
.................................................................................................................................................. 23
Table 3.7. Historical outbreaks of RVF involving Ijara and the other districts in the north-
eastern Kenya .......................................................................................................................... 27
Table 3.8. Results of the univariate analyses used to assess the association between RVF
outbreaks in Ijara district and precipitation, temperature and NDVI obtained from ECMWF27
Table 3.9. Random effects logistic regression models evaluating the association between
climate variables (precipitation and temperature) and RVF epizootics in Ijara district, Kenya
.................................................................................................................................................. 28
Table 3.10. Types of livestock species kept and their relative population sizes determined
using median percentage scores (with 10th and 90th percentiles) .......................................... 29
Table 3.11. Median proportions (with 10th and 90th percentiles) representing age category-
specific risks of mortalities in selected livestock species, by season ...................................... 29
Table 3.12. Median percentages (10th and 90th percentiles) of animals sold or slaughtered
in Ijara district by seasons (August 2006 to November 2007) ................................................. 31
HEALTHY FUTURES FP7:266327 – D 3.2 RVF/malaria study site analysis and major findings for RVF & malaria transmission
vii
Table 3.13. Reproduction parameters estimated from participatory exercises for the most
important livestock species raised in Ijara district .................................................................. 31
Table 3.14. Monthly normalised vegetation indices (NDVI) for the areas used to graze sheep
and goats by four different grazing communities in Ijara district over the period July 2012 to
July 2012 .................................................................................................................................. 33
Table 3.15. Monthly normalised vegetation indices (NDVI) for the areas used to graze cattle
by four different grazing communities in Ijara district over the period July 2012 to July 2012
.................................................................................................................................................. 33
Table 4.1. Annual statistics on the numbers of insecticide treated nets (ITNs), long lasting
insecticide treated nets (LLINs), arteminisin-combination therapies (ACTs) and the number
of houses covered with indoor residual spraying (IRS) obtained from Ijara district for the
period 2006 - 2007 ................................................................................................................... 44
Table 4.2. Results of statistical analyses conducted to investigate the correlation between
climate variables (rainfall and temperature) and hospital records of malaria cases and the
proportion of positive cases obtained from laboratory analyses (Ijara district, 2006 – 2011)
.................................................................................................................................................. 45

HEALTHY FUTURES FP7:266327 – D 3.2 RVF/malaria study site analysis and major findings for RVF & malaria transmission
viii
List of Figures
Figure 2.1. Location of Ijara district in Kenya. ........................................................................... 2
Figure 2.2. Total monthly rainfall and maximum (Tmax) and minimum (Tmin) temperatures
measured at Garissa meteorological station in 2011 ................................................................ 4
Figure 3.1. Flow diagram outlining vectors’ development stages captured in the vector sub-
model ....................................................................................................................................... 12
Figure 3.2. Flow diagram outlining hosts’ infection stages ..................................................... 18
Figure 3.3. Map of Ijara District showing the locations of villages that were surveyed in the
study. The inset is a ma of Kenya showing the location of Ijara district. ................................ 22
Figure 3.4. Predicted population levels of Aedes and Culex mosquitoes over the simulation
period ....................................................................................................................................... 34
Figure 3.5. Predicted RVFV incidence in cattle and sheep over the simulation period; the
inset graph illustrates the patterns of the epidemic at a relatively higher temporal resolution
.................................................................................................................................................. 35
Figure 3.6. Predicted changes in immunity levels following natural exposure to RVFV in
cattle ........................................................................................................................................ 36
Figure 3.7. Expected effect of varying the number of Aedes spp and joint Aedes and Culex
spp breeding sites on RVFV incidence in cattle ....................................................................... 36
Figure 3.8. Predicted RVFV incidence in Ijara, Kenya and Arusha Tanzania ............................ 37
Figure 4.1. Trends in the total number of outpatient malaria cases and those for patients
less than 5 years old attended to in all the health facilities in Ijara district in 2006 to 2011. 43
Figure 4.2. Monthly trends in proportion of cases that are positively diagnosed for malaria
using laboratory tests in Ijara district over the period 2006 – 2011 ....................................... 44
List of Plates
Plate 3.1. A CDC-type light trap set in the bushy Boni Forest near a water body in Ijara
District. ..................................................................................................................................... 26
Plate 3.2. A map indicating migration patterns of livestock in Hara sublocation, Ijara district
developed during one of the participatory rural appraisal meetings ..................................... 32

HEALTHY FUTURES FP7:266327 – D 3.2 RVF/malaria study site analysis and major findings for RVF & malaria transmission
ix
List of terms and abbreviations
ACTs Arteminisin combination therapies
AVID Arbovirus Incidence and Diversity project
CBS Central Bureau of Statistics
CDC Centres for Disease Control
ECMWF European Centre for Medium_Range Weather Forecasts
ELISA Enzyme linked immunosorbent assay
FAO Food and Agriculture Organization of the United Nations
GoK Government of Kenya
IBM Individual based model
IDSR Integrated Disease Surveillance and Response
IgG Immunoglobulin G
ILRI International Livestock Research Institute
ITNs Insecticide treated nets
LLINs Long lasting insecticide treated nets
MoH Ministry of Health
NDVI Normalised difference vegetation index
PfRT Parasite rate
RVF Rift Valley fever
RVFV Rift Valley fever virus
SST Sea surface temperatures
Tmax Maximum temperature
Tmin Minimum temperature
TRMM Tropical Rainfall Measuring Mission
WHO World Health Organization

HEALTHY FUTURES FP7:266327 – D 3.2 RVF/malaria study site analysis and major findings for RVF & malaria transmission
x
Summary
The HEALTHY FUTURES project evaluates the effects of environment and climate change
effects on selected vector borne diseases (Rift Valley fever, malaria and schistosomiasis) in
East Africa. The project will use both empirical and simulated data to develop prediction
models and information systems that can support the management of these diseases.
Empirical data will be collected in three pre-determined case study sites including Ijara
district in Kenya (Rift Valley fever and malaria study site), Lake Albert in Uganda
(schistosomiasis study site) and northern and southern Rwanda (a second malaria study
site).
Ijara is one of the six districts in Garissa County, north-eastern Kenya. It falls in V-VI agro-
ecological zones (semi-arid and very arid respectively) with the south-eastern part
neighbouring the coastal strip falling in zone IV (semi-humid to semi-arid zone).
Temperatures range between 15 and 380C though they tend to remain high throughout the
year except in April – August due to the low altitude and semi-arid conditions. Rainfall is low
and bimodal, with its density ranging between 200 mm to 1000 mm per annum. The district
is inhabited by the Somali pastoralists who live in small families commonly in trading centres
or watering points. The average population density is 7 people per square kilometre. The
district was selected for this work because it is a hotspot for RVF and it has also been used
previously by research projects such as Arbovirus Incidence and Diversity (AVID) project for
similar activities; it will be possible, therefore, to obtain secondary data for some of the
analyses. In addition, the district has high levels of poverty, malnutrition, and morbidity
rates especially among children and women.
Since 1961, Ijara has had at least 4 RVF outbreaks – these occurred in the years: 1961, 1962,
1997-98 and 2006-07. These outbreaks produce devastating effects on both public health
and animal production given that the native pastoral communities rely heavily on livestock
for their livelihoods. Preliminary results obtained from an analysis of historical data indicate
that RVF outbreaks are associated with excessive and persistent rainfall that lasts for a
period of at least 3 months. Participatory studies have shown that outbreaks cause
tremendous losses through livestock mortalities, abortions and trade embargoes. An
individual-based model developed as part of the HEALTHY FUTURES project’s activities track
RVF virus transmission dynamics between vectors and hosts and demonstrate that hosts’
herd immunity play a critical role in moderating the frequency of epidemics. The model also
provides a framework for testing alternative scenarios, for example, the effects of varying
relative proportions of livestock and other potential hosts on RVFV transmission. This is
critical for the evaluation of land use and biodiversity changes on the disease incidence and
hence the effectiveness of control measures.

HEALTHY FUTURES FP7:266327 – D 3.2 RVF/malaria study site analysis and major findings for RVF & malaria transmission
xi
The level of malaria transmission in the district is low and unstable because of the harsh
climatic conditions. The area is semi-arid with low rainfall density ranging between 200 to
1000 mm per year. Multiple intervention programs have also been implemented in the
district over the last 5 – 10 years. These interventions have had a substantial impact on the
risk of the disease. However, the disease still poses a risk to the local communities
particularly during the wet seasons. Long periods of underexposure, frequent droughts,
cross-border migrations that are common in the area, and use of counterfeit drugs, among
other factors are likely to increase the local community’s vulnerability to the disease
particularly if the on-going intervention programs are temporary halted or discontinued. An
analysis of hospital records obtained from the local health centres did not find any
association between climate variables – precipitation and temperature – probably because
of the effects of the on-going interventions.
More work is being done to generate decision support tools and risk maps for managing
these diseases. This report is intended to give initial findings. It is structured into four
chapters: Chapter 1 describes the location of the district and its physical features; Chapter 2
presents preliminary findings on RVF analyses; Chapter 3 presents results of a statistical
analysis of hospital records on malaria and Chapter 4 outlines some of the work that will be
done in the coming months.

HEALTHY FUTURES FP7:266327 – D 3.2 RVF/malaria study site analysis and major findings for RVF & malaria transmission
2
1 Ijara district – location and physical features
1.1 Position and size
Ijara is one of the six districts in Garissa County, north-eastern Kenya. The district lies
between 10 7`S and 20 3`S and 400 4`E and 410 32`E and borders Fafi district to the north,
Lamu to the south, Tana Delta to the southwest, Tana River to the west and Republic of
Somalia to the east. It covers an area of 9,642 km2 (GoK, 2009). Figure 2.1 shows the
location of the district in Kenya.
Figure 1.1. Location of Ijara district in Kenya.

HEALTHY FUTURES FP7:266327 – D 3.2 RVF/malaria study site analysis and major findings for RVF & malaria transmission
3
1.2 Administrative and political units
The district is subdivided into six administrative divisions namely: Masalani, Ijara, Sangailu,
Kotile, Korisa and Bodhai. The district has one constituency (i.e., Ijara), 11 electoral wards
and one local authority, Ijara County Council (GoK, 2009).
1.3 Ecological zone and topographic features
The district falls in V-VI agro-ecological zones (semi-arid and very arid respectively) with the
south-eastern part neighbouring the coastal strip falling in zone IV (semi-humid to semi-arid
zone). Approximately one quarter of the district on the eastern part is covered by the Boni
Forest. The forest is indigenous and constitutes the northern strip of the Zanzibar-
Inhambane coastal forest mosaic. Areas adjacent to the forest fall under the agricultural
Zone IV, which gradually changes to V and VI as one moves westwards. The forest is an
important resource for the local pastoralists since it is used as a dry season grazing site. The
vegetation in the other parts of the district comprises acacia shrubs, star and elephant
grasses, etc. (GoK, 2009).
The district generally has a flat topography interspersed with undulating plains. Its altitude
ranges between 0 and 90 meters above sea level. Most of the district has black cotton and
alluvial soils with small patches of sandy soils towards the coastal border. An analysis
conducted by the GIS Unit, ILRI, indicates that 56% of the district has haplic solonertz soil
type, while 23% and 18% has eutric planosols and eutric vertisols, respectively. These soils
have poor drainage properties and they form deep cracks when dry – they are, therefore,
not suitable for rain-fed agriculture. The Tana River that runs along the western boundary of
the district has a tremendous influence over the climate, settlement patterns, and economic
potential within the district for it forms the single most important source of water. Seasonal
rivers (laghas) that are found in most parts of the district provide water for both human and
livestock consumption during the wet season.
1.4 Climate
Temperatures range between 15 and 380C though they tend to remain high throughout the
year except in April – August due to the low altitude and semi-arid conditions. Rainfall is low
and bimodal and its density ranges between 200 mm to 1000 mm per annum. The two wet
periods in the year occur between March to May and October to December, with the
second period having higher rainfall densities than the former. Rainfall and temperature
patterns for the year 2011 measured at Garissa meteorological station, which represent
most of the north-eastern Kenya including Ijara district, are pre presented in Figure 2.2.

HEALTHY FUTURES FP7:266327 – D 3.2 RVF/malaria study site analysis and major findings for RVF & malaria transmission
4
0
5
10
15
20
25
30
35
40
0
20
40
60
80
100
120
140
160
Jan Feb Mar Apr May Jun Jul Aug Sep Oct Nov DecRain
Tmax
Tmin
Rai
nfa
ll (m
m)
Tem
per
atu
re (
°C)
Month
Figure 1.2. Total monthly rainfall and maximum (Tmax) and minimum (Tmin) temperatures
measured at Garissa meteorological station in 2011
1.5 Human population density and settlement patterns
The district is inhabited by the Somali pastoralists. They live in small families commonly in
trading centres or watering points. The average population density is 7 people per square
kilometre. The district’s headquarters (Masalani division) has the highest population density
of 13 persons per square kilometre. Factors influencing population distribution are
availability of pasture and watering points for livestock such as dams, wells, boreholes, and
reservoir tanks. Other factors include proximity to schools, health facilities and
administration and police posts as well as district, divisional, locational and sub-locational
headquarters wherein security is assured. These clustered settlement patterns contribute to
overgrazing around watering locations (GoK, 2009).
The housing and population census of 1999 indicated that the district had a human
population of 62,571. This was predicted to be 70,718 in 2008, including 37,136 (52.51%)
males and 33,582 (47.5%) females. At an annual growth rate of 3.5%, this population was
projected to rise to 73,767 people by 2012 (National Coordination Agency for Population
and Development, Ministry of Planning and National Development, 2005). Table 2.1
presents population projection by age groups.

HEALTHY FUTURES FP7:266327 – D 3.2 RVF/malaria study site analysis and major findings for RVF & malaria transmission
5
Table 1.1. Projected population distributions of Ijara district by age groups for the period: 2008-2012
1999 2008 2010 2012
M F T M F T M F T M F T
32,890 29,743 62,633 37,136 33,582 70,718 37,980 34,346 72,326 38,737 35,030 73,767
Source: National Coordination Agency for Population and Development, Ministry of Planning
and National Development, (2005).
The projected population figures given in Table 2.1 indicate an increasing trend over the
period. The number of males marginally exceeds the number of females. Ijara division has
the highest population, accounting for 32% of the total. Masalani division, in which the
district headquarters is located, has the second highest population and accounts for 25%.
The district has a population growth rate of 3.5% which is higher than the national average
of 2.9%. Similarly, the district’s mean fertility rate is 7 births per woman while the national
average is 4.9 (Central Bureau of Statistics (CBS), Ministry of Health (MOH), and ORC Macro,
2004). The district’s life expectancy for men is 60 years while that for women is 57 years.
The national average (for both men and women) is 46 years. Current estimate for the crude
death rate is 10 deaths per 1,000. Infant mortality rate averages 91 per 1,000 live births
while that for children under five years of age is 163 per 1,000 births.
Based on these statistics, it was predicted that the population of the district would increase
from 70,718 (level projected for 2008) to 73,767 by 2012. Given that 59% of the district’s
population living in absolute poverty, such an increase in population has negative impacts
on food security, water availability, provision of public health and other social services. Most
of the people depend on livestock. Agriculture (crop production) is another major economic
activity and is largely limited to the Tana basin and Bodhai division.
Overtime, the district has received local immigrants mainly from the Kamba community who
travel in search for blue-collar jobs in the district. It is also probable that citizens of the
Somali Republic who have relatives in the district could have immigrated to the district
when that country was being ruled by insurgents.
1.6 Agriculture
Ijara district has 100,000 ha of arable land of which only 1% is currently under crop
production. Over 90% of land is either trust land or government land that is used by the
local communities for pastoralism. The carrying capacity of the land is 15.5 total livestock
units/ha and the proportion of the population working in the livestock sector is 95%.
However, the potential for crop production is immerse with some isolated farms producing
for the export market. Table 2.2 presents the current livestock species in Ijara and their

HEALTHY FUTURES FP7:266327 – D 3.2 RVF/malaria study site analysis and major findings for RVF & malaria transmission
6
population sizes while Table 2.3 presents quantities of products produced and their market
values.
Table 1.2. Types of livestock species kept in Ijara and their respective population sizes
Livestock species Population
Cattle 35, 2617
Sheep 323, 676
Goats 348, 648
Camels 1, 740
Donkeys 8, 096
Pigs 1, 009
Indigenous Chicken 25, 439
Commercial Chicken 3, 279
Bee Apiaries 20
Bee Hives 422
Source: Kenya National Bureau of Statistics, 2009 (http://www.knbs.or.ke/censuspopulation.php)
Table 1.3. Quantities of products generated from livestock in Ijara district in 2008 and their market values in Kenya shillings
Product Description Units Value (KSh)
Milk Annual milk production (litres) 13,398,236 401,947,080
Beef Annual beef production (kgs) 3,201 624,000
Mutton Annual mutton production (kgs) 193,390 38,678,000
Goat meat Annual goat meat production (kgs) 209,202 41,840,400
Eggs Annual egg production (trays) 600 180,000
Poultry meat Annual poultry meat production (kgs) 1,000 300,000
Honey Annual mutton production (kgs) 4,260 1,065,000
Source: Kenya National Bureau of Statistics, 2009 (http://www.knbs.or.ke/censuspopulation.php)
1.6.1 Wildlife resources and forestry
Ijara has three national reserves and one community conservancy. Wildlife species present
in the district include the rare Hirola antelope, lions, elephants, buffaloes, monkeys, hippos,
crocodiles, guinea fowls, giraffes, ostriches, leopards, hyenas, warthogs, zebra, cheetahs,
snakes, deer and varieties of birds. There is one non-gazetted forest. Poaching control
measures incorporate routine patrols and participatory wildlife management.

HEALTHY FUTURES FP7:266327 – D 3.2 RVF/malaria study site analysis and major findings for RVF & malaria transmission
7
2 Rift Valley Fever
2.1 Background
RVF is a viral zoonosis that mainly affects sheep, goats, cattle and camels. The disease was
first reported in livestock in Kenya around 1915 but it was not until 1931 when the RVF virus
(RVFV) was identified in response to an abortion storm in sheep the Rift Valley, Kenya
following prolonged heavy rainfall (Daubney et al. 1931). Humans become infected after
either a bite of an infected mosquito or by intensive contact with acutely infected animals or
by handling infected tissues. In man, the disease manifests either as a mild influenza-like
syndrome in a majority of cases (> 80 per cent) or as a severe disease with haemorrhagic
fever, encephalitis, or retinitis (Soumare et al., 2012). In Kenya, RVF outbreaks have
previously occurred in 1931, 1951/53, 1961/63, 1967/68, 1977/79, and most recently during
1997/98 and 2006/07 with unusually high human morbidity (between 600 – 700 cases) and
mortality (case fatality rate of 23%) (Anyamba et al., 2009).
The recent outbreak (observed between 4th December 2006 and 21st June 2007) affected a
total of 35 districts in Kenya including Ijara district. The outbreak was preceded by
excessively high rainfall and flooding. A total of 717 human and 8,252 animal cases were
reported though only 216 human and 448 animal cases were confirmed through laboratory
diagnosis. A high percentage (85%) of human cases occurred in four districts namely: Garissa
and Ijara districts in the north-eastern Kenya, Baringo district in the Rift Valley and Kilifi
district in the coast. In Ijara, an extensive serological survey showed that buffaloes,
warthogs and waterbucks had RVFV-neutralizing antibodies, suggesting that these animals
were exposed to the virus during the outbreak (Evans et al., 2008). The district also had RVF
outbreaks in 1961/1962 and 1997/1998 (Woods et al., 2002; Murithi et al., 2011).
A number of analytical studies have been implemented in the district to identify risk factors
for the disease. LaBeaud et al., (2008) determined environmental risk factors and long-term
sequelae of human RVF in Gumarey (village) and Sogan-Godud (urban) areas before the
2006/2007 outbreak. Thirteen per cent of the 248 residents examined were positive for
RVFV antibodies based on immunoglobulin G (IgG) ELISA. This prevalence was higher among
older persons, males, individuals who lived in the village (Gumarey), and those who had
been involved in the disposal aborted foetuses. Seropositive persons were also more likely
to have visual impairment and retinal lesions compared to those that had not been exposed
to the virus. LaBeaud et al. (2011b) further examined 92 randomly selected individuals after
the 2006/2007 outbreak from the same sites. The results showed significant variability in
RVFV exposure in two neighbouring villages that had similar climate, terrain, and vector
density. Individuals that had had a previous exposure (before 2006) had IgG titre
concentration of 1:40 for more than 3 years. Twenty seven out of the 92 newly recruited
individuals (29%, 95% CI: 20%–39%) were seropositive. Factors associated with
seropositivity included living in the rural areas and consumption of raw milk. Entomological

HEALTHY FUTURES FP7:266327 – D 3.2 RVF/malaria study site analysis and major findings for RVF & malaria transmission
8
assessments were also done at the same time; these indicated that Culex spp. constituted
75% of the mosquito vectors trapped and laboratory tests revealed that 22% of the 105
pools tested were positive for RVFV, 18% were positive for West Nile virus while 3% were
positive for both viruses (LaBeaud et al., 2011a).
Hightower et al. (2012) estimated RVF incidence as a function of geological, geographic, and
climatological factors during the 2006/2007 outbreak in the north-eastern Kenya (including
Ijara district), Baringo and Kilifi districts. They established that locations with subtypes of
solonetz, calcisols, solonchaks and planosols soil types, increased rainfall and higher
normalised difference vegetation indices (NDVI) before the outbreak were associated with
increased risk of RVF. It has not been established why the soil types mentioned above are
associated with RVF outbreaks but we hypothesize that their low infiltration rates make
them to be more prone to flooding than other soil types. They might also retain moisture for
an appreciable length of time, therefore allowing infected eggs of floodwater Aedes
mosquitoes to survive for long. Other risk factors that were identified by Hightower et al.
(2012) include low elevation, plains and densely bushed areas. A more recent analysis of
historical data on RVF epizootics corroborate these findings and shows that high and
persistent precipitation over a period of 3 months and low altitude is associated with the
incidence of the disease while the presence of soil sub-types solonetz and luvisols in an area
leads to persistence of outbreaks for a period of at least 3 months (Bett et al., 2012).
Following the 2006/2007 outbreak, ILRI in partnership with the Department of Veterinary
Services (DVS) implemented studies in Garissa and Ijara districts to assess the impact of the
outbreak and identify ways of improving the prediction, detection, and response to RVF
(ILRI, 2007). The study found out that the severity of the epidemic particularly in the north-
eastern Kenya was exasperated by delays in recognizing risk factors and in taking decisions
to prevent and control the disease. The study found out that epidemics of RVF can most
effectively be prevented and controlled through the active monitoring of key risk factors
leading to timely decision making and the targeting of prevention and control resources.
The new transmission studies being done under the HEALTHY FUTURES project build on the
work that has been done to further investigate the disease transmission dynamics. They
utilize a mechanistic model that simulates the disease transmission dynamics as an
analytical framework which specifies the type of data or information required for a holistic
assessment of the disease system.
2.2 Methodology 2.2.1 Analytical framework
RVFV transmission mechanisms are poorly understood partly they involve complex
interactions between multiple agents (a wide range of vector and host species) and drivers
that operate at local (e.g. socio-economic practices and land use) and regional levels

HEALTHY FUTURES FP7:266327 – D 3.2 RVF/malaria study site analysis and major findings for RVF & malaria transmission
9
(including climate change). In the Horn of Africa, RVF epidemics occur periodically following
periods of prolonged heavy rainfall. It is believed that the virus persists during the inter-
epidemic periods in drought resistant floodwater Aedes eggs. It is also thought that riverine
vegetation, moist bushed and wooded grasslands and forests can support endemic
transmission of the virus probably because these areas always have high population
densities of mosquito vectors and potential reservoir hosts.
This study utilizes an individual based RVF model (IBM) as a framework for studying these
transmission dynamics. The study area, as described above, is inhabited by transhumant
pastoralists whose movements (to and from wet and dry grazing areas) could be important
for RVFV maintenance and transmission. Individual based models (IBMs) are suitable for
studying such complex non-linear systems where space is crucial and agents’ positions are
not fixed. They are also useful for simulating agents’ behaviours especially if they are
expected to change over time as they adapt based on acquired knowledge or in response to
new challenges.
The model is currently being used to determine types of studies that should be
implemented to obtain input parameters. Scenario analyses are also being implemented to
generate hypotheses on RVFV transmission mechanisms. The structure of the model is
described below.
2.2.2 RVFV transmission model
The key components of the model include: (i) the environment or landscape, (ii) agents, and
(iii) processes describing interactions in time and space.
2.2.2.1 The environment
The model simulates livestock and vector population dynamics and RVF transmission in a
spatially-explicit environment that is subdivided into 100 x 100 grids of square cells
measuring 500 x 500 m. This framework allows for the incorporation of spatial
heterogeneities in the model such as the locations of the grazing sites by season and vector
breeding sites. A reliable estimate of the carrying capacity of the area has not been
obtained. For the purposes of this analysis, it is assumed that the current cattle and sheep
populations of 300,000 and 600,000, respectively, (Department of Veterinary Services,
unpublished data) represent equilibrium populations of these livestock species. Sensitivity
analyses are, however, being conducted to determine the effects of varying the equilibrium
population sizes on epidemic patterns.
Vector breeding sites (dambos) are randomly distributed within the grid. The number used
at the model initialization stage is given in Table 3.1.

HEALTHY FUTURES FP7:266327 – D 3.2 RVF/malaria study site analysis and major findings for RVF & malaria transmission
10
2.2.2.2 Agents
Two host species, namely cattle and sheep are used as agents in the model. Their attributes
include species (cattle or sheep), age (neonate, weaner, yearling or adult), sex (male or
female), infection status (susceptible, exposed, infectious or removed/resistant), time since
infection and physical location. Animals are also aggregated to form herds or flocks. The
numbers of herds, flocks and individuals generated at the model initialization stage are
given in Table 3.1.
2.2.2.3 Dynamic processes
Dynamic processes that drive the model operations are classified into three, these are:
i. Mosquito population dynamics,
ii. Host population and movement dynamics, and
iii. RVFV transmission dynamics.
All of these processes are updated on daily basis.
Table 2.1. Parameters used to initialize the RVFV transmission model
Model component Value Description a
Host Cattle 100 Number of herds created in the model
30 Number of cattle randomly assigned to each herd; their ages in days are randomly allocated from 1 to 3,650 days (10 years)
0.3 Probability of being male
Sheep 100 Number of flocks created in the model
60 Number of sheep randomly assigned to each flock; their ages in days are randomly allocated from 1 to 1,825 days (5 years)
0.4 Probability of being male
Vector breeding sites (dambos)
Aedes spp 250 Number of Aedes spp breeding sites
Culex spp 1000 Number of Culex spp breeding sites
Vectors Aedes spp 2500 Number of RVFV uninfected eggs
250 Number of RVFV infected eggs
Culex spp 100 Number of eggs a These parameters are subjective; however, sensitivity analyses are being conducted to gauge their impacts on epidemic patterns
Mosquito population dynamics
The model considers two RVFV vectors, namely Aedes mcintoshi (indicated throughout this
report as Aedes spp.), as the primary vector, and Culex spp., to represent all the possible
secondary vectors. Their population dynamics are simulated using a stage-structured
transition matrix model described by Yussof et al. (2012) based on the parameters used are
presented in Table 3.2. This model illustrated in Figure 3.1. Each vector has four life stages,
i.e., eggs, larvae, pupae and adult. Each stage has corresponding probability of surviving and

HEALTHY FUTURES FP7:266327 – D 3.2 RVF/malaria study site analysis and major findings for RVF & malaria transmission
11
staying in stage i, denoted by iP , and the probability of surviving and growing from stage i to
stage i+1, denoted by iG .
A list of these development and survival probabilities constitute a transition matrix A and
the population of a given stage at time t, X(t), is obtained by multiplying the transition
matrix with X(t-1), the population of each life stage at time t-1.
iP and iG were computed as described by Yussof et al. (2012) based on iS , the survival rate
for stage i, and id the duration in that stage i, as follows:
i
i
d
i
i
d
ii
S
SSG
1
)1( (Eq. 1)
and i
i
d
i
d
iii
S
SSP
1
)1( (Eq 2)
Climate variables: temperature, precipitation and humidity influence the development rates
of most vectors including mosquitoes. At the moment though, only daily rainfall densities
obtained from Tropical Rainfall Measuring Mission (TRMM) are used to estimate the
development and survival probabilities. Work is underway to include temperature estimates
to these functions.
For Aedes spp., simulation starts with the hatching of eggs in inundated soils. During dry
periods, eggs of Aedes spp that are dormant in dried up soils are assumed to suffer a low
baseline mortality rate of μAe. When conditions that favour hatching are provided (i.e.,
flooding that persists for at least 2-3 days), hatching occurs at the rate, HA. Hatching rate is
made to depend on the amount of flooding, therefore extensive floods leads to the hatching
of a higher proportion of dormant eggs.
Larvae develop into pupae after PA days while pupae emerge as adults after EA days. Larvae,
pupae and adults have baseline mortality rates of μAl, μAp and μAa, respectively. Females seek
a blood meal every GA days. Following a successful feeding, these mosquitoes lay eggs on
moist soil at the edge of the flooded areas. Aedes spp are assumed to lay SA eggs per batch;
all the eggs laid by infected Aedes spp are assumed infected trans-ovarially. RVFV is thought
to be transmitted transovarially by floodwater Aedes mosquitoes (EFSA, 2005). Mosquitoes
that emerge from the infected eggs develop into infectious vectors. It is assumed the
development rates of the immatures, and feeding frequencies and baseline mortality rates
for the mature stages are not influenced by RVFV infection. In addition, the model does not
as yet allow for the variation in the duration of the gonotrophic cycle, or the number of eggs
laid per batch, with an increase in the age of the vector.

HEALTHY FUTURES FP7:266327 – D 3.2 RVF/malaria study site analysis and major findings for RVF & malaria transmission
12
Culex spp lay eggs on fresh or existing pools of water; these eggs cannot withstand
desiccation, therefore they don’t remain dormant in the soils like those of the Aedes
mcinthoshi. The development processes from eggs to adults are similar to those described
for Aedes spp. There is however no transovarial transmission of RVFV in Culex spp or in any
other secondary vectors.
Persistent rainfall and flooding provide extensive breeding surfaces especially for Culex
mosquitoes. Linthicum et al. (1983) indicates that flooding that persist for at least 4-6 weeks
allows for the development of massive swarms of secondary mosquitoes which amplify the
transmission of RVF when cattle, goats and sheep are present. Similarly, a participatory
survey that was carried out in Ijara in following the 2006-2007 RVF outbreak established
that the mean interval in days between the start of heavy rains and appearance of mosquito
swarms was 23.6 days (Jost et al., 2010). To mimic these dynamics, the number of Culex
mosquitoes obtained from the matrix model is amplified based on a by 23-day cumulative
rainfall. The cumulative rainfall is also used to control the hatching of infected Aedes spp.
eggs that remained dormant in the soils during the dry and low rainfall periods.
Model runs generated for this analysis focussed on the period January 1, 2005 to July 23,
2010 so as to capture the recent RVF outbreak that occurred in the district between October
2006 and February 2007.
Figure 2.1. Flow diagram outlining vectors’ development stages captured in the vector sub-model

HEALTHY FUTURES FP7:266327 – D 3.2 RVF/malaria study site analysis and major findings for RVF & malaria transmission
13
2.2.2.4 Host population and movement dynamics
The number of herds and flocks used to initialize the model are given in Table 3.1. These
populations represent 1% of the assumed equilibrium population of cattle and goats in the
area.
A new host is allowed to enter the system through births or purchase while exits occur
through mortality, RVFV-associated mortality (case fatality) or through sale; the parameters
used to run these simulations are given in Table 3.3. Mature females breed for the first time
at ages BRC and BRS for cattle and sheep, respectively. The probability of a female giving
birth at the end of the gestation period (taken to be 9 months for cattle and 5 months for
sheep) depends on
i. conception probability: CeS in sheep and CeC in cattle
ii. abortion probability, classified into baseline abortion probability (AbC in cattle and
AbS in sheep) and RVF-associated abortion only for RVFV infected animals (AbCRVF
and AbSRVF, respectively).
After parturition, cattle and sheep will undergo a waiting period of 180 and 60 days
respectively before it can start breeding again.
Hosts move between wet and dry grazing sites depending on season. In the current model,
host movements are driven by cumulative daily rainfall. Livestock are confined to the wet
season grazing areas when the cumulative (TRMM) rainfall over a period of 21 days is >100
mm/month. Below this threshold, livestock are transferred to a dry season grazing area.
Movement ranges within each site are outlined in Table 3.3.
2.2.2.5 RVF virus transmission dynamics
The probability that a given host gets exposed to RVFV depends on its level of interaction
with infectious vectors present in the area. Given that a host can get infection either from
either of the vectors used in the model (Aedes spp and/or Culex spp), the model simulates
infection processes for each vector independently and then aggregates them to obtain a
composite transmission coefficient, hi for each host. Parameters that are multiplied to
obtain the transmission coefficient for a given vector include:
(i) The ratio of the population of the vector species to that of a specified host species,
(ii) The vector’s biting rate,
(iii) The probability that the vector feeds on the host depending on the blood meal
index,
(iv) The probability that the host gets infected following a bite by an infectious
mosquito;

HEALTHY FUTURES FP7:266327 – D 3.2 RVF/malaria study site analysis and major findings for RVF & malaria transmission
14
(v) The prevalence of RVFV infection in the vector,
The composite transmission coefficient ( hi ) is transformed into host’s infection probability
( hip ) using the formula:
)exp(1 hihip (Eq. 4)
A host’s status changes to exposed following exposure to RVFV infection. It remains in this
state for LC (cattle) or LS (sheep) days after which it becomes infectious. The infectious state
lasts for iC (cattle) or iS (sheep) after which a host moves to immuned/removed state. It is
assumed that following recovery, a host remains immuned for the remainder of its life.
Table 3.3 outlines the parameters used to simulate RVFV transmission in the host while
Figure 3.2 represents host’s infection stages. Where possible, the model picks an input
parameter for simulating state transitions from a continuous uniform distribution bounded
by minimum and maximum values.
A compartmental SIR model is used to simulate RVFV infections in mosquitoes. Susceptible
vectors can pick RVFV infection either from infectious cattle or sheep. The transmission
coefficient for vector i is estimated by first simulating the interactions between that vector
and host species i, followed by aggregating the estimates for all the species that each vector
would feed on. Parameters used to estimate this coefficient include:
i. vector biting rates
ii. blood meal index (indicating the proportion of meals obtained by vector i on host j.
iii. the probability that the vector will get infected from an infected blood meal
iv. the prevalence of RVFV infection in host i.
Following exposure, susceptible mosquitoes will join exposed category for LAe days (Aedes
spp) or LCu days (Culex sp). They will become infectious at the end of that period. It is
assumed that an infectious vector remains at this state for its remaining lifetime. Most of
the input parameters for this work have been obtained from the literature.

HEALTHY FUTURES FP7:266327 – D 3.2 RVF/malaria study site analysis and major findings for RVF & malaria transmission
15
Table 2.2. Parameters used to simulate population dynamics and RVFV transmission in the vectors
Parameter Symbol Value and units
Comment Source
Aedes spp
Average length of time the mosquito can live (lifespan) AA 14-30 days Estimate for Aedes aegypti Gaff et al., 2007
Gonotrophic cycle GA 3 days Neto and Navarro-Silva, 2004; Pant and Yasuno, 1973
Number of eggs laid per batch SA 63 Estimate for Aedes aegypti Otero et al., 2006
Egg development rate HA 0.25 - 0.33 Estimate for Ae. vexans arabiensis Ndiaye et al., 2006; Clements and Paterson, 1981
Larvae development rate PA 0.18 Rueda et al., 1990
Pupae development rate EA 0.92 Rueda et al., 1990
Proportion of blood meals from cattle aAc 0.0001 Subjective estimate Not available in literature but values that mimic expected incidence levels in respective hosts are used
Proportion of blood meals from sheep aAs 0.0001 Subjective estimate Not available in literature but values that mimic expected incidence levels in respective hosts are used
Egg mortality probability μAe 9.1*10-5 Subjective estimate Not available in literature but low estimate used to ensure persistence over time
Larvae mortality probability μAl 0.2 For Aedes aegypti; temperature dependent
Yusoff et al, 2012; Otero et al, 2006
Pupae mortality probability μAp 0.1 For Aedes aegypti; temperature dependent
Yusoff et al, 2012; Otero et al, 2006
Adult mortality probability μAa 0.1 Estimate for Aedes aegypti McDonald, 1977
Probability of infection following ingestion of infected blood meal in susceptible mosquitoes
bAe 0.38 – 0.86 Estimate for Aedes notoscriptus Turell and Kay, 1998
Culex spp
Average length of time the mosquito can live AC 21 - 30 days http://www.mosquitoes.org/downloads/life-cycle.pdf (Accessed 5/11/12)
Gonotrophic cycle GC 3 days Elizondo-Quiroga et al., 2006
No of eggs laid per bacth SC 240 Estimate for Culex pipiens http://www.mosquitoes.org/downloads/life-cycle.pdf (Accesed on 5/11/12), http://www.metapathogen.com/mosquito/culex/ (Accessed 19/12/12)
Larvae development rate PC 0.1 Rueda et al., 1990
Pupae development rate EC 0.2 Rueda et al., 1990
Proportion of blood meals from cattle aCc 0.25 Subjective estimate No estimate found in literature; Culex spp are nocturnal and so would access livestock in the sheds in the night
Proportion of blood meals from sheep aCs 0.25 Subjective estimate
Egg mortality probability μCe 0.1
Larvae mortality probability μCl 0.2 Rueda et al., 1990
Pupa mortality probability μCp 0.1 Rueda et al., 1990
Adult mortality probability μCa 0.1 Estimate for Culex pipiens Jones et al., 2012; Reisen et al., 1991
Probability of infection following ingestion of infected blood meal bCu 0.3 - 0.89 Estimates for Culex annulirostris, Culex zombaensis
Turell and Kay, 1998

HEALTHY FUTURES FP7:266327 – D 3.2 RVF/malaria study site analysis and major findings for RVF & malaria transmission
16
Table 2.3. Parameters used to simulate livestock population dynamics in the RVFV transmission model
Parameter Symbol Value and unit Comments Source
Maximum population of livestock that Ijara can sustain indefinitely (Carrying capacity) K 15.5 TLU/ha Ijara district development plan, 2008-2012
Cattle: movement ranges and demographic parameters
Daily movement range in wet/dry season MoveC 11/13 km Ijara district development plan, 2008-2012
Average length of time a bull/cow is retained in a herd AC 1-12/7-12 years Ijara participatory survey, 2012
Proportion of cattle that successfully conceive after a natural service CeC 0.8 Median estimate Ijara participatory survey, 2012
Proportion of abortions that are expected to occur over a gestation period (baseline) AbC 0.176 Median value for wet and dry seasons, respectively
Jost et al 2010; Ijara participatory survey, 2012
Proportion of animals that abort due to RVFV infection during an outbreak period AbCRVF 0.471 Jost et al., 2010
Probability of an animal being introduced into a herd EnC 0.003 Ijara participatory survey, 2012
Daily baseline mortality rate (bull/cow) mC 2.3*10-3 to 2.7*10-3
2.3 *10-4 to 3.9*10-4 Estimated as an inverse of the lifespan Ijara participatory survey, 2012
Probability that an animal is removed from a herd in the wet season ClCwet 1.4*10-4 to 1.4*10-3 Estimates include animals sold or slaughtered Ijara participatory survey, 2012
Probability that an animal is removed from a herd in the dry season ClCdry 3.3*10-4 to 1.5*10-3 Estimates include animals sold or slaughtered Ijara participatory survey, 2012
Sheep: movement ranges and demographic parameters
Daily movement range in wet/dry seasons MoveS 4.5km Ijara participatory survey, 2012
Average duration that a male/female is retained in a flock AS 1-3/4-8 years Ijara participatory survey, 2012
Proportion of sheep that successfully conceive after a natural service CeS 0.9 Ijara participatory survey, 2012
Proportion of abortions that are expected to occur over a gestation period AbS 0.2 Medians for wet and dry seasons Ijara participatory survey, 2012
Proportion of animals that abort due to RVFV infection during an outbreak period AbSRVF 0.9 Ijara participatory survey, 2012
Probability of an animal being introduced into a herd EnS 0 - 0088 Ijara participatory survey, 2012
Baseline mortality (ram/ewe) mS 4.6*10-3 to 2.7*10-3 3.4*10-4 to 6.8*10-4
Estimated as an inverse of the lifespan Ijara participatory survey, 2012
Probability that an animal is removed from a herd in the wet season ClSwet 3.3*10-4 to 2.2*10-3
Estimates include animals sold or slaughtered Ijara participatory survey, 2012
Probability that an animal is removed from a herd in the dry season ClSdry 3.7*10-4 to 3.3*10-3
Estimates include animals sold or slaughtered Ijara participatory survey, 2012

HEALTHY FUTURES FP7:266327 – D 3.2 RVF/malaria study site analysis and major findings for RVF & malaria transmission
17
Table 2.4. RVFV transmission parameters in the hosts
Parameter Symbol Value and unit Comments Source
Cattle
Probability of infection in neonates following a bite from an infected mosquito bNC 0.9 Subjective estimate
Gestimate; sensitivity analysis to be done
Probability of infection in weaners following a bite from an infected mosquito bWC 0.7 Subjective estimate
Gestimate; sensitivity analysis to be done
Probability of infection in yearlings following a bite from an infected mosquito bYC 0.6 Subjective estimate
Gestimate; sensitivity analysis to be done
Probability of infection in adults following a bite from an infected mosquito bAC 0.5 Subjective estimate
Gestimate; sensitivity analysis to be done
Latent period Interval between exposure to RVFV to occurrence of clinical signs LC 1-6 days Niu et al., 2012; Gaff et al., 2007
Infectious period - time period over which infected cattle can transmit RVFV iC 2-7 days Pepin et al., 2010; McIntosh et al., 1973
Case fatality-neonates mNCRVF 0.1 - 0.7 Gaff et al., 2007; Burnham and Musser, 2006
Case fatality rates - weaners mWCRVF 0.1 – 0.7 Gaff et al., 2007; Burnham and Musser, 2006
Case fatality rates - yearlings mYCRVF 0.05 Gaff et al., 2007; Burnham and Musser, 2006
Case fatality rates - adults mACRVF 0.05 Gaff et al., 2007; Burnham and Musser, 2006
Immunity period- time period when an animal is resistant to RVFV infection rC - Life long
Sheep
Probability of infection in neonates following a bite from an infected mosquito bNeonS 0.9 Subjective estimate
Gestimate; sensitivity analysis to be done
Probability of infection in weaners following a bite from an infected mosquito bWeanS 0.9 Subjective estimate
Gestimate; sensitivity analysis to be done
Probability of infection in yearlings following a bite from an infected mosquito bYearS 0.8 Subjective estimate
Gestimate; sensitivity analysis to be done
Probability of infection in adults following a bite from an infected mosquito bAdultS 0.7 Subjective estimate
Gestimate; sensitivity analysis to be done
Latent period - Interval between exposure to RVFV to occurrence of clinical signs LS 1-6 days Niu et al., 2012; Gaff et al., 2007
Infectious period - time period over which infected sheep can transmit RVFV iS 2-7 days Pepin et al., 2010; McIntosh et al., 1973
Case fatality rates-neonates mNSRVF 0.9 Gaff et al., 2007; Burnham and Musser, 2006
Case fatality rates- weaners mWSRVF 0.8 Gaff et al., 2007; Burnham and Musser, 2006
Case fatality rates- yearlings mYSRVF 0.3 Gaff et al., 2007; Burnham and Musser, 2006
Case fatality rates- adults mASRVF 0.1 Gaff et al., 2007; Burnham and Musser, 2006
Immunity period- time period when an animal is resistant to RVFV infection rS - Life long

HEALTHY FUTURES FP7:266327 – D 3.2 RVF/malaria study site analysis and major findings for RVF & malaria transmission
18
Figure 2.2. Flow diagram outlining hosts’ infection stages
2.2.2.6 Model validation
Given the multiple and complex interactions that the model is structured to simulate; it will
not be possible to use traditional methods of validation, e.g. fitting the model empirical
data. In addition, there is scanty data on temporal-spatial distribution of RVF incidence –
most of the available records have been collected during epidemics. Attempts have been
made, therefore, to test the model using pattern oriented modelling approaches. This is an
attempt to establish whether the model mimics RVF occurrences at different scales and
ecologies other than that used to build the model. In this analysis, Arusha region of
Tanzania that officially reported the 2007 RVF outbreak in February 12, 2007 was used. Daily
TRMM rainfall data for the area were obtained and used to drive the model. Temporal
patterns of the RVF outbreak were then analysed against those observed in Ijara.
In future, model validation will include testing various parameterizations of the input
parameter values to determine how well they simulate observed patterns.

HEALTHY FUTURES FP7:266327 – D 3.2 RVF/malaria study site analysis and major findings for RVF & malaria transmission
19
2.2.3 Empirical Studies Three main studies have been done to generate additional information for RVFV modelling;
these include:
1. Statistical analyses of historical data on RVF outbreaks in Ijara district to determine
the correlation between climate variables (temperature and rainfall) and the
outbreaks,
2. Participatory epidemiological surveys to determine types of livestock species kept
and their proportions, livestock demographic parameters, and movement patterns,
3. Entomological and epidemiological surveys to determine the risk of RVFV infection in
livestock
2.2.3.1 Analysis of historical data on RVF outbreaks
Annual records on RVF epizootics in Kenya dating back to 1979 were obtained from CDC
Kenya. RVF epizootics included outbreaks associated with stormy abortions in livestock
especially small ruminants and hemorrhagic syndrome that occurred after prolonged
periods of heavy rainfall, and were confirmed using laboratory tests [ELISA] or reverse
transcriptase polymerase chain reaction [PCR]). Outbreaks were recorded by year, province,
district and area. For the purpose of this analysis, the data were restructured by: (i)
classifying the areas affected by divisions defined during the 1999 human population census
(n = 505), and (ii) refining the time component of the outbreaks from an annual to monthly
time scale. The refinements were made with reference to records kept at the Department of
Veterinary Services.
Gridded climate data comprising monthly mean precipitation, maximum and minimum
temperatures for the period January 1979 to December 2010 were obtained from the
European Centre for Medium-Range Weather Forecasts (ECMWF). The data merged with
the disease data and kept in a database designed using MS Access database. They were
subsequently exported to STATA/SE 11.1 for statistical analysis. A division was used as the
unit of analysis. The outcome ( ijy ) represented the infection status (Yes/No) of a division in
a given month, therefore it was analyzed as a dichotomous outcome with a binomial
distribution, i.e., ),1( ijijij Binomialy .
Univariate logistic regression models were used to assess the association between the
climate variables: precipitation and temperature and RVF outbreaks. Alternative forms of
the climate variables were tested; precipitation, for instance, had 7 alternative formulations
including:

HEALTHY FUTURES FP7:266327 – D 3.2 RVF/malaria study site analysis and major findings for RVF & malaria transmission
20
- monthly values,
- lagged values by 1 and 2 months,
- running cumulative values for the recent 2 and 3 months,
- running mean values for the recent 2 and 3 months.
Maximum and minimum temperatures and NDVI values were used in the analyses as well
and competing models compared based on the log likelihood values.
The choice of the variables and the lags tested was based on the studies that have been
done by Anyamba et al. (2009) which indicates that rainfall, NDVI, sea surface temperatures
and outgoing long wave radiation are good predictors for RVF, with NDVI representing
ecological variables. Anyamba et al. (2012) also suggested that cumulative rainfall anomaly
for 3-4 months immediately preceding an outbreak is critical for RVF outbreaks in East
Africa. Temperature does not change much in the area, so lagging was not considered for
this variable.
Random effects logistic regression models were also fitted to the data to account for
clustering of observations in time (due to repeated observations by division). One model
had precipitation (3-month aggregate) and minimum temperature as predictors while the
other had precipitation as the only predictor. In both models, division was treated as a
random effects variable and the correlation structure (for observations within a division)
were assumed to be unstructured. The structure of the model used was as follows:
jijij
jijij
jijijuxx
uxyp
uxyp
210
),0(
),1(ln (Eq. 5)
With ),0( 2Nu j ; i = 1 …1185; j = 1…6.
Given that the analyses presented in this report were limited to the data from Ijara district,
it was not possible to include the other potential predictor variables such as elevation, soil
types, land use given that most of their values would be similar.
2.2.3.2 Community-based participatory research survey
Identification and mapping of the survey sites
Participatory surveys were held between August and November 2012 to collect information
on livestock demographics and movement patterns. A sub-location, the smallest
administrative area with a human population of 4,000 – 5,000 was used as the sampling
unit. A total of 27 units were selected using stratified random sampling technique from a
sampling frame that comprised 40 sub-locations. A division was used as a stratifying

HEALTHY FUTURES FP7:266327 – D 3.2 RVF/malaria study site analysis and major findings for RVF & malaria transmission
21
variable; the total number of sub-locations per division and the number that were selected
are outlined in Table 3.5.
Table 2.5. Total number of and selected sub-locations by division in Ijara District
Division Total number of sub-locations Number of selected sub-locations
Sangailu 8 4
Ijara 10 7
Masalani 13 11
Korisa 2 1
Kotile 5 3
Bodhai 2 1
One site within a sub-location was purposefully selected for an interview. A site was
selected if it had a majority of the families clustered in a small area. Each meeting
comprised at least 10 participants and it involved the local pastoralists and community
leaders. These meetings were convened with the help of the community animal health
workers and the local administrator, which in most cases was the Chief of the area. The
meeting sites were geo-referenced after the interview using the Arc 1960 Geographic
Coordinate System. Figure 3.3 shows the distribution of these sites within the district.
Data collection checklist
Semi-structured interviews were carried out using the local Somali language with the help of
a translator -- each session took about 1 hour. The interviews were guided by a checklist of
open-ended questions. Probing was also done to investigate other relevant issues that
emerged from these discussions. The main items that the checklist covered include:
1. Livestock (cattle, sheep and goats) population dynamics:
a. Types of livestock species kept and their relative population proportions
b. Age at first breeding, by season
c. Interval between parturition and subsequent heat, by season
d. Frequency of repeat breeding
e. Frequency of twinning
f. Frequency of abortions, by season
g. Classification of age categories and identification of age ranges in each
category
h. Maximum age attained in both sexes (lifespan)
i. Expected mortality for each age category, by season
j. Frequency of sales and slaughter, by season

HEALTHY FUTURES FP7:266327 – D 3.2 RVF/malaria study site analysis and major findings for RVF & malaria transmission
22
2. Movement patterns – using participatory mapping and timelines to determine
livestock movement patterns
Figure 2.3. Map of Ijara District showing the locations of villages that were surveyed in the study. The inset is a ma of Kenya showing the location of Ijara district.
Participatory epidemiological techniques
Participatory epidemiological (PE) techniques used in the surveys include semi-structured
interviews, proportional piling and participatory mapping. These techniques have been
described by Cleaveland et al. (2001), Catley and Mariner (2002) and used in several studies
including Bedelian et al. (2007) and Bett et al. (2009). Table 3.6 outlines the specific
information gathered using each of these methods.

HEALTHY FUTURES FP7:266327 – D 3.2 RVF/malaria study site analysis and major findings for RVF & malaria transmission
23
Table 2.6. A summary of the type of information collected using each of the three PE techniques during participatory surveys conducted in Ijara District, August-November 2012
Participatory technique Information gathered
Semi-structured interviews Types of livestock species kept per sub-location
Age at first breeding
Interval between parturition and subsequent heat
Frequency of repeat breeding
Frequency of twinning
Classification of age categories
Determining the age ranges in each category
Lifespan, by sex
Proportional piling Relative abundance of livestock species
Proportion of pregnancies carried to term (% of abortions)
Mortality and case fatalities by age group and season
Proportion of animals sold and slaughtered by season
Participatory mapping Location of settlements and seasonal grazing sites
Timeline Livestock movement patterns between July 2011 and July
2012
Proportional piling
Proportional piling is a scoring technique used to determine perceptions on the relative
importance, abundance or frequency of a list of items. It uses a set of counters (e.g. beans,
pebbles, etc.) that are piled against a given item and then counted to determine relative
percentages or proportions. This survey used a total of 100 beans for all the exercises
conducted.
To determine the relative proportions of livestock species kept, participants were first asked
to list the type of livestock species commonly kept in their area. The responses given (e.g.,
cattle, sheep, goats, chickens) were listed on a flip chart. The participants were then given
100 beans to distribute to the listed items (species) based on the relative abundance of the
livestock species assuming that 100 beans represented the population of livestock in the
area. Circles were often drawn besides each item to guide the participants on where to
place a pile of counters for a species. Livestock species that had the highest population got a
bigger pile of beans and vice versa. The piles were counted when all the participants had
settled on the distribution provided. They were also asked to give reasons that supported
the results observed – e.g. why a particular species was perceived as having the
highest/lowest population sizes.

HEALTHY FUTURES FP7:266327 – D 3.2 RVF/malaria study site analysis and major findings for RVF & malaria transmission
24
The same approach was used for the other proportional piling exercises. For example, on
the proportion of abortions/pregnancies carried to term, participants were given 100 beans
to represent animals that were pregnant. They were asked to divide the beans into two: the
number of animals that was expected to carry their pregnancies to term verses the number
that would abort. The exercise was completed for a peacetime period (no major disease
outbreaks) and for periods with RVF epidemics. Other exercises involved determining the
relative population sizes of age cohorts of cattle, sheep and goats (neonates, weaners,
yearlings and adults) identified by the participants, and the relative proportion of animals
lost through mortality, sold, or purchased by season.
Data obtained from these exercises were entered into a database designed using MS Excel
and analysed in SATA 11 using non-parametric statistical tests. Medians and their respective
10th and 90th percentile ranges were estimated from the proportional piling scores.
Participatory mapping and timelines
Participants were guided to develop maps of their areas indicating human settlements,
grazing sites, watering points, roads and service centres e.g. towns. These maps were used
to facilitate discussions on a variety of socio-economic activities including livestock grazing
patterns. Timelines were used together with the maps to identify locations where livestock
were, on a monthly basis, over the period July 2011 to July 2012. Timelines on livestock
movements/locations were developed in a reverse order starting with identification of the
sites where livestock were in July 2012, and the earliest time (month) when these animals
were taken there. This approach was repeated until the full period specified above was
covered. Mapping of the livestock movement patterns was done by species (specifically
cattle, sheep and goats).
Data on livestock movement patterns obtained from the participatory mapping exercises
were entered into a database designed using MS Excel. The data variables that could be
formulated include: sub-location, GPS coordinates of the interview sites and other locations
that had been used for grazing over the year, livestock species, month/year, and an
indicator variable which when used together with the month/year specifies whether a given
livestock species was just arriving at a given grazing site, had been there for some time or
was being moved out to other sites with more pasture/water. Monthly mean NDVI data for
all the geo-referenced sites for the study period were obtained from SPOT VEGETATION,
filtered and merged with the movement data obtained from the map. Statistical analyses
were done to determine mean NDVI values for periods when livestock were being moved
out of their recent grazing sites. Up to 1000 bootstrap samples were generated from the
sample and used to estimate 95% confidence intervals for the mean NDVI values for each
site at the time when animals were being moved out from these areas. These analyses were
done in STATA 11 and the results represented thresholds for livestock movement from

HEALTHY FUTURES FP7:266327 – D 3.2 RVF/malaria study site analysis and major findings for RVF & malaria transmission
25
specific sites. Movement patterns for sheep and goats were combined since these livestock
species were often moved to similar locations.
2.2.3.3 Cross-sectional surveys to determine the risk of RVFV infection in livestock
Cross sectional surveys were implemented in the district between October and November
2012 at a time when the government had issued a warning on the likelihood of an RVF
outbreak. The Meteorological Department had predicted higher than normal amounts of
rainfall for the period. Flooding was expected to occur and contingency measures for RVF
were being put in place.
Eleven sites (10 sites in homesteads area and 1 site in the Boni forest) were selected and
used for the survey based on historical information suggesting that these areas had been
involved in the 2006/2007 outbreak. In the homesteads, vectors were sampled using CDC
miniature light traps placed in the livestock night sheds. This trapping targeted night-time
host-seeking mosquitoes. Three traps were set each evening (6 pm) and left overnight and
gathered the following morning. Trapping in the Boni forest targeted day-time host-seeking
mosquitoes (Plate 3.1). The forest is considered to be a good breeding site for mosquitoes
due to high humidity, dense vegetation, presence of hosts for blood meal and presence of
water bodies. Samples were barcoded (by trap) and transported alive to a field laboratory
where they were sorted, identified to genus level and frozen for storage and transportation.
Pooling was done by genus, traps and trapping sites and transported to ILRI Nairobi where
they will be subjected to further laboratory analyses to identify blood meal sources,
infection status and species diversity.
In the same sites, 300 blood samples were collected from cattle and sheep. Herds/flocks
sampled included: (i) animals that had just been brought back from the Boni forest (given
that the short rainy season was commencing and the pastoralists were bringing their
animals back home), and (ii) herds/flocks had not been vaccinated. The sample size (n = 300)
used represented minimum number of livestock that would be needed to detect RVFV
infection. This number was distributed It was estimated using the formula:
))}2
1((()1{( /1
d
Nn d (Eq. 6)
where N - the population size (900,000); α - 1 - confidence level (0.05); d - the estimated
minimum number of diseased animals in the district (population size × the minimum
expected prevalence (1%)). This estimation mainly targeted small ruminants (sheep and
goats in equal proportions) because they are not usually vaccinated against RVF compared
to cattle and the commonly used serological tests do not have the capacity to differentiate
infection from vaccination. Cattle, however, can act as good sentinels for RVFV infection

HEALTHY FUTURES FP7:266327 – D 3.2 RVF/malaria study site analysis and major findings for RVF & malaria transmission
26
because they travel much further than the small ruminants and so they were likely to get
greater exposure to mosquito-borne viruses. Limited attention was focussed on cattle in this
study because there was no assurance that the project team will get unvaccinated herds.
Community animal health workers were used to identify appropriate herds/flocks to
sample. For each animal recruited, 20 ml venous blood was drawn from the jugular vein
using heparinized vacutainer tubes and transported to the field laboratory where each
sample was aliquoted into 5 ml barcoded vials. The samples were then frozen and
transported to ILRI Nairobi for further laboratory analyses.
Plate 2.1. A CDC-type light trap set in the bushy Boni Forest near a water body in Ijara District.
2.3 Results
2.3.1 Analyses of the historical data on RVF outbreaks
Ijara district, like those affected by RVF outbreaks in the north-eastern Kenya, has recorded
at least 4 outbreaks since 1961 (Table 3.7). Before then, outbreaks were confined to a few
districts in the Rift Valley. The data given in the table suggest that all the districts reported
outbreaks at the same time.
Table 3.8 gives results of univariate analyses that were done to evaluate unconditional
association between RVF outbreaks and precipitation, temperature and NDVI. These results
demonstrate that RVF outbreaks in Ijara are significantly associated with precipitation and
NDVI, which represents ecological changes that promote RVF occurrence, e.g. the
development of vector breeding sites. Based on the log likelihood estimates, cumulative
rainfall for a recent period of 3 months was strongly associated with RVF outbreaks than the
other forms of rainfall variable used in the analysis.

HEALTHY FUTURES FP7:266327 – D 3.2 RVF/malaria study site analysis and major findings for RVF & malaria transmission
27
NDVI was not however included in subsequent regression models because data that were
obtained from SPOT VEGETATION covered a short period (1999 – 2010) compared to those
for RVF outbreaks, precipitation, and temperature (1979 – 2010).
Table 2.7. Historical outbreaks of RVF involving Ijara and the other districts in the north-eastern Kenya
Province District Area Year
North Eastern Ijara Habasweni, Masalani
1961, 1962, 1997, 1998, 2006, 2007
Garissa Garissa, Galmagala, Dadaab, Bura Shantabak, Mbalambala, Danyiri, Saka
1961, 1962, 1997, 1998, 2006, 2007
Wajir Wajir, Adadi, Jole, Hadado, Burder, Habaswein
1961, 1962, 1997, 1998, 2006, 2007
Mandera Mandera, Dantu, Kuturo, Didkuro, Gari
1961, 1962, 1997, 1998, 2006, 2007
Table 2.8. Results of the univariate analyses used to assess the association between RVF outbreaks in Ijara district and precipitation, temperature and NDVI obtained from ECMWF
Variable Variable formulations Log likelihood Wald test P > |Z|
Precipitation (n = 1536)
Monthly rainfall -136.14 0.00
1 month lag -142.21 0.00
2 month lag -143.79 0.00
2 month’s aggregate -134.29 0.00
3 month’s aggregate -132.84 0.00
Temperature (n=744)
Maximum -77.22 0.79
Minimum -75.33 0.06
NDVI (n = 528)
Maximum -8.98 0.05
Minimum -12.47 0.14
Results of multivariate analyses involving rainfall and temperature as fixed effects and
division as a random effect are presented in Table 3.9. These findings show that temperature
is not a significant predictor for RVF outbreaks (p =0.22 [Model I]). The analysis was therefore
repeated without this variable (Model II) to obtain a parsimonious model that can be used to
guide the development of a dynamical model.

HEALTHY FUTURES FP7:266327 – D 3.2 RVF/malaria study site analysis and major findings for RVF & malaria transmission
28
Table 2.9. Random effects logistic regression models evaluating the association between climate variables (precipitation and temperature) and RVF epizootics in Ijara district, Kenya
Variable Model 1: Precipitation + Temperature Model II: Precipitation only
β SE P>|Z| β SE P>|Z|
Fixed effects
Constant 106.09 91.34 0.25 -5.23 0.35 0.00
Precipitation 0.42 0.13 0.00 0.58 0.10 0.00
Minimum temperature -0.37 0.31 0.22 -
Random effects
Division 4.08e-13 0.26 8.78e-11 0.27
Log likelihood -70.73, n = 740 Log likelihood -132.85, n = 1528
2.3.2 Community-based participatory research survey
2.3.2.1 Livestock species kept and wild animals found in Ijara
In all the sites visited, participants listed cattle, goats, sheep, donkeys and chickens as the
common livestock species kept. Cattle, goats and sheep, in that order, are the most
abundant and highly valued species compared to the donkeys and chickens (Table 3.10).
Participants indicated that they don’t keep camels because they are very susceptible to
trypanosomosis, the most prevalent vector-borne disease in the area. Wild animals that
were identified as being common include buffaloes, warthogs, leopards, cheetahs and a
variety of gazelles.
2.3.2.2 Livestock age structures and relevant baseline risk of mortality
Field exercises used to collate data on livestock age structures and their respective risks of
mortality required a lot of time to complete. This activity therefore involved a smaller
number of villages and focused only on cattle, sheep and goats. Most participants identified
at least 4 livestock age categories for each species; these included:
- cattle: Dalan (0-3 months), Ashirow (4-6 months), Sarar (7-36 months) and
Hauwechi (37 months and older);
- goats: Dalan (0-3 months), Sarar (4-5 months), Asan (6-12 months) and Riya (13
months and older), and,
- sheep: Maqal (0-1 month), Saben (2-3 months), Laah (5-6 months) and Hauwechi (7
months and older).
Minimum and maximum ages for each category, relative population sizes, and age category-
specific risk of mortality were also determined. Younger animals, in general, are perceived
to have a higher risk of mortality than older ones. The participants further indicated that
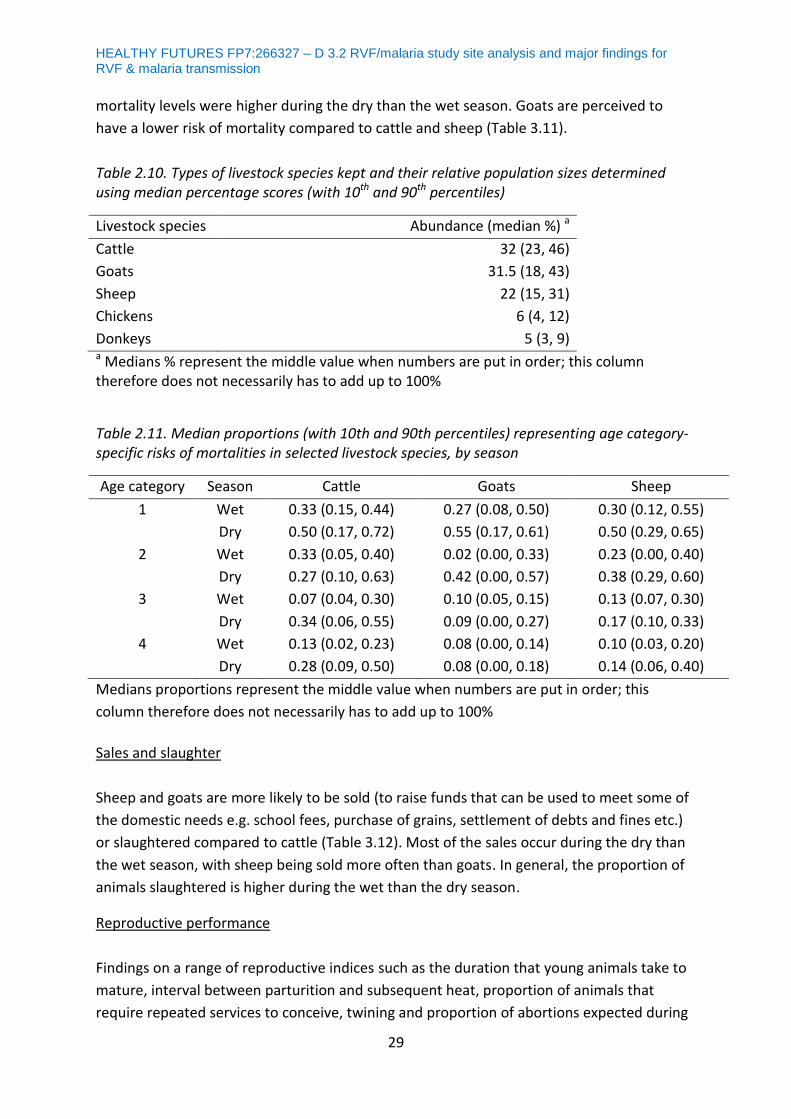
HEALTHY FUTURES FP7:266327 – D 3.2 RVF/malaria study site analysis and major findings for RVF & malaria transmission
29
mortality levels were higher during the dry than the wet season. Goats are perceived to
have a lower risk of mortality compared to cattle and sheep (Table 3.11).
Table 2.10. Types of livestock species kept and their relative population sizes determined using median percentage scores (with 10th and 90th percentiles)
Livestock species Abundance (median %) a
Cattle 32 (23, 46)
Goats 31.5 (18, 43)
Sheep 22 (15, 31)
Chickens 6 (4, 12)
Donkeys 5 (3, 9) a Medians % represent the middle value when numbers are put in order; this column therefore does not necessarily has to add up to 100%
Table 2.11. Median proportions (with 10th and 90th percentiles) representing age category-specific risks of mortalities in selected livestock species, by season
Age category Season Cattle Goats Sheep
1 Wet 0.33 (0.15, 0.44) 0.27 (0.08, 0.50) 0.30 (0.12, 0.55)
Dry 0.50 (0.17, 0.72) 0.55 (0.17, 0.61) 0.50 (0.29, 0.65)
2 Wet 0.33 (0.05, 0.40) 0.02 (0.00, 0.33) 0.23 (0.00, 0.40)
Dry 0.27 (0.10, 0.63) 0.42 (0.00, 0.57) 0.38 (0.29, 0.60)
3 Wet 0.07 (0.04, 0.30) 0.10 (0.05, 0.15) 0.13 (0.07, 0.30)
Dry 0.34 (0.06, 0.55) 0.09 (0.00, 0.27) 0.17 (0.10, 0.33)
4 Wet 0.13 (0.02, 0.23) 0.08 (0.00, 0.14) 0.10 (0.03, 0.20)
Dry 0.28 (0.09, 0.50) 0.08 (0.00, 0.18) 0.14 (0.06, 0.40)
Medians proportions represent the middle value when numbers are put in order; this
column therefore does not necessarily has to add up to 100%
Sales and slaughter
Sheep and goats are more likely to be sold (to raise funds that can be used to meet some of
the domestic needs e.g. school fees, purchase of grains, settlement of debts and fines etc.)
or slaughtered compared to cattle (Table 3.12). Most of the sales occur during the dry than
the wet season, with sheep being sold more often than goats. In general, the proportion of
animals slaughtered is higher during the wet than the dry season.
Reproductive performance
Findings on a range of reproductive indices such as the duration that young animals take to
mature, interval between parturition and subsequent heat, proportion of animals that
require repeated services to conceive, twining and proportion of abortions expected during

HEALTHY FUTURES FP7:266327 – D 3.2 RVF/malaria study site analysis and major findings for RVF & malaria transmission
30
the wet and the dry season are outlined in Table 3.13. Participants, as expected, indicated
that females mature earlier compared to males and that dry weather conditions delay both
the age at first breeding and the interval between parturition and subsequent heat.
In addition, it is perceived that goats have higher proportions of repeat services and higher
twinning frequencies compared to the other livestock species. Goats are also perceived to
have higher baseline abortion risk relative to cattle and sheep. In all the species, the risk of
abortion is higher during the dry than the wet season.
Livestock movement patterns
Plate 3.2 outlines movement patterns of livestock in Hara sub-location, Ijara district. Similar
maps were developed for all the sub-locations visited. General observations made from the
mapping exercise are:
- Boni forest (located along the Kenya Somalia border), the Tana delta and the banks
of River Tana are used as dry season grazing areas. However, Boni forest is heavily
infested with tsetse flies, therefore pastoralists move to this site when there are no
alternative grazing grounds. Animals are also grazed in conservancies such as the
Ishaqbini during the dry season.
- Because of the high tsetse challenge in the Boni forest, small ruminants (sheep and
goats) are seldom taken there. These animals are often grazed in the peripheries of
the forest or in the Tana Delta. In particular, goats are perceived to be more
susceptible to trypanosomosis and they are less responsive to medication.
- The respondents said that cattle are usually moved out of the wet season grazing
sites much earlier than the small ruminants because they are more sensitive to lack
of pasture than goats and sheep.

HEALTHY FUTURES FP7:266327 – D 3.2 RVF/malaria study site analysis and major findings for RVF & malaria transmission
31
Table 2.12. Median percentages (10th and 90th percentiles) of animals sold or slaughtered in Ijara district by seasons (August 2006 to November 2007)
Livestock species Sales (%) Slaughter (%)
Wet season Dry season Wet season Dry season
Cattle 4.5 (0, 20) 6 (2, 15) 2 (1, 3) 0 (0, 2)
Goats 8 (5, 17.5) 15 (4, 21) 4 (0, 17.5) 5 (0, 10)
Sheep 10 (4, 20) 19 (10, 30) 6 (4, 10) 4 (3, 14)
Table 2.13. Reproduction parameters estimated from participatory exercises for the most important livestock species raised in Ijara district
Livestock
species
Age at first breeding in months
(n=22)*
Interval between parturition
and subsequent heat in
months
(n=21)*
Proportion of
repeat
breeders
(n=6)*
Proportion of
animals
giving birth to
twins
(n=15)*
Proportion of pregnancies
that are expected to
terminate prematurely
(abortions)
(n=21)*
Females Males
Wet season Dry season Wet season Dry season Wet season Dry season Wet season Dry season
Cattle 36 (36, 48) 48 (48, 60) 42 (42, 60) 48 (48, 60) 6 (1, 12) 12 (12, 24) 0.1 (0.0, 0.3) 0.0 (0, 0.001) 0.2 (0.0, 0.4) 0.3 (0.2, 0.6)
Goats 7 (12, 30) 12 (18, 24) 6 (24, 30) 30 (12, 36) 3 (2, 5) 6 (3, 12) 0.35 (0.2, 0.6) 0.3 (0.1, 0.5) 0.3 (0.2, 0.5) 0.5 (0.2, 0.6)
Sheep 7.5 (6, 24) 12 (8, 18) 6 (12, 24) 10 (12, 24) 2 (1, 3) 5 (2, 12) 0.0 (0.0, 0.2) 0.1 (0.0, 0.3) 0.1 (0.0, 0.5) 0.3 (0.1, 0.5)
*Number of villages where this information was collected

HEALTHY FUTURES FP7:266327 – D 3.2 RVF/malaria study site analysis and major findings for RVF & malaria transmission
32
- A small herd mainly comprising lactating cows is often left behind in the homesteads
when livestock are moved to the dry season grazing sites. These herds provide milk
for children, women and the elderly people who remain behind in the homesteads,
- Movement between sites could take a short (about 2 days) or a long period (up to 15
days) depending on whether animals can get water and pasture along the migratory
routes,
Plate 2.2. A map indicating migration patterns of livestock in Hara sublocation, Ijara district developed during one of the participatory rural appraisal meetings
To better understand climate thresholds for movement, monthly mean NDVI estimates for
the areas where livestock were grazed in during the period considered for these analyses
(July 2011 and July 2012) were obtained; these are summarised in Tables 3.14 and 3.15. The
overall NDVI mean for the study period was 0.42 (95% CI: 0.38 – 0.46).
At the time when sheep/goats and cattle were being moved out of a grazing site, mean
NDVI values were estimated to be 0.15 (0.08 – 0.22) and 0.27 (0.14 – 0.40), respectively.
These values support observations made by participants that sheep and goats have lower
thresholds for movement compared to cattle.

HEALTHY FUTURES FP7:266327 – D 3.2 RVF/malaria study site analysis and major findings for RVF & malaria transmission
33
Table 2.14. Monthly normalised vegetation indices (NDVI) for the areas used to graze sheep and
goats by four different grazing communities in Ijara district over the period July 2012 to July 2012
Grey shading indicates areas where sheep and goats were in a given month. Negative NDVI values
correspond to water, low positive to slightly negative values correspond to bare soil while values
ranging from 0.3 to 0.8 correspond to dense vegetation.
Table 2.15. Monthly normalised vegetation indices (NDVI) for the areas used to graze cattle by four different grazing communities in Ijara district over the period July 2012 to July 2012
Month Boni---Korisa Boni---Haji Mohamed
Boni---Gababa---Kitele Boni---Falema--Bura
July 11
0.22 0.92
0.22 0.92
0.22 0.92 0.92
0.22 0.92 Aug 11
0.22 0.85
0.22 0.90
0.22 0.20 -0.05
0.22 0.86
Sep 11
0.12 0.86
0.12 0.76
0.12 0.05 -0.04
0.12 0.86 Oct 11
0.34 0.13
0.34 0.05
0.34 0.68 0.45
0.34 0.26
Nov 11
0.26 0.42
0.26 0.52
0.26 0.16 0.15
0.26 0.67
Dec 11
0.66 0.26
0.66 0.36
0.66 0.25 0.08
0.66 0.56
Jan 12
0.66 0.01
0.66 0.14
0.66 0.24 0.77
0.66 0.38
Feb 12
0.32 -0.10
0.32 -0.03
0.32 0.81 0.48
0.32 0.08
Mar 12
0.38 0.88
0.38 0.92
0.38 0.48 0.16
0.38 -0.04
Apr 12
0.27 0.84
0.27 0.88
0.27 0.37 0.10
0.27 0.92 May 12
0.08 -0.05
0.08 -0.10
0.08 0.52 0.15
0.08 0.05
Jun 12
0.44 -0.10
0.44 -0.01
0.44 0.73 0.22
0.44 0.23
Jul 12 0.40 0.87 0.40 0.85 0.40 0.56 0.07 0.40 0.01
Grey shading indicates areas where cattle were in a given month. Negative NDVI values correspond
to water, low positive to slightly negative values correspond to bare soil while values ranging from
0.3 to 0.8 correspond to dense vegetation.
Month Warende Goga---Shelu
Plain---Bodhai Abalatiro---Warawesa---
Gababa Bodhai---Shelu
Plain Atheweiyno---
Warawesa
July 11 -0.03 0.92 0.92
0.92 0.92 0.92
0.92 0.92
0.92 0.92
Aug 11 0.92 0.74 0.61
-0.09 0.90 0.20
0.61 0.74
0.81 0.90
Sep 11 0.86 0.74 0.13
0.92 0.76 0.05
0.13 0.74
0.77 0.76
Oct 11 0.24 0.46 0.55
0.34 0.22 0.68
0.55 0.46
0.28 0.22
Nov 11 0.65 0.90 0.11
0.10 0.91 0.16
0.11 0.90
0.05 0.91
Dec 11 0.74 0.46 0.15
0.85 0.80 0.25
0.15 0.46
-0.10 0.80
Jan 12 0.52 0.04 0.12
0.39 0.38 0.24
0.12 0.04
0.46 0.38
Feb 12 0.17 0.92 0.71
0.18 0.11 0.81
0.71 0.92
0.12 0.11
Mar 12 -0.03 0.81 0.42
0.01 -0.04 0.48
0.42 0.81
-0.09 -0.04
Apr 12 -0.05 0.86 0.26
-0.03 0.16 0.37
0.26 0.86
0.92 0.16
May 12 0.12 0.82 0.68
0.05 0.39 0.52
0.68 0.82
-0.10 0.39
Jun 12 0.19 0.71 -0.09
-0.03 0.14 0.73
-0.09 0.71
0.85 0.14
Jul 12 0.02 0.68 0.40 0.92 0.07 0.56 0.40 0.68 0.81 0.07

HEALTHY FUTURES FP7:266327 – D 3.2 RVF/malaria study site analysis and major findings for RVF & malaria transmission
34
2.3.3 Cross sectional surveys
A total of 300 blood samples were collected from livestock that were being moved out of
the dry season grazing areas towards the end of 2012. Forty nine per cent of these samples
were obtained from goats, 35.7% from sheep and 15 % were obtained from cattle that had
not been vaccinated. At the same time, vectors sampled (using CDC miniature light traps
baited with carbon dioxide) included 2,513 Culex, 33 Anopheles, 9 Mansonia and 7 Aedes
mosquitoes.
These samples are being analysed in the molecular laboratory at ILRI for RVFV infection. In
addition, blood meal sources for mosquitoes are also being investigated using PCR tests.
2.3.4 Preliminary predictions
2.3.4.1 Vector population dynamics and RVFV incidence in livestock
Predicted population dynamics for Aedes app and Culex spp driven by daily TRMM rainfall
are given in Figure 3.4.These populations are used to estimate the force of infection, and
hence the probability of a host getting infected with RVF virus. Predicted RVF virus infection
incidences in cattle and sheep that follow the upsurge in the number of mosquitoes are
presented in Figure 3.5.
Figure 2.4. Predicted population levels of Aedes and Culex mosquitoes over the simulation period
The inset graph in Figure 3.5 demonstrates that RVF epidemics tail off slowly depending on
the rate of disappearance of the flood waters. The main graph also indicates that there are
periodic occurrences of RVFV related with

HEALTHY FUTURES FP7:266327 – D 3.2 RVF/malaria study site analysis and major findings for RVF & malaria transmission
35
Figure 2.5. Predicted RVFV incidence in cattle and sheep over the simulation period; the inset graph illustrates the patterns of the epidemic at a relatively higher temporal resolution
The model has also been used to conduct a number of scenario analyses. Results of an
analysis assessing the effect of varying the area under floods (5 – 50%) are presented in
Figure 3.7.
2.3.4.2 Immunity dynamics
Predictions given in Figures 3.4 and 3.5 suggest that even though there was heavy
precipitation, followed by an upsurge in the number of Aedes and Culex mosquitoes
between days 865 to 921, an insignificant outbreak of the disease occurred in livestock at
the time. Predictions given in Figure 3.6 suggest that naturally acquired immunity could
have played a role in limiting the likelihood of a full-blown epidemic. During this period,
peak incidence of the disease in cattle is predicted to have been below 5% since over 60% of
the animals were immune. This immunity declined over time such that by day 2000, 40% of
the animals were immune. Immunity can therefore play a big role in dampening RVF
outbreaks as well as in determining their frequency of occurrence. These analyses are being
refined so as to help in determining the duration of herd immunity acquired following RVFV
outbreaks.

HEALTHY FUTURES FP7:266327 – D 3.2 RVF/malaria study site analysis and major findings for RVF & malaria transmission
36
Figure 2.6. Predicted changes in immunity levels following natural exposure to RVFV in cattle
2.3.4.3 Varying the number of mosquito breeding sites
Increasing the number of the mosquito breeding sites increases the populations of vectors,
hence the force of RVFV infection, and the probability of an animal encountering at least
once mosquito breeding site as it moves around while grazing. Predictions given in Figure
3.7 demonstrate that higher numbers of mosquito breeding sites produces higher incidence
of RVFV in cattle that also develops much faster than lower number of breeding sites.
Figure 2.7. Expected effect of varying the number of Aedes spp and joint Aedes and Culex spp breeding sites on RVFV incidence in cattle

HEALTHY FUTURES FP7:266327 – D 3.2 RVF/malaria study site analysis and major findings for RVF & malaria transmission
37
2.3.4.4 Validation
The model mimics temporal patterns of the recent 2006/2007 RVF epidemics – Kenya
officially reported the epidemic in December 2006 while Tanzania reported (as stated
earlier) in February, 2007. However, the time interval between the provisions of official
reports between the two countries was longer than the predicted interval of occurrence.
More analyses will be done to determine the cause of this discrepancy which might be
associated with:
- Differences in response times, hence provision of reports by country
- Failure of the model to respond to precipitation changes
- Inaccuracies with precipitation measurements
Figure 2.8. Predicted RVFV incidence in Ijara, Kenya and Arusha Tanzania
2.4 Discussion
RVF transmission dynamics are influenced by multiple drivers that act at various time and
spatial scales. Tremendous progress has been made in identifying some of the main drivers
and transmission processes, particularly the relationships between RVF outbreaks and
physical or climatic factors. Anyamba et al. (2009), for instance, have developed a prediction
system based on climate anomalies that can be used for predicting outbreaks with 2 to 6
week lead time. The present work recognises the need to employ a multidisciplinary
approach to generate more knowledge on the disease transmission mechanisms. It
therefore uses an individual-based RVFV transmission model as an analytical framework for
generating hypotheses for further work. The model simulates interactions between the
various components of the disease system including vectors, hosts, and the environment
and its processes are driven by climatic and socio-economic variables. This approach
therefore represents an initial attempt to study how climate drivers interact with

HEALTHY FUTURES FP7:266327 – D 3.2 RVF/malaria study site analysis and major findings for RVF & malaria transmission
38
local/socio-economic processes such as livestock movements, off-take rates and herd
immunity changes to influence the incidence of RVF.
The analysis of historical data shows that RVF outbreaks are associated with excessive and
persistent rainfall that lasts for a period of at least 3 months. It also reveals that
temperature variability is not a significant predictor although these findings will be verified
as the statistical model is refined, for example, through the inclusion of other districts and
key predictors that could not be used. Nonetheless, similar results have been reported by
Anyamba et al. (2012) and they are consistent with observations made by Logan et al.
(1991) and Linthicum et al. (1983) that flooding for 10-15 days is necessary for the
emergence of RVFV infected Aedes floodwater breeding mosquitoes and that the
persistence of floodwaters for a further 4-6 weeks and their colonization by secondary
mosquito vectors allows for the amplification of the virus to epidemic proportions. Anyamba
et al. (2009) also indicates that RVF outbreaks occur after excessive rainfall and flooding,
often associated with El Nino weather phenomenon in the Horn of Africa. El Nino weather
patterns follow an anomalous warming of the sea surface temperatures (SSTs) by >1 ⁰C in
the eastern-central pacific region and concurrent anomalous warming of SSTs (>0.5 ⁰C) in
the western equatorial Indian Ocean leading to increased precipitation (Anyamba et al.,
2009). They indicate that in 2006/2007, cases of RVF occurred after 3-4 months of sustained
above normal rainfall and associated green-up in vegetation. These observations have been
used in setting thresholds for the RVFV transmission model though more work is needed to
refine hydrological dynamics that lead to flooding. Analyses on historical data have utilised
animal and not human outbreak data although both human and livestock cases were
reported in the district during the 1997-98 and 2006-07 outbreaks. Attempts are being
made to collate human cases and identify risk factors involved in anima-human transmission
so as to estimate the expected impacts of the disease (on both human and livestock health
and livestock trade).
Animal movements contribute immensely to the transmission and maintenance of
infectious diseases. For the purposes of this work, animal movements are classified into
three levels depending on the range of distances covered; these are:
(i) International/trade-related movements. For instance RVFV is believed to have been
introduced into the Middle East by ruminants transported from Kenya that had
experienced the outbreak in 1997/1998 (Abdo-Salem et al. 2011),
(ii) seasonal migrations across ecological zones associated with pastoralism, and
(iii) local movements within settlement areas.

HEALTHY FUTURES FP7:266327 – D 3.2 RVF/malaria study site analysis and major findings for RVF & malaria transmission
39
This report focuses on the second and third levels of movement since these could be
relevant for RVFV transmission in Ijara. The local Somali community practice transhumant
pastoralism (involving seasonal migration patterns) as the key socio-economic activity to
cope or manage the effects of adverse climate. Animals are moved from inhabited areas
with diminishing pasture and water to areas where these resources can still be found.
Participatory survey established that the number of movements undertaken in a year
depends on environmental conditions and the type of animals kept. An analysis of these
movements against NDVI estimates as a proxy for climate variability indicates that there is a
pattern of increased movement during periods of low NDVI. Small ruminants have a higher
NDVI threshold for movement than cattle since they browse on a variety of shrubs that can
withstand drought conditions for a slightly longer time than the normal pasture. Similar
analyses have been used previously by Worden (2007) to analyse livestock movement
dynamics in the greater Amboselli ecosystem in Kenya. Low NDVI estimates, however, might
not always imply increased livestock movement because they measure the amount of
greenness or green forage that is present in an area rather than pasture availability. In fact
drought mitigation strategies focus more on accessing standing dry biomass rather than
green forage. Nevertheless, these estimates can be valuable for guiding livestock movement
dynamics in the model. It can also be correlated with rainfall density, as it has been done in
agronomy, to allow for predictions of future movement patterns assuming that there are
minimal changes in land use patterns.
Efforts are underway to determine whether seasonal/transhumant migrations influence RVF
transmission/persistence. Areas used as dry season grazing sites e.g. the Boni forest and
riverine vegetation along River Tana have the potential to sustain an endemic transmission
of the virus since they have a rich diversity and density of animals and vectors. Observations
made by Shope et al. (1982) indicating that the virus can exists in endemic cycle in forests or
in humid and shrubby grasslands are very relevant in this case. Analysis of the biological
samples collected from animals that were being brought back from these areas would
therefore be invaluable for this assessment. If it is established that these areas have some
RVFV activity, then it is likely that exposures that occur while livestock are being grazed
there help in sustaining naturally acquired immunity. These hypotheses are consistent with
unproven opinions suggesting that major RVF outbreaks occur after prolonged periods of
drought when a large proportion of otherwise immune animals are lost, and so they get
replaced with naive populations.
It has been shown that local livestock movements amplify the rate transmission of an
infectious disease especially if movements occur in the course of an outbreak. Anyamba et
al. (2010) observe that movement of vireamic animals to other ecological zones in the
course of RVF outbreaks amplifies outbreaks especially if these areas have large populations
of Culex mosquitoes that play a role in creating secondary RVF transmission foci. Scenario
analyses conducted using the RVFV model (not shown) suggest that the range of distances

HEALTHY FUTURES FP7:266327 – D 3.2 RVF/malaria study site analysis and major findings for RVF & malaria transmission
40
covered per day correlate positively with size (incidence and duration) of an epidemic. This
is due to the fact that there is an increased chance of an animal getting into a vector
breeding zone the further it moves away from its base.
Outputs from the transmission model suggest that herd/flock immunity against RVF can
influence the size and intervals of the outbreaks. This appears to be more important in
cattle, given their lower turn-over rates, than sheep. It is currently thought that an animal
that recovers from natural infection remains immune for the rest of its life. This implies that
livestock offtake rates (sales, slaughters and mortalities) are very important in determining
the longevity of acquired herd-level immunity by influencing the rates at which immunized
animals are removed from the herds/flocks. Preliminary findings show that small ruminants
have high turn-over rates compared to cattle. During the dry season for instance, 19% of
sheep and 15% of goats are sold to meet some of the household needs. The high offtake
rates negatively affect the persistence of herd immunity. The data collected from these
surveys will be analysed further and used for the prediction of immunity dynamics over
time.
There are many other factors that can influence RVFV transmission dynamics which cannot
be exhaustively addressed by this report. One of this is the type of hosts that are present in
an area (a measure of biodiversity). Participatory surveys identified types of livestock
species being kept in the area, their relative population sizes as well as wildlife species that
are common in the district. This information is being used to determine types of hosts that
should be considered when developing a multi-host model. It is known however that there
is a huge variability in the susceptibility of the various animal species to RVFV infection.
Domestic animals, for instance, have been listed in a decreasing order of susceptibility as:
sheep, goats, cattle, camels and water buffaloes (FAO, 2003). Similarly, antelopes, cape
buffaloes, monkeys, cats, dogs and rodents are known to be susceptible while birds, reptiles
and amphibians are refractory to RVFV infection. The presence of such a big diversity of
hosts in an area can either promote the transmission of the disease (e.g. by providing a
larger potential source of blood meal for the vectors or harbouring the virus, etc ) or reduce
further pathogen transmission especially is some of them act as dead-end hosts. This is one
of the interesting aspect of the topics that would be addressed as the model is expanded
and refined.

HEALTHY FUTURES FP7:266327 – D 3.2 RVF/malaria study site analysis and major findings for RVF & malaria transmission
41
3 Malaria
3.1 Background
Malaria is a major public health problem in Kenya and it accounts for 30% of outpatient
consultations, 15% hospital admissions, and 3-5% inpatient deaths (Njuguna et al., 2012). In
arid and semi-arid areas (e.g. Ijara district), malaria transmission is extremely seasonal since
the vectors that are involved (mainly Anopheles arabiensis and An. gambiensis) are sensitive
to climate variability. These vectors are confronted with highly variable and challenging
climatic conditions, particularly during the dry seasons, which cause drastic shrinking or
complete disappearance of larval habitats, a decline in the vector population and hence a
reduction in the incidence of the disease. Build-up of a new population of vectors in
subsequent wet seasons arise either from new populations of immigrants from the
neighbouring areas or an expansion of the small local populations that survive the dry
period (Mala et al., 2011). Given that Anopheles eggs have low tolerance to desiccation,
adults have to survive the dry spell in order for the species to survive by hiding in barrows,
abandoned houses, etc.
Malaria cases often cluster by geographic/ecological, socio-economic, or demographic
factors. In Arid and semi-arid areas, closeness to a river, watering points or irrigated areas
has been associated with an increased prevalence of the disease (Oesterholt et al, 2006).
Other risk factors that have been reported include living in grass-thatched houses (preferred
by mosquitoes), engaging in outdoor occupations such as herding cattle, low altitude, and
dense vegetation cover (Mala et al., 2011; Noor et al., 2009). These relationships are,
however, not linear; Ijumba and Lindsay (2001) indicate that the use of vector control
measures such as bed nets or improved access to medical services masks the expected
effects of these risk factors. In fact recent observations indicate that malaria caused by P.
falciparum is declining in sub-Saharan Africa due to large-scale bed net programmes and
improved case management. Malaria risk mapping work done by Noor et al. (2009) also
shows that a large proportion of Kenya (94%) has low intensity transmission which can be
difficult or costly to quantify empirically.
The intensity of malaria transmission is often measured using: (i) the entomological
inoculation rate (EIR), which represents the average number of infective bites per person
per unit time, and (ii) Ro, the average number of secondary infections in a non-immune
population resulting from a single new infection. However, both of these indices are difficult
to measure directly. EIR, for instance, is estimated as the product between the proportion of
mosquitoes carrying sporozoites in their salivary glands (sporozoite-rate) and the mosquito-
human biting rate. In semi-arid areas (like Ijara district), sporozoite rate is usually very low
and seasonal. Mosquito-human biting rate is also influenced by many factors such as the
density of the mosquitoes, relative locations of mosquito breeding sites and areas of human

HEALTHY FUTURES FP7:266327 – D 3.2 RVF/malaria study site analysis and major findings for RVF & malaria transmission
42
aggregation. Alternative measures for P. falciparum risk have been developed and used
since the 1950s, e.g. parasite rate (PfRT), which represents a proportion of a random sample
of population with malaria parasites in their peripheral blood, spleen rates, etc. PfRT has
been used to map malaria risk in Africa.
This is a preliminary analysis that uses hospital records obtained from health facilities in
Ijara district to determine whether the number of cases reported in the district can be
associated with climate variables – precipitation and temperature. The data represents the
number of outpatient malaria cases recorded over a 5 year period and the proportion of the
cases that are found to be positive for malaria following laboratory investigation. This
analysis is however prejudiced by the fact that hospital records do not necessarily represent
the background incidence of a disease. In this case, more work will be done to estimate EIRs
and repeat the analysis in order to generate more solid evidence on the linkages between
climate and malaria transmission.
3.2 Methodology Hospital records on malaria cases in Ijara district for the period 2006 to 2011 were obtained
from the District Health Records and Information Office. The data comprise monthly records
of inpatient and outpatient cases; mortalities from the inpatient cases; the number of cases
tested versus those that turned positive for malaria following laboratory investigation; and
annual quantities of insecticide-treated nets and long lasting insecticide treated nets,
artemisinin-combination therapy distributed to people and the number of houses covered
with indoor residual spraying.
Descriptive analyses were done to explore trends in malaria incidence based on the number
of outpatient cases and the proportion that turned positive on laboratory investigation.
Subsequently, simple statistical analyses using Generalised Linear Model (GLM) were done
to assess the correlation between these outcomes (total number of outpatient cases and
proportion of the cases that turned positive) and climate variables: mean precipitation,
mean minimum and maximum temperature estimates for the district obtained from
ECMWF. Both current and lagged (1 and 2 months) rainfall and temperature estimates were
used in the analysis. The dependent variables iy were assumed to have a normal
distribution with mean i and variance 2 represented as: ),( 2ii Ny , and the general
structure of the model:
iii exy 110 (Eq. 7)
The two climate variables (precipitation and temperature) were used in the analysis because
they have been shown to influence the incidence of malaria. Precipitation influences
humidity and causes the development of mosquito larva habitats. Changes in temperature

HEALTHY FUTURES FP7:266327 – D 3.2 RVF/malaria study site analysis and major findings for RVF & malaria transmission
43
0
200
400
600
800
1000
1200
1400
Jan
May
Sep
Jan
May
Sep
Jan
May
Sep
Jan
May
Sep
Jan
May
Sep
Jan
May
Sep
All cases
Cases under 5 years
Nu
mb
er o
f ca
ses
Month
2006 2007 2008 2009 2010 2011
and humidity affect vector distribution and development, survival, susceptibility to
pathogens, pathogens’ replication rates in the vector and their extrinsic incubation periods.
3.3 Results
3.3.1 Descriptive analyses
The total numbers of outpatient and inpatient malaria cases reported over the period (2006
– 2011) were 33,618 and 1,308, with those under 5 years of age representing 47% and
41.3%, respectively. Figure 4.1 shows the distribution of these cases by month. It also shows
that there was a steady increase in the number of cases until mid – 2009 when it started
declining.
Figure 3.1. Trends in the total number of outpatient malaria cases and those for patients less than 5 years old attended to in all the health facilities in Ijara district in 2006 to 2011.
Figure 4.2 shows the trend in the proportion of cases, out of those tested, that were
confirmed following laboratory analysis. A majority of the cases were found to be negative
for malaria; 83% of the cases had less than 40% probability of being diagnosed as positive.

HEALTHY FUTURES FP7:266327 – D 3.2 RVF/malaria study site analysis and major findings for RVF & malaria transmission
44
0.00
0.10
0.20
0.30
0.40
0.50
0.60
Jan
May
Sep
Jan
May
Sep
Jan
May
Sep
Jan
May
Sep
Jan
May
Sep
Jan
May
Sep
Month
2006 2007 2008 2009 2010 2011
Prop
orti
on o
f cas
es t
hat
are
posi
tive
for
mal
aria
Figure 3.2. Monthly trends in proportion of cases that are positively diagnosed for malaria using laboratory tests in Ijara district over the period 2006 – 2011
Interventions implemented by the public health department in response to these cases are
outlined in Table 4.1. More emphasis was placed on the use of indoor residual spraying in
2007, which also targeted a bigger population, than in the subsequent years. A lot of
arteminisin-combination therapies were used in 2008.
Table 3.1. Annual statistics on the numbers of insecticide treated nets (ITNs), long lasting insecticide treated nets (LLINs), arteminisin-combination therapies (ACTs) and the number of houses covered with indoor residual spraying (IRS) obtained from Ijara district for the period 2006 - 2007
Year ITN LLINs ACTs IRS
No houses sprayed No. of houses targeted No. of people
protected
2007 372 10,478 3,041 6,880 8,840 20,640
2008 200 0 20,703 1,524* 3,824 4,572
2009 0 0 3,083 3,098 5,480 9,294
2010 0 782 3,019 80* 2,128 240
2011 0 24,000 1,659 10,813 11,133 32,439
* Low numbers of houses were covered with IRS in the years 2008 and 2010 because the Ministry of Health did not receive external support at the time. This implies that only local government resources were used to fund the intervention. The Mentor Initiative (http://thementorinitiative.org/) is now partnering with the local government to improve the effectiveness of malaria response measures.
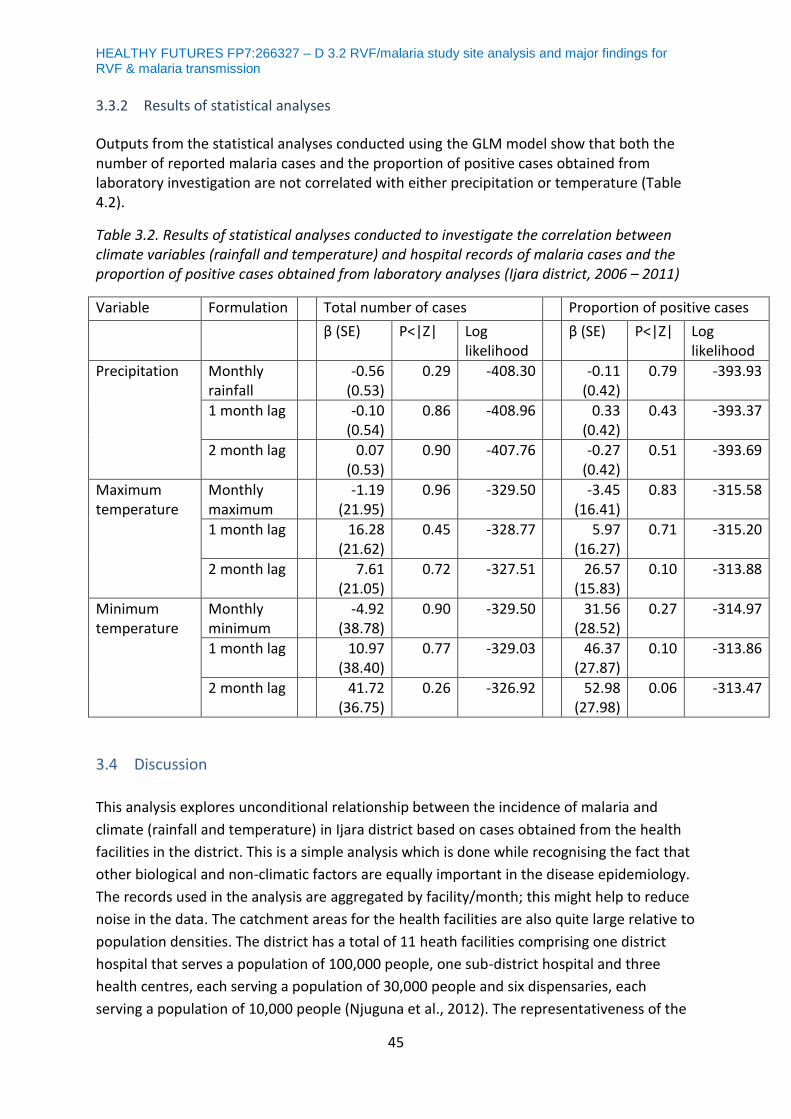
HEALTHY FUTURES FP7:266327 – D 3.2 RVF/malaria study site analysis and major findings for RVF & malaria transmission
45
3.3.2 Results of statistical analyses
Outputs from the statistical analyses conducted using the GLM model show that both the number of reported malaria cases and the proportion of positive cases obtained from laboratory investigation are not correlated with either precipitation or temperature (Table 4.2).
Table 3.2. Results of statistical analyses conducted to investigate the correlation between climate variables (rainfall and temperature) and hospital records of malaria cases and the proportion of positive cases obtained from laboratory analyses (Ijara district, 2006 – 2011)
Variable Formulation Total number of cases Proportion of positive cases
β (SE) P<|Z| Log likelihood
β (SE) P<|Z| Log likelihood
Precipitation
Monthly rainfall
-0.56 (0.53)
0.29 -408.30 -0.11 (0.42)
0.79 -393.93
1 month lag -0.10 (0.54)
0.86 -408.96 0.33 (0.42)
0.43 -393.37
2 month lag 0.07 (0.53)
0.90 -407.76 -0.27 (0.42)
0.51 -393.69
Maximum temperature
Monthly maximum
-1.19 (21.95)
0.96 -329.50 -3.45 (16.41)
0.83 -315.58
1 month lag 16.28 (21.62)
0.45 -328.77 5.97 (16.27)
0.71 -315.20
2 month lag 7.61 (21.05)
0.72 -327.51 26.57 (15.83)
0.10 -313.88
Minimum temperature
Monthly minimum
-4.92 (38.78)
0.90 -329.50 31.56 (28.52)
0.27 -314.97
1 month lag 10.97 (38.40)
0.77 -329.03 46.37 (27.87)
0.10 -313.86
2 month lag 41.72 (36.75)
0.26 -326.92 52.98 (27.98)
0.06 -313.47
3.4 Discussion
This analysis explores unconditional relationship between the incidence of malaria and
climate (rainfall and temperature) in Ijara district based on cases obtained from the health
facilities in the district. This is a simple analysis which is done while recognising the fact that
other biological and non-climatic factors are equally important in the disease epidemiology.
The records used in the analysis are aggregated by facility/month; this might help to reduce
noise in the data. The catchment areas for the health facilities are also quite large relative to
population densities. The district has a total of 11 heath facilities comprising one district
hospital that serves a population of 100,000 people, one sub-district hospital and three
health centres, each serving a population of 30,000 people and six dispensaries, each
serving a population of 10,000 people (Njuguna et al., 2012). The representativeness of the

HEALTHY FUTURES FP7:266327 – D 3.2 RVF/malaria study site analysis and major findings for RVF & malaria transmission
46
data can also be questioned considering the fact that a large proportion of the target
population seek medical services from private clinics, pharmacies and traditional healers,
etc. which are not captured by the public health surveillance. Nevertheless, the quality of
surveillance for infectious diseases has been improving in the country following the
introduction of Integrated Disease Surveillance and Response (IDSR) program by WHO and
CDC.
Most studies have demonstrated that climate factors are important drivers for malaria
transmission, affecting both the development rates of the malaria parasites and vectors.
This topic has generated a lot of interest because of the expected impacts of climate change
on human health. A rise in temperature is expected to increase the transmission and
prevalence of malaria by increasing the vector feeding rate and by shortening the incubation
period of the parasite in the vector. Precipitation, on the other hand, provides a medium for
the development of the aquatic stages of the vector and increases humidity, which
enhances the longevity of the vector (Alemu et al., 2011). A recent analysis by Akinbobola
and Omotosho et al. (2012), for instance, reported that rainfall (with a lag of one month)
and maximum temperature are positively correlated with malaria incidence in Nigeria.
Contrary to the expectations expressed above, this study did not find any correlation
between climate variables and incidence of malaria in Ijara district. This can be attributed to
increased uptake of malaria prevention and control measures such as IRS, ACTs and LLINs.
Njuguna et al. (2012) reports that a majority (76.5%) of the cases reported in these facilities
are diagnosed using clinical examinations and no laboratory confirmations are done. In fact
the degree of positivity that is obtained following laboratory diagnosis rarely goes beyond
40%. This trend is thought to cause an over-representation of malaria incidence and hence
an over-treatment. In fact it has been demonstrated that spleen and parasite prevalence in
communities that live in villages with health facilities are significantly lower than those
communities that live in villages without these facilities (Mboera et al., 2008).
There is a need for more studies on the relationship between climate variability and malaria
transmission dynamics, and how it is influenced by anthropogenic drivers, including the
application of large scale intervention measures. It has been reported that the endemicity
and geographical extent of the disease is declining globally, and yet there are predictions
that suggest an increased burden of the disease as a result of the global climate change
(Gething et al., 2010). This paper also observes that non-climatic factors such as disease
control, indirect effects of urbanization and economic development have had greater
influence on the geographic extent and intensity of malaria worldwide than have climatic
factors.
4 Way forward on RVF work
More work is being done to refine the RVFV model particularly on developing an
appropriate module to simulate flooding dynamics. This needs to be driven by topography,

HEALTHY FUTURES FP7:266327 – D 3.2 RVF/malaria study site analysis and major findings for RVF & malaria transmission
47
soil types, precipitation and temperature. There is also a need to develop a way of
incorporating wild life, for example having a group of hosts that have variable contribution
to the RVFV transmission. In addition, the model does not explicitly include people yet it
would be necessary to determine the impact of the disease on humans. This has not been
one because it is believed that infections that have substantial impacts are acquired through
contact with tissues and (or) fluids of infected animals. This will not be possible to model
dynamically. However, a parallel survey is being conducted to identify the proportion of
people that engage in risk practices such as slaughtering animals, consumption of uncooked
meat etc. to be used for the development of a statistical model that estimates the risk of the
disease in humans when there are outbreaks in animals.
Biological samples that have been collected so far are inadequate. More sampling will be
done particularly in the dry season grazing areas to determine whether they support an
endemic transmission of RVF.
Finally, RVF is a zoonotic disease and there is a need to collect socio-economic data that can
be used to assess factors that promote exposure to humans. This work will be done in
collaboration with the University of Nairobi.
Acknowledgements
We received tremendous support from a large number of people. Andrew Githeko helped
us so much in the collation of malaria records from the local hospitals in Ijara district. RVF
records were obtained from CDC Kenya. We also thank all the participants of the focus
group discussions we held in Ijara. This report was reviewed by Mark Booth and Felipe de
Jesús Colón-González.

HEALTHY FUTURES FP7:266327 – D 3.2 RVF/malaria study site analysis and major findings for RVF & malaria transmission
48
5 References
Abdo-Salem, S., Waret-Szkuta, A., Roger, F., Olive, M-M., Saed, K., Chevalier, V., 2011. Risk
assessment of the introduction of Rift Valley fever from the Horn of Africa to Yemen via legal trade
of small ruminants. Tropical Animal Health and Production 43, 471 – 480.
Akinbobola, A., Omotosho, J.B., 2012. Predicting malaria occurrence in southwest and north central Nigeria using meteorological parameters. International Journal of Biometeorology. DOI 10.1007/s00484-012-0599-6.
Alemu, A., Abebe, G., Tsegaye, W., Golassa, L., 2011. Climatic variables and malaria transmission
dynamics in Jimma town, southwest Ethiopia. Parasites and Vectors 4, 30.
Anyamba, A., Linthicum, K. J., Small, J., Britch, S. C., Pak, E., de La Rocque, S., Formenty, P.,
Hightower, A. W., Breiman, R. F., Chretien, J-P., Tucker, C. J., Schnabel, D., Sang, R., Haagsma, K.,
Latham, K., Lewandowski , H. B., Magdi, S. O., Mohamed, M. A., Nguku, P. M., Reynes, J-M.,
Swanepoel, R., 2010. Prediction, assessment of the Rift Valley fever activity in East and Southern
Africa 2006-2008 and possible vector control strategies. American Journal of Tropical Medicine and
Hygiene 83, 43 – 51.
Anyamba, A., Chretien, J-P., Small, J., Tucker, C.J., Formenty, P.B., Richardson, J.H., Britch, S.C.,
Schnabel, D.C., Erickson, R.L., Linthicum, K.J., 2009. Prediction of a Rift Valley fever outbreak.
Proceedings of the National Academy of Sciences of the United States of America 106, 955-959.
Anyamba, A., Linthicum, K. J., Small, J.L., Collins, K.M., Tucker, C.J., Pak, E.W., Britch, S.C., Eastman,
J.R., Pinzon, J.E., Russel, K.L., 2012. Climate teleconnections and recent patterns of human and
animal disease outbreaks. PLoS Neglected Tropical Diseases 6, e1465.
Bedelian, C., Nkedianye, D., Herrero, M., 2007. Maasai perception of the impact and incidence of malignant catarrhal fever (MCF) in southern Kenya. Preventive Veterinary Medicine78, 296–316.
Bett, B., Jost, C., Allport, R., Mariner, R., 2009. Using participatory techniques to estimate the relative incidence and impact on livelihoods of livestock diseases amongst nomadic pastoralists in Turkana South District, Kenya. Preventive Veterinary Medicine 90, 194 – 203.
Bett, B., Omolo, A., Notenbaert, A., Kemp, S., 2012. Spatial-temporal analysis of the risk of Rift Valley
Fever in Kenya. A presentation given at the 13th International Symposium for Veterinary
Epidemiology and Economics, Maastricht, 20 – 24th August 2012.
Burnham, S., Musser, J., Coetzer, J.A., 2006. Rift Valley Fever Symptoms (Case Report). Texas A&M University, College of Veterinary Medicine and University of Pretoria, Department of Veterinary Tropical Diseases.
Catley, A., Mariner, J., 2002. Where there is no data: participatory approaches to veterinary epidemiology in pastoral areas of the Horn of Africa. IIED. Issue paper No. 110.

HEALTHY FUTURES FP7:266327 – D 3.2 RVF/malaria study site analysis and major findings for RVF & malaria transmission
49
Central Bureau of Statistics (CBS) [Kenya], Ministry of Health (MOH) [Kenya], ORC Macro. 2004. Kenya Demographic and Health Survey 2003. Calverton, Maryland: CBS, MOH, and ORC Macro. Cleaveland, S., Kusiluka, L., Ole Kuwai, J., Bell, C., Kazwala, R., 2001. Assessing the Impact of Malignant Catarrhal Fever in Ngorongoro District, Tanzania. A study commissioned by Animal Health Program, DFID.
Clements, A.N., Paterson, G.D., 1981. The analysis of mortality and survival rates in wild populations of mosquitoes. Journal of Applied Ecology 18, 373–399.
Daubney, R., Hudson, J. R., Granham, P. C.,1931. Enzootic hepatitis or Rift Valley fever: an
undescribed virus disease of sheep, cattle and man from East Africa. Journal of Pathology and
Bacteriology 34, 545 – 579.
EFSA, 2005. The risk of a Rift Valley fever incursion and its persistence within the EU community. The
EFSA Journal 238, 1 – 128.
Elizondo-Quiroga, A., Flores-Suarez, A., Elizondo-Quiroga, D., Ponce-Garcia, G., Blitvich, B.J., Contreras-Cordero, J.F., Gonzalez-Rojas, J.I., Mercado-Hernandez, R., Beaty, B.J., Fernandez-Salas, I., 2006. Gonotrophic cycle and survivorship of Culex quinquefasciatus (Diptera: Culicidae) using sticky ovitraps in Monterrey, northeastern Mexico. Journal of the American Mosquito Control Association 22, 10–14.
Evans, A., Gakuya, F., Paweska, J.T., Rostal, M., Akoolo, L., Van Vuren, P. J., Manyibe, T., Macharia,
J.M., Ksiazek, T.G., Feikin, D.R., Breiman, R.F., Kariuki Njenga, M., 2008. Prevalence of antibodies
against Rift Valley fever virus in Kenyan wildlife. Epidemiology and Infection 136, 1261 – 1269.
FAO., 2003. Recognising Rift Valley Fever, FAO Animal Health Manual No. 17,
http://www.fao.org/docrep/006/Y4611E/y4611e00.htm
Gaff, H. D., Hartley, D. M., Leahy, N. P., 2007. An epidemiological model of Rift Valley Fever. Elec-tronic Journal of Differential Equations 115, 1–12
García-Rejón, J., Farfan-Ale, J., Ulloa, A., Flores-Flores, L., Rosado-Paredes, E., Baak-Baak, C., Loroño-Pino, I., Fernández-Salas, I., Beaty, B., 2008. Gonotrophic cycle estimate for Culex quinquefasciatus in Mérida, Yucatán, México. Journal of the American Mosquito Control Association 24, 344–348.
Gething, P.W., Smith, D.L., Patil, A.P., Tatem, A.J., Snow, R.W., Hay, S.I., 2010. Climate change and
the global malaria recession. Nature 465, 342 – 345.
GoK., 2009. Ijara district development plan 2008-2012. Government of Kenya, Ministry of State for Planning, National Development and Vision 2030, pg 1-20
Hightower, A., Kinkade, C., Nguku, P.M., Anyangu, A., Mutonga, D., Omolo, J., Njenga, M.K., Feikin,
D.R., Schnabel, D., Ombok, M., Breiman, R.F., 2012. Relationship of Climate, Geography, and Geology
to the Incidence of Rift Valley Fever in Kenya during the 2006-2007 Outbreak. The American Journal
of Tropical Medicine and Hygiene 86, 373-380.

HEALTHY FUTURES FP7:266327 – D 3.2 RVF/malaria study site analysis and major findings for RVF & malaria transmission
50
ILRI, 2007. Learning the Lessons of Rift Valley Fever: Improved Detection and Mitigation of Outbreaks. Draft RVF report. International Livestock Research Institute (ILRI) in partnership with the Government of Kenya’s Ministry of Agriculture, Department of Veterinary Services.
Jones, C.E., Lounibos, L.P., Marra, P.P., Kilpatrick, A.M., 2012. Rainfall influences survival of Culex pipiens (Diptera: Culicidae) in a residential neighbourhood in the mid-Atlantic United States. Journal of Medical Entomology 49, 467–73.
Jost, C.C., Nzietchueng, S., Kihu, S., Bett, B., Njogu, G., Swai, E.S., Mariner, J.C., 2010. Epidemiological assessment of the Rift Valley fever outbreak in Kenya and Tanzania in 2006 and 2007. The American Iournal of Tropical Medicine and Hygiene 83, 65–72.
LaBeaud, A.D., Muchiri, E.M., Ndzovu, M., Mwanje, M.T., Muiruri, S., Peters, C.J., King, C.H., 2008.
Inter-epidemic Rift Valley Fever Virus seropositivity, Northeastern Kenya. Emerging Infectious
Diseases 14, 1240-1246.
LaBeaud, A.D., Muiruri, S., Sutherland, L.J., Dahir, S., Gildengorin, G., Morrill, J., Muchiri, E.M., Peters, C.J., King, C.H., 2011b. Post-epidemic analysis of Rift Valley fever virus transmission in northeastern Kenya: a village cohort study. PLoS Neglected Tropical Diseases 5, e1265.
LaBeaud, A.D., Sutherland, L.J., Muiruri, S., Muchiri, E.M., Gray, L.R., Zimmerman, P.A., 2011a.
Arbovirus prevalence in mosquitoes, Kenya. Emerging Infectious Diseases
http://dx.doi.org/10.3201/eid1702.091666
Linthicum, K.J., Davies, F.G., Bailey, C.L., Kairo, A., 1983. Mosquito species succession in a dambo in
East African forest. Mosquito News 43, 464 – 470.
Logan, T.M., Linthicum, K.J., Thande, P.C., Wagateh, J.N., Roberts, C.R., 1991. Egg hatching of Aedes
mosquitoes during successive floodings in a Rift Valley fever endemic area in Kenya. Journal of the
American Mosquito Control Association 7, 109 – 112.
Mala, A.O., Irungu, L.W., Shililu, J.I., Muturi, E.J., Mbogo, C.M., Njagi, J. K., Mukabana, W. R., Githure,
J.I., 2011. Plasmodium falciparum transmission and aridity: a Kenyan experience from the dry lands
of Baringo and its implications for Anopheles arabiensis control. Malaria Journal 10, 121.
Martin, V., Chevalier, V., Ceccato, P., Anyamba, A., Simone, L. De, 2008. The impact of climate change on the epidemiology and control of Rift Valley fever vector-borne diseases Rift Valley fever and climate change. Review of Science and Technology, Office of International Epizootics 27, 413–426.
Mboera, L.E.G., Kamugisha, M.L., Rumisha, S.F., Kisinza, W.N., Senkoro, K.P., Kitua, A.Y., 2008.
Malaria and mosquito net utilization among school children in villages with and without health care
facilities at different altitudes in Iringa district, Tanzania. African Health Sciences 8, 114 – 119.
McDonald, P.T., 1977. Population characteristics of domestic Aedes aegypti (Diptera: Culicidae) in villages on the Kenyan coast.1. Adult survivorship and population size. Journal of Medical Entomology, 49–53.

HEALTHY FUTURES FP7:266327 – D 3.2 RVF/malaria study site analysis and major findings for RVF & malaria transmission
51
McIntosh, B.M., Dickinson, D.B., Dos Santos, I., 1973. Rift Valley fever: 3.Viraemia in cattle and sheep. 4. The susceptibility of mice and hamsters in relation to transmission of virus by mosquitoes. Journal of South Africa Veterinary Association 44, 167–169.
Murithi, R.M., Munyua, P., Ithondeka, P.M., Macharia, J.M., Hightower, A., Luman, E.T., Breiman, R.F., Njenga, M.K., 2011. Rift Valley fever in Kenya: history of epizootics and identification of vulnerable districts. Epidemiology and Infection 139, 372–80.
National Coordination Agency for Population and Development, Ministry of Planning and National Development, 2005. Ijara District Strategic Plan 2005-2010 for Implementation of the National Population Policy for Sustainable Development. Eds. Robinson Kahuthu, Thomas Muchoki, Catherine Nyaga, HSK Consulting Ltd, Nairobi.
Ndiaye, P.I., Bicout, D.J., Mondet, B., Sabatier, P., 2006. Rainfall triggered dynamics of Aedes mosquito aggressiveness. Journal of Theoretical Biology 243, 222–229.
Neto, P.L., Navarro-Silva, M., 2004. Systematics, morphology and physiology, development, longevity, gonotrophic cycle and oviposition of Aedes albopictus Skuse (Diptera:Culicidae) under cyclic temperatures. Neotropical Entomology 33, 29–33.
Niu, T., Gaff, H.D., Papelis, Y.E., Hartley, D.M., 2012. An epidemiological model of rift valley fever with spatial dynamics. Computational and Mathematical Methods in Medicine 2012, 138757.
Njuguna, J., Mogire, F., Chege, C., 2012. An assessment of malaria curative services in Ijara district, a
remote community in the North-Eastern province of Kenya. Journal of Health Care for the Poor and
Underserved 23, 1020 – 1025.
Noor, A.M., Gething, P.W., Alegana, V.A., Patil, A.P., Hay, S.I., Muchiri, E., Juma, E., Snow, R.W., 2009. The risk of malaria infection in Kenya. BMC Infectious Diseases 9, 180.
Otero, M., Solari, H.G., Schweigmann, N., 2006. A stochastic population dynamics model for Aedes aegypti: formulation and application to a city with temperate climate. Bulletin of Mathematical Biology 68, 1945–1974.
Pant, C. P., Yasuno, M., 1973. Field studies on the gonotrophic cycle of Aedes aegypti in Bangkok, Thailand. Journal of Medical Entomology 10, 219–223.
Pepin, M., Bouloy, M., Bird, B.H., Kemp, A., Paweska, J., 2010. Rift Valley fever virus (Bunyaviridae: Phlebovirus): an update on pathogenesis, molecular epidemiology, vectors, diagnostics and prevention. Veterinary Research 41, 61.
Reisen, W., Milby, M., Meyer, R., Pfuntner, A., Spoehel, J., Hazelrigg, J., Webb, J., 1991. Mark- release-recapture studies with Culex mosquitoes (Diptera: Culicidae) in southern California. Journal of Medical Entomology 28, 357–371.
Rueda, L., Patel, K., Axtell, R., Stinner, R.,1990. Temperature-Dependent Development and Survival Rates of Culex quinquefasciatus and Aedes aegypti (Diptera: Culicidae). Journal of Medical Entomology 27, 892–898.
HEALTHY FUTURES FP7:266327 – D 3.2 RVF/malaria study site analysis and major findings for RVF & malaria transmission
52
Shope, R. E., Peters, C. J. and Davies, F. G., 1982. The spread of Rift Valley fever and approaches to its
control. Bulletin of World Health Organization 60, 299 – 304.
Soumare, P. O., Freire, C. C., Faye, O., Diallo, M., de Olieveira, J.V., Zanotto, P.M., Sall, A. A., 2012.
Phylogeography of rift valley fever virus in Africa reveals multiple introductions in Senegal and
Mauritania. PLoS One 7, e35216
Turell, M.J., Kay, B.H., 1998. Susceptibility of selected strains of Australian mosquitoes (Diptera: Culicidae) to Rift Valley fever virus. Journal of Medical Entomology 35, 132–135.
Woods, C.W., Karpati, A.M., Grein, T., McCarthy, N., Gaturuku, P., Muchiri, E., Dunster, L., Henderson, A., Khan, A.S., Swanepoel, R., Bonmarin, I., Martin, L., Mann, P., Smoak, B.L., Ryan, M., Ksiazek, T.G., Arthur, R.R., Ndikuyeze, A., Agata, N.N., Peters, C.J., 2002. An outbreak of Rift Valley fever in Northeastern Kenya, 1997-98. Emerging Infectious Diseases 8, 138–144.
Worden, J., 2007. Settlement pattern and fragmentation in maasailand: implications for pastoral mobility, drought, vulnerability and wildlife conservation in an East African Savannah. PhD Graduate Degree Program in Ecology. Colorado State University.
Yusoff, N., Budin, H., Ismail, S., 2012. Simulation of Population Dynamics of Aedes aegypti using Climate Dependent Model. World Academy of Science, Engineering and Technology 62, 477–482.