d3 mapping visualization
TRANSCRIPT
Mapping with D3
Sudhir Chowbina @genomegeek
Follow along code !
h9p://bit.ly/1IPr6hj
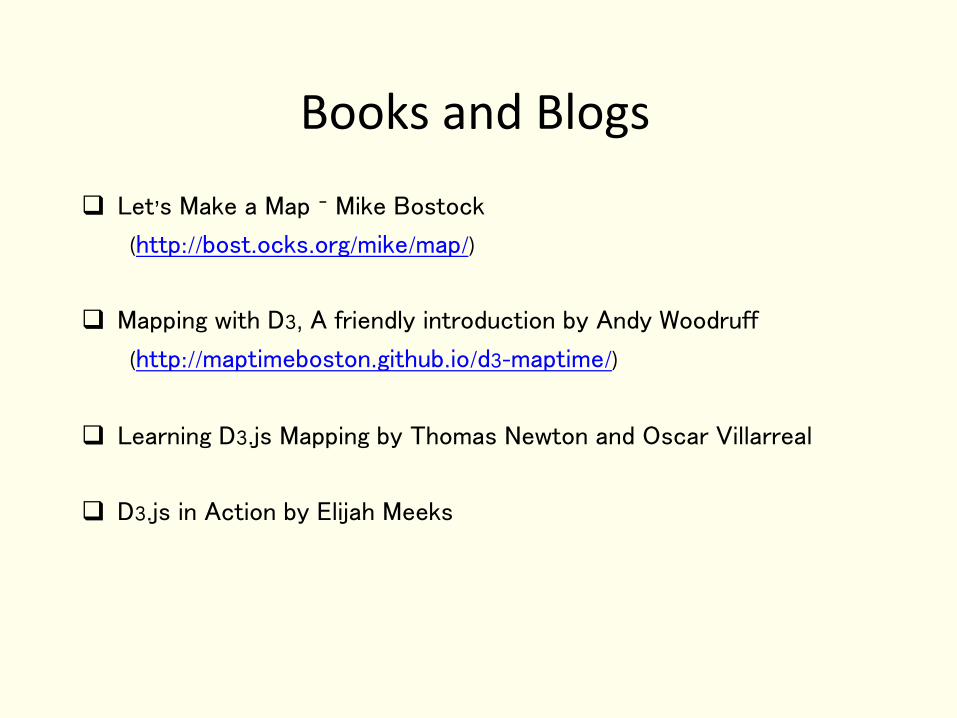
Books and Blogs
q Let’s Make a Map – Mike Bostock (http://bost.ocks.org/mike/map/)
q Mapping with D3, A friendly introduction by Andy Woodruff
(http://maptimeboston.github.io/d3-maptime/)
q Learning D3.js Mapping by Thomas Newton and Oscar Villarreal
q D3.js in Action by Elijah Meeks
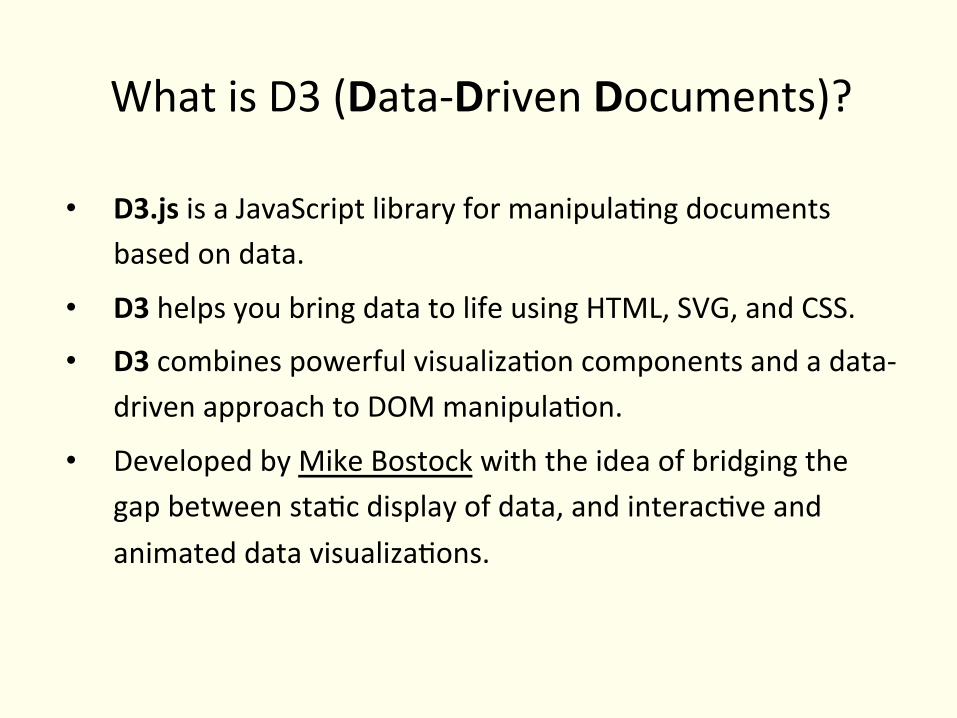
What is D3 (Data-‐Driven Documents)?
• D3.js is a JavaScript library for manipulaOng documents based on data.
• D3 helps you bring data to life using HTML, SVG, and CSS.
• D3 combines powerful visualizaOon components and a data-‐driven approach to DOM manipulaOon.
• Developed by Mike Bostock with the idea of bridging the gap between staOc display of data, and interacOve and animated data visualizaOons.
WHAT DOES THAT MEAN?
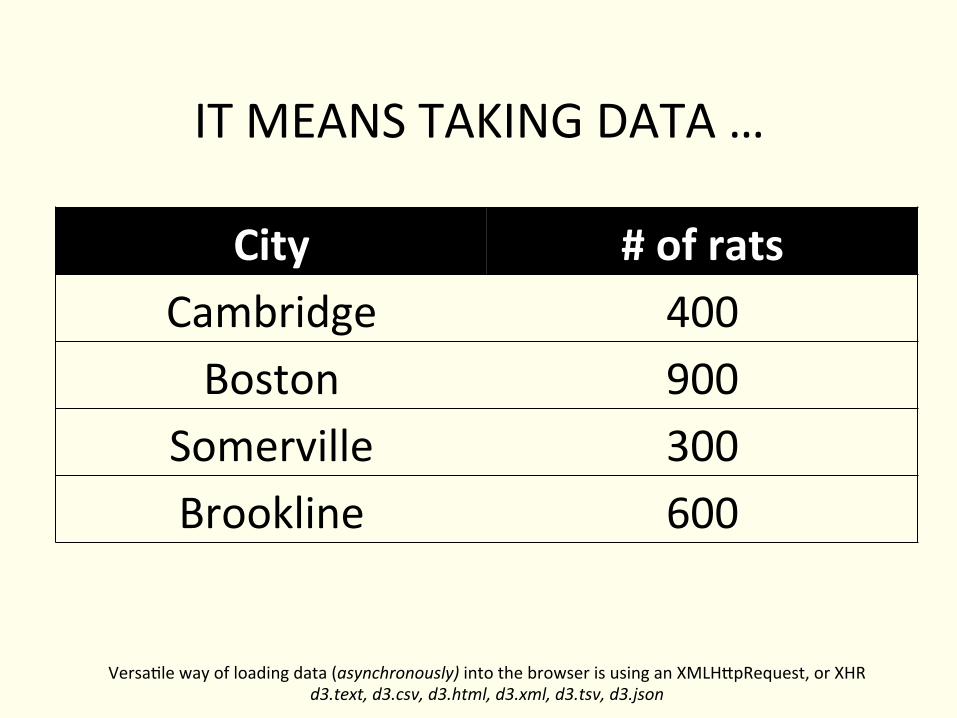
IT MEANS TAKING DATA …
City # of rats Cambridge 400 Boston 900
Somerville 300 Brookline 600
VersaOle way of loading data (asynchronously) into the browser is using an XMLH9pRequest, or XHR d3.text, d3.csv, d3.html, d3.xml, d3.tsv, d3.json

… BINDING TO HTML OR SVG ELEMENTS …
<rect x="0" width="15" fill="#d1c9b8"></rect> <rect x="25" width="15“ fill="#d1c9b8"></rect> <rect x="50" width="15" fill="#d1c9b8"></rect> <rect x="75" width="15" fill="#d1c9b8"></rect>
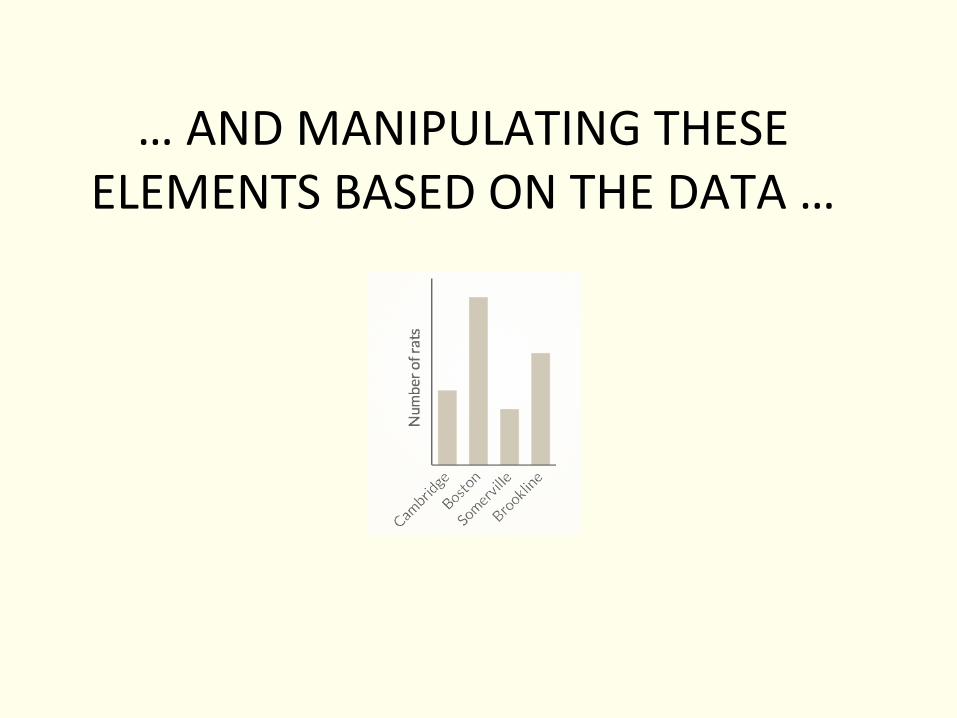
… AND MANIPULATING THESE ELEMENTS BASED ON THE DATA …

Simple. Right?

D3 is Not a Graphical RepresentaOon
D3 is not a magic tool that draws and styles charts, maps, etc. Rather, it provides a means for YOU to create and style web-‐
standard documents based on your data.
It's not about charts, nor maps, nor any parOcular kind of graphic. It is fundamentally about data and web documents.
(But let's sOck to maps for now.)
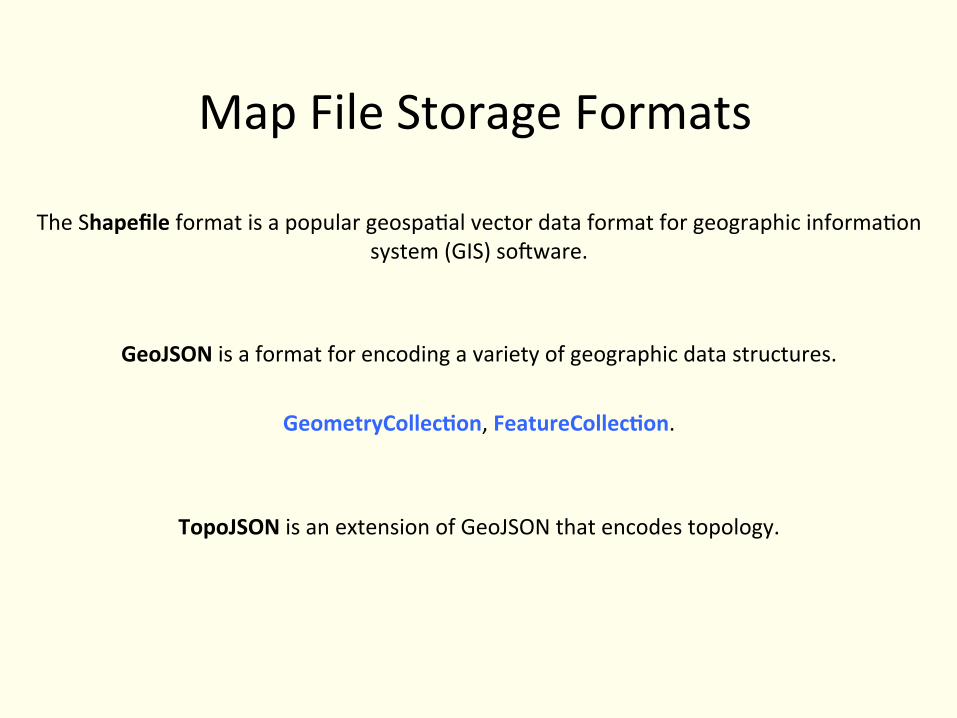
Map File Storage Formats
The Shapefile format is a popular geospaOal vector data format for geographic informaOon system (GIS) sofware.
GeoJSON is a format for encoding a variety of geographic data structures.
GeometryCollec<on, FeatureCollec<on.
TopoJSON is an extension of GeoJSON that encodes topology.
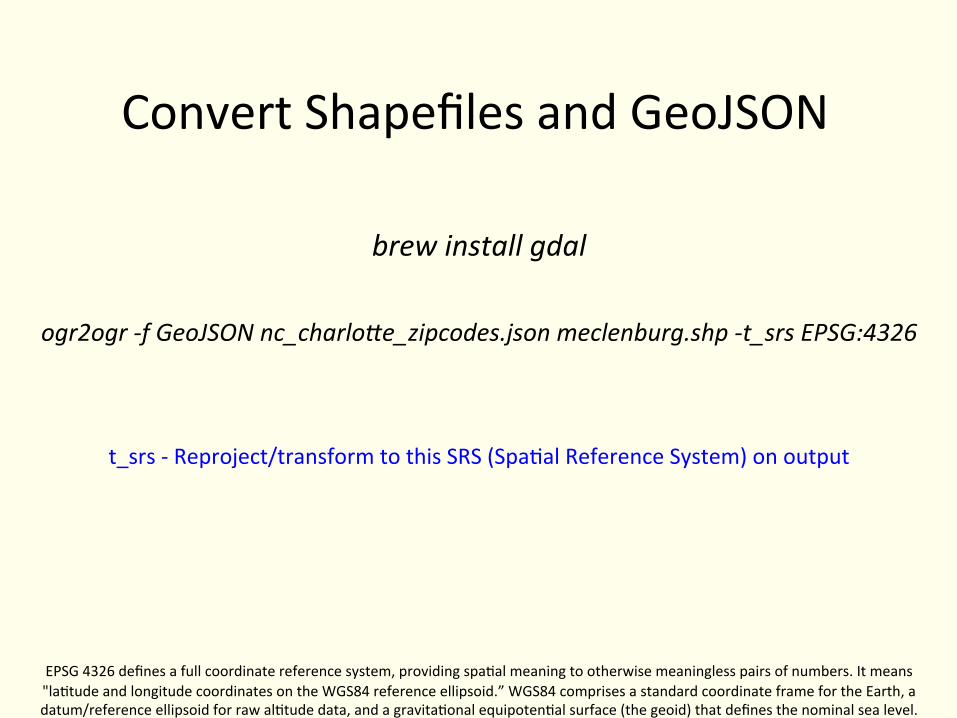
Convert Shapefiles and GeoJSON
brew install gdal
ogr2ogr -‐f GeoJSON nc_charloDe_zipcodes.json meclenburg.shp -‐t_srs EPSG:4326
t_srs -‐ Reproject/transform to this SRS (SpaOal Reference System) on output
EPSG 4326 defines a full coordinate reference system, providing spaOal meaning to otherwise meaningless pairs of numbers. It means "laOtude and longitude coordinates on the WGS84 reference ellipsoid.” WGS84 comprises a standard coordinate frame for the Earth, a datum/reference ellipsoid for raw alOtude data, and a gravitaOonal equipotenOal surface (the geoid) that defines the nominal sea level.

TopoJSON brew install node
npm install -‐g topojson
topojson -‐o topo_nc_zipcode.json -‐-‐id-‐property zipcode
-‐-‐properLes name=zipcode nc_charloDe_zipcodes.json
• Rather than represenOng geometries discretely, geometries in TopoJSON files are sOtched
together from shared line segments called arcs.
• Eliminates redundancy, offering more compact representaOons of geometry than GeoJSON
• 80% smaller than their GeoJSON equivalents.
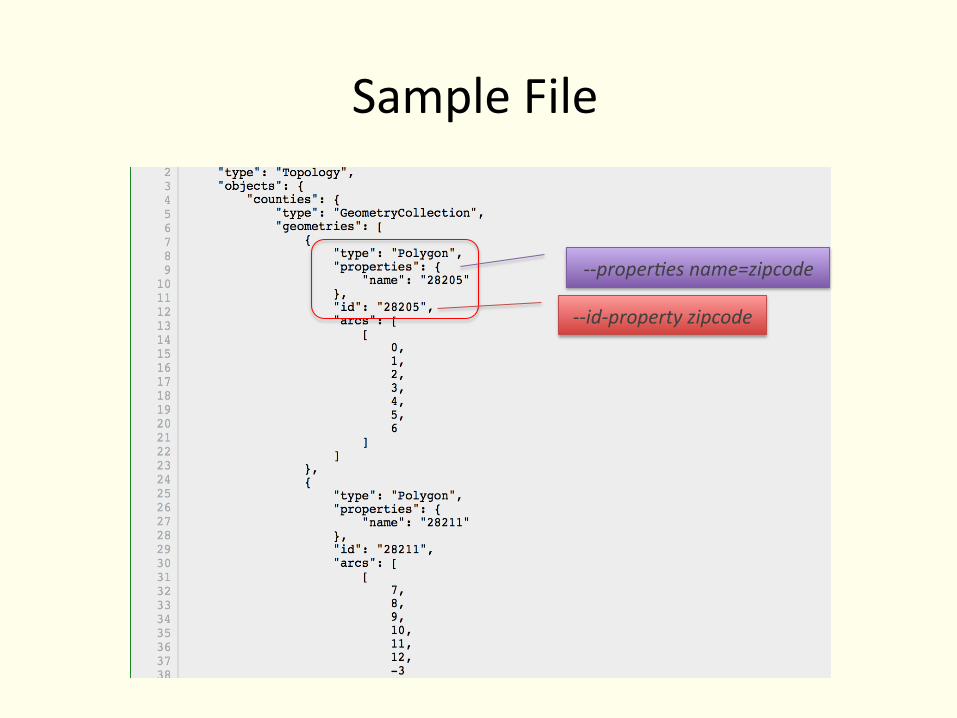
Sample File
-‐-‐properLes name=zipcode
-‐-‐id-‐property zipcode
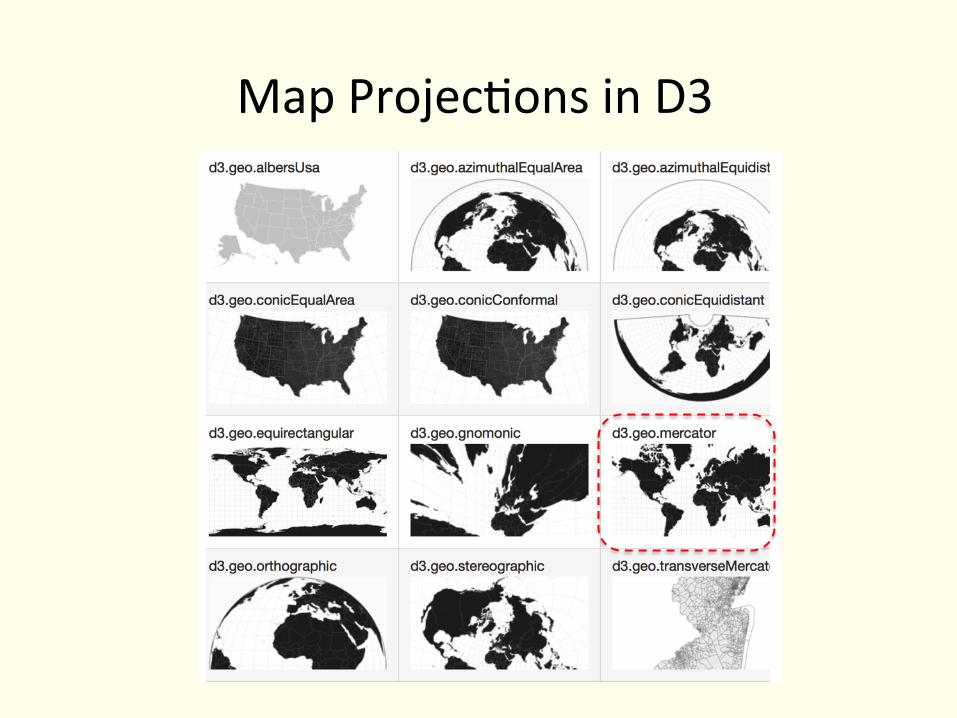
Map ProjecOons in D3
ENOUGH INTRODUCTION.
LET’S MAKE SOMETHING!
Code at: h9p://bit.ly/1IPr6hj
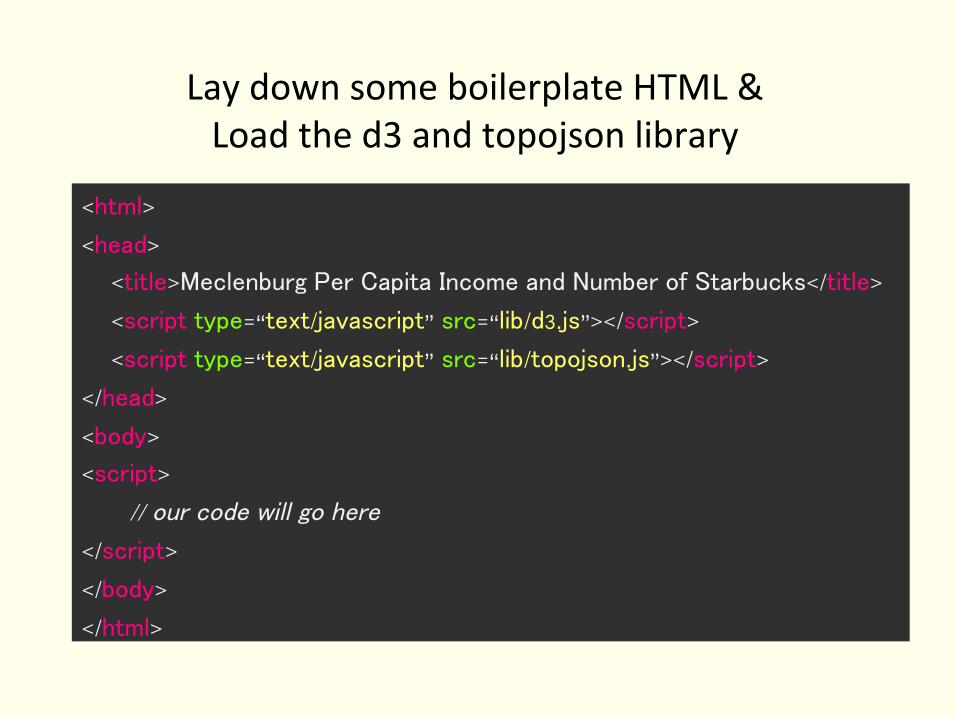
Lay down some boilerplate HTML & Load the d3 and topojson library
<html>
<head>
<title>Meclenburg Per Capita Income and Number of Starbucks</title>
<script type=“text/javascript” src=“lib/d3.js”></script>
<script type=“text/javascript” src=“lib/topojson.js”></script>
</head>
<body>
<script>
// our code will go here
</script>
</body>
</html>
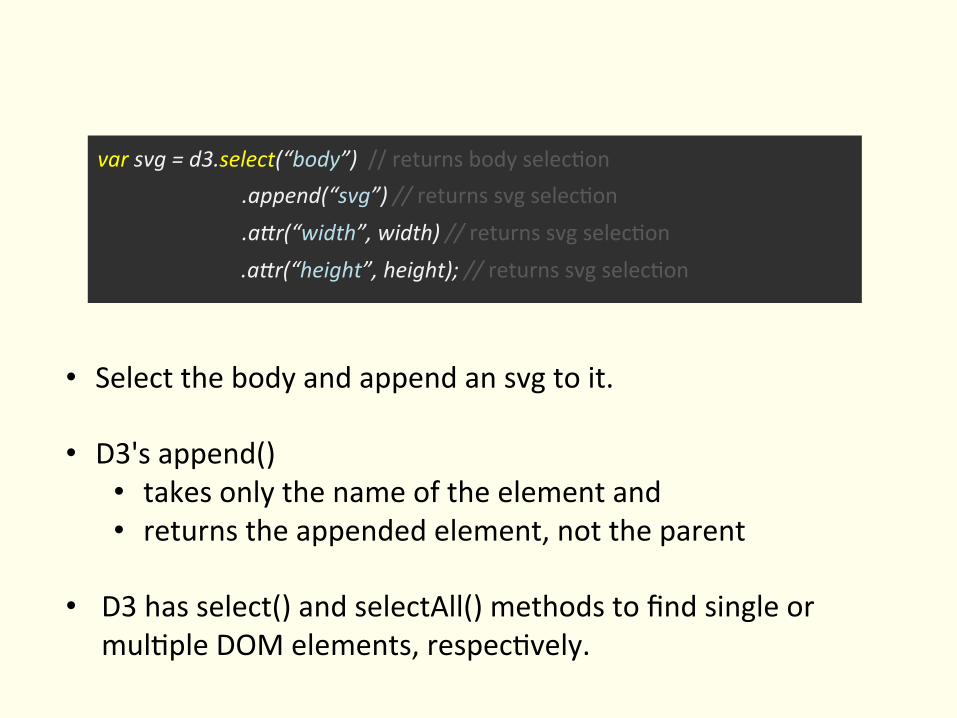
var svg = d3.select(“body”) // returns body selecOon .append(“svg”) // returns svg selecOon
.aDr(“width”, width) // returns svg selecOon .aDr(“height”, height); // returns svg selecOon
• Select the body and append an svg to it.
• D3's append() • takes only the name of the element and • returns the appended element, not the parent
• D3 has select() and selectAll() methods to find single or mulOple DOM elements, respecOvely.
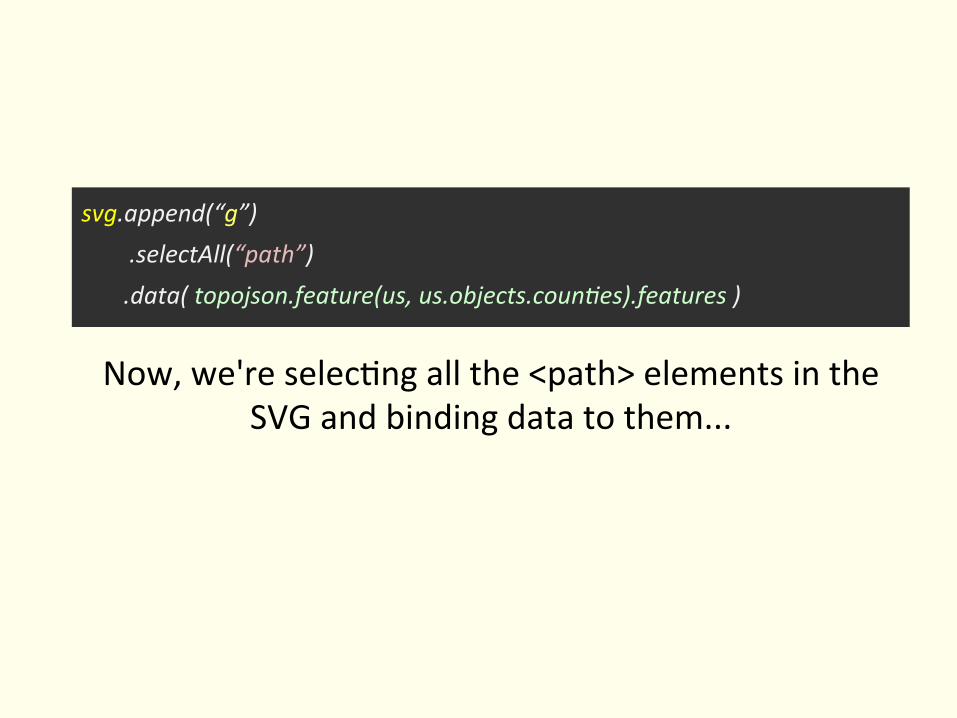
svg.append(“g”) .selectAll(“path”)
.data( topojson.feature(us, us.objects.counLes).features ) Now, we're selecOng all the <path> elements in the
SVG and binding data to them...

WAIT !! PATH DOES NOT EXISTS !
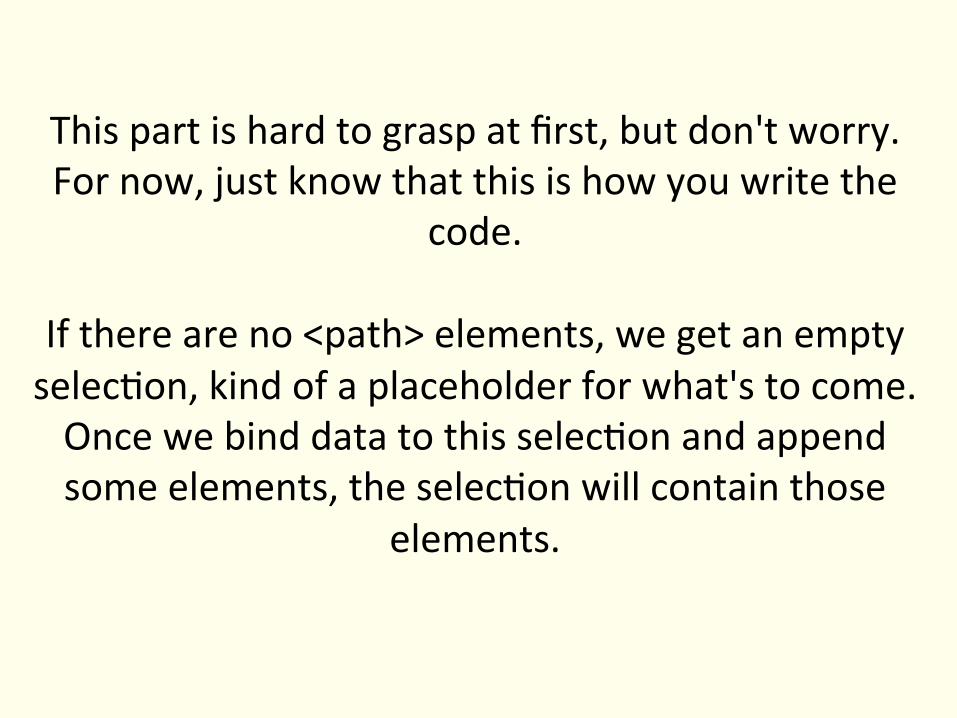
This part is hard to grasp at first, but don't worry. For now, just know that this is how you write the
code.
If there are no <path> elements, we get an empty selecOon, kind of a placeholder for what's to come. Once we bind data to this selecOon and append some elements, the selecOon will contain those
elements.

svg.append(“g”) .selectAll(“path”) .data( topojson.feature(us, us.objects.counLes).features ) .enter()
.append(“path”)
This is the basic syntax for creaOng new elements to match a data array.
enter() refers to new incoming data for which there is not yet an exisOng <path>. For each incoming data
value, we're appending a <path> element.
SVG path element is the generic element to define a shape. All basic shapes can be created with a path element

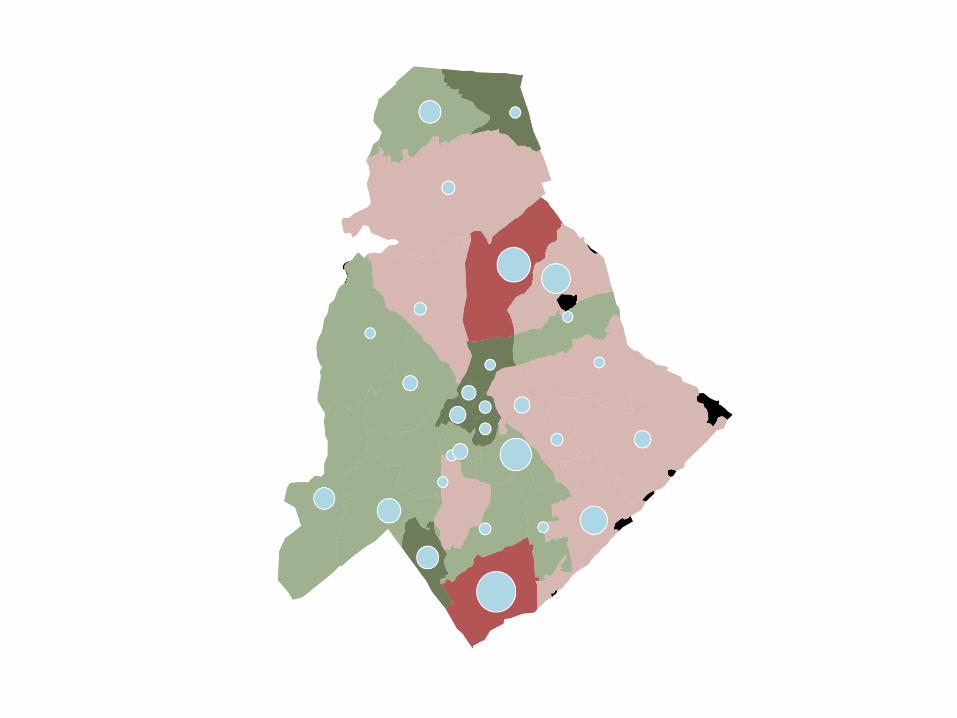
CSV with Income and #Starbucks per Zipcode

Loop over two data files d3.json("data/topo_nc_zipcode.json", funcLon (error, us) {
// Create a Path Generator FuncLon // Collect the outer bound projecLon parameters and zoom to the county
d3.csv('data/nc_city_zip_rand.csv', funcLon(zips) {
// For each zip-‐code collect the income // Create a ‘path’ for each Zip // Color the zip code by income value
});
});
Path Generators
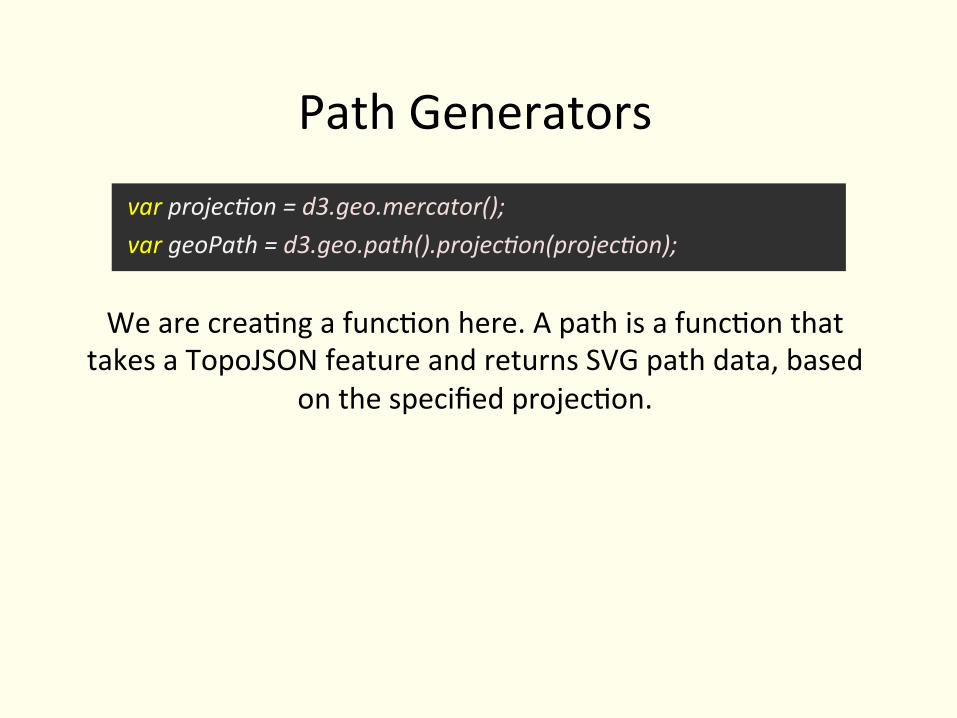
var projecLon = d3.geo.mercator(); var geoPath = d3.geo.path().projecLon(projecLon);
We are creaOng a funcOon here. A path is a funcOon that takes a TopoJSON feature and returns SVG path data, based
on the specified projecOon.

svg.append(“g”) .selectAll(“path”) .data( topojson.feature(us, us.objects.counLes).features ) .enter()
.append(“path”)
.aDr("d", geoPath)
Specify where to project the path
In SVG Land d is an a9ribute that defines the coordinates of a path.
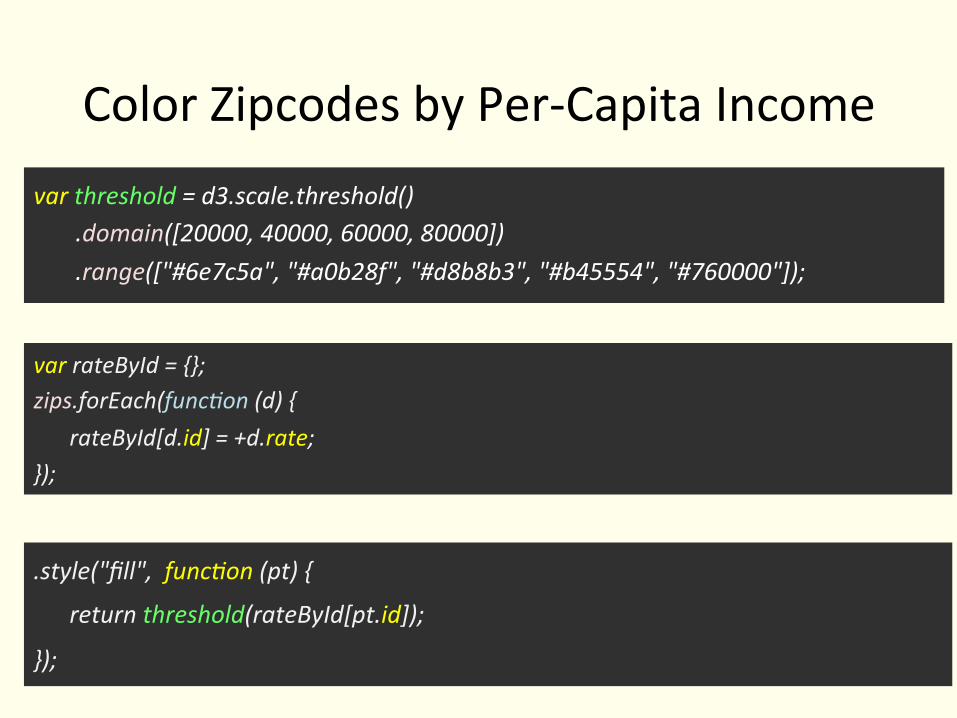
Color Zipcodes by Per-‐Capita Income var threshold = d3.scale.threshold()
.domain([20000, 40000, 60000, 80000]) .range(["#6e7c5a", "#a0b28f", "#d8b8b3", "#b45554", "#760000"]);
var rateById = {}; zips.forEach(funcLon (d) {
rateById[d.id] = +d.rate; });
.style("fill", funcLon (pt) {
return threshold(rateById[pt.id]);
});
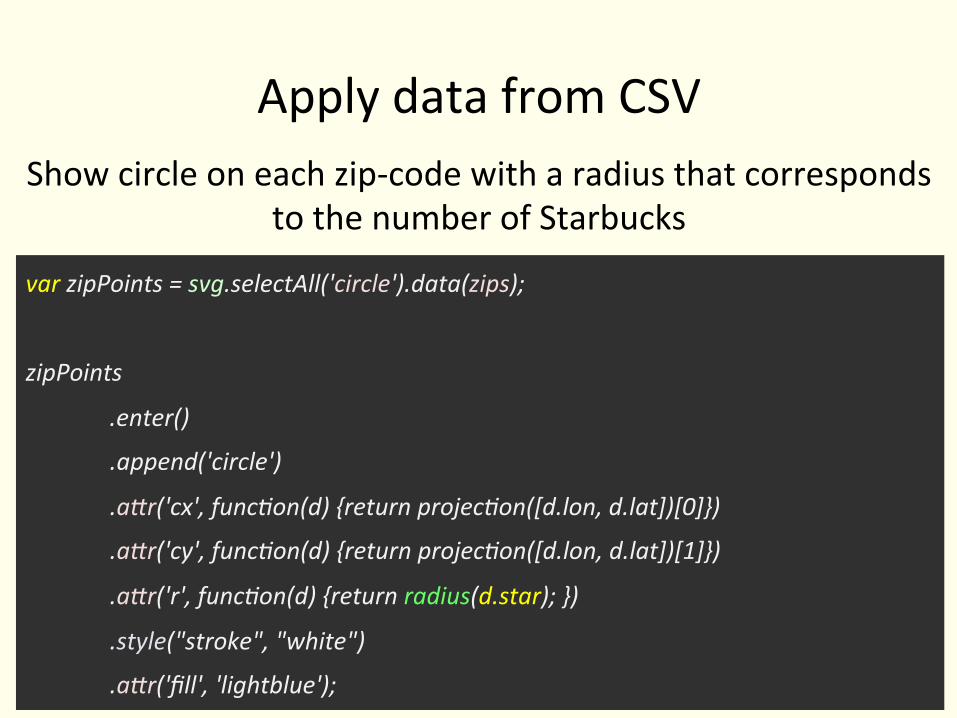
Apply data from CSV
var zipPoints = svg.selectAll('circle').data(zips);
zipPoints
.enter()
.append('circle')
.aDr('cx', funcLon(d) {return projecLon([d.lon, d.lat])[0]})
.aDr('cy', funcLon(d) {return projecLon([d.lon, d.lat])[1]})
.aDr('r', funcLon(d) {return radius(d.star); })
.style("stroke", "white")
.aDr('fill', 'lightblue');
Show circle on each zip-‐code with a radius that corresponds to the number of Starbucks
Extras
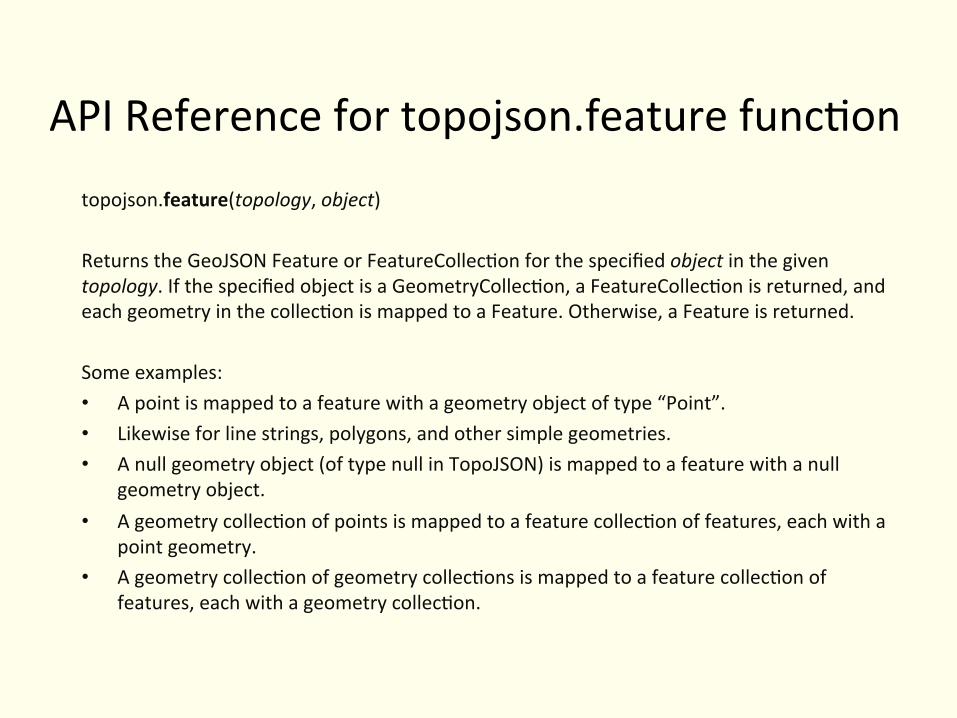
API Reference for topojson.feature funcOon topojson.feature(topology, object) Returns the GeoJSON Feature or FeatureCollecOon for the specified object in the given topology. If the specified object is a GeometryCollecOon, a FeatureCollecOon is returned, and each geometry in the collecOon is mapped to a Feature. Otherwise, a Feature is returned. Some examples: • A point is mapped to a feature with a geometry object of type “Point”. • Likewise for line strings, polygons, and other simple geometries. • A null geometry object (of type null in TopoJSON) is mapped to a feature with a null
geometry object. • A geometry collecOon of points is mapped to a feature collecOon of features, each with a
point geometry. • A geometry collecOon of geometry collecOons is mapped to a feature collecOon of
features, each with a geometry collecOon.
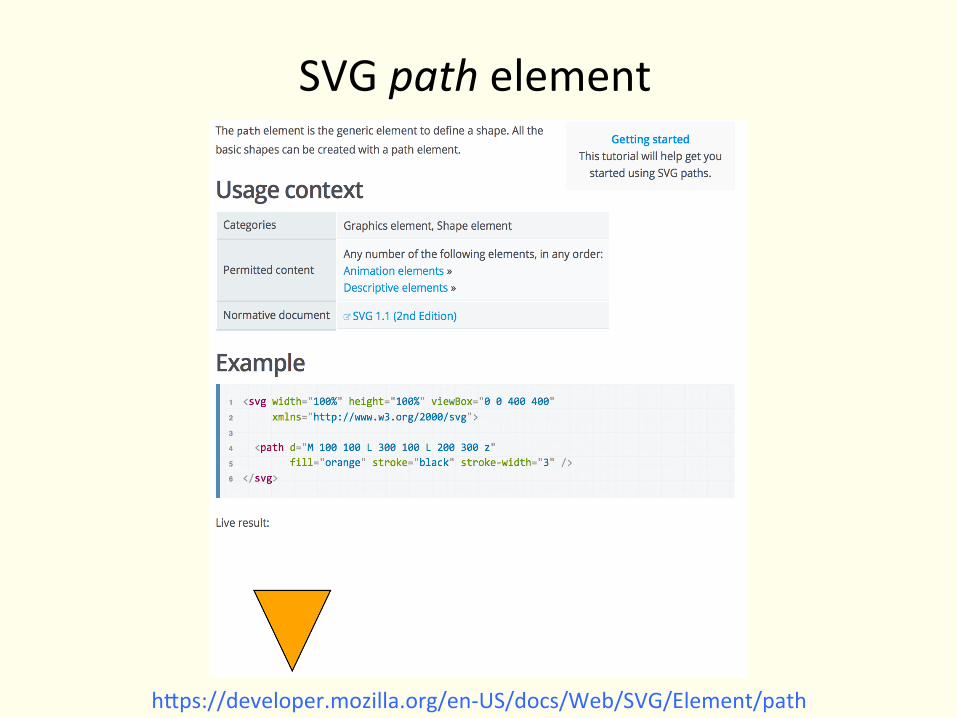
SVG path element
h9ps://developer.mozilla.org/en-‐US/docs/Web/SVG/Element/path
D3 ProjecOon Methods
h9ps://github.com/mbostock/d3/wiki/Geo-‐ProjecOons
# projecOon.center([locaLon]) If locaLon is specified, sets the projecOon’s center to the specified locaLon, a two-‐element array of longitude and laOtude in degrees and returns the projecOon. If center is not specified, returns the current center which defaults to ⟨0°,0°⟩. # projecOon.translate([point]) If point is specified, sets the projecOon’s translaOon offset to the specified two-‐element array [x, y] and returns the projecOon. If point is not specified, returns the current translaOon offset which defaults to [480, 250]. The translaOon offset determines the pixel coordinates of the projecOon’s center. The default translaOon offset places ⟨0°,0°⟩ at the center of a 960×500 area. # projecOon.scale([scale]) If scale is specified, sets the projecOon’s scale factor to the specified value and returns the projecOon. If scale is not specified, returns the current scale factor which defaults to 150. The scale factor corresponds linearly to the distance between projected points. However, scale factors are not consistent across projecOons.

ProjecOon Scale and Translate
var states = topojson.feature(us, us.objects.counLes); var b, s, t; projecLon.scale(1).translate([0, 0]); var b = geoPath.bounds(states); // zoom to the county var s = .9 / Math.max((b[1][0] -‐ b[0][0]) / width, (b[1][1] -‐ b[0][1]) / height); var t = [(width -‐ s * (b[1][0] + b[0][0])) / 2, (height -‐ s * (b[1][1] + b[0][1])) / 2]; projecLon.scale(s).translate(t);