d12g pm from the second annual meeting - novac-project.eu from the second annual meeting.pdf3 agenda...
TRANSCRIPT

NOVAC
Network for Observation of Volcanic and Atmospheric Change
Specific Targeted Research Project: Sub-Priority 1.1.6.3 Global Change and Eco-systems IV.1 Natural Disasters IV.1.2 Volcanic risk assessment Project No: 18354
Deliverable 1.2.g
PM from the second annual meeting
2009-05-25

1
NOVAC SECOND ANNUAL MEETING Manizales, Colombia
29th October – 2nd November 2007

2
Participants:Participants:Participants:Participants: Patricia Ponce INGEOMINAS
Bety Silva INGEOMINAS
Ulrich Platt UHEI
Christoph Kern UHEI
Leif Vogel UHEI
Vladimir Conde UES
Rodolfo Olmos UES
Bo Galle CHALMERS
Gustavo Garzon INGEOMINAS
Eliecer Duarte OVSICORI
Giussepe Salerno INGV
Ligdamis Gutierrez INETER
Cristian Santacoloma INGEOMINAS
John Makario Londoño INGEOMINAS
Amparo Coral INGEOMINAS
Ricardo Mendez INGEOMINAS
Leonardo Fabio Arias INGEOMINAS
Cesar Vega INGEOMINAS
Santiago Arellano IGEPN
Silvana Hidalgo IGEPN
Freddy Vasconez IGEPN
Francisco Montalvo SNET
Gaia Pinardi BIRA
Sofia Navarro INGEOMINAS
Martha Calvache INGEOMINAS
Zoraida Chacón INGEOMINAS
Claudia Rivera CHALMERS

3
Agenda for the Second Annual NOVAC Meeting, Manizales, Colombia 29 October – 2 November
Monday 29 October Time Activity Remark Person in charge 9.00-9.30 Welcome Ricardo Méndez,
Bo, Gustavo and Martha Calvache
9.30 – 10.00 Agenda of the meeting, practical details
Bo and Gustavo
10.00 – 10.30 Volcanic risk assessment in Colombia
Martha Calvache INGEOMINAS
10.30 – 12.00 Scientific reports by partners
Each group should prepare a 15-20 min. presentation of their activities during the past year
All partners
12.00 – 13.00 Lunch 13.00 – 15.00 Scientific reports by
partners
15.00 – 15.30 Coffee break Special reports
NOVAC Instrument ver.II
UHEI
The NOVAC Database
UHEI
BIRA Spectrometer characterization
BIRA
15.30 – 18.00
Contributions are welcome. Contact Bo and Gustavo, give title and duration
19.00 - Dinner
Tuesday 30 October Time Activity Remark Person in charge
Administrative issues Annual Reports Revised time schedule Prolongation? Revised deliverables and milestones
Prolongation?
Equipment budget status Installation plan
9.00-10.30
Meetings IAVCEI gas
Bo

4
workshop, IAVCEI general assembly, 3rd Annual meeting AGU
10.30 – 11.20 NOVAC Instrument version II
UHEI Christoph
11.20 – 11.40 Monitoring of SO2 from satellite: the Support of Aviation Control Service of PROMOTE and the role in NOVAC
BIRA Gaia
11.50 – 12.00 New possible spectrometers
UHEI Ulrich Platt
12.00 – 13.00 Lunch 14.00 – 14.20 Report of volcanic
monitoring from UES UES Rodolpho
14.20 – 14.30 How to model volcanic activity using gas data
INGEOMINAS John Londoño
13.00 – 14.00 Experience from installed NOVAC instruments
All partners who have NOVAC stations should give a report; Statistics (scans/day), hardware/software problems, training needs.
IGEPN, UNAM, INETER, SNET, INGEOMINAS, OVG, IPGP, INGV
14.00 – 15.00 Actions for improvement New hard- and software, modelled wind, training?
Chalmers, UHEI, BIRA
15.00 – 15.30 Coffee break
Special reports, other topics Flux error discussion Chalmers, UHEI,
BIRA…… UV Scanner DOAS data retrieved using a modeled reference spectrum
Giuseppe Salerno
Contributions are welcome. Contact Bo and Gustavo, give title and duration
15.30 – 18.00
Flux errors connected with radiative transfer and recommendation on how to flag data
UHEI
19.00 - Dinner

5
Wednesday 31 November Time Activity Remark Person in charge 9.00 – 10.00 Flux calculation
overview Bo, Claudia
10.00 – 11.00 Data quality flagging?
Chalmers, UHEI, BIRA….
11.00 – 12.00 Examples of flux calculations
Claudia
12.00 – 13.00 Lunch 13.00 – 16.00 Training on flux
evaluation All partners who have NOVAC stations should bring data.
Claudia, Christoph
16.00 – 16.30 Coffee break Prolongation 1 year 5% of equipment for met. modeling 10% of equipment for travel and installation AGU 2008 Next Annual Meeting
Bo
Instrument status protocol
Santiago
Conference dinner Gustavo
Decisions
Agenda 2 Nov. Bo and Gustavo
16.30 – 17.30
Steering Committee meeting
Bo, Ulrich
18.00 – 19.00 Dinner 19.00 – 21.00 Tour of Manizales INGEOMINAS
Thursday 1 November Time Activity Remark Person in charge
Field trip to Nevado del Ruiz
Gustavo 9.00 – 19.00
Administrative problems helpdesk
If needed Bo
20.00 - Conference Dinner Gustavo
Friday 2 November Time Activity Remark Person in charge
Field work at Nevado del Ruiz
Gustavo 9.00 – 19.00
Administrative problems helpdesk
If needed Bo
20.00 - Dinner

6
29292929thththth October October October October 2007 2007 2007 2007 The meeting starts at 9:22. Bo welcomes everyone to the Second Annual Meeting. Ricardo
Mendez (Coordinator of Vulcanological Observatory in Manizales), representing the General
Director of INGEOMINAS welcomes everyone to the meeting. He explains that the Subdirector
of INGEOMINAS, Martha Calvache, will arrive later to the meeting. All the participants then
present themselves.
Practical details about arrangements are then discussed by Gustavo Garzon, meteorological
conditions at Nevado del Ruiz, lunch and coffee breaks. The preliminary agenda is discussed:
scientific reports, administrative issues, organization for everyday dinner, flux error
discussions, training on flux calculation and evaluation and finally field work days. The
importance of scientific and annual reports is then stressed and during the meeting, time will
be allocated to discuss them.
10:15 – 10:40 Coffee Break
At 10:40 Bo starts with Chalmers scientific report presentation. The working group is
presented and the main activities of the group during last year. Some scientific management
activities done last year were: Mobile DOAS training in Nicaragua, arrangement of NOVAC
training and seminars in Nicaragua, arrangement of 2 spectroscopy and 2 instrument meetings
and the submission of a proposal for a “Marie Curie Training Network” linked to NOVAC. Also
administrative activities and dissemination of results activities were presented. Instruments
have been continuously improved: observatory software (wind-speed, plume height),
electronic board, software for real time monitoring of data via Chalmers FTP-server.
Also 26 instruments were built, calibrated and tested. There are already installed instruments
at: San Cristobal (3), Masaya (2), Tungurahua (2), Popocatepetl (3), Nyiragongo (3), Piton de la
Fournaise (3) and under installation: Cotopaxi (1), Galeras (1), Tungurahua (1), Colima (2),
Nyamulagira (1) and Etna (2).
Improvements on internet and network were also done: software to facilitate downloading of
data in the field, improved observatory (instrument communication), successful implementation
using FTP at Piton de la Fournaise, Reunion Island.
10:55 Francisco Montalvo, Gaia Pinardi, Sofia Navarro and Martha Calvache present
themselves.
At 11:05 Eliecer from OVSICORI gives his scientific report presentation. Eliecer explains the
work of OVSICORI, normally they work with 5 volcanoes, but recently Turrialba volcano has
been very active. An explanation of Turrialba´s damaged vegetation due to gases volcano is
made. Burned vegetation around Turrialba is shown. Regular pictures have been taken to see
the impact of gases on vegetation over time. A schematic representation of how the plume
develops is then explained. Turrialba´s latest activity was 140 years ago, the population is
worrying about the activity. Rapid increase of temperature and release of gases is also
present. Also fractures have been developed and new fumarolic activity. The impact of
vegetation is worsening and is spreading around the volcano. Grass for livestock is being

7
affected, there is concern since many people depend on livestock for survival. Fauna has been
killed due to gases (domestic and wildlife). Seismic activity has also been increasing.
Furmaroles temperature have increased from 90 to 137 degrees. Flux measurements using
mini-DOAS have been made. During 2002, measured fluxes were of 1 t/day, but during 2007
fluxes have been quantified between 65-100 ton/day.
At 11:30 Gustavo Garzon from INGEOMINAS gives his scientific report presentation. During
the past year, work on dissemination of results, exploitation of data for local volcanology,
local impact of gas emissions, implementation of risk assessment and work on satellite
validation has been made. A presentation about NOVAC was made during November 2006 at
the Geophysics Institute of Panama. Also during August 2007, the NOVAC project was
presented at XI Colombian Geological Congress in Bucaramanga, Colombia. A scientific paper
is also in preparation.
Three UV Scan DOAS systems were installed recently (October 2007) at Galeras volcano.
Mobile-DOAS measurements have been made at Nevado del Huila, Galeras, Purace, Cerro
Machin, Nevado del Ruiz and Cumbal. Presently the most active volcanoes are Nevado del
Huila and Galeras.
An explanation about the volcanological monitoring in Colombia is then made. Nevado del
Huila volcano has been recently very active, emissions using Mobile DOAS have been reported
as 11363 ton/day (April 11th, 2007), 13650 ton/day (April 24th, 2007). In June 1st, 2007 early in
the morning emissions were down to 3076 ton/day (helicopter); the same day at mid day the
emissions were about 3391 ton/day (car).
At Nevado del Ruiz, 370 ton/day were measured using MobileDOAS during June 26th, 2007.
A graph showing SO2 emissions (MobileDOAS) and Long-Period released energy of Nevado
del Huila volcano was then presented. Statistics of contribution of SO2 emissions to the
atmosphere of Colombian volcanoes is then presented. Nevado del Huila has increased its
background emissions (600-2500 ton/day) up to max 13,000 ton/day. Galeras has increased
from background emsissions (600 ton/day) to 1,600 ton/day).
At 11:45 Ligdamis Gutierrez gives INETER scientific report presentation. He explains the
installations that have been made at Masaya. Both Caracol and Nancital stations are presented
as well as some example of data from the stations and flux calculations. Then San Cristobal
installations are presented, as well as some examples of downloaded data from the
instruments and flux evaluations. San Cristobal´s network is then explained as well as
Masaya´s network and freewave radios configuration of Masaya and San Cristobal. The
designs of both Masaya´s and San Cristobal´s installations are then presented. A discussion
about the problem of obtaining a complete plume at Masaya was discussed. Also data
transmission problems were discussed. Bo explains that a new program has been made to
download data from the instruments using ftp in a quicker way.
12:00 – 13:40 Lunch
At 13:40 Martha Calvache gives a presentation about the Activity at Galeras and Nevado del
Huila Volcanoes: evaluation and disaster prevention. Volcanic unrest at Galeras and Nevado
del Huila volcanoes is addressed. INGEOMINAS is the Colombian institute of Geology and

8
Mining, it comprises three observatories: Pasto, Manizales and Popayan. For volcanic hazard
evaluation purposes, characterization of the hazards is needed. Historic and recent activity at
Galeras is then presented as well as the volcanic hazard map. The main concern is the people
leaving near the volcano, even when the volcano does not present severe eruptions.
A geological map of Nevado del Huila volcano is then presented, at the south part, flank
collapses are likable. The hazard map of Nevado del Huila is also presented as well as the
monitoring network and monitoring instruments. A thermal camera is also used both at Galeras
and Nevado del Huila volcanoes as well as SO2 monitoring equipment.
The activity of Galeras is then presented in a graph: long period seismic activity, volcano-
tectonic activity, etc., are shown between 1st January 2004 – July 2007.
Nevado del Huila activity (february-july 2007) is then presented: the volcano was generally
very quiet and in a period of two days the volcano tectonic activity increased (19th February
2007). Seismic signals on February 18-19th 2007 were presented showing the increase in
activity of the volcano from February 18th to February 19th.
In order to prevent disasters, several activities were carried out:
a) Community communication: in Galeras there is big scepticism on the activity of the
volcano; on the other hand in Nevado del Huila there is good organization and there is
acceptance of the danger of the volcano.
b) Inter-institutional work: difficult since there are different points of view, it is difficult
that institutes work together.
c) Drill (June 18th, 2005) in Galeras
d) Work with indigenous community
e) Shelters to accommodate the community in case of evacuation
f) Visit to Tungurahua volcano, Ecuador helped to change the perception of people from
Galeras about a volcanic eruption
Early warning and alerts for Galeras volcano has been seismic activity, however during the
latest activity period this was not the case.
For Nevado del Huila, a small swarm was detected on April 17th 2007 and this was informed to
the community. During night time the seismic activity continued and a second communication
bulletin was released. Early in the morning on April 18th the eruption took place.
The accomplishment of Nevado del Huila crisis: 0 fatalities, 0 injured people, 0 missing
people, 16 destroyed bridges; at 80 km of the volcano, down the river about a flow of 130
m3/sec to 1300 m3/sec. At 150 km from the volcano, around 10 millions m3 of water arrived;
indicating big lahar descending from the volcano.
Finally the people working in each observatory were mentioned as well as joint projects with
different organizations.
At 14:15 Francisco Montalvo from SNET presented their scientific report. San Miguel volcano
presents now increased seismic activity, small changes of fumaroles are reported. In October
2006 the seismic activity of San Miguel started to increase as well as SO2 flux from the
volcano.

9
In march 2007, Santa Ana volcano had a new volcanic crisis. The different stages of Santa Ana
lake were presented, the lake finally disappeared but the seismic activity did not increase
much.
Presently the motor of the scanner is broken and SO2 measurements can only be made using
mobile instruments.
At 14:25 Silvana Hidalgo presents the activity report during the second year for IGEPN. The
main topics covered are installations, problems, implementation of NOVAC system in local
monitoring activities and plan for the next year.
At Tungurahua three instruments (two single and 1 double) have been installed: Huayrapata
hill, Bayushing town and Pillate town. Huayrapata station has a direct link to OVT, Bayushing
station needs 1 repeater to OVT, Pillate station also needs 1 repeater to OVT (Huayrapata).
For Cotopaxi station one site has been prepared.
The problems IGEPN has had:
Volatile memory on the electronic unit: the cfg.txt configuration file was removed of the unit.
Data archiving
Problems with time acquisition using GPS
Minor problems with internal routines of the NOVAC program
There are also administrative problems regarding money transfer.
The activities of the observatory are: Re-evaluation of fluxes (wind information obtained from
satellite or local airports). Statistical analysis with software developed in the IGEPN. Results
are reported and compared with other gas measurements.
Plan for next year: finish installations at Cotopaxi, improve flux evaluation with better
constrained wind information.
At 14:35 Bo Galle explains about installations at Nyiragongo in July 2007. There have been
problems of data transmission. Additionally because of political unrest the instruments have
been taken down.
In 2004 a scanning instrument was installed at Rusayo station, it has been running with few
interruptions. Two additional systems were installed in July 2007: Sake, Kunene. In addition
Rusayo instrument has been upgraded. Both Rusayo and Kunene have a direct link to OVG.
Sake station needs a repeater (Buzi) which happens to be a good site for instrument
installation, in the future a system will be installed in this site. The combination of data from
Rusayo and Buzi stations can be a good possibility to study plume chemistry.
In Nyamulagira is military impossible to install instruments at the moment. Discussions are still
going on about the decision of whether install more instruments at Nyiragongo.
The installations at Rusayo, Sake and Kunene are shown: mainly a big pole where the scanner
is and all electronics and instruments inside a box either inside or outside stations.

10
At 14:50 Claudia Rivera presents UNAM scientific report presentation. The main topics
covered were the installations of three stations at Popocatepetl volcano. The three stations
were presented and the installations explained. Some issues related to data transfer were
discussed.
At 15:05 Christoph Kern presents UHEI scientific report. A study on data evaluation and error
estimation was made.
Test installations of NOVAC version II instruments at Stromboli volcano in March 2007 were
made. At Stromboli two instruments were installed, some data from this two installed
instruments was presented.
An intensive campaign including active DOAS measurements at Masaya volcano in Nicaragua
was also made. Installation of NOVAC version I instruments at Masaya, Mobile-scanning
instruments (version II) were also done. Long path instrumentation was used in Masaya, an
explanation about the system and data from this field campaign was presented.
Satellite evaluations of SO2 from Nyamuragira volcano (using SCHIAMACHY data) were also
presented.
The project of a construction of an “SO2 camera” was also explained, the objective was to
image SO2 column densities in volcanic plumes. The first measurements using this “SO2
camera” were presented.
At 15:30 Bo Galle presents the installations performed at Reunion Island (Piton de la
Fournaise) in September 2007. Piton de la Fournaise is not erupting at the moment. Last
eruption of the volcano was during April 2007. Normally winds come from East. Three stations
were installed west of the crater: Piton Partago, Enclos0 and Piton de Bert. The objective with
the installation setting was to cover most of wind directions. In this volcano the problem of
incomplete plume could be faced, just as in Masaya case. Some pictures of the installation
sites were showed. Heavy rain is common at Piton de la Fournaise. Upon arrival to the
volcano, the infrastructure for installations was already prepared, including a WiFi network.
Because of this the installations did not take much time and the three systems could be
installed in less than 2 weeks.
At 15:45 Cristian Santacoloma from Popayan´s Volcanological Observatory gave a
presentation about Nevado del Huila volcano activity. A description of surveillance stations at
Nevado del Huila volcano were shown (mudflow monitoring network). The accumulated
released energy by Nevado del Huila volcano between January-October 2007 was presented
as well as the seismic activity. The number of events had two peaks: one on February 19th and
a second in April 18th 2007. In addition El Oso glacier lost some of its mass. Some statistics of
the activity of the volcano were also presented as well as thermal images of the volcano on
April 30th and AURA-OMI Satellite images of the eruption.
16:05 – 16:45 Coffee Break
At 16:45 everyone is back. Coffee breaks, lunch and dinner were then discussed.

11
Leif Vogel continues presenting the NOVAC Database (16:55). Presently the NOVAC database
contains scans and spectra from 5 volcanoes but lot of more data is expected so high
performance of the database is needed. Data will be automatically imported from the ftp-
server in Chalmers: raw data (pak files) and processed data (logfiles) are expected, both types
of files are stored locally and re-stored matching the measurement date.
There are three search-levels in the database: scans, spectra and scans & spectra. There will
be multiple options for searching, sorting and viewing. Everything is downloadable from the
database. Presently data from 5 volcanoes has been downloaded.
The final database server is installed at Heidelberg and is at the final stage of configuration.
The next step is performance optimization; it will be completed by 01/01/2008. It is needed to
test the database so everyone is encouraged to apply for an account and start to download
data.
The server hardware and software details and costs were then explained. The server is
FUJITZU SIEMENS PRIMERGY RX300S2 and it has uninterruptible power supply. The final
configuration will be completed by end of the year.
The NOVAC database server website is: novac.iup.uni-heidelberg.de, for any questions
contact Thomas Lehmann ([email protected]). The database was then
accessed and the use was explained. The question of the location of postfluxevaluation-log
file is raised as well as dynamic queries.
Gaia Pinardi (17:25) continues presenting the characterization of S2000 and SD2000
spectrometers at BIRA-IASB. Large variability from one instrument to the other was found.
Stray-light is unavoidable in single grating spectrometers and can be a significant source or
error/incertitude for optical absorption measurements, especially in the UV range. It can be
handled by hardware or software. At BIRA spectral stray-light was measured in different
spectrometers and corrected for. Stray-light correction was difficult for S2000 spectrometers
because of their limited dynamical range (4096 counts). The advantage of the stray-light
method technique is the characterization of the error done when considering a constant offset
over the whole detector range. The error on stray-light contribution was accounted from 1.5%
to 4% (for the shown example).
Also temperature effects were accounted for both S2000 and SD2000 spectrometers. The
temperature range was 6.8 to 40 degrees. The effect of temperature varies among
spectrometers (large differences were found). Variation of temperature was also found to
induce slit changes, shift variation as well as resolution variation. The electronic offset also
needs to be adjusted because it changes with temperature.
In conclusion: regarding resolution about 10% error is expected, errors due to stray-light are
expected to be about 4%.
The last presentation ends at 17:55.
30303030thththth October October October October 2007 2007 2007 2007
12
The meeting starts at 9:20 discussing the agenda, some changes during the morning session
were made in order to catch up with the presentations that were not possible to take the day
before.
Bo Galle (9:25) starts with a status of the annual reports delivery (scientific report,
management report, cost statement and signed cost statement) of all the partners. In the
scientific report some results should be showed. In the management report a summary of
costs (justification) and general information should be included. The cost statement is a form
to request for money, an explanation of how to fill it in was made. All the reports should be
ready by November 15th, 2007.
The idea to have audit certificates is to prove that expenses have been made. The importance
to have an audit early in the project for all partners is stressed. There is additional budget for
audits; in this case there is no economical reason for not doing audits. The auditor should be
authorized to do audits and should also be external from the observatory.
The possibility of a prolongation of the project was then discussed. With the original plan
there is only one year left to finish installations. But because of some problems of
spectrometers delivery and the addition of 4 more volcanoes, the suggestion of adding one
more year of the project is raised and in this case having one more year of data at the time of
writing the final reports. If there is a prolongation of the project, all deliverables due to last
year will be pushed one more year and there will be no extra money. Some extra money for
travel will be needed since one more Annual Meeting will take place.
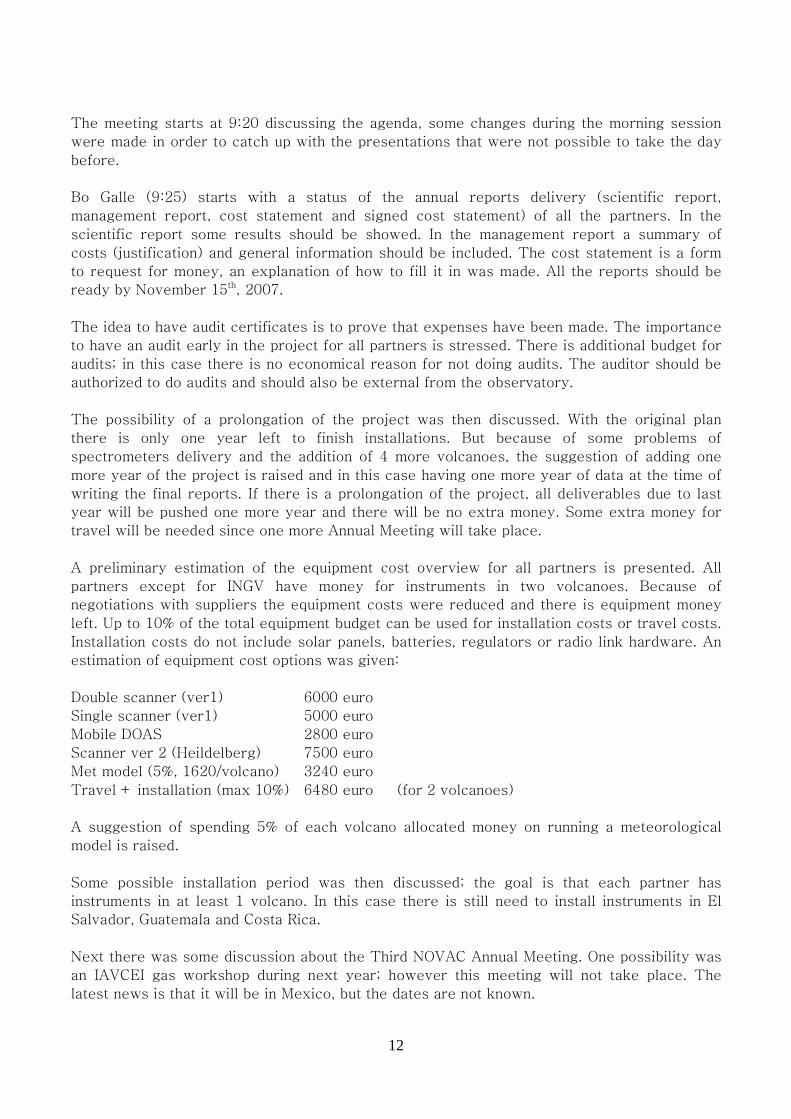
A preliminary estimation of the equipment cost overview for all partners is presented. All
partners except for INGV have money for instruments in two volcanoes. Because of
negotiations with suppliers the equipment costs were reduced and there is equipment money
left. Up to 10% of the total equipment budget can be used for installation costs or travel costs.
Installation costs do not include solar panels, batteries, regulators or radio link hardware. An
estimation of equipment cost options was given:
Double scanner (ver1) 6000 euro
Single scanner (ver1) 5000 euro
Mobile DOAS 2800 euro
Scanner ver 2 (Heildelberg) 7500 euro
Met model (5%, 1620/volcano) 3240 euro
Travel + installation (max 10%) 6480 euro (for 2 volcanoes)
A suggestion of spending 5% of each volcano allocated money on running a meteorological
model is raised.
Some possible installation period was then discussed; the goal is that each partner has
instruments in at least 1 volcano. In this case there is still need to install instruments in El
Salvador, Guatemala and Costa Rica.
Next there was some discussion about the Third NOVAC Annual Meeting. One possibility was
an IAVCEI gas workshop during next year; however this meeting will not take place. The
latest news is that it will be in Mexico, but the dates are not known.

13
There is a plan for an International Meeting on Arenal volcano next year during July in Costa
Rica, however it is not an option because of the dates.
Another possibility is to have the Third NOVAC Annual Meeting in connection with AGU 2008
in San Francisco during December next year.
Christoph Kern (10:50) continues presenting Instrument Hardware NOVAC Instrument Version
II. The instrument schematics is presented and explained. The instrument status is:
7 instruments have been constructed, they have been successfully tested at Mount Etna, Italy
(2006), San Cristobal and Masaya, Nicaragua (2006). Two instruments were installed at
Stromboli, Italy (March 2007). Further measurements have been made at Masaya (April 2007)
and Etna (August 2007). Two more instruments are ready for installation at Mt. Etna.
Among improvements implemented in the last 12 months are: adaptation of HR2000
spectrometer in place of HR4000 (software and spectroscopy issues resolved), addition of
direct solar mode, temperature issues largely solved (additional fan).
The special characteristics if this instrument are: scanning scheme entirely set by software
(flexible: plume scans, wind measurements, tropospheric and stratospheric components),
exclusively achromatic optics, no polarization sensitivity, high resolution (0.4nm FWHM),
determination of instrument-orientation from solar position possible as well as direct sunlight
measurements capabilities.
Next the different measurement modes were explained: scans, wind speed measurements,
direct sunlight measurements (for this the sun needs to be behind the plume). The advantages
of direct sunlight measurements were also explained. Direct sunlight measurements were
performed at Mt. Etna (last week). The impact of enhanced resolution of the used
spectrometer is then explained.
The power consumption of the scanner is then discussed; the big issue is the temperature
controller which can take between 0-50W. A cost estimate of the instrument is then
discussed.
Some deployment possibilities of the instruments are then discussed. Installation examples of
the instrument at Stromboli are shown.
Finally some conditions to think about if one wants to install these instruments are:
Adequate security: instrument is installed in the open (working on alternative installation
configuration for near future)
Power considerations: temperature control requires additional power (not necessary all the
time)
Interest in more advanced data acquisition and exploitation (additional measurement modes
can be interesting, but require some training and initiative).
Gaia Pinardi (11:20) then presents a study about monitoring of SO2 from satellite: the support
to aviation control service of PROMOTE and the role in NOVAC. PROMOTE stands for
“Protocol Monitoring for the GMES Service Element: Atmosphere” and the aim is to deliver

14
near-real-time data derived from satellite measurements regarding SO2 and aerosol emissions
possibly related to volcanic eruptions.
Using SCHIAMACHY data, SO2 slant and/or vertical columns are analyzed and email alerts are
sent in case there is an “exceptional SO2 concentrations”. There are predefined regions; there
are 42 volcano regions of 30 by 30 degrees. Maps are made for SO2 and cloud cover
information based on SCHIAMACHY data, the use of OMI data is currently being added.
SO2 is retrieved in the range of 315-326 nm: SO2 and ozone are fitted at two temperatures
(223 and 243 K). However there is still interference between SO2 and ozone, in this case a
correction is made.
An example of a notification of “exceptional SO2 concentration” is then shown. The main
information is process date and time, instrument used, Volcano region, maximum SO2 content,
etc. Some more examples of detected “exceptional SO2 concentration” at different volcanoes
were shown.
Some web links of interest:
http://www.temis.nl/aviation/so2.php
http://sacs.aeronomie.be/
Bo Galle (11:50) then gives a short explanation about GlobVolcano project.
Ulrich Platt (12:00) presents the possibility to have new spectrometers for NOVAC. First some
issues with ocean optics spectrometers were presented. A new possible supplier is omt-
optische messtechnik gmbh, the size is about the same of the ocean optics spectrometer. It
has many gratings and slit width available as well as cylinder lens option. The cost is around
4000 euros but it can be negotiable. The detector is back-illuminated CCD (like Hamamatsu
S10140). In summary the omt spectrometer may be a solution to most of the problems
associated with ocean optics miniature spectrometers, however we should be careful with
changes. Two spectrometers were ordered and will be tested. A discussion about ocean optics
spectrometers follows.
12:15 – 13:15 Lunch
After lunch a demonstration of the NOVAC Instrument version 2 (Heidelberg) was made.
Then Rodolfo Olmos (13:50) continued with a presentation about University of El Salvador
activities during last year. CO2 and SO2 values showed increased values before both Santa Ana
and San Miguel eruptions.
Next John Makario (14:15) gave a presentation about Temporal Changes in Seismic waves
attenuation related to gas content, as a tool of forecasting volcanic activity at Nevado del Ruiz
Volcano, Colombia. The relationship between seismic wave attenuation (Q-1) and SO2
emissions was addressed in this study. Q-1 = attenuation of seismic waves.
Coda Q is the quality factor of the media. Coda waves are the “tail” or last part of a seismic
event or earthquake. It has been used as a possible tool for earthquake forecasting (Jin and

15
Aki 1986; Sato 1987). Temporal changes of coda Q have been observed before volcanic
eruptions.
Hypocenters of earthquakes of Nevado del Ruiz volcano were used in this study. Q can be
separated on intrinsic, scattering and total attenuation. Intrinsic attenuation is a good tool for
monitoring thermodynamics of the volcano.
A correlation between Q-1 and SO2 flux (measured using COSPEC) was found. SO2 flux can be
used as an approximation of gas content inside the volcano and correlated with seismic
attenuation.
Santiago Arellano (15:00) gives a presentation about some results of the first year of
activities. IGEPN has done some local developments: in-house software for data analysis,
station maintenance register, summarized operator manual distributed to NOVAC-users in the
Observatory, data archive, data backup, acquisition of spare components with local funding (1
station). The in-house software interface is explained, the software reads the post evaluated
data. There is need to include statistics on all NOVAC Program versions. Statistics about both
Bayusig and Huayrapata stations were given as well as flux results. The main training needs
are: wind speed measurements by the autocorrelation method, MobileDOAS, error analysis
incorporating measurement and path effects, data retrieval strategies and measurement of
other species (e.g. BrO).
Patricia Ponce (15:25) continues presenting experiences of installations at Galeras volcano.
Initially a scanner was installed at Ancuya and data was transmitted by FTP (july-september
2006). There was a problem with internet connection and the system was moved to the
observatory on September 2006. During this year work has been done to find possible
installation sites as well as repeater sites: Santa Barbara, Alto Jimenez, Alto Tinajillas are the
three chosen stations. Two repeaters are needed. At the moment only the protection systems
are installed due to administrative issues.
Some mobile measurements have been made. With increased seismic activity, the recorded
SO2 flux data has been also increasing. Some measurements have been also made using a
scanner: a person from the observatory drives there and performs measurements.
Ligdamis Gutierrez (15:40) gives some comments about how the scanners in Nicaragua have
been working.
Bo Galle (15:42) continues giving a summary about the problems the scanners have had: flash
memory, the need to reformat the memory is then mentioned. Some changes have been made
in software. Also the possibility to change the computer is mentioned. The importance to keep
an instrument log where important changes are registered is stressed. At this point it would be
very useful to have a regular instrument log.
16:05 – 17:00 Coffee Break
After the coffee break arrangements about the dinner of the day were made.

16
Bo Galle (17:05) continues with errors discussion. First of all the spectroscopical error needs
to be taken into account and the final effect on the evaluations are in the order to 10% for a
non temperature-controlled spectrometer.
The second error is the meteorological data error. If there is an error on plume height of for
example 20% then we will have 20% error on flux estimation.
The geometrical error deals with the geometry and location of the plume. When the plume is
incomplete and when the highest column of the plume is not in the centre, also an error is
expected.
Another error is wind speed and wind direction error. Error in wind speed affects more
seriously to flux calculations than wind direction error.
The scattering error is then explained, it can be divided in: light path extension inside the
plume and light dilution.
There are various possibilities to handle errors, the data can be easily flagged as “good” or
“bad” or a more detailed handling of error could be made.
Giuseppe Salerno (17:15) continues presenting some results about the scanners network
installed at Mt Etna. The performance of DOAS SO2 retrievals using a modelled reference
spectrum was investigated. The methodology followed was using clear-sky (no plume), in this
case spectra were collected viewing through either 130 or 344 ppm m cells and data was
analyzed. It was observed that retrievals were under-estimated in early mornings and late in
the afternoons. The errors varied according to the hour of the day and the viewing angle. Also
seasonal effects on multiple scattering were addressed. The relative difference among months
was about 1%. Further work still needs to be done to improve the understanding of the energy
transfer in the long-time analysis using a radiative transfer model.
Christoph Kern (17:45) continues with a presentation of radiative transfer in and around
volcanic plumes. The main error sources or error are: spectroscopy error, geometric error,
wind error and radiative transfer error. The ideal conditions for a measurement were then
explained as well as a “dilution” effect. Multiple scattering effect is also explained. Even
during ideal measurements conditions the dilution and extension effects counteract, however
quantification of both is necessary to determine accurate fluxes. If located above the plume,
clouds play a secondary role, in this case photon paths will be extended, but the path in the
plume will remain the same. The influence of clouds or fog below the plume is a bit more
complicated and very difficult to deal with.
As a procedure for dealing with radiative transfer it is important to: qualitative understand
effects, flag data, quantitative understand the effects (O4 absorption, wavelength dependent
effects, radiative transfer models) and reduce and correct error of radiative transfer effects.
An example of TracyII GUI was showed. In summary, radiative transfer can greatly influence
retrieved trace gas column densities (errors > 100% possible).
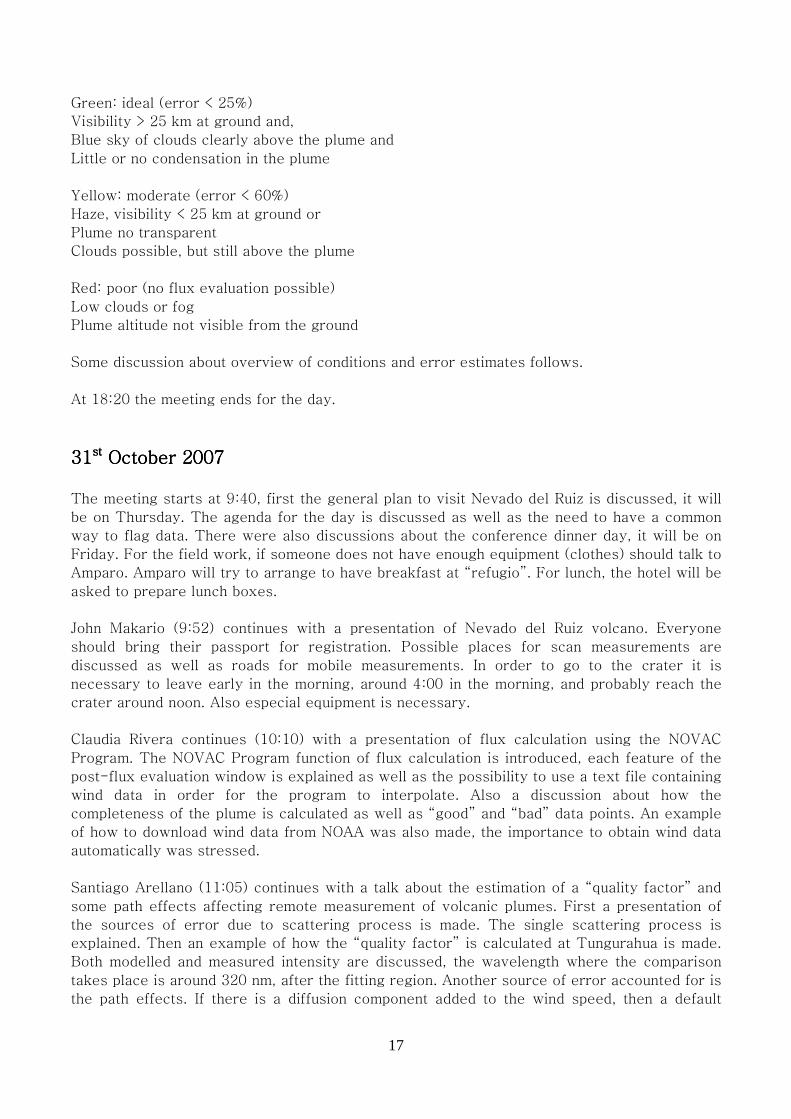
A suggestion to flag data is to have “green”, “yellow” and “red” values. Some examples of
ideal, medium and poor conditions were shown.
17
Green: ideal (error < 25%)
Visibility > 25 km at ground and,
Blue sky of clouds clearly above the plume and
Little or no condensation in the plume
Yellow: moderate (error < 60%)
Haze, visibility < 25 km at ground or
Plume no transparent
Clouds possible, but still above the plume
Red: poor (no flux evaluation possible)
Low clouds or fog
Plume altitude not visible from the ground
Some discussion about overview of conditions and error estimates follows.
At 18:20 the meeting ends for the day.
31313131stststst October 2007 October 2007 October 2007 October 2007 The meeting starts at 9:40, first the general plan to visit Nevado del Ruiz is discussed, it will
be on Thursday. The agenda for the day is discussed as well as the need to have a common
way to flag data. There were also discussions about the conference dinner day, it will be on
Friday. For the field work, if someone does not have enough equipment (clothes) should talk to
Amparo. Amparo will try to arrange to have breakfast at “refugio”. For lunch, the hotel will be
asked to prepare lunch boxes.
John Makario (9:52) continues with a presentation of Nevado del Ruiz volcano. Everyone
should bring their passport for registration. Possible places for scan measurements are
discussed as well as roads for mobile measurements. In order to go to the crater it is
necessary to leave early in the morning, around 4:00 in the morning, and probably reach the
crater around noon. Also especial equipment is necessary.
Claudia Rivera continues (10:10) with a presentation of flux calculation using the NOVAC
Program. The NOVAC Program function of flux calculation is introduced, each feature of the
post-flux evaluation window is explained as well as the possibility to use a text file containing
wind data in order for the program to interpolate. Also a discussion about how the
completeness of the plume is calculated as well as “good” and “bad” data points. An example
of how to download wind data from NOAA was also made, the importance to obtain wind data
automatically was stressed.
Santiago Arellano (11:05) continues with a talk about the estimation of a “quality factor” and
some path effects affecting remote measurement of volcanic plumes. First a presentation of
the sources of error due to scattering process is made. The single scattering process is
explained. Then an example of how the “quality factor” is calculated at Tungurahua is made.
Both modelled and measured intensity are discussed, the wavelength where the comparison
takes place is around 320 nm, after the fitting region. Another source of error accounted for is
the path effects. If there is a diffusion component added to the wind speed, then a default
18
value of wind speed is 1 m/s. Also the scanner plume distance is taken into account for
quantification of the “quality factor”. When the plume is above the station or about 100 m from
it, then that is considered as a good measurement. Some examples about weather quality
flagging are presented: A-good conditions, B-regular conditions, C-bad conditions and D-
really bad conditions. Scavenging processes of the plume were also deeply discussed. After
the presentation a discussion continues about SO2 removal. It was concluded that plume
chemistry could be another error to consider.
A discussion about including a modelled and normalized intensity together with scans
information followed. Also width of the plume was discussed as a parameter to take into
consideration.
12:05 – 13:35 Lunch
After lunch (13:35) Bo Galle continues with some decisions and administrative issues. First the
prolongation of the project is addressed and decided to extend the project.
Next the decision of allocating 5% of the equipment budget to meteorological modelling, in
general the audience thinks it is a good idea. Bo will send an email to the principal
investigators and they will decide.
The allocation of 10% of the equipment budget for travel and installation is then addressed. If
a partner wants to do this allocation of 10% of the equipment budget to travel costs, a request
should be sent soon.
Then the place where the next Annual Meeting is discussed, there are two possibilities: AGU
2008, in San Francisco and Alexander von Humboldt International Conference in Santiago de
Chile during end of November, 2008.
The possibility to have an Instrument Status Protocol monthly is decided, more information
about this will be sent later.
Suggestions about the conference dinner are then made, it will be on Friday evening, and the
place will be later decided.
Finally the suggestion to go to Armero in Friday is raised.
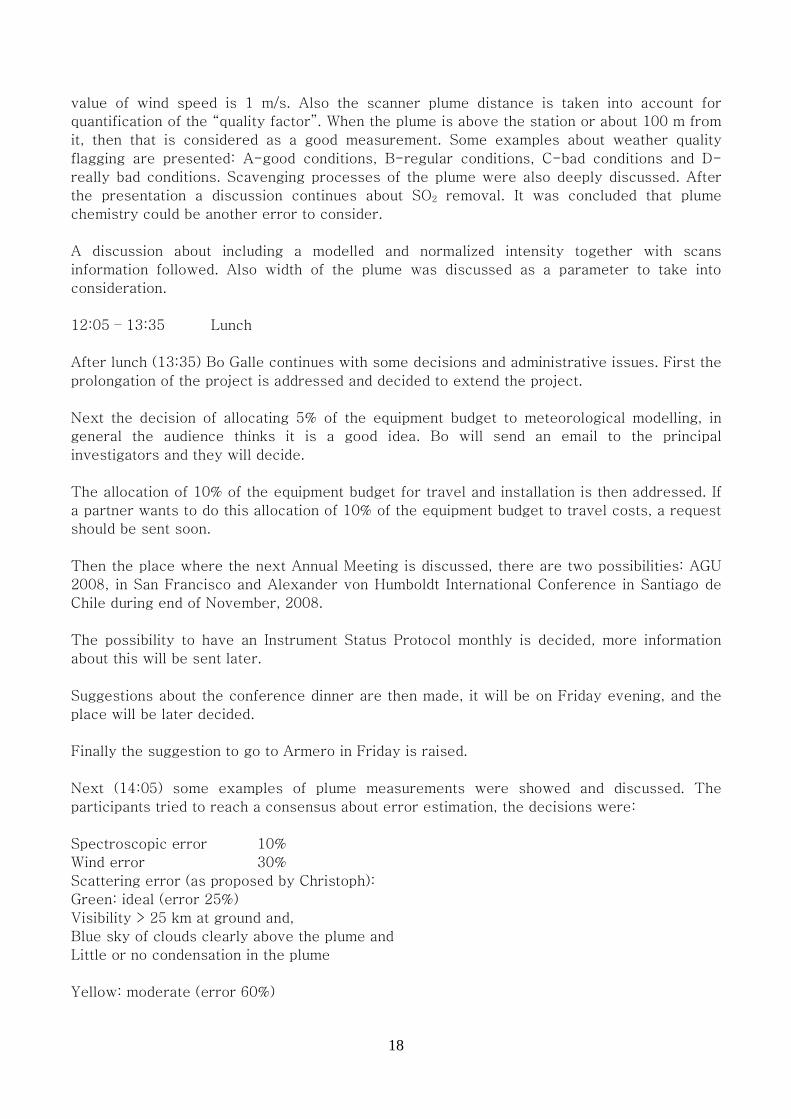
Next (14:05) some examples of plume measurements were showed and discussed. The
participants tried to reach a consensus about error estimation, the decisions were:
Spectroscopic error 10%
Wind error 30%
Scattering error (as proposed by Christoph):
Green: ideal (error 25%)
Visibility > 25 km at ground and,
Blue sky of clouds clearly above the plume and
Little or no condensation in the plume
Yellow: moderate (error 60%)

19
Haze, visibility < 25 km at ground or
Plume no transparent
Clouds possible, but still above the plume
Red: poor (no flux evaluation possible) if calculated flux (error 100%)
Low clouds or fog
Plume altitude not visible from the ground
Geometrical error (depending on plume height and centre of the plume):
These values are preliminary and will be tested. Claudia Rivera will send the participants a
protocol about these errors and communications will follow as whether these purposed
numbers work or if modifications are needed.
More proposals about how to handle geometrical error were raised by IGEPN and Heidelberg,
discussions will continue about the possibility to implement them.
1111stststst November November November November 2007 2007 2007 2007 Visit to Nevado del Ruiz, participants met around 6:00 am to leave for the volcano. Breakfast
was taken at “Gualí place”. Some mobile measurements were made by Christoph, Leif and
Claudia. Betty Silva joined in the exercise.
2222ndndndnd November November November November 2007 2007 2007 2007 Visit to Armero by most of the participants. Gustavo Garzon, Ulrich Platt, Leif Vogel and
Christoph Kern visited Nevado del Ruiz again. Mobile and scanning measurements were made.
The conference ended with a dinner.
Plume height
Calculated Estimated or assumed
Plume center < ±30
25%
Plume center > ±30
60%
Plume center < ±30
60%
Plume center > ±30
100%