d1.2 use case analysis and user scenarios - vis-sense - home · d1.2 use case analysis and user...
TRANSCRIPT
SEVENTH FRAMEWORK PROGRAMMEArea ICT-2009.1.4 (Trustworthy ICT)
Visual Analytic Representation of Large Datasetsfor Enhancing Network Security
D1.2 Use Case Analysis and User Scenarios
Contract No. FP7-ICT-257495-VIS-SENSE
Workpackage WP 1 – Requirements-Specifications-ArchitectureAuthor SYMVersion 1.0Date of delivery M12Actual Date of Delivery M12Dissemination level PublicResponsible SYMData included from EUR, TSP, IGD, CERTH
The research leading to these results has received funding from the European Community’sSeventh Framework Programme (FP7/2007-2013) under grant agreement n°257495.

SEVENTH FRAMEWORK PROGRAMMEArea ICT-2009.1.4 (Trustworthy ICT)
The VIS-SENSE Consortium consists of:
Fraunhofer IGD Project coordinator GermanyInstitut Eurecom FranceInstitut Telecom FranceCentre for Research and Technology Hellas GreeceSymantec Ltd. IrelandUniversitat Konstanz Germany
Contact information:Dr Jorn KohlhammerFraunhofer IGDFraunhoferstraße 564283 DarmstadtGermany
e-mail: [email protected]: +49 6151 155 646

Contents
1 Introduction 61.1 Methodology . . . . . . . . . . . . . . . . . . . . . . . . . . . . . . . . . . 7
1.2 End-user identification . . . . . . . . . . . . . . . . . . . . . . . . . . . . . 10
1.3 Scenario-based design in VIS-SENSE . . . . . . . . . . . . . . . . . . . . . 11
2 Visualization of the Internet threat landscape 142.1 Introduction . . . . . . . . . . . . . . . . . . . . . . . . . . . . . . . . . . . 14
2.2 The TRIAGE approach . . . . . . . . . . . . . . . . . . . . . . . . . . . . 15
2.2.1 Current situation . . . . . . . . . . . . . . . . . . . . . . . . . . . . 15
2.2.2 Intelligence analysis . . . . . . . . . . . . . . . . . . . . . . . . . . 19
2.3 Security visualization scenario . . . . . . . . . . . . . . . . . . . . . . . . . 21
2.3.1 High-level requirements . . . . . . . . . . . . . . . . . . . . . . . . 21
2.3.2 Insights into the spam botnets ecosystem . . . . . . . . . . . . . . 28
2.3.3 Problem claims . . . . . . . . . . . . . . . . . . . . . . . . . . . . . 36
2.3.4 Activity and interaction design . . . . . . . . . . . . . . . . . . . . 36
2.4 Other possible scenarios . . . . . . . . . . . . . . . . . . . . . . . . . . . . 41
2.4.1 Visual analysis of the malware threat ecosystem . . . . . . . . . . 41
2.4.2 Visual analysis of the Web threat dynamics . . . . . . . . . . . . . 43
3 Analysis and Visualisation of Attacks against the Control Plane (BGP) 463.1 Introduction . . . . . . . . . . . . . . . . . . . . . . . . . . . . . . . . . . . 46
3.2 BGP Scenario 1 . . . . . . . . . . . . . . . . . . . . . . . . . . . . . . . . . 47
3.2.1 The Spamtracer framework . . . . . . . . . . . . . . . . . . . . . . 48
3.2.2 High-level requirements . . . . . . . . . . . . . . . . . . . . . . . . 49
3.2.3 Scenario: Analysis of fly-by spammers . . . . . . . . . . . . . . . . 50
3.2.4 Problem claims . . . . . . . . . . . . . . . . . . . . . . . . . . . . . 57
3.2.5 Activity and interaction design . . . . . . . . . . . . . . . . . . . . 59
3.3 BGP Scenario 2 . . . . . . . . . . . . . . . . . . . . . . . . . . . . . . . . . 60
3.3.1 Scenario: Analysis of BGP routing anomalies . . . . . . . . . . . . 60
3.3.2 Problem claims . . . . . . . . . . . . . . . . . . . . . . . . . . . . . 68
3.3.3 Activity and interaction design . . . . . . . . . . . . . . . . . . . . 68
3
4 Conclusion 72
4
Abstract
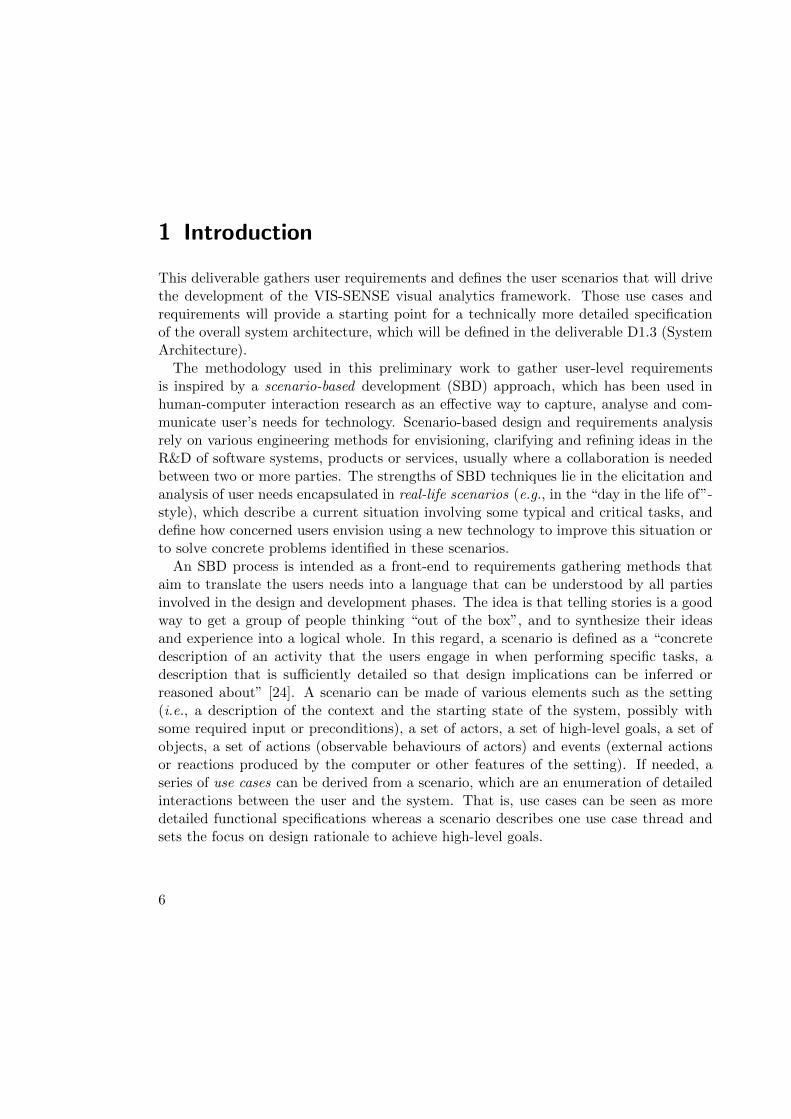
This deliverable identifies user requirements and describes the user scenarios that willdrive the development of a bespoke visual analytics framework for security analysisand visualization. This document will provide a starting point for a more detailedspecification of the overall VIS-SENSE system architecture.
The methodology used to gather user-level requirements is inspired by a scenario-baseddesign approach (SBD), which has been used in Human Computer Interaction researchas an effective way to capture, analyse and communicate user’s needs for technology.The strength of SBD lies in the elicitation and analysis of users needs encapsulatedin real-life scenarios describing how to use the envisioned technology from the user’sperspective in order to solve concrete problems. Specifically, two user-level scenarios arebeing developed in this deliverable: (i) “Visualisation of the Internet threat landscape”,and (ii) “Analysis and visualisation of attacks against the Control Plane (BGP)”.
The resulting use cases convey stories envisioning creative and innovative solutions,which can be readily latched onto and understood by projects partners but also by peopleoutside the project group.
1 Introduction
This deliverable gathers user requirements and defines the user scenarios that will drivethe development of the VIS-SENSE visual analytics framework. Those use cases andrequirements will provide a starting point for a technically more detailed specificationof the overall system architecture, which will be defined in the deliverable D1.3 (SystemArchitecture).
The methodology used in this preliminary work to gather user-level requirementsis inspired by a scenario-based development (SBD) approach, which has been used inhuman-computer interaction research as an effective way to capture, analyse and com-municate user’s needs for technology. Scenario-based design and requirements analysisrely on various engineering methods for envisioning, clarifying and refining ideas in theR&D of software systems, products or services, usually where a collaboration is neededbetween two or more parties. The strengths of SBD techniques lie in the elicitation andanalysis of user needs encapsulated in real-life scenarios (e.g., in the “day in the life of”-style), which describe a current situation involving some typical and critical tasks, anddefine how concerned users envision using a new technology to improve this situation orto solve concrete problems identified in these scenarios.
An SBD process is intended as a front-end to requirements gathering methods thataim to translate the users needs into a language that can be understood by all partiesinvolved in the design and development phases. The idea is that telling stories is a goodway to get a group of people thinking “out of the box”, and to synthesize their ideasand experience into a logical whole. In this regard, a scenario is defined as a “concretedescription of an activity that the users engage in when performing specific tasks, adescription that is sufficiently detailed so that design implications can be inferred orreasoned about” [24]. A scenario can be made of various elements such as the setting(i.e., a description of the context and the starting state of the system, possibly withsome required input or preconditions), a set of actors, a set of high-level goals, a set ofobjects, a set of actions (observable behaviours of actors) and events (external actionsor reactions produced by the computer or other features of the setting). If needed, aseries of use cases can be derived from a scenario, which are an enumeration of detailedinteractions between the user and the system. That is, use cases can be seen as moredetailed functional specifications whereas a scenario describes one use case thread andsets the focus on design rationale to achieve high-level goals.
6

1.1 Methodology
As pointed out in [8], some key features of scenario-based approaches are:
- scenarios provide vivid descriptions of end-users experiences that evoke reflectionabout design issues;
- scenarios concretely fix an interpretation and a solution, but are not prescriptiveand can be easily revised;
- scenarios can be written at multiple levels, from many perspectives and differentpurposes (e.g., subdivided into various use cases);
- scenarios can be abstracted and categorized;
- SBD is a collaborative process, i.e., it naturally evokes the participation amongstakeholders, supporting an appropriate design outcome.
The resulting scenarios and use cases convey thus stories envisioning creative andinnovative solutions, which can be readily latched onto and understood by all projectpartners but also by people outside the project group.
In Section 1.1, we give a brief overview of the scenario-based design methodology thathas served as basis for producing the scenarios and user requirements of this deliver-able. Section 1.2 identifies and characterizes the possible end-users that the VIS-SENSEframework will target. In Section 1.3 we give an overview of the scenarios themselveswith a particular focus on tactical and strategic analysis activities.
1.1 Methodology
There exist several methods and frameworks for scenario-based development (SBD),which are commonly used in usability engineering or human-computer interaction (HCI).In the VIS-SENSE design, we will mostly rely on John Carroll’s SBD framework [9, 17].This framework describes an iterative approach to interactive systems design and analy-sis, and encourages a reasoning about people using technology and about finding trade-offs throughout development. The SBD framework is comparable to other usabilityengineering approaches, in that it encompasses requirements analysis, design, prototyp-ing, evaluation, and documentation. Its key distinction is its central reliance on userinteraction scenarios as an ongoing source of insight and reasoning about users’ needsand experiences [18].
Figure 1.1 illustrates the Scenario-Based Development framework. Three main stages“Analysis, Design, Evaluation” segment the design process of the system. Each of these
FP7-ICT-257495-VIS-SENSE 7

1 Introduction
stages is comprised of one or more phases, which are in turn made up of multiple ac-tivities. It is assumed that SBD phases and their activities occur in an iterative andinterleaved fashion. As shown, the framework is also founded on three main components:scenarios, claims, and knowledge of HCI methods and concepts. Scenarios are analysedusing claims and HCI knowledge throughout the entire system development life cycle.In fact, scenario writing is always interleaved with claims analysis, where the features ofa situation that have important effects on the actors or the system are identified. Eachsuch feature is written down with its hypothesized good and bad effects. Claims analysisnot only extends and elaborates the scenarios, but helps generate design reasoning.
!"#$%&'&() *+,-$./(&0."#+',&() 1.23'+./."4&(
*+,4,4%5.(6(78#$3#9,"(
) (:&#-'$'4%(&5.0&() (:&#-'$'4%(4.&9";(
<.&';"() (!098'4%(=.&';"() (>"?,+/#9,"(=.&';"() (>"4.+#09,"(=.&';"(:&.+(
@0."#+',&(AB>(
C",D$.=;.(
B$#'/&(
Figure 1.1: Scenario-Based Design process[9, 17].
During the Analysis stage, a requirements analysis is performed in which the scopeof the problem is understood and various methods are used to study the situation andthe context. Typically these methods include interviews with experts and other users(the stakeholders), field studies of the current situation (e.g., state-of-the-art studies),and brainstorming among users and developers. This input is gathered and analysedto formulate problem scenarios that convey important characteristics of the users, thetypical and critical tasks they engage in, the tools they use, and their organizationalcontext.
The Design stage is where the project is moved from problem understanding to envi-sioned solutions. SBD organizes design into four phases with a rough ordering: Activity
8 SEVENTH FRAMEWORK PROGRAMME

1.1 Methodology
Design, Information Design, and Interaction Design, with Documentation Design con-ducted throughout. Each design phase is comprised of three concurrent activities:
• exploring relevant HCI concepts, metaphors, and different technology options withthe goal of discovering possible solutions;
• envisioning the proposed solutions in the form of prototypes, scenarios, etc., withthe goal of narrowing down the solution space to one or two design possibilities;
• rationale for building the chosen solution(s) in the form of design claims and eval-uation results.
Developers usually start by writing down activity scenarios in which they envisiontypical or critical services that people will seek from the system and introduce concreteideas about new functionality. These early scenarios propose various transformationsfrom current situation and provide a concrete glimpse of the future that the designersare trying to enable through their efforts. However, they deliberately focus on purefunctionality, refraining from specifying details about what the system will look like orhow users will manipulate it.
In the second design phase, information scenarios are elaborated to provide detailsabout the information that the system will provide to users. This phase is about howusers perceive, interpret and make sense of information.
The third design phase involves the design of interaction scenarios. These scenariosdescribe the details of user action and feedback. Each interaction scenario is a fully-specified design vision: the users and task(s) being supported, the information neededto carry out the task, the actions the users take to interact with the task information,and the responses the system provides to users’ actions.
Even though the SBD framework makes, in theory, a clear distinction between thosevarious scenarios during the design stage, from a practical viewpoint it can be sometimesmore convenient to group the three aspects (activity, information and system interac-tion) in a single, unified design scenario. For the VIS-SENSE scenarios developed inChapters 2 and 3, we will adopt this more pragmatic and unified approach.
The last stage of SBD involves an evaluation of the design ideas, which focuses onUsability testing. Two forms of usability testing can be applied: formative, which iscarried out to guide re-design and aimed at improving a design prototype, or summa-tive evaluation, which serves as a overall system verification function. In other words,formative evaluation aims at identifying what in the designed system is working poorly
FP7-ICT-257495-VIS-SENSE 9
1 Introduction
and what changes might fix the problem, whereas summative evaluation aims at com-paring the developed system (as a whole) with what was envisioned and specified duringthe design. Since this evaluation stage requires collecting data and feedback about theutilization of the designed and developed prototype, we will consider this aspect in WP6which takes place later in the project, more specifically in deliverable D6.3 (VIS-SENSEFramework Evaluation).
1.2 End-user identification
In any design process, it is important to identify who are the target groups of end-users.In this project, we are in a particular situation in the sense that, project partners arenot only the problem owners, but also the researchers and developers of a bespoke visualanalytics framework addressing the problem. However, if this research is successful, weenvision that our software framework could be effectively used by certain categories ofend-users and help them in their daily job. In such case, we would target the followingcategories of end-users:
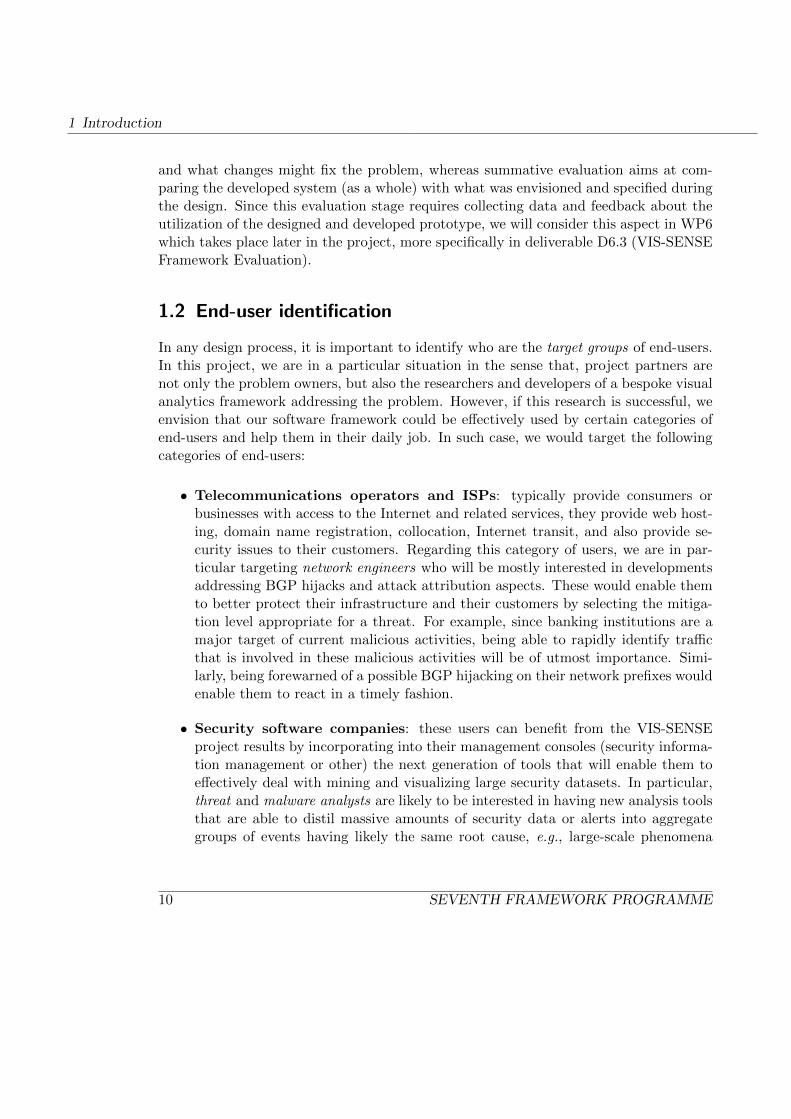
• Telecommunications operators and ISPs: typically provide consumers orbusinesses with access to the Internet and related services, they provide web host-ing, domain name registration, collocation, Internet transit, and also provide se-curity issues to their customers. Regarding this category of users, we are in par-ticular targeting network engineers who will be mostly interested in developmentsaddressing BGP hijacks and attack attribution aspects. These would enable themto better protect their infrastructure and their customers by selecting the mitiga-tion level appropriate for a threat. For example, since banking institutions are amajor target of current malicious activities, being able to rapidly identify trafficthat is involved in these malicious activities will be of utmost importance. Simi-larly, being forewarned of a possible BGP hijacking on their network prefixes wouldenable them to react in a timely fashion.
• Security software companies: these users can benefit from the VIS-SENSEproject results by incorporating into their management consoles (security informa-tion management or other) the next generation of tools that will enable them toeffectively deal with mining and visualizing large security datasets. In particular,threat and malware analysts are likely to be interested in having new analysis toolsthat are able to distil massive amounts of security data or alerts into aggregategroups of events having likely the same root cause, e.g., large-scale phenomena
10 SEVENTH FRAMEWORK PROGRAMME
1.3 Scenario-based design in VIS-SENSE
pointing to spam or phishing campaigns organized by the same individuals, mal-ware variants belonging to the same family, etc. Furthermore, this category ofusers is likely to be interested in strategic analyses of various threats landscapes,by which they are able to visualize and understand the modus operandi of attackersand how those evolve over longer periods of time.
• CERT teams: this group of potential users typically respond to security incidentsoccurring in the Internet, cooperate with other CERTs and ISPs, provide securecontact to report an incident, analyse the state of the Internet security, provideincident reaction and prevention, provide security information and warnings as wellas education and training. CERT analysts can benefit from the project results byincorporating into their arsenal of monitoring tools some of the new technologiesdeveloped in VIS-SENSE, eventually adapting them to their specific needs anddata sets. This category of users is likely to be interested in both tactical andstrategic analysis of security data sets, so as to respond more effectively to theirsecurity incidents but also to remain informed of changes or evolutions in attackphenomena occurring on the networks that they are monitoring.
• Security researchers: these users are mostly involved in research and teach-ing (education), development of ideas related to a broad range of theoretical andpractical aspects of computer security and privacy issues (Internet threat analysis,intrusion detection, data analysis, information visualization, etc.). Besides usingand testing the system with their own data sets, this category of users is likelyto be interested in improving and extending the framework with new modules,techniques or algorithms, both on analytical and visualization aspects.
1.3 Scenario-based design in VIS-SENSE
The overall objective of the VIS-SENSE framework is to improve Internet security byenabling security experts to gain a better situational understanding of existing andemerging threats faced by Internet users. This objective will be achieved by fosteringproactive measures that will increase the efficiency of cybercrime resolution and improvethe prediction of such attacks. Thus, helping people better protect themselves againstcriminal activity.
From a conceptual viewpoint, we can distinguish two different approaches to help inachieving these goals: tactical and strategic analysis [21]. The tactical approach involvesthe development of monitoring methods to distinguish between malicious and benignactivity (e.g., malicious or benign network traffic, software, websites, etc.). This ap-
FP7-ICT-257495-VIS-SENSE 11

1 Introduction
proach can be summarized with the question “What characterizes a malicious object?”,e.g., what characterizes a specific malware, a rogue AV website, an exploit server, anetwork intrusion, a spam email, a phishing email, etc. Tactical methods use analysisfor the development and refinement of a model, which can then be used for automatedmonitoring and classification.
The strategic approach, instead, involves the exploratory analysis of data with a par-ticular focus on the generation of activity overviews and behavioural models. Statisticaland data mining methods, such as clustering and aggregation play an important rolein the generation of overviews. The correlation of data from different sources is alsoimportant for an understanding of how different aspects of network security relate toone another (e.g., BGP hijacking and spam campaigns, exploits and malware propa-gation, or spam and botnets). This approach can be summarized with questions like“Which malicious objects are likely due to the same source?” (root cause analysis andattribution) or “What is the modus operandi of an attacker?” (behavioural analysis).
As one can see, tactical and strategic approaches have fundamentally different goals:the tactical approach tries to process and characterise security-related data in near realtime. Alerts and events are generated with the help of new antivirus signatures, knowl-edge of the spread of a new botnet, correlations with new IDS signatures, etc. Thestrategic approach instead deals with the observation of the modus operandi of attackersand their strategies on a long-term basis. Obviously, the two approaches are comple-mentary; however, they involve different time scales. Tactical battles are won, or lost, interms of seconds, minutes or hours whereas strategic approaches involve days, weeks ormonths. To a certain extent, methods for strategic analysis usually include more contex-tual features and try to correlate them with the structural or behavioural characteristicsof the malicious events being observed.
The main innovation of the VIS-SENSE framework will be to provide users with novelvisual analytics technologies for the identification and prediction of abnormal behaviourin various network security application areas ranging from attack attribution to BGPhijacking. It will thus involve the introduction of new visual analytics technologiesfor the mining of, presentation of and interaction with massive amounts of heteroge-neous data. In particular, VIS-SENSE aims to research and develop innovative waysto combine emerging attack attribution technologies relying on multi-criteria analysisand data fusion [21], with visualization techniques that can help analysts interact withmulti-dimensional clusters representing cybercrime activities.
In the rest of this document, we will instantiate the SBD framework around thefollowing two specific scenarios that will guide overall VIS-SENSE development:
• Scenario 1: “Visualisation of the Internet threat landscape” will be handled in
12 SEVENTH FRAMEWORK PROGRAMME
1.3 Scenario-based design in VIS-SENSE
detail in Chapter 2;
• Scenario 2: “Analysis and visualisation of attacks against the Control Plane (BGP)”will be described in Chapter 3.
Whenever possible, we will try to distinguish in the developed scenarios the aspectsthat have strategic or tactical analysis goals. For each scenario, we start by analysingthe problem and try to extract high-level user requirements, before sketching new usecases and system interactions. Finally, we will try to map the extracted user needsto appropriate technologies, again if this is possible at this development stage. Thedocument will close with concluding remarks in Chapter 4.
FP7-ICT-257495-VIS-SENSE 13

2 Visualization of the Internet threat landscape
2.1 Introduction
The first VIS-SENSE user scenario will be described in this chapter. In this scenario,users of the target groups identified in Section 1.2 aim to get insights into various threatecosystems, such as for example malware propagation models, spammers’ behaviour andspam campaigns performed through large botnets, or client-side threats targeting Webusers. These are some common analysis use cases that we envision today; however, theframework to be developed should not be restricted, or specifically tailored, to thoseparticular cases. Instead, the central idea behind the VIS-SENSE framework is to iden-tify common root causes of attack phenomena observed in the Internet. We want tobe able to attribute or classify any given set of attacks to the phenomenon that haslikely generated them, and then represent graphically this phenomenon through aggre-gate summaries highlighting, in a visual and meaningful way, the modus operandi of thecybercriminals behind those attacks (i.e., strategic analysis).
We want also to be warned as soon as possible of any significant deviation observed inthose cybercriminal behaviours. The system should thus highlight the occurrence of anew phenomenon, or any significant changes in the behavior of malicious actors identifiedby the automated attack attribution methods (i.e., tactical analysis). Whenever possible,we would like to bridge the gap between these strategic and tactical approaches, e.g.,by leveraging behavioural models obtained from the strategic analysis component tocorrelate this high-level information about attackers behaviour with low-level intrusionor attack information collected on other networks (using techniques like alert correlation,for example).
The main data sources used as input for this scenario will be WAPI-enabled datasets, which provide security events collected by sensors previously developed during theWOMBAT project [10], as well as analysis results, all accessible in a uniform and flexibleway. In this regard, we consider the integration and the use of the following datasets toachieve the goals of Scenario 1:
• SGNET, a distributed honey-pot deployment that provides extensive data relatedto malware propagating in the Internet in an automated fashion [16];
14

2.2 The TRIAGE approach
• HARMUR, which provides historical data on the security and network state ofsuspicious web domains, enabling an analysis of client-side threats and their evo-lution [?];
• Symantec.Cloud spam data set, which gives access to large spam data sets collectedthrough spam traps which are distributed worldwide [20].
SGNET and HARMUR are described in more detail in the VIS-SENSE deliverableD2.1 (Network Information Sources) [25]. Symantec.Cloud spam data set, however, isstill being actively developed and will be integrated to the VIS-SENSE data collectioninfrastructure. An early empirical study of this data set has been done recently in [22].
The rest of this Chapter is organized as follows: Section 2.2 gives a brief overview ofthe triage framework and describes the current situation, i.e., how this framework iscurrently being used for security or cyberintelligence analyses. In Section 2.3, we analysethe user-level requirements for the development of the VIS-SENSE framework, and wetry to identify various problem claims through a specific use case (based on the spamdata set). In the same Section, we try to envision how the new framework will be usedto perform the security analysis in a more effective way, thanks to the incorporation ofnew features addressing the user needs.
Finally, in Section 2.4 we also envision a few other possible use cases having similar re-quirements at this time being, but involving data sets other than SGNET or HARMUR.Depending on the state of the Internet security landscape we may use and elaborate onthose alternative scenarios to guide further research and development efforts. To evalu-ate the new VIS-SENSE framework these data sets could be considered as appropriateto perform an empirical study of new attack phenomena performed by cybercriminalsat a later stage.
2.2 The TRIAGE approach
2.2.1 Current situation
triage is a multi-criteria software analysis framework whose development started in thewombat project to address the attack attribution problem. This framework enables asecurity analyst to systematically discover, extract and combine patterns from a dataset,according to a set of potentially useful characteristics (or features), and with limitedknowledge on the phenomena under scrutiny. The triage approach is sufficiently genericto be applied to virtually any type of dataset made of security events (e.g., attackevents observed by honey-pots, network intrusions, IDS alerts, malware samples, spammessages, etc.).
FP7-ICT-257495-VIS-SENSE 15
2 Visualization of the Internet threat landscape
0. Select and Import Features • HARMUR • SGNET + Anubis +
VT • …
1. Per-feature Graph-based clustering • Discover data structure
and interesting patterns • Repeat for each feature
2. Multi-feature analysis • Model a given behavior
using MCDA function • Aggregate all features
3. Visualize MD-Clusters • Analyze relationships
across multiple features • Get insights into root
phenomena: behaviors, charac., evolution, etc.
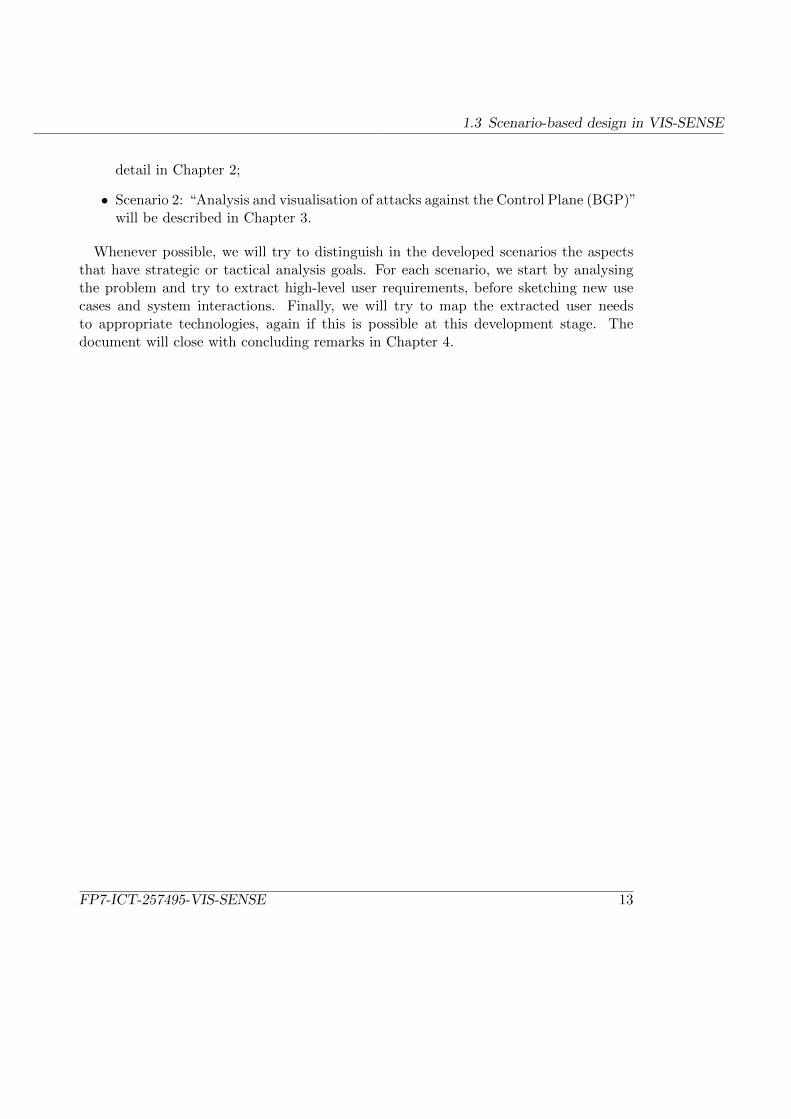
Figure 2.1: Current triage work flow.
The main objective of triage is to identify attack phenomena that are responsible forgroups of security events and occurring at a larger scale. By identifying and analysingsuch phenomena, analysts want to get insights into their root cause as well as the modusoperandi of attackers. triage relies on a combination of graph-based analysis with adata fusion process inspired by Multi-Criteria Decision Analysis (MCDA). As illustratedin Fig. 2.1, the current triage work flow is based on three stages:
1. Attack feature selection: we determine which (potentially) useful features wewant to include in the overall analysis, and we characterize each element (i.e., eachsecurity event) of the data set according to this set of selected features (e.g., bycreating feature vectors for each element);
2. Graph-based clustering: an undirected edge-weighted graph is created withrespect to every feature based on an appropriate distance for measuring pairwisesimilarities. In most cases, a graph analysis is performed on a single feature basisin order to identify clusters and hence to reveal the underlying structure of thedata and all relevant correlations with respect to every feature;
3. Multi-criteria aggregation: this step implements a data fusion process in which
16 SEVENTH FRAMEWORK PROGRAMME

2.2 The TRIAGE approach
the different weighted graphs are combined using an aggregation function that mod-els the expected behaviour of the phenomena under study. To define such a model,and to include some domain knowledge, the analyst can use vague statements (suchas “at least three” or “most” features must be highly correlated) and also includerelative importances and interactions among features.
As output, we obtain Multi-Dimensional Clusters (or MDCs) grouping security eventsthat are correlated by a sufficient number of features, which is likely to reflect the sameunderlying root cause or a common modus operandi. At this stage, it is important tostress that, in contrast to classical clustering techniques (single or multi-features), theuse of MCDA data fusion methods enables us to model more complex behaviours. Thatis, the precise combination of features needed to link security events does not have tobe specified in advance. As a result, an MD Cluster can be made of separate subsets ofevents linked by different combinations of features, modelling thus a possible evolutionof the phenomenon responsible for all those events. Note that the overall approach usedin triage is mostly unsupervised. It also provides the analyst with a flexible analysistool to include additional features, if needed. However, a major drawback is the lack ofintegrated graphical user interactivity. At present, visualizations are restricted to staticimages generated with the help of scripts.
MCDA aggregation
As shown in previous work [21], the choice of the aggregation function used to combinefeatures is fundamental, as it models the behavioural characteristics of the phenomenaunder study. There exist different classes of aggregation functions, according to the typeof behaviour to be modelled (e.g., averaging, conjunctive or disjunctive). A classicalmethod for this problem is to use the weighted sum; however, this approach has theshortcoming that it implicitly assumes the independence of criteria, which is rarely ver-ified. In prior work [21, 7], different families of averaging functions and fuzzy integralswere extensively studied, and applied to various security domains to address problemsrelated to attribution and root cause analysis. Examples of such aggregation methodsinclude Ordered Weighted Average (OWA) functions and fuzzy integrals, which are par-tially supported in the current triage software framework. OWA functions perform areordering of input criteria before aggregating them, which allows the decision-maker touse vague statements to model behaviours, such as “most of” or “at least k” criteria (outof n) have to be strongly correlated in the aggregation process to eventually attributedifferent events to the same phenomenon. Other aggregation methods, such as the Cho-quet integral, could also be used; however, these methods remain to be investigated in
FP7-ICT-257495-VIS-SENSE 17
2 Visualization of the Internet threat landscape
more depth. The Choquet integral belongs to the family of Fuzzy integrals, which pro-vide decision-makers with more complex behaviour modelling schemes. Fuzzy integralsaggregate a set of scores by taking into account not only importance factors assignedto individual criteria, but also interactions among subsets of features (used as decisioncriteria), such as synergies or redundancies between two or more features extracted fromthe data set.
Observe that the MCDA approach is conceptually close to fuzzy inference systems(FIS), which represent and combine expert knowledge using fuzzy logic rules. However,one of the key advantages of using MCDA aggregation lies in the flexibility and simplicityof the approach, e.g., the user must define fewer parameters. Modelling a behaviour suchas “at least k high scores out of n must be satisfied to link two events” can require a largenumber of rules to implement in the inference system, as it requires the combination of(nk) = n!
k!(n−k)! rules. For example, with n = 10 and k = 4, we would have to build an
expert system made of 210 different rules (plus one additional function to aggregate allrules output), whereas in the MCDA approach, we only need a single function and alimited set of parameters, i.e., a specific weighting vector of length n with OWA, and atmost n(n + 1) weighting values for defining a Choquet fuzzy integral (more details onthis can be found in [7]).
It has been shown previously that the triage approach has delivered some prelim-inary results that are very encouraging (we briefly illustrate one of them here below).However, the various analyses performed so far have also shown the limits of the ap-proach in terms of scalability and usability when it comes to (i) extracting or selecting anappropriate set of features; (ii) defining suitable parameters for the aggregation model;and (iii) explaining the results obtained by this technique. More research efforts are thusrequired to transition this analytic framework to a scalable and mature visual analyticsframework.
Ultimately, the VIS-SENSE framework should help to make sense of triage results byeffectively tracing relationships in massive amounts of security data across many differentdimensions. It should also enable a highly iterative and interactive process where the usersteadily improves his understanding of the data. More precisely, the user would examinethe final or intermediate results of algorithms, extract the most profitable informationand, using this knowledge, further improve the overall result. Therefore, some of thekey challenges to be addressed are the scalability and usability of the new framework.The goal is to enable threat analysts to analyse multiple data sets comprising millionsof events, sometimes collected from a number of different perspectives. Appropriatevisualizations will be used to make sense of the results and explore them interactively.
18 SEVENTH FRAMEWORK PROGRAMME
2.2 The TRIAGE approach
2.2.2 Intelligence analysis
triage was previously applied on different data sets to analyse various types of phe-nomena, such as rogue antivirus (AV) campaigns [11, 19], malicious network activity inthe Internet [12, 21, 23], code variants of the same malware family [7], or spam botnetsoperations [22]. All those previous analyses had strategic goals and were performed toextract some intelligence and get insights into attackers behavior.
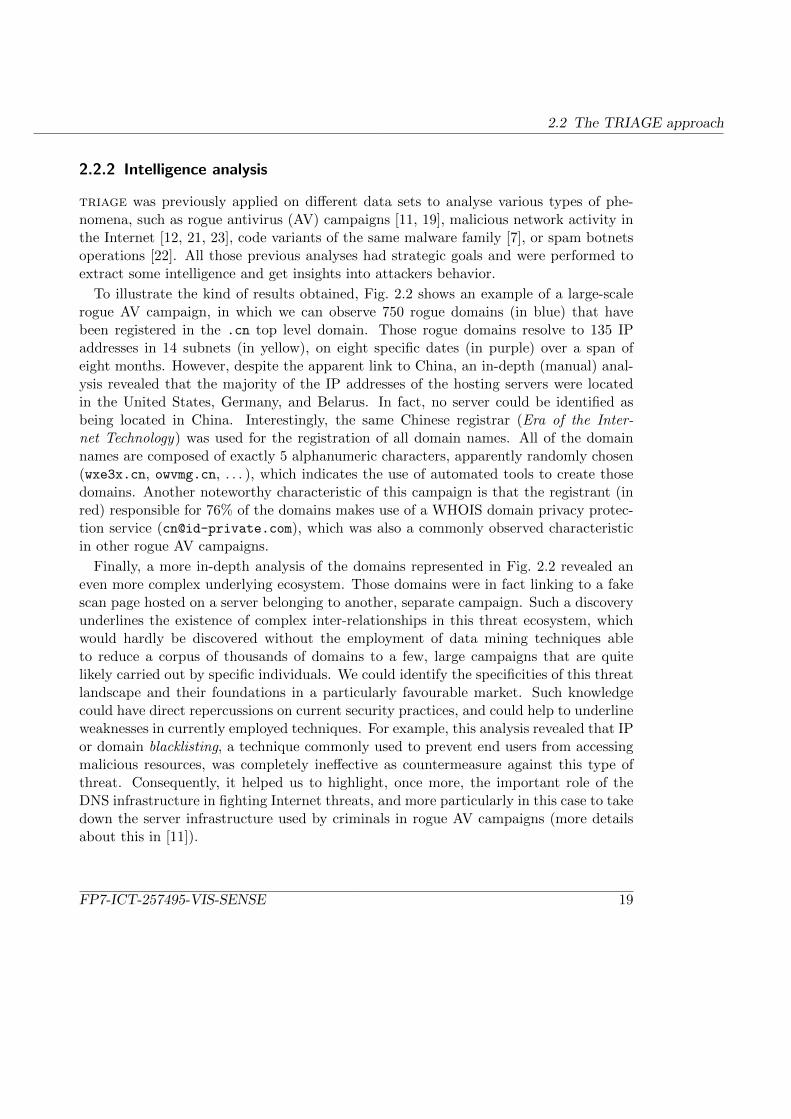
To illustrate the kind of results obtained, Fig. 2.2 shows an example of a large-scalerogue AV campaign, in which we can observe 750 rogue domains (in blue) that havebeen registered in the .cn top level domain. Those rogue domains resolve to 135 IPaddresses in 14 subnets (in yellow), on eight specific dates (in purple) over a span ofeight months. However, despite the apparent link to China, an in-depth (manual) anal-ysis revealed that the majority of the IP addresses of the hosting servers were locatedin the United States, Germany, and Belarus. In fact, no server could be identified asbeing located in China. Interestingly, the same Chinese registrar (Era of the Inter-net Technology) was used for the registration of all domain names. All of the domainnames are composed of exactly 5 alphanumeric characters, apparently randomly chosen(wxe3x.cn, owvmg.cn, . . . ), which indicates the use of automated tools to create thosedomains. Another noteworthy characteristic of this campaign is that the registrant (inred) responsible for 76% of the domains makes use of a WHOIS domain privacy protec-tion service ([email protected]), which was also a commonly observed characteristicin other rogue AV campaigns.
Finally, a more in-depth analysis of the domains represented in Fig. 2.2 revealed aneven more complex underlying ecosystem. Those domains were in fact linking to a fakescan page hosted on a server belonging to another, separate campaign. Such a discoveryunderlines the existence of complex inter-relationships in this threat ecosystem, whichwould hardly be discovered without the employment of data mining techniques ableto reduce a corpus of thousands of domains to a few, large campaigns that are quitelikely carried out by specific individuals. We could identify the specificities of this threatlandscape and their foundations in a particularly favourable market. Such knowledgecould have direct repercussions on current security practices, and could help to underlineweaknesses in currently employed techniques. For example, this analysis revealed that IPor domain blacklisting, a technique commonly used to prevent end users from accessingmalicious resources, was completely ineffective as countermeasure against this type ofthreat. Consequently, it helped us to highlight, once more, the important role of theDNS infrastructure in fighting Internet threats, and more particularly in this case to takedown the server infrastructure used by criminals in rogue AV campaigns (more detailsabout this in [11]).
FP7-ICT-257495-VIS-SENSE 19

2 Visualization of the Internet threat landscape
Figure 2.2: A example of large-scale rogue AV campaign identified by triage.
The above analysis provides quite a successful example, in which many insights andeven actionable knowledge could be gained. It significantly improved our understand-ing of the underlying infrastructure of cybercriminals operating in the particular threatecosystem of rogue AV distribution. However, a significant amount of manual analysiswork was still required to obtain these results. In particular, the selection of an appro-priate combination of domain features, the definition of an aggregation model (includingpossible feature interactions) and the visualization and exploitation of the results (i.e.,interactive exploration of MD Clusters) were all done manually. Indeed, the analysiswas not only done manually, but without the help of a graphical user interface. Further-more, the poor scalability of the current approach is a strong limitation of the number ofdomains (or more generally, security events) that can be processed in the same analysis.
20 SEVENTH FRAMEWORK PROGRAMME

2.3 Security visualization scenario
2.3 Security visualization scenario
We will now turn our attention to the requirements for the VIS-SENSE framework whichresult from the first scenario; overview of the internet threat landscape. Section 2.3.1analyses the user requirements for the development of the framework. In Section 2.3.2,we then elaborate on a specific use case describing the analysis of the spam botnetsecosystem, which takes advantage of the spam data available in the Symantec.Cloudspam data set. This use case illustrates the typical problems that analysts are currentlyconfronted with, and will be used to identify problem claims from a user perspective(Section 2.3.3). Finally, in Section 2.3.4 we describe a new activity and interactiondesign scenario in which we try to incorporate all the user requirements identified.
2.3.1 High-level requirements
As introduced in Section 2.2, the flexibility of the MCDA fusion approach in triagecomes unfortunately also with a number of limitations regarding the effectiveness andthe usability of the framework for real-world analyses and operational tasks. As shownin Fig.2.3, we classify the general user requirements of the VIS-SENSE framework intothree main categories:
1. Network analytics: requirements of this category are related to algorithms, pro-cesses or techniques that, in a stand-alone, serial, parallel or any other combina-tional manner, provide the means for the fusion, integration, correlation, group-ing and, more generally, the processing of data at multiple levels in a systematicor automated way. Furthermore, these algorithms must be developed or chosensuch that they can facilitate the visual analysis and manipulation of their results(i.e., synergistic interaction with visualizations). In Fig.2.3, sub-components ofthe framework that are likely to require the research and development of networkanalytics algorithms are depicted with green rounded rectangles.
2. Visualization: requirements of this category shall be addressed with visualizationtechniques that interface with automatic data mining methods to investigate largedatasets. Visualization puts the emphasis on software interactivity by tightly cou-pling human and machine analysis (usually with the help of feedback loops). Theidea is to combine the strengths of human visual perception and electronic dataprocessing to exploit their respective advantages, and thus achieve the most effec-tive results from the analysis of massive data sets. In Fig.2.3, the visualizationcomponents of the framework is depicted with a yellow rounded rectangle.
FP7-ICT-257495-VIS-SENSE 21

2 Visualization of the Internet threat landscape
3. System integration: we classify in this category all user requirements that are di-rectly related to the integration of various components in the VIS-SENSE frame-work, such as the import of new data events from databases, the export of analysisresults or the interaction and communication among sub-components (depictedwith filled blue arrows in Fig.2.3).
By tightly coupling visualization an network analytics components in the VIS-SENSEframework a novel visual analytics solution will result. This solution should respond tothe shortcomings of triage, providing analysts with a more powerful toolset in the fightagainst cybercrime.
!"#$%&"'(")"*+,-'.'/-#)0121'
3#$#'("$1' Σ
456/78'
/-,9#)0':"$"*+,-';),,<'=,&':">2#+,-1'2-'
?@"-,9"-#A'*@#-B"1',='9,:%1',?"&#-:2C'
D21%#)2E#+,-';"FBFA'#:#?$':#$#'=%12,-'G"2B@$1A':"*212,-'$@&"1@,):1A''
2:"-+=0'="#$%&"'2-$"&:"?"-:"-*2"1C'
H/I
6'
H/I
6'H/I
6'H/I6'
!%12,-'
D21%#)'/-#)0+*1''!	"G,&<'
J"$G,&<'/-#)0+*1'
J"$G,&<''
/-#)0+*1'
/)"&$'K,&&")#+,-';*&"#$"'456/78'#)"&$1A'%1"'$@"9'),*#))0C'
H/I6'
Figure 2.3: Classifying user-level requirements in the design process of the VIS-SENSEframework.
Network analytics requirements.
TRIAGE.
The definition of the weights and parameters used in the multi-criteria data fusion stepis currently done manually by a domain expert who must know how to tune them
22 SEVENTH FRAMEWORK PROGRAMME

2.3 Security visualization scenario
according to the data set and the application. In this regard, a first requirement is tomechanize the definition of those MCDA parameters through an automated optimizationprocess that is subject to a set of high-level constraints (such as vague statements andfeature interdependencies) defined by the security analyst. Furthermore, some supportfrom the visualization layer should also be made possible, such that interactive visualanalysis techniques can help the decision maker define or tune those parameters, and thenimmediately observe their impact on the behavioural models or the high-level clusteringpatterns visualized on the screen (feedback loop).
Another improvement pertains to the scalability of the framework. At present triagehas only been applied to data sets of moderate size (i.e., in the order of 10,000 securityevents). To address any scalability issues that might appear when dealing with largerdata sets, we need to consider more scalable clustering techniques, approximation ap-proaches or heuristics that are able to limit the number of computations required tocreate MD clusters (or to attribute new events to existing ones).
Note that some of these analytical improvements will be of relevance for the visualiza-tion components, for example to deal with network representations at various coarsenesslevels for visualization (e.g., coarse clustering in the distance, finer representation whenzooming in).
Anomaly detection.
Another limitation of the current triage framework comes from the fact that it does notprovide any effective way to easily compare different analysis results in a systematic andautomated fashion. A highly desirable requirement would be to enable an incrementalanalysis in which the system could highlight the occurrence of new phenomena andwarn users of any significant change in the modus operandi of malicious actors. Suchrequirement can be addressed by means of anomaly detection techniques, which canhighlight any meaningful deviation in the behavioural models previously obtained bythe system. This requires quite obviously the ability of the system to model the normalbehaviour of malicious actors in an effective and auto-adaptive fashion.
It is important to note that the notion of “normality” in this specific case is somehowdifferent from the normal behaviour that traditional anomaly detection systems (suchas network IDS) are using. In the VIS-SENSE framework, a “normal” model will indeedcharacterize previously observed attack phenomena, in which the behaviour of maliciousactors has been already observed and is thus already known. However, since maliciousadversaries may occasionally adapt or change their strategies, this would also changetheir modus operandi. When such change is considered to be significant, it should bereported as soon as possible to the users.
FP7-ICT-257495-VIS-SENSE 23
2 Visualization of the Internet threat landscape
Additionally, due to the dynamic and time-evolving nature of (attack) phenomenastudied in the VIS-SENSE project, a challenging aspect of this anomaly detection re-quirement is the fact that the normal behaviour of malicious actors may also evolve.The notion of current normal behaviour might thus need to be automatically adaptedas well.
Given that the data collected by the data collection infrastructure of VIS-SENSE canbe represented by graphs by considering timestamped pairs of attributes (e.g., source-destination pairs from attack events, email messages, BGP update messages, etc.) andthe fact that the output of various algorithms operating at the network analytics layerwhich will feed the anomaly detection modules will be represented by edge-weightedgraphs, the anomaly detection module will have to model and enhance the analyst’sunderstanding of complex global phenomena that are given rise due to local interactionsbetween graph entities. By using graph-based anomaly detections for network and threatmonitoring, two different but equally important problems will be addressed.
The first problem, which can be described as the static case, is the detection of struc-tural anomalies in a given graph. Detecting regions of a graph that are anomalous withrespect to the rest of the graph can reveal attack strategies that significantly differ fromcommonly used ones (e.g. malware that exhibits different strategies to propagate orcyber-criminals that develop different methods to launch attacks). Detecting new ordifferent strategies may indicate the rising of new phenomena. Therefore, these strate-gies have to be analysed so that the security expert can understand and gain insightinto the underlying methods, techniques and tools that are incorporated by these newphenomena. Once, these new strategies have been detected and analysed, the newlyobserved patterns can be incorporated into the normal model.
While the first case refers to the detection of the rising of new phenomena, the sec-ond one which is dynamic in nature aims at detecting significant shifts in the modusoperandi of attackers. Therefore, the second problem to be tackled by anomaly detec-tion techniques is the detection of anomalies in subsequent or in a time-series of graphs.Detecting anomalies in a time-series of graphs can highlight the occurrence of changesin the modus operandi of malicious actors by revealing how they change and adapt theirstrategies over time to launch more sophisticated attacks.
Given the very large datasets considered in the VIS-SENSE project, the anomaly de-tection algorithms should have both low complexity and low memory requirements. Thiswill allow their execution in near real-time allowing a smooth and seamless interactionwith the visualization layer. The near-real time constraint is imposed by the securityanalyst and the need to reconfigure the network analytics algorithms by changing theiroperational parameters based on the feedback of the analyst.
Since we consider the online nature of the anomaly detection task and the continuous
24 SEVENTH FRAMEWORK PROGRAMME
2.3 Security visualization scenario
analysis of new data , the need for speed and incremental processing of new data pointsis more than obvious. However, this is far from being a trivial requirement. First, theplacement of new points cannot be decided by a function that requires comparison withall the points that have been processed in the past. This first condition argues for acompact and accurate representation of the anomalous points and regions of a graph.Moreover, it argues for a function that can be evaluated using that representation.Second, the function that decides the placement of new points has to exhibit goodperformance. This condition addresses the need for a function with good complexity(e.g. one that is linear on the size of the representation chosen).
Alert correlation.
Another requirement of the VIS-SENSE framework regarding the network analytics com-ponents deals with the development of a novel alert correlation module. The idea consistsin exploiting the triage clustering results to correlate them with security informationobtained by local sensors located on different networks than those used to collect theraw data used in VIS-SENSE.
To achieve this requirement, the framework shall integrate an alert correlation enginethat will provide automatic reasoning about local security alerts and the global threatsidentified and aggregated by the triage module of VIS-SENSE. Some challenges forthis requirement are how to find an appropriate knowledge representation for bridgingthe gap between very different contexts, i.e., how to bridge the gap between tacticalanalysis (local context) and strategic analysis (global context).
Visualization requirements.
As illustrated in Fig. 2.2, the first triage prototype provides some visualization basedon node-link diagrams showing relations between events with respect to multiple features.Those multi-dimensional graphs are currently statically generated using Graphviz1. How-ever, more advanced interactive visualizations (e.g., with the ability to select, zoom, ormove around nodes and edges) would be much more effective for analysing interrela-tionships among security events. Experience has also shown that it is often difficult tofind the most appropriate combination of features to generate the visualization, or tounderstand why certain events have been grouped into an MDC in the first place.
To address these issues, we envision the following requirements regarding the designof new interactive visualization methods:
1Graphviz - Graph Visualization Software http://www.graphviz.org
FP7-ICT-257495-VIS-SENSE 25

2 Visualization of the Internet threat landscape
• visual feature selection and analysis of feature interdependencies (interactivity &understanding).
• visual selection and adjustment of MDC parameters and analysis of parameterchanges (interactivity & understanding).
• suitability to represent very large and complex networks (scalability);
• scalable interactive visual exploration at varying levels of detail (scalability &interactivity);
• enabling the understanding of complex feature relationships and facilitating theinterpretation of the results (interactivity & sense-making);
As suggested in Fig. 2.3, an interface with a feature selection component will berequired. For example, techniques such as visual feature selection could help users tonot only select appropriate sets of features in a more effective and visual manner, butalso identify and mitigate the effects of superfluous data artefacts after feature selection.
At present, the parametrisation of by-feature clustering and MDC is done manuallyvia the console. This could be done interactively via a graphical user interface to providethe expert with more feedback and assist in the fine tuning of data mining activities. Achallenge here will be the fact that most parameter modifications would lead to complexoperations with high latencies.
Future analyses performed with VIS-SENSE shall involve complex relationships amonglarge amounts of security events, which can be modelled as large networks comprisingthousands or even millions of nodes (data items) and edges (relationships). Conventionalvisualization techniques usually fail at such scale and provide unusable results or aretoo slow for interactive visual exploration. Therefore, visualization methods in the VIS-SENSE framework shall be specifically designed for the representation of large and densenetworks, providing meaningful visualizations of the results and of the raw data beingprocessed by the framework. Therefore, if node-link-based visualizations were to bechosen, special care should be given to the choice of a scalable layout algorithm.
At present graph visualizations are restricted to node-link diagrams. An effort will bemade to explore the usefulness of other representations of graphs in the analysis process.Alternatives include adjacency matrices, adjacency lists, as well as the visualization ofa host of statistics which can be used to describe graphs.
Interactive visualization (e.g., with the ability to select, zoom, or move around nodesand edges, or any other data item) shall provide a faster and more fluid approach toexploring interrelationships among security events. To address this issue, we could em-ploy visualization techniques that are based on hierarchical structures, like hierarchical
26 SEVENTH FRAMEWORK PROGRAMME
2.3 Security visualization scenario
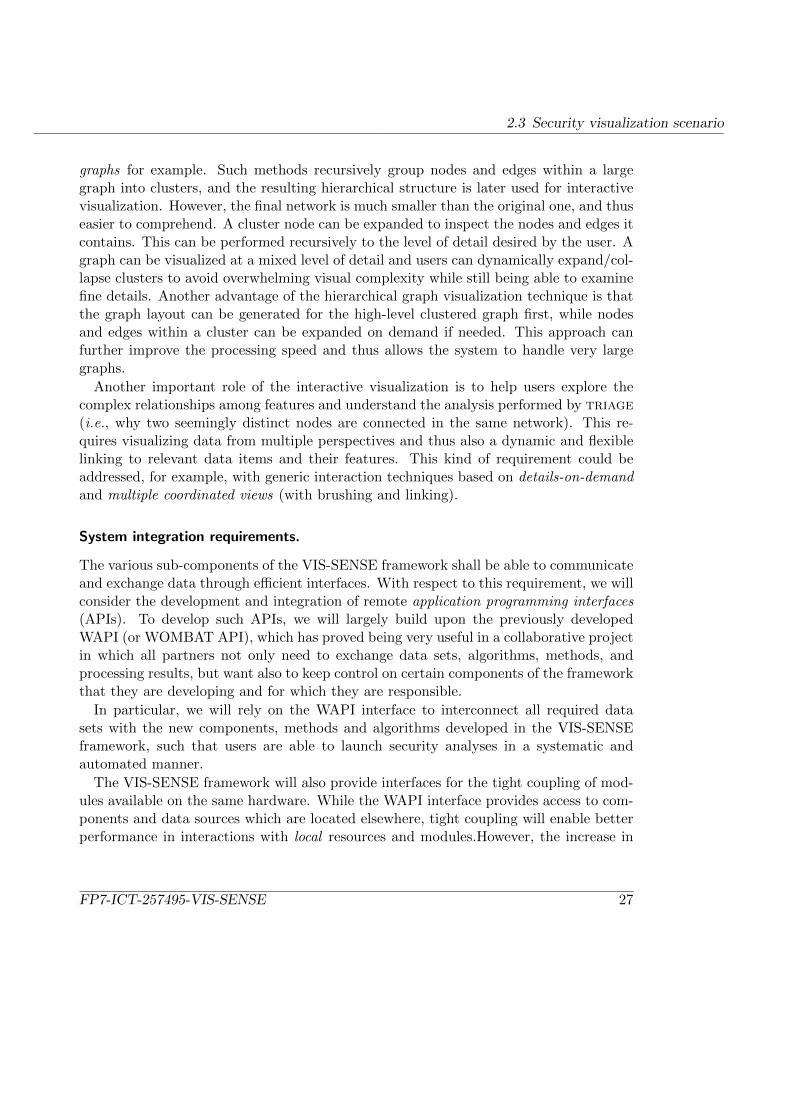
graphs for example. Such methods recursively group nodes and edges within a largegraph into clusters, and the resulting hierarchical structure is later used for interactivevisualization. However, the final network is much smaller than the original one, and thuseasier to comprehend. A cluster node can be expanded to inspect the nodes and edges itcontains. This can be performed recursively to the level of detail desired by the user. Agraph can be visualized at a mixed level of detail and users can dynamically expand/col-lapse clusters to avoid overwhelming visual complexity while still being able to examinefine details. Another advantage of the hierarchical graph visualization technique is thatthe graph layout can be generated for the high-level clustered graph first, while nodesand edges within a cluster can be expanded on demand if needed. This approach canfurther improve the processing speed and thus allows the system to handle very largegraphs.
Another important role of the interactive visualization is to help users explore thecomplex relationships among features and understand the analysis performed by triage(i.e., why two seemingly distinct nodes are connected in the same network). This re-quires visualizing data from multiple perspectives and thus also a dynamic and flexiblelinking to relevant data items and their features. This kind of requirement could beaddressed, for example, with generic interaction techniques based on details-on-demandand multiple coordinated views (with brushing and linking).
System integration requirements.
The various sub-components of the VIS-SENSE framework shall be able to communicateand exchange data through efficient interfaces. With respect to this requirement, we willconsider the development and integration of remote application programming interfaces(APIs). To develop such APIs, we will largely build upon the previously developedWAPI (or WOMBAT API), which has proved being very useful in a collaborative projectin which all partners not only need to exchange data sets, algorithms, methods, andprocessing results, but want also to keep control on certain components of the frameworkthat they are developing and for which they are responsible.
In particular, we will rely on the WAPI interface to interconnect all required datasets with the new components, methods and algorithms developed in the VIS-SENSEframework, such that users are able to launch security analyses in a systematic andautomated manner.
The VIS-SENSE framework will also provide interfaces for the tight coupling of mod-ules available on the same hardware. While the WAPI interface provides access to com-ponents and data sources which are located elsewhere, tight coupling will enable betterperformance in interactions with local resources and modules.However, the increase in
FP7-ICT-257495-VIS-SENSE 27
2 Visualization of the Internet threat landscape
performance does come at the cost of an increase in integrationeffort. A healthy balancein the use of WAPI and the tighter couplings of modules will be sought.
2.3.2 Insights into the spam botnets ecosystem
In this section we will present the chapter’s main scenario. The scenario centres arounda fictional character named Matthew.
Matthew is working as a cyberintelligence analyst in an anti-spam company. His mainrole consists of analyzing new trends in spam operations. In particular, he explores thesignificant developments in the area of spam and their impact on the security landscape.Since spam botnets are largely responsible for sending spam (approximately 80% of thetotal spam volume sent worldwide), Matthew is particularly interested in gaining insightsinto their behaviour. Matthew wants to discover how spammers exploit these botnets tolaunch large-scale spam or phishing campaigns, or to propagate new forms of malwareand viruses. Thanks to this intelligence, the anti-spam company can better protect theircustomer base by continuously improving the technologies used in their spam filteringservices.
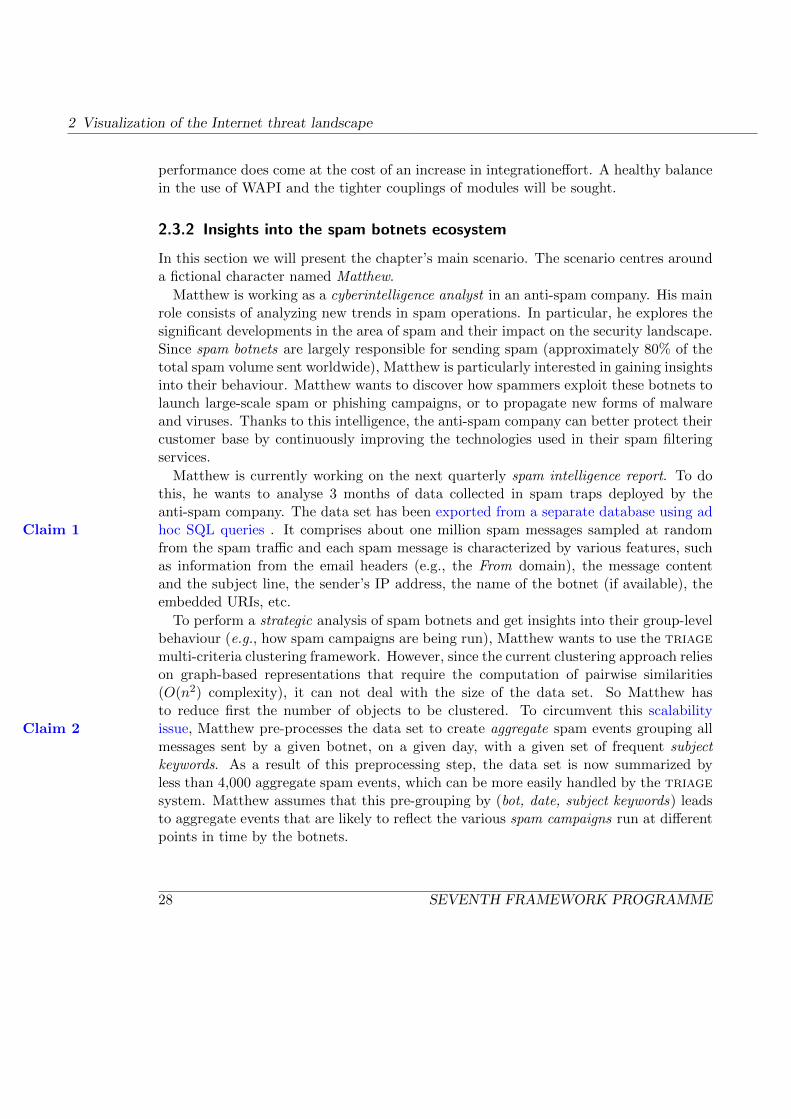
Matthew is currently working on the next quarterly spam intelligence report. To dothis, he wants to analyse 3 months of data collected in spam traps deployed by theanti-spam company. The data set has been exported from a separate database using adhoc SQL queries . It comprises about one million spam messages sampled at randomClaim 1from the spam traffic and each spam message is characterized by various features, suchas information from the email headers (e.g., the From domain), the message contentand the subject line, the sender’s IP address, the name of the botnet (if available), theembedded URIs, etc.
To perform a strategic analysis of spam botnets and get insights into their group-levelbehaviour (e.g., how spam campaigns are being run), Matthew wants to use the triagemulti-criteria clustering framework. However, since the current clustering approach relieson graph-based representations that require the computation of pairwise similarities(O(n2) complexity), it can not deal with the size of the data set. So Matthew hasto reduce first the number of objects to be clustered. To circumvent this scalabilityissue, Matthew pre-processes the data set to create aggregate spam events grouping allClaim 2messages sent by a given botnet, on a given day, with a given set of frequent subjectkeywords. As a result of this preprocessing step, the data set is now summarized byless than 4,000 aggregate spam events, which can be more easily handled by the triagesystem. Matthew assumes that this pre-grouping by (bot, date, subject keywords) leadsto aggregate events that are likely to reflect the various spam campaigns run at differentpoints in time by the botnets.
28 SEVENTH FRAMEWORK PROGRAMME

2.3 Security visualization scenario
Figure 2.4: Showing all imported features in TRIAGE for the spam dataset.
Matthew imports all spam events as well as their respective feature vectors that have Claim 1been created offline, as the two systems (spam database and TRIAGE) are not yetinterconnected by any communication channel or automated interface. The result of thisoperation, which still required a few hours of processing time, is illustrated in Fig. 2.4.
Selecting features.
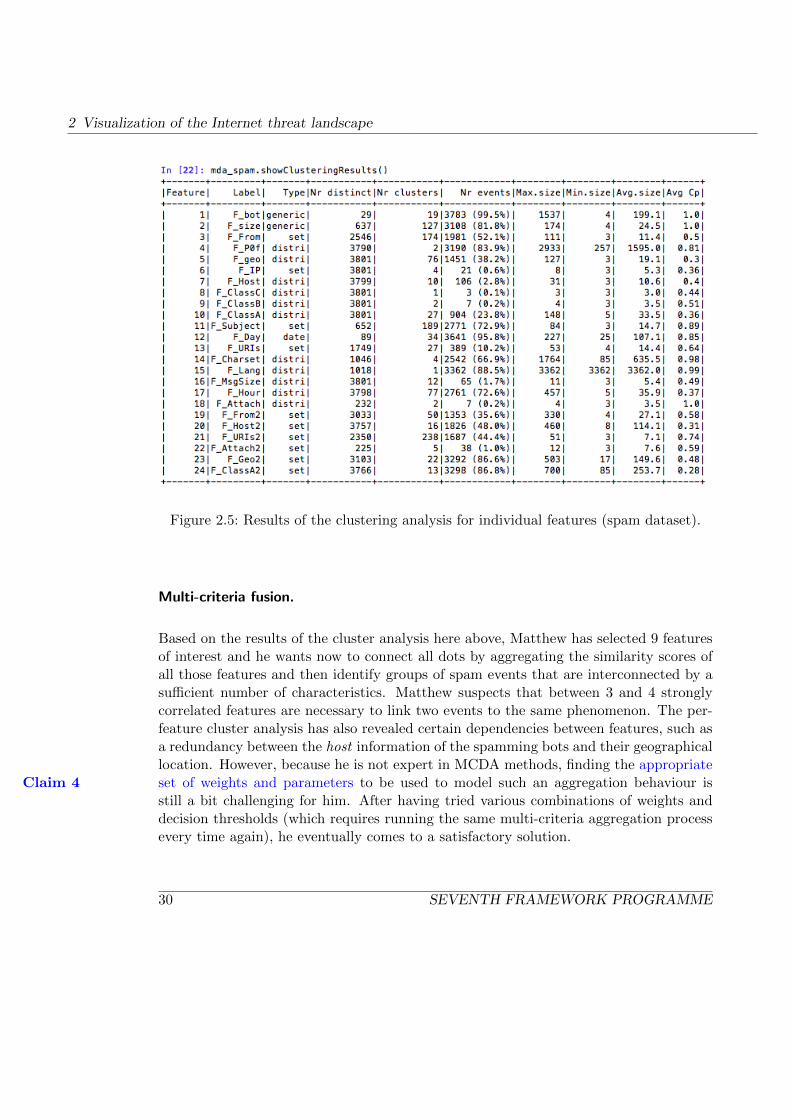
As a domain expert, Matthew can roughly guess which set of features might be appro-priate for running a multi-criteria clustering analysis. However, before selecting features,he still wants to verify his assumptions by analysing the structure of the data set andthe properties of each feature separately, so as to find out which features are sufficientlydiscriminant and which ones have inter-dependencies. This feature selection step, how- Claim 3ever, is tedious and requires quite a lot of time as Matthew must wait for the clusteringprocess to be finished for all features separately. When this is done Matthew can finallylook at the results of the clustering on a feature-by-feature basis, as illustrated in Fig. 2.5.
FP7-ICT-257495-VIS-SENSE 29
2 Visualization of the Internet threat landscape
Figure 2.5: Results of the clustering analysis for individual features (spam dataset).
Multi-criteria fusion.
Based on the results of the cluster analysis here above, Matthew has selected 9 featuresof interest and he wants now to connect all dots by aggregating the similarity scores ofall those features and then identify groups of spam events that are interconnected by asufficient number of characteristics. Matthew suspects that between 3 and 4 stronglycorrelated features are necessary to link two events to the same phenomenon. The per-feature cluster analysis has also revealed certain dependencies between features, such asa redundancy between the host information of the spamming bots and their geographicallocation. However, because he is not expert in MCDA methods, finding the appropriateset of weights and parameters to be used to model such an aggregation behaviour isClaim 4still a bit challenging for him. After having tried various combinations of weights anddecision thresholds (which requires running the same multi-criteria aggregation processevery time again), he eventually comes to a satisfactory solution.
30 SEVENTH FRAMEWORK PROGRAMME
2.3 Security visualization scenario
Results analysis.
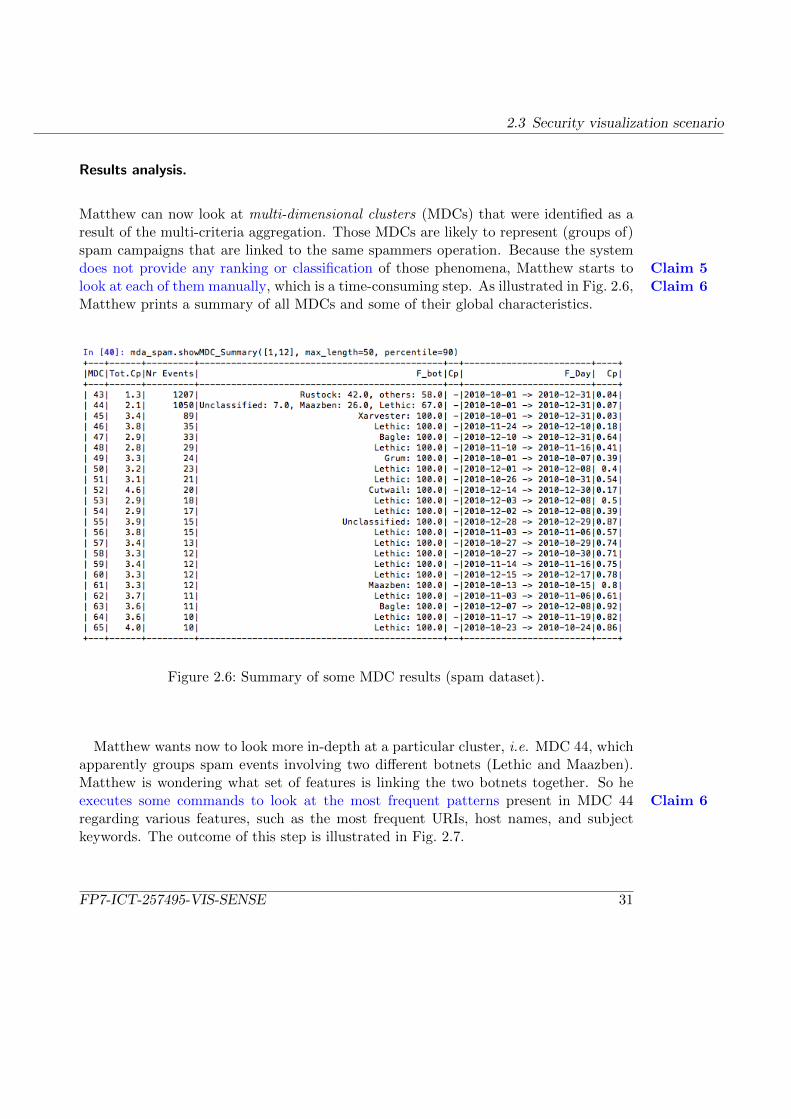
Matthew can now look at multi-dimensional clusters (MDCs) that were identified as aresult of the multi-criteria aggregation. Those MDCs are likely to represent (groups of)spam campaigns that are linked to the same spammers operation. Because the systemdoes not provide any ranking or classification of those phenomena, Matthew starts to Claim 5look at each of them manually, which is a time-consuming step. As illustrated in Fig. 2.6, Claim 6Matthew prints a summary of all MDCs and some of their global characteristics.
Figure 2.6: Summary of some MDC results (spam dataset).
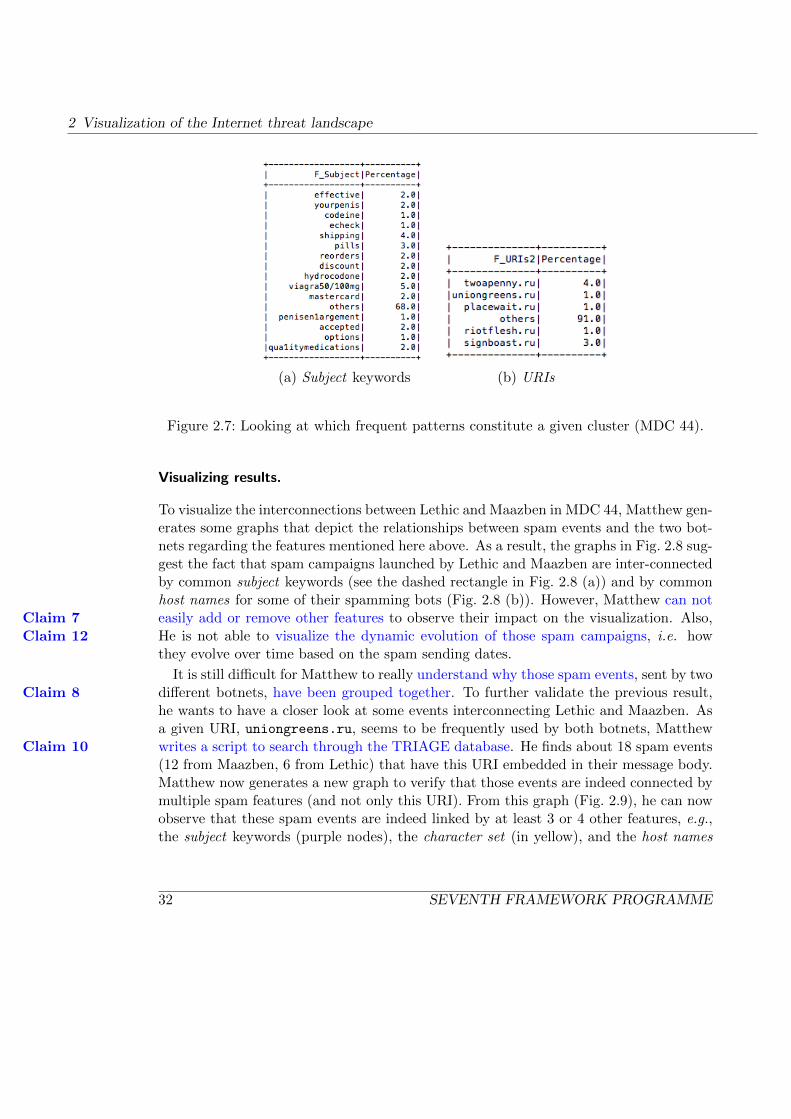
Matthew wants now to look more in-depth at a particular cluster, i.e. MDC 44, whichapparently groups spam events involving two different botnets (Lethic and Maazben).Matthew is wondering what set of features is linking the two botnets together. So heexecutes some commands to look at the most frequent patterns present in MDC 44 Claim 6regarding various features, such as the most frequent URIs, host names, and subjectkeywords. The outcome of this step is illustrated in Fig. 2.7.
FP7-ICT-257495-VIS-SENSE 31
2 Visualization of the Internet threat landscape
(a) Subject keywords (b) URIs
Figure 2.7: Looking at which frequent patterns constitute a given cluster (MDC 44).
Visualizing results.
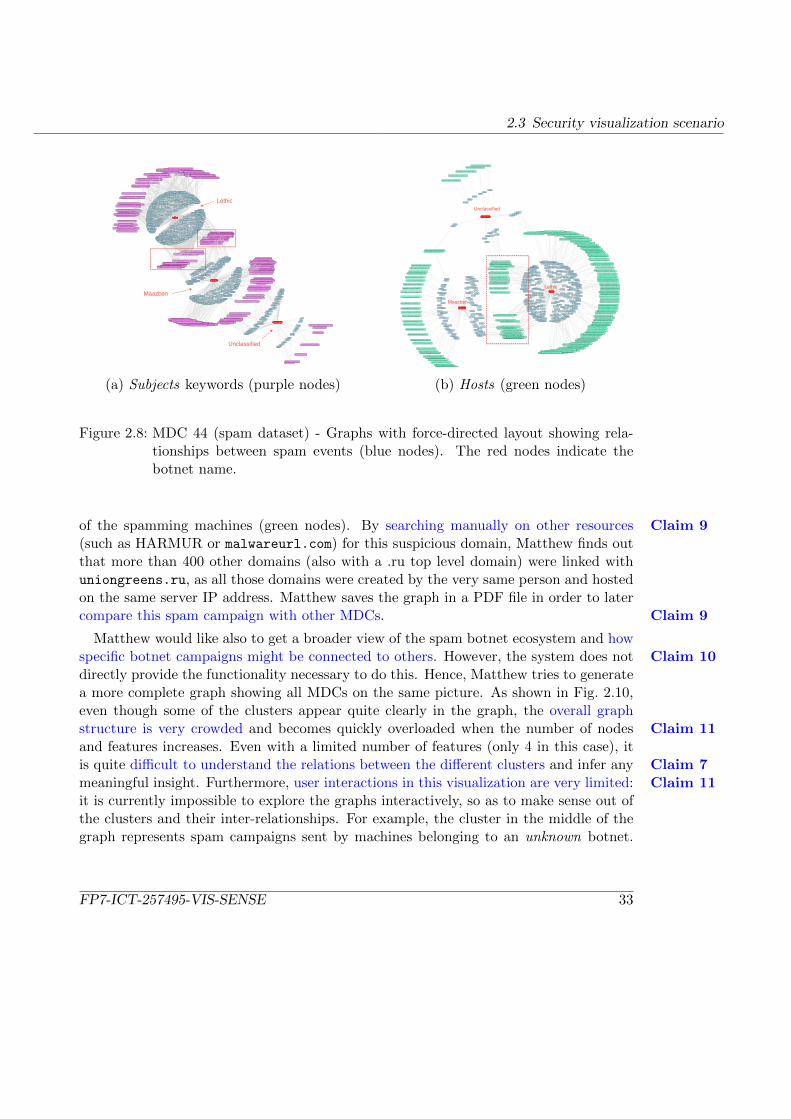
To visualize the interconnections between Lethic and Maazben in MDC 44, Matthew gen-erates some graphs that depict the relationships between spam events and the two bot-nets regarding the features mentioned here above. As a result, the graphs in Fig. 2.8 sug-gest the fact that spam campaigns launched by Lethic and Maazben are inter-connectedby common subject keywords (see the dashed rectangle in Fig. 2.8 (a)) and by commonhost names for some of their spamming bots (Fig. 2.8 (b)). However, Matthew can noteasily add or remove other features to observe their impact on the visualization. Also,Claim 7He is not able to visualize the dynamic evolution of those spam campaigns, i.e. howClaim 12they evolve over time based on the spam sending dates.
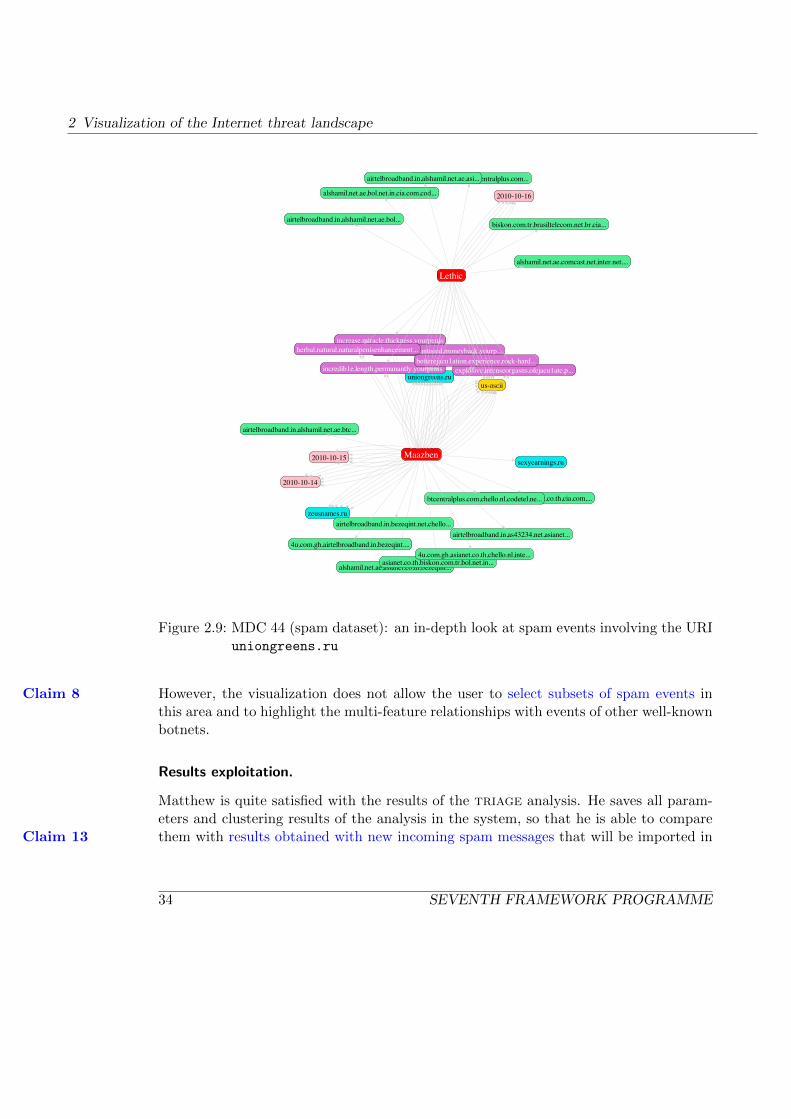
It is still difficult for Matthew to really understand why those spam events, sent by twodifferent botnets, have been grouped together. To further validate the previous result,Claim 8he wants to have a closer look at some events interconnecting Lethic and Maazben. Asa given URI, uniongreens.ru, seems to be frequently used by both botnets, Matthewwrites a script to search through the TRIAGE database. He finds about 18 spam eventsClaim 10(12 from Maazben, 6 from Lethic) that have this URI embedded in their message body.Matthew now generates a new graph to verify that those events are indeed connected bymultiple spam features (and not only this URI). From this graph (Fig. 2.9), he can nowobserve that these spam events are indeed linked by at least 3 or 4 other features, e.g.,the subject keywords (purple nodes), the character set (in yellow), and the host names
32 SEVENTH FRAMEWORK PROGRAMME
2.3 Security visualization scenario
Lethic
Maazben
Unclassified
Maazben
Lethic
Unclassified
(a) Subjects keywords (purple nodes) (b) Hosts (green nodes)
Figure 2.8: MDC 44 (spam dataset) - Graphs with force-directed layout showing rela-tionships between spam events (blue nodes). The red nodes indicate thebotnet name.
of the spamming machines (green nodes). By searching manually on other resources Claim 9(such as HARMUR or malwareurl.com) for this suspicious domain, Matthew finds outthat more than 400 other domains (also with a .ru top level domain) were linked withuniongreens.ru, as all those domains were created by the very same person and hostedon the same server IP address. Matthew saves the graph in a PDF file in order to latercompare this spam campaign with other MDCs. Claim 9
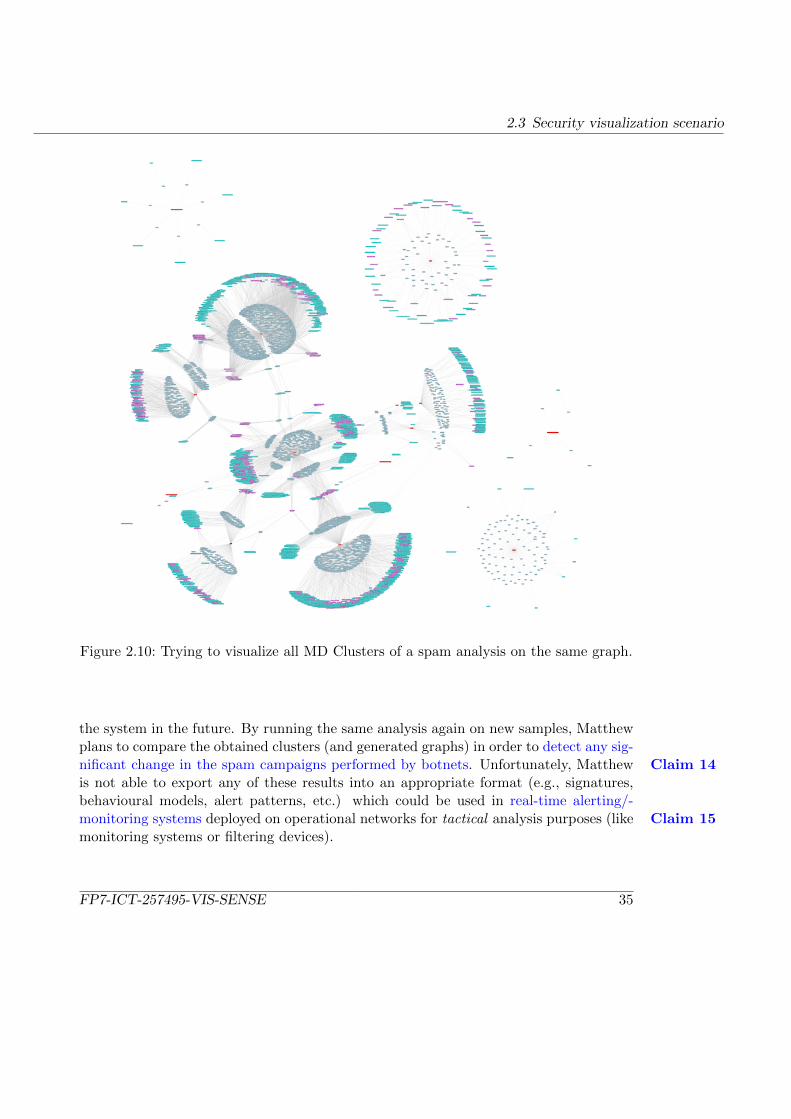
Matthew would like also to get a broader view of the spam botnet ecosystem and howspecific botnet campaigns might be connected to others. However, the system does not Claim 10directly provide the functionality necessary to do this. Hence, Matthew tries to generatea more complete graph showing all MDCs on the same picture. As shown in Fig. 2.10,even though some of the clusters appear quite clearly in the graph, the overall graphstructure is very crowded and becomes quickly overloaded when the number of nodes Claim 11and features increases. Even with a limited number of features (only 4 in this case), itis quite difficult to understand the relations between the different clusters and infer any Claim 7meaningful insight. Furthermore, user interactions in this visualization are very limited: Claim 11it is currently impossible to explore the graphs interactively, so as to make sense out ofthe clusters and their inter-relationships. For example, the cluster in the middle of thegraph represents spam campaigns sent by machines belonging to an unknown botnet.
FP7-ICT-257495-VIS-SENSE 33
2 Visualization of the Internet threat landscape
Maazben
increase,miracle,thickness,yourpenis
2010-10-14
uniongreens.ru
zeusnames.ru
airtelbroadband.in,alshamil.net.ae,btc...
us-ascii
2010-10-15sexyearnings.ru
alshamil.net.ae,asianet.co.th,cia.com,...
everything,guaranteeed,moneyback,yourp...
airtelbroadband.in,as43234.net,asianet...
herbal,natural,naturalpenisenhancement...
alshamil.net.ae,asianet.co.th,bezeqint...
explosive,intenseorgasns,ofejacu1ate,p...
btcentralplus.com,chello.nl,codetel.ne...
asianet.co.th,biskon.com.tr,bol.net.in...
incredib1e,length,permanantly,yourpenis
airtelbroadband.in,bezeqint.net,chello...
4u.com.gh,asianet.co.th,chello.nl,inte...
betterejacu1ation,experience,rock-hard...
4u.com.gh,airtelbroadband.in,bezeqint....
Lethic
2010-10-16alshamil.net.ae,bol.net.in,cia.com,cod...
biskon.com.tr,brasiltelecom.net.br,cia...
brasiltelecom.net.br,btcentralplus.com...
alshamil.net.ae,comcast.net,inter.net....
airtelbroadband.in,alshamil.net.ae,bol...
airtelbroadband.in,alshamil.net.ae,asi...
Figure 2.9: MDC 44 (spam dataset): an in-depth look at spam events involving the URIuniongreens.ru
However, the visualization does not allow the user to select subsets of spam events inClaim 8this area and to highlight the multi-feature relationships with events of other well-knownbotnets.
Results exploitation.
Matthew is quite satisfied with the results of the triage analysis. He saves all param-eters and clustering results of the analysis in the system, so that he is able to comparethem with results obtained with new incoming spam messages that will be imported inClaim 13
34 SEVENTH FRAMEWORK PROGRAMME
2.3 Security visualization scenario
Figure 2.10: Trying to visualize all MD Clusters of a spam analysis on the same graph.
the system in the future. By running the same analysis again on new samples, Matthewplans to compare the obtained clusters (and generated graphs) in order to detect any sig-nificant change in the spam campaigns performed by botnets. Unfortunately, Matthew Claim 14is not able to export any of these results into an appropriate format (e.g., signatures,behavioural models, alert patterns, etc.) which could be used in real-time alerting/-monitoring systems deployed on operational networks for tactical analysis purposes (like Claim 15monitoring systems or filtering devices).
FP7-ICT-257495-VIS-SENSE 35
2 Visualization of the Internet threat landscape
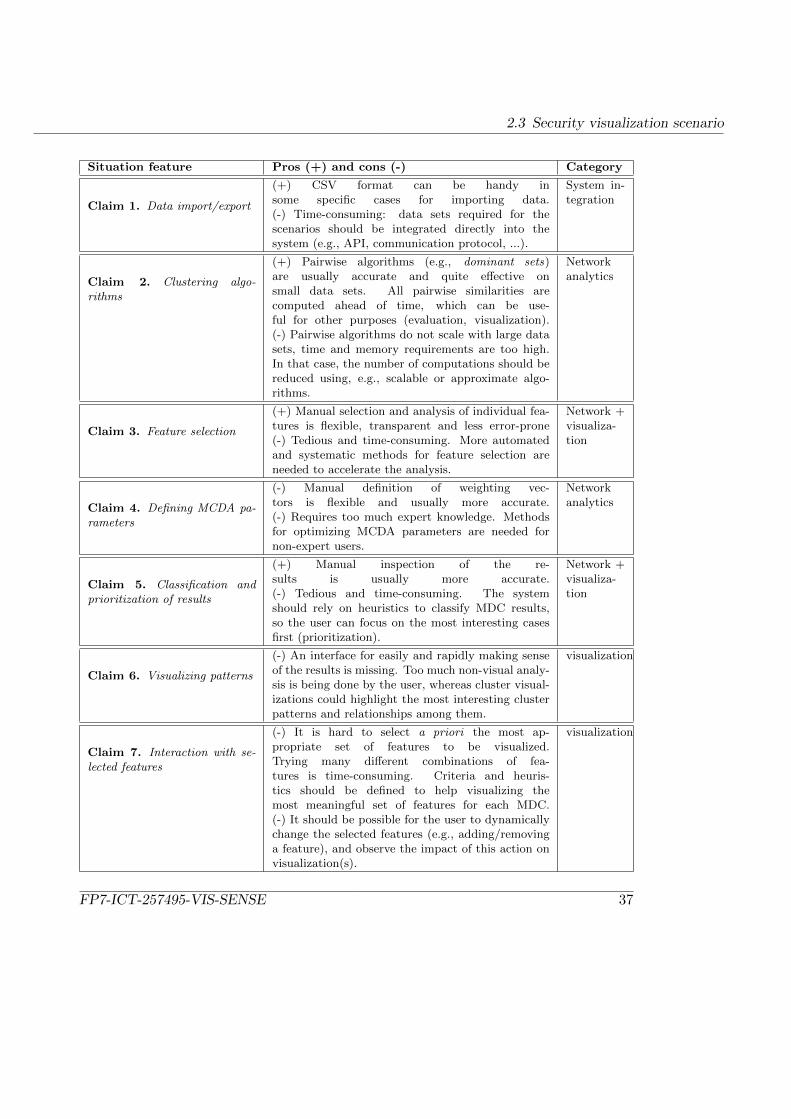
2.3.3 Problem claims
Table 2.1 summarizes the problem claims identified from the current situation of the usecases elaborated in this scenario, as described and illustrated in the previous section.
2.3.4 Activity and interaction design
This Section describes a new scenario relying on an envisioned system that incorporatesmost of the requirements identified previously.
Matthew, a cyberintelligence analyst working in an anti-spam company, is currentlyworking on the next quarterly spam intelligence report. For this analysis he wants touse the VIS-SENSE framework, an intelligence tool featuring flexible visual analyticscapabilities. Matthew selects a three-month data set collected by distributed spam trapsvia the graphical user interface. The data is automatically imported and analysedby the system. The selected data set comprises about one million spam messagessampled from the spam traffic. Each spam message is characterized by many differentfeatures, such as the From domain, the subject line, the sender’s IP address, the nameof the botnet (if available), the embedded URIs, etc.
All these features are automatically used by the TRIAGE attribution algo-rithms to create clusters representing spam campaigns which are likely linked to thesame spammers’ operations. The aggregation of all features is executed with the helpof a behavioural model defined by Matthew. Thanks to the MCDA software wizardprovided by the system, Matthew is able to easily and precisely model his expectationsregarding the required number of correlations, their strengths, and their interdependen-cies, so as to guide the system in the subsequent clustering and incremental classifi-cation process. Also, to help in the selection of an appropriate set of features to beincluded in the aggregation model, Matthew could visually assess the interdepen-dencies between all features by making use of the visual feature selection assistant.Based on randomly chosen samples, this module shows a visual representation of thestructure of the data set with respect to the different features, and highlights anystatistical interdependencies among them ( i.e., redundance and relevance).
The main screen of the system shows a classification performed by the systemfor the three-month data set that Matthew has selected. A number of phenomena,representing various spam campaigns, have been identified and these are automaticallyranked based on various characteristics, such as their size, threat and activity level,etc. Matthew can immediately visualize any significant change detected amongthose phenomena, most of which are run through large spam botnets. For example,Matthew can directly visualize the life cycle of spam campaigns, i.e. when they started
36 SEVENTH FRAMEWORK PROGRAMME
2.3 Security visualization scenario
Situation feature Pros (+) and cons (-) Category
Claim 1. Data import/export
(+) CSV format can be handy insome specific cases for importing data.(-) Time-consuming: data sets required for thescenarios should be integrated directly into thesystem (e.g., API, communication protocol, ...).
System in-tegration
Claim 2. Clustering algo-rithms
(+) Pairwise algorithms (e.g., dominant sets)are usually accurate and quite effective onsmall data sets. All pairwise similarities arecomputed ahead of time, which can be use-ful for other purposes (evaluation, visualization).(-) Pairwise algorithms do not scale with large datasets, time and memory requirements are too high.In that case, the number of computations should bereduced using, e.g., scalable or approximate algo-rithms.
Networkanalytics
Claim 3. Feature selection
(+) Manual selection and analysis of individual fea-tures is flexible, transparent and less error-prone(-) Tedious and time-consuming. More automatedand systematic methods for feature selection areneeded to accelerate the analysis.
Network +visualiza-tion
Claim 4. Defining MCDA pa-rameters
(-) Manual definition of weighting vec-tors is flexible and usually more accurate.(-) Requires too much expert knowledge. Methodsfor optimizing MCDA parameters are needed fornon-expert users.
Networkanalytics
Claim 5. Classification andprioritization of results
(+) Manual inspection of the re-sults is usually more accurate.(-) Tedious and time-consuming. The systemshould rely on heuristics to classify MDC results,so the user can focus on the most interesting casesfirst (prioritization).
Network +visualiza-tion
Claim 6. Visualizing patterns
(-) An interface for easily and rapidly making senseof the results is missing. Too much non-visual analy-sis is being done by the user, whereas cluster visual-izations could highlight the most interesting clusterpatterns and relationships among them.
visualization
Claim 7. Interaction with se-lected features
(-) It is hard to select a priori the most ap-propriate set of features to be visualized.Trying many different combinations of fea-tures is time-consuming. Criteria and heuris-tics should be defined to help visualizing themost meaningful set of features for each MDC.(-) It should be possible for the user to dynamicallychange the selected features (e.g., adding/removinga feature), and observe the impact of this action onvisualization(s).
visualization
FP7-ICT-257495-VIS-SENSE 37
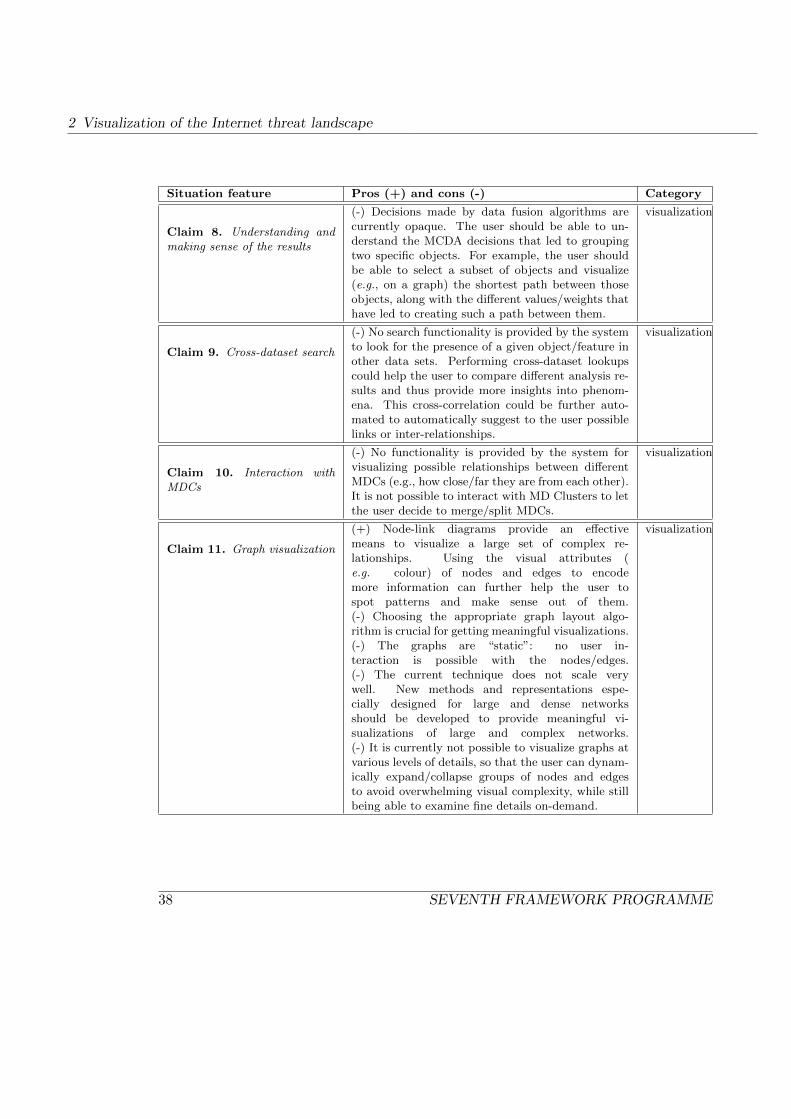
2 Visualization of the Internet threat landscape
Situation feature Pros (+) and cons (-) Category
Claim 8. Understanding andmaking sense of the results
(-) Decisions made by data fusion algorithms arecurrently opaque. The user should be able to un-derstand the MCDA decisions that led to groupingtwo specific objects. For example, the user shouldbe able to select a subset of objects and visualize(e.g., on a graph) the shortest path between thoseobjects, along with the different values/weights thathave led to creating such a path between them.
visualization
Claim 9. Cross-dataset search
(-) No search functionality is provided by the systemto look for the presence of a given object/feature inother data sets. Performing cross-dataset lookupscould help the user to compare different analysis re-sults and thus provide more insights into phenom-ena. This cross-correlation could be further auto-mated to automatically suggest to the user possiblelinks or inter-relationships.
visualization
Claim 10. Interaction withMDCs
(-) No functionality is provided by the system forvisualizing possible relationships between differentMDCs (e.g., how close/far they are from each other).It is not possible to interact with MD Clusters to letthe user decide to merge/split MDCs.
visualization
Claim 11. Graph visualization
(+) Node-link diagrams provide an effectivemeans to visualize a large set of complex re-lationships. Using the visual attributes (e.g. colour) of nodes and edges to encodemore information can further help the user tospot patterns and make sense out of them.(-) Choosing the appropriate graph layout algo-rithm is crucial for getting meaningful visualizations.(-) The graphs are “static”: no user in-teraction is possible with the nodes/edges.(-) The current technique does not scale verywell. New methods and representations espe-cially designed for large and dense networksshould be developed to provide meaningful vi-sualizations of large and complex networks.(-) It is currently not possible to visualize graphs atvarious levels of details, so that the user can dynam-ically expand/collapse groups of nodes and edgesto avoid overwhelming visual complexity, while stillbeing able to examine fine details on-demand.
visualization
38 SEVENTH FRAMEWORK PROGRAMME

2.3 Security visualization scenario
Situation feature Pros (+) and cons (-) Category
Claim 12. Dynamic plotting
(+) The TRIAGE framework is integrated to ascripting environment (Python/Matplotlib), whichallows almost any type of graph to be created.(-) Difficult to use for non-expert users. A visualinterface should be provided to dynamically createvarious charts (e.g., line or scatter plots, pie charts,time charts, histograms, geographical maps) withany combination of 2/3 features. When time infor-mation is present, it should be possible to dynami-cally adjust the time frame used in the visualization.
visualization
Claim 13. Incremental analy-sis
(-) The system does currently not support incremen-tal analysis. However, clustering results from previ-ous analyses could be used as a basis for classifyingnew samples.
Networkanalytics+ visual-ization
Claim 14. Exploiting resultsfor anomaly detection
(-) Analysis results are mainly used for strategicpurposes, i.e., understanding attackers behaviours.However, detecting any change in those behavioursrequire manual analysis by a human expert. Meth-ods for anomaly detection could provide the userwith alerts when significant changes are detected inthe analysis of new samples.
Networkanalytics
Claim 15. Exploiting resultsfor alerting systems
(-) Analysis results are not currently used for tacticalpurposes on operational networks. Generating deci-sion and correlation rules from MDC results and us-ing them as input to alert correlation systems couldhelp specific categories of users to monitor their net-works (e.g., network administration, security ana-lysts).
Networkanalytics
Table 2.1: Problem claims for Scenario 1: Visualization of the Internet threat landscape
FP7-ICT-257495-VIS-SENSE 39
2 Visualization of the Internet threat landscape
or ended, when their activity level increased or decreased, which botnets were used, orwhen new kinds of campaigns seemed to appear in this threat landscape.
On the main screen, a particular phenomenon is drawing Matthew’s attention. Alarge cluster of spam messages (MDC 44) seems to involve two different botnets, namedLethic and Maazben, for a short amount of time (i.e., a few days). By selecting thiscluster, Matthew can directly visualize the aggregate patterns that characterizethis spam phenomenon, and how they evolve over time using a time selection func-tionality. To better understand the interconnections between the two botnets Matthewuses the framework to visualize the relationships between spam messages with respectto various features. Since the cluster contains a very large number of spam messages,only representative prototypes for the various features are shown. This is to avoidoverwhelming visual complexity. The prototypes can be dynamically expandedand more details can be shown on-demand if needed. Furthermore, techniques fortemporal exploration allow Matthew to focus on particular periods of time.
Thanks to these visualizations, Matthew discovers that the Lethic and Maazben bot-nets seem to share certain spamming bots and have run very similar campaigns in a giventime period. By limiting the time selection to a specific period, he can now focus ona subset of spam messages that seem to interconnect the two botnets. Matthew candynamically add and remove other features and observe their impact on the visu-alization. For example, by adding the features “From domains” and “Embedded URIs”Matthew notices that a subset of URIs (such as uniongreens.ru, sexyearnings.ru, andzeusnames.ru) were used in similar spam campaigns sent by both botnets, but on con-secutive dates. By highlighting the relations between spam messages, Matthewcan also understand in this visualization why they were grouped together in the samephenomenon, even though they were sent by different botnets. Similarity scores for theselected features, as well as their aggregated score as calculated by the MCDA modelare used as visual cues (e.g., using the length of the paths between nodes in graph-basedvisualizations). By clicking on those common and frequently used URIs, Matthew cannow search across other data sets, such as HARMUR, and finds that a large numberof other URIs related to scam activities were linked to the same individuals who haveregistered more than 400 domain names in the .ru top level domain using the sameregistrant information.
Matthew would like to get a broader view of the spam botnet ecosystem andhe is wondering if other spam phenomena might be linked to this one. Going backto the main screen, he selects another visualization that provides an overview of allspam phenomena that are somehow close, or at least related, to this Lethic/Maazbenphenomenon. Thanks to the prototype-based representation, the system can showa very large number of spam messages on the same screen and highlight similarities
40 SEVENTH FRAMEWORK PROGRAMME

2.4 Other possible scenarios
or differences between multiple phenomena (or spam clusters). Matthew discovers thatanother cluster was created with very similar characteristics as the previous one. Hedecides to interactively merge the two clusters with the help of the user interface.As a result, the system shows Matthew which (lower) decision threshold should beused in the aggregation model in future to automatically attribute new spam samplesto this phenomenon.
As spammers seem to be increasingly using shortened URL services, Matthew launchesa search in the system for spam phenomena in which shortened URLs are being usedas URIs embedded in the message content. The result of this action shows that twodistinct campaigns involved this new kind of activity at different periods in time. Thus,Matthew discovers that not all botnets were used for these kinds of operations.
Matthew now selects another phenomenon in which spam messages sent from an un-known botnet were grouped together with other messages sent by Rustock, a very largeand well-known spamming botnet. Using the provided visualizations, Matthew canhighlight the similarity between the unclassified spam messages and the classifiedones, so that he can understand why those spam messages were missed by the signature-based systems used to attribute spam to known botnets. Thanks to this information, heis now able to create an updated set of signatures for this botnet, which could beused for tactical analysis purposes in spam filtering systems.
2.4 Other possible scenarios
2.4.1 Visual analysis of the malware threat ecosystem
Andrew is a malware analyst working for a security software company. One of the taskshe is responsible for consists of analyzing new incoming threats observed by honey-potsensors in order to continuously monitor the malware threat ecosystem, and detect anysignificant change in the properties of known or unknown malware families.
Every day, Andrew starts his work by looking at the latest malware analysis resultsgiven by the VIS-SENSE cyberintelligence framework. About 1,000 new malware sam-ples are automatically imported from the SGNET honey-pot network every night, andthese are automatically analysed and classified by the system. The main screen ofthe system interface shows Andrew a classification of the malware families ranked bytheir activity and threat level. Andrew is directly notified by the system of any signif-icant change detected among the malware families. For example, malware variants forwhich a number of characteristics have changed quite significantly, or any new malwarefamily that was created in the system would be highlighted.
Today, the set of new malware samples analysed during the night led apparently to
FP7-ICT-257495-VIS-SENSE 41

2 Visualization of the Internet threat landscape
the creation of a new malware cluster. So Andrew selects this cluster to get more detailsabout it. Since he is interested in getting a broader view on the current malware ecosys-tem first, Andrew generates a visualization showing him an overview of all malwareclusters that are close or at least related to this new malware family. Because of severalstrong inter-relations with respect to certain static and behavioural features, it appearsthat this new malware family is actually closely related to the Allaple polymorphic worm.In particular, it seems to be related to four other variants of the worm. However, thisnew variant does not seem to have an anti-virus label yet.
Andrew wants to get more insight into the Allaple family and the new unknown vari-ant. So he selects another interactive visualization, showing him the relationships amongall malware samples. This malware family is made up of a very large number of sam-ples. For scalability reasons and to avoid overwhelming visual complexity the systemonly shows representative prototypes belonging to this malware family. Prototypes areclearly marked in the visualization and, if needed, Andrew can dynamically expand/-collapse those representations of large groups of samples so that he can examine finedetails on-demand.
The system has automatically selected a set of three features for the visualization,based on the entropy and the discriminant properties of the various code features. Thesespecific features seem to underlie the creation of the new cluster. Andrew still wantsto add some other informative features, so he checks them on the sidebar and observesimmediately their impact on the visualization layout. However, the general structureand shape does not change very much, which is confirmed by some quantifiers in thesidebar indicating a high redundancy between the features added by Andrew and anotherfeature already selected by the system. To further assess this interdependency amongcertain features, Andrew opens a new window for visual feature selection, in whichhe can visually assess the inter-dependencies among a set of selected features.
Looking back at the visualization, Andrew is still wondering why two malware samples,apparently quite different, were classified in this new malware cluster. By selecting thosetwo visual representations, the relation between them is automatically highlighted inthe visualization, along with an indication of the similarity scores for the selectedfeatures and the aggregated score. Since these values were used by the data fusionalgorithm to group all the related samples, Andrew can now better understand therationales of the automated classification. Because of polymorphism and probably alsosome recompilation or code patching artefacts, the two polymorphic samples come fromthe same code base but they have apparently evolved, and may thus look quite differentat first sight. However, they are strongly linked with other “intermediate” sampleshaving a number of highly similar features in common with them.
Looking now at the IP addresses, Andrew finds out that a huge number of samples
42 SEVENTH FRAMEWORK PROGRAMME
2.4 Other possible scenarios
seem to originate from a single IP. By selecting this IP, Andrew can now query the systemto look for other activities coming from the very same source in the same time frame.It turns out that the source was apparently also infected with another malware used totransform the machine into a bot belonging to Rustock, a botnet used by spammers forsending large spam campaigns.
2.4.2 Visual analysis of the Web threat dynamics
Leyla is a threat analyst working for a security company specialized in web security. Oneof her daily tasks consists of analysing the threat ecosystem of the World Wide Web,and studying the origins and prevalence of client-side threats, along with their life cycleand their evolution.
Recently, a new phenomenon drew the attention of security analysts within the com-pany. Large-scale campaigns are currently being launched by criminals for the distribu-tion of rogue AV software. To combat this newly emerging threat, Leyla wants to get abetter understanding of how these rogue AV campaigns are being organized by cyber-criminals and how they evolve. Using the VIS-SENSE framework, she has selected about6,000 domain names from the HARMUR data set, which are supposedly linked to thisrogue AV phenomenon because of various criteria defined in the name patterns and thetypes of threats found on the corresponding websites. For each rogue domain, a set ofrelevant features were automatically imported from HARMUR to characterize thedomains with respect to different aspects, such as web server IPs, name servers (DNS),ISPs and WHOIS information (registrant and registrar names, and creation dates).
Leyla wants to have a broader overview of the rogue AV landscape. By further ex-tending her search criteria and the analysis time period, Leyla ends up with a largerdata set made up of 50,000 suspicious domain names. Despite the size of this dataset, the system can still process the data in a reasonable time thanks to very efficientclustering algorithms.
Leyla wants to analyse this set of rogue AV domains and their features with thetriage multi-criteria clustering engine of the VIS-SENSE framework. To determinewhat set of features might be most appropriate to perform this multi-criteria analysis(MCDA), Leyla starts the visual feature selection module, which quickly revealsthe underlying structure of the data set and the properties of the features,like their discriminant nature and possible inter-dependencies. The visualization of theseinterdependencies let Leyla clearly understand that some of the features may be highlyredundant (e.g., web server IP addresses and the corresponding Class A/B/C-subnets,or the mapped countries of origin of these addresses). Thanks to this visual analysis,Leyla can quickly and effectively select an appropriate set of features to include
FP7-ICT-257495-VIS-SENSE 43
2 Visualization of the Internet threat landscape
in the MCDA analysis.Leyla wants the VIS-SENSE system to attribute any rogue AV domain to the same
root cause, and then create multi-dimensional clusters (MDCs), with domains sharing atleast three strong similarities, no matter which combination it is. Using the MCDA op-timization module, Leyla can enter her preferences for the aggregation model,as well as the interdependencies found previously in the visual feature selection mod-ule. The system then optimizes all the parameters of the aggregation model to beused in the analysis. However, Leyla is still able to check the consistency of theparameters by visualizing the result of the aggregation on some randomly-chosen datasamples, and she can also observe the contribution of each feature and the influenceof the weights chosen by the system. If needed, Leyla can still adapt those weightsto better reflect how she wants to group rogue AV domains.
The fusion of all features and the identification of phenomena takes only a fewminutes. So Leyla can now look at the groups, or MDCs (multi-dimensional clusters),found by triage as outcome of the MCDA analysis. These MDCs are likely to representvarious campaigns run by the same individuals and these are ranked by the systembased on different criteria that Leyla is able to select (e.g., their size, their averagethreat level, etc.).
Leyla wants to look at the top-ranked MDC, which comprises about 8,000 domainsapparently created over an extended period of time (almost 2 years), and for which mostof the domains seem to be linked to just a few registrant email addresses. Using anothervisualization module, Leyla can obtain a quick visual overview of the significantpatterns of this large-scale campaign and how they have evolved over time duringthe whole lifetime of the campaign. She can clearly observe that the hosting web serversoriginally located in the U.S. and in Germany have suddenly migrated to ISPs locatedin China. Different email accounts were used to register those domains, however, thesame email domain (@id-private.com) was used in 90% of the cases, even after themigration to China.
To visualize the patterns of this large-scale campaign, Leyla selects another visual-ization representing the rogue AV domains, some of their features and the relationshipsbetween them. The system has automatically selected a set of three features forthe visualization. The selection is based on their properties and whether or not theyunderlie the creation of this cluster.
For scalability reasons, only some of the domains, chosen as representative proto-types, are being represented. However, Leyla can still dynamically expand/collapsethose prototypes representing large groups of domains, so that she can examine fine de-tails on-demand. Furthermore, the interaction techniques for temporal exploration allowLeyla to focus on particular periods of time of this phenomenon, or to observe how it
44 SEVENTH FRAMEWORK PROGRAMME

2.4 Other possible scenarios
has evolved over time with respect to the selected features. By selecting a larger periodof time, Leyla observes that certain domains, created at dates that are far from eachother actually have nothing in common. Hence, to understand why those two domainswere still attributed to the same phenomenon, Leyla selects them and lets the systemhighlight the similarities that interconnect the two domains. Leyla can nowunderstand what set of similar features this chain of domains have in common and howtheir characteristics have evolved.
To have a broader view of the whole rogue AV ecosystem and how this specific cam-paign might be connected to others, Leyla selects another visualization showing anoverview of all clusters that are close to or related to the selected one. In thisinteractive visualization Leyla can eventually decide to merge or split certain clus-ters, if needed. The parameters of the aggregation model are then automaticallyupdated for subsequent analyses.
Since Leyla is satisfied with the results. She saves all parameters and clustering resultsof the analysis in the system, and starts an incremental clustering process that willcontinuously monitor the database and automatically classify new rogue AV domainsas soon as they are fed into the system from HARMUR. She can also set an alertingfunction with the anomaly detection module, which will notify her as soon as asignificant change in the rogue AV campaigns is observed (e.g., a new cluster with totallydifferent characteristics and patterns, or an existing cluster increasing substantially insize, etc.).
Finally, Leyla can export selected clusters and let the system create high-level de-scriptions of them (i.e., signatures), which can then be used for tactical analysis pur-poses in other monitoring or filtering devices.
FP7-ICT-257495-VIS-SENSE 45
3 Analysis and Visualisation of Attacks against theControl Plane (BGP)
3.1 Introduction
In this scenario, we aim at collecting and analyzing data about the state of the Inter-net routing infrastructure to correlate them with other sources of information relatedto attacks targeting end hosts. We want to take advantage of routing data analysistechniques and visual analytics tools to highlight the existence, or the absence of attacksagainst the Border Gateway Protocol (BGP). We will run experiments to demonstratethat our system would find them if they exist and, if they exist, we will investigate themodus operandi of the attackers. Finally, we want to confirm, or not, the existence ofspammers suspected of performing attacks against BGP to allow them to send spam ina stealthy way (i.e., the so-called “fly-by spammers”).
When considering attacks on the Internet routing infrastructure, we refer to BGPhijacking (or IP prefix hijacking). This attack consists in taking control of blocks of IPaddresses owned by a given administrative entity, called an Autonomous System (AS),e.g., a company or a governmental institution, without their authorization. This enablesthe attacker to disrupt or spy on the communications related to these addresses, or touse the stolen network addresses as its own.
However, due to the hypothetical nature of the attacks against BGP, the overall goal ofthis scenario is to make a contribution to the discourse on control plane threats analysis.
The main data sources used as input for this scenario will provide information aboutthe state of the routing infrastructure collected from two different perspectives: the firstone at the data plane and the second one at the control plane. More specifically, thefollowing datasets will be used to achieve the scenario goals:
• Spamtracer, which focuses on monitoring the IP/AS forwarding paths, enrichedwith BGP routing information, towards specific IP addresses or networks (e.g.,spammers) in order to analyse routing anomalies;
• A BGP dataset providing raw routing information collected from different BGPfeeds in the control plane (e.g., BGP announcements, RIB, etc), enabling the
46

3.2 BGP Scenario 1
analysis of routing anomalies or the detection of possible BGP hijacks anywherein the Internet.
As one can see, the two datasets here above provide quite different starting points andperspectives, and ask thus for very different analysis approaches. Spamtracer continu-ously monitors forwarding paths observed in the data plane and for a restricted set of IPaddresses selected based on well-defined criteria (e.g., IP sources involved in maliciousactivities like spam or network attacks, C&C servers, etc). Whereas the second BGPdataset gathers massive information from the control plane, such as BGP announce-ments and entries from routing tables (Routing Information Base, or RIB), from manydifferent vantage points and without any pre-selection of IP networks/addresses, nor anyassumption about suspicious AS’es to monitor.
Note that the ultimate goals of these two approaches are fairly similar (i.e., detectionand analysis of BGP hijackers); however, the underlying data and methods to reach thesegoals are still very different. Note that both datasets are still being actively developedand maintained by partners of the project, and will soon be made WAPI-enabled tofacilitate the access and sharing of data.
As introduced here above, our main objective in this scenario is to find a correlationbetween possible BGP hijacks and other malicious activities occurring in the Internet.Security software companies and researchers are quite likely to be interested in exploitingthese results. However, all the data collection infrastructure as well as the developedanalysis techniques could also be leveraged by ISPs or CERT teams to detect attacksagainst the Internet routing infrastructure.
In the rest of this Chapter, we will further develop the two BGP analysis scenariosintroduced here, i.e., the detection and analysis of fly-by spammers (Section 3.2) andthe analysis of BGP routing anomalies (Section 3.3).
3.2 BGP Scenario 1
This Section describes the first BGP scenario related to the analysis of the hypotheticalfly-by spammers phenomenon. This scenario takes advantage of data provided by theSpamtracer dataset, described in Section 3.2.1. This scenario is illustrated with a real-world use case (in Section 3.2.3) that will help define the problem claims that will haveto be dealt with in the designed system (Section 3.2.4). Finally, in Section 3.2.5, wedescribe a new activity and interaction design scenario in which we try to incorporateall the user requirements identified.
FP7-ICT-257495-VIS-SENSE 47
3 Analysis and Visualisation of Attacks against the Control Plane (BGP)
3.2.1 The Spamtracer framework
The Spamtracer framework builds upon two modules: a data collection module and arouting anomaly detection and analysis module. It aims at monitoring networks hostingmalicious hosts to find those exhibiting routing anomalies. The data collected consistsof traceroute paths to malicious hosts, enriched with metadata (mainly BGP data) fromdifferent repositories (e.g., AS-level paths built using live RouteViews BGP data).
An intuitive solution to analyzing collected data would be to take advantage of themulti-criteria analysis capabilities of the triage framework introduced in section 2.2.Applied to our data, this technique would allow us to find the root causes of a setof routing events recorded in the data based on how similar they are with respect tothe available features. A routing event can be, for instance, a conflict between twoautonomous systems announcing the same IP prefix. The triage process can thengroup together events that are similar enough according to the model defined. However,due to the characteristics and properties of the data, defining appropriate models ofBGP hijacks to be used in triage is not as straightforward. For this reason, it will benecessary to exploit new approaches to analyzing routing data to find BGP hijacks.
In order to take advantage of the specificities of the data, some analysis algorithmshave recently been elaborated by some partners while developing the Spamtracer infras-tructure. Two approaches have been considered: the first approach is referred to asa top-down approach whereas the second one is referred to as a bottom-up approach.The top-down approach consists of defining routing anomalies, e.g., Multiple-OriginAutonomous System (MOAS), based on BGP hijack scenarios, then detecting theseanomalies and finally analyzing them to determine whether they are actually benignor malicious. This technique relies on control-plane data to define the anomalies butall features from the data and control planes can be leveraged in the analysis of theanomalies.
The bottom-up approach consists of mining the data to uncover different kinds ofrouting changes (e.g., a traceroute path to a Russian target ends in Russia one day andin the US the day after). The observed routing changes are not derived from any BGPhijack scenario but they rather highlight suspicious patterns that could be investigated.
While the bottom-up approach allows suspicious routing patterns to be easily uncov-ered within the data, the results are sometimes very hard to interpret. The reason isthat these patterns are not derived from BGP hijack scenarios. The top-down approach,instead, allows to focus on studying routing anomalies that are more likely due to BGPhijacks. The scenario described in the following section makes thus use of a top-downanalysis approach to study BGP hijacking and their possible use to assist spam activities.
48 SEVENTH FRAMEWORK PROGRAMME

3.2 BGP Scenario 1
3.2.2 High-level requirements
In order to study attacks against the Internet routing infrastructure and the possiblecorrelation with other malicious entities, the system designed for VIS-SENSE shouldfulfil the requirements described below. These will ensure that appropriate analysis andvisualization techniques can be applied on the collected data.
Data collection.
In order to monitor the Internet routing infrastructure to detect routing anomalies andfind those that are malicious, data from both the data plane and the control plane shouldbe collected. Collecting control plane data seems obvious as it represents the raw routinginformation exchanged by interconnected parties in the Internet. The data plane alsoprovides information about the networks topology by uncovering the forwarding decisionstaken by the routers when packets flow from a source host to a destination host. Thetwo types of data are thus relevant when analyzing routing anomalies as they provide adifferent view of the routing infrastructure. In VIS-SENSE, the data collected to studypossible attacks against BGP is required to include routing information from the dataplane and the control plane.
BGP hijack detection.
In VIS-SENSE, different BGP hijack detection techniques should be leveraged in orderto take advantage of the diversity of the collected data. First, existing techniques shouldbe used and new techniques should be developed to take advantage of BGP (controlplane) data. Second, existing techniques should be used and new techniques should bedeveloped to take advantage of data plane routing information, i.e., forwarding paths.Finally, the hijack detection techniques should take advantage of the fact that bothcontrol plane and data plane routing information is collected to correlate the two ofthem.
Visual analytics.
A major contribution of VIS-SENSE regarding the study of attacks against BGP isthe development and application of visual analytics techniques to facilitate the analysisand the visualization of BGP routing anomalies and possible hijacks. Techniques forthe analysis of network topologies in order to find and investigate on routing anomaliescould definitely be improved using visualization. Finally, it would be interesting to have
FP7-ICT-257495-VIS-SENSE 49

3 Analysis and Visualisation of Attacks against the Control Plane (BGP)
visualization techniques that take advantage of the control plane and data plane collectedinformation, and that are also able to correlate the two of them.
3.2.3 Scenario: Analysis of fly-by spammers
This section elaborates a first BGP scenario for which the current situation is describedfrom a user perspective and problem claims are then identified. The scenario centresaround a fictional character named Alex.
Alex is working as an anti-spam engineer in an anti-spam company. His job consistsof analyzing new trends in spam operations in order to improve their spam filteringtechnologies based on the evolving behavior and techniques of spammers. Alex is partic-ularly interested in studying the correlation between spam and attacks on the Internetrouting infrastructure, as one part of their spam filtering technologies relies on senderIP address reputation. Indeed, this type of attack would actually facilitate the emissionof large number of spam emails.
Current situation
Alex’s company has set up spamtraps around the world in order to collect junk emailswhich are meant to be used to test and improve the performance of their filtering tech-nologies. As spam emails are received by the different spamtraps, a sample (around10,000 per day) is continuously and randomly selected and added to a centralizeddatabase. These emails provide analysts with a representative sample of current world-wide spam traffic, which is limited in size. Different data fields characterizing spamactivities are made available in the database. Because IP prefix hijacking allows spam-mers to hide themselves behind stolen identities, Alex wants to look at the spam theyreceive in their spamtraps to see if he can correlate them with suspicious BGP routingevents possibly due to BGP hijacks. The primary field Alex is interested in is the IPaddress of the hosts that have sent emails to the spamtraps. Because one IP addresscan send multiple emails, there are around 9,000 new IP addresses added every day tothe database.
To perform this strategic analysis, Alex wants to use the framework Spamtracer (de-scribed in Section 3.2.1). This system relies on the combination of traceroute pathsto specific IP addresses and live BGP routing data collected over a number of days touncover routing changes that could be due to BGP hijacks.
50 SEVENTH FRAMEWORK PROGRAMME
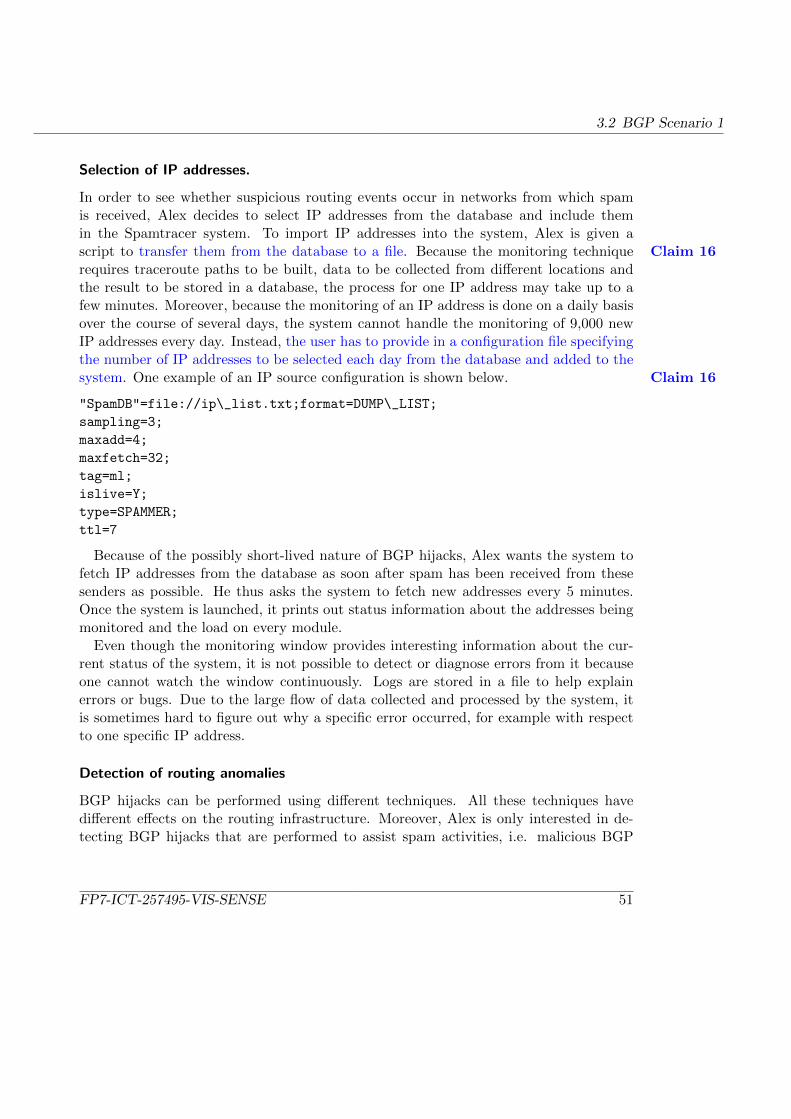
3.2 BGP Scenario 1
Selection of IP addresses.
In order to see whether suspicious routing events occur in networks from which spamis received, Alex decides to select IP addresses from the database and include themin the Spamtracer system. To import IP addresses into the system, Alex is given ascript to transfer them from the database to a file. Because the monitoring technique Claim 16requires traceroute paths to be built, data to be collected from different locations andthe result to be stored in a database, the process for one IP address may take up to afew minutes. Moreover, because the monitoring of an IP address is done on a daily basisover the course of several days, the system cannot handle the monitoring of 9,000 newIP addresses every day. Instead, the user has to provide in a configuration file specifyingthe number of IP addresses to be selected each day from the database and added to thesystem. One example of an IP source configuration is shown below. Claim 16
"SpamDB"=file://ip\_list.txt;format=DUMP\_LIST;
sampling=3;
maxadd=4;
maxfetch=32;
tag=ml;
islive=Y;
type=SPAMMER;
ttl=7
Because of the possibly short-lived nature of BGP hijacks, Alex wants the system tofetch IP addresses from the database as soon after spam has been received from thesesenders as possible. He thus asks the system to fetch new addresses every 5 minutes.Once the system is launched, it prints out status information about the addresses beingmonitored and the load on every module.
Even though the monitoring window provides interesting information about the cur-rent status of the system, it is not possible to detect or diagnose errors from it becauseone cannot watch the window continuously. Logs are stored in a file to help explainerrors or bugs. Due to the large flow of data collected and processed by the system, itis sometimes hard to figure out why a specific error occurred, for example with respectto one specific IP address.
Detection of routing anomalies
BGP hijacks can be performed using different techniques. All these techniques havedifferent effects on the routing infrastructure. Moreover, Alex is only interested in de-tecting BGP hijacks that are performed to assist spam activities, i.e. malicious BGP
FP7-ICT-257495-VIS-SENSE 51

3 Analysis and Visualisation of Attacks against the Control Plane (BGP)
Figure 3.1: The Spamtracer monitoring window.
hijacks. Thus, in order to detect those BGP hijacks, it is necessary to start by lookingat routing anomalies.
Because Spamtracer does not include the automated detection of routing anomaliesClaim 17from the data it collects, such analysis must be done manually on a regular basis. Alexhas been given a script which extracts routing anomalies from a database and attempts toclassify them as benign or malicious. However, the classification algorithm only detectssome routing anomalies that might be due to malicious BGP hijacks. He applies theClaim 17script on a database of routes collected from April 4th 2011 and May 9th 2011. Anexample of the (truncated) output of the script is given below. It shows a summary of atraceroute path collected on April 4th 2011 and the associated BGP data gathered fromdifferent collectors. The complete case includes eight traceroute paths. The routinganomaly detected is described and, if it is considered benign, an explanation is given.
-----------------------------Routing anomaly-----------------------------
<MOAS
ASNs 35641 47313,
Prefix(es) 95.83.136.0/21 95.83.128.0/18,
52 SEVENTH FRAMEWORK PROGRAMME

3.2 BGP Scenario 1
first seen on 2011-04-04 21:21:02,
last seen on 2011-04-12 22:15:29,
legitimate
>
--------------------------------Explanation-------------------------------
PROVIDER 35641
CUSTOMER 47313
----------------------------------Report----------------------------------
<Traceroute
from 192.168.100.13 to 95.83.142.130
17 hops
seen on 2011-04-04 21:21:02
ip complete:0
as complete:0
dest. bogon:None
dest. drop:None
source:Message Labs spamdb
>
<BGP route
prefix:95.83.128.0/18
asn:47313
ip:95.83.142.130
as path:4826 6939 8641 35641 47313
>
<BGP route
prefix:95.83.128.0/18
asn:47313
ip:95.83.142.130
as path:2497 3549 12389 35641 47313
>
<BGP route
prefix:95.83.136.0/21
asn:35641
ip:95.83.142.130
as path:31500 35641
>
...
FP7-ICT-257495-VIS-SENSE 53

3 Analysis and Visualisation of Attacks against the Control Plane (BGP)
Thanks to the existing BGP feeds repository(RouteViews, RIPE, etc), query on controlplane have access to raw BGP data long before the monitoring request issued to Spam-tracer. This would allow an extended view of the prefix in question. Anomalies mayalready be loosely clustered because of adjacency in time line or similarity in natureof abnormality. For example multiple MOAS alerts concentrated in adjacent prefixesthat all belongs to a single shorter prefix and/or almost raised at the same time may begrouped. Thanks to the existing BGP feeds repository(RouteViews, RIPE, etc), queryon control plane have access to raw BGP data long before the monitoring request issuedto Spamtracer. This would allow an extended view of the prefix in question. Anoma-lies may already be loosely clustered because of adjacency in time line or similarity innature of abnormality. For example multiple MOAS alerts concentrated in adjacent pre-fixes that all belongs to a single shorter prefix and/or almost raised at the same timemay be grouped.
The complete report contains 322 routing anomalies, among which 257 are consideredbenign. So Alex has 65 routing anomalies left unexplained. The report provides infor-mation about the detected routing anomalies (e.g., ASNs, prefixes, spammer IP addressinvolved, etc) so that he can verify that a benign case is indeed benign and investigatesuspicious cases.Claim 19
Investigation on suspicious routing anomalies.
Now that Alex has the report about routing anomalies, he can use the informationto study each suspicious case individually. Routing anomalies currently detected byClaim 18the script are related to conflicts between the prefixes that monitored IP addressesbelong to, and/or the autonomous systems announcing these prefixes, namely MOASand subMOAS.
Some cases can be explained thanks to other information fields found in the database.For example, the routing anomaly below depicts two conflicting autonomous systemsactually belonging to the same owner, i.e., an Internet service provider).
<MOAS
ASNs 44038 3303,
Prefix(es) 109.164.128.0/17,
First seen on 2011-04-06 13:48:02,
Last seen on 2011-04-17 15:44:05,
ORGs BLUEWIN-AS Swisscom (Schweiz) AG;
SWISSCOM Swisscom (Switzerland) Ltd
>
54 SEVENTH FRAMEWORK PROGRAMME

3.2 BGP Scenario 1
However, the data collected by Spamtracer is sometimes not enough to resolve suspi-cious routing anomalies. Therefore, Alex has to take advantage of other external datasources. For example, the routing anomaly below cannot be solved using only data from Claim 18the Spamtracer database.
<MOAS
ASNs 31501 15774,
Prefix(es) 188.244.128.0/17,
First seen on 2011-04-20 10:35:52,
Last seen on 2011-05-01 00:03:24,
ORGs SPBTELEPORT-AS SPB-TELEPORT Autonomous System;
TTK-RTL Closed Joint Stock Company TransTeleCom
>
Several services available on the Internet collect BGP and other types of data inorder to build routing information databases which greatly help in the study suspi-cious anomalies. For instance, the RIPEstat service [5] output, queried with the prefix188.244.128.0/17, is shown in figure 3.2. Combined with the whois output from theRADB [3], they allow Alex to solve the routing anomaly above.
Figure 3.2: RIPEstat output for prefix 188.244.128.0/17. AS 31501 provides transitfor AS 15774.
FP7-ICT-257495-VIS-SENSE 55

3 Analysis and Visualisation of Attacks against the Control Plane (BGP)
Figure 3.3: whois output from whois.radb.net for AS 15774. AS 15774 has import andexport policies with AS 31501.
The routing anomaly described below can be explained by looking at the graph infigure 3.4 provided by Robtex [6].
<MOAS
ASNs 6877 6849,
Prefix(es) 46.200.0.0/14,
First seen on 2011-04-22 12:28:22,
Last seen on 2011-04-28 05:22:03
ORGs AS6877 Utel Mobile Internet Service ASN;
UKRTELNET JSC UKRTELECOM
>
Services like RIPE RIS [4], fixedorbit.com [1], peeringdb.com [2] and others can alsobe of great help in the investigation the remaining suspicious cases.
56 SEVENTH FRAMEWORK PROGRAMME
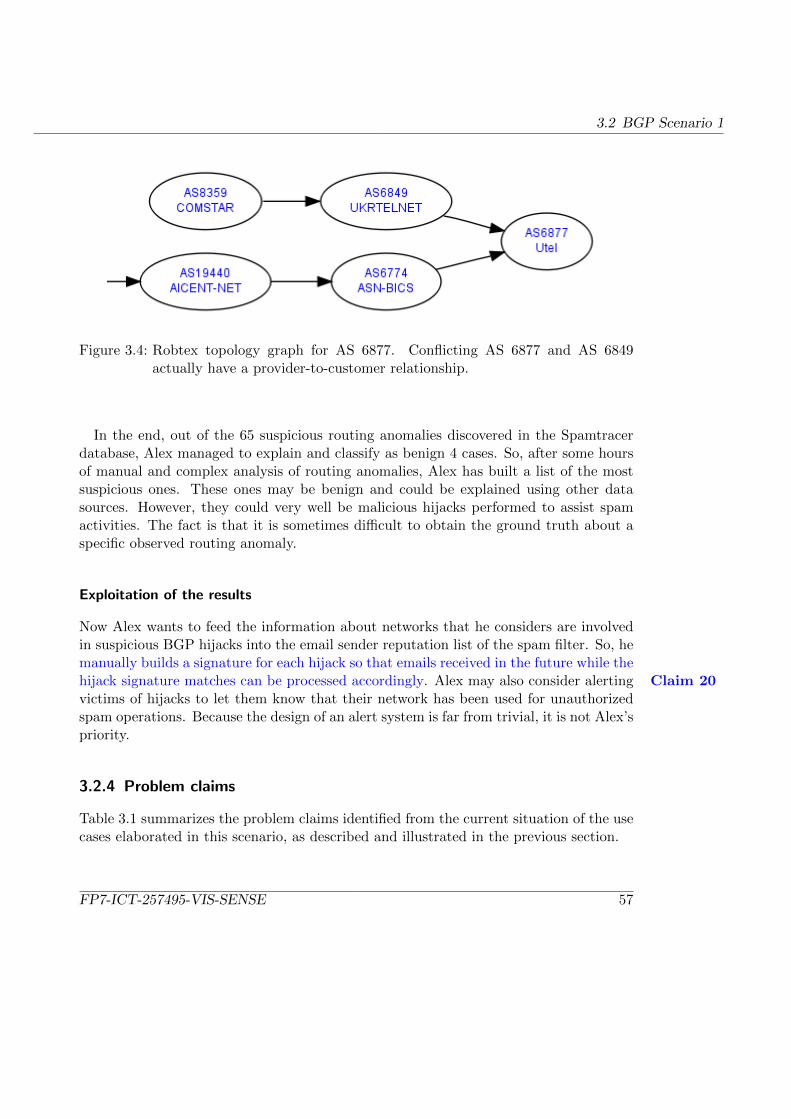
3.2 BGP Scenario 1
Figure 3.4: Robtex topology graph for AS 6877. Conflicting AS 6877 and AS 6849actually have a provider-to-customer relationship.
In the end, out of the 65 suspicious routing anomalies discovered in the Spamtracerdatabase, Alex managed to explain and classify as benign 4 cases. So, after some hoursof manual and complex analysis of routing anomalies, Alex has built a list of the mostsuspicious ones. These ones may be benign and could be explained using other datasources. However, they could very well be malicious hijacks performed to assist spamactivities. The fact is that it is sometimes difficult to obtain the ground truth about aspecific observed routing anomaly.
Exploitation of the results
Now Alex wants to feed the information about networks that he considers are involvedin suspicious BGP hijacks into the email sender reputation list of the spam filter. So, hemanually builds a signature for each hijack so that emails received in the future while thehijack signature matches can be processed accordingly. Alex may also consider alerting Claim 20victims of hijacks to let them know that their network has been used for unauthorizedspam operations. Because the design of an alert system is far from trivial, it is not Alex’spriority.
3.2.4 Problem claims
Table 3.1 summarizes the problem claims identified from the current situation of the usecases elaborated in this scenario, as described and illustrated in the previous section.
FP7-ICT-257495-VIS-SENSE 57
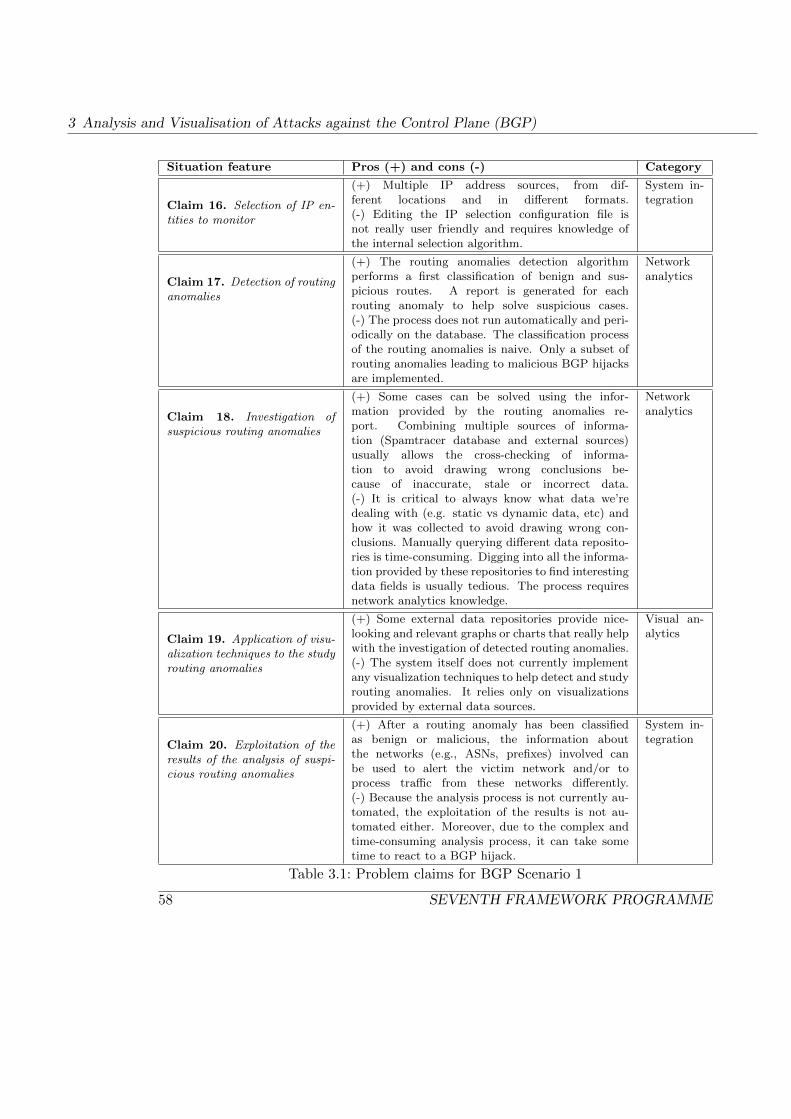
3 Analysis and Visualisation of Attacks against the Control Plane (BGP)
Situation feature Pros (+) and cons (-) Category
Claim 16. Selection of IP en-tities to monitor
(+) Multiple IP address sources, from dif-ferent locations and in different formats.(-) Editing the IP selection configuration file isnot really user friendly and requires knowledge ofthe internal selection algorithm.
System in-tegration
Claim 17. Detection of routinganomalies
(+) The routing anomalies detection algorithmperforms a first classification of benign and sus-picious routes. A report is generated for eachrouting anomaly to help solve suspicious cases.(-) The process does not run automatically and peri-odically on the database. The classification processof the routing anomalies is naive. Only a subset ofrouting anomalies leading to malicious BGP hijacksare implemented.
Networkanalytics
Claim 18. Investigation ofsuspicious routing anomalies
(+) Some cases can be solved using the infor-mation provided by the routing anomalies re-port. Combining multiple sources of informa-tion (Spamtracer database and external sources)usually allows the cross-checking of informa-tion to avoid drawing wrong conclusions be-cause of inaccurate, stale or incorrect data.(-) It is critical to always know what data we’redealing with (e.g. static vs dynamic data, etc) andhow it was collected to avoid drawing wrong con-clusions. Manually querying different data reposito-ries is time-consuming. Digging into all the informa-tion provided by these repositories to find interestingdata fields is usually tedious. The process requiresnetwork analytics knowledge.
Networkanalytics
Claim 19. Application of visu-alization techniques to the studyrouting anomalies
(+) Some external data repositories provide nice-looking and relevant graphs or charts that really helpwith the investigation of detected routing anomalies.(-) The system itself does not currently implementany visualization techniques to help detect and studyrouting anomalies. It relies only on visualizationsprovided by external data sources.
Visual an-alytics
Claim 20. Exploitation of theresults of the analysis of suspi-cious routing anomalies
(+) After a routing anomaly has been classifiedas benign or malicious, the information aboutthe networks (e.g., ASNs, prefixes) involved canbe used to alert the victim network and/or toprocess traffic from these networks differently.(-) Because the analysis process is not currently au-tomated, the exploitation of the results is not au-tomated either. Moreover, due to the complex andtime-consuming analysis process, it can take sometime to react to a BGP hijack.
System in-tegration
Table 3.1: Problem claims for BGP Scenario 1
58 SEVENTH FRAMEWORK PROGRAMME

3.2 BGP Scenario 1
3.2.5 Activity and interaction design
Alex is working as an anti-spam engineer in an anti-spam company. His job consistsof analyzing new trends in spam operations in order to improve their spam filteringtechnologies based on the evolving behavior and techniques of spammers. Alex is partic-ularly interested in studying the correlation between spam and attacks on the Internetrouting infrastructure, as one part of their spam filtering technologies relies on senderIP address reputation. Indeed, this type of attack would actually facilitate the emissionof a large number of spam emails.
To determine which spamming networks make use of BGP hijacking to send spam in astealthy way, Alex adds the spam database as a list of sources to the Spamtracer system.To do that, he simply has to specify the location of the IP addresses and the waythey have to be fetched. Spamtracer then automatically retrieves and monitors newIP addresses. Based on the performances and the current load on the system,the number of IP addresses monitored is adjusted to maximize the likelihood ofmalicious BGP hijacks being discovered.
In order to detect malicious BGP hijacks as soon as possible, the routing anomalydetection and analysis is executed automatically. The system assigns a currentstate to each monitored network. As new data is collected, this state can evolve to pointout routing anomalies. Routing anomaly detection and classification rules are able tohandle the different anomalies that can be induced by malicious BGP hi-jacks. While it is possible to tune algorithms to achieve low false positive and falsenegative rates, one hundred per cent accuracy is not possible. Thus, Alex can dynami-cally change the parameters of the algorithms according to the results obtained. Eventhough many different data repositories can be leveraged to investigate suspiciousrouting anomalies, Alex sometimes has to study some cases manually.
The status of the monitored IP addresses is available through a private web pagedirectly connected to the Spamtracer database. It also provides an interface to querythe system with different types of network objects, for instance, IP addresses, IP prefixes,ASes. This is useful for Alex because he regularly wants to look at the aggregated statusof multiple objects across a specific timeframe. For instance, he may want to examine aset of IP addresses from one given day to another given day. After having seen a reporton the NANOG mailing list on August 20th 2011 about a supposedly hijacked networkused to send spam, he queries the system with the prefix 46.96.0.0/16 and discoversthat 27 IP addresses are already being monitored, some of them since August 4th 2011.Now, Alex also wants to add the other reported prefixes to the system to monitor them.
Besides providing a searchable interface to the database, the system also generatesreports for every routing anomaly detected. If the anomaly turns out to be benign,
FP7-ICT-257495-VIS-SENSE 59

3 Analysis and Visualisation of Attacks against the Control Plane (BGP)
the explanation as well as the data repositories used to clear the case is output.The remaining cases can be considered either malicious or suspicious by default. If theyare not considered malicious by default, Alex will have to go through all cases manuallyand confirm or clear them. Of course, the reports would help. Every time Alex connectsto the interface, he is informed of the new benign and suspicious/malicious routinganomalies that have occurred.
To assist Alex in the investigation of the suspicious routing anomalies, the systemprovides a visualization component in which he can observe the traceroute pathsto a specific (or a group of) monitored IP address(es). Alex can also adjust thepoint of view from which the paths are observed (e.g., IP-level, AS-level, country-level,etc). When clicking on a network entity (e.g., an IP address, an AS, etc), the informationSpamtracer has collected about this entity is displayed.
Furthermore, Alex is able to instruct the system to export the information aboutthe networks involved in the detected hijacks in a standard format so that theemail sender reputation module of the anti-spam filter can benefit from it.
3.3 BGP Scenario 2
3.3.1 Scenario: Analysis of BGP routing anomalies
This section elaborates a second BGP scenario, which relies on the analysis of a differentdata set and has a slightly different approach and goal. This scenario centres around afictional character named Bob.
Bob works for an information security company. The recent incidents concerning BGPhijacking has attracted people’s attention and Bob has been tasked to look into thesematters. Realizing the feasibility of such attack, Bob is not sure if such technique hasalready been employed by malicious parties, or how serious the situation is. Facing thetypical problem of lacking the ground truth while digging through vast amounts of BGPdata (collected from the control plane), Bob hopes to get some help from visual analytictechnique to combine incomplete views from all possible sources.
Current situation
Thanks to the researchers’ constant effort to improve Internet performance, many projectshave been launched in the recent years to collect and store BGP traffic for future anal-ysis (e.g., RIPE, RouteViews, etc). The data collected does not contains datagramsexchanged between every two BGP peers, but instead BGP conversations observed from
60 SEVENTH FRAMEWORK PROGRAMME

3.3 BGP Scenario 2
dozens of collaborating BGP routers scattered around the world. Thus the view is lim-ited to these Vantage Points (VPs). Because of the high financial and operational costof building new Vantage Points, Bob has to use those data sources that are readilyavailable.
On the internet there are other BGP related services available. To name a few, CAIDAprovides AS-level topology charts, deduced AS relationships chart, and AS ranking, whileBGPmon.net offer registration-based hijacking alert services. Although the nature andquality of these services varies a lot, the combination of this information may yield usefulhints toward understanding BGP anomalies and validating IP prefix hijacking attacks.
The idea of this scenario is to extract routing anomalies primarily from raw BGP tracesand group them into events according to similarities on certain aspects, then visuallycombine those aggregate events with other information sources to validate or revoke themalicious intent of these anomalies. However, real-time detection is not available atcurrent stage. Claim 21
Nevertheless, since the ultimate goal is to develop an infrastructure that succeeds inperforming real-time monitoring and analysis of the BGP operation and performance,the processing rate must be on average higher or at least equal to the generation andacquisition rate of the BGP info (e.g., as far as the RIPE repository is concerned, anew BGP update message file is made available every 5 minutes). Otherwise, in caseof excessively increased aggregate processing delay (due to either automatic or manualtasks), the BGP collected data shall progressively pile up and the detection mechanismshall be inevitably limited to the off-line study of the system’s history. Hence, thewhole monitoring, detection and attribution procedure that leads to the final visuallyperceived output must be designed taking into account the stringent time constraints,in order to eventually provide Bob with a tool that supports the prompt reaction andremedy against any BGP hijack attempts. In this respect, it must be underlined that Claim 22the large size of the IPs and ASNs pool drastically affects significant aspects of themechanism’s implementation and deployment; additional time burden is imposed to thedata mining and visualization routines, jeopardizing the desirable real-time nature ofthe BGP hijack detection technique.
Routing anomalies discovery.
Bob first dumps raw BGP traces to a database. BGP updates are the major type ofdata being examined since the BGP protocol uses them to inform or announce changesof routing table, instead of transmitting the entire RIB to their peers. Those changes inrouting paths is also what we are primarily interested in. Note however that RIB dumpsare also available, but not used for the moment. Claim 23
FP7-ICT-257495-VIS-SENSE 61

3 Analysis and Visualisation of Attacks against the Control Plane (BGP)
The basic element to be examined is an IP prefix, instead of IP address. Althoughthe object space is much smaller than for IP addresses, it can still be difficult sometimesto keep track of every single prefix being announced. So the actual sample space is setaccording to the type of detection methods being used.
MOAS conflict. For Multiple Origin AS conflict, the entire IP prefix space has to bemonitored. That is because it is relatively costless to extract a list of prefixes exhibitinga MOAS in a given time period, and further tracking of origin AS evolution is not costlyeither. Usually, this information can be obtained through a simple SQL query, and thesize of the resulting list is typically of moderate size. For data collected during May2011, such typical query returns 6,915 entries.
Bob can execute an ad-hoc script that will query database to obtain this list of prefixes(query executed on demand). Then, different algorithms are automatically applied toClaim 24each of the returned prefix to generate a sequence of MOAS alerts. Some provide ag-gregated event once per prefix and per alert sequences, while others may provide alertson a Vantage Point basis. Alerts generated are dumped to a tab-separated text file.Figure 3.5 shows an excerpt of output file made of alerts generated per Vantage Point(indicated by CP in this file).
“MessageID” corresponds to the raw data that caused this alert and can be used tomanually check the source when necessary. The column “CP” shows which vantage pointthe alert is generated from. The field “type” shows a customized type ID of alerts. Inthe example here above, “11” means re-occurrence of long-absent origin AS and “1”means a new origin AS that had never been seen before (from the perspective of thisvantage point).
The algorithm used here is a variant of PHAS [15]. If the original PHAS algorithmhad been used, the output would have been quite similar except that the “CP” columnwould be absent, and significantly less alerts would have been generated.
When Bob find some events for a certain prefix that are particularly interesting, hemay then use another ad-hoc script to sketch the evolution of origin AS out of the rawdata.
A plot of alerts sequence across multiple VPs can be used to understand the visibilityof the event. As of now, these plots are drawn manually. Figure 3.6 shows the plotClaim 25of a simple MOAS case. Lines with different colour represent origin AS’s observed bydifferent vantage points (colour) along a timeline (X-axis) and the Y-axis representsthe AS number. Coloured dots represent alerts generated from each VP (in this case,only 6 out of 30 of VPs are being showed here for the sake of clarity), and the blackbar represents alerts generated by the original PHAS algorithm [15]. All symbols are
62 SEVENTH FRAMEWORK PROGRAMME
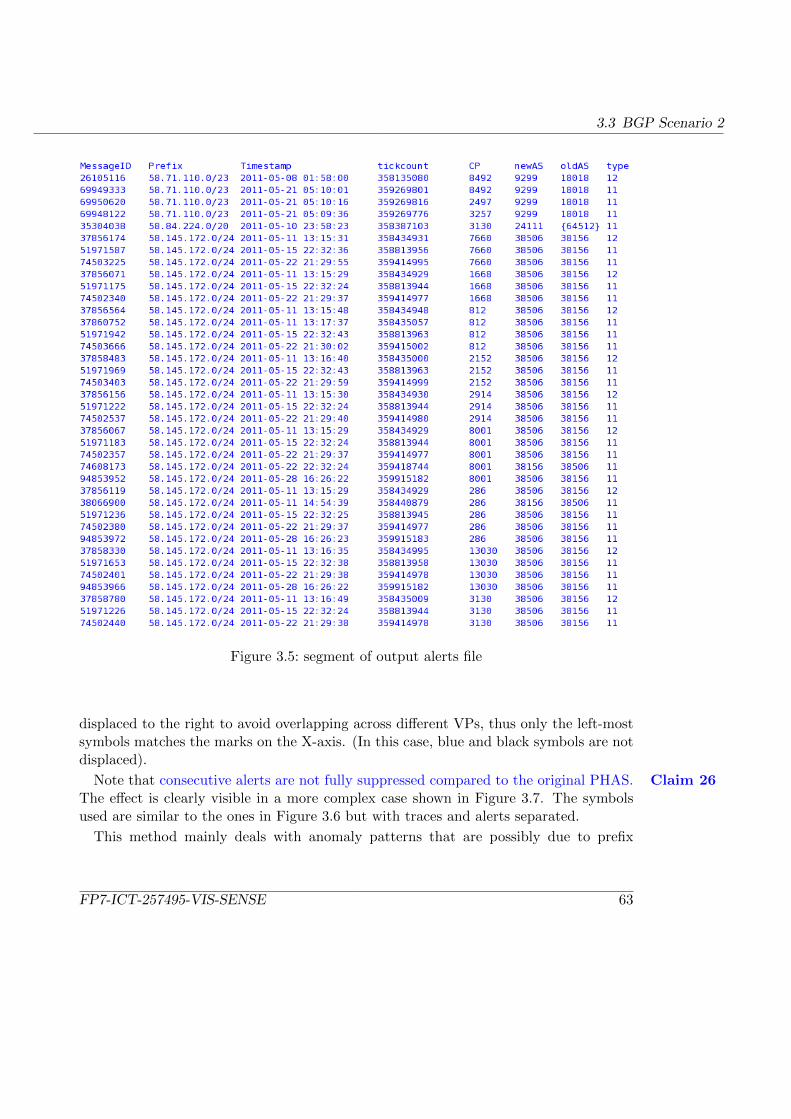
3.3 BGP Scenario 2
Figure 3.5: segment of output alerts file
displaced to the right to avoid overlapping across different VPs, thus only the left-mostsymbols matches the marks on the X-axis. (In this case, blue and black symbols are notdisplaced).
Note that consecutive alerts are not fully suppressed compared to the original PHAS. Claim 26The effect is clearly visible in a more complex case shown in Figure 3.7. The symbolsused are similar to the ones in Figure 3.6 but with traces and alerts separated.
This method mainly deals with anomaly patterns that are possibly due to prefix
FP7-ICT-257495-VIS-SENSE 63

3 Analysis and Visualisation of Attacks against the Control Plane (BGP)
0 1 2 3 4 5 6 7 8 9 10 11 12 13 14 15 16 17 18 19 20 21 22 23 24 25 26 27 28 29 30 311.5
2
2.5
3
3.5
4x 10
4 62.139.15.0/24
as293as31500as3561as6539as8001as852
Figure 3.6: Simple example of BGP trace and alerts generated.
hijacking, given that the origin AS has been altered (possibly by an attacker). However,there may be some other (legitimate) reasons explaining such phenomenon, such asmulti-homed domains that will also generate similar events (but hopefully in a slightlydifferent pattern).
Sub-prefix anomaly. The suspected prefix is longer than a previously announced one.This type of anomaly coincides with other famous BGP incidents. In principle, Bobshould provide a list of suspicious prefixes to be monitored in order to avoid an exhaustivesearch, yet this may be unnecessary in case of offline analysis of historical data. The inputClaim 27of this list is done manually. As most of the events generated here will be legitimate, itis important to cross-correlate this information with external sources.
This method mainly deals with signatures that are possibly introduced by prefix hi-jacking, given that the suspected attacker has allegedly announced a more specific prefix
64 SEVENTH FRAMEWORK PROGRAMME
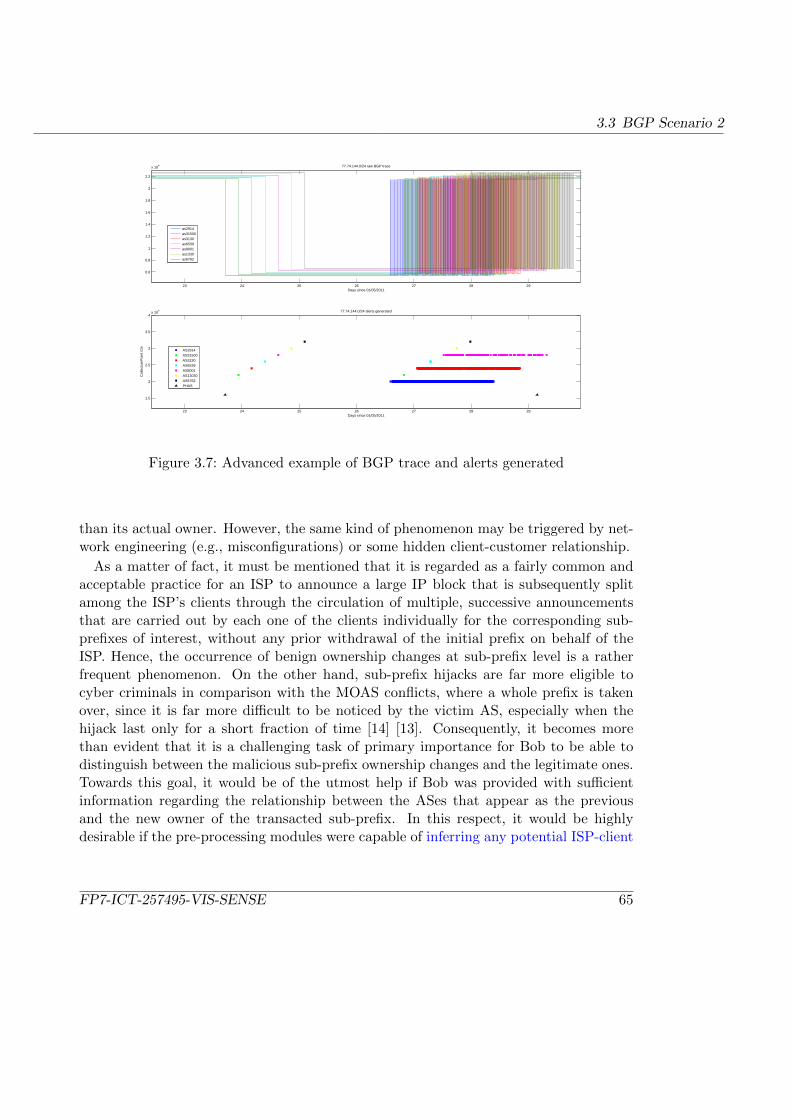
3.3 BGP Scenario 2
23 24 25 26 27 28 29
0.6
0.8
1
1.2
1.4
1.6
1.8
2
2.2
x 104 77.74.144.0/24 raw BGP trace
Days since 01/05/2011
as2914as31500as3130as6539as8001as1330as6762
23 24 25 26 27 28 29
1.5
2
2.5
3
3.5
4x 10
4 77.74.144.0/24 alerts generated
Days since 01/05/2011
Col
lect
ionP
oint
IDs
AS2914AS31500AS3130AS6539AS8001AS13030AS6762PHAS
Figure 3.7: Advanced example of BGP trace and alerts generated
than its actual owner. However, the same kind of phenomenon may be triggered by net-work engineering (e.g., misconfigurations) or some hidden client-customer relationship.
As a matter of fact, it must be mentioned that it is regarded as a fairly common andacceptable practice for an ISP to announce a large IP block that is subsequently splitamong the ISP’s clients through the circulation of multiple, successive announcementsthat are carried out by each one of the clients individually for the corresponding sub-prefixes of interest, without any prior withdrawal of the initial prefix on behalf of theISP. Hence, the occurrence of benign ownership changes at sub-prefix level is a ratherfrequent phenomenon. On the other hand, sub-prefix hijacks are far more eligible tocyber criminals in comparison with the MOAS conflicts, where a whole prefix is takenover, since it is far more difficult to be noticed by the victim AS, especially when thehijack last only for a short fraction of time [14] [13]. Consequently, it becomes morethan evident that it is a challenging task of primary importance for Bob to be able todistinguish between the malicious sub-prefix ownership changes and the legitimate ones.Towards this goal, it would be of the utmost help if Bob was provided with sufficientinformation regarding the relationship between the ASes that appear as the previousand the new owner of the transacted sub-prefix. In this respect, it would be highlydesirable if the pre-processing modules were capable of inferring any potential ISP-client
FP7-ICT-257495-VIS-SENSE 65

3 Analysis and Visualisation of Attacks against the Control Plane (BGP)
relationship between the two ”competing” ASes, or at least quantitatively flagging theClaim 28credibility of the two ASes’ relationship, so as Bob to be urged to further investigateonly the hijack-prone issues through the designated BGP repositories.
The impact of this phenomenon on the anomaly detection procedures is amplified dueto the fact that each Vantage Point receives for every prefix ownership announcementmultiple copies of the corresponding update message, originating from different peerrouters of the VP. In consequence, the corresponding sub-prefix under ”transaction”may erroneously appear to move back-and-forth between the old and the new ownerAS, which is generally regarded as strong evidence of malicious activity. Therefore, inorder not to confuse Bob with false alerts (high False Positive Ratio), it is mandatoryto develop a mechanism for discarding duplicate updates, without however, suppressingannouncements or withdrawals specifically emitted by the true owner in order to recoverfrom illegitimate hijacks.
Other anomalies. Other kinds of anomalies may be of interest in this analysis scenario.For example, the deviation of AS-paths may contain signatures to other potential attacksagainst the control plane. It could thus be a symptom of either prefix hijacking, man-in-the-middle attack, eavesdropping, someone abusing the “next hop” field, or any activitythat causes abnormal change in the AS path. However, no method has currently beendeveloped to detect and differentiate between those anomalies and such task is expectedClaim 29to be rather challenging. If the detection algorithms proposed are too complex to monitorall prefixes simultaneously, a monitor list of prefixes may still be required.Claim 27
Further analysis with visual feedback.
The output alerts and/or events from previous module is likely to be ambiguous andredundant. Some post-processing should be applied to partially address this issue. Atthis stage, only a prefix hierarchy is being considered and the output file as showed inClaim 30Figure 3.5 can be configured to aggregate alerts that belongs to the same less-specificprefix in the same period of time. If needed, alerts for the same prefix from different VPsmay be merged with a separated value showing its coverage (number of VPs triggereddivided by total count of VPs).
However, as plots are currently done manually with no direct interaction with detectionalgorithms, interactive visualization methods are still lacking.Claim 31
Regarding data fusion and correlation with external sources, Bob has to performmanually such cross-reference with other sources, like the AS-level topology charts andClaim 19deduced AS relationships from CAIDA’s system.
66 SEVENTH FRAMEWORK PROGRAMME

3.3 BGP Scenario 2
Visual analytics has been triggered by the fact that the incorporation of intelligentdata manipulation algorithms along with the inherent human background knowledge andintuition maximizes the probability of imminently capturing any underlying patterns,since this human-machine interaction overcomes the boundaries imposed by automaticthreshold-based decision making algorithms and succeeds in increasing both the speci-ficity and sensitivity of the management framework. On this basis, as far as BGPanomaly detection is concerned, the IP and ASN space that needs to be visualized isvery difficult, if not impossible, to fit to the capabilities of the monitoring systems underthe restrictions of the human visual and conceptual perception, while this phenomenonis further intensified by the excessive BGP activity within the enlarged and dynamicmodern Internet environment. Thus, sophisticated visualization methods must be de-ployed, since the existing approaches are most likely to fail to appropriately present that Claim 32large datasets of occupied IPs, ASes and BGP events while pertaining their underlyingattributes and correlations in a vivid manner.
Moreover, it is of the utmost importance that the set of BGP events to be visualizedare very carefully selected so as neither to erroneously withhold any malicious activitiesnor to overwhelm the user with that much incidents that one is bound to fail to keep trackof. In more detail, although suppressing the bulk of recorded incidents by flagging themas legitimate ones and subsequently discarding them may entail the danger of risingthe False Negative Ratio (FNR), it is generally accepted that it is highly preferableto isolate an as narrow as possible set of hijack-prone events, instead of showing anextensive sample of the recorded BGP anomalies, allowing in this manner the targetedand efficient exploitation of Bob’s intervention. Therefore, special emphasis must be laidon the preprocessing step of the aggregate visual analytics methodology, so as through astringent selection procedure to minimize the number of items reaching the final visualrepresentation. This fine filtering of the suspicious BGP events, consistently provides Claim 33Bob with a comprehensive view of the BGP dynamic alterations and draws his attentionsolely to the incidents that can and/or must be benefited by deeper human-orientedanalysis, utilizing visual hints in order to flag the ambiguity and the importance of eachevent. As a result, Bob is able to more easily focus on the specific events that needfurther, probably non-real-time, investigation.
Exploitation of results.
After checking results from other sources, Bob should be able to identify some of thealert events as benign and others marked by sources and assumed attack scenario (sub-prefixing, MOAS competition, AS path anomalies, etc.). For these confirmed events,the prefix owner may then be contacted for further validation and remediation.
FP7-ICT-257495-VIS-SENSE 67

3 Analysis and Visualisation of Attacks against the Control Plane (BGP)
3.3.2 Problem claims
Table 3.2 summarizes the problem claims identified from the current situation of the usecase elaborated in this scenario, as described and illustrated in the previous section.
3.3.3 Activity and interaction design
Bob works for an information security company. The recent incidents concerning BGPhijacking has attracted people’s attention and Bob has been tasked to look into thesematters. Realizing the feasibility of such attack, Bob is not sure if such technique hasalready been employed by malicious parties, or how serious the situation is.
Bob first logs in to the main UI and selects a given period of time in which theanalysis of BGP data should be performed. He can then select multiple types of anomalydetection algorithms to be executed, along with a set of appropriate parameters and thedesired output methods. However, some parameters presets are provided by default.The output can either be a customized plain text file for low-level sharing with otherpotential programs or a table in the database which will be accessible afterwards throughWAPI. The default setting is to examine all prefixes in the designated data segment ifthe algorithms allow, but Bob also has the option to specify one or several ranges ofprefixes to narrow down the search.
To optimize the parameters of a certain detection algorithm, two possible approachescan be chosen in the system.
• Automate this process by feeding certain statistics back to the algorithm to adjustparameters accordingly until these statistics converge to the targeted value range.The feasibility of this approach depends, however, on the anomaly detection algo-rithms that have been selected.
• The other approach is to enable the operator to evaluate the performance of thecurrent parameter sets on the fly (through a feedback loop). He then has the optionto adjust the parameters and restart the processing. As this operation takes timeto complete (e.g., in case of full scale search), the system provided an optionto periodically fetch results on certain prefixes. A visualization module is thenactivated automatically to present the results in a meaningful way. For example,some prefix samples can be presented together with raw traces and correspondingalerts being generated.
Bob can also use the system to aggregate the generated alerts into events in a automaticmanner based on specified grouping criteria. The feed-back loop for this procedure will
68 SEVENTH FRAMEWORK PROGRAMME
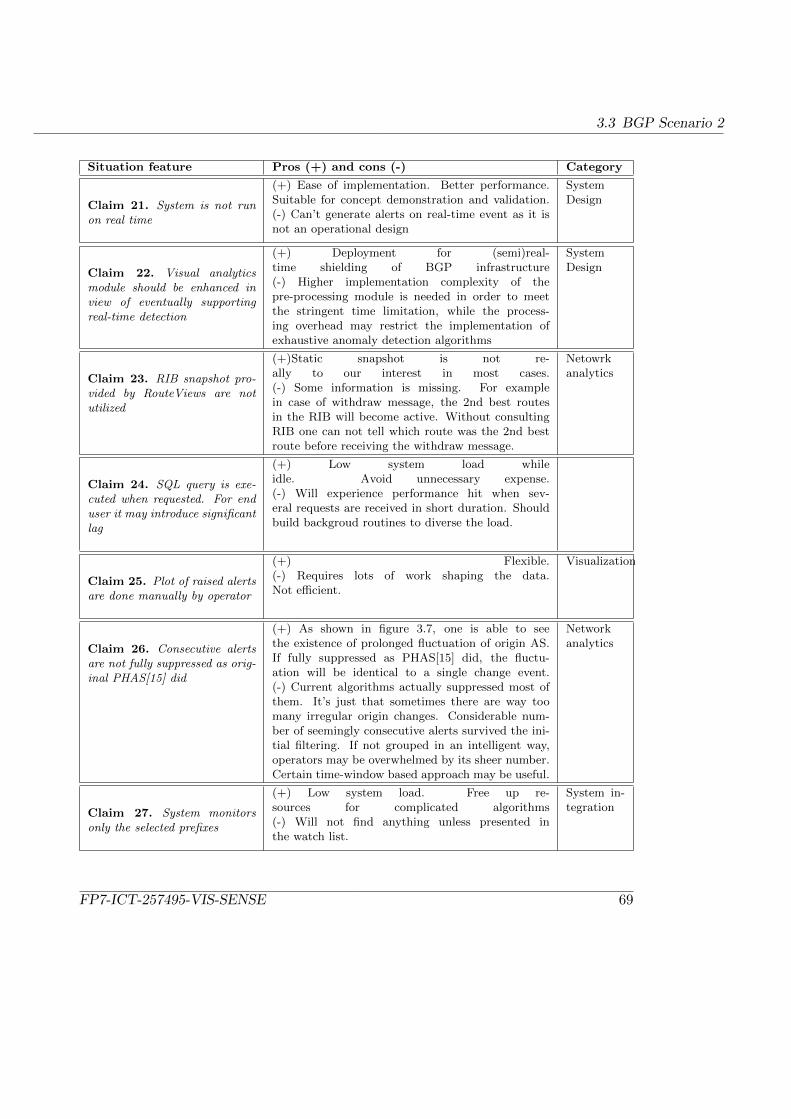
3.3 BGP Scenario 2
Situation feature Pros (+) and cons (-) Category
Claim 21. System is not runon real time
(+) Ease of implementation. Better performance.Suitable for concept demonstration and validation.(-) Can’t generate alerts on real-time event as it isnot an operational design
SystemDesign
Claim 22. Visual analyticsmodule should be enhanced inview of eventually supportingreal-time detection
(+) Deployment for (semi)real-time shielding of BGP infrastructure(-) Higher implementation complexity of thepre-processing module is needed in order to meetthe stringent time limitation, while the process-ing overhead may restrict the implementation ofexhaustive anomaly detection algorithms
SystemDesign
Claim 23. RIB snapshot pro-vided by RouteViews are notutilized
(+)Static snapshot is not re-ally to our interest in most cases.(-) Some information is missing. For examplein case of withdraw message, the 2nd best routesin the RIB will become active. Without consultingRIB one can not tell which route was the 2nd bestroute before receiving the withdraw message.
Netowrkanalytics
Claim 24. SQL query is exe-cuted when requested. For enduser it may introduce significantlag
(+) Low system load whileidle. Avoid unnecessary expense.(-) Will experience performance hit when sev-eral requests are received in short duration. Shouldbuild backgroud routines to diverse the load.
Claim 25. Plot of raised alertsare done manually by operator
(+) Flexible.(-) Requires lots of work shaping the data.Not efficient.
Visualization
Claim 26. Consecutive alertsare not fully suppressed as orig-inal PHAS[15] did
(+) As shown in figure 3.7, one is able to seethe existence of prolonged fluctuation of origin AS.If fully suppressed as PHAS[15] did, the fluctu-ation will be identical to a single change event.(-) Current algorithms actually suppressed most ofthem. It’s just that sometimes there are way toomany irregular origin changes. Considerable num-ber of seemingly consecutive alerts survived the ini-tial filtering. If not grouped in an intelligent way,operators may be overwhelmed by its sheer number.Certain time-window based approach may be useful.
Networkanalytics
Claim 27. System monitorsonly the selected prefixes
(+) Low system load. Free up re-sources for complicated algorithms(-) Will not find anything unless presented inthe watch list.
System in-tegration
FP7-ICT-257495-VIS-SENSE 69

3 Analysis and Visualisation of Attacks against the Control Plane (BGP)
Situation feature Pros (+) and cons (-) Category
Claim 28. Any ISP-client re-lationship between the old andthe new owner should be in-ferred at pre-processing level.
(+) Filtering of the suspicious events. Sub-prefix hijacks where the old owner appears asISP of the new owner are discarded as legitimate(-) Hijacks may be suppressed in case an ISP-clientrelationship is falsely identified
NetworkAnalytics
Claim 29. Methods other thanMOAS and sub-prefixing is wellinvestigated
(+)The existing two approaches are easier to mas-ter to gain first hand experience on relevant issues.(-) MOAS and sub-prefixing is only looking at somevery specific symptoms of some specific assumed at-tacks. While it may be sufficient for some applica-tions, it will fail in scenarios with distinctively differ-ent demands. Should be addressed in future works
Networkanalytics
Claim 30. Only one categoryis used to shape the generatedalerts for further process.
(+) The basic and the necessary(-) Together with claim 26, resulting alerts needto be better processed. Classical solutions such asclustering and multidimensional scaling (MDS) maybe of help.
NetworkAnalytics
Claim 31. There is currentlyno visual analytics involved inthe procedure of BGP anomaliesdetection algorithm.
(-) Several critical processes may benefit from visualanalytics. For one it will be helpful to visualize theresulting alerts/events while the anomalies detectionalgorithms are running. Many adjustable parame-ters exist to fine tune the algorithms affecting notonly the grouping of anomalies but also the accu-racy. An intuitive visual feedback will aid the effortgreatly.
Visualization
Claim 32. Sophisticated visu-alization methods must be intro-duced to support the vast set ofoccupied IPs and ASes
(+) Scalability against the number of involved IPsand ASNs and the volume of the corresponding BGPactivity
Visualization
Claim 33. Fine filtering atpre-processing level
(+) Narrow down the set of presented events. Drawuser’s attention to significant incidents that needfurther investigation utilizing human perception(-) Probable increase of False Negative Ratio, i.e.decrease of system’s sensitivity
NetworkAnalytics
Table 3.2: Problem claims for BGP Scenario 2
70 SEVENTH FRAMEWORK PROGRAMME

3.3 BGP Scenario 2
be similar with the method mentioned above.Based on the result of the BGP anomalies detection, Bob may want to move to the
next phase in which he can investigate the correlation of BGP anomalies with externalsources through an integrated visualization. The supported data sources may contain(but not limited to): alerts generated from previous module, AS connectivity, AS peeringrelationship, AS registration and geographical information, traceroute database, spamdatabase, other WAPI-enabled datasets, and mailing lists related to reported hijackcases. Bob ticks sources that will be used for this data correlation, and the systemreturns multiple views for interactive analysis.
The final results are sets of highly possible BGP attack events (if not already confirmedby third parties in the last step) and other unknown anomalies. The performance of thesystem can then be evaluated based on the percentage of confirmed attacks, or thenumber of cases for which a correlation between BGP anomalies and other maliciousactivities could be validated.
FP7-ICT-257495-VIS-SENSE 71

4 Conclusion
In this document, two specific scenarios were elaborated in order to identify and gatheruser-level requirements. Those scenarios will drive the development of a visual analyticsframework for security analysis and visualization in the VIS-SENSE project. Also, thisscenario-based design provides a starting point for a more detailed specification of theoverall system architecture in deliverable D1.3.
Specifically, two scenarios have been developed in this deliverable: (i) “Visualisationof the Internet threat landscape”, and (ii) “Analysis and visualisation of attacks againstthe Control Plane (BGP)”. The key objective of the former is to identify common rootcauses of various attack phenomena observed in the Internet and to provide insightsinto the modus operandi of attackers, whereas the latter aims at investigating possibleattacks against the core routing infrastructure of the Internet (e.g., IP prefix hijackingthrough the Border Gateway Protocol) and tries to correlate them with other sources ofinformation related to malicious attacks targeting end hosts. One particular goal in thissecond scenario is to confirm, or not, the existence of spammers suspected of performingattacks on BGP, enabling them to send spam in a stealthy way via stolen IP blocks (i.e.,the so-called “fly-by spammers”).
Thanks to the elaboration of those scenarios and their instantiation on real-life usecases, we have been able to identify a set of accurate requirements as well as novelimprovements to bring to current technologies in the network analytics and visualizationfields, and perhaps more importantly, to achieve a synergy among both fields. Theresulting use cases convey stories envisioning creative and innovative solutions, whichcan be readily latched onto and understood by project partners to support research anddevelopment efforts.
72

Bibliography
[1] Fixed orbit. http://www.fixedorbit.com.
[2] Peering db. http://www.peeringdb.com.
[3] Radb internet routing registry. http://www.radb.net.
[4] Ripe ris. http://www.ris.ripe.net.
[5] Ripestat. http://www.stat.ripe.net.
[6] Robtex swiss army knife internet tool. http://www.robtex.com.
[7] Wombat Deliverable D22 (D5.2) Root Causes Analysis: Experimental Report.http://wombat-project.eu/deliverables/.
[8] J. M. Carroll. Five reasons for scenario-based design. In Proceedings of the Thirty-Second Annual Hawaii International Conference on System Sciences - Volume 3,pages 3051–, Washington, DC, USA, 1999. IEEE Computer Society.
[9] J. M. Carroll. Making use: scenarios and scenario-based design. In Proceedings ofthe 3rd conference on Designing interactive systems: processes, practices, methods,and techniques, DIS ’00, pages 4–, New York, NY, USA, 2000. ACM.
[10] W. Consortium. Wombat project. http://www.wombat-project.eu, retrieved on20.08.2012.
[11] M. Cova, C. Leita, O. Thonnard, A. D. Keromytis, and M. Dacier. An Analysis ofRogue AV Campaigns. In Proceedings of the 13th international conference on Recentadvances in intrusion detection, RAID’10, pages 442–463, Berlin, Heidelberg, 2010.Springer-Verlag.
[12] M. Dacier, V. Pham, and O. Thonnard. The WOMBAT Attack Attribution method:some results. In 5th International Conference on Information Systems Security(ICISS 2009), 14-18 December 2009, Kolkata, India, Dec 2009.
73
Bibliography
[13] X. Hu and Z. M. Mao. Accurate Real-time Identification of IP Prefix Hijacking. InSP ’07: Proceedings of the 2007 IEEE Symposium on Security and Privacy, pages3–17, Washington, DC, USA, 2007. IEEE Computer Society.
[14] J. Karlin, S. Forrest, and J. Rexford. Pretty good bgp: Improving bgp by cautiouslyadopting routes. In Proceedings of the IEEE International Conference on NetworkProtocols 2006 (ICNP ’06), pages 290–299, Santa Barbara, CA, USA, Nov. 2006.
[15] M. Lad, D. Massey, D. Pei, Y. Wu, B. Zhang, and L. Zhang. PHAS: A Prefix HijackAlert System. In USENIX-SS’06: Proceedings of the 15th conference on USENIXSecurity Symposium, Berkeley, CA, USA, 2006. USENIX Association.
[16] C. Leita and M. Dacier. SGNET: a worldwide deployable framework to supportthe analysis of malware threat models. In 7th European Dependable ComputingConference (EDCC 2008), May 2008.
[17] M. B. Rosson and J. M. Carroll. Usability Engineering: Scenario-Based Devel-opment of Human-Computer Interaction. Morgan Kaufmann, 1st edition edition,2001.
[18] M. B. Rosson and J. M. Carroll. Usability case library. Available online at http:
//ucs.ist.psu.edu/, 2011.
[19] Symantec Corporation. Symantec Report on Rogue Security Software. Availableonline at http://www.symantec.com/threatreport/archive.jsp, October 2009.
[20] Symantec.cloud. Messagelabs Intelligence: 2010 Annual Security Report. http:
//www.messagelabs.com/globalthreats.
[21] O. Thonnard. A multi-criteria clustering approach to support attack attribution incyberspace. PhD thesis, Ecole Doctorale d’Informatique, Telecommunications etElectronique de Paris, March 2010.
[22] O. Thonnard and M. Dacier. A Strategic Analysis of Spam Botnets Operations. InProceedings of the 8th Annual Collaboration, Electronic messaging, Anti-Abuse andSpam Conference (CEAS’11), Perth, Australia, Sep 2011.
[23] O. Thonnard, W. Mees, and M. Dacier. Addressing the attack attribution problemusing knowledge discovery and multi-criteria fuzzy decision-making. In KDD’09,15th ACM SIGKDD Conference on Knowledge Discovery and Data Mining, Work-shop on CyberSecurity and Intelligence Informatics, June 28th - July 1st, 2009,Paris, France, Dec 2009.
74 SEVENTH FRAMEWORK PROGRAMME

Bibliography
[24] J. Van Helvert and C. Fowler. Scenario based user needs analysis, chimera workingpaper 2003-02. Technical report, University of Essex, Colchester, 2003.
[25] VIS-SENSE Consortium. VIS-SENSE - Deliverable D2.1 (Network InformationSources). Available at http://www.vis-sense.eu/.
FP7-ICT-257495-VIS-SENSE 75