d1.1- soa and benchmarking€¦ · adas&me (688900) d1.1 – soa and benchmarking march, 2017...
TRANSCRIPT

Adaptive ADAS to support incapacitated drivers Mitigate Effectively risks through tailor
made HMI under automation
This project has received funding from the European Union’s Horizon 2020 research
and innovation programme under grant agreement No 688900
D1.1- SoA and Benchmarking Deliverable Identity
Work Package No. WP1
Work Package Title Critical scenarios identification and use cases
Activity No. A1.1
Activity Title Benchmarking and SoA
Dissemination level PU = Public
Main Author(s) Katerina Touliou, M. Maglavera, C. Britsas (CERTH/HIT)
File Name ADASANDME_D1.1.doc
Online resource Link-to-Deliverable

ADAS&ME (688900) D1.1 – SoA and Benchmarking
March, 2017 Page 2 of 238 CERTH/HIT
Version History
Date Version Comments
28 February 2017 0.1 Version send out for peer review 08 March 2017 0.2 2nd review by WP1.1 partners 13 March 2017 0.3 Incorporated feedback by reviewers 20 March 2017 0.4 Updated version after quality review 31 March 2017 0.5 Version ready for submission
Authors (full list in alphabetic order)
Ahlström, Christer (VTI) Brasca, Michelle (DAINESE) Cochron, Marta Sofia Perteira (TUC) Ecabert, Christophe (EPFL) Georgoulas, George (Up) Krupenia, Stas (SCANIA) Pauzie, Annie (IFSTTAR) Troberg, Sonja (SCANIA) Vallejo, Alex (IDIADA) Wendemuth, Andreas (OVGU) Willstrand, Tania (VTI) Zanovello, Luca (DUCATI)
Project Coordinator Dr. Anna Anund Research Director / Associate Professor VTI - Olaus Magnus väg 35 / S-581 95 Linköping / Sweden Tel: +46-13-20 40 00 / Direct: +46-13-204327 / Mobile: +46-709 218287 E-mail: [email protected]

ADAS&ME (688900) D1.1 – SoA and Benchmarking
March, 2017 Page 3 of 238 CERTH/HIT
Legal Disclaimer The information in this document is provided “as is”, and no guarantee or warranty is given that the information is fit for any particular purpose. The above referenced authors shall have no liability for damages of any kind including without limitation direct, special, indirect, or consequential damages that may result from the use of these materials subject to any liability which is mandatory due to applicable law.
The present document is a draft, and it is not yet approved by the EC. The sole responsibility for the content of this publication lies with the authors. It does not necessarily reflect the opinion of the European Union. Neither the INEA nor the European Commission is responsible for any use that may be made of the information contained therein. © 2017 by ADAS&ME Consortium

ADAS&ME (688900) D1.1 – SoA and Benchmarking
March 2017 Page 4 of 238 CERTH/HIT
Table of Contents
EXECUTIVE SUMMARY ................................................................................................................. 16 1. INTRODUCTION ...................................................................................................................... 18
1.1 OBJECTIVES .............................................................................................................................. 19 1.2 METHODOLOGY ........................................................................................................................ 19 1.3 CONNECTION TO USE CASES .................................................................................................... 20
2 OVERVIEW OF AFFECTIVE STATE RECOGNITION TECHNIQUES ......................... 20 2.1 AFFECTIVE STATES’ DEFINITIONS ............................................................................................ 20 2.2 DRIVER MONITORING ............................................................................................................... 23
3 LITERATURE REVIEW ON DRIVER IMPAIRMENT AND MONITORING ................ 23 3.1 FATIGUE, DROWSINESS AND SLEEPINESS ................................................................................. 24 3.2 STRESS ...................................................................................................................................... 33 3.3 RANGE ANXIETY ....................................................................................................................... 33 3.4 EMOTIONS ................................................................................................................................ 38 3.5 INATTENTION/ DISTRACTION/ WORKLOAD .............................................................................. 48 3.6 PHYSIOLOGICAL STATES........................................................................................................... 59 3.7 REST ......................................................................................................................................... 59 3.8 ENVIRONMENTAL SENSING ...................................................................................................... 59
4 APPLICATIONS (DRIVER’S/ RIDER’S MONITORING SYSTEMS) ............................... 71 4.1 PASSENGER CAR, BUS AND TRUCKS ....................................................................................... 71 4.1.1 FATIGUE/ DROWSINESS/ SLEEPINESS ................................................................................... 71 4.1.2 INATTENTION/ DISTRACTION/ COGNITIVE LOAD ................................................................. 86 4.1.3 STRESS/ RANGE ANXIETY ..................................................................................................... 97 4.1.4 REST CONDITION ................................................................................................................ 108 4.1.5 EMOTIONS .......................................................................................................................... 117 4.1.6 ENVIRONMENTAL SENSING TECHNOLOGIES....................................................................... 126 4.2 RIDER MONITORING SYSTEMS ............................................................................................. 134 4.2.1 RIDER SYSTEMS .................................................................................................................. 134 4.2.2 WEARABLES, HELMETS &ACCESSORIES ........................................................................... 144 4.2.3 SUBJECTIVE MEASURE ....................................................................................................... 147 4.2.4 AUTOMATION STRATEGIES AND PATTERNS FOR MOTORCYCLES ....................................... 148 4.3 TRANSFER OF KNOWLEDGE FROM AVIATION, RAIL AND MARITIME ....................................... 151
5 ALIGNMENT OF RESULTS ................................................................................................. 155 5.1 ALIGNMENT WITH ACEM PRIORITIES ................................................................................ 155 5.1.1 OBJECTIVE.......................................................................................................................... 155 5.1.2 ACEM PRIORITIES.............................................................................................................. 155 5.1.3 RESULTS ............................................................................................................................. 156 5.1.4 CONCLUSION ...................................................................................................................... 157 5.2 ALIGNMENT WITH ERTRAC PRORITIES ............................................................................ 158 5.2.1 OBJECTIVE.......................................................................................................................... 158 5.2.2 ERTRAC’S PRIORITIES ...................................................................................................... 158 5.2.3 ALIGNMENT........................................................................................................................ 159 5.2.4 RESULTS ............................................................................................................................. 159 5.2.5 CONCLUSION ...................................................................................................................... 160 5.3 ALIGNMENT WITH TRILATERAL WORKING GROUP ON AUTOMATION (EU-US-JAPAN) –
CARTRE PROJECT ........................................................................................................................ 162 5.3.1 OBJECTIVES ........................................................................................................................ 162 5.3.2 CARTRE’S PRIORITIES ...................................................................................................... 162 5.3.3 METHODOLOGY ................................................................................................................. 162 5.3.4 RESULTS ............................................................................................................................. 162 5.3.5 CONCLUSION ...................................................................................................................... 163 5.4 ALIGNMENT WITH EURO NCAP PRIORITIES ...................................................................... 163
5.4.1 OBJECTIVES ........................................................................................................................ 163

ADAS&ME (688900) D1.1 – SoA and Benchmarking
March 2017 Page 5 of 238 CERTH/HIT
5.4.2 NCAP’S PRIORITIES ........................................................................................................... 163 5.4.3 METHODOLOGY ................................................................................................................. 165 5.4.4 RESULTS ............................................................................................................................. 165
6 CONCLUSIONS ....................................................................................................................... 165
REFERENCES .................................................................................................................................. 169
ANNEX. 1 COMPENDIUM OF LITERATURE REVIEW ......................................................... 176
ANNEX 2. AUTOMATION STRATEGIES FOR MOTORCYCLES ......................................... 217
ANNEX 3. TRANSFER OF KNOWLEDGE FROM OTHER TRANSPORTATION AREAS 226
ADAS&ME (688900) D1.1 – SoA and Benchmarking
March 2017 Page 6 of 238 CERTH/HIT
Index of Figures
FIGURE 1: SAE INTERNATIONAL’S NEW STANDARD J3016: TAXONOMY AND DEFINITIONS FOR TERMS
RELATED TO ON-ROAD MOTOR VEHICLE AUTOMATED DRIVING SYSTEMS ...................................... 18 FIGURE 2: HISTORY AND STEPS TAKEN TOWARDS AUTOMATED FUNCTIONS AND DRIVER AUTOMATION ..... 19 FIGURE 3: ADAS&ME BENCHMARKING GENERIC METHODOLOGY .......................................................... 20 FIGURE 4: RGB-D PLACEMENT FOR DRIVER ACTIVITY IDENTIFICATION................................................... 23 FIGURE 5: EYE BLINK SHAPE ................................................................................................................... 26 FIGURE 6: KEY CATEGORISATION FOR LITERATURE REVIEW .................................................................... 27 FIGURE 7: GALVANIC SKIN RESPONSE (GSR) NORMALISED RESPONSES AS A FUNCTION OF TIME (SEC) .... 33 FIGURE 8: LIST AND COMPARISON OF PUBLICLY AVAILABLE DATABASES OF FACIAL EXPRESSIONS AND
AUS.. ............................................................................................................................................. 43 FIGURE 9: DELPHI’S DRIVER STATE MONITORING SYSTEM ..................................................................... 72 FIGURE 10: SEEING MACHINES DRIVER SAFETY SYSTEM ON BOARD ........................................................ 72 FIGURE 11: DRIVER INFORMATION AND CAMERA DETECTING FATIGUE ................................................... 72 FIGURE 12: THE ANTI SLEEP PILOT DEVICE (RIGHT) LOCKED ON DASHBOARD (LEFT) .............................. 73 FIGURE 13: AN ANTI-SLEEP DEVICE ........................................................................................................ 74 FIGURE 14: THE STOPSLEEP DEVICE (LEFT) AND WORN WHILE DRIVING (RIGHT) .................................... 75 FIGURE 15: THE VIGO DEVICE ................................................................................................................ 76 FIGURE 16: REAL TIME PERFORMANCE MONITORING (FOR FLEETS) ........................................................ 76 FIGURE 17: VOLVO’S DRIVER ALERT LINKED SYMBOL (LEFT) AND CAMERA CONTINUOUSLY RECOGNISES
LANE MARKINGS (RIGHT) ............................................................................................................... 77 FIGURE 18: FORD’S DRIVER ALERT WARNING ......................................................................................... 78 FIGURE 19: FORD DRIVER ALERT TECHNOLOGIES .................................................................................. 78 FIGURE 20: AUDI’S REST RECOMMENDATION SYSTEM ............................................................................ 79 FIGURE 21: ACTIVE DRIVING ASSISTANT MENU (BMW) ........................................................................... 80 FIGURE 22: VISUAL AND ACOUSTIC WARNING WHEN THE SYSTEM FINDS THE DRIVER IS WANING .............. 81 FIGURE 23: NISSAN’S DAA INFORMS THE DRIVER WHEN IT IS TIME TO TAKE A BREAK .............................. 82 FIGURE 24: THE TI BIOMETRIC STEERING WHEEL ................................................................................... 83 FIGURE 25: THE BIORICS ALGORITHM USED TO DETECT SLEEPINESS IN TRUCK DRIVERS ........................ 84 FIGURE 26: HMI FEATURE FOR IN-VEHICLE CENTRAL MIRROR (LEFT) AND HMI SHOWING INCREASE IN
COGNITIVE WORKLOAD (RIGHT) ..................................................................................................... 86 FIGURE 27: A CLASS: ATTENTION ASSIST ................................................................................................. 87 FIGURE 28: THE I-ACTIVSENSE IN ACTION ........................................................................................... 88 FIGURE 29: EYE SIGHT CAMERA .............................................................................................................. 89 FIGURE 30: EYE SIGHT CAMERA DETECTS A PROBABLY CRITICAL FRONTAL EVENT ................................... 89 FIGURE 31: SUBARU WITH EYESIGHT DASHBOARD: A) PRE-COLLISION BRAKING ALERT, B) ADAPTIVE
CRUISE CONTROL, C) LANE DEPARTURE WARNING, D) DRIFTING BACK AND FORTH WARNING.......... 90 FIGURE 32: NEONODE ZFORCE STEERING WHEEL SENSOR ...................................................................... 90 FIGURE 33: MIO ALPHA 2 WEARABLE DEVICE (SOURCE: BIORICS) ..................................................... 97 FIGURE 34: MEASUREMENT BOX FOR 1 DRIVER (SOURCE: BIORICS) ..................................................... 98 FIGURE 35: PIP DEVICE (SOURCE: CALVANIC LTD) .............................................................................. 99 FIGURE 36: TINKE FOR IOS AND ANDROID DEVICES (SOURCE: ZENZORIUM) ......................................... 100 FIGURE 37: TINKE TECHNICAL SPECIFICATIONS (SOURCE: ZENZORIUM) ............................................... 100 FIGURE 38: SPIRE DEVICE (SOURCE: SPIRE) ......................................................................................... 101 FIGURE 39: EMBRACE WATCH MAJOR COMPONENTS (SOURCE: EMPATICA) ...................................... 102 FIGURE 40: ESENSE SKIN RESPONSE (SOURCE: MINDFIELD BIOSYSTEMS LTD) ................................... 103 FIGURE 41: SC911 SENSOR (SOURCE: STENS CORPORATION) ............................................................. 103 FIGURE 42: NEUMITRA (SOURCE: NEUMITRA) ..................................................................................... 104 FIGURE 43: NEUROSKYLAB ENVIRONMENT (SOURCE: NEUROSKY) ....................................................... 105 FIGURE 44: IN CAR RANGE CALCULATOR ............................................................................................... 106 FIGURE 45: PHONE ACTIVATION OF SMALL CHARGE.................................................................................105
FIGURE 46: TESLA RANGE ASSISTANCE .................................................................................................. 106 FIGURE 47: RANGE ASSISTANCE (BMW)................................................................................................ 107 FIGURE 48: MEASURING HEART RATE (SOURCE: FITBIT) ...................................................................... 108

ADAS&ME (688900) D1.1 – SoA and Benchmarking
March 2017 Page 7 of 238 CERTH/HIT
FIGURE 49: DISPLAY OF HEART RATE (SOURCE: AZUMIO INC) ............................................................. 109 FIGURE 50: CARDIO PULMONARY EXERCISE TEST (SOURCE: COSMED) ................................................ 110 FIGURE 51: SPECIFICATIONS OF THE PRODUCT (SOURCE: POLAR ELECTRO) ....................................... 111 FIGURE 52: VIVOSMART HR WEARABLE DEVICE (SOURCE: GARMIN LTD) ............................................. 112 FIGURE 53: POD ATTACHED TO ANY MUSCLE (SOURCE: FIBRUX OY).................................................... 113 FIGURE 54: PULSE OX DEVISE (SOURCE: WITHINGS) ............................................................................ 114 FIGURE 55: MAX30205 TYPICAL APPLICATION CIRCUIT (SOURCE: MAXIM INTEGRATED) .................. 115 FIGURE 56: TYPE8395A DEVICE (SOURCE: KISTLER) .......................................................................... 115 FIGURE 57: THE LUMO PLATFORM (SOURCE: LUMO BODYTECH) ........................................................ 116 FIGURE 58: DRIVER AUTHENTICATION VIA FACIAL RECOGNITION (PROJECT MOBII).............................. 117 FIGURE 59: FACIAL RECOGNITION CAMERA (LEFT) AND MOBII SYSTEM INFORMS OWNER THAT DOES NOT
RECOGNISE DRIVER (RIGHT) ......................................................................................................... 118 FIGURE 60: THE FY2 WILL CONNECT WITH OTHER VEHICLES AND THE INFRASTRUCTURE (LEFT) AND
EMOTIONALLY BOND WITH THE DRIVER (RIGHT) ........................................................................... 119 FIGURE 61: EMOTION RECOGNITION SYSTEM SPECIFICATION AND PARAMETERS .................................... 119 FIGURE 62: EQ-RADIO SYSTEM (SOURCE: HTTP://EQRADIO.CSAIL.MIT.EDU/) ...................................... 120 FIGURE 63: EMBRACE FOR USER – SENSORS .......................................................................................... 121 FIGURE 64: E4 EMPRACE SENSORS WITH REAL-TIME MONITORING OF PHYSIOLOGICAL SIGNS ............... 121 FIGURE 65: EMOTIENT INTERFACE........................................................................................................ 122 FIGURE 66: GRAPHICAL REPRESENTATION OF EXPRESSED EMOTIONS (EMOVU) ................................... 123 FIGURE 67: NORDIC APIS FOUNDERS TRAVIS SPENCER AND ANDREAS KROHN – 99% HAPPY .............. 123 FIGURE 68: FACE EXPRESSION SOFTWARE INTERFACE AND EXPRESSION IMAGES PROCESSING ............... 124 FIGURE 69: SIGHCORP DEMONSTRATION F FACE RECOGNITION BASED ON CLOUD ANALYSIS OF FACIAL
EXPRESSIONS ................................................................................................................................ 124 FIGURE 70: SMILE RECOGNITION WITH FACE++ .................................................................................. 125 FIGURE 71: IMOTIONS DETECTS DIFFERENT TYPES OF BODILY CUES BASED ON LAYERS ......................... 125 FIGURE 72: ANALYSIS OF FACE POINTS IN REAL-TIME VIDEO (CROWDEMOTION) ................................... 125 FIGURE 73: FACIOMETRICS EXPRESSION ANALYSIS ................................................................................ 126 FIGURE 74: CAN DETECT AND DISPLAY ROAD SIGN IN THE VEHICLE DASHBOARD ................................... 127 FIGURE 76: MPC5XXX 32-BIT MCU FOR ADAS APPLICATIONS (SOURCE: NXP® SEMICONDUCTORS) 128 FIGURE 77: SENSOR’S PRINCIPLE (SOURCE: OPTICAL SENSORS) .......................................................... 129 FIGURE 78: OVERVIEW OF THE SYSTEM (SOURCE: VAISALA CORPORATION) ....................................... 130 FIGURE 79: MEMS INERTIAL SENSOR (SOURCE: FIRSTSENSOR) ........................................................... 130 FIGURE 80: LIDAR SCANNER (SOURCE: VELODYNE LIDAR INC) ........................................................ 131 FIGURE 81: LOOK THROUGH THE LENSE OF THE MOBILEYE SYSTEM (SOURCE: MOBILEYE) .............. 132 FIGURE 82: MB8450 CAR DETECTION SENSOR (SOURCE: MAXBOTIX INC) ......................................... 133 FIGURE 83: PREFERRED CORRECTION METHOD (SOURCE: NOVATEL) ................................................. 133 FIGURE 84: NOVATEL CORRECT TECHNICAL SPECIFICATIONS (SOURCE: NOVATEL) .......................... 134 FIGURE 85: RIDER (LEFT) AND BIKE (RIGHT) VARIABLES COLLECTED .................................................... 135 FIGURE 86: WIKO APPLICATION AREAS ................................................................................................ 135 FIGURE 87: WISE PRODUCT .................................................................................................................. 136 FIGURE 88: RIDER HEART RATE MEASURES DURING THE RACE .............................................................. 137 FIGURE 89: BRAIN TELEMETRY DEVICE FOR MOTORSPORTS .................................................................. 137 FIGURE 90: INDICATORS AND SENSORS USED TO COLLECT THESE DATA (BRAIN) .................................... 138 FIGURE 91: D-AIR RACING SUIT ........................................................................................................... 139 FIGURE 92: DAINESE D-AIR RACING SUIT PARTS AND SENSORS ............................................................. 139 FIGURE 93: LVL WRISTBAND ................................................................................................................ 140 FIGURE 94: WRISTBAND FEATURES TO COMMUNICATE MOOD, HYDRATION LEVELS, HEART RATE ........... 140 FIGURE 95: LVL MEASURES .................................................................................................................. 140 FIGURE 96: HOW THE PERSPIRATION DETECTIVE WILL WORK ................................................................ 141 FIGURE 97: THE FROSTBITE DETECTOR AND ALARM PROTOTYPE ........................................................... 142 FIGURE 98: HEALTH CHECK UP THROUGH THE STEERING WHEEL (DETECTS FAINTING SPELLS) ............. 143 FIGURE 99: BEMBU HYPOTHERMIA ALERT WRISTBAND .......................................................................... 144 FIGURE 100: SKULLY AR-1 HELMET ..................................................................................................... 146 FIGURE 101: FORCITE ALPINE HELMET ................................................................................................. 146

ADAS&ME (688900) D1.1 – SoA and Benchmarking
March 2017 Page 8 of 238 CERTH/HIT
FIGURE 102: LIVEMAP HELMET ............................................................................................................ 146 FIGURE 103: NANDLOGIC ENCEPHALON HELMET ................................................................................. 147 FIGURE 104: THE MOHAWK SYSTEM MOUNTED ON A HELMET ............................................................... 147 FIGURE 104: ERTRAC STRATEGIC RESEARCH AGENDA, SYSTEM APPROACH TO ROAD TRANSPORT
SOCIETAL CHALLENGES ............................................................................................................... 158 FIGURE 105: BENCHMARKING RESULTS .............................................................................................. 167 FIGURE 107: MYON 320 SURFACE ELECTROMYOGRAPHY (SEMG) SYSTEM ............................................ 194
ADAS&ME (688900) D1.1 – SoA and Benchmarking
March 2017 Page 9 of 238 CERTH/HIT
Index of Tables
TABLE 1: OVERVIEW OF REVIEWED PUBLICATIONS AND SYSTEMS ............................................................ 16 TABLE 2: ADAS&ME USE CASES (UCS) ................................................................................................ 20 TABLE 3: AFFECTIVE STATES’ DEFINITIONS ............................................................................................ 21 TABLE 4: LIST OF MOST VALUABLE SLEEPINESS PHYSIOLOGICAL INDICATORS AND TECHNIQUES ............. 24 TABLE 5: VEHICLE PARAMETERS TO DETECT SLEEPINESS ........................................................................ 27 TABLE 6: SUMMARY OF LITERATURE REVIEW-SLEEPINESS AFFECTIVE CLUSTER ...................................... 28 TABLE 7: SUMMARY OF LITERATURE REVIEW- STRESS AFFECTIVE CLUSTER ............................................. 34 TABLE 8: SUMMARY OF LITERATURE REVIEW-EMOTIONS AFFECTIVE CLUSTER ........................................ 46 TABLE 9: SUMMARY OF LITERATURE REVIEW- INATTENTION/ DISTRACTION AFFECTIVE CLUSTER ............ 49 TABLE 10: SUMMARY OF LITERATURE REVIEW- PHYSIOLOGICAL STATES’ AFFECTIVE CLUSTER ............... 60 TABLE 11: SUMMARY OF LITERATURE REVIEW- REST .............................................................................. 63 TABLE 12: SUMMARY OF LITERATURE REVIEW- ENVIRONMENTAL SENSING ............................................. 68 TABLE 13: KAROLINSKA SLEEPINESS SCALE (KSS) ................................................................................. 85 TABLE 14: COMPUTER VISION ALGORITHMS TO DETECT CELL PHONE USAGE. HIGH RECOGNITION RATES
ARE USUALLY OBTAINED USING VERY DIFFERENT APPROACHES ...................................................... 92 TABLE 15: HANDS RECOGNITION IN DIFFERENT REGIONS INSIDE THE CAR USING CVRR-HANDS 3D
DATASET [1] ................................................................................................................................... 93 TABLE 16: SUPERVISED ALGORITHMS FOR COGNITIVE DISTRACTION DETECTION .................................... 93 TABLE 17: MIXING TYPES OF DISTRACTION DETECTION ALGORITHMS .................................................... 95 TABLE 18: SUMMARY OF LITERATURE REVIEW- AUTOMATION STRATEGIES FOR MOTORCYCLES ............. 149 TABLE 19: KNOWLEDGE TRANSFER FROM OTHER TRANSPORT AREAS .................................................... 151 TABLE 20: OVERVIEW OF ALIGNMENT RESULTS TO ACEM PRIORITIES .................................................. 157 TABLE 21: OVERVIEW OF ALIGNMENT RESULTS TO ERTRAC’S PRIORITIES ........................................... 161 TABLE 22: OVERVIEW OF ALIGNMENT RESULTS TO CARTRE’S PRIORITIES ........................................... 163 TABLE 23: OVERVIEW OF ALIGNMENT RESULTS TO NCAP’S PRIORITIES ................................................ 165 TABLE 24: KEY PUBLICATION FOR ADAS&ME UCS ............................................................................ 166

ADAS&ME (688900) D1.1 – SoA and Benchmarking
March 2017 Page 10 of 238 CERTH/HIT
Glossary
Acronym Full form
A Activity AAM Active Appearance Model ABS Antilock Braking System AC Alternating Current ACC -Advanced Cruise Control
-Anterior Cingulate Cortex ACEM European Association of Motorcycles Manufacturers ADAS Advanced Driver Assistance Systems ADC Analog-to-Digital Converter AEB Autonomous emergency braking AFE Analog Front-Ends AFEA Automatic Facial Expression Analysis AIDE Adaptive Integrated Driver vehicle Interface AIC Akaike's Information Criterion ALFF Amplitude of Low Frequency Fluctuation ANFIS Adaptive Neuro-Fuzzy Inference System ANOVA Analysis of Variance ANS Autonomic Nervous System AOI Areas of Interest API Application Programming Interface ART Automated Road Transport ASM Active Shape Model ASP Average Sleep Propensity ATC Air Traffic Control AU Action Unit AUC Area Under Curve AVI Audio Video Interleave AVM Around View Monitoring AVRB Amplitude-Velocity Ratio of Blinks BAL Balance BB Biceps Brachii BBS Bulletin Board System BEV Battery Electric Vehicles BF Biceps Formaris BLE Bluetooth Low Energy BOLD Blood Oxygen Level-Dependent BP Blood Pressure BT Body Temperature BVP Blood Volume Pressure CAN Controller Area Network CBF Cerebral Blood Flow CBV Cerebral Blood Volume C-ITS Cooperative Intelligent Transport Systems CLM Constrained Local Model CMC Connected Motorcycle Consortium CMG Control Moment Gyroscope CMO Complementary Metal Oxide semiconductor CMRO2 Cerebral Metabolic Rate of Oxygen CMU Carnegie Mellon University CNN Convolutional Neural Network CR Carpi Radialis CRF Centro Ricerche Fiat

ADAS&ME (688900) D1.1 – SoA and Benchmarking
March 2017 Page 11 of 238 CERTH/HIT
Acronym Full form
CTREE Classification Trees CV cross-validation CVPR Computer Vision and Pattern Recognition DAA Driver Attention Alert dAAC Amygdala and dorsal Anterior cingulate Cortex DAC Digital-to-Analog Converter DALI Driving Activity Load Index DAQ Data Acquisition DC Deforming Coefficients DCT Discrete Cosine Transform DGPS Differential Global Positioning System DIMS Driver Inattention Monitoring System DMA Direct memory access DMVD Dead-man’s Vigilance Devices DBN Dynamic Bayesian Network DOA Domain of Attraction DRN Dynamic Relational Network DRT Detection Response Task DSB Double Strand Break DSM Driver Status Monitor DSMS DataBase Management System DSP Digital Signal Processing DSSQ Dundee Stress State Questionnaire DVTCS Vigilance Telemetric Control System ECG Electrocardiography ECR Extensor Carpi Radialis EDA Electrodermal Activity EEG Electroencephalography EI Eye Index EIC External/Internal Convertible EKG Electrocardiogram EMG Electromyography EMS Electro Mechanical Systems EOG ElectroOculoGram EOF Eyes-Off-Road ERP Event-Related Potential ERTRAC European Road Transport Research Advisory Council ERS Everyday Range Stress ES Erector Spinae ESS Epsworth Sleepiness Scale EV Electric Vehicle F Fahrenheit FACS Facial Action Coding System FDR Flight Data Recorder FER Facial Emotion Recognition FERET Facial Recognition Technology FFT Fast Fourier Transform FLC Fuzzy Logic Controllers fMRI functional Magnetic Resonance Imaging FOT Field Operational Tests FOV Field of View FPGA Field-Programmable Gate Array FRM Fatigue Risk Management FS Flexor Superficialis

ADAS&ME (688900) D1.1 – SoA and Benchmarking
March 2017 Page 12 of 238 CERTH/HIT
Acronym Full form
G Gastrocnemius GA Genetic Algorithms GIE GPU Inference Engine GMD Gray Matter Density GNSS Global Navigation Satellite System GP Grip Pressure GPS Global Positioning System GPU Graphics Processing Unit GS Gerchberg–Saxton GSR Galvanic Skin Response HA Highly Automated HCI Human-Computer Interaction HCRF Hidden Conditional Random Fields HD High Definition HDRT Head-mounted Detection Response Task HF High Frequency HISS Highway Intelligent Space System HMI Human Machine Interface HoG Histogram of Oriented Gradients HR Heart Rate HRV Heart Rate variability HUD Head-Up-Display IAF Individual Alpha Frequency ICA Independent Component Analysis ICC Intraclass Correlation Coefficient ICEVS Internal Combustion Engine Vehicles ICP Iterative Closest Point IMU Inertial Measurement Unit INEA Innovation and Networks Executive Agency IR Infrared IVIS In-vehicle Information System IWI WG Information, Warning and Intervention Working Group JDS Johns Drowsiness Scale KDS Karolinska drowsiness score KSS Karolinska Sleepiness Scale KNN K Nearest Neighbour LBP Local Binary Patterns LCD Liquid Crystal Display LD Latissimus Dorsi LDA Linear Discriminate Analysis LDC Linear Discriminant Classifier LDF Linear Discriminant Function LDW Lane Departure Warning LED Light Emitting Diode LF Low Frequency LIDAR -Light Detection And Ranging
-Light Imaging, Detection, And Ranging Li-ion Lithium Ion LKS Lane Keeping System LMPC Linear Model Predictive Control LPV Linear-Parameter-Varying LQR Linear Quadratic Regulator LRNN Layer-Recurrent Neural Networks MAEB Motorcycle Autonomous Emergency Braking

ADAS&ME (688900) D1.1 – SoA and Benchmarking
March 2017 Page 13 of 238 CERTH/HIT
Acronym Full form
MATB Multi Attribute Task Battery MCU Microprocessor Control Unit MEMS Micro Electro-Mechanical Systems ML Machine Learning MoCC Mean of Class classifier MoU Memorandum of Understanding MPC Model Predictive Control MPEG Moving Picture Experts Group MRF Markov Random Fields MVC Model View Controller MWL Mental Workload MySQL Structured Query Language NBC Naive Bayes Classifier NCAP New Car Assessment Programme NFC Near Field Communication NHTSA National Highway Traffic Safety Administration NMI Normalized Mutual Information NMPC Nonlinear Model Predictive Control NN Normal-to-Normal NIR Near Infrared OEM Original Εquipment Μanufacturer ORD Objective Rating of
Drowsiness PA Pupil Activity PCA Principal Component Analysis PCB Printed Circuit Board PCC Posterior Cingulate Cortex PCM Phase Change Material PERCLOS PERcentage of eyelid CLOSure over time PD Pupil Diameter PDM Point Distribution Model PHP Hypertext Pre Processor PID Proportional–Integral–Derivative PIS Powered Two wheeler Integrated Safety PPE Personal Protective Equipment PPP Precise Point Positioning PRC Percentage Road Centre PSAP Public Safety Answering Points PVT Psychomotor Vigilance Test PTW Powered Two Wheelers QFT Quantitative Feedback Theory QoE Quality of Experience QT Quiz Task RBF Radial Basis Function RDRT Remote Detection Response Task ReHo Regional Homogeneity RESB Resubstitution RFID Radio-frequency identification
RH Relative Humidity
RGB-D Are a specific type of depth sensing devices that work in association with a RGB camera, that are able to augment the conventional image with depth information
RMSSD Root of the Mean Squared Successive Differences ROC Receiver-Operating Characteristic

ADAS&ME (688900) D1.1 – SoA and Benchmarking
March 2017 Page 14 of 238 CERTH/HIT
Acronym Full form
ROI Region of Interest RPM Revolutions per Minute RR Respiration Rate RSME Rating Scale Mental Effort RTK Real-Time Kinematic RTLX Raw Task Load Index S Sternocleidomastoid SAR Specific Absorption Rate SBA Spontaneous Brain Activity SBAS Satellite-Based Augmentation System SDK Software Development Kit SDLP Standard Deviation of Lateral Position SDM Supervised Descent Method SDNN Standard Deviation of NN intervals SF Scaling Factor SHRP Strategic Highway Research Program SIFT Scale-Invariant Feature Transform SLM Stress Level Monitoring SMC Symbolic Model Checking SMI Senso Motoric Instruments
SNR Signal-to-Noise Ratio
SNS Sympathetic Nervous System
SoA State of the Art
SPO2 Oxygen saturation measured by pulse oximetry
SPS Samn Perelli Fatigue Scale SRAM Static Random access memory SRFC Seed-Region-based Functional Connectivity ST Skin Temperature SURT Surrogate Visual Research Task SVM Support Vector Machine SWAT Subjective Workload Assessment Technique SWI Susceptibility-Weighted Images SWM Statistical Wave Model T Trapezius TB Triceps Brachii TBC To Be Confirmed TBD To Be Determined TDRT Tactile Detection Response Task TETTC Time Exposed Time to Collision TEDD Thoracic Effort Drowsiness Detection TLC Time-to-Line Crossing TM Trapezius Medial TOR Take-over Request TTC Time-To-Collision UC Use Case USB Universal Serial Bus V2V Vehicle-to-Vehicle V2X Vehicle-to-All VAD Vascular Density VAS Visual analogue scales VBM Voxel-Based Morphometry VIS Visible Imaging System

ADAS&ME (688900) D1.1 – SoA and Benchmarking
March 2017 Page 15 of 238 CERTH/HIT
Acronym Full form
VLP Variation of Lane Position VO2 Volume of Oxygen VOG VideoOculoGraphy VRU Vulnerable Road Users WSN Wireless Sensor Network

ADAS&ME (688900) D1.1 – SoA and Benchmarking
March 2017 Page 16 of 238 CERTH/HIT
Executive Summary
This document reports the results from the literature review and State-of-the-Art (SoA) benchmarking search carried out within A1.1 “Benchmarking and SoA” for systems that are relevant to the project’s preliminary Use Cases (UCs) of ADAS&ME project. In general, benchmarking is considered a continuous and systematic approach to measure the processes and outputs against the most relevant (and occasionally) toughest competitors in the business, or at least the most prominent/ profitable ones. This is a so called competitive benchmarking approach. In this document a qualitative benchmarking approach is adopted. Three different types of results are included in this document: a) literature search and reviews of literature on drive/rider affective states, ) b) SoA of driver and rider monitoring systems, and, lastly, c) alignment of the results with key selected organization’s priorities and roadmaps about automated vehicle systems and functions. The deliverable opens with the introduction to automated functions in driving, the objectives of the document and the addressed UCs (Chapter 1). An overview of addressed affective states per Use Cases, as they are currently agreed upon, are presented in Chapter 2, along with their general definitions and driver monitoring techniques and systems. Chapter 3 presents an introduction to main research findings per affective state, followed by a literature review overview table, including connection to the project and respective Use Cases. The complete compilation per affective state is included in sub-sections of Annex 1. The table at the end of the Executive Summary includes the number of journals reviewed and systems selected (Table 1). In addition, a short literature review was carried out to investigate the automation strategies for stabilisation mechanisms for motorcycles. The work and relevant findings are included in main the document and the rest were added in Annexes 1-3. The literature review is followed by the benchmarking of existing State of the Art (SoA) technologies for drivers and riders per addressed affective state (Chapter 4). Similarly, an overview of findings is presented in the table at the end of the summary. In addition, studies from other transport modes were reviewed, for their potential of transferring knowledge, methods and techniques. The results are summarised in a Table in Section 4.3, but the whole compilation of the studies was annexed. Chapter 5 presents the alignment of A1.1 results with the efforts of several established organizations, such as ACEM, ERTRAC, NCAP and the international collaborations within CARTRE project. The Deliverable concludes with Chapter 6, where an overview of the results, in terms of numbers and relevance (key categorization) to the project, are presented.
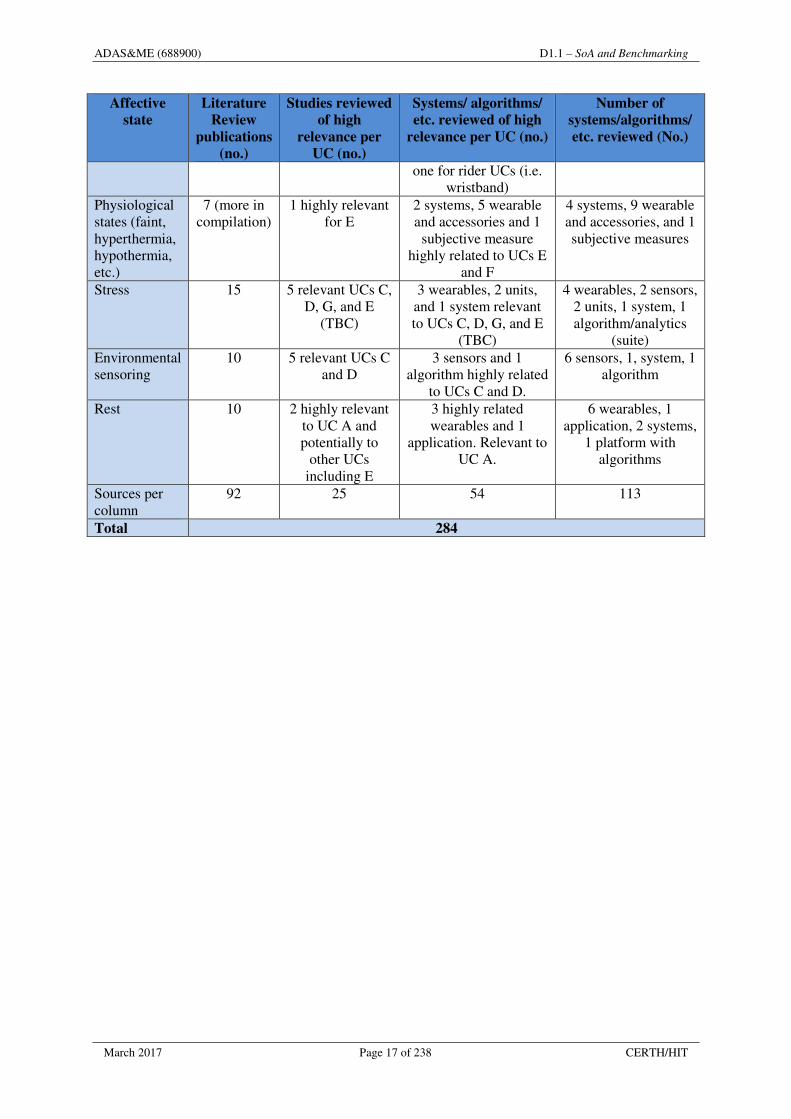
Table 1: Overview of reviewed publications and systems
Affective
state
Literature
Review
publications
(no.)
Studies reviewed
of high
relevance per
UC (no.)
Systems/ algorithms/
etc. reviewed of high
relevance per UC (no.)
Number of
systems/algorithms/
etc. reviewed (No.)
Sleepiness 16 3 highly relevant for UCs A, C, D,
G
6 systems and 1 subjective (KSS)
relevant for UCs A, C, D, G
14 systems, 4 subjective measures
Range anxiety 9 1 highly relevant for UC B
2 systems for UC B 3 systems
Inattention 21 7 highly relevant for UCs C, D, E,
G
3 systems, 7 sensors, 4 algorithms, 1 subjective scale for UCs C, D, E,
F, G
6 systems, 7 sensors, 12 algorithms, 5 subjective scales
Emotions 4 1 highly relevant for UCs A, B, C,
D
2 systems relevant, 6 face and speech apps
for UCs A, B, C, D and
5 systems, 15 apps and APIs
ADAS&ME (688900) D1.1 – SoA and Benchmarking
March 2017 Page 17 of 238 CERTH/HIT
Affective
state
Literature
Review
publications
(no.)
Studies reviewed
of high
relevance per
UC (no.)
Systems/ algorithms/
etc. reviewed of high
relevance per UC (no.)
Number of
systems/algorithms/
etc. reviewed (No.)
one for rider UCs (i.e. wristband)
Physiological states (faint, hyperthermia, hypothermia, etc.)
7 (more in compilation)
1 highly relevant for E
2 systems, 5 wearable and accessories and 1
subjective measure highly related to UCs E
and F
4 systems, 9 wearable and accessories, and 1 subjective measures
Stress 15 5 relevant UCs C, D, G, and E
(TBC)
3 wearables, 2 units, and 1 system relevant to UCs C, D, G, and E
(TBC)
4 wearables, 2 sensors, 2 units, 1 system, 1 algorithm/analytics
(suite) Environmental sensoring
10 5 relevant UCs C and D
3 sensors and 1 algorithm highly related
to UCs C and D.
6 sensors, 1, system, 1 algorithm
Rest 10 2 highly relevant to UC A and potentially to
other UCs including E
3 highly related wearables and 1
application. Relevant to UC A.
6 wearables, 1 application, 2 systems,
1 platform with algorithms
Sources per column
92 25 54 113
Total 284

ADAS&ME (688900) D1.1 – SoA and Benchmarking
March 2017 Page 18 of 238 CERTH/HIT
1. Introduction
ADAS&ME is an intermediate step towards full automation and addresses certain automated functions with clearly set Use Cases for different types of vehicles (passenger cars, trucks, buses and motorcycles). Vehicles with (varying levels of) automated functions already exist in the market and they include one of more types of technologies that aim to increase driver’s comfort and safety, and operate by controlling the vehicles applying braking, steering and throttle control. The driver may (or may not) be actively involved (e.g. switch on/off and take over control). Vehicles that have on-board systems that inform or warn the drivers (e.g. a lane departure warning systems) are not automated because they do not take control or request to take control at any point during driving. Vehicles with automated functions contain similar systems with other cars (e.g. cameras and GPS) but the vehicle takes the control in several or specific occasions. Vehicles can have automated functions (e.g. cruise control is a function found in many vehicles nowadays) or be totally automated and self-driving. With the goal of providing common terminology for automated driving, SAE International’s new standard J3016: Taxonomy and Definitions for Terms Related to On-Road Motor Vehicle Automated Driving Systems, delivers a harmonized classification system and supporting definitions that is shown in the table below.
Figure 1: SAE International’s new standard J3016: Taxonomy and Definitions for Terms Related to
On-Road Motor Vehicle Automated Driving Systems
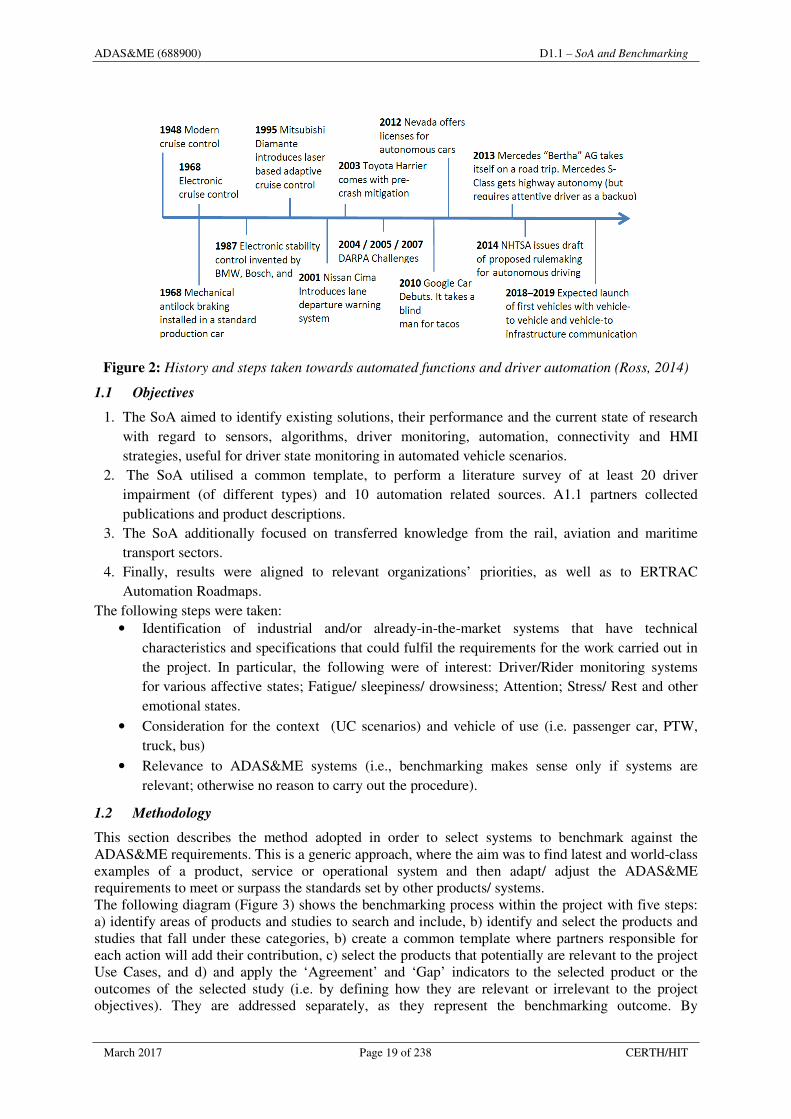
Ross (2014) reported that the efforts to develop automated driving functionalities started almost thirty years, resulting in many semi-automated functions and features with a close look to near future launching of connected vehicles (Figure 2). In ADAS&ME, automated functions are addressed in most UCs, with variations for different vehicle types and UCs. Each UC focuses on one type of vehicle but might address different affective states. Monitoring the affective state is important in order not only to investigate if it will affect the driver’s driving task (i.e., performance and/ or impairment) but if the driver/rider should be in control or take control of the vehicle. The inter-relation between each affective state will be further defined and discussed within D1.2.
ADAS&ME (688900) D1.1 – SoA and Benchmarking
March 2017 Page 19 of 238 CERTH/HIT
Figure 2: History and steps taken towards automated functions and driver automation (Ross, 2014)
1.1 Objectives
1. The SoA aimed to identify existing solutions, their performance and the current state of research with regard to sensors, algorithms, driver monitoring, automation, connectivity and HMI strategies, useful for driver state monitoring in automated vehicle scenarios.
2. The SoA utilised a common template, to perform a literature survey of at least 20 driver impairment (of different types) and 10 automation related sources. A1.1 partners collected publications and product descriptions.
3. The SoA additionally focused on transferred knowledge from the rail, aviation and maritime transport sectors.
4. Finally, results were aligned to relevant organizations’ priorities, as well as to ERTRAC Automation Roadmaps.
The following steps were taken: • Identification of industrial and/or already-in-the-market systems that have technical
characteristics and specifications that could fulfil the requirements for the work carried out in the project. In particular, the following were of interest: Driver/Rider monitoring systems for various affective states; Fatigue/ sleepiness/ drowsiness; Attention; Stress/ Rest and other emotional states.
• Consideration for the context (UC scenarios) and vehicle of use (i.e. passenger car, PTW, truck, bus)
• Relevance to ADAS&ME systems (i.e., benchmarking makes sense only if systems are relevant; otherwise no reason to carry out the procedure).
1.2 Methodology
This section describes the method adopted in order to select systems to benchmark against the ADAS&ME requirements. This is a generic approach, where the aim was to find latest and world-class examples of a product, service or operational system and then adapt/ adjust the ADAS&ME requirements to meet or surpass the standards set by other products/ systems. The following diagram (Figure 3) shows the benchmarking process within the project with five steps: a) identify areas of products and studies to search and include, b) identify and select the products and studies that fall under these categories, b) create a common template where partners responsible for each action will add their contribution, c) select the products that potentially are relevant to the project Use Cases, and d) and apply the ‘Agreement’ and ‘Gap’ indicators to the selected product or the outcomes of the selected study (i.e. by defining how they are relevant or irrelevant to the project objectives). They are addressed separately, as they represent the benchmarking outcome. By

ADAS&ME (688900) D1.1 – SoA and Benchmarking
March 2017 Page 20 of 238 CERTH/HIT
agreement we mean the extent to which this system covers the requirements of the project and its systems (incl. the ones to be developed) and by gap we mean the aspects/ characteristics missing by the systems that will be/ or have to be part of the ADAS&ME systems, in order to fulfil the project aims.
Figure 3: ADAS&ME benchmarking generic methodology
1.3 Connection to Use Cases
The driving force behind the searches and the selection of studies, systems and products was the Use Cases. It is evident that the application of the methodology was not always so straightforward. At this early stage of the project, many assumptions are necessary in order to accept and include any possible connections to ADAS&ME UCs. The main limitation is that the project’s UCs are not final and their descriptions carry in depth of analysis and concreteness. The following table (Table 2) presents the ADAS&ME UCs.
Table 2: ADAS&ME Use Cases (UCs)
Short name Full name
A Attentive long haul trucking B Electric vehicle range anxiety C Driver state based smooth and safe automation transitions D Non-reacting driver emergency manoeuvre
E Long range attentive touring with motorbike
F Rider faint G Passenger pick up / drop off automation for buses
2 Overview of affective state recognition techniques
The following sections in this chapter demonstrate the major areas of interest across affective states, UCs and vehicles in the deliverable.
2.1 Affective states’ definitions
Affective states addressed in the project need to be defined in terms of project and Use Cases context and demands. The following definitions are not the ones adopted for the project but they will be
Identify Benchmarking areas/
product categories
Identify companies and products that fall into these categories
Gather information/ descriptions and
communicate with partners responsible per action based on a
common template (Gathered indicators)
Focus search based on UC requirements-Connection between benchmarking action and ADAS&ME UCs
(selection/ performance
indicator)
Outcome is characterised based
on the following indicators:
Agreement
and
Gap

ADAS&ME (688900) D1.1 – SoA and Benchmarking
March 2017 Page 21 of 238 CERTH/HIT
further refined (or made specific), in order to accommodate for each UC’s requirements. Responsible partners were asked to complete also any definitions they have found of affective states during the literature searches. The initial templates circulated to responsible partners, included two extra columns, aiming to assist the work carried out within A1.3 (affective state definition and ground truth, respectively). The following table presents the definitions of affective states, as currently being defined in the project, the clustering of affective states - depending on their definition and relation to other, as well as the currently undertaken ones within A1.3. The final agreed definitions will be included in D1.2 (due M9).
Table 3: Affective states’ definitions
Cluster Affective state Definition UC
Fa
tig
ue
Fatigue Fatigue refers to tiredness that can be physical and/or mental (Hawley et al., 1997)
A, C, D, G
Drowsiness/ Sleepiness
Sleepiness is the propensity to fall asleep. Sleepiness is a result of changes in several regulatory factors. The most central one is sleep. For sleepiness there is an operational definition: “a physiological drive to fall asleep” (Dement & Carskadon, 1982).
A, C, D
Rest (state of rest) Rest is a state characterized by relaxation, and in most cases, mental and physical inactivity. Thus, the definition of rest means that no work is undertaken.
A
Att
enti
on
Focus of Attention/Attention
Attention is defined as the allocation of resources to a set of activities, whereat a resource denotes any sensory, actuator, perceptual, motor or cognitive mechanism that is utilized in performing activities. It is characterized by two dimensions: activation and selectivity (Engström et al., 2013).
A, C, D
Inattention Described as “a mismatch between the current allocation of resources and those resources demanded by activities critical for safe driving (Regan et al., 2014).
C, D, E, G
Visual distraction Three types exist: a) occurs when the driver’s visual field is blocked by objects, that prevent them from detecting or recognizing objects or hazards in the road environment, b) occurs when the driver neglects to look at the road and instead focuses on another visual target for an extended period of time and c) involves a loss of visual “attentiveness”, often referred to as “looked, but did not
see”, and interferes with the driver’s ability to recognize hazards in the road environment (Hajime et al., 2001).
C, D, E
Cognitive Distraction
Includes any thoughts that absorb the driver’s attention to the point where they are unable to navigate through the road network safely and their reaction time is reduced (NHTSA, 2000).
C,D
Em
oti
on
Emotion state/valence
Valence, as used in psychology, especially in discussing emotions, means the intrinsic attractiveness (positive valence) or averseness (negative valence) of an event, object, or situation (Harmon et al., 2004).
A, B, C, D

ADAS&ME (688900) D1.1 – SoA and Benchmarking
March 2017 Page 22 of 238 CERTH/HIT
Cluster Affective state Definition UC
Emotions An affective state of consciousness in which one or more of the below-mentioned states are experienced, as distinguished from cognitive and volitional states of consciousness. Universality of a facial expression indicates that it is presented in a particular fashion, in the same way among everyone regardless of the age, gender, ethnicity or cultural background. According to Ekman (1999) there are six of those emotions: Happiness, Surprise, Anger, Sadness, Fear, and Disgust (Cabanac, 2002).
C, D S
tres
s/ W
ork
loa
d
Anxiety “Anticipation of a situation that cannot be mastered using available resources” which is characterized by a feeling of strain and pressure (Lazarus & Folkman, 1984).
B, C, D (range
anxiety) Stress “Anticipation of a situation that cannot be mastered using
available resources” which is characterized by a feeling of strain and pressure (Semmer et al., 2007)
C, D, E (TBC),G
Mental effort/ workload
Workload is the amount of resources that are required by a set of concurrent task and distinguishing between three types of workload (visual, motor, mental) (Hoedemaker, 2002)
C, D
Confusion A disruption of awareness marked by amazement, a lack of cognitive or behavioural clarity, and confusion for place, individual, and time. Commonly referred to as mental confusion (http://psychologydictionary.org/confusion/)
C, D
Ph
ysi
olo
gic
al
sta
tes
Dehydration Refers to a deficit of total body water, with an accompanying disruption of metabolic processes. Dehydration is also a cause for hypernatremia. The term dehydration is distinct from hypovolemia (loss of blood volume, particularly plasma) (Mange et al., 1997).
F
Hyperthermia (most probably potentially heat strokes)
An elevated body temperature due to failed thermoregulation that occurs when a body produces or absorbs more heat than it dissipates. For humans hyperthermia is defined as a temperature greater than 37.5 °C or 38.3 °C, on the reference used, that occurs without a change in the body's temperature set point (Karakitsos et al., 2006).
E (TBD)
Hypothermia Is defined as a body core temperature below 35.0 °C. Hypothermia usually occurs from exposure to low temperatures, and is frequently complicated by alcohol consumption (Brown et al., 2012).
E (TBD)
Frostbite The medical condition in which localized damage is caused to skin and other tissues due to freezing. Frostbite is most likely to happen in body parts farthest from the heart and those with large exposed areas. The initial stages of frostbite are sometimes called frostnip. (http://emedicine.medscape.com)
E (TBD)
Faint Syncope, also known as fainting, is defined as a short loss of consciousness and muscle strength, characterized by a fast onset, short duration, and spontaneous recovery (Peeters et al., 2014).
F

ADAS&ME (688900) D1.1 – SoA and Benchmarking
March 2017 Page 23 of 238 CERTH/HIT
2.2 Driver monitoring
Emergence of sensors within the 90’-as well as of increased capacity computers- paved the way for new research in vehicle telematics and innovative research in monitoring driver’s behaviour and states. Work in European projects, such as DETER-EU (Brookhuis, 1995) and PROCHIP/ PROMETHEYS (Esteve et al., 1995) introduce driver monitoring as well as the SAVE-project (Bekiaris, 1999) sensor fusion was introduced to monitor driver impairment. As research progressed, more sensors and more indicators were included - like eyelid sensors, steering wheel sensors, vehicle parameters related sensors. The SENSATION project (SENSATION, 2004) aimed at promoting novel micro and nano sensors for physiological state monitoring. The focus of the work was the detection, the prediction and the management of the sleep and wakefulness states and their boundaries, stress, inattention and hyper-vigilance. The indirect supervision systems are generally based on the analysis of the vehicle’s behaviour that can be correlated to driver actions (steering wheel movement for example) and other information available on the vehicle. It should be noticed that the first Driver Drowsiness Monitoring systems, being already commercialized belong to this category. Driver activity recognition is the process of determining what the driver is doing, while he/she is in the vehicle. With the introduction of in-vehicle information systems, as well as smartphones, drivers often are distracted from their main activity. This situation will become even more common with the introduction of automated vehicles that are decreasing the workload of the driver. Systems available currently can detect head pose (Zhu and Fujimura, 2004), (Murphy-Chutorian and Trivedi, 2008), (Baker, 2004), targeting detection of fatigue and sleepiness by measuring the head pitch. For driver activity monitoring, image processing methodologies were proposed in (Veeraraghavan et al., 2007) for driver activity classification in safe and unsafe (Park and Trivedi, 2005) with classifier algorithms used for activity identification as gear shifting, changing the radio channel, swerving or driving forward- backward. More recently RGB-D sensors were used for driver monitoring under a driving simulator environment (Ikoma, 2014). RGB-D are a specific type of depth sensing devices that work in association with a RGB camera, that are able to augment the conventional image with depth information (related with the distance to the sensor) in a per-pixel basis. In (Kondyli et al., 2013) an RBD sensor was used in the vehicle with very promising results based on the driver motion capture, proposing the development of a framework in order ADAS to take into account not only the vehicle state but also the driver’s activity. The placement of the RGB-D sensor did not allow a second passenger in the vehicle; however a more appropriate placement of the sensor with the use of mirrors is feasible.
Figure 4: RGB-D placement for driver activity identification
3 Literature review on driver impairment and monitoring
The chapter is divided in to eight main sections, with the first seven dedicated to an affective state: a)

ADAS&ME (688900) D1.1 – SoA and Benchmarking
March 2017 Page 24 of 238 CERTH/HIT
fatigue, drowsiness and sleepiness (3.1), b) Stress (3.2), c) Range anxiety (3.3), d) Emotions (3.4), e) Inattention/ distraction/ Workload (3.5), f) Physiological states (3.6), g) Rest (3.7) and finally research on h) environmental sensing (3.8). Driver impairment’s literature survey was conducted by each partner responsible for each affective state and the review results are briefly presented below per reviewed publication. A short summary is added for each study. This section includes a short literature review of primarily relevant aspects for the specific impairment cluster (i.e. milestone advances in the area but not necessarily latest achievements) and a table with latest studies that can really contribute to the ADAS&ME work. The full compendium of literature can be found in Annex 1, stratified per affective state. The compendium aims to serve as reference for working teams from other WPs that wish to utilize the work performed within A1.1 in order to support their work.
3.1 Fatigue, drowsiness and sleepiness
There is no concrete definition for the terms fatigue, drowsiness and sleepiness that are universally accepted. However, early definitions have been taken up and will be further described in A1.3 and discussed in D1.2. The end result is that regardless of any of these definitions or states, they all reduce driver’s vigilance/ arousal and negatively affect their driving performance. Sleepiness was one of the first affective states to be studied and several parameters have been identified to diagnose sleepiness and are presented in the following diagram (SENSATION EU project, 2004-2008). These indicators can be used to monitor the involuntary transition from wakefulness to sleep. The following table stems from the SENSATION project (Deliverable 1.2.2; Muzet, 2006), where the authors defined the most appropriate measures and indicators to detect sleepiness. These were the best candidates for developing systems or prototypes in order to measure and detect sleepiness in drivers. The last column reports any related weaknesses in the proposed measuring process and/ or indicator. This table serves as a baseline and reference list whereas the literature review will further enhance the described systems and indicators. The information presented in Table 4 is old but it has been added because it nicely depicts the complexity and variation of indicators related to the detection of an affective state. Therefore, we expect the variation might increase when we have to monitor several or many affective states but- as it is shown in Table 6- new technologies have enabled less complex procedures and systems (e.g. a device can know measure many indicators) for detecting/ predicting several affective states.
Table 4: List of most valuable sleepiness physiological indicators and techniques
(SENSATION EU project)
Physiologic
al system
Physiol
ogical
functio
n
Physiologi
cal
indicator
Measurement
technique
Comment Weakness
Sensorial
system
Vision Gaze fixity Gaze direction VOG (videooculography)
Camera looking to driver's face
2 cameras with quite resolution are necessary to perform a good reconstruction of the eye gaze
Eye lid closure and blinks
Eyelid sensor Camera looking to driver's face
Results obtained are different depending on conditions of the recording. Globally, main reasons for low detection rate are

ADAS&ME (688900) D1.1 – SoA and Benchmarking
March 2017 Page 25 of 238 CERTH/HIT
Physiologic
al system
Physiol
ogical
functio
n
Physiologi
cal
indicator
Measurement
technique
Comment Weakness
bright incident illumination by daytime driving (e.g. sundown), glasses, fast head movement, driver specific behaviour (hand on face, Inclination of the head).
Motor
system
Body motility
Body posture
Sensitive mattress
Implementation in the seat
Problems with the reliability of the signals. The measurements are strongly dependent on the subjects
ANS
Cardiovascular function
Heart rate Pulse detection Sensor in the steering wheel or in the seat
Implementation of the sensor is critical
Respiration
Respiration movement
Strain gauges Sensor in the seat or linked to the safety belt
Sensitivity
Electrodermal activity
Skin conductance
Electrodes Sensor in the steering wheel
Movement of the hands create artefacts
Skin resistance
Electrodes Sensor in the steering wheel
Skin potentials
Electrodes Sensor in the steering wheel
Behaviour Videometry Camera looking at the driver
Complex image processing
For a complete list of indicators and techniques, please read respective SENSATION deliverable (D1.2.2). Key milestone aspects of sleepiness that have to be addressed are: a) eye closure and thoracic effort characteristics and b) driving performance parameters as indirect measures of sleepiness. a) Eye closure and thoracic effort characteristics These characteristics have traditionally been used across studies with potential for several parameters to be extracted. The spontaneous eye blink comprises 3 phases: i) the closing phase (the eyelid goes down to close), ii) the close phase (the eyelid is down and eye is closed), and iii) the opening phase (the eyelid is going up and the eye is opening). It is obvious from the following shape (Figure 5) that the eyes close faster than they open, with a difference of 200 mm/sec (Speedclosing = 350 mm/ sec and Speedopening 150 mm/sec). Therefore, the speed of closing and opening of the eyelid are measures very sensitive to change because of sleepiness and, more specifically, the peak velocities are measured (mm/sec). The velocities decrease considerably when the driver is sleepy but the variability across participants is high, therefore considerable and repeated measures per person are required, in order to ensure correct detection.

ADAS&ME (688900) D1.1 – SoA and Benchmarking
March 2017 Page 26 of 238 CERTH/HIT
Figure 5: Eye blink shape
Blinks are affected by the driver’s vigilance state (Blinksleepiness =1.5Blinknormal shape (Figure 5)) with blinks referring to sleepiness when they are above 500 ms whereas the ones that are between 120 and 250 ms are considered as normal (“tired” corresponds to 300 and 600 ms). As the driver becomes sleepier, blinks become longer. The increase is not linear and depends on personal characteristics. Blink amplitude, rate and interval are characteristics that are affected by sleepiness but are sensitive to other factors as well. The most common surrogate variable encountered in studies is the so-called PERCLOS (PERcentage of eyelid CLOSure over time), proposed by Wierwille back in 1999. Another commonly used estimate was proposed by Johns and colleagues (2005) and is called AVRBs and measures the blinks’ amplitude/ peak closure velocity ratio that changes with drowsiness levels, including parameters such as duration of eyelid closure and amplitude velocity ratio. Hargutt (2003) proposed another estimate, the drowsiness index, where coils are placed on both eyelids (i.e. upper and lower), in order to enable the measurement and analysis of eyelids’ movement. The eye-opening level is calculated based on a drowsiness detection algorithm that identifies four stages (i.e., fatigue, drowsiness and sleepiness can be also viewed as stages of the same affective state for the algorithms calculations). The stages are: from being awake (Stage 0 – eyes open, short blink durations, low blinking frequencies), to hypovigilant (Stage 1 – eyes open, short blink durations, high blinking frequency), to drowsy (Stage 2 – eyes half closed, long blnk durations, high blinking frequency), as to sleepy (Stage 3 – eyes nearly closed, very long blink durations, micro sleeps). Another type of important biomedical signal, widely used in sleep research, is the thoracic effort. The thoracic signals become irregular when moving from awake to drowsy or sleepy state. The increase of yawns shows that the driver has entered a fatigue state. Changes in the amplitude and signal frequency are lower when compared to the first line (i.e. baseline state). The Thoracic Effort Drowsiness Detection (TEDD) algorithm / index is used to estimate the respiratory rate variability for each person, based on normalizing the individual’s baseline data (i.e. collected in normal conditions) (Lopez & Ibanez, 2012). Video recordings (i.e. face) constitute a timely, not cost-efficient method. Although its sensitivity in fatigue detection is beneath 50% (i.e., transition phase; 49.3%), its specificity is very high (88.7%). b) Driving performance parameters as indirect measures of sleepiness Vehicle parameters have been gathered and measured for many decades in road safety research and they are completely unobtrusive to the driver as well as they do not interrupt or disrupt their driving experience. Vehicle parameters are collected for investigating different aspects of driving behaviour through sensors (e.g., braking, steering wheel turning, lane deviation, headway, etc.). The following table presents the different types of vehicle parameters that can be collected in order to investigate sleepiness whilst driving.

ADAS&ME (688900) D1.1 – SoA and Benchmarking
March 2017 Page 27 of 238 CERTH/HIT
Table 5: Vehicle parameters to detect sleepiness
Measure
Control Activity measures Performance measures
Longitudinal
Braking, accelerating, decelerating, braking reaction time, errors
Headway (distance/time)
Lateral
Magnitude and frequency of steering, slow and fast steering corrections, position in relation to lane markings
Lateral position, Standard Deviation of Lateral Position (SDLP), Time-to-Line Crossing (TLC), Lane crossing no., mean yaw rate, mean lateral position.
Dawson and colleagues (2014) reviewed evidence supporting fatigue detection technologies and identifies criteria for assessing evidence supporting these technologies (i.e. developer validation, Independent validation, Laboratory studies, Field studies, Tested against an established fatigue measure (e.g., PVT, EEG), Tested against driving performance, Sensitivity/specificity , End user acceptability). Identified devices typically assessed correlates of fatigue using either psychophysiological measures or embedded performance measures drawn from the equipment being operated. Critically, the majority of the ‘validation’ data were not found within the scientific peer-reviewed literature, but within the quasi-scientific, grey or marketing literature. Based on the validation evidence available, none of the current technologies met all the proposed regulatory criteria for a legally and scientifically defensible device. Further, none were sufficiently well validated to provide a comprehensive solution to managing fatigue-related risk at the individual level in real time. Horrey and colleagues (2012) evaluated numerous on-board systems with regards to their effect on safety. They reached a similar conclusion with Dawson et al. (2014); coherence and continuity is missing in most research studies as well as a clear framework of reference. They suggested that a series of studies that one follows a previous one are necessary in order to validate the addressed systems with regards to their effectiveness (i.e. scope of Dawson et al. review) and safety (scope of Horrey et al. review). A summary of the literature review is presented in Table 6. Each publication is categorized with a key with regards to its relevance to the project and relevant UCs (Figure 6). A group of five experts discussed and categorized each publication based on this categorization. The same categorization scheme was applied for all publications reviewed in this Deliverable.
Figure 6: Key categorisation for literature review

ADAS&ME (688900) D1.1 – SoA & Benchmarking
March 2017 Page 28 of 238 CERTH/HIT
Table 6: Summary of literature review-Sleepiness affective cluster
Publication Objective Measured Results Relevance to ADAS&ME Contribution to UCs Key
Jackson et al. (2016)
The study aims at the comparison of two
drowsiness monitors (Copilot and Optalert)
PERCLOS KSS JDS
Since the optalert systems outperform
PERCLOS, it may be possible to boost the
performance of remote camera systems by
using the same sleepiness metric
(JDS) as optalert does.
Composite measures, consisting of several (eye)
parameters, should be used in ADAS&ME. PERCLOS alone
does not seem to be a good choice.
Consideration for the compilation of indicators to be used in order to measure
sleepiness. Related mostly to UCs A C, D, G.
Selvakumar et al. (2016)
A new partial least squares based algorithm
for classifying open/closed eyes is
presented
PERCLOS Eye detector has a true positive rate of 96%, out of these; between 90-100% accuracy is
achieved. Worst performance in
darkness with glasses due to reflections
(about 90%).
A closed-eyes detector has been developed. It is not really revealed how well it operates
in realistic conditions.
The algorithm is based on PERCLOS which may not be
an ideal measure of sleepiness. If it really is a
robust closed-eyes detector then it can at least be used as
a late-stage sleepiness or actual sleep detector. Related
mostly to UCs A C, D, G.
Schömig et al. (2015)
Use of secondary tasks can prevent drowsiness
in highly automated vehicles
Mean Drowsiness Index in test phases and transitions
Interesting and motivating tasks can prevent increase of
drowsiness.
Interesting for take-over HMI strategies and measurements
for both drowsiness but potential also for rest
identification.
Persuasive HMI implementation might
increase alertness whilst resting in automated function mode. Related mostly to UCs
A C, D, G.
Åkerstedt et al. (2014)
Review article comparing KSS ratings with physiological and
behavioural measures in
KSS Lane
departures, slow eye
Subjective ratings of sleepiness are put
forward as a sensitive and valid indicator of
Subjective ratings of sleepiness are put forward as a sensitive and valid indicator of
sleepiness, which is easy to use and just as valid as other
KSS should be used as a reference measure of
sleepiness in the ADAS&ME evaluations.

ADAS&ME (688900) D1.1 – SoA and Benchmarking
March 2017 Page 29 of 238 CERTH/HIT
Publication Objective Measured Results Relevance to ADAS&ME Contribution to UCs Key
different settings, including car driving
movements EEG alpha
power Subjective
ratings on eye symptoms (heavy eye lids, gravel-
eyed, difficulties
keeping eyes open)
sleepiness, which is easy to use and just as
valid as other sleepiness measures.
sleepiness measures. Related mostly to UCs A C, D, G.
Naeubauer et al. (2014)
Use of games and conversation to energize (when
fatigued) driver during automated driving
Reaction time SDLP
Dundee Stress State
Questionnaire (DSSQ)
The study showed that usage of secondary media devices may
improve vehicle control and reduce
driver fatigue
HMI design that support secondary task in low-
workload driving can reduce driver fatigue and increase task
engagement. Though media usage is not associated with
faster response time or lasting driver alertness.
Persuasive HMI implementation might
increase alertness whilst resting in automated function mode. Related mostly to UCs
A C, D, G.
Halvig et al. (2014)
Investigate unintentional lane
departures with various measures
KSS blink duration
KDS Lane
departures
KSS is the best indicator of lane departures. Blink
duration can also be used when customized to an individual. KDS (EEG+EOG-based) is
not successful in predicting lane
departures
Measures of sleepiness should be individualized.
KSS remains a strong indicator meaning it can be
used with any type of vehicle. HMI strategies could
consider its usefulness incorporated to driver/rider’s
regime. Related mostly to UCs A C, D, G.
Jung et al. (2014)
Measure sleepiness through steering wheel
ECG (HRV) along with
Only descriptive, not conclusive.
Similar to the steering wheels provided by Autoliv. Other
Textile sensors need validation. Related mostly to

ADAS&ME (688900) D1.1 – SoA and Benchmarking
March 2017 Page 30 of 238 CERTH/HIT
Publication Objective Measured Results Relevance to ADAS&ME Contribution to UCs Key
textile sensor. subjective measures
studies, using medical ECG equipment, have had trouble
providing reproducible results.
UCs A C, D, G.
McDonald et al. (2014)
Compare algorithms that best predict
driver’s involuntary lane departures because
of drowsiness in a simulator study
PERCLOS Subjective sleepiness
Steering wheel angle
measures ORD scale
Performance is comparable, but
random forest is the best in terms of AUC.
Accuracy of the algorithm was 79%
(PERCLOS 55%) and positive predictive
value was 80% (PERCLOS 88%)
The steering wheel angle alone, without taking road
geometry into account, provides a decent estimate of driver sleepiness. However,
the results also indicate that a lack of steering is the key
feature used to predict sleepiness. This appears to be
a poor indicator on long monotonous motorways
(where little steering is needed and where sleepiness is a large
problem).
Vehicle measures should not be ruled out for drowsiness detection, but despite what
the authors claim, it is probably wise to take road
geometry into account. Related mostly to UCs A C,
D, G.
Jin et al. (2013)
Classify alert vs. sleep restricted conditions
with SVM
PERCLOS Gaze direction
Blink rate Fixation time features for
SVM
Individual models were derived with 85%
accuracy.
The lesson to be learned from this paper is that we can gain a lot by individualized models. Performance drops when a
general (group-level) model is applied to an individual driver.
Indicators /features to be used for individuals models
of sleepiness. Related mostly to UCs A C, D, G.
Marina et al. (2013)
Forearm muscle fatigue patterns and relating maximal voluntary
contraction with EMG among motorcycle
riders.
EMG of flexor digit rum
superficialis (FS) and carpi radialis (CR)
were monitored
Forearm discomfort might affect inattention.
To monitor rider’s inattention, relevant and important to
clearly distinguish inattention due to distraction (external
cause) and inattention due to fatigue (internal cause).
Measure of fatigue and inattention directly affecting riders could be useful for E
and F. As there are other already established
techniques for monitoring these two states in drivers, then no need to apply to
drivers. It could be interested

ADAS&ME (688900) D1.1 – SoA and Benchmarking
March 2017 Page 31 of 238 CERTH/HIT
Publication Objective Measured Results Relevance to ADAS&ME Contribution to UCs Key
though to investigate if there is any relevant ground truth with regards to state of rest.
Craig et al. (2012)
Investigate regional brain wave activity
changes associated with fatigue
EEG Changes in EEG can be used to detect
severe fatigue, but the actual difference is small between alert
and fatigued
Even with EEG it is difficult to design a sleepiness detection
system.
The paper says nothing about the transition phase from
alert to fatigue but the analysis methods could be useful –for the two states.
Related mostly to UCs A C, D, G.
Dong et al. (2011)
Review SoA technologies related to
both fatigue and inattention
Subjective Biological Physical
Performance Hybrid
Hybrid measures give more reliable
Results
Monitoring systems Variation in data sources
Fatigue is better measured with hybrid measures.
Related mostly to UCs A C, D, G.
Senaratne et al. (2011)
Comparison of classification
approaches versus optical flow to estimate eye state (open/closed
PERCLOS Classification: Eye pixels or wavelet coefficients are
classified as open/closed using
MoCC, kNN, SVM, NBC.
The classification approach is more accurate but requires
large amounts of training data. If such data are unavailable, the optical flow approach is
preferable.
The algorithm is based on PERCLOS which may not be
an ideal measure of sleepiness. If it really is a
robust closed-eyes detector then it can at least be used as
a late-stage sleepiness or actual sleep detector. Related
mostly to UCs A C, D, G.
Golz et al. (2010)
Investigate how electrophysiological
signals can be used to validate video-based fatigue monitoring
systems
PERCLOS, KSS, SDLP, EEG, EOG
PERCLOS in itself is practically not very useful for fatigue
monitoring
The authors recommend complementing PERCLOS
with other eye/face measures that can also be extracted from
the camera, such as pupil diameter and eye movements. Off-the-shelf products are not
Selection of combination of data for ground truths of
fatigue. Related mostly to UCs A C, D, and G.

ADAS&ME (688900) D1.1 – SoA and Benchmarking
March 2017 Page 32 of 238 CERTH/HIT
Publication Objective Measured Results Relevance to ADAS&ME Contribution to UCs Key
good enough for sleepiness detection.
Liu et al. (2009)
This is a review article aimed to assess whether it is possible to predict driver sleepiness using
vehicle measures.
KSS EEG SDLP SWM
Composite vehicle measure has to be
explored further. The time window used for deriving the sleepiness
estimate was high.
It is very beneficial to adapt driver monitoring systems to
individual drivers.
Simple vehicle functions will not do for any type of
vehicle; ground truth should be based on composites.
Important for all sleepiness related UCs, i.e. A, C, D, G. (same as above publication)
May & Baldwin (2009)
Identifying causal factors of fatigue
Theoretical paper
Several systems available to detect and
counter fatigue.
PERCLOS and lane departure/collision avoidance systems are useful to counter multiple driver impairments
such as task related fatigue and inattention. Automation at
levels 0-3 may counter active task related fatigue.
Head-nodding and deadman switches are only able to detect sleepy drivers after sleep has set in. Automation at levels 0-
3 may cause passive task related fatigue.
An effective countermeasure technology has to take the
cause and type of fatigue into account.
Related mostly to UCs A C, D, G.

ADAS&ME (688900) D1.1 – SoA & Benchmarking
March 2017 Page 33 of 238 CERTH/HIT
3.2 Stress
Stress in drivers can be detected by measuring bio-signals with the Dynamic Bayesian Network method (Rigas et al., 2008). The implemented framework (based on probabilistic reasoning) showed strong correlation between levels of stress in drivers and the model’s outcome. Heart Rate Variability (HRV), easily deriving from the variation in R-R interval of ECG, is used extensively in stress research as a real-time detection of electrocardiogram (ECG), opening the way to new signal processing features and techniques, in order to extract meaningful physiological signals (Jeong et al., 2007), as well as being sensitive in cognitive workload (Kumar et al., 2007). Another method, named Page’s technique (Singh et al., 2012) is used to categorise data in two separate levels of stress based on a self-organized map. Another method proposed by Deng and colleagues (2012), is based on feature selection, by using the following classification algorithms: a) Linear Discriminant Function (LDF), b) Support Vector Machine (SVM), c) Naïve Bayes, d) K Nearest Neighbour (KNN), and e) induction tree C4.5. Continuous collection in real driving environment of a combination of physiological signals (ECG, EMG), including skin conductance and respiration, was used, in order to measure stress levels, showing that they constitute adequate and appropriate stress metrics for drivers (Healy & Picard, 2005).
Figure 7: Galvanic Skin Response (GSR) normalised responses as a function of time (sec)
As in the previous section, the following table (Table 7) presents an overview of the main findings and a final verdict (key) about the utility of publication to the specific UCs where this affective state will be measured and taken into consideration.
3.3 Range anxiety
This section refers to anxiety produced to electric vehicle drivers with regards to finding a charging station. It is anticipated that this state might not exist in a few years, due to increasing construction of charging infrastructure that are appearing already throughout Europe. This state is relevant only to electric vehicles and relevant literature review results are presented in Table 7 and in Annex 1.2.

ADAS&ME (688900) D1.1 – SoA & Benchmarking
March 2017 Page 34 of 238 CERTH/HIT
Table 7: Summary of literature review- Stress affective cluster
Publication Objective Measured Results Relevance to
ADAS&ME
Contribution to UCs Key
Giannakakis et al.
(2017) To develop an
automated identification of a set of facial parameters
(semi and non-voluntary)
Facial parameters in different conditions (i.e. social exposure,
emotion recall, stressful
images/mental task and stressful videos)
The results in terms of classification accuracy varied
between 80-90 % taking into account the most effective
classifier.
This systematic review provides
evidence that adverse
psychosocial work conditions are
negatively associated with Autonomous
Nervous System (ANS) function as indexed by HRV.
The use of different classification across various contents but not contexts. Real driving requires
increased sensitivity and accuracy and no evidence exists; only
potential for transferability.
Relevant to UCs C, D, G
Rodrigues et al. (2015)
A mobile sensing approach was
designed to detect georeferenced stress
responses and facilitate memory
recall of the stressful situations
ECG sensors (Vital jacket + Physionet), GPS and button for self-reporting stress
event and were driving every day a
daily route
The findings suggest that the system can be a promising tool to support applied
occupational health interventions for
public bus drivers and guide
authorities’ interventions to improve these
aspects in “future” cities.
The system show promising results
combining HRV and GPS information with stress button.
Good for bus drivers understanding.
Highlighting the most stressful contributors. Relevant to UCs C,
D, G
Wickens et al. (2015)
This study replicated the findings of the in
Time urgency, lack of perceived control, and
Driving style and loci of control are of
Driving style and loci of control are of
The main outcomes (e.g. lack of

ADAS&ME (688900) D1.1 – SoA and Benchmarking
March 2017 Page 35 of 238 CERTH/HIT
Publication Objective Measured Results Relevance to
ADAS&ME
Contribution to UCs Key
situ methodology (i.e. field study/
conducted on site) using a between-subjects research
design in high and low congestion
conditions
trait susceptibility key importance of how stressed
someone can be. Congestion can be a
factor.
key importance. perceived control, trait susceptibility) can be used to build
up the current driving style as part of the driver’s behaviour that can directly or indirectly affect the affective state the
driver experiences. Relevant to UCs C,
D, G Rigas et al. (2011) A methodology for
detecting drivers’ stress and fatigue
and predicting driving performance
is presented
Physiological signals (ECG, EDA, and
respiration) Video recordings
(face) Environmental
information
Results based only one driver; reliability
is not sufficient. Association of
fatigue states with driving performance
Classification of states based on
extracted features is extremely relevant to the FER that the project has uptake.
The approach is validated and thus
within the project we may replicate or
replicate parts of it. Relevant to UCs C,
D, G
Benoit et al. (2009) This paper presents a driver simulator
study and taking into account the
information about the user’s state of
mind (level of attention, fatigue state, stress state)
Video data and biological signals
Not clear, not described.
The simulator-based approach is
interesting and in particular the
combination of video and
physiological (especially which
data types have been chosen) in relation to feedback output.
Difficult to define the relationship with this project as processes
and outcomes are not clearly discussed.
However, the choice for measuring stress
and its relation to multimodal attention is interesting not only
for identifying the driving impairment per se because of stress but also the

ADAS&ME (688900) D1.1 – SoA and Benchmarking
March 2017 Page 36 of 238 CERTH/HIT
Publication Objective Measured Results Relevance to
ADAS&ME
Contribution to UCs Key
effect it can have in designing the
respective HMIs within the project
(i.e. multimodality in information/ warning
and stress). Relevant to UCs C, D, G. It would be
highly recommended because the approach
is interesting but there no results supporting the efficacy of this
approach. Range Anxiety
Franke et al. (2016) Measure range anxiety as part of everyday range
anxiety
Subjective measures in stress-related
events
Less frequent encounter with critical range
situations, higher practical experience,
subjective range competence,
tolerance of low range, and
experienced trustworthiness of
the range estimation system were related
to lower ERS.
Moreover, range stress was found to be related to range
satisfaction and BEV acceptance.
Address variables related to lower range
stress in UC B.
Günther et al. (2016) Which eco-driving strategies users know
Driving test The results imply that eco-driving
The strategies are more important for
Not directly applicable but can

ADAS&ME (688900) D1.1 – SoA and Benchmarking
March 2017 Page 37 of 238 CERTH/HIT
Publication Objective Measured Results Relevance to
ADAS&ME
Contribution to UCs Key
before and after driving a BEV for 3
months
strategies for ICEVs have to be adapted
for BEV eco-driving and that drivers gain
a deeper understanding of
factors that influence energy consumption by experiencing the BEV for a longer
period of time.
Training EV drivers rather than
measuring range anxiety.
Help in selecting the indicators that are more resilient to
change. Relevant to UC B.
Franke et al. (2012) Investigate how range affects drivers of electric vehicles
Stress-buffering personality traits
Coping skills
Scientific conceptualization of
range experience.
Providing drivers with a reliable
usable range may be more important than enhancing maximal range in an electric mobility system.
Measures are interesting to take
into consideration for UC B
Khan et al. (2012) Role of HMI in range anxiety in EV
Questionnaires Importance of adequate HMI
design is emphasized.
However accuracy is a key factor to gain
trust in range information. EV
drivers need dynamic information
on factors that influence available
range.
HMI design should enhance trust.
UC B.

ADAS&ME (688900) D1.1 – SoA & Benchmarking
March 2017 Page 38 of 238 CERTH/HIT
3.4 Emotions
This chapter focuses on face recognition methods and processes, which are new and innovative techniques to capture and recognise emotions. It is a very innovative area of research with increased
potential in automation and this is the reason why an in-depth review was conducted compared to
other more traditional research areas. Automatic Facial Expression Recognition (FER) is the research area of detecting the emotional state of a subject by analysing his/her facial features. Since some years, recognition of facial characteristics such as eye blinking and eyelid movement, face orientation, and gaze (pupil) movement, has been applied in the field of automotive safety, in order to detect fatigue (Ji et al., 2004), (Ji and Yang, 2002), (Bergasa et al., 2006). Very recently, researchers have started to explore FER applications. In vehicle simulators FER was used in laboratory condition in (Kolli et al., 2011), (Vural et al., 2007) and (Jabon et al., 2011). FER was used in the Toyota fv2 concept vehicle, without any further published information. The only available publication for facial recognition in real driving conditions is made from (Gao et al., 2014), in which FER was used to detect stress by detecting anger and disgust. In the conducted experiments, a near infrared camera was employed in order to compensate lighting condition while a pose normalization step was used to overcome different head poses. The correct detection of stress in the vehicle was as high as 85%, however no information is given on how different were the poses from the normal pose and for the accuracy in case of facial occlusion (e.g., from glasses or hair). In (Li et al., 2013) a low resolution RGB – D near infrared camera was used for a robust face recognition algorithm, overcoming problems related to capturing images in an uncontrolled environment, as varying poses (up to 90° off the normal pose), facial expressions, illumination and disguise. Automatic Facial Expression Recognition (FER) is the research area of detecting the emotional state of a subject by analysing his/her facial features. Since some years recognition of facial characteristics as eye blinking and eyelid movement, face orientation, and gaze (pupil) movement, has been applied in the field of automotive safety, in order to detect fatigue (Ji et al., 2004), (Ji and Yang, 2002), (Bergasa et al., 2006). However only until recently researchers have started to explore FER applications. In vehicle simulators FER was used in laboratory condition in (Kolli et al., 2011), (Vural et al., 2007) and (Jabon et al., 2011). FER was used in the Toyota fv2 concept vehicle, however without any other published information. The only available publication for facial recognition in real driving conditions is from (Gao et al., 2014), in which FER was used to detect stress by detecting anger and disgust, as initially hypothesised in the study, in experiments performed with a near infrared camera, in order to compensate lighting condition, installed on the dashboard of a vehicle while a pose normalization step was used to overcome different head poses. The correct detection of stress in the vehicle was as high as 85%, however no information is given on how different were the poses from the normal pose and for the accuracy in case of facial occlusion e.g. from glasses or hair. In (Li et al., 2013) a low resolution RGB and Depth near infrared camera is used for a robust face recognition algorithm, overcoming problems related to capturing images in an uncontrolled environment, as varying poses (up to 90° off the normal pose), facial expressions, illumination and disguise.
3.4.1 Face detection and facial expression recognition in images
The concept of Affective Computing has entered our lives the la te 1990’s, and it has constituted an important research and application area, as a bridge between computer science, signal processing, wearable device technology, psychology and neuroscience, among many others. It is defined by Rosalind Picard as computing that relates to, arises from, or influences emotions; in her famous work, that is considered to have introduced the term (Picard, 1997). Affective computing can be performed using three main modalities: audio, physiological or visual signals that are also commonly used in combination to each other, in a multimodal fashion. Audio cues that are used in affective computing can be verbal (the actual words) as well as non-verbal, as in features of the voice, such as the intonation, or the speed and duration of the speech and its segments. Some physiological signals related to emotions are the electroencephalography (EEG), electrocardiography (ECG), Galvanic Skin Response (GSR), electrodermal activity (EDA), heart rate (HR), breathing rate or even brain imaging techniques, such as the functional Magnetic Resonance Imaging (fMRI).

ADAS&ME (688900) D1.1 – SoA & Benchmarking
March 2017 Page 39 of 238 CERTH/HIT
Visual cues, on the other hand, may involve the pose, displacement and gestures of the various body parts (or the whole body) and sometimes the identity of person involved. Facial cues are arguably the richest and most effective sources of information in terms of affective computing. In terms of real-world applications, facial information is more continuously accessible compared to audio cues, for instance, which are absent when the person is not speaking or producing a sound. It is non-invasive, as opposed to physiological signals, which require special equipment attached to the body and whose performance is easily affected by noise. Finally, it is less subject-dependent and contains more affect related material compared to gestures of other body parts. Automatic Facial Expression Analysis (AFEA), therefore, is an essential branch or component, of affective computing. In this text we review the existing methods, tools, databases and applications related to AFEA systems. Note that, facial analysis systems (including face recognition) can be performed on 2-dimensional (2D) or 3-dimensional (3D) data; 2D being the grey-level or RGB images and 3D meaning additional depth information. Since industrially available hardware does not provide the 3D information yet, we mainly include the SoA in 2D face analysis systems. An AFEA system consists of three main parts:
• Face acquisition (detection and/or tracking), • Facial feature extraction, and • Classification according to the task.
All these components involve a training phase (to learn the parameters or to learn the class separation), for which a (great) number of data with ground-truth is needed. The ground-truth information is obtained by manual or semi-automatic methods. Thanks to the research effort by the facial analysis community, many databases have been published with annotations available for the basic emotions, two (or more) continuous emotion dimensions or Action Unit presence, which can be used for training, validation and testing new AFEA systems. In the rest of the text we review important examples of all these mentioned components, the existing databases and proposed applications. 3.4.2 Face and Facial Points Detection Methods
Face localization and detection methods can be sub-categorized in as holistic and local (or part-based) approaches. Holistic approaches aim to model the whole face as a single object and look for the complete face in an image. Local approaches, on the other hand, are able to localize parts or landmarks on the face and from there estimate the location of the face. They can, in turn, be said to be better handling partial or occluded views of faces. The term face detection refers to detecting the presence and location of all faces in an image, while localization refers to finding the location of a single one. Facial points refer to salient landmarks on the face that can be consistently identified across different faces. Facial points’ detection can be classified as shape, appearance and regression based methods. In this section we give a short review and explain three important facial point detection methods: Active Appearance Models (AAM), Constrained Local Model (CLM) and Supervised Descent Method (SDM). Earlier approaches to face detection used information, such as skin colour or motion. Modern techniques rely on learning methods and classifiers that utilize appearance-based descriptors of the face or its landmarks. The most commonly known and used face detection system is the one by Viola & Jones (2004). It had drawn a lot of attention when it was published, as it was the first real-time face-detection method and since then, it has been integrated in many facial analysis systems, including those on mobile platforms, and is still commonly employed as the initialization method for newer and more precise methods. It is based on learning a cascade of weak classifiers, using Adaboost Schapire & Singer (1999). The weak classifiers use Haar-like features, which can simply be explained as horizontal and vertical pixel differences at different scales. The face detector performs an exhaustive search in the image and outputs the square with the highest score to be the closest to a face. The downside of the Viola-Jones algorithm is that its training is tedious and requires thousands of face and non-face images, it usually outputs multiple detections for a single face, and, consequentially the output is not precise enough for further facial analysis methods (e.g., expression recognition or AU detection). In addition, the method is not very robust against occlusions or variations of head-pose, especially if relevant samples had not been included in the training.

ADAS&ME (688900) D1.1 – SoA & Benchmarking
March 2017 Page 40 of 238 CERTH/HIT
3.4.3 Active Appearance Models (AAM)
The AAM, proposed by Cootes et al. (2001), aims to represent or explain an object (the face in this case), in terms of a set of model parameters, which are obtained by constraining solutions to be valid instances of a model. Active appearance models are statistical models of deformable objects, which contain both the shape and texture variation among a set of training images of the object. It is well suited for applications in facial analysis, since it provides positions of the facial features, such as eyes, brows, nose, mouth, etc., as well as the strict boundaries of the face. They can be seen as an extension to the Active Shape Models (ASM), which proposed such a statistical modelling of the shape variation for the first time (Cootes et al., 1995). The images in the training set are first of aligned for the shape and then texture normalized to reduce the effect of the change in lighting conditions. Then, the model is built by a Principal Component Analysis (PCA) on each pixel value of the images of the training set. This results in an AAM made of the mean object (mean face image in this case) and the admissible variations around this mean face, modelled by a principal modes of variations (eigenvectors of the covariance matrix of the training images – called eigenfaces in face detection) of combined shape and texture data. A given face is thus modelled as the mean face plus some variations around it, parameterized by a set of parameters of the AAM. The idea of the AAM search algorithm is then to synthesize a new example by the adjustment of these model parameters, and it is generally treated as a minimization problem of the difference between the synthesized image and the original unseen image, so that the two are as close as possible. The main limitation of the original AAM is that the fitting is constrained by the variation among the training set. Therefore, it is more accurate in person-specific applications (Gross et al., 2005). The original AAM was proposed as a 2D model trained for faces with near-frontal poses. This, of course is not sufficient for real life applications. One of the solutions is to include many pose configurations in training, but then the accuracy of landmark detection decreases for all. In addition, some pose variations result in self-occlusion of certain landmarks and AAM is not flexible enough to handle this issue. To overcome this problem many methods have been proposed, namely 3D (Ramnath et al. (2008), the multi-view nonlinear active shape model or the use of multiple AAM and adequate model switching according to the pose (Yüce et al. (2011)). Still, this detection remains global, and hardly handles local occlusion. To address this, another very successful family of models has been proposed, the Constrained Local Models. 3.4.4 Constrained Local Models (CLM)
CLM is the name given to the ensemble of methods that aim at localizing a set of points on a given image, constrained by an overall statistical shape. The first CLM was proposed by Cristinacce & Cootes (2006), where again a Point Distribution Model (PDM) is generated like in the AAM. This time, the local appearance patches around the shape points are attempted to match in the image using feature templates, instead of the actual pixel values of the whole image (e.g., AAM), which naturally leads to better generalisation. The original method can be summarized as replacing the texture vector of the AAM with a vector that is the concatenation of patches extracted around each feature and normalised to have zero mean and unit variance. Each of these patches output a response image that defines a cost term. The total cost is optimized by manipulating the shape parameters, explaining the constraint coming from the overall shape. These response images can also be created using other appearance descriptors, such as Local Binary Patterns or Histogram of Oriented Gradients (HoG). A notable adoption of the technique is by Saragih et al. (Saragih et al., 2011), where they have proposed a non-parametric distribution to approximate the response image and the shape fitting is reduced to a regularized mean-shift. This method is very efficient, is robust against partial occlusions and a larger variety of head-poses, and is therefore frequently employed in facial analysis applications. Open source code is available at: https://github.com/kylemcdonald/FaceTracker 3.4.5 Regression based methods – Supervised Descent Method (SDM)
Another efficient approach to facial point detection and tracking is regression-based methods. Regression-based methods learn a mapping from local image patches to a probability over the parameter space, the 2D position of the facial points on the next frame, in this case. Due to their efficient computation and robustness against variability of head-pose and image resolution they have been effectively used recently for facial point detection. In a relatively early attempt, Cristinacce &

ADAS&ME (688900) D1.1 – SoA & Benchmarking
March 2017 Page 41 of 238 CERTH/HIT
Cootes (2007) have extended the ASM with a GentleBoost regression scheme. In Valstar et al. (2010) SVM regression is combined with conditional Markov Random Fields (MRF). In Dantone et al. (2012) the authors use Conditional Regression Forests that are conditional to the global face properties, such as the head-pose. Cao et al. (2014b) propose a two-level boosted regression with explicit shape correction, which was further extended by Richter et al. (2014), to allow for different feature channels and include head pose information to improve detection performance. Xiong & De la Torre (2013) proposed to use the Supervised Descent Method (SDM) for the minimization of non-linear least-squares problems and applied it successfully to the problem of facial point tracking. The real-time performance and the publicly available implementation make it the most commonly used SoA face and facial point tracking system (available at: http://www.humansensing.cs.cmu.edu/intraface). It is an extension of Newton’s gradient descent method, which aims at minimizing a function by sequential updates or cascaded regression. SDM carries out this function in a supervised manner, i.e., for a training set of known facial point locations and corresponding templates or appearance features (e.g., SIFT), SDM learns a series of parameter updates and generic descent directions and for an unseen image the extracted templates are projected onto the learned descent direction to obtain the displacement update of the facial features. Common to all regression-based methods, for tracking the points in a sequence it requires an initial estimate of the positions, which is typically chosen as the mean shape of the training set, scaled and translated using a face detector. For the rest of the frames, previous locations of the facial points are used to regress from. 3.4.6 Feature extraction
Once the face is located, its content (e.g., the facial expressions) need to be recognized by analysing features extracted from different locations on the face. Feature extraction is the process of obtaining representations from images, or sequences of images, that are ideally relevant to the discrimination task and that can be formulated in a fixed-size vector form, to be used in a classifier or regressor. For facial analysis systems the features used in the literature can be categorized in two: Geometric features and Appearance based features. Geometric features are the ones that are calculated through the locations of certain points (landmarks) on the image and do not include any pixel intensity information (except for being used to locate these landmarks). Appearance based features, on the other hand, relies on these pixel intensities either directly or via image transformations on a global level or extracted locally. Geometric and appearance based features can also be used in combination (in feature-level or classifier- level fusion) and have even shown better performance in certain cases compared to their individual usage. 3.4.7 Geometric Features
The geometric features of the face consist of the ones that involve the actual location of facial landmarks. This location information is then converted in a feature representation either via normalized direct coordinates of the image or as a function of the distance between multiple points. The geometric features can be calculated in a single frame or can be calculated over two or more frames as a difference or trajectory function. Features of this type that have been used in various works can be listed as follows:
• Locations of facial landmarks (e.g., eyebrows, mouth contours, etc.). • Distance between landmark-pairs (e.g., distance between two mouth corners or
uppermost and lowermost points of the eye contours). • Angle of the lines joining landmark-pairs. • Angle between edges of polygons joining 2+ landmarks. • Difference of these features in the current frame and a reference frame. • Trajectory of these features along a sequence frame, represented in a fixed size feature
vector, e.g., via coefficients of a polynomial fit. • Coefficients of a shape model fitted on the specific image.
Since the efficacy of geometric features is directly related to the precision of the facial landmark detection system, geometric features are not very suitable to detect subtle facial expressions. The feature vectors contain the accumulated noise introduced by the face tracker, for example when using the

ADAS&ME (688900) D1.1 – SoA & Benchmarking
March 2017 Page 42 of 238 CERTH/HIT
evolution of locations in two or more frames. When the landmark detector is accurate, however, geometric features are very effective in detecting Action Units (AU) (especially some AUs that are marked relatively more by movement of salient facial points) and even the temporal phases of AUs (e.g., Pantic & Patras (2006), Valstar & Pantic (2012)), particularly on data where the head-pose does not vary significantly over sequences. 3.4.8 Appearance Features
Appearance features are based on the texture information in an image that is the pixel intensities. These pixel intensities can be used as they are directly as features for facial action recognition. However, this requires an accurate registration of the faces, as well as intensity normalization for illumination and individual skin colour differences. Feature transformations are in general less influenced by these aforementioned factors and they are able to represent effectively additional in- formation on the face, such as edges, corners, frequency, etc. This information is more meaningful
and discriminative in terms of facial actions, therefore it is common to apply a transformation on a face image and form a feature vector through this transformation. Chew et al. (2012) have investigated the benefits of using feature transformations compared to using raw pixel information for the task of AU detection and they have concluded that feature transformations are useful in cases of alignment errors and illumination variations, but not so much when these conditions are perfect. The most commonly used appearance descriptors in the literature are the HoG (Dalal & Triggs, 2005), Discrete Cosine Transform (DCT) (Ahmed et al., 1974), LBP and its variants in 3D and the frequency domain, filter banks (Gabor wavelets in particular) and SIFT features. The construction of the HoG features are similar to that of the SIFT and an example of usage in the facial action context can be found in Chew et al. (2012). 3.4.9 Feature selection and classification
Once the features are extracted, they can be used as inputs to a classifier, trained to recognize the facial content (e.g., expressions). However, most of the time, the features may be too many and potentially contain redundant information. Keeping them all may dramatically decrease the classifier performances. Therefore feature selection if needed. This can for instance be performed in an unsupervised manner by PCA or in a supervised manner by linear discriminate analysis (LDA). Some classification methods, called boosting methods, can be used both for feature selection and classification. Boosting is the term that is used to define the ensemble of methods that aim at combining multiple classifiers to produce a committee of decisions, that is used as the final classifier and whose performance is ideally better than any of the "base" classifiers. These base classifiers are generally chosen from weak learners, which are very simple classifiers with only better than random performance, and still can create very powerful classifiers when combined in a boosting scheme. The most well-known and commonly used boosting algorithm is AdaBoost or adaptive boosting that was developed by Freund et al. (1996). It is the method that is also used in the Viola & Jones (2004) face detection method. The main idea is to give emphasis by weighting the instances that are misclassified at each step of the classifier, i.e., adapt the classifier to better handle problematic instances. Variations of this idea are also found in the well-known GentleBoost algorithm, proposed by Friedman et al. (2000). Finally, like in many other classification tasks, a very popular classifier is the Support Vector Machine (SVM). The Support Vector Machine (SVM) is a maximum margin binary classifier, which tries to separate two classes by a margin whose width is maximized so as to decrease the generalization error over all training instances. SVM is a very successful machine learning tool that has been effectively used for a variety of classification and regression problems (Bishop, 2006). As an example of a complete system to automatically recognize Action Units (AU), the individual facial shape features used in the canonical facial action coding system (FACS), our group at EPFL has develop one of the most effective AU detectors currently available. Once the full set of features (shape + texture using LBP) is obtained, we perform feature selection using the GentleBoost algorithm (Friedman et al. (2000)) to choose the most relevant features for each of the AUs. We therefore perform this process 15 times independently, for the action units 1, 2, 4, 5, 6, 7, 9, 12, 15, 17, 20, 23, 24, 25 and 27. Feature selection is a crucial step in the AU detection process, since it discards the irrelevant and redundant features which constitute a huge portion of the total number of features extracted, due to the large number of LBP windows and inter-point relations we use for building our

ADAS&ME (688900)
March 2017 CERTH/HIT
features set. For each action unitand then the optimal number of 50, 100, 150 and 200 features forselected features, we train 15 Support binary, the classes being if the specificGaussian RBF, and optimize thetraining set. The detailed analysis of the performances of such a metho 3.4.10 Existing databases for facial expression recognition
Facial expression databases aretesting. Publicly available imageobjective comparison of systemtask mainly due to providing thewith annotations for the six (or sdominance, etc.), AU existenceinterest, engagement, distraction. Indatabases mostly consisted of posedto perform a certain facial actionannotation (since the sequence-lthe data obtained is not natural andThe later trend, therefore, is to obtainelicitation or by having human-ratersof course, bring along the problemmost objective and well-defined raters that annotate the same dataTable 1 below gives a list of some(ground-truth) provided, the existence
3.4.10.1 Applications of facial expression recognition
General application
In this section we provide a shortautomatic detection of AUs or fdoes not include applications offacial expression analysis is firstly
Figure 8: List and ComparisonBasic Exp.: annotated for the 6 (or 7) valence and arousal dimensions (mightimages, 3D: involves 3D data, Spontaneous:portion of the data, or partially fulfilling
D1.1
March 2017 Page 43 of 238
unit 200 features are extracted in total as result features is chosen by performing leave-one-subjectfor each AU separately. For the detection of action
Support Vector Machine (SVM), once again for eachspecific AU is present in the image sequence or not.the SVM classifier parameters using a 5-fold cross
set. The detailed analysis of the performances of such a method can be found in (Yüce, (2015)
Existing databases for facial expression recognition
are crucial tools for facial analysis research, bothimage and video databases help advancements in the
system performances. Creating a database of facial expressionsthe ground-truth. Databases currently available to the(or seven) basic expressions, the emotional dimension
xistence or intensity, or a specific condition or state,distraction. In the earlier years of automatic face analysis
posed expressions, i.e., the participants were givenaction combination. Although this provides convenience
level ground-truth labels come automatically duringand quite different from what one observes in realobtain expressions in a spontaneous manner that
raters annotate the data through visual observation.problem of subjectivity, even in the case of FACS annotations,
system to date. For this purpose some databasesdata and a measure of reliability is provided along some commonly used publicly available databases, thexistence of spontaneous expressions and 3D data.
expression recognition
short review of some of the application areas in thefacial expressions as a source of information. Note
of face recognition (e.g., in forensics or face verification). Automaticfirstly an essential component of HCI (which can also
Comparison of Publicly Available Databases of Facial Expressions basic expressions, AUs: annotated for the AUs, Val. - Arou.:
(might also be annotated for other dimensions), Dynamic: invSpontaneous: involves spontaneous (non-posed) expressions,
fulfilling the condition.
D1.1 – SoA & Benchmarking
result of the GentleBoost, subject-out tests with 30, action units using these each AU. The SVM are not. As kernels we use cross validation on the
d can be found in (Yüce, (2015).
both for training and the field and allow for
xpressions is a tedious the community come
dimension (valence, arousal, state, for instance pain,
analysis research the en explicit instructions
enience in terms of data during data acquisition), real-world applications.
that is either by emotion ation. Human annotations, annotations, which is the
databases use multiple human with the annotations.
the type of annotations
the literature that use Note that this review
erification). Automatic can also be called Human-
Expressions and AUs.Arou.: annotated for the
volves sequences ofxpressions, Partially: only in a

ADAS&ME (688900) D1.1 – SoA & Benchmarking
March 2017 Page 44 of 238 CERTH/HIT
Machine Interfaces (HMI) in this case). Systems that are able to understand affective and cognitive states of users use this information to mediate and adapt their behaviour for a more user-friendly and efficient system. HCI applications range from gaming to medical and learning assistance. One of the most commonly encountered use of automatic analysis of facial expressions is in the field of marketing. Analysing people’s facial reactions when they watch advertisements or browse a product allow measuring their liking and intent to purchase the product. By using this information, producers, retailers or online shopping sites can build marketing strategies, reorganize product placements and infer about their target population. This idea does not only apply to direct purchasing behaviour, but also to assessment of liking multimedia content in general. For example, as a very interesting recent application, a comedy club in Barcelona, Spain, has placed cameras in front of the audiences’ faces, detects every time you smile, and charges you according to your number of smiles / laughs during the performance. Another field of application is in the health-care area. Certain psychopathologies have been shown to have as symptoms flat or abnormal affect. Abnormal affect is defined as not feeling or expressing a feeling in an expected way, for example getting extremely raged as response to an amusing stimulus with no apparent side reasons. Flat affect, on the other hand, is the deficiency to lack to feel or express a feeling when you are expected to. Flat and abnormal affect is encountered in patients with schizophrenia, depressive disorder, manic-depressive disorder and certain types of autism spectrum disorder (e.g., Asperger’s syndrome). These disorders are also characterized by not being able to recognize others facial expressions (Sander & Scherer (2009), Kring & Stuart (2005)). Automatic facial expression recognition tools can be used for the diagnosis and treatment of those psychopathologies and evaluation of psychiatric intervention. Another application can be found in the healthcare area, where systems measure patient’s level of pain, for instance, after surgeries or during regular monitoring of the elderly, and help the doctor and the user to take appropriate measures (Sikka et al., (2015). A similar approach is also used to model, understand and provide feed-back to learning and teaching systems, the main idea being that understanding and being able to interpret the student’s feelings and cognitive states (e.g. distracted, confused) one can adapt their behaviour for a more efficient interaction. Another application field, which is on the rise, is driver and pilot monitoring systems via facial analysis. These systems detect particular states of the drivers (e.g. fatigue, distraction, rage) that can be hazardous for driving and allow for taking appropriate measures. This is presented in detail in the next section.
Visual Driver Monitoring
This section presents a brief review of existing work on visual driver monitoring. An extensive review is given in Dong et al., (2011) and Kang (2013). The interested reader is referred to these publications for more approaches and applications not listed here. Over the years most of the research on visual driver monitoring systems has focused on fatigue detection, which is a critical factor for human error in driving. Vural et al., (2007) used many AUs, including head-pose, and analysed their relation to fatigue during a three-hour simulator driving experiment after midnight. As expected, the most relevant features were related to eye-blink (AU45) and also outer brow raise (AU2), as the subjects tried to remain awake. In Rongben et al. (2004) an automatic mouth movement analysis is performed to detect fatigue related actions, and also speaking, while in Gu & Ji (2004) AUs are used within a Dynamic Bayesian Network (DBN) to detect driver vigilance. The head pose dynamics have also been successfully exploited in a real-time driver awareness detection system (Murphy-Chutorian & Trivedi, 2010). Another commonly used visual cue for fatigue detection is the Percent Eye Closure Measure (PERCLOS), as used for instance in Bergasa et al. (2006). As for automatic detection of distraction, a non-vision based system is presented in Tango et al. (2010) where the driving information, such as the speed, position of the pedal and steering wheel have been used to detect visual distraction tested with various machine learning methods. Wöllmer et al. (2011) also used the driving information and non-vision based head tracking data to detect cases of visual distraction while performing various tasks. In Liang et al. (2007) the authors used eye movements and driving performance data within a Bayesian Network framework to predict ∼ 80% of distraction cases while interacting with an in-vehicle information system (IVIS). A similar study is presented in Jimenez et al. (2012) where the gaze angle and fixation data was used once again to recognize

ADAS&ME (688900) D1.1 – SoA & Benchmarking
March 2017 Page 45 of 238 CERTH/HIT
distraction induced by the IVIS. In D’Orazio et al. (2007), the eye movements are analysed to predict visual inattention using Neural Networks. The gaze information was used along with head movements and lane position of the vehicle in Kutila et al. (2007) to detect induced visual and cognitive distraction using a stereo-vision system integrated in trucks and passenger cars. For cognitive distraction, the authors achieve 68% on the truck experiments and 86% for the passenger car experiments. However, the low number of drivers tested (3 for the passenger car, 12 for the truck) is insufficient to discuss the generalization capability of the system. In Jabon et al. (2010) several features related to the coordinates of 22 facial landmarks and driving data were used to predict accidents. In Ragab et al. (2014) the arm position, eye closure, eye gaze, facial expressions, and orientation provided by an FGB-D camera were used to detect visual and manual distraction on 6 participants. The approach by Li & Busso (2015) use AUs, gaze and head pose information to detect visual and cognitive distraction. With the experiments performed on 20 subjects, the F-score for detection cognitive distraction is 73.8% and for visual distraction 80.8% (Li & Busso, 2015). 3.4.10.2 Speech recognition
As smartphones and infotainment systems became part of our lives, the ability to use them with voice commands creates the potential of detecting emotions from the driver’s voice. Speech emotion recognition has been proven to result in successful recognition of the speaker’s emotion in laboratory conditions. In (Pierre-Yves, 2003) and (Nwe et al., 2003) above 80% successful emotions’ recognition is reported; however in both studies a quiet environment was required and a high quality or a mouthpiece microphone was used. Inside a vehicle speech emotion recognition was evaluated in (Kamaruddin and Wahab, 2010). Speech emotion recognition was performed with accuracy detection of 73% for sadness and 67% for anger, (Tawari and Trivedi, 2010), using noise cancelling technologies in gender specific and drive context information, they were able to recognize emotions with a higher accuracy. Toyota fv2 concept vehicle support speech emotion recognition, however no other published information is available. The following table presents relevant current research, where each publication is key categorised according to each relevance and usefulness to the UCs and the project (Table 8).

ADAS&ME (688900) D1.1 – SoA & Benchmarking
March 2017 Page 46 of 238 CERTH/HIT
Table 8: Summary of literature review-Emotions affective cluster
Publication Objective Measured Results Relevance to
ADAS&ME
Contribution to UCs Key
Koo et al. (2015) Explores the
interaction between the driver and semi-automated driving
actions
Tested different messages that
provided advance explanation of the
car’s imminent automated action
These results suggest that, to increase overall
safety, car makers need to attend not only to the design of
automated actions but also to the right way to explain these actions to the
drivers.
Reasons for an action are as important as the
action in order drivers to trust and continue to use
function, i.e. need to establish connection. i.e.,
affective design.
Mostly related to HMI design to incorporate affective strategies in order to increase trust, especially for handing over control. Relevant
UCs A, B, C, D.
Mesken et al. (2007) Investigate the frequency,
determinants and consequences of
anger, anxiety and happiness in traffic
Speed Heart rate
Environment through video Self-reports
Anxiety is the most frequent
state very much related to
emotional traits, goal congruent events resulting
to increased perceived risk and increased
heart rate.
The study does not consider assistive or support systems but guides us towards
theories and state-trait differences in emotions
that we might consider in defining the emotions
and selecting the appropriate indicators.
Anxiety is more often registered than other
emotions. Important to evaluate emotional traits. Relevant UCs A, B, C,
D. Especially for
professional driver a standardized emotional
traits questionnaire could be used.
Vaw et al. (2007) Evaluation of the emotional states of car-racing drivers
Facial electromyograms Electrocardiogram
Respiration Electrodermal
Classification worked using
SVMs and ANFIS with
adequate rates.
However, the clusters selected: high/ low
stress, disappointment and euphoria may be
very relevant for race car
But it is still to be decided if this clustering will work for everyday
drivers, professional drivers and leisure riders

ADAS&ME (688900) D1.1 – SoA & Benchmarking
March 2017 Page 47 of 238 CERTH/HIT
Publication Objective Measured Results Relevance to
ADAS&ME
Contribution to UCs Key
activity drivers. Relevant UCs A, B, C, D.
Jonsson, I., & Harris, H. (2005)
Investigate emotion recognition through
speech based systems with real users taking into
consideration both linguistic and paralinguistic
features.
Experiments are conducted in
simulated but still driving
environment.
Evaluation focussed on
driving performance, acceptance,
usefulness and use of the speech
system.
Testing set up is interesting and especially the categories of prompts can be used to categorize speech outputs and help
design the HMI for certain driving instances.
Use of similar prompts to induce emotions in
controlled conditions. Relevant UCs A, B, C, D
and HMI strategies (A5.1).

ADAS&ME (688900) D1.1 – SoA & Benchmarking
March 2017 Page 48 of 238 CERTH/HIT
3.5 Inattention/ distraction/ Workload
In a study conducted by Dingus (2004), it was found that 78% of the accident was linked to a driver’s inattention, during the last 3 seconds before the accident. Distraction is perceived as a sub-category of inattention with three different categories: a) visual, where outside visual stimuli attract the driver’s attention, e.g. looking at something outside/ inside the vehicle, b) auditory (e.g. listening to radio) and c) cognitive (thinking, talking on the phone, etc.). Visual distraction becomes critical when it lasts longer than 2 seconds (Simons-Morton et al., 2014). However, this is not a definite and cut-off decision; the driving task is complex and affected by many contextual, situational and other factors. Camera-based approaches are the most abundant used in order to detect and measure distraction. In particularly, eye gaze is a common measure that requires high precision cameras with stereoscopic vision. These camera systems need to be able to be used in driving contexts (e.g. Seeing Machine and smart eye and are already commercialised). A basic assumption governs visual distraction; glances longer than 2 seconds are accompanied by head turn, as otherwise is not comfortable. Therefore, head turning and orientation has been shown to be a reliable indicator of visual distraction. Kircher and Ahlstrom (2016) looked at the limitations of existing definitions of driver inattention and formulated MiRA, or "minimum required attention." MiRA considers whether or not the driver -- who is only one part of the larger traffic system -- is maintaining situation awareness in the driving context; in other words, visually attending to and acting on the minimum amount of information from the environment necessary for safe driving. It takes into consideration human factors such as drivers' ability to adjust pace and location, balance goals such as efficiency and perceived risk, and use spare capacity (available reaction time) to attend to targets (traffic signals, pedestrians, etc.) that don't pose a risk. Many of the 50 or so extant definitions of driver distraction suffer from hindsight bias; that is, they identify distraction after the fact. Kircher notes, "with MiRA, the idea is to define the distraction criteria beforehand. Those criteria are based on areas in the driving environment in which certain information has to be sampled [viewed] a minimum number of times for safe operation of the vehicle. Apart from camera-based approaches, task-demand based performance can be evaluated, and if found impaired, then it is assumed that the driver is no longer attentive to the primary driving task. However, the connection is not so direct, as impaired driving is not always evident. This is more difficult to measure when cognitive distraction is involved. Similarly, observing the driver whilst completing in-vehicle tasks (e.g. talking on the phone, interacting with in-vehicle technologies) with camera-based systems, may lead to inattention identification. Apart from camera-based approaches, task-demand based performance can be evaluated, and if found impaired, then it is assumed that the driver is no longer attentive to the primary driving task. However, the connection is not so direct, as impaired driving is not always evident. This is more difficult to measure when cognitive distraction is involved. Similarly, observing the driver whilst completing in-vehicle tasks (e.g. talking on the phone, interacting with in-vehicle technologies) with camera-based systems, may lead to inattention identification.

ADAS&ME (688900) D1.1 – SoA & Benchmarking
March 2017 Page 49 of 238 CERTH/HIT
Table 9: Summary of literature review- Inattention/ distraction affective cluster
Publication Objective Measured Results Relevance to
ADAS&ME
Contribution to
UCs
Key
van der Meulen et
al. (2016) Investigate the
implementation of a method to
monitor driver distraction based
on a stereo camera to estimate the face pose and
gaze of a driver in real time
Reaction times and gaze focalisation behaviour patterns measured on a sample of professional
drivers
Evaluated truck driver's distraction
under a set of various situations.
System allowing evaluating truck
driver’s distraction.
Relevant UCs C, D, G and indirectly A
and E.
Craye & Karray (2015)
Driver distraction detection and
recognition using RGB-D sensor
Eye behaviour (detecting gaze and blinking)
Arm position (is the right arm up, down, right of
forward) Head orientation
Facial expressions
Qualitative and quantitative results showed accurate
detection and recognition capacity (85% accuracy for
the type of distraction and 90%
for distraction detection).
The system based upon an FGB-D sensor, computer
vision and machine learning is suitable for context aware human-machine interaction.
Each module developed to detect
distraction is obtained
independently and could be used for
other types of inference, such as
fatigue and detection
Relevant UCs C, D, G. Indirectly relevant to E.
Gold et al. (2015) The study investigated
whether different tasks are
impeding the drivers'
T-react time Minimum/ maximum longitudinal/lateral
acceleration Minimum occurring time to collision
(TTC)
The study provides a good
understanding on how non-driving
tasks influence the driver behaviour
The cognitive demanding tasks are impeding the take-over in cognitive
demanding take-over situations and the
The study investigated on
method on how to use gaze behaviour as an indicator of driver readiness to

ADAS&ME (688900) D1.1 – SoA & Benchmarking
March 2017 Page 50 of 238 CERTH/HIT
Publication Objective Measured Results Relevance to
ADAS&ME
Contribution to
UCs
Key
capabilities of regarding control
intake over situations.
Visual motoric SURT tasks Cognitive n-Back
task
during take over. The secondary tasks are quiet interesting and the method of
evaluating the distraction is also very informative.
influence of cognitive tasks is less easy in well-practiced take
over conditions.
take over control during automated driving. The study also showed that how specific gaze
parameters are suitable to assess the adequacy of
driver monitoring strategy. This could be useful in ADAS
for investigating use case driver
monitoring (driver distraction).
Gonçalves, J., &
Bengler, K. (2015) The main
contribution of this paper is to
provide an overview on DSM from a HAD point
of view
Review paper Advantages of reviewed
monitoring systems: Eye metrics is
valuable due to the ability to obtain
relevant data associated with fatigue in a non-
intrusive way, and has broad
community acceptance.
Behaviour based metrics is
recognised as a promising source
Eye based metrics will remain an
important DSMS for fatigue detection. For distraction detection,
monitoring body posture and head
rotation is a possible alternative.
Image processing/cameras for detecting body postures (fatigue
detection) and eye tracking for
monitoring fatigue and distraction.
Behaviour based metrics is a promising
information source for detecting
drowsiness but should not be used alone, since these
activities are person

ADAS&ME (688900) D1.1 – SoA & Benchmarking
March 2017 Page 51 of 238 CERTH/HIT
Publication Objective Measured Results Relevance to
ADAS&ME
Contribution to
UCs
Key
for detecting drowsiness - drivers' change behaviour to counter the fatigue
progression.
dependent. Use generic algorithms for detecting driver
behaviour. Relevant to UCs A,
c, D, E, F, G Mok et al. (2015) The study
investigated driver monitoring capability from a highly distracted
state
Drivers’ emotional state captured using multiple
cameras inside the cabin to provide additional video
feed of the drivers face for automated emotion
analysis. Emotion coding is performed using FACET
algorithm (attention tool software)
After a take-over request visually
distracted drivers initially avert their gaze on secondary tasks to the road
way and simultaneously establish motor
readiness to intervene in the
vehicle guidance. Drivers who
distribute their visual attention appropriately
between driving and the secondary task
and regular monitoring the
roadway should be able to acquire and
maintain high situation awareness. Cognitive and not
motor process determines the take-
The study provides a good understanding on how the number and the maximum
duration of off road glances seem to be
suitable gaze parameters to assess and categorise the drivers monitoring behaviour in highly automated driving
situation. The study also provides good
understanding on the method that should be used to measure the gaze behaviour of visually distracted
drivers.
The study investigated on
method on how to use gaze behaviour as an indicator of driver readiness to take over control during automated driving. The study also showed that how specific gaze
parameters are suitable to assess the adequacy of
driver monitoring strategy. This could be useful in ADAS
for investigating use case driver
monitoring (driver distraction).
Relevant UCs C, D, G.
Indirectly relevant to E.

ADAS&ME (688900) D1.1 – SoA & Benchmarking
March 2017 Page 52 of 238 CERTH/HIT
Publication Objective Measured Results Relevance to
ADAS&ME
Contribution to
UCs
Key
over performance. Rashid et al. (2015) This case study
was conducted to determine signal
transfer challenges and limitations that researchers tend
to experience while using a
wireless Myon 320 sEMG system during a real on-road motorcycle
riding experiment
Upper trapezius (T), triceps brachii (TB), erector spinae (ES),
latissimus dorsi (LD), extensor carpi radialis
(ECR), sternocleidomastoid (S), gastrocnemius (G) and biceps formaris (BF)
muscle groups
As a conclusion, this study provides
an insight of what to expect during
performing wireless sEMG experiments
on real roads involving two
moving vehicles.
Finally, any procedures and
experimental setups involved in such on-
road experiment should be observed
carefully for the safety of all parties
and road users.
To monitor rider’s inattention, relevant
and important to clearly distinguish inattention due to
distraction (external cause) and
inattention due to fatigue (internal
cause). Relevant UCs C, D,
G. Indirectly relevant
to E.
Lorenz et al. (2014) The study investigated
whether augmented reality information can
positively influence the take-
over process.
Lane keeping or speed choice
PERCLOS PRC
TETTC
The study provides a good
understanding on how the number and
the maximum duration of off road glances seem to be
suitable gaze parameters to assess and categorise the drivers monitoring behaviour in highly automated driving
situation. The study also provides good understanding on the method that
should be used to
The study provides a good understanding on how the number and the maximum
duration of off road glances seem to be
suitable gaze parameters to assess and categorise the drivers monitoring behaviour in highly automated driving
situation. The study also provides good
understanding on the method that should be used to measure the gaze behaviour of
The study investigated on
method on how to use gaze behaviour as an indicator of driver readiness to take over control during automated driving. The study also showed that how specific gaze
parameters are suitable to assess the adequacy of
driver monitoring strategy. This could be useful in ADAS
for investigating use

ADAS&ME (688900)
March 2017
Publication Objective Measured
Wu et al.(2015) Drivers’ use of voice interfaces within their own
vehicles was explored using
contextual interviews.
Video recorded interviews (identification of errors)NASA TLX (Task Load
Strayer et al. (2015)
Establish a systematic
framework for measuring and understanding
cognitive distraction in the
automobile, defining
relationship between mental
workload, cognitive
distraction, and impaired driving
Detection Response Task (DRT), Brake reaction
time, following distance, glances at hazard
locations, subjective workload rating (NASA
TLX), physiological measures (EEG)
Naujoks et al. (2014)
The study investigated the
Time until driver takes hands back on the steering
Page 53 of 238
Measured Results Relevance to
ADAS&ME
Contribution to
UCs
measure the gaze behaviour of
visually distracted drivers.
visually distracted drivers.
Relevant UCs C, D,
Video recorded interviews (identification of errors) NASA TLX (Task Load
Index)
Accuracy of speech interface can impact
safety
Voice communication with systems is
recommended but has to be robust with high
quality
Measures used and
HMI strategies and resulting workload. Relevant UCs C, D,
Detection Response Task (DRT), Brake reaction ime, following distance,
glances at hazard locations, subjective
workload rating (NASA-TLX), physiological
measures (EEG)
Definition of a cognitive distraction
scale.
Framework to measure driver
distraction associated with different in- vehicle activities.
framework across 3
partially adopted in
Relevant UCs C, D,
Time until driver takes hands back on the steering
Time until driver takes hands back on
Visual-auditory warning modality
D1.1 – SoA & Benchmarking
CERTH/HIT
Contribution to
UCs
Key
case driver monitoring (driver
distraction). Relevant UCs C, D,
G. Indirectly relevant
to E. Measures used and voice commands are important for
HMI strategies and resulting workload. Relevant UCs C, D,
G. Indirectly relevant
to E.
An established framework across 3 studies that could
be adapted or partially adopted in
UCs where distraction is
measured. Relevant UCs C, D,
G. Indirectly relevant
to E.
Very important result for HMI
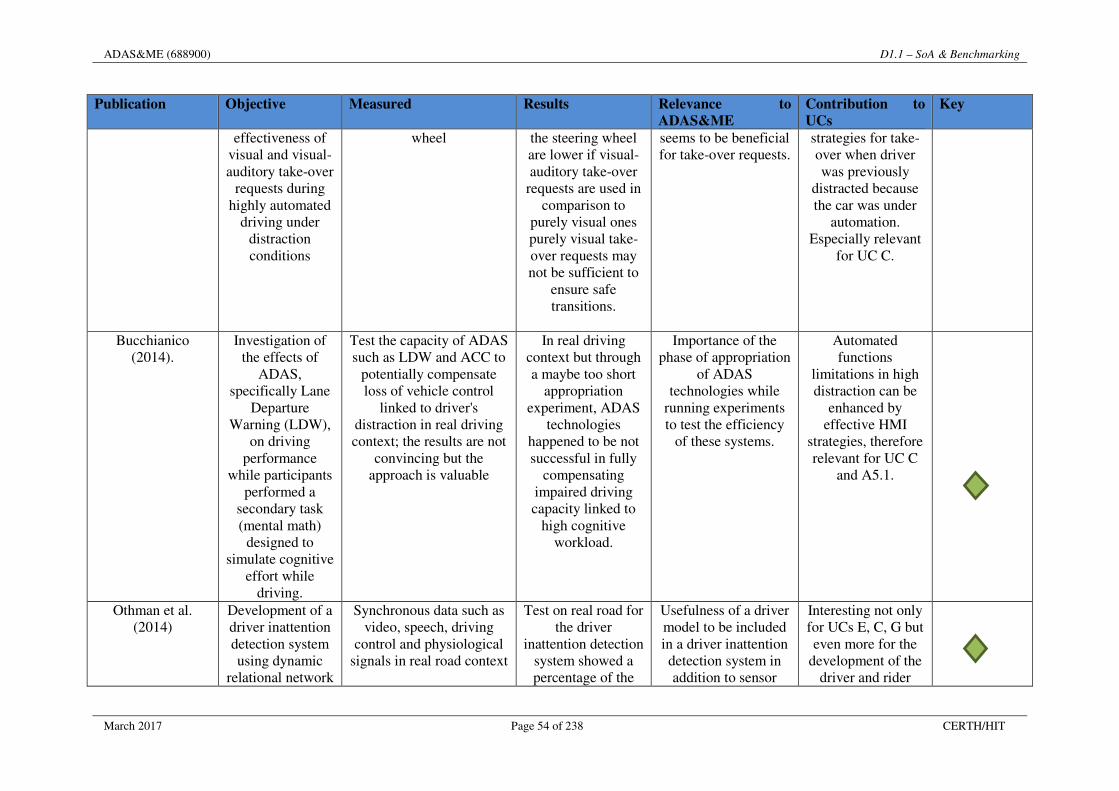
ADAS&ME (688900) D1.1 – SoA & Benchmarking
March 2017 Page 54 of 238 CERTH/HIT
Publication Objective Measured Results Relevance to
ADAS&ME
Contribution to
UCs
Key
effectiveness of visual and visual-auditory take-over
requests during highly automated
driving under distraction conditions
wheel the steering wheel are lower if visual-auditory take-over
requests are used in comparison to
purely visual ones purely visual take-over requests may not be sufficient to
ensure safe transitions.
seems to be beneficial for take-over requests.
strategies for take-over when driver was previously
distracted because the car was under
automation. Especially relevant
for UC C.
Bucchianico (2014).
Investigation of the effects of
ADAS, specifically Lane
Departure Warning (LDW),
on driving performance
while participants performed a
secondary task (mental math)
designed to simulate cognitive
effort while driving.
Test the capacity of ADAS such as LDW and ACC to
potentially compensate loss of vehicle control
linked to driver's distraction in real driving context; the results are not
convincing but the approach is valuable
In real driving context but through a maybe too short
appropriation experiment, ADAS
technologies happened to be not successful in fully
compensating impaired driving capacity linked to
high cognitive workload.
Importance of the phase of appropriation
of ADAS technologies while
running experiments to test the efficiency
of these systems.
Automated functions
limitations in high distraction can be
enhanced by effective HMI
strategies, therefore relevant for UC C
and A5.1.
Othman et al. (2014)
Development of a driver inattention detection system using dynamic
relational network
Synchronous data such as video, speech, driving
control and physiological signals in real road context
Test on real road for the driver
inattention detection system showed a percentage of the
Usefulness of a driver model to be included in a driver inattention detection system in addition to sensor
Interesting not only for UCs E, C, G but even more for the
development of the driver and rider

ADAS&ME (688900) D1.1 – SoA & Benchmarking
March 2017 Page 55 of 238 CERTH/HIT
Publication Objective Measured Results Relevance to
ADAS&ME
Contribution to
UCs
Key
confidence score of the system output
very high, between 80 to 70%.
diagnosis module to monitor driver's state
in the car.
models (A1.3)
Ranney et al. (2014)
To evaluate the sensitivity of
Detection Response Task
(DRT) metrics to differences in
attentional load
Head-mounted DRT (HDRT), Remote DRT
(RDRT), and Tactile DRT (TDRT)
Overall, the TDRT was consistently
more sensitive than other DRT variants, albeit marginally, in
the driving simulator
Test of sensitivity of DRT variant metrics to evaluate driver's
distraction to be used at an international
level in the framework of the NHTSA Driver
Distraction Guidelines
The variants of this metric DRT may be used in several UCs
of the project, especially in C and
D.
Dong & Hu (2013) This paper presents a review of current state of
the knowledge about driver inattention
monitoring, with inattention
classified into 2 categories:
distraction and fatigue
Driver physical variables Driving performance
Variables and information from IVIS
As the goal of a driver’s inattention monitoring system is to reduce driving
risk, it is recommended to
combine the 3 data sources.
Several systems available to evaluate in real time driver's
distraction and driver's fatigue.
To monitor driver’s inattention, relevant
and important to clearly distinguish inattention due to
distraction (external cause) and
inattention due to fatigue (internal
cause). Relevant UCs C, D,
G. Indirectly relevant
to E.
Tango & Botta (2013)
Real-time detection system
of driver distraction using machine learning
Data for training the models were collected using a static driving
simulator, with real human subjects performing a
specific secondary task,
Usefulness of a ML model to detect
driver's distraction without using eye-
tracker data but rather nonintrusive
This model SVM can be useful to define
driver's distraction in the objective of
design of adaptive PADAS.
Best machine learning models is important also for
the work carried out within WP4 apart
from UCs C and D.

ADAS&ME (688900) D1.1 – SoA & Benchmarking
March 2017 Page 56 of 238 CERTH/HIT
Publication Objective Measured Results Relevance to
ADAS&ME
Contribution to
UCs
Key
i.e., a surrogate visual research task (SURT)
and real-time vehicle dynamic
data. Mbourna et al.
(2013) Visual analysis of eye state and head
pose for driver alertness and distraction monitoring
Eye index (EI), pupil activity (PA), and Head
Pose (HP)
Head pose (HP) provides useful
information on the lack of attention, particularly when
the driver’s eyes are not visible due to
occlusion caused by large head
movements.
A support vector machine (SVM) is useful to classify a sequence of video
segments into alert or non-alert driving
events.
Use a single camera in addition to
combination of information coming
from driver's eye and head in order to
achieve correct identification of distraction state.
Convincing method applicable in real
road driving context to evaluate driver's distraction state.
Relevant UCs C, D, G.
Indirectly relevant to E.
Di Stasi et al. (2011)
Method of estimating the
mental workload (MWL) of a
motorcycle rider was proposed,
through the application of
machine learning methods
Saccade duration, eye fixation (short stop), tracking frequency,
saccade amplitude, and most frequency eye movement velocity
As a result, discrimination functions were found through
machine learning methods that allow
us to detect increasing MWL
with an accuracy of over 80%, under set
experimental conditions.
Measurements of rider’s mental
workload through machine learning
methods.
Comparison to ADAS&ME: The
method of measurements with
the helmet (included in project)
Relevant to E

ADAS&ME (688900) D1.1 – SoA & Benchmarking
March 2017 Page 57 of 238 CERTH/HIT
Publication Objective Measured Results Relevance to
ADAS&ME
Contribution to
UCs
Key
Jain & Busso (2011)
Assessment of driver’s
distraction using perceptual
evaluations, self-assessments and
multimodal feature analysis
Self-assessments Subjective evaluation of
localized recordings of the drivers
CAN Bus signals, eye glance behaviour
Acoustic signal, giving unbiased metrics to
describe the deviation in behaviour’s observed
when the driver is involved in the secondary
task
Identification and description of
relevant metrics to describe distracted
drivers.
Methodologies to assess driver's distraction are multiple: self-
assessed, observation by experts, objective data from the vehicle.
To be robust, it is possible to use the combination of the 3 of them. Relevant
to UC C and D.
Ahlstrom and Dukic (2010)
Comparison of eye tracking
systems with one and three cameras
Advantages with a one-camera system are that it is cheaper, easier to operate and easier to install in a vehicle. A multi-camera system will, on the other
hand, provide higher availability and accuracy for areas that are far from
the road centre
Both accuracy and availability
deteriorated with distance from the
central gaze target, with a larger
decrease for the one-camera eye
tracking systems as compared to the three-cameras
Better understanding of limits and
advantages in terms of accuracy in using one-
camera or three-camera eye tracking
systems.
Comparison of 2 systems that could
be used in the project to evaluate driver's distraction
state. Relevant to UCs C
and D.
Tofetti et al.(2009) An experiment was conducted to compare the two eLane interfaces.
(City Mobil project)
Interface evaluation questionnaire
Driving performance evaluation questionnaire
The study showed the method to
investigate two different interfaces: Acoustic and Vocal
and its effect of driving
performance. AIDE- HMI
Driving in automatic mode with the vocal
modality is considered safer than acoustic
one. At the same time vocal modality can be bit annoying, but this
can be solved with dedicated design that
An interface design with a mixed
automatic-manual modality is
recommended for situation like
automated driving in case of medium
and low traffic,

ADAS&ME (688900) D1.1 – SoA & Benchmarking
March 2017 Page 58 of 238 CERTH/HIT
Publication Objective Measured Results Relevance to
ADAS&ME
Contribution to
UCs
Key
questionnaire measures were used
for the investigation.
allows the deactivation to expert
users. In case of automation system
fault the vocal modality seems to be the better one because
it shortens drivers’ reaction time. The
visual information for the acoustic modality is considered more
necessary than for the vocal modality. The
labels such as «automatic
overtaking", "fault" are not problematic and requires a pre
warning.
straight and high velocity streets and manual driving for medium and high traffic in the urban context, overtaking and for mountain
streets.
Especially relevant for UC C.
Hancock et al. (1990)
The work reported here examines the behaviour of car drivers during
different driving sequences, in
particular during left-turn
manoeuvres
Video-taping of the driver and the forward-looking
scene
Results indicated that there were
significant increases in head movements
and mental workload during turn sequences
compared to straight driving.
Results indicated that there were significant
increases in head movements and mental workload
during turn sequences compared to straight
driving.
Consideration for Use Case scenarios.
Includes both objective and
subjective measures.
Identification of relation between head movements and increase in
workload. Relevant UCs C, D, G.

ADAS&ME (688900) D1.1-SoA & Benchrmarking
March 2017 Page 59 of 238 CERTH/HIT
3.6 Physiological states
Physiological signals, as Electrocardiography (ECG), Heart Rate (HR), Respiratory Rate (BR), Galvanic Skin Response (GSR), Blood Pressure (BP), Body Temperature (BT) and Electroencephalography (EEG), Grip Pressure (GP) were used in the past in experiments, in order to assess the physiological conditions of the driver and to estimate his/her fatigue, sleepiness, stress levels and drivers workload, (O’Hanlon and Kelley, 1977), (Egelund, 1982), (Brookhuis and De Waard, 1993), (Apparies et al., 1998), (Healey and Picard, 2005), (Papadelis et al., 2007). Ubiquitous and affective computing has created a new generation of less expensive and easily to integrate sensors (Bekiaris and Nikolaou, 2004). Prototypes were created with the non-invasive use of physiological sensors in cars. (Lin et al., 2007) used a BT, BR, HR and GP sensor on a steering wheel for a simulator. (Osaka et al., 2008), (Matsuda and Makikawa, 2008) and (Jeong et al., 2007) used ECG electrodes either on two sides of the steering wheel or the seat. (Watson et al., 2011) created a prototype for a simulator with a steering wheel that integrates HR, GSR and BT sensors and a seatbelt that can measure the BR. Further, a biometric steering wheel reference design is available from Texas Instruments and Exmovere has developed a steering wheel, which combines a GSR and a HR sensor. The fusion of many sensors is used for emotion recognition, since the combined data they provide is useful for different emotions (Leng et al., 2007), (Katsis et al., 2008). Issues with the use of the physiological signals sensors, mentioned by researchers of the above publications, include unreliability in the measurement with motions of the driver (motion artefacts), as well as not functioning of the measurement when the skin contact is not possible, e.g., with the GSR and ECG sensor, when the driver is wearing gloves. Wearable equipment, as smart-watches (Exmovere Holdings Inc., 2011) or bracelets (Ouwerkerk et al., 2013), can be used for physiological signal tracking, however they need to be paired with the integrated system of the vehicle, adding to the workload of the driver. NFC technology may be used in this case for seamless function. Also the investigation of extremely low or high temperatures that may lead to hypothermia/ hyperthermia is not available and medical evidence for studies do not necessarily transfer knowledge from other activities or clinical studies to riders. In addition, faint, frostbite and other conditions are similarly not studied in the past; therefore any studies included are from other disciplines. Transferability of knowledge and technologies need to further be investigated under the prism of the work to be performed within these contexts. The following table presents current research in the physiological states of mostly riders as well as their categorisation with regards to their relation to the project’s UCs and ADAS&ME in general (Table 10).
3.7 Rest
Rest is the state where the driver is either relaxing/ sleeping, etc. inside or outside the vehicle. As literature with regards to driving does not actually exist, a considerable gap is identified there that ADAS&ME attempts to first address and fill in. Therefore, the literature included in this section does not come from any of the transport areas but from other research fields. The aim is to identify any transferable results, knowledge, know-how and technologies that will enable us to select the appropriate indicators and systems. The following table presents the main publications selected from the literature review (Table 11).
3.8 Environmental sensing
A review on environmental sensing was included in this section because it is closely related to UCs C and D and to automated functions. It plays a crucial role in the interaction of the vehicle with other vehicles or road users and the infrastructure. Interoperable and smooth integration of sensors and operation of multi-sensorial platforms is essential in order to ensure a safe and uneventful driving experience. Relevant publications were reviewed and presented in Table 12.

ADAS&ME (688900) D1.1 – SoA & Benchmarking
March 2017 Page 60 of 238 CERTH/HIT
Table 10: Summary of literature review- Physiological states’ affective cluster
Publication Objective Measured Results Relevance to
ADAS&ME
Contribution to
UCs
Key
Balasubramanian &
Jagannath (2014) Detecting
motorcycle rider local physical
fatigue and discomfort using
surface electromyography and seat interface
pressure. Although, in this study they
focus on measuring fatigue. These
measures would be interesting to investigate for
fainting because of fatigue or long time
spent riding.
Surface electromyography
(sEMG) Seat interface
pressure
The authors find that the occurrence of fatigue can be
measured on postural muscle
groups
Measuring sEMG might give
information about fatigue and related
conditions (e.g. faint because of fatigue).
If connection between these variables is clear, then they could be used to measure fatigue in riders but still not clear what type of sensors are more appropriate (relevant to UC Ε).
Zwolińska (2013) Investigation of the effect of clothing gear to increase of
rider’s temperature.
Selected physiological parameters
Thermal insulation Thermal comfort
The research confirmed the
problem related to high values of
thermal insulation of motorcycle clothing and transport of
moisture from the skin surface. by decreasing the
Rider’s high temperatures and hyperthermia are
taken into consideration in UC
E.
Thermal comfort can be enhanced by taking out a membrane or, alternatively, by using a membrane which maintains optimal air permeability (to transfer sweat from the body) with

ADAS&ME (688900) D1.1-SoA & Benchrmarking
March 2017 Page 61 of 238 CERTH/HIT
Publication Objective Measured Results Relevance to
ADAS&ME
Contribution to
UCs
Key
thermal insulation of motorcycle
clothing, as well as by increasing the effectiveness of
channelling humidity off the
skin surface
improved protective properties against external conditions.
Bogdan et al. (2012) This article proposes a method for a comprehensive
assessment of the effect of integral
motorcycle helmets on physiological and cognitive responses
of motorcyclist
Heart rate, local skin temperature, core temperature, air temperature,
relative humidity in the space between the helmet and the surface of the head,
and the concentration of O2 and CO2 under the
helmet motorcyclists’
reflexes, fatigue, perceptiveness and
mood
Measurements of mean skin
temperature revealed that this
was a reliable indicator for
evaluating the effect of an
integral helmet on a motorcyclist’s
physiological parameters.
Temperature inside the helmet, to be
significant, has to be measured with great
precision.
Investigate the applicability to UC E.
Di Stasi et al. (2011) Behavioural and eye-movement
measures to track improvements in driving skills of vulnerable road users: First-time
motorcycle riders.
Behavioural and eye-related
measures that are sensitive to both
long-term experience and
training in motorcycle riders
As expected, training led to an improvement in
the riding skills of first-time riders,
reducing the number of accidents,
improving their
This multidimensional
methodology can be useful for the design
of the rider model and the rider monitoring
system
Classification of states based on extracted features is extremely relevant to the FER that the project has uptake. The approach is validated and thus within the project we
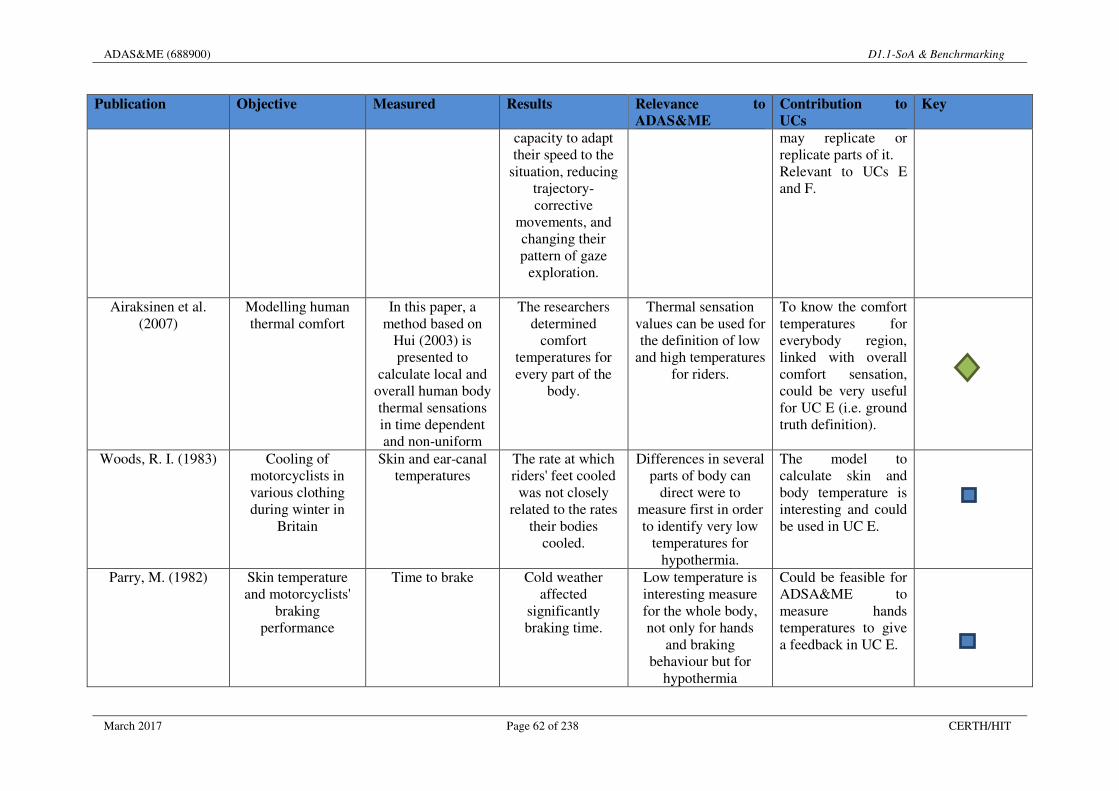
ADAS&ME (688900) D1.1-SoA & Benchrmarking
March 2017 Page 62 of 238 CERTH/HIT
Publication Objective Measured Results Relevance to
ADAS&ME
Contribution to
UCs
Key
capacity to adapt their speed to the
situation, reducing trajectory-corrective
movements, and changing their pattern of gaze
exploration.
may replicate or replicate parts of it. Relevant to UCs E and F.
Airaksinen et al. (2007)
Modelling human thermal comfort
In this paper, a method based on
Hui (2003) is presented to
calculate local and overall human body thermal sensations in time dependent and non-uniform
The researchers determined
comfort temperatures for every part of the
body.
Thermal sensation values can be used for the definition of low
and high temperatures for riders.
To know the comfort temperatures for everybody region, linked with overall comfort sensation, could be very useful for UC E (i.e. ground truth definition).
Woods, R. I. (1983) Cooling of motorcyclists in various clothing during winter in
Britain
Skin and ear-canal temperatures
The rate at which riders' feet cooled was not closely
related to the rates their bodies
cooled.
Differences in several parts of body can
direct were to measure first in order to identify very low
temperatures for hypothermia.
The model to calculate skin and body temperature is interesting and could be used in UC E.
Parry, M. (1982) Skin temperature and motorcyclists'
braking performance
Time to brake Cold weather affected
significantly braking time.
Low temperature is interesting measure for the whole body, not only for hands
and braking behaviour but for
hypothermia
Could be feasible for ADSA&ME to measure hands temperatures to give a feedback in UC E.
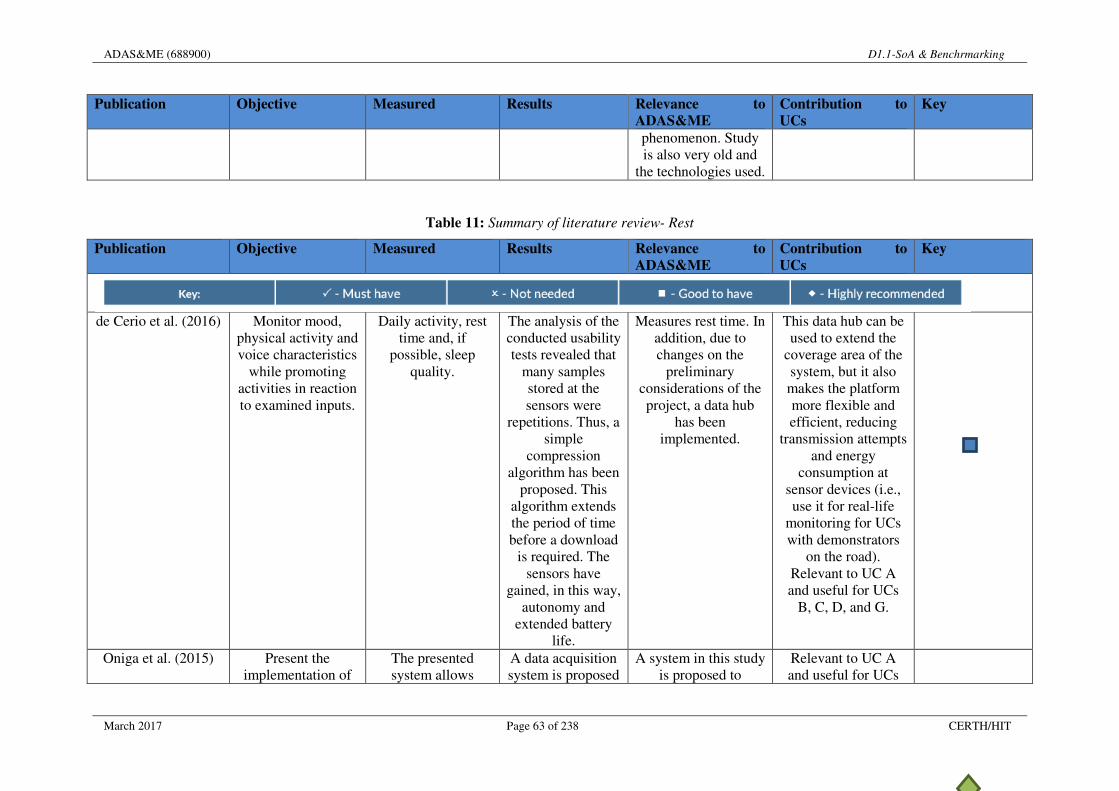
ADAS&ME (688900) D1.1-SoA & Benchrmarking
March 2017 Page 63 of 238 CERTH/HIT
Publication Objective Measured Results Relevance to
ADAS&ME
Contribution to
UCs
Key
phenomenon. Study is also very old and
the technologies used.
Table 11: Summary of literature review- Rest
Publication Objective Measured Results Relevance to
ADAS&ME
Contribution to
UCs
Key
de Cerio et al. (2016) Monitor mood,
physical activity and voice characteristics
while promoting activities in reaction to examined inputs.
Daily activity, rest time and, if
possible, sleep quality.
The analysis of the conducted usability tests revealed that
many samples stored at the sensors were
repetitions. Thus, a simple
compression algorithm has been
proposed. This algorithm extends the period of time before a download
is required. The sensors have
gained, in this way, autonomy and
extended battery life.
Measures rest time. In addition, due to changes on the
preliminary considerations of the project, a data hub
has been implemented.
This data hub can be used to extend the
coverage area of the system, but it also makes the platform more flexible and efficient, reducing
transmission attempts and energy
consumption at sensor devices (i.e., use it for real-life
monitoring for UCs with demonstrators
on the road). Relevant to UC A and useful for UCs
B, C, D, and G.
Oniga et al. (2015) Present the implementation of
The presented system allows
A data acquisition system is proposed
A system in this study is proposed to
Relevant to UC A and useful for UCs

ADAS&ME (688900) D1.1-SoA & Benchrmarking
March 2017 Page 64 of 238 CERTH/HIT
Publication Objective Measured Results Relevance to
ADAS&ME
Contribution to
UCs
Key
an activity recognition system
based on a data acquisition system
with inertial sensors.
recording sensors data from a
wearable system containing two
inertial sensors, in files for storage and further processing
or real-time tracking of the
parameters provided by
sensors.
using inertial sensors, for
acquiring data related to body
position and some simple movements
recognize seventeen activities or postures.
This system can monitor human
activity and hence understand if he is resting in respect to physical activities.
B, C, D, and G.
Oniga et al. (2015) Factors that may influence the
recognition rate of the human activity
using wearable sensors data
Number of sensor nodes, the type of sensor node, pre-
processing algorithms, type of
classifier and its parameters.
Better results can be obtained using a better placement of
the sensors.
With 2 sensors placed on the thigh and wrist
and using only the accelerometer data and pre-processed data they obtained
very good results as presented.
Relevant to UC A and useful for UCs
B, C, D, and G. Maybe also for UC
E.
Bayat et al. (2014) Recognize certain types of human
physical activities using acceleration data generated by a user's cell phone.
The system was trained and tested in an experiment with
multiple human subjects in real-
world conditions. High-frequency and
low-frequency components of the
data were taken into account.
A recognition system is proposed
in which a new digital low-pass
filter is designed in order to isolate the
component of gravity
acceleration from that of body
acceleration in the raw data.
For future work plans is to extend the
activity recognition task in several ways,
first to recognize additional activities, such as sleeping or
bicycling. Hence it’s a useful tool which
can be easily integrated to the
project, especially for motorbike drivers
Relevant to UC A and useful for UCs
B, C, D, and G. Maybe also for UC
E.

ADAS&ME (688900) D1.1-SoA & Benchrmarking
March 2017 Page 65 of 238 CERTH/HIT
Publication Objective Measured Results Relevance to
ADAS&ME
Contribution to
UCs
Key
Chang et al. (2014) This work provides evidence for neural (BOLD functional
connectivity) correlates of distinct autonomous nervous
states
HRV, suggesting a physiological
contribution to the observed non-stationarity of resting state connectivity
between particular regions that may
ultimately translate to a psychological dimension of time-varying vigilance
states.
Correlations between sliding-
window measures of HRV and
respiration are shown. The
RMSSD metric of HRV using both the heart rate and inter-beat-interval time series were
strongly correlated (0.90±0.09). Significant
covariation was observed of HRV
with regional connectivity over the resting-state
scan.
Provides a strong basis to include HRV sensors to monitor the
driver’s resting condition.
Relevant to UC A and useful for UCs
B, C, D, and G.
Zheng et al. (2013) The authors proposed the Subwindow
Ensemble Model which used an ensemble of classifiers.
Trained on features made up of coarse summary statistics
computed from different temporal scales. The SWEM outperformed other baseline algorithms.
The SWEM algorithm achieved
very accurate results (≥ 90% for OSU data, > 80% for HASC), which suggests that the
algorithm could be viable for
deployment.
Algorithms can be integrated to the
project; free-living data consists of a
mixture of different activities performed
throughout an individual’s day, and thus it is necessary to
explore algorithms for segmenting the data and classifying these segments into
Relevant to UC A and useful for UCs
B, C, D, and G.

ADAS&ME (688900) D1.1-SoA & Benchrmarking
March 2017 Page 66 of 238 CERTH/HIT
Publication Objective Measured Results Relevance to
ADAS&ME
Contribution to
UCs
Key
physical activity types.
Vigneau-Roy et al. (2013)
The variation of the oxy/deoxygenated
blood ratio and blood volume in the
brain following neural activation
They first developed an
automated approach of segmenting
vessels based on susceptibility-
weighted images (SWIs) from which they then compute regional measures of VAD at various
spatial scales
The findings add to the growing body
of evidence, suggesting that
regional variations in GMD (as derived from VBM) are not
strong predictors of the BOLD
response amplitude.
Correlates to the resting state of the
driver, both in means of brain or physical
activities.
Relevant to UC A and useful for UCs
B, C, D, and G.
Xu et al. (2013) Determine a proper threshold value for
accurate sEMG signal analysis
Due to the specific dependence of the detection accuracy
on the decision threshold, it is important to
determine a proper threshold value for
accurate sEMG signal analysis.
In this paper, an improved ML
algorithm with an adaptive threshold
technique was devised to face the task of detecting both onset and offset timing of
muscle contraction by sEMG signal processing in the case of low SNR.
Using EMG method to detect the resting state is very useful since it can also be implemented into a
small wearable device usable by all kind of
drivers.
Relevant to UC A and useful for UCs
B, C, D, and G.
Li et al. (2012) Simulations were used to assess the
sensitivity of SRFC, ReHo, and ALFF to noise interference.
fMRI were acquired from 32 healthy
participants.
The neighbourhood
size for calculating ReHo should be larger than 20
Very important as noise is a major
factory especially for the motorbike tests.
Relevant to UC A and useful for UCs
B, C, D, and G. Maybe also for UC
E.
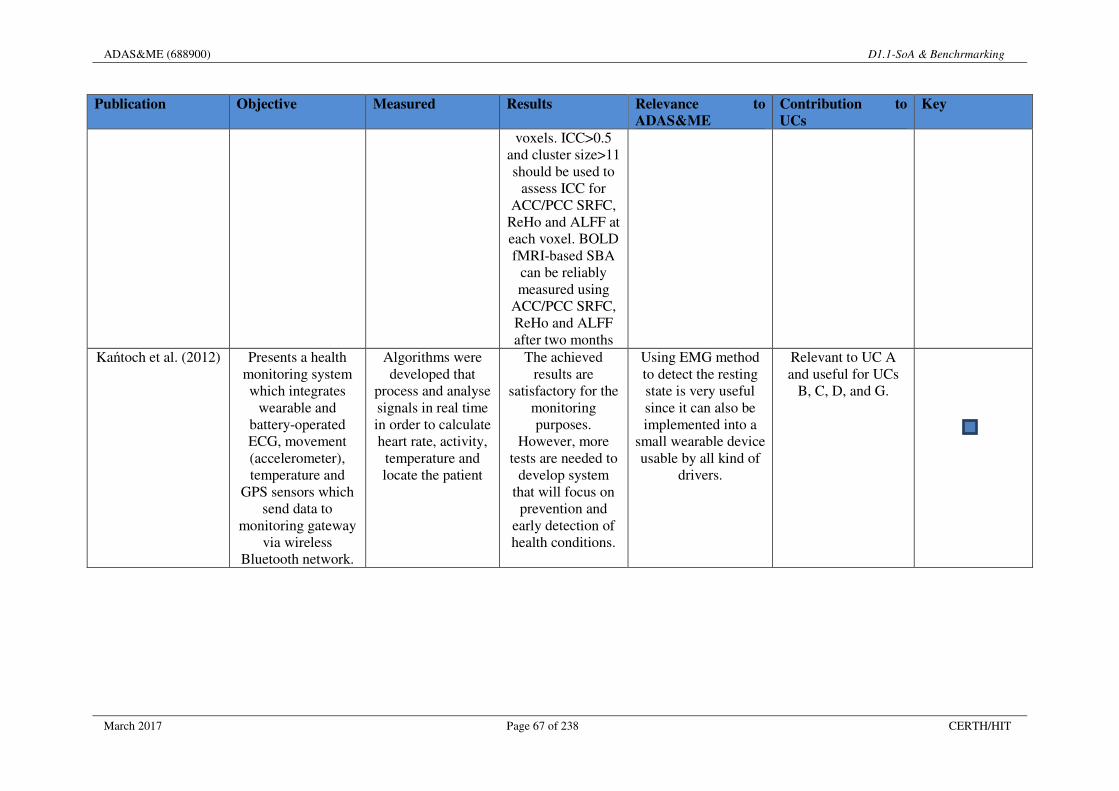
ADAS&ME (688900) D1.1-SoA & Benchrmarking
March 2017 Page 67 of 238 CERTH/HIT
Publication Objective Measured Results Relevance to
ADAS&ME
Contribution to
UCs
Key
voxels. ICC>0.5 and cluster size>11 should be used to
assess ICC for ACC/PCC SRFC,
ReHo and ALFF at each voxel. BOLD fMRI-based SBA
can be reliably measured using
ACC/PCC SRFC, ReHo and ALFF after two months
Kańtoch et al. (2012) Presents a health monitoring system which integrates
wearable and battery-operated ECG, movement (accelerometer), temperature and
GPS sensors which send data to
monitoring gateway via wireless
Bluetooth network.
Algorithms were developed that
process and analyse signals in real time in order to calculate heart rate, activity, temperature and locate the patient
The achieved results are
satisfactory for the monitoring purposes.
However, more tests are needed to
develop system that will focus on prevention and
early detection of health conditions.
Using EMG method to detect the resting state is very useful since it can also be implemented into a
small wearable device usable by all kind of
drivers.
Relevant to UC A and useful for UCs
B, C, D, and G.

ADAS&ME (688900) D1.1-SoA & Benchrmarking
March 2017 Page 68 of 238 CERTH/HIT
Table 12: Summary of literature review- Environmental sensing
Publication Objective Measured Results Relevance to
ADAS&ME
Contribution to
UCs
Key
Dongwook et al.
(2015) Method of lane-
level localization for automated driving using around view monitoring (AVM)
camera
The maps are created beforehand
using an AVM camera and RTK
GPS. A pose estimation of
vehicle was derived from a low-cost
GPS and an iterative closest
point(ICP) match of real-time sensor data to lane map
The performance of proposed localization
algorithm (esp. lateral and yaw error) allows a lateral control
precise enough to be applicable. At
the moment (generally
crossroads), the localization error is
accumulated slightly.
Can be used as an alternative or
complementary solution to sense the
environment or specific aspects of it.
Related to UCs C and D.
Castillo et al. (2015) Vehicle models were programmed in on-board systems to perform real-time estimations of the forces of contact
between the wheel and road and the
speed of the vehicle.
These simulations show the ability of
the proposal to yield accurate
values of the road condition index
and optimal sliding when changes have been made in the
adhesion characteristics of the road condition in both straight and curved trajectories.
Road condition index and sliding is an
important factor of the vehicle’s environment.
Related to UCs C and D.

ADAS&ME (688900) D1.1-SoA & Benchrmarking
March 2017 Page 69 of 238 CERTH/HIT
Publication Objective Measured Results Relevance to
ADAS&ME
Contribution to
UCs
Key
Wang et al. (2014) Presents a new approach to
recognize the types of moving vehicles
in a distributed, wireless sensor
network, based on sparse signal
representation
The experiments are based on the
data sets of military vehicles collected by DARPA. The algorithm need to be further tested.
The results show that the proposed algorithm model
gives good performance on
vehicle recognition.
Compared with other classification
algorithms, the method improves the precision of
recognition.
Acoustic sensors are a good and low cost solution to monitor the traffic near the
vehicle.
Related to UCs C and D.
Milanés et al. (2013) Approach to automation of one
the riskiest autonomous manoeuvres
involving vehicles – overtaking
Based on a stereo vision system to
detect the preceding vehicle and then to
activate the autonomous
overtaking system
While the results achieved are
promising, there still remain several questions in need
of further investigation.
Among them, the detection of
oncoming traffic via stereo vision,
increasing the vehicle detection
range, and performing the
autonomous lateral displacement at greater speeds
The system can be part of an advanced
driver assistance system or automated to aid driving in very difficult or dangerous
tasks.
Related to UCs C and D.
Barbagli et al. (2012) Propose a Wireless Sensor Network that
Measure the temporal variation
The signal processing
The developed system shows the
Related to UCs C and D.

ADAS&ME (688900) D1.1-SoA & Benchrmarking
March 2017 Page 70 of 238 CERTH/HIT
Publication Objective Measured Results Relevance to
ADAS&ME
Contribution to
UCs
Key
utilizes a microphone array to
detect the sound waves generated by
the road vehicles
of the differential time of arrival of
the acoustic signal at each pair of sensors with an
algorithm based on a generalized cross-correlation method
algorithm and the vehicle detection
procedure are described.
Experimental results of long-
time period operation are
shown.
following key features: (i) provides a complete picture state of the traffic
flow at an larger scale and in real-time (ii) collect information coming from two
different devices (iii) presents low
installation and maintenance cost (iv) is able to large scale
deployment.

ADAS&ME (688900) D1.1-SoA & Benchrmarking
March 2017 Page 71 of 238 CERTH/HIT
4 Applications (driver’s/ rider’s monitoring systems)
This chapter includes descriptions of systems, algorithms, wearables, etc. that are relevant to UCs and the project. A separate section is prepared for passenger cars, buses and trucks (Section 4.1) and second one (Section 4.2) for motorcycles. The reason for separating the two sections is that the UCs for motorcycles consider affective states that are not addressed in the other vehicle types (e.g., fainting).
4.1 Passenger car, bus and trucks
Each presented system will include information collected through the template whereas the title (brackets) identifies the relation to specific project’s UCs. This section is structured based on around the affective states addressed.
4.1.1 Fatigue/ Drowsiness/ Sleepiness
Sleepiness constitutes one of the major causes of road accidents and can lead to severe physical injuries, deaths and significant economic losses. Statistics indicate the need of a reliable driver drowsiness detection system, which could alert the driver before a mishap happens. Researchers have attempted to determine driver drowsiness using the following measures: (1) vehicle-based measures; (2) behavioural measures and (3) physiological measures. In some cases they are also integrated with models about circadian. This section includes systems, sensors, subjective measures and algorithms developed to detect this cluster of affective states. Not all of the technologies, measures, and batteries included in this section target vehicles and drivers but those mentioned potentially could. It is important to note that some of the technologies discussed have not be implemented/ used in road transport but there is potential for market expansion to the automotive industry. Various technologies can be used to try to detect driver drowsiness. Steering pattern monitoring: Primarily uses steering input from electric power steering system. Vehicle position in lane monitoring: Uses lane monitoring camera. Driver eye/face monitoring: Requires a camera watching the driver's face. Physiological measurement: Requires body sensors for measure parameters like brain activity, heart rate, skin conductance, muscle activity. As sleepiness detecting systems were the first to be investigated in the literature, we are far more informed than any other area of interest within the project. Thus, we will place less emphasis on this area in the benchmarking report. Inattention/ Distraction is also researched but not as much as sleepiness and therefore more information is included about sensors and algorithms. However, in many cases, it is obvious that many systems aim to address both safety risks (i.e. distraction and sleepiness). It is important to note, that ADAS&ME moves towards to a hybrid territory, where many systems can address many affective states or aspects of these states, therefore a consensus on how these affective states are linked and their indicators overlap should be reached. 4.1.1.1 In-vehicle systems/ sensors/algorithms
Product name – Delphi's Driver State Monitoring System
Producer/ Manufacturer Delphi Automotive PLC (NYSE: DLPH) is a major Tier 1 ADAS supplier. Contact information / Website (URL) Headquartered in Gillingham, U.K., Delphi operates technical centres, manufacturing sites and customer support services in 44 countries. URL: http://www.delphi.com/manufacturers/auto/sensors Short description The Delphi's Driver State Monitoring System monitors the driver’s fatigue and distraction level and then reacts. The driver can be warned via seat and steering wheel vibrations or the system can offset driver workload or take specific action to help ensure safety. It is reported to be an automotive-grade, real-time, vision-based driver state monitor. Upon detecting and tracking the driver's facial features, the system analyses eye-closures and head pose to infer his/her fatigue or distraction.

ADAS&ME (688900) D1.1-SoA & Benchrmarking
March 2017 Page 72 of 238 CERTH/HIT
Images
Figure 9: Delphi’s Driver State Monitoring System
Technical specifications / requirements The information is used to warn the driver and to modulate the actions of other safety systems. The purpose of this monitor is to increase road safety by preventing drivers from falling asleep or from being overly distracted, and to improve the effectiveness of other safety systems. Eye-tracking: 3 sensors in dashboard; 2 sensors in A-Pillar; 1 sensor near the radio. ADAS&ME relevance (aspects covered):
Relevant to UCs: A, C, D and G. A system that addresses two clusters of affective states within the project (sleepiness and distraction); Facial recognition/ expressions are also considered in the system. ADAS&ME irrelevance (aspects not covered): No automated functions, just detection/ recognition. Price: Not available. Product name – Seeing Machines
Producer/ Manufacturer Seeing Machines, (AIM: SEE) – An ADAS Tier 1 supplier with specialization on driver monitoring. Contact information / Website (URL) Headquartered in Australia 24/7 Telephone Support Call +1 855 377 4636 (toll-free US number) Call +61 2 6103 4700 (Australia) URL: https://www.seeingmachines.com/ Short description Seeing Machines Driver Safety is a stand-alone system for preventing distraction and fatigue in professional truck drivers. Images
Technical specifications / requirements • Driver fatigue and distraction detection technology; • In-cab sensor and forward-facing camera;
Figure 10: Seeing Machines Driver Safety
System on board
Figure 11: Driver information and camera detecting

ADAS&ME (688900) D1.1-SoA & Benchrmarking
March 2017 Page 73 of 238 CERTH/HIT
• Real-time intervention; • 3-tier SafeGuard Program.
ADAS&ME relevance (aspects covered) Relevant to UCs: A and G. Relevant to two major affective states’ clusters; Existing product (stand-alone) and not vehicle integrated. ADAS&ME irrelevance (aspects not covered) No automation, though the fleet version includes potential intervention by the operators. Price Not available. Product name – Anti Sleep Pilot®
Producer/ Manufacturer Asp Technology Ltd Contact information / Website (URL) Apex House, Timothys Bridge Road, Stratford-Upon-Avon, Warwickshire, England, CV37 9BF. Short description The anti Sleep pilot by Asp Technology Ltd is Stand-alone system for preventing distraction and fatigue, by scheduling break intervals, i.e., when having a break will have the greatest effect on drowsiness. Anti Sleep Pilot® claims that calculates how tired the driver is, maintains his/her alertness and lets him/her know when it is time to take a break. While driving, the Anti Sleep Pilot continuously calculates driver’s fatigue level and keeps him/her informed of this via the display. The calculation is based on 1) driver’s personal risk profile, which is determined by completing a short questionnaire, 2) driver’s fatigue status before the trip and 3) data from driving behaviour that Anti Sleep Pilot automatically registers via built-in sensors. Anti Sleep Pilot maintains alertness using driver’s alertness maintaining tests. The driver receives alertness maintaining tests at 10 to 25 minute intervals, depending on his/her risk profile and fatigue status. His/her reaction time is registered once he/she touches the top of the Anti Sleep Pilot. Anti Sleep Pilot records the reaction times and includes these in the calculation of driver’s fatigue level. When driver’s fatigue level begins to reach a critical point the Anti Sleep Pilot uses both audible and visual signals to let him/her know it's time to take a break. A subtle light and sound indication is given when it is safe to continue driving. Images
Technical specifications / requirements • Calculates driver’s fatigue level • Maintains driver’s alertness • Recommends a break • Touch sensor – for interaction with the driver
Figure 12: The anti Sleep pilot device (right) locked on dashboard (left)

ADAS&ME (688900) D1.1-SoA & Benchrmarking
March 2017 Page 74 of 238 CERTH/HIT
ADAS&ME relevance (aspects covered):
Relevant UCs: A, C, D and G. Driver needs to enter information to build a driver profile; Visual and auditory signals are sent; Driver has to perform tasks while driving (tapping the system) to help defining level of attentiveness. ADAS&ME irrelevance (aspects not covered):
No automated function; vehicle does not take control at any point. Price: 240 Euros; Box Contains: Anti Sleep Pilot, Instructions. Product name – Anti sleep driving alarm
Producer/ Manufacturer Nap Zapper Contact information / Website (URL) [email protected] | Phone: 914.NAP.ZAPP (914.627.9277) | Los Angeles CA. URL: http://napzapper.com/
Short description The Nap Zapper anti sleep driving device sounds an alarm when the driver’s head falls forward in drowsiness. Images
Figure 13: An anti-sleep device
Technical specifications / requirements Manufacturer Specifications:
• Main Function: Anti Sleep Alarm • Alarm mode: Vibration • Dimensions: 75 x 22 x 15mm • Angle of Protection: 15~ 30 • Battery: Replaceable button cell battery • Life Time: 30,000 nods Product Notes • There is no vibration when the driver keeps normal driving status with eyes looking forward
ADAS&ME relevance (aspects covered): Easy design and non-obtrusive; Relevant to UC and affective state: A, C, D, G. Simple stand-alone product; right of self; mainly for sleepiness – drowsiness (not fatigue); ADAS&ME irrelevance (aspects not covered): No automated functions; Not appropriate for prediction – only for detection. Price: Several prices, depending on company and model: from 10 to 70 Euros.
Product name – Anti sleep alarm Stop Sleep
Producer/ Manufacturer StopSleep.biz Contact information / Website (URL) Sergej Kusnezow Bernsteinstr.22 70619 Stuttgart

ADAS&ME (688900) D1.1-SoA & Benchrmarking
March 2017 Page 75 of 238 CERTH/HIT
E-mail: [email protected] Web: www.stopsleep.biz Telefon: +49 170 / 1723188 URL: http://stopsleep.biz/ Short description Anti Sleep Alarm StopSleep aims to recognise the loss of concentration and to prevent falling asleep. It is a stand-alone, small device to be worn on the fingers. It has 8 skin sensors, to detect electrodermal activity, in order to detect tiredness and warn the driver of sleep onset. Images
Technical specifications / requirements Anti-sleep alarm measures the conductivity of the skin (electrodermal activity - EDA). EDA reflects brain activity. Electrical conductivity of the skin varies, depending on the activity of the brain. The processing algorithm of the signal, which is used in the anti sleep alarm StopSleep is used for the detection of the following two states:
• Falling asleep, characterized by a strong signal decrease; • Reduction of reaction, which can be called by the start of drowsiness, deep thought or simply
boredom. Both conditions are considered as dangerous for the driver, and therefore generate anti sleep alarm StopSleep, by warning signals (sound, vibration). To work properly it is important for the driver to start to use StopSleep in a time, when he/ she is still active, and not when already being tired. The fatigue detection takes 3-5 minutes to measure current brain activity and then fatigue is estimated from this level. ADAS&ME relevance (aspects covered):
Relevant to UCs and affective state: A, C, D, G. Independent product; not vehicle type bound; Warns drivers with an audio and vibration alarm; Warns the driver before onset of sleep. ADAS&ME irrelevance (aspects not covered): No automation of functions or vehicle taking over for an action. Price: Ranging from 170 € to 250 € Product name – Vigo Producer/ Manufacturer Originally developed at the University of Pennsylvania. Built on principles of machine learning and statistics, Vigo’s algorithm learns from individual differences, with a calibration phase, and adapts to individual driver’s unique characteristics. Short description Vigo tracks driver’s eyes and head motion to measure his/her levels of alertness. When Vigo senses the driver getting drowsy, it stimulates the driver with a combination of vibrations, music, audio, flashing light or phone calls. Vigo tracks over 20 parameters to measure variations, such as blink rates, blink durations and drooping eyelids. By analysing biosignal patterns, Vigo senses driver’s drowsiness. Vigo’s 6-axis accelerometer and gyroscope measures movements of driver’s head. Vigo also monitors head nods, lowered gaze and slouched postures. Vigo exists also for fleets and professional drivers and operators. In addition to assessing the real-time
Figure 14: The StopSleep device (left) and worn while driving (right)

ADAS&ME (688900) D1.1-SoA & Benchrmarking
March 2017 Page 76 of 238 CERTH/HIT
alertness status of each driver, it measures his/her safe driving habits such as, scanning the road, checking side mirrors and taking rest breaks between long trips. Drivers get notified for bad behaviour such as driving while operating a phone, harsh acceleration and braking, and speeding.
Images
Figure 15: The Vigo device
Figure 16: Real time performance monitoring (for fleets)
ADAS&ME relevance (aspects covered):
It stimulates the driver with a combination of vibrations, music, audio, flashing light or phone calls; Stand-alone product; Multi-type of warning (i.e., interesting for HMI strategies to be developed within the project); Relevant to UCs and affective states and more than one type of vehicles: A, C, D and G. ADAS&ME irrelevance (aspects not covered): No automated functions/ just warning. Price: 97 Euros Product name – Volvo’s Driver Alert Control (DAC) Settings are made from the centre console display screen and its menu system (MY CAR). Producer/ Manufacturer Volvo Car Group (Volvo Cars) Contact information / Website (URL) Volvo Car Corporation 405 31 Göteborg Sweden +46 31 59 00 00 URL: www.volvocars.com
Short description This function alerts driver when they start losing concentration

ADAS&ME (688900) D1.1-SoA & Benchrmarking
March 2017 Page 77 of 238 CERTH/HIT
The Driver Alert function can be set in standby mode via the menu system MY CAR: • Checked box - function activated; • Unchecked box - the function is deactivated. • Driver Alert is activated when speed exceeds 65 km/h and remains active as long as the speed
is over 60 km/h.
If the vehicle is being driven erratically, the driver is notified by an acoustic signal plus the text message: “Driver Alert”, “Time for a break”, whereas the linked symbol (Figure 17) is illuminated in the combined instrument panel at the same time. The warning is repeated after a time if driving ability does not improve. The warning symbol can go off by pressing the left stalk switch OK button. Images
Technical specifications / requirements
• Cameras recognise lane markings on the road (measures distance between car and lane markings) and assesses if the vehicle is driver in a controlled way;
• Steering wheel inputs.
ADAS&ME relevance (aspects covered):
Relevant to UCs C and D. Used on roads with higher speeds (not in urban roads); HMI features: audible alert with visual feedback; Displays 5 concentration levels. ADAS&ME irrelevance (aspects not covered): In-vehicle systems – not separate; so it can be examined/and implemented in ADAS&ME Not suitable for use in every type of road; Not related to automation level or functions (take-up/ continuous, etc.) Price: Integrated in the vehicle price.
Product name – Ford’s Driver Alert Offers a safety system which warns if the driver is at risk of falling asleep. Producer/ Manufacturer Ford Motor Company Contact information / Website (URL) Board of Directors Ford Motor Company P.O. Box 685 Dearborn, MI 48126-0685 U.S.A. URL: http://www.ford.com/ Short description
Figure 17: Volvo’s Driver Alert linked symbol (left) and camera continuously recognises
lane markings (right) (Source:https://www.youtube.com/watch?v=EJA1KSrhzNU)
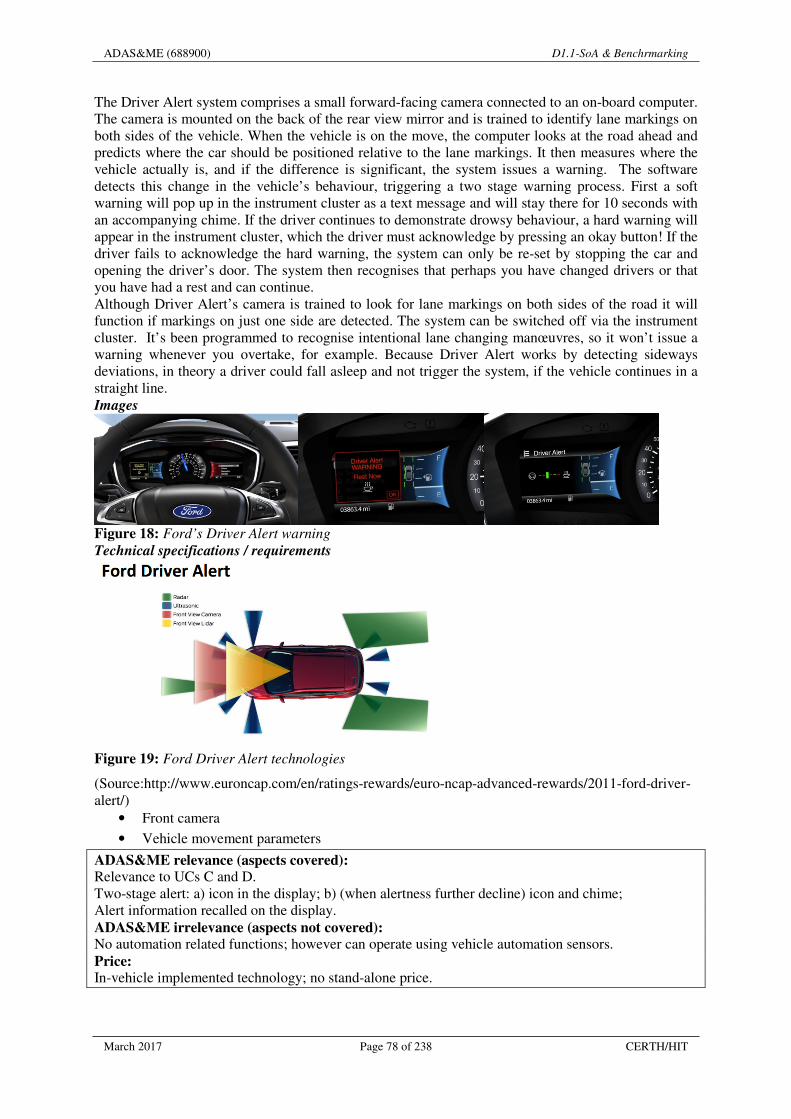
ADAS&ME (688900) D1.1-SoA & Benchrmarking
March 2017 Page 78 of 238 CERTH/HIT
The Driver Alert system comprises a small forward-facing camera connected to an on-board computer. The camera is mounted on the back of the rear view mirror and is trained to identify lane markings on both sides of the vehicle. When the vehicle is on the move, the computer looks at the road ahead and predicts where the car should be positioned relative to the lane markings. It then measures where the vehicle actually is, and if the difference is significant, the system issues a warning. The software detects this change in the vehicle’s behaviour, triggering a two stage warning process. First a soft warning will pop up in the instrument cluster as a text message and will stay there for 10 seconds with an accompanying chime. If the driver continues to demonstrate drowsy behaviour, a hard warning will appear in the instrument cluster, which the driver must acknowledge by pressing an okay button! If the driver fails to acknowledge the hard warning, the system can only be re-set by stopping the car and opening the driver’s door. The system then recognises that perhaps you have changed drivers or that you have had a rest and can continue. Although Driver Alert’s camera is trained to look for lane markings on both sides of the road it will function if markings on just one side are detected. The system can be switched off via the instrument cluster. It’s been programmed to recognise intentional lane changing manœuvres, so it won’t issue a warning whenever you overtake, for example. Because Driver Alert works by detecting sideways deviations, in theory a driver could fall asleep and not trigger the system, if the vehicle continues in a straight line. Images
Figure 18: Ford’s Driver Alert warning
Technical specifications / requirements
Figure 19: Ford Driver Alert technologies
(Source:http://www.euroncap.com/en/ratings-rewards/euro-ncap-advanced-rewards/2011-ford-driver-alert/)
• Front camera • Vehicle movement parameters
ADAS&ME relevance (aspects covered): Relevance to UCs C and D. Two-stage alert: a) icon in the display; b) (when alertness further decline) icon and chime; Alert information recalled on the display. ADAS&ME irrelevance (aspects not covered): No automation related functions; however can operate using vehicle automation sensors. Price: In-vehicle implemented technology; no stand-alone price.

ADAS&ME (688900) D1.1-SoA & Benchrmarking
March 2017 Page 79 of 238 CERTH/HIT
Product name - Rest recommendation system
Producer/ Manufacturer The Audi Group Contact information / Website (URL) http://www.audi.com/corporate/en/etc/contact.html URL: http://www.audi.com/en.html Short description This system analyses driving behaviour based on steering, pedals and gear lever movements. If the system detects a change in driving patterns, it, via audio and visual effects, notifies the driver of the possible need to take a break. It shows a warning if it detects a decline in attentiveness. The system will activate above 40mph, but can be switched off by the driver. Images
Figure 20: Audi’s Rest Recommendation System
(Source: http://www.audi.in/sea/brand/in/models/a3/a3-cabriolet/safety-and-security.html)
Technical specifications / requirements
• Forward-facing camera • Steering, pedals and gear level movements
ADAS&ME relevance (aspects covered):
Relevant to UC A; Activated for speeds between 65 and 200 km/h; Turned off by the driver if desired; Audible and visual alert; Support drowsy and distracted drivers. ADAS&ME irrelevance (aspects not covered): Vehicle parameters based; Price: In-vehicle implemented technology; no stand-alone price. Product name –Active Driving Assistant and Active Driving Assistant Plus
Producer/ Manufacturer Bayerische Motoren Werke AG (BMW) Contact information / Website (URL) URL: http://www.bmw.com/com/en/newvehicles/x/x3/2014/showroom/driver_assistance/driving_assistant.html Short description Active Driving Assistant with Attention Assistant analyses driving behaviour and, if necessary, advises the driver to rest. The advice to take a break is provided in the form of graphic symbols shown on the Control Display. The Driving Assistant with the light city braking function high is seeing the surrounding vehicles. The Lane Departure Warning detects lane markings and may warn also with alerts the driver to an unintentional lane change at speeds above approx. 70 km/h by means of vibrations in the steering wheel. The warning is not activated if the lane change is deliberate, that is, when the turn indicator has been activated. The Driving Assistant Plus feature (only available with Steptronic transmission) includes not only approach control warning and Lane Departure Warning, but also Active Cruise Control with Stop&Go function. This provides assistance when driving on motorways in both critical and stable traffic

ADAS&ME (688900) D1.1-SoA & Benchrmarking
March 2017 Page 80 of 238 CERTH/HIT
situations. This option is only available in conjunction with the Navigation system Business or Professional. The approach control warning responds in stages. Should the car begin to change lanes unintentionally, the Lane Departure Warning quickly provides a warning by means of vibrations in the steering wheel. The Active Cruise Control maintains a constant selected speed between 30 km/h and 210 km/h or automatically adjusts to conform to the cars driving in front if the distance control is activated. The Stop&Go function even controls speed down to a standstill, accelerating again easily when the gas pedal is pressed, for example in dense moving traffic. Images
Figure 21: Active driving assistant menu (BMW)
Technical specifications / requirements
• External camera-based systems; • Puts together several systems/system functions: a) Lane Departure Warning, b) approach
control (risk of collision with cars), and c) light city braking (risk of collision with pedestrians);
• Driving assistant plus (uses ACC with Stop& Go).
ADAS&ME relevance (aspects covered): Relevance to UCs A and D For speeds above 70 km/h (System=Lane departure is activated) Not activated if turning indicator is active Speeds between 10 - 60 Km/h (System=Light city brake operates) For speeds between 30 and 210 km/h (System= driving assistant plus: Two-stage alert: symbol in the instrumented cluster + acoustic alarm For city collision risks the system applies brakes Completes stand-still for version Driving Assistant plus Multi-assistance with consideration of combination of vehicle variables ADAS&ME irrelevance (aspects not covered): Overall assistance for assisting the driver to control the driver but not specific to certain affective states; Existing vehicle implementation for specific car models. Price: In-vehicle implemented technology; no stand-alone price. Product name - Fatigue detection system VW has incorporated a system to assist drivers in the physical and mental well-being when behind the wheel. The system monitors driver behaviour closely, noting deviations that may be warning signs to driver fatigue. Producer/ Manufacturer Volkswagen (shortened to VW). Contact information / Website (URL) URL:http://www.volkswagen.com.au/en/technology_and_service/technical-glossary/fatigue-detection.html Short description The driver Fatigue Detection system automatically analyses the driving characteristics and, if they indicate possible fatigue, recommends that the driver takes a break. The system continually evaluates

ADAS&ME (688900) D1.1-SoA & Benchrmarking
March 2017 Page 81 of 238 CERTH/HIT
steering wheel movements along with other signals in the vehicle on motorways and others roads at speeds in excess of 65 km/h, and calculates a fatigue estimate. If fatigue is detected, the driver is warned by information in the Multi-function Display and an acoustic signal. A driving time of 15 minutes is required in order to assess the driver correctly. The functionality of the system is restricted given a sporty driving style, winding roads and poor road surfaces. The manual includes also advice on effective breaks. Images
Figure 22: Visual and acoustic warning when the system finds the driver is waning (source: https://www.youtube.com/watch?v=W12qBrtypb8)
Technical specifications / requirements System continually evaluates steering wheel movements, along with other signals in the vehicle. ADAS&ME relevance (aspects covered):
Relevant to UC A, C, D, and G; When vehicle speeds in excess of 65 km/h; The driver is warned by information in the Multi-function Display and an acoustic signal; The warning is repeated after 15 minutes if the driver has not taken a break; A driving time of 15 minutes is required in order to assess the driver correctly. ADAS&ME irrelevance (aspects not covered): Functionality of the system is restricted given a sporty driving style, winding roads and poor road surfaces. No function is automated, only suggestions are included. Price:
In-vehicle already implemented technology; no stand-alone price.
Product name – Nissan’s Driver Attention Alert (DAA) Nissan’s Driver Attention Alert system analyses driver steering behaviour to provide an alert if signs of drowsiness or inattention are detected. A system that could also be included in the previous section, where systems relevant to drowsiness and sleepiness are presented. Producer/ Manufacturer Nissan Motor Co., Ltd. Nissan Motor Co., Ltd. is headquartered in Yokohama, Japan, and is part of the Renault-Nissan Alliance. Contact information / Website (URL) URL: http://www.nissan-global.com/EN/ Short description Nissan’s DAA system adapts to each individual driver. DAA monitors steering input patterns (using steering angle sensors) during a period of driving to establish a baseline. It continuously compares subsequent driving patterns to a baseline using a statistical analysis of steering correction errors. If it detects driving behaviour consistent with a drowsy driver, the system uses an audible chime sound and displays the amber coffee cup with a message reading, “Take a break?” in the vehicle’s information display. The DAA includes logic to help address false detection, road curvatures, lane changes, braking and even poor road conditions. The system automatically resets when the engine is

ADAS&ME (688900) D1.1-SoA & Benchrmarking
March 2017 Page 82 of 238 CERTH/HIT
turned off. It can also be turned off by the driver, if desired. Images
Figure 23: Nissan’s DAA informs the driver when it is time to take a break (Source: http://nissannews.com/en-US/nissan/usa/releases/nissan-s-driver-attention-alert-helps-detect-erratic-driving-caused-by-drowsiness-and-inattention?la=1)
Technical specifications / requirements Using steering angle sensors, DAA monitors steering input patterns to establish a baseline or a “snapshot” of how you were driving. Then, it continuously compares subsequent driving patterns to the most recent snapshot using a statistical analysis of steering corrections. If DAA detects driving behaviour consistent with drowsy driving, it will let you know by:
1. Sounding an audible chime 2. Displaying an amber coffee cup in the instrument panel 3. Displaying the message “Take a break?” next to the coffee cup
The system also includes logic to help address false detections such as lane changes, braking events, and even poor road conditions. It’s even smart enough to know when you may be drowsy, and also know when your driving patterns have to be adjusted to fit the circumstances. ADAS&ME relevance (aspects covered):
Relevant to UC A, C, D (for inattention / distraction) and G; Detection of drowsiness and distraction through steering wheel indicators; HMI to communicate and advice drivers to take a break; Can be turned on/ off. ADAS&ME irrelevance (aspects not covered):
In-vehicle systems – not separate so they can be examined/ and implemented in ADAS&ME; Only warn the driver based on collection of only one indicator (i.e., steering wheel); Not related to automation. Price: Part of the passenger car technologies.
Other automotive manufacturers The Saab Driver Attention Warning System (Nabo, 2015) detects visual inattention and drowsy driving. The system uses two miniature IR cameras integrated with Smart Eye technology to accurately estimate head pose, gaze, and eyelid status. When a driver’s gaze is not located inside the primary attention zone (which covers the central part of the frontal windshield) for a predefined period, an alarm is triggered. Toyota has equipped their luxury Lexus models with their Driver Monitoring System (Ishiguro et al., 2006). The system permanently monitors the movement of the driver’s head when looking from side to side using a NIR camera installed at the top of the steering wheel column. The system is integrated into Toyota’s pre-crash system, which warns the driver when a collision is likely to happen. More recently, a Hyundai concept car (the Hyundai HCD-14) incorporates Tobbi Technologies to track the eyes.

ADAS&ME (688900) D1.1-SoA & Benchrmarking
March 2017 Page 83 of 238 CERTH/HIT
ADAS&ME relevance (aspects covered):
Relevant to UC A, C, D (attention also), and G; Includes Smart Eye technology (partner); Steering wheel sensors; Use of NIR camera; Automated functions, pre-crash system. ADAS&ME irrelevance (aspects not covered): - Price: In-vehicle already implemented technology; no stand-alone price. Product name - Texas Instruments Biometric Steering Wheel
Producer/ Manufacturer Texas Instruments Incorporated is a global semiconductor company operating in 35 countries. Contact information / Website (URL) Texas Instruments Incorporated Executive Offices: 12500 TI Boulevard Dallas, Texas 75243 USA Mailing Address: P.O. Box 660199 Dallas, TX 75266-0199 Phone Number: 972-995-2011 (not for semiconductor support) URL: http://www.ti.com/
Short description Texas instrument has come up with a design for a concept demonstration of how a driver's pulse rate, respiration rate, and ECG based heart rate can be obtained from a vehicle steering wheel. The company’s AFE4400 and AFE4300 biometric analog front-ends (AFE) enable the acquisition of all three parameters via simple hand contacts on the steering wheel. The design includes a full BLE connectivity design for easy interface to smartphones and tablets.
The current collaboration between TI, Autoliv, and Neonode is bringing in a prototype that is a new type of steering wheel that offers gesture recognition and multi-touch control.
Images
Figure 24: The TI biometric steering wheel
Technical specifications / requirements • Features AFE4400 for measuring pulse from the palm;
• Features AFE4300 for measuring heart rate and respiration rate;
• MSP430F5528 MCU for holding algorithm data for each measurement;
• BLE module connection featuring TI's CC2541;
• This design is tested and provides everything you need to complete your design including Schematics, Layout and Gerber files, and BOM.
ADAS&ME relevance (aspects covered):
Unobtrusively gathers physiological data to monitor driver’s state;

ADAS&ME (688900) D1.1-SoA & Benchrmarking
March 2017 Page 84 of 238 CERTH/HIT
Related to all passenger car related UCs. ADAS&ME irrelevance (aspects not covered): No automated function related. Price: N/A (only prototype so far).
BioRICs
Producer/ Manufacturer BioRICS was created in 2006 as a spin-off of the research unit Measure, Model and Manage Bio Responses (M3-BIORES), the former Laboratory for Agricultural Buildings Research, of the Department Biosystems of the Katholieke Universiteit Leuven. Contact Info / Website URL: Location: BioRICS NV Technologielaan 3 3001 Heverlee Belgium Phone number: 016/395854 URL: https://www.biorics.com Short Description The BioRICS algorithm for sleepiness’ detection is reported to predict which driver is going to fall asleep and raise an alarm up to 15 minutes before the driver reaches a state of heavy drowsiness. The technology is aimed to be implemented in different means of transport, such as trucks, ships, trains and airplanes
Images
Figure 25: The BioRICS algorithm used to detect sleepiness in truck drivers
Technical specifications / requirements By monitoring the driver’s biological responses (ECG, biorythm, heat balance and/or driving performance) in real-time during the driving activity using wearable technology, and putting these data into a mathematical algorithm, changes in the individual driver’s body functions are detected and allow to predict when sleep will set in. ADAS&ME relevance (aspects covered): High relevant to UCA and G; Uses biological responses in real-time driving; Uses wearable technologies. ADAS&ME irrelevance (aspects not covered): No automated function related. Price: N/A. 4.1.1.2 Subjective measures
Subjective measures that evaluate the level of drowsiness are based on the driver’s personal estimation and many tools have been used to translate this rating to a measure of driver drowsiness. Karolinska Sleepiness Scale (KSS)

ADAS&ME (688900) D1.1-SoA & Benchrmarking
March 2017 Page 85 of 238 CERTH/HIT
The most commonly used drowsiness scale is the Karolinska Sleepiness Scale (KSS), a nine-point scale that has verbal anchors for each step, as shown in Table 13 (Åkerstedt et al 1990). Hu and colleagues (2009) measured the KSS ratings of drivers every 5 min and used it as a reference to the EoG signal collected. The score is aimed to be used as an average for the past minute and has been validated against EEG (Åkerstedt et al 2014). Some researchers compared the self-determined KSS, which was recorded every 2 min during the driving task, with the variation of lane position (VLP) and found that these measures were not in agreement (Sommer et al., 2010). Ingre and colleagues (2006) determined a relationship between the eye blink duration and the KSS collected every 5 min during the driving task. Researchers have determined that major lane departures, high eye blink duration and drowsiness-related physiological signals are prevalent for KSS ratings between 5 and 9 (Ingre et al., 2006). However, the subjective rating does not fully coincide with vehicle-based, physiological and behavioural measures. Table 13: Karolinska Sleepiness Scale (KSS)
Because the level of drowsiness is measured approximately every 5 min, sudden variations cannot be detected using subjective measures. Another limitation to using subjective ratings is that the self-introspection alerts the driver, thereby reducing their drowsiness level. In addition, it is difficult to obtain drowsiness feedback from a driver in a real driving situation. Therefore, while subjective ratings are useful in determining drowsiness in a simulated environment, the remaining measures may be better suited for the detection of drowsiness in a real environment. Epsworth Sleepiness Scale (ESS) (Johns, 1997) The ESS is a self-administered questionnaire with 8 questions. Respondents are asked to rate, on a 4-point scale (0-3), their usual chances of dozing off or falling asleep while engaged in eight different activities. Most people engage in those activities at least occasionally, although not necessarily every day. The ESS score (the sum of 8 item scores, 0-3) can range from 0 to 24. The higher the ESS score, the higher that personal average sleep propensity in daily life (ASP), or their average daytime sleepiness. The questionnaire takes no more than 2 or 3 minutes to answer. It is available in many different languages. Samn-Perelli fatigue scale (SPS) [Samn & Perelli, 1982). In the Samn-Perelli fatigue scale, the driver has to mark his/her relation to all of the 10 statements given on the screen. Fatigue assessed by this scale has a score between 0 and 20. The Samn-Perelli scale is standardised and has been used mainly in aviation, but not with drivers. Both the Karolinska sleepiness and the Samn-Perelli fatigue scales can be manipulated by the drivers towards better results, especially when it is known, which results can restrain the driver from starting his duty. Subjective scales are more demanding than filling in the checklist, but are usually completed in a shorter time.
Visual analogue scales (VAS) The visual analogue scale or visual analog scale (VAS) (Reips et al., 2008) Generator is a psychometric response scale, which can be used in questionnaires. It is a measurement instrument for subjective characteristics or attitudes that cannot be directly measured. When responding to a VAS item, respondents specify their level of agreement to a statement by indicating a position along a

ADAS&ME (688900) D1.1-SoA & Benchrmarking
March 2017 Page 86 of 238 CERTH/HIT
continuous line between two end-points. The test is represented by a line with “No Fatigue” and “Fatigue labelled” on two ends. The respondent will then draw a mark where he/she feels to be. Advantages of subjective scales:
Relevant to UCs A, E, G. -quick and easy to administer; -either paper-based or computer-based; -minimal BUT disruptive to driver – cannot measure during driving, unless in controlled conditions (e.g. simulated with co-driver); -many studies have used the SPS and KSS, and provide data for comparison. Disadvantages of subjective scales: -relatively easy to cheat; -may lack face validity; -do not always reliably reflect objective performance measures. Price: for free.
4.1.2 Inattention/ Distraction/ Cognitive Load
This section includes systems, sensors and algorithms that exist as off-the-self products or are in-vehicle integrated systems focussing on detecting distraction, cognitive load and generally inattentive behaviour. 4.1.2.1 In-vehicle systems/ sensors/algorithms
Pupil-Based Driver Monitoring System Product name - HARMAN introduced a pupil-based tracking system that monitors a driver’s cognitive workload. Producer/ Manufacturer HARMAN International is a Tier 1 supplier for OEM’s, as well as consumers and business products. Contact information / Website (URL) CORPORATE HEADQUARTERS HARMAN International 400 Atlantic Street Stamford, CT 06901, USA URL: http://www.harman.com/contact-us Short description The camera records fluctuations of the pupil for the calculation of the cognitive workload. ARMAN’s new proprietary eye and pupil tracking system measures high cognitive load and mental multitasking in the driver’s seat, and signals the car’s other safety systems to adapt to the driver’s state. Images
Technical specifications / requirements The camera continually captures the driver’s pupil dilation, and a proprietary software algorithm analyses the pupil reflex using advanced filtering and signal processing. The filter isolates and identifies responses triggered by high cognitive load. The calculated outputs are used to intuitively
Figure 26: HMI feature for in-vehicle central mirror (left) and HMI showing increase in
cognitive workload (right)

ADAS&ME (688900) D1.1-SoA & Benchrmarking
March 2017 Page 87 of 238 CERTH/HIT
adjust user interfaces, like placing mobile devices in do-not-disturb mode or adjusting ADAS intervention thresholds, to minimize physical and mental distraction to the driver.
ADAS&ME relevance (aspects covered):
Relevance to UCs C, D, G. Easy configurable, off the self product. ADAS&ME irrelevance (aspects not covered): No automation related, single indicator related. Price: Not known. Product name - A-Class: Attention assist
Producer/ Manufacturer Mercedes Benz Original (Daimler AG) Contact information / Website (URL)
Daimler AG Mercedesstraße 137 D-70327 Stuttgart E-mail: [email protected] URL: http://techcenter.mercedes-benz.com/en/attention_assist/detail.html YouTube channel videos: https://www.youtube.com/watch?v=uMZDV3JL7IE https://www.youtube.com/watch?v=nu1Ax3Z7zyY https://www.youtube.com/watch?v=A66zgJ4Oj8o https://www.youtube.com/watch?v=mf8JYVa7f1w Short description ATTENTION ASSIST creates an individual driver profile, detects by reference to over 70 measured variables when the driver is becoming tired and duly prompts him/her to take a rest. The system is active at speeds between 80 and 180 km/h, analysing a number of indicators to monitor the driver's gradual transition from alertness to tiredness. Images
Figure 27: A class: Attention Assist
Technical specifications / requirements The algorithm is based on driving parameters (steering movements and steering speed, trip duration, use of other systems/instruments in the car that show signs of activity). This information is used to define the driver's state (principle: more monotony, higher risk). ADAS&ME relevance (aspects covered):
Relevance to UCs C and D. Continuous personalised monitoring of the transition from awake/alarmed to fatigue; Complete HMI to warn and inform driver; Uses profile of driving style defined in the first few minutes of driving; Speeds between 80-180 Km/h or 60-200 Km/h, depending on models.

ADAS&ME (688900) D1.1-SoA & Benchrmarking
March 2017 Page 88 of 238 CERTH/HIT
Configuration Mode: standard & Sensitive; Visual and audible warning; Information on dashboard with 5 levels of attention; Activated by the driver. ADAS&ME irrelevance (aspects not covered): Existing product for A-Class Mercedes not open for integration; vehicle parameters and drowsy behaviour based. Price: Not relevant; no stand-alone function. Product name - Mazda i-ACTIVSENSE: Driver Attention Alert (DAA) DAA Mazda’s Driver Attention Alert aims to help improve the safety of longer distance journeys by monitoring driver’s attentiveness. Producer/ Manufacturer Mazda Motor Corporation Contact information / Website (URL) Company name: Mazda Motor Corporation Founded: January 30, 1920 Headquarters: 3-1 Shinchi, Fuchu-cho, Aki-gun, Hiroshima 730-8670 Japan Representative: Masamichi Kogai, Representative Director; President and CEO URL: https://www.mazda.com.au/innovation/i-activsense/
YouTube URLs: https://www.youtube.com/watch?v=yXyhdnYB1xQ Short description Driver Attention Alert is designed to reduce accidents caused by inattentiveness due to driver fatigue. The system comes into play at speeds above 65 km/h and begins to “learn” the driver’s habits, watching inputs and the vehicle’s movements in the early stages before fatigue is a factor. Later, if the system detects changes in vehicle behaviour that suggests the driver may be losing concentration, it will suggest a rest stop by sounding a chime and displaying a warning in the Multi-Information Display. DAA is designed to alleviate the burden of driving and reduce damage resulting from accidents and is predicated on the driver operating the vehicle in a safe manner. Images
Figure 28: The i-ACTIVSENSE in action
(source: http://www.mazda.com/en/innovation/technology/safety/active_safety/daa/)
Technical specifications / requirements
• Sensors and forward camera to measure distance to lane marking. • Parameters: steering angle, speed, trip duration, position on the lane.
ADAS&ME relevance (aspects covered):
Uses profile of driving style; Activated when speed is higher than 65 Km/h for trips longer than 20 minutes; Warning with advice to rest; Activated by the driver; Relevant for UCs C and D.

ADAS&ME (688900) D1.1-SoA & Benchrmarking
March 2017 Page 89 of 238 CERTH/HIT
ADAS&ME irrelevance (aspects not covered): In-vehicle commercial system; it is part of embedded technologies. However, it addresses behaviour only for long and leisure journeys and driving style sensors based only. Price: Part of the passenger car technologies; no stand-alone price.
Product name - EyeSight Driver Assist
Producer/ Manufacturer Subaru. Contact information / Website (URL) http://www.subaru.com/company.html URL: http://www.subaru.com/guides/forester/my16/Life/EyeSight
Short description EyeSight®1 Driver Assist Technology integrates multiple convenience and safety features and aims to give a virtual second pair of eyes on the road that can warn the driver of potential danger ahead—and apply the brakes, if necessary. It involves the following technologies:
• Pre-collision braking: provides automatic braking that prevents a collision or reduces the severity of a frontal impact.
• Pre-collision throttle management: provides automatic acceleration reduction in order to minimize the severity of certain frontal impacts.
• Adaptive cruise control: like conventional cruise control, the driver sets the desired speed with the steering wheel switch. When the driver reaches a halt at traffic by switching it again, the car accelerates and keeps the pre-selected distance from the leading vehicle.
• Lane departure and sway control: alerts driver when they depart the lane (without signalling) and when the driver drifts back and forth, then another alert is signalled in order to inform the driver to become attention (it may be a sign of inattention).
Images The photos in this section are all taken by the following URL: http://www.subaru.com/guides/forester/my16/Life/EyeSight
Figure 29: Eye sight camera Figure 30: Eye sight camera detects a
probably critical frontal event
a) c)

ADAS&ME (688900) D1.1-SoA & Benchrmarking
March 2017 Page 90 of 238 CERTH/HIT
Figure 31: Subaru with Eyesight dashboard: a) Pre-collision braking alert, b) Adaptive cruise
control, c) Lane departure warning, d) Drifting back and forth warning
Technical specifications / requirements
• Camera-based technologies; • Puts together several in-vehicle systems: a) pre-collision braking; b) pre-collisions throttle
management; c) Adaptive Cruise control; d) Lane departure & Sway warning.
ADAS&ME relevance (aspects covered):
Relevant to UCs C and D; Warns the driver and intervenes if driver does not react. ADAS&ME irrelevance (aspects not covered): Provides a whole set of functions that informs, warns and automatically takes control of vehicle; probably the most complete set of function for the driver’s safety and potentially targets a driver’s affective state. However, the focus is overall safety and not addressing a specific affective state per se. The latter was found in other technologies but without an automated function. Price: Vehicle implemented technology. Product name – zForce DRIVE™ Steering Wheel Sensor
Producer/ Manufacturer Neonode develops and licenses optical touch solutions. Contact information / Website (URL) Neonode Inc. 2880 Zanker Rd, Suite 362, San Jose CA 95134 USA Phone: +1 408 496 6722 URL: http://www.neonode.com Short description zForce DRIVE steering wheel sensor allows the car to know exactly where on the wheel the driver has his/her hands at any given moment. It’s a scalable HMI toolbox that can be integrated to the centre stack and Head up Display – or even replace the centre stack altogether. Images
b) d)
Figure 32: Neonode zForce steering wheel sensor

ADAS&ME (688900) D1.1-SoA & Benchrmarking
March 2017 Page 91 of 238 CERTH/HIT
ADAS&ME relevance (aspects covered):
UCs C, D, G Interesting HMI interactions. ADAS&ME irrelevance (aspects not covered): No automated function related Price: N/A (prototype). 4.1.2.2 Commercial sensors
Smart Eye The Smart Eye system consists of a multi-camera system running on a single PC and on a single algorithm. The system is scalable from 2 up to 8 cameras allowing 360 head and eye tracking. A typical configuration inside a vehicle cabin is composed of four cameras with two IR lightings, located on the dashboard on either side of the steering wheel. Smart Eye offers a sampling rate of 60 Hz (up to 8 cameras) or 120 Hz (up to 4 cameras). The field of view, depending on the number of cameras, is in the range of 90 –360. The data output includes over 145 values covering, among others, gaze, eyelid, pupilometer and head tracking, raw and filtered gaze, blinks, fixations and saccades. Relevant UCs C, D, G. EyeAlert EyeAlert has been conceived to detect driver inattention using computer vision and to generate a warning signal in case of dangerous situation. The EyeAlert system focuses entirely on the driver’s alertness levels or inattention to the road ahead, regardless of the time of the day or the weather conditions. Three models are available: EyeAlert EA410 detects both distracted and fatigue driving. The EA410 has an IR camera, a computer, an image processing unit and an alarm. The system will also respond in case the driver does not focus on driving. EyeAlert EA430, with GPS, detects both distracted and fatigue driving. Moreover, a minimum speed threshold is programmed into the internal GPS to prevent false alarms in urban environments. Additionally, minimum speed threshold, sensitivity, volume and data can be remotely programmed. Relevant UCs C, D, G. Seeing Machines SeeingMachines builds image-processing technology that tracks the movement of a person’s eyes, face, head, and facial expressions. It monitors fatigue and distraction events in real-time and uses IR technology to provide fatigue and distraction monitoring at any time of the day. The system can also combine multiple camera sensors, to detect a wider range of movements. The Seeing Machines’ system continuously measures operator eye and eyelid behaviour to determine the onset of fatigue and micro sleeps and delivers real-time detection and alerts. Apart from the sensor the monitoring system is presented in a previous section of this report. Relevant UCs C, D, G. Visage Technologies AB Visage Technologies AB provides a commercial head tracker based on feature-point detection and tracking of the nose boundary and eye regions. Visage SDK finds and tracks the face and facial features, including gaze direction, in video sequences in real time. It provides pupil coordinates, 3D gaze direction as well as (with a calibration step) screen-space gaze point. Visage Technologies also features support for embedded systems like FPGA and IR light tracking for poor lighting conditions. Relevant UCs C, D, E, G. Delphi Electronics Driver Status Monitor Delphi Electronics developed a single camera Driver Status Monitor (DSM) (Edenborough et al., 2015). By detecting and tracking the driver’s facial features, the system analyses eye-closures and head pose to infer his/her fatigue or distraction. This information is used to warn the driver and to modulate the actions of other safety systems. The system includes the use of NIR illumination, an embedded processing unit, as well as the camera (resolution of 640 480 pixels). Relevant UCs C, D, G. Tobii Technologies Tobii Technologies develops Tobii’s eye-tracking technology for integration into volume products, such as computers, computer games, virtual reality and cars. The Tobii platform consists of two-

ADAS&ME (688900) D1.1-SoA & Benchrmarking
March 2017 Page 92 of 238 CERTH/HIT
camera sensors, placed at different angles, and operating at IR frequencies to eliminate interference from external light. The system can distinguish whether the driver’s eyes are open or closed or if the driver has turned his/her head. The sensors work even when the driver is wearing glasses or sunglasses. By observing the specifics of eyelid closure, in combination with eye gaze patterns, an active safety system powered by Tobii’s eye tracking sensor can reliably detect if a driver is falling asleep and warns him/her properly. Moreover, Tobbi Technologies provides the Tobii EyeChip, which is a dedicated eye tracking SOC ASIC. Relevant UCs C, D, G. SensoMotoric Instruments SensoMotoric Instruments GmbH (SMI) Eye and gaze tracking systems. Their eye tracking solutions can measure head position and orientation, gaze direction, eyelid opening, and pupil position and diameter. Eye trackers use a sampling rate of 120 Hz for head pose and gaze measurement, 120 Hz for eyelid closure and blink measurement, and 60 Hz for combined gaze, head pose, and eyelid measurement. It also provides PERCLOS information for drowsiness detection. It is a computer-based system and needs user calibration. In [Juhola et al., 2013) SensoMotoric was used to recognize the pupil in each image in order to measure horizontal and vertical eye movements. Relevant UCs C, D, G. 4.1.2.3 Algorithms
The following tables are from a recent review carried out by Fernandez et al. (2016) and refer to algorithms developed to identify distraction within the vehicle. The interest for this project is the comparison of several algorithms on aspects (classifiers) relevant to the project. (Fernández et al., 2016). The items highlighted in blue, are the algorithms with higher success rate based on the comparison indicator chosen in each table. The aim is to identify the algorithms with higher success rate in relation to the ones already included in the project. The information added in section might of greater interest for WP4 partners. We did not go into detail in each algorithm but for a detailed account, please refer to (Fernández et al., 2016). These algorithms are relevant for UC C and D (cognitive distraction). For each study included in the following tables (Tables Table 14-Table 17), the references are added after the each table to ease access to the publication title and authors. Table 14: Computer vision algorithms to detect cell phone usage. High recognition rates are usually
obtained using very different approaches
Algorithm Features Classifier
Recognition Rate
(%) Features from the Hidden Conditional
Random
Zhang et al. [1] driver’s face, 91.20 Fields (HCRF)
mouth and hand
91.2 Image descriptors
Artan et al. [2] extracted from a
SVM 86.19 region of interest
around the face Percentage of the
Berri et al. [3] Hand and Moment FV 91.57 of Inertia
Xu et al. [4] DPM FV 95

ADAS&ME (688900) D1.1-SoA & Benchrmarking
March 2017 Page 93 of 238 CERTH/HIT
Seshadri et al. [5] Raw pixels and Real AdaBoost,
93.86 HOG features SVM, RF
[1] Zhang, X.; Zheng, N.; Wang, F.; He, Y. Visual recognition of driver hand-held cell phone use based on
hidden CRF. In Proceedings of the 2011 IEEE International Conference on Vehicular Electronics and
Safety (ICVES), Beijing, China, 10–12 July 2011; pp. 248–251.
[2]Artan, Y.; Bulan, O.; Loce, R.P.; Paul, P. Driver cell phone usage detection from HOV/HOT NIR
images. In Proceedings of the 2014 IEEE Conference on Computer Vision and Pattern Recognition
Workshops (CVPRW), Columbus, OH, USA, 23–28 June 2014; pp. 225–230. [3]Berri, R.A.; Silva, A.G.; Parpinelli, R.S.; Girardi, E.; Arthur, R. A Pattern Recognition System for
Detecting Use of Mobile Phones While Driving. 2014, arXiv preprint arXiv:1408.0680.
[4] Xu, B.; Loce, R.P. A machine learning approach for detecting cell phone usage. In Proceedings of the
IS&T/SPIE Electronic Imaging, International Society for Optics and Photonics, San Francisco, CA, USA, 4
March 2015. [5] Seshadri, K.; Juefei-Xu, F.; Pal, D.K.; Savvides, M.; Thor, C.P. Driver Cell Phone Usage Detection on
Strategic Highway Research Program (SHRP2) Face View Videos. In Proceedings of the IEEE Conference
on Computer Vision and Pattern Recognition (CVPR) Workshops, Boston, MA, USA, 7–12 June 2015. Table 15: Hands recognition in different regions inside the car using CVRR-HANDS 3D dataset [1]
Algorithm Features Classifier Regions
Recognition Rate (%)
Ohn et al. [1] RGB data SVM 5 52.1
Ohn et al. [1] RGB combined with depth
data SVM 5 69.4 Martin et al. [2] Hands cues SVM 3 83 Martin et al. [2] Hands and head cues SVM 3 91
Ohn et al. [3] Hands cues SVM 3 90
Ohn et al. [3] Hands and head cues SVM 3 94
[1] Ohn-Bar, E.; Trivedi, M.M. The power is in your hands: 3D analysis of hand gestures in naturalistic video. In
Proceedings of the 2013 IEEE Conference on Computer Vision and Pattern Recognition Workshops (CVPRW),
Portland, OR, USA, 23–28 June 2013; pp. 912–917.
[2] Martin, S.; Ohn-Bar, E.; Tawari, A.; Trivedi, M.M. Understanding head and hand activities and coordination
in naturalistic driving videos. In Proceedings of the 2014 IEEE Intelligent Vehicles Symposium Proceedings,
Ypsilanti, MI, USA, 8–11 June 2014; pp. 884–889.
[3] Ohn-Bar, E.; Martin, S.; Tawari, A.; Trivedi, M. Head, eye, and hand patterns for driver activity recognition.
In Proceedings of the IEEE 2014 22nd International Conference on Pattern Recognition (ICPR), Stockholm,
Sweden, 24–28 August 2014; pp. 660–665.
Table 16: Supervised algorithms for cognitive distraction detection
Algorithm Features Classifier Accuracy (%)
Zhang et al. [1] Eye gaze-related features
Decistion Tree 81 and driving performance
Zhang et al. [1] Eye gaze-related features Decision Tree 80

ADAS&ME (688900) D1.1-SoA & Benchrmarking
March 2017 Page 94 of 238 CERTH/HIT
Algorithm Features Classifier Accuracy (%)
Zhang et al. [1] Pupil-diameter features Decision Tree 61
Zhang et al. [1] Driving performance Decision Tree 60
Liang, Reyes, et al. [2] Eye gaze-related features
SVM 83.15 and driving performance
Liang, Reyes, et al. [2] Eye gaze-related features SVM 81.38
Liang, Reyes, et al. [2] driving performance SVM 54.37
Liang, Lee, et al. [3] Eye gaze-related features
DBNs 80.1 and driving performance data
Miyaji et al. [4] Heart rate, Eye gaze-related
AdaBoost 91.5 features and pupil diameter
Miyaji et al. [4] Eye gaze-related features SVM 77.1 (arithmetic task)
Miyaji et al. [4] Eye gaze-related features SVM 84.2 (conversation task)
Miyaji et al. [4] Eye gaze-related features AdaBoost 81.6 (arithmetic task)
Miyaji et al. [4] Eye gaze-related features AdaBoost 86.1 (conversation task)
Yang et al. [5] Eye gaze-related features
ELM 87.0 and driving performance data
Yang et al. [5] Eye gaze-related features
SVM 82.9 and driving performance data
[1] Zhang, Y.; Owechko, Y.; Zhang, J. Driver cognitive workload estimation: A data-driven perspective. In
Proceedings of the 7th International IEEE Conference on Intelligent Transportation Systems, Washington,
DC, USA, 3–6 October 2004; pp. 642–647.
[2] Liang, Y.; Reyes, M.L.; Lee, J.D. Real-time detection of driver cognitive distraction using support
vector machines. IEEE Trans. Intell. Transp. Syst. 2007, 8, 340–350.
[3] Liang, Y.; Lee, J.D.; Reyes, M.L. Nonintrusive detection of driver cognitive distraction in real time
using Bayesian networks. Transp. Res. Rec. J. Transp. Res. Board 2007, 2018, 1–8.
[4] Miyaji, M.; Kawanaka, H.; Oguri, K. Effect of pattern recognition features on detection for driver’s
cognitive distraction. In Proceedings of the 2010 13th International IEEE Conference on Intelligent
Transportation Systems (ITSC), Funchal, Portugal, 19–22 September 2010; pp. 605–610.
[4]Yang, Y.; Sun, H.; Liu, T.; Huang, G.B.; Sourina, O. Driver Workload Detection in On-Road Driving
Environment Using Machine Learning. In Proceedings of ELM-2014; Springer: Berlin/Heidelberg,
Germany, 2015; Volume 2, pp. 389–398.

ADAS&ME (688900) D1.1-SoA & Benchrmarking
March 2017 Page 95 of 238 CERTH/HIT
Table 17: Mixing types of distraction detection algorithms
Algorithm Features Classifier Average Accuracy (%)
Li et al. [1] AU and head pose
LDC (visual distraction) and
80.8 (LDC), 73.8 (SVM) SVM (cognitive distraction)
eye behaviour, arm
position,
Craye et al. [2] head orientation and facial
Adaboot and HMM 89.84 (Adaboot), 89.64
(HMM) expressions using both
colour and depth images
Liu et al. [3] Head and eye movements SVM, ELM and CR-ELM 85.65 (SVM), 85.98 (ELM),
86.95 (CR-ELM)
Head orientation SVM, CRF, NN
90 (RF—distraction detection) Ragab et al. [4]
using depth images
[1] Li, N.; Busso, C. Analysis of facial features of drivers under cognitive and visual distractions. In Proceedings
of the 2013 IEEE International Conference on Multimedia and Expo (ICME), San Jose, CA, USA; 15–19 July
2013; pp. 1–6. [2] Craye, C.; Karray, F. Driver distraction detection and recognition using RGB-D sensor. 2015, arXiv preprint
arXiv:1502.00250.
[3] Liu, T.; Yang, Y.; Huang, G.B.; Lin, Z.; Klanner, F.; Denk, C.; Rasshofer, R.H. Cluster Regularized Extreme
Learning Machine for Detecting Mixed-Type Distraction in Driving. In Proceedings of the 2015 IEEE 18th
International Conference on Intelligent Transportation Systems (ITSC), Las Palmas de Gran Canaria, Spain, 15–
18 September 2015; pp. 1323–1326. [4] Ragab, A.; Craye, C.; Kamel, M.S.; Karray, F. A Visual-Based Driver Distraction Recognition and Detection
Using Random Forest. In Image Analysis and Recognition; Springer: Berlin/Heidelberg, Germany, 2014; pp.
256–265.
4.1.2.4 Subjective measures
Subjective measurement of levels of workload is based on the use of rankings or scales to measure the amount of workload a person is feeling. Subjective workload measures are devoted primarily to the intermittent question and answer type response to varying levels of workload. The two main types of scales used to measure subjective workload are unidimensional and multidimensional scales. Unidimensional rating scales are considered the simplest to use because there are no complicated analysis techniques. The unidimensional scale has only one dimension. Generally, the unidimensional scale is more sensitive than the multidimensional scale. The multidimensional workload scale is considered to be a more complex and more time consuming form of measurement, and has from 3 to 6 dimensions. The multidimensional scale is generally more diagnostic (De Waard, 1996). Several simple subjective mental workload scales have been developed to measure an individuals’ perceived workload. Some of the main scales used in the driving domain include NASA-task Load
Index (TLX), Rating Scale Mental Effort (RSME), Situation Awareness Global Assessment Technique, Driving Activity Load Index (DALI).

ADAS&ME (688900) D1.1-SoA & Benchrmarking
March 2017 Page 96 of 238 CERTH/HIT
NASA Task Load Index Scale (NASA-TLX) The NASA Task Load Index uses six dimensions to assess workload: mental demand, physical demand, temporal demand, performance, effort, and frustration. Twenty-step bipolar scales are used to obtain ratings for these dimensions. A score from 0 to 100 is obtained on each scale. This scale uses a weighting process that requires a paired comparison task. The task requires the operator to choose which dimension is more relevant to workload for a particular task across all pairs of the six dimensions. The workload scale is obtained for each task by multiplying the weight by the individual dimension scale score, summing across scales, and dividing by the total weights (Hill et al., 1992). Generally, the NASA-TLX is an extremely good multidimensional scale for measuring mental workload (Byers, 1989; Hill et al., 1992). Hill et al. (1992) found that the TLX was well liked, sensitive to changes in workload, and had high diagnosticity. One drawback is the time needed to complete and analyse the test. Another drawback with the TLX scale, as with any other subjective scale, is consistency. Hankins & Wilson (1998) reported that the TLX ratings “lacked internal consistency from the effort and frustration levels reported to the performance scale.” NASA-RTLX or RNASA-TLX A different type of TLX scale was developed, called the NASA Raw Task Load Index (NASA RTLX). This scale was developed because the collection and analysis of the original TLX scale was cumbersome and labour intensive. The RTLX computes a score by taking the sum of the TLX test and dividing it by six. This new way to score the NASA-TLX was found to be almost equivalent to the original TLX scale R= .977 (p<10−6) (Byers, 1989), with far less time involved for analysis. In a driving situation, Park & Cha (1998) found that the RTLX scale was the more sensitive to mental demand and difficulty in driving than the TLX. Subjective Workload Assessment Technique (SWAT) The Subjective Workload Assessment Technique uses three levels – low, medium, and high – for each of the three dimensions of time load, mental load, and physiological stress load to assess workload (Hill et al., 1992). The SWAT technique scales the measurement scores to produce a single rating scale with interval properties (Hill et al., 1992). This multidimensional test uses three steps to complete and analyse workload. Hill et al. (1992) outlines the test in the following step method. The first step is scale development, which combines all the possible combinations of the three dimensions in 27 cards. The person sorts the cards into a ranking that reflects his or her perception of increasing workload. The rankings are used to develop a scale with interval properties. The second step is rating the workload. The third step is to convert the scores into a 0 to 100 scale using the scale developed in step one. The theory behind the SWAT technique is that it “(gains) insight into the mechanism of human information processing resources, together with the notion that it is possible to derive a model, by some rational procedure, that has greater validity than that of an arbitrarily chosen model” (Hendy et al., 1993). Rating Scale Mental Effort (RSME) The Rating Scale Mental Effort (RSME) scale is a unidimensional scale. “Ratings of invested effort are indicated by a cross on a continuous line. The line runs from 0 to 150 mm, and every 10 mm is indicated” (De Waard, 1996). This scale rates invested effort of the task, not explicitly mental effort. De Waard (1996) found the RSME could distinguish between the “task-load situation and baseline.” This does not seem to be a mainstream test because no other studies could be found that use the RSME to measure mental workload. The Activation scale is comparable to the RSME. “The scale has a range from 0 to 270 and is scored by measuring the distance from the origin to the mark in millimetres” (De Waard, 1996). The reference points are based on general tasks like “I am reading the newspaper” (De Waard, 1996). People mark their estimated workload, comparing it to the general tasks. The sensitivity and diagnosticity of this test is not documented. Driver Activity Load Index (DALI) The Driver Activity Load Index (DALI) (Pauzié, A. (2008) is related to the NASA-TLX. The Driving Load Activity Index (DALI) is a tool that enables the gathering of informative data about the mental workload for the driver. The procedure to set up DALI was to ask various experts involved in the

ADAS&ME (688900) D1.1-SoA & Benchrmarking
March 2017 Page 97 of 238 CERTH/HIT
driving tasks studies to define which were, in their opinion, the main factors inducing mental workload for people driving a vehicle equipped with an on-board system (car phone, driving aid systems, radio, etc.). This investigation led to the following definitions for the workload dimensions for the DALI: Effort of attention, Visual demand, Auditory demand, Temporal demand, Interference and Situational stress. Evaluation occurs on a 5-point rating scale (1: Low to 5: High). Subjective measurement of workload is good for determining how much workload a person “feels.” In the past, multi-dimensional measures were considered the best form of subjective measurement of workload. Recently, however, there is some evidence that unidimensional ratings of workload could be just as good as the multidimensional scales. For simple tasks, or while performing a task, a unidimensional rating scale is very good because it is fast, easy, and not distracting. The overall workload scale has been shown to be a good unidimensional rating scale. At the end of the test, it may be beneficial to use a multidimensional scale to gain a more exact estimate of workload.
4.1.3 Stress/ range anxiety
This section includes systems, sensors, algorithms and other instruments to measure stress and range anxiety. Range anxiety is addressed only in UC B and refers to the anxiety produced because the driver worries that the battery will run out of power before the destination or a suitable charging point is reached. Range anxiety is often cited as the most important reason why many are reluctant to buy electric cars. 4.1.3.1 In-vehicle systems/ sensors/algorithms
For this section, only range anxiety systems are presented and not for those related to driver’s stress monitoring in general. The systems and respective measures have been discussed in depth in the respective literature section (many of the studies focusses on systems). Product name – MIO ALPHA 2
Producer/ Manufacturer BioRICS Contact information / Website (URL) Technologielaan 3 3001 Heverlee Belgium: 016/395854 Email: [email protected] / URL: https://www.biorics.com/ Short description The Mio Alpha 2 has Bluetooth Smart 4.0 technology, allowing connecting with a smartphone (Android or iOS). It sends data of heart rate to apps on the smartphone. It can be used for stress monitoring and for physical work out programmes (it has 2-way communication). Images
Figure 33: MIO ALPHA 2 wearable device (source: BioRICS)
Technical specifications / requirements It has a rechargeable Li-ion battery. Battery life in workout mode is approx. 20hrs. ADAS&ME relevance (aspects covered): Measures heart rate and transfers output data. Can be used to address stress levels. Relevant to UCs C, D, E, G.

ADAS&ME (688900) D1.1-SoA & Benchrmarking
March 2017 Page 98 of 238 CERTH/HIT
Can be used for all types of drivers (truck, car and motorbikes). ADAS&ME irrelevance (aspects not covered): No automation involved/ no automated functions Price: €154.00 Product name – SLM@RACING VIDEO
Producer/ Manufacturer BioRICS & GetSpeed GmbH & Co. KG Contact information / Website (URL) BioRICS: Technologielaan 3 3001 Heverlee Belgium 016/395854 Email: N/A / URL: https://www.biorics.com/
GetSpeed GmbH: Gottlieb-Daimler-Straße 5 53520 Meuspath Tel:02691.9330334 Fax: 02691.9330335 Email: [email protected] / URL: https://www.GetSpeed.de/ Short description The driver wears an intelligent watch which measures body parameters and sends the data to a smartphone. Software on the smartphone calculates mental energy consumption of the driver and sends the stress level figure in real-time to the video- or data-logger. Driver’s stress levels can be visualised together with the other measured parameters in the interface of the system.
Images
Figure 34: Measurement box for 1 driver (source: BioRICS) Technical specifications / requirements The system consists of the SLM measurement hardware with the analysis software plus online support by the company’s engineers for integrating with user’s product. ADAS&ME relevance (aspects covered):
Very useful system to accurately and instantly examine driver’s stress levels. Relevant to most UCs C, D, E, G. ADAS&ME irrelevance (aspects not covered):
Cannot detect any other mental states. No automated functions. Price: N/A. Company requires an official inquiry to give offer.
Product name – PIP
Producer/ Manufacturer Galvanic Ltd Contact information / Website (URL)

ADAS&ME (688900) D1.1-SoA & Benchrmarking
March 2017 Page 99 of 238 CERTH/HIT
One Gateway, East Wall Road, Dublin 3, Ireland Email: [email protected] / URL: https://thepip.com/en-eu/ Short description Two gold-plated sensors—which the user grasps between the thumb and forefinger—detect stress-induced electrical fluctuations in the skin eight times per second. The device connects to a smartphone via Bluetooth, and the user has an option of several apps. One measures stress over a user-set period of time; another is a racing game where, counter-intuitively, the more the user relaxes the faster their character (in this case, a dragon) goes. Images
Figure 35: PIP Device (source: Calvanic Ltd) Technical specifications / requirements Pip comes with a suite of Apps which use changing stress levels to control their in-app progress, letting them visualize stress and try different techniques to learn to control it. Apps compatible with Smartphones and Tablets (iOS and Android). ADAS&ME relevance (aspects covered):
Device to measure stress levels. Relevant to UCs C, D, E, G. System is not bound to certain car manufacturing company. ADAS&ME irrelevance (aspects not covered): No automation involved/ no automated functions. Price: €179.00
Product name – Tinke
Producer/ Manufacturer Zenzorium Contact information / Website (URL) 3 Biopolis Drive, Synapse 03-17/18 Singapore 138623 +65 6467 7782 Email: support.zensorium.com / http://www.zensorium.com/ Short description A handheld unit plugs into the bottom of a smartphone. Optical sensors scan the thumb to measure heart rate and variability, respiratory rate, and blood oxygen. An app offers two options: Vita, which measures physical fitness based on heart and respiratory rates and blood oxygen, and Zen, which steps the user through a breathing exercise and measures stress levels based on heart rate variations. Images

ADAS&ME (688900) D1.1-SoA & Benchrmarking
March 2017 Page 100 of 238 CERTH/HIT
Figure 36: Tinke for ios and android devices (source: Zenzorium) Technical specifications / requirements
Figure 37: Tinke technical specifications (source: Zenzorium)
ADAS&ME relevance (aspects covered):
Determines driver’s stress levels. Relevant to UCs C, D, E, G. System is not bound to certain car manufacturing company. Can be used for all types of drivers (truck, car and motorbikes). ADAS&ME irrelevance (aspects not covered):
No automation involved/ no automated functions. Measurements might not be easy to be taken. Price: $119.00. It costs +$10 for compatibility with Android devices.

ADAS&ME (688900) D1.1-SoA & Benchrmarking
March 2017 Page 101 of 238 CERTH/HIT
Product name –Spire Breath and activity tracker
Producer/ Manufacturer Spire Contact information / Website (URL) 2030 Harrison Street San Francisco CA 94110, USA
+1 800 501 2256 Email: [email protected] / URL: https://spire.io/ Short description A wearable Bluetooth device clips to a waistband or other clothing, and proprietary sensors and algorithms measure breathing patterns. When the user is stressed, they breathe faster than normal; when they are calm, they usually breathe more deeply and slowly. Images
Figure 38: Spire device (source: Spire) Technical specifications / requirements Sensors include: • Patented respiration sensor • 3-axis accelerometer • Vibration motor Works with iOS and Android and integrates with Apple Health ADAS&ME relevance (aspects covered):
Tracks user activity measures stress. Relevant to UCs C, D, E, G. ADAS&ME irrelevance (aspects not covered): No automation involved/ no automated functions. Can be used only for vehicle drivers. Not suitable for riders. Price: $129.95 each unit. Product name – EMBRACE WATCH
Producer/ Manufacturer Empatica Contact information / Website (URL) 1 Broadway Cambridge, Massachusetts 02142 United States Email: [email protected] / URL: https://www.empatica.com/ Short description Embrace comes with an app called Mate. Mate combines events that the user enters manually with events that are detected by Embrace. Whether or not Embrace can detect seizures, Mate may help see how patterns of sleep, rest and activity interact with seizure events. The company is also working on a
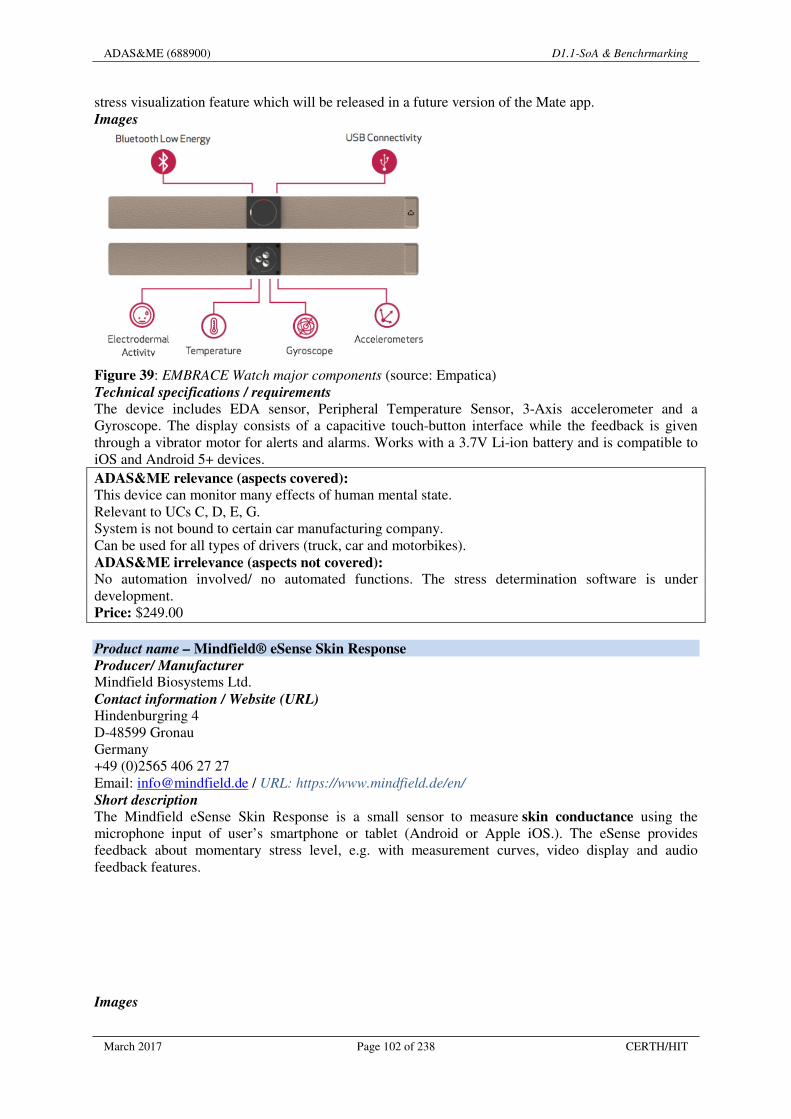
ADAS&ME (688900) D1.1-SoA & Benchrmarking
March 2017 Page 102 of 238 CERTH/HIT
stress visualization feature which will be released in a future version of the Mate app. Images
Figure 39: EMBRACE Watch major components (source: Empatica) Technical specifications / requirements The device includes EDA sensor, Peripheral Temperature Sensor, 3-Axis accelerometer and a Gyroscope. The display consists of a capacitive touch-button interface while the feedback is given through a vibrator motor for alerts and alarms. Works with a 3.7V Li-ion battery and is compatible to iOS and Android 5+ devices. ADAS&ME relevance (aspects covered):
This device can monitor many effects of human mental state. Relevant to UCs C, D, E, G. System is not bound to certain car manufacturing company. Can be used for all types of drivers (truck, car and motorbikes). ADAS&ME irrelevance (aspects not covered): No automation involved/ no automated functions. The stress determination software is under development. Price: $249.00
Product name – Mindfield® eSense Skin Response
Producer/ Manufacturer Mindfield Biosystems Ltd. Contact information / Website (URL) Hindenburgring 4 D-48599 Gronau Germany +49 (0)2565 406 27 27 Email: [email protected] / URL: https://www.mindfield.de/en/ Short description The Mindfield eSense Skin Response is a small sensor to measure skin conductance using the microphone input of user’s smartphone or tablet (Android or Apple iOS.). The eSense provides feedback about momentary stress level, e.g. with measurement curves, video display and audio feedback features.
Images

ADAS&ME (688900) D1.1-SoA & Benchrmarking
March 2017 Page 103 of 238 CERTH/HIT
Figure 40: eSense Skin Response (source: Mindfield Biosystems Ltd) Technical specifications / requirements
• Mindfield® eSense Skin Response Sensor • 2 velcro electrodes • Free app from Mindfield via the App Store or Google Play • Extensive instructions for effective biofeedback training.
ADAS&ME relevance (aspects covered):
Measures stress levels instantly. (Relevant to most UCs) System is not bound to certain car manufacturing company. Can be used for most kinds of drivers. ADAS&ME irrelevance (aspects not covered):
No automation involved/ no automated functions. Price: $89.00. The application that allows exporting the measured data via e-mail can be downloaded for free.
Product name – Stress Thermometer - SC911
Producer/ Manufacturer Stens Biofeedback – Stens Corporation Contact information / Website (URL) 3020 Kerner Blvd., Suite D San Rafael, CA 94901 1-800-257-8367 Email: [email protected] / URL: https://stens-biofeedback.com/ Short description The Stress Thermometer (SC911) monitors finger temperature with ease. Hand temperature ranges from 60º F to 99º F. The Stress Thermometer shows exactly what the stress level is down to 0.1 degree. So when worried and nervous = 74.5º F, Calm and easy going = 89.3º F, Dreamy, drifty relaxed = 96.8º F. Each person can measure their personal range of stress and relaxation. Images
Figure 41: SC911 Sensor (source: Stens corporation) Technical specifications / requirements

ADAS&ME (688900) D1.1-SoA & Benchrmarking
March 2017 Page 104 of 238 CERTH/HIT
• High Contrast LCD display, 3/4” high. • Displays temperature to the nearest 0.1. • Thermistor wire length - 10 ft. • Reads body & room temp. • 2 seconds temperature updates • Accuracy +/- 1.8° F, Displays Fahrenheit or Celsius • Digital Clock, Desktop stand. • Battery Life approximately one year. Battery included. • Unit size 2 3/4” inches L, 2 1/8” H, 5/8”W.
ADAS&ME relevance (aspects covered): Temperature is very important to address several physical and/or physiological states of human drivers, such as rest and stress condition. Relevant to UCs C, D, E, G. System is not bound to certain car manufacturing company. Can be used for vehicle drivers (truck, car and motorbikes). ADAS&ME irrelevance (aspects not covered):
No automation involved/ no automated functions. Has limited range of temperature functionality. Riders cannot use such device. Price: $21.95
Product name – Neumitra
Producer/ Manufacturer Neumitra Contact information / Website (URL) 86 South Street #2A, Boston, MA 02111 Email: [email protected] / URL: https://neumitra.com/ Short description Neumitra is a technology and research company which builds biological biomodules, algorithms and provides respective analytics specifically for stress conditions. Images
Figure 42: Neumitra (source: Neumitra) Technical specifications / requirements Their mobile software enhances understanding of physiological data from biomodules by incorporating it with daily life contexts. Personal insights are automatically generated on smartphones by showing how events, locations, and activities are associated with the continuous physiology of stress, rest, and activity. Algorithms use physiological and statistical models to explain acute and chronic stress. ADAS&ME relevance (aspects covered):
Can provide software and algorithms to specifically state driver’s stress levels. Relevant to UCs C, D, E, G. System is not bound to certain car manufacturing company. Can be used for all types of drivers (truck, car and motorbikes). ADAS&ME irrelevance (aspects not covered):
No automation involved/ no automated functions. The research is under process in order to become marketable.

ADAS&ME (688900) D1.1-SoA & Benchrmarking
March 2017 Page 105 of 238 CERTH/HIT
Price: N/A. Some modules may be for sale on demand.
Product name – NeuroSkyLab
Producer/ Manufacturer NeuroSky, Inc. Contact information / Website (URL) 25 S Market St – #900 San Jose, CA 95113 (408) 200-6675
Email: [email protected] / URL: http://neurosky.com/ Short description NeuroSkyLab is used by EEG researchers who are familiar with the MATLAB environment, providing more customization and real-time data viewing and analysis. Images
Figure 43: Neuroskylab environment (source: NeuroSky) Technical specifications / requirements NeuroSkyLab is currently only working with older MATLAB, version 7.0(R14/2004). The new MATLAB, v7.14(R2012a) and v8.4(R2014b), requires the Toshiba driver. If user paired headset with Microsoft BT driver, the headset can't connect. The Research Tools do not include any hardware. These tools are compatible with Windows XP / Vista / 7/8/8.1/10. The Research Tools are recommended for use with the MindWave and MindWave Mobile. ADAS&ME relevance (aspects covered):
Very useful software to collect and analyse EEG driver’s data from other devices and wearables. Relevant to UCs C, D, E, G. System is not bound to certain car manufacturing company. Can be used for all types of drivers (truck, car and motorbikes). Can combine data from multiple devices. ADAS&ME irrelevance (aspects not covered): Can monitor and analyse data received but does not provide feedback for certain mental states. Price: $499. Comes together with NeuroView tool. Range anxiety
Product name - ReVive range calculator (UC B) Mahindra Rive Ltd has developed an application to reduce ‘range anxiety’ for the users of electric vehicles. The driver can activate an invisible fuel tank via phone (sending a text message) and then access to small charge is granted (i.e., a 15 km range is granted from a hidden reserve0. This has been used as a strategy to address range anxiety.

ADAS&ME (688900) D1.1-SoA & Benchrmarking
March 2017 Page 106 of 238 CERTH/HIT
Figure 44: In car range calculator Figure 45: Phone activation of small charge
Product name - Range assurance
Producer/ Manufacturer Tesla Motors. Contact information / Website (URL) Sales Toll free: (888) 51-TESLA or (888) 518-3752 Local: (650) 681-5100 Fax: (650) 681-5101 [email protected] [email protected] Tech Support & Roadside Assistance Toll free: (877) 79-TESLA or (877) 798-3752 Local Service Centre: (844) 248-3752 Phone numbers for other countries [email protected] Safety recall information URLs: https://www.tesla.com/blog/model-s-has-you-covered http://www.autoevolution.com/news/tesla-updates-model-s-with-range-assurance-and-trip-planner-auto-steering-will-follow-93477.html# https://www.youtube.com/watch?v=mOYXaBHArP0 https://www.tesla.com Short description The Range Assurance application is running in the background even when navigation is not in use. In real-time, it communicates with the network of Tesla Superchargers and destination chargers, discarding any that are in heavy use or inactive and warns you before you drive out of range. The navigation system then shows a map of the most convenient charging locations and guides you to the closest one. Moreover, it factors in height changes, like having to climb over a mountain pass, and looks up weather and wind speed from the Internet to determine range with accuracy. Images
Figure 46: Tesla range assistance

ADAS&ME (688900) D1.1-SoA & Benchrmarking
March 2017 Page 107 of 238 CERTH/HIT
Technical specifications / requirements
• System runs in the background (even when navigation is switched off); • Communicates with charging stations; • Warns the driver if battery is running low; • Elevation and driving style are incorporated in range estimation.
ADAS&ME relevance (aspects covered):
Relevant to UC B; Constantly monitors range status and closest charging opportunities; The driver is warned and informed about closest charging opportunities. ADAS&ME irrelevance (aspects not covered):
The technology is manufacturer specific It addresses charging stress but the car does not take control (i.e. no automated function) Price: Vehicle implemented. No stand-alone price. Product name - Range assurance
Producer/ Manufacturer BMW Contact information / Website (URL) http://www.bmw.com/com/en/insights/corporation/bmwi/connecteddrive.html
Short description Within the centrepiece of BMW rests i Navigation the Range Assistant with dynamic range map, which takes into account all factors that are important for route navigation: battery charge level, driving style, traffic conditions and topographic nature of the route. Using BMW ConnectedDrive Real Time Traffic Information, the ECO ROUTE is optimised on BMW servers. The calculation incorporates a traffic prediction, and the most efficient route is estimated in real time. The nearest available charging station is displayed at all times. BMW i Navigation also takes into account public transport connections via the Intermodal Routing service, displays up-to-date timetables, and guides you to a free parking space near the stop in question.
The BMW i Remote App for iOS and Android shows detailed information on the current status of BMW i – e.g., car location, range, and battery charge level, service messages, and information on whether the doors are locked and the lights are off. The charging process can be initiated remotely, using the weekly timer. The dynamic range map is also integrated into the BMW i Remote App. Destinations (points of interest, PoIs) and locations of charging stations can be sent easily from the application directly to the car. The BMW i Remote App also measures the efficiency of each journey in a BMW i model and gives helpful tips on how to drive the car more efficiently and extend the range. The efficiency value of each journey can be anonymously shared with others and compared. Images
Figure 47: Range assistance (BMW

ADAS&ME (688900) D1.1-SoA & Benchrmarking
March 2017 Page 108 of 238 CERTH/HIT
Technical specifications / requirements
• Implemented in the navigation system • Closest charging station is displayed at all times • Incorporates relevant info on battery charge level, driving style, traffic conditions and
topographic nature of the route • ECO ROUTE included which displays most efficient route • ECO PRO function • ECO driving advice
ADAS&ME relevance (aspects covered: Relevance to UCB; Constantly monitors range status and closest charging opportunities; The driver is warned and informed about closest charging opportunities. ADAS&ME irrelevance (aspects not covered): No automated function Price: Vehicle implemented technology, no stand-alone price.
4.1.4 Rest condition
This sub-section includes systems and wearables that can identify and measure the resting phase of a driver. These are commercial products that actually –in most cases – are used to measure the activity or fitness level. However, they can be used to detect when someone is physically resting and not when they are mentally resting. Product name – Fitbit Charge 2
Producer/ Manufacturer Fitbit Contact information / Website (URL) 405 HOWARD STREET SUITE 550 SAN FRANCISCO, CA 94105 +1 877-623-4997 Email: N/A / URL: https://www.fitbit.com/ Short description The wearable tracks heart rate continuously on the wrist. Introducing Cardio Fitness Level, a new feature on Fitbit Charge 2 that allows seeing a snapshot of user’s fitness level using a personalized Cardio Fitness Score. Viewable in the heart rate section of the Fitbit app, the score is an estimation of their VO2 Max (the maximum amount of oxygen your body can use when you’re working out at your hardest). Fitbit automatically provides them with a Cardio Fitness Level in the app using their resting heart rate and user profile. Images
Figure 48: Measuring Heart Rate (source: Fitbit)

ADAS&ME (688900) D1.1-SoA & Benchrmarking
March 2017 Page 109 of 238 CERTH/HIT
Technical specifications / requirements Gives continuous heart rate and simplifies heart rate zones by measuring automatically wrist-based pulses. Using Bluetooth LE wireless technology, Fitbit Charge 2 sends smartphone notifications and syncs automatically to computers and 200+ leading iOS, Android and Windows devices. Certain features like smartphone notifications or Connected GPS may require Android 5.0+. ADAS&ME relevance (aspects covered):
Once a normal resting heart rate for each individual has been established, it becomes easy to determine his physiological state and rest condition. (Relevant to UCA) System is not bound to certain car manufacturing company. Can be used for all types of drivers (truck, car and motorbikes). ADAS&ME irrelevance (aspects not covered): No automation involved/ no automated functions Price: €159.95 Product name – Instant Heart Rate
Producer/ Manufacturer Azumio Inc Contact information / Website (URL) 230 S California Avenue Suite 212 Palo Alto, CA Email: [email protected] / URL: http://www.azumio.com/ Short description Measures heart rate by placing the finger gently over the camera of the mobile device. The camera picks up the changes in blood flow by tracking colour changes in the light that passes through the finger, corresponding to each beat of the heart. After a few seconds it can determine the current heart rate, shown on the phone's display. This technique is the same as used in the medical field with pulse oximeters. Images
Figure 49: Display of Heart Rate (source: Azumio inc) Technical specifications / requirements This App works best on devices with a camera flash, as the light source is used to shine the light though the finger tissue. Otherwise, it can still be used in good lighting conditions. Can work on iOS, Android or Windows operating system devices. ADAS&ME relevance (aspects covered):
Provides a quick measurement of rest condition. (Relevant to (relevant to UCA) System is not bound to certain car manufacturing company.

ADAS&ME (688900) D1.1-SoA & Benchrmarking
March 2017 Page 110 of 238 CERTH/HIT
ADAS&ME irrelevance (aspects not covered):
No automation involved/ no automated functions Price: Android: free to download, iOS: $4.99, Windows: $1.99
Product name – Fitmate Pro
Producer/ Manufacturer Cosmed Contact information / Website (URL) Via dei Piani di Mt. Savello 37 Albano Laziale - Rome 00041, Italy +39 (06) 931-5492 / (06) 888-0241 Fax: +39 (06) 931-4580 (fax) Email: [email protected] / URL: http://www.cosmed.it/ Short description The Fitmate PRO proposes an approach for the measurement of Oxygen consumption in both clinical and athletic exercise testing. Images
Figure 50: Cardio Pulmonary Exercise Test (source: Cosmed) Technical specifications / requirements Fitmate PRO is a one of a range of desktop devices with battery charging, a large LCD screen and inbuilt printer that allows testing without a computer or mains power lead. Fitmate PRO manages test results and stores all information inside its internal memory, ready for upload to PC software (included). Fitmate PRO measures VO2max, calculates sub-max VO2, measures Resting Metabolic Rate and provides additional features like the calculation of heart rate Training Zones (using the client’s unique relationship between oxygen consumption and HR). ADAS&ME relevance (aspects covered):
Can be used as an alternative method to measure driver’s rest condition System is not bound to certain car manufacturing company. Relevant to UCA. ADAS&ME irrelevance (aspects not covered): No automation involved/ no automated functions. Difficulties in usage. Price: N/A
Product name – Polar A360
Producer/ Manufacturer Polar Electro Oy Contact information / Website (URL) Headquarters: Kempele, Finland Greece: Voriou Ipirou 76, Ano Glufada Athens 165 62

ADAS&ME (688900) D1.1-SoA & Benchrmarking
March 2017 Page 111 of 238 CERTH/HIT
Tel. +30-210 9690592 - 4 Fax +30-210 9690595 Email: [email protected] / URL: https://www.polar.com/el Short description Polar A360 is a fitness tracker monitors sleep quality, steps, distance, calories burned and any activity. Users can check their daily activity goal and get practical guidance if they need a little extra help to reach it. Shows current heart rate and what heart rate zone they are in, Users can set their own targets or favourites to aim for. Images
Figure 51: Specifications of the product (source: Polar Electro) Technical specifications / requirements Easy wireless sync via Bluetooth® Smart with the Polar Flow app Micro USB connector for charging and data sync with PC or Mac via Polar FlowSync Compatible with: - Computer running Mac OS X10.6 or later and Windows XP, 7, 8, 10 - Mobile phones running iOS7 or later and Android 4.3 or later - Polar Balance smart scale - Polar H7 heart rate sensor - Apple Health Kit, Google Fit, MyFitnessPal (iOS users) and MapMyFitness UI languages: English, Spanish, Portuguese, French, Danish, Dutch, Swedish, Norwegian, German, Italian, Finnish, Polish, Russian, Chinese (simplified), Japanese. ADAS&ME relevance (aspects covered):
Handy and instant measurement of heart rates. Relevant to UCA System is not bound to certain car manufacturing company. Can be used for all types of drivers (truck, car and motorbikes). ADAS&ME irrelevance (aspects not covered):
No automation involved/ no automated functions Price: €199.90
Product name –Vivosmart HR
Producer/ Manufacturer Garmin Ltd Contact information / Website (URL) Headquarters: Schaffhausen, Switzerland Greece: Digital Tracer Electronics S.A. L. Posidonos 10, Alimos Athens 174 55 +30 210-9840144 Email: N/A / URL: https://www.garmin.gr/ Short description Smart Activity Tracker with Wrist-based Heart Rate plus GPS
• GPS tracks distance and pace while mapping out run or walk • Measures steps, distance, calories, floors climbed, activity intensity and heart rate on the wrist

ADAS&ME (688900) D1.1-SoA & Benchrmarking
March 2017 Page 112 of 238 CERTH/HIT
• Smart notifications, which includes email, call, text, social media alerts • Auto sync to Garmin Connect™ Mobile to join fitness challenges, review data and receive
smart coaching Images
Figure 52: Vivosmart HR wearable device (source: garmin ltd) Technical specifications / requirements Works with a rechargeable lithium battery. Includes the following features:
• Clock • Sensors (GPS, accelerometer, barometric altimeter, etc.) • Daily Smart (smart notifications, weather..) • Activity Tracking (Step counter, move bar, intensity, etc.) • Training, Planning and Analysis Features • Heart Rate (HR zones, HR alerts, HR calories) • Running • Cycling • Garmin Connect
ADAS&ME relevance (aspects covered):
Tracks user activity and measures heart rates. Can be used for all types of drivers (truck, car and motorbikes). Relevant to UCA. ADAS&ME irrelevance (aspects not covered):
No automation involved/ no automated functions Price: €219.00
Product name – MPOWER POD
Producer/ Manufacturer Fibrux Oy Contact information / Website (URL) Teknologiantie 4A 90590 Oulu, Finland +358 40 543 0974 Email: [email protected] / URL: http://www.mpower-bestrong.com/ Short description Mpower is based on sEMG signal analysis, which gives information about muscle activation. Furthermore, the technology enables the measurement of fast and slow muscle fibers and detection of fatigue. When muscles are activated, they produce electrical signal called EMG. Mpower uses a technology called surface EMS (sEMG) to measure and analyse muscle behaviour during training. EMG (electromyography) consists of electrical signals of nerves and muscles controlling the
contraction of the muscles • EMG can be measured non-invasively with special electrodes placed on the skin overlying the muscle(s) of interest (i.e. surface EMG, sEMG)

ADAS&ME (688900) D1.1-SoA & Benchrmarking
March 2017 Page 113 of 238 CERTH/HIT
• sEMG technology has enabled the use of sEMG signal for medical and sports physiology related muscle performance analysis sEMG signal contains useful information about • Activation level of the muscle • Activation levels of specific types of muscle cells • Muscle fatigue • Timing of muscle activation(s) in relation to movement Images
Figure 53: Pod attached to any muscle (source: Fibrux Oy) Technical specifications / requirements The Mpower pod is attached to the skin surface over any muscle to measure EMG-signal as the muscle response to the training exercises. The Mpower pod transmits the measurement data to the Mpower app for further analysis. ADAS&ME relevance (aspects covered):
Rest condition can be determined by monitoring muscle activity. Relevant to UCA. System is not bound to certain car manufacturing company. Can be used for all types of drivers (truck, car and motorbikes). ADAS&ME irrelevance (aspects not covered):
No automation involved/ no automated functions Price: N/A. Given only by request
Product name –Pulso Ox
Producer/ Manufacturer Withings Contact information / Website (URL) Withings SAS 2 rue Maurice Hartmann 92130 Issy-les-Moulineaux FRANCE Email: N/A / URL: https://www.withings.com/ Short description The Withings Pulse O2 captures heart rate and uses a pulse oximeter to measure the optional oxygen saturation (SPO2):
• Track steps, running, calories burned, elevation & distance • Measure heart rate & blood oxygen level with a touch • Analyses night & sleep cycles
Images

ADAS&ME (688900) D1.1-SoA & Benchrmarking
March 2017 Page 114 of 238 CERTH/HIT
Figure 54: Pulse Ox devise (source: Withings) Technical specifications / requirements iOS compatibility (iOS7 or higher) iPhone (4 and above) iPod touch (4th generation or higher) iPad (3rd generation or higher) Android compatibility (4.0 or higher) Requires a Bluetooth Low Energy device Bluetooth connectivity (4.0 wireless technology) Compatible with Bluetooth 2.0 or higher Power source 2 week average use between charges Charging via provided power cable micro USB standard Built-in Lithium-ion polymer battery ADAS&ME relevance (aspects covered):
A device used to establish the state of the driver (relevant to most UCs) System is not bound to certain car manufacturing company. Can be used for most kinds of drivers. ADAS&ME irrelevance (aspects not covered): No automation involved/ no automated functions Price: $99.95
Product name – MAX30205
Producer/ Manufacturer Maxim Integrated Contact information / Website (URL) 160 Rio Robles San Jose, CA 95134 USA 408-601-1000 + 353 (0) 1 223 5500 Email: [email protected]/ URL: https://www.maximintegrated.com/ Short description The MAX30205 temperature sensor measures temperature and provide an over temperature alarm/interrupt/shutdown output. This device converts the temperature measurements to digital form using a high-resolution, sigma-delta, analog-to-digital converter (ADC). It includes clinical thermometry specification of the ASTM E1112 when soldered on the final PCB. Communication is through an I2C-compatible 2-wire serial interface. The MAX30205 evaluation kit (EV kit) provides a way to evaluate the MAX30205 human body temperature sensor. The sensor uses a high resolution, sigma-delta, analog-to-digital converter to accurately measure temperature and convert it to digital form. The kit includes a USB-to-I2C controller and GUI program to simplify evaluation. Images
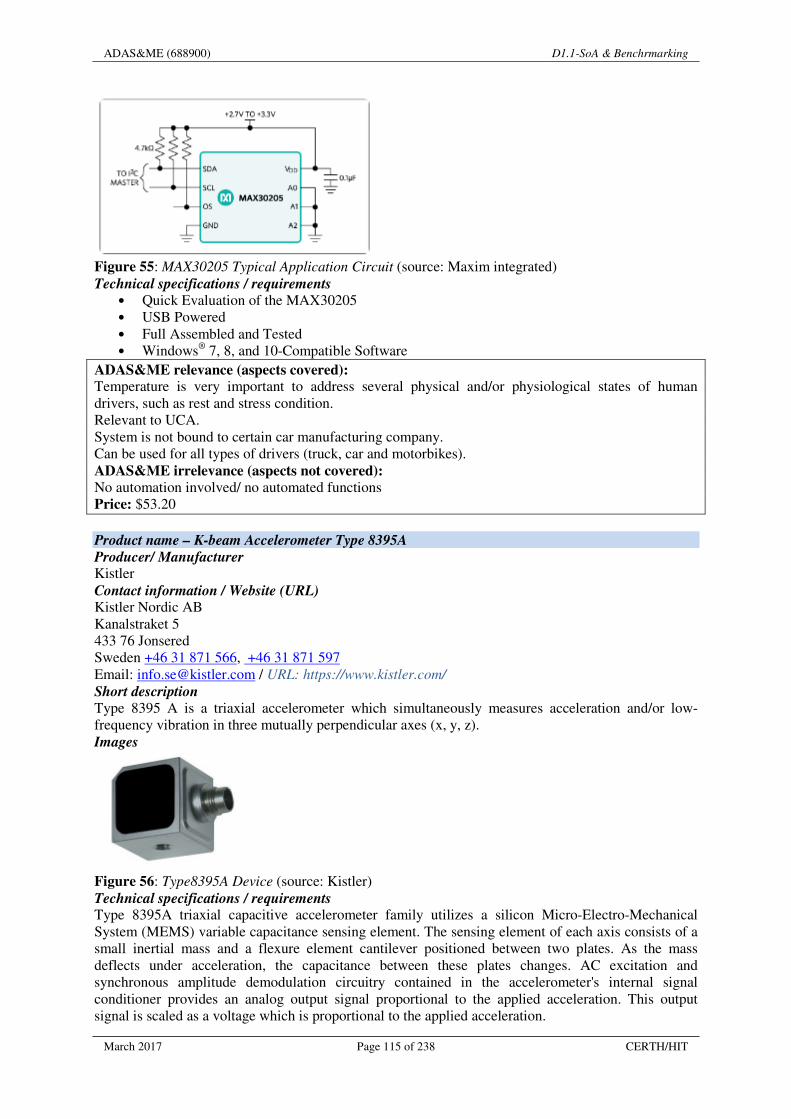
ADAS&ME (688900) D1.1-SoA & Benchrmarking
March 2017 Page 115 of 238 CERTH/HIT
Figure 55: MAX30205 Typical Application Circuit (source: Maxim integrated) Technical specifications / requirements
• Quick Evaluation of the MAX30205 • USB Powered • Full Assembled and Tested • Windows® 7, 8, and 10-Compatible Software
ADAS&ME relevance (aspects covered): Temperature is very important to address several physical and/or physiological states of human drivers, such as rest and stress condition. Relevant to UCA. System is not bound to certain car manufacturing company. Can be used for all types of drivers (truck, car and motorbikes). ADAS&ME irrelevance (aspects not covered):
No automation involved/ no automated functions Price: $53.20
Product name – K-beam Accelerometer Type 8395A
Producer/ Manufacturer Kistler Contact information / Website (URL) Kistler Nordic AB Kanalstraket 5 433 76 Jonsered Sweden +46 31 871 566, +46 31 871 597 Email: [email protected] / URL: https://www.kistler.com/ Short description Type 8395 A is a triaxial accelerometer which simultaneously measures acceleration and/or low-frequency vibration in three mutually perpendicular axes (x, y, z). Images
Figure 56: Type8395A Device (source: Kistler) Technical specifications / requirements Type 8395A triaxial capacitive accelerometer family utilizes a silicon Micro-Electro-Mechanical System (MEMS) variable capacitance sensing element. The sensing element of each axis consists of a small inertial mass and a flexure element cantilever positioned between two plates. As the mass deflects under acceleration, the capacitance between these plates changes. AC excitation and synchronous amplitude demodulation circuitry contained in the accelerometer's internal signal conditioner provides an analog output signal proportional to the applied acceleration. This output signal is scaled as a voltage which is proportional to the applied acceleration.

ADAS&ME (688900) D1.1-SoA & Benchrmarking
March 2017 Page 116 of 238 CERTH/HIT
ADAS&ME relevance (aspects covered):
Accurate accelerometer can monitor drivers’ activity and movements. Relevant to UCA. System is not bound to certain car manufacturing company. Can be used for all types of drivers (truck, car and motorbikes). ADAS&ME irrelevance (aspects not covered):
No automation involved/ no automated functions Price: N/A Product name – Lumo MotionSciencePlatform
Producer/ Manufacturer Lumo Bodytech Contact information / Website (URL) 201 San Antonio Circle Suite #135 Mountain View, CA 94040 United States (877) 702-7866 Email: [email protected] / URL: http://www.lumobodytech.com/ Short description Wearables platform offers access to algorithm models that can track multiple movements and has various applications. For example, the Lumo Back sensor and algorithms can be used for lifting compliance products to promote healthy lifting of heavy objects, or similarly, the Lumo Run sensor can be applied to other sports biomechanics like cycling or golf. The platform offers access to multiple layers of data and flexible architecture of algorithms, cloud and data storage, and even hardware development to fit the specific needs and goals of the partners to make the integration of Lumo technology as seamless as possible. Images
Figure 57: The Lumo Platform (source: Lumo Bodytech) Technical specifications / requirements Wearables platform is a technology stack that includes hardware, software, and unique algorithms to cloud data and storage services. ADAS&ME relevance (aspects covered):
All data collected from wearables and smartphones connected to the cloud can be analysed and using appropriate algorithms identify human activities. These data can be combined from multiple sources and drivers. Relevant to UCA. System is not bound to certain car manufacturing company. Can be used for all types of drivers (truck, car and motorbikes). Can combine data from multiple drivers. ADAS&ME irrelevance (aspects not covered):
Only an activity data can be collected and transferred. Price: Not available yet. Platform is under development.

ADAS&ME (688900) D1.1-SoA & Benchrmarking
March 2017 Page 117 of 238 CERTH/HIT
4.1.5 Emotions
This section includes systems that are not detecting or monitoring fatigue, sleepiness, distraction and range anxiety. These aspects are covered in the driver monitoring systems’ section, as they are systems that have been commercialised for many years. Emotions are the psychological experiences of an individual’s state of mind influencing the person’s concentration by interacting with internal and external influences (e.g., joy, angry, fear, sadness, aware, accepted, rejected, surprised). Emotion recognition nowadays largely depends on facial recognition system, speech patterns, galvanic skin response (GSR) measurements, temperature and heart rate variability. 4.1.5.1 In-vehicle systems/ sensors/algorithms
The systems discussed in this section are mostly based on existing literature and prototypes that do not actually represent mature products in the market yet. They are added in this section to demonstrate the future concepts and implementation prospects.
Product name - Project Mobii
Producer/ Manufacturer Joint project of Ford and Intel Contact information / Website (URL) www.corporate.ford.com. conflictfree.intel.com. Short description Joint research between Ford and Intel explores new applications for interior cameras, using data from existing vehicle sensors to enhance the in-vehicle experience for drivers and passengers. As vehicles become an integral part of the Internet of Things, Ford and Intel are researching new opportunities for the connected car, including giving drivers the ability to remotely peer into their car using a smartphone, or a vehicle that could identify its owner using facial recognition software. The joint research project, called Mobile Interior Imaging, or Project Mobii, explores how interior-facing cameras could be integrated with sensor technology and data already generated within and around the vehicle, to create a more personalized and seamless interaction between driver and vehicle, that transforms the driving experience. Upon entering the vehicle, the driver is authenticated by Project Mobii through a front-facing camera, using facial software recognition. The in-car experience is then personalized, to display information specific to that driver, such as calendar, music and contacts. If Project Mobii does not recognize the driver, a photo is sent to the primary vehicle owner’s smartphone. That owner can then set permissions and specify features that should be enabled or disabled. If the driver is the child of the vehicle owner, for example, restrictions could be automatically set to require safety belt use and to limit speed, audio volume or mobile phone use while driving. A combination of natural gestures and simple voice commands is used in such tasks as turning the heat up and down, or opening and closing a sunroof while driving. Just like smart keys, this recognition software will adjust the car’s settings to whoever is driving. It can automatically adjust the music volume, driver’s seat position, vehicle speed, and so on. Drivers will also be able to adjust climate, sunroof, and other options by using voice commands, allowing the driver to pay more attention to the road. Images
Figure 58: Driver authentication via facial recognition (Project Mobii)

ADAS&ME (688900) D1.1-SoA & Benchrmarking
March 2017 Page 118 of 238 CERTH/HIT
(Source: http://laurenfix.com/article/facial-recognition-vehicle/)
Figure 59: Facial recognition camera (left) and Mobii system informs owner that does not recognise
driver (right)
(Source: https://media.ford.com/content/fordmedia/fna/us/en/news/2014/06/25/ford-and-intel-research-demonstrates-the-future-of-in-car-person.html)
Technical specifications / requirements • Mobile Interior Imaging, also known as Project Mobii, uses facial recognition software to
offer enhanced privacy controls, and a more secure and personalized in-vehicle experience • A mobile phone app enables a driver to remotely access the vehicle, allowing for a quick
check of belongings left inside or authorizing/declining other drivers to operate the vehicle • Uses exterior vehicle cameras for driver-assist features, such as lane-keeping assist and lane
departure warning.
ADAS&ME relevance (aspects covered):
Relevant to UC A, C, D (and generally to authentication of professional drivers and the handover of automated functions). Facial recognition can be extended from driver status and identification to identifying the affective state of the driver and it might be one of the most promising types of technologies for identifying more complex emotions (e.g., surprise, anger, combinations of emotional states). Incorporates external driving assist technologies (i.e., lane assist). Secondary gesture recognition and interaction might be interested for personalized complex (or combinations) of affective states (e.g. anger in a driver can be identified with combination of facial feature recognition and gestures). This system in progress has been considered here for its future potential for affective state recognition and monitoring. ADAS&ME irrelevance (aspects not covered):
Not an existing commercial product, thus, cannot be used in the project. Focus is solely on driver identification. No automation is involved or automated functions, only driver assistance. Price: The use of interior imaging is purely research at this point; however, the insights to be gained will turn into vehicle implemented technologies in the future.
Product name – Toyota FV2 concept
Producer/ Manufacturer Toyota Motor Contact information / Website (URL) https://www.toyota-europe.com/world-of-toyota/concept-cars/fv2
Short description Using both voice and image recognition to determine the driver’s mood, the car will accumulate driving history to suggest driving routes and even determine the driver’s skill level to assist in driving technique. In doing so, the FV2 will develop a bond with the driver and grow in knowledge with them over time.

ADAS&ME (688900)
March 2017
Images
Figure 60: The FY2 will connect with other vehicles and the infrastructure (left) and emotionally bond
with the driver (right) cars/fv2#/youtube/JLGuUyzyteQ)
Technical specifications / requirementsNot available yet. ADAS&ME relevance (aspects covered)
Relevant to UCs A, C, D. Emotion recognition through combination of systems and variables (e.g.experiences); Communication with infrastructure (relevant for specific Use Cases).ADAS&ME irrelevance (aspects not covered)Not clear if automation will be involved;A holistic approach in driver/vehicle communication;Still a concept; does not constitute benchmark material but the ideainteresting. Price: Not yet relevant/ it will be a whole vehicle;
Product name - EmoVu
Producer/ Manufacturer Eyeris Technologies Contact information / Website (URL)
530 Lytton Ave, Palo Alto, CA 94301 Phone: 650-262-7900 Email: info [at] eyeristech.com
Short description A facial expression recognition methodology imitates human vision and allows prototypic expressions directly from the face instead of relying on decomposed action units.The methodology computes both shape and texture informationvariant uncontrolled environments. Images
Figure 61: Emotion recognition system specification and parameters
Technical specifications / requirements
D1.1
Page 119 of 238
The FY2 will connect with other vehicles and the infrastructure (left) and emotionally bond
(source: https://www.toyota-europe.com/worldcars/fv2#/youtube/JLGuUyzyteQ)
specifications / requirements
ADAS&ME relevance (aspects covered):
Emotion recognition through combination of systems and variables (e.g., facial, speech, gesture, past
infrastructure (relevant for specific Use Cases). ADAS&ME irrelevance (aspects not covered): Not clear if automation will be involved; A holistic approach in driver/vehicle communication; Still a concept; does not constitute benchmark material but the ideas behind the concept are
ant/ it will be a whole vehicle; integrated system, not a stand-alone.
Contact information / Website (URL)
Email: info [at] eyeristech.com / URL: http://emovu.com/e/
A facial expression recognition methodology imitates human vision and allows anressions directly from the face instead of relying on decomposed action units.
he methodology computes both shape and texture information, which results in accuracy under variant uncontrolled environments.
Emotion recognition system specification and parameters (source: Eyeris Technologies)
Technical specifications / requirements
D1.1-SoA & Benchrmarking
CERTH/HIT
The FY2 will connect with other vehicles and the infrastructure (left) and emotionally bond
europe.com/world-of-toyota/concept-
facial, speech, gesture, past
s behind the concept are
alone.
an algorithm to learn ressions directly from the face instead of relying on decomposed action units.
which results in accuracy under
(source: Eyeris Technologies)

ADAS&ME (688900) D1.1-SoA & Benchrmarking
March 2017 Page 120 of 238 CERTH/HIT
A tiny camera mounted in a dashboard and connected to the company’s EmoVu software continually scans the driver’s face, monitoring facial expressions, head position, and how open the driver’s eyes are. It can also detect signs of exhaustion, such as eyes rolling downward or backward, according to Alaoui. The EmoVu software was created using a deep learning algorithm to train a convolutional neural network (CNN) to measure joy, surprise, sadness, disgust, fear, and anger. It is currently being tested by OEM’s. ADAS&ME relevance (aspects covered):
Emotion recognition (relevant to UCs A, C, and D); System is not bound to certain car manufacturing company. ADAS&ME irrelevance (aspects not covered): No automation involved/ no automated functions; Not yet available in market; Price: Not available yet. Will be released in 2017.
Product name - EQ-Radio: Emotion Recognition using Wireless Signals
Producer/ Manufacturer Computer Science & Artificial Intelligence Laboratory Massachusetts Institute of Technology (MIT) Contact information / Website (URL) Mingmin Zhao Fadel Adib Dina Katabi
URL: http://eqradio.csail.mit.edu/
Short description EQ-Radio is a new technology that can infer a person’s emotions using wireless signals. It transmits an RF signal and analyses its reflections off a person’s body to recognize his/her emotional state (happy, sad, etc.). The key enabler underlying EQ-Radio is a new algorithm for extracting the individual heartbeats from the wireless signal at accuracy comparable to on-body ECG monitors. Images
Figure 62: EQ-radio system (source: http://eqradio.csail.mit.edu/)
ADAS&ME relevance (aspects covered): Easy to implement and potentially non-obtrusive for driver to detect and identify emotions; Related to UCs A, C, D; Is not bound to a certain type of vehicle. ADAS&ME irrelevance (aspects not covered): Not commercial available yet (not clear if and when it will be); Not related to any automated function; No HMI for interaction; Not related to automotive industry. Price: Not known yet.

ADAS&ME (688900) D1.1-SoA & Benchrmarking
March 2017 Page 121 of 238 CERTH/HIT
Product name – Empatica Emprace watch (user) and E4 wristband (researcher)
Producer/ Manufacturer Empatica is an affective computing company, focused on human data analytics. They develop wearable devices with medical quality sensing.
Contact information / Website (URL) Via Stendhal, 36 Milano, MI 20144, Italy URL: https://www.empatica.com/
Short description An Embrace watch was designed, in order to detect and prevent seizures, but has many more applications. It monitors sleep, physical activity, autonomic stress and arousal (stress monitoring coming soon). The device tells time and keeps tabs on metrics, like physical activity and sleep. But the Embrace goes one step further, measuring its wearer’s stress levels by tracking something called electrodermal activity (EDA). EDA is essentially a measurement of the skin’s conductance; as humans get excited or stressed, the amount of sweat on their skin fluctuates. The Embrace’s sensors are able to track little changes in skin conductance and communicate via vibrations when the wearer is experiencing higher than normal levels of stress. Images
Figure 63: Embrace for user – sensors (source: https://www.empatica.com/product-embrace)
Technical specifications / requirements
Embrace for user Activity Monitoring -The Embrace collects your physiological data not only during exercise, but also at work, during your commute, during the night. Data Analysis - Your data is analysed in real-time to give you feedback. Data Clustering - The Empatica system analyses historical data and interactions with your Embrace. In the future this will help you to discover patterns in your daily habits and behaviour. Personalized Insight - Visualise summarized data with various granularity to better understand your day. E4 embrace for researcher Although, this is not directly targeting emotion recognition and detection, it gathers data that can be used to indirectly measure changes in emotional state/valence.
Figure 64: E4 Emprace sensors with real-time monitoring of physiological signs (source: https://www.empatica.com/e4-wristband)

ADAS&ME (688900) D1.1-SoA & Benchrmarking
March 2017 Page 122 of 238 CERTH/HIT
ADAS&ME relevance (aspects covered):
Monitoring of activity, stress, and other physiological parameters useful for the investigation of other considered affective states (i.e., relevant to all UCs); Non-obtrusive technology (especially for riders); Existing commercial product; Real-time data monitoring (especially useful for trials); Developer’s API and accompanying software. ADAS&ME irrelevance (aspects not covered):
No automation involved; No vehicle related; Price: Embrace watch: 240 Euros, E4: 1,660 Euros
4.1.5.2 Algorithms and APIs
Lately there has been a movement on emotional intelligence and emotional recognition. There’s a lot of API-accessible software online that parallels the human ability to discern emotive gestures. These algorithms driven APIs use facial detection and semantic analysis to interpret mood from photos, videos, text, and speech. Today exist over 20 Facial Detection APIs that Recognize Mood.
These computer vision APIs use facial detection, eye tracking, and specific facial position cues to determine a subject’s mood. There are many APIs that scan an image or video to detect faces, but these go the extra mile to spit back an emotive state. This is often a combination of weight assigned to 7 basic emotions, and valence — the subject’s overall sentiment. These tools reviewed in this section are relevant to Use Cases A, C, and D.
Emotient Emotient aims to track attention, engagement, and sentiment from viewers. The RESTful Emotient Web API can be integrated into apps, or used to help power AB testing. In addition to the API, there’s an account analytics panel.
Figure 65: Emotient interface
Affectiva With 3,289,274 faces analysed to date, Affectiva is a solution for massive scale engagement detection. They offer SDKs and APIs for mobile developers, and provide visual analytics to track expressions over time.
EmoVu

ADAS&ME (688900)
March 2017
Produced by Eyeris, EmoVu facial detection products incorporate machine learning and micro expression detection that allow an agency to “accurately measure their content’s emotional engagement and effectiveness on their target audience.” an API for fine grained control, EmoVu offers wide platform support, including many tracking features, like head position, tilt, eye tracking, eye open/close, and more. They offer a free demo with account creation. It is also mentioned earlier in this section; here
Nviso Switzerland-based Nviso specializes in emotion video analytics, using 3D facial imaging tech to monitor many different facial data points to produce likelihoods for 7 main emotions. Though no free demo is offered, Nviso claims to provide afor smarter computing in 2013 by IB
Figure 66: Graphical representation of expressed emotions
Kairos The Emotion Analysis API by Kairosand on-demand, you send them video, and they send back coordinates that detect smiles, surprise, anger, dislike and drowsiness. They offer aand graph your facial responses to a few commercial ads.Recognition API , Crowd Analytics SDKwent live.
Project Oxford by Microsoft Microsoft’s Project Oxford is a catalogue ofspeech, and language analysis.
Figure 67: Nordic APIs founders Travis Spencer and Andreas Krohn
The API only works with photos. It detects faces, and responds in JSON with specific percentages for each face using the core 7 emotions
D1.1
Page 123 of 238
facial detection products incorporate machine learning and micro expression detection that allow an agency to “accurately measure their content’s emotional engagement and effectiveness on their target audience.” With a Desktop SDK, Mobile SDK, and
for fine grained control, EmoVu offers wide platform support, including many tracking features, like head position, tilt, eye tracking, eye open/close, and more. They offer a free demo with
tioned earlier in this section; here the API is presented.
specializes in emotion video analytics, using 3D facial imaging tech to facial data points to produce likelihoods for 7 main emotions. Though no free
demo is offered, Nviso claims to provide a real-time imaging API. They have a reputation, awarded for smarter computing in 2013 by IBM.
Graphical representation of expressed emotions (EmoVu)
Kairos is a more SaaS-y startup in the facial detection arena. Scalable demand, you send them video, and they send back coordinates that detect smiles, surprise,
anger, dislike and drowsiness. They offer a Free Demo (no account setup required)and graph your facial responses to a few commercial ads. It supports with documentation
Crowd Analytics SDK, and Reporting API. The Emotion Analysis API
is a catalogue of artificial intelligence APIs focused on computer vision,
Nordic APIs founders Travis Spencer and Andreas Krohn – 99% happy
The API only works with photos. It detects faces, and responds in JSON with specific percentages for core 7 emotions, and Neutral. Without the decimals this could be a very simple
D1.1-SoA & Benchrmarking
CERTH/HIT
facial detection products incorporate machine learning and micro expression detection that allow an agency to “accurately measure their content’s emotional
With a Desktop SDK, Mobile SDK, and for fine grained control, EmoVu offers wide platform support, including many tracking
features, like head position, tilt, eye tracking, eye open/close, and more. They offer a free demo with the API is presented.
specializes in emotion video analytics, using 3D facial imaging tech to facial data points to produce likelihoods for 7 main emotions. Though no free
. They have a reputation, awarded
startup in the facial detection arena. Scalable demand, you send them video, and they send back coordinates that detect smiles, surprise,
p required), that will analyse documentation for its Face
Emotion Analysis API just recently
APIs focused on computer vision,
99% happy
The API only works with photos. It detects faces, and responds in JSON with specific percentages for ould be a very simple
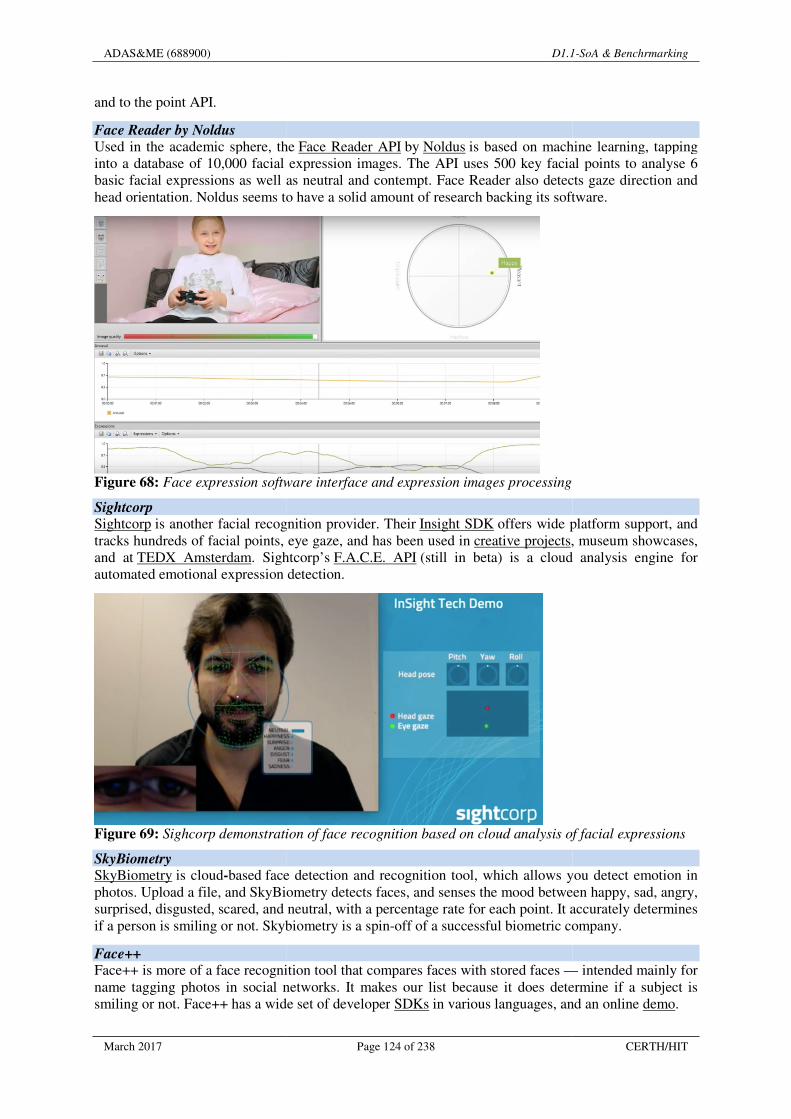
ADAS&ME (688900)
March 2017
and to the point API.
Face Reader by Noldus Used in the academic sphere, theinto a database of 10,000 facial expression images. The API uses 500 key facial points to basic facial expressions as well as neutral and contempt. Face Reader also detects gaze direction and head orientation. Noldus seems to have a solid amount of research backing its software.
Figure 68: Face expression software interface and expression images processing
Sightcorp Sightcorp is another facial recognition provider. Theirtracks hundreds of facial points, eye gaze, and has been used inand at TEDX Amsterdam. Sightcorp’sautomated emotional expression detection.
Figure 69: Sighcorp demonstration
SkyBiometry SkyBiometry is cloud-based face detection and recognition toolphotos. Upload a file, and SkyBiometry detects faces, and senses the mood between happy, sad, angry, surprised, disgusted, scared, and neutral, with a percentage rate for each point. It accurately determines if a person is smiling or not. Skybiometry is a spin
Face++ Face++ is more of a face recognitionname tagging photos in social networks. It makes our list because ismiling or not. Face++ has a wide set of developer
D1.1
Page 124 of 238
Used in the academic sphere, the Face Reader API by Noldus is based on machine learning, tapping into a database of 10,000 facial expression images. The API uses 500 key facial points to basic facial expressions as well as neutral and contempt. Face Reader also detects gaze direction and head orientation. Noldus seems to have a solid amount of research backing its software.
software interface and expression images processing
is another facial recognition provider. Their Insight SDK offers wide platform support, and hundreds of facial points, eye gaze, and has been used in creative projects, museum showcases,
. Sightcorp’s F.A.C.E. API (still in beta) is a cloud analysis engine for automated emotional expression detection.
Sighcorp demonstration of face recognition based on cloud analysis of facial expressions
face detection and recognition tool, which allows you detect emotion in photos. Upload a file, and SkyBiometry detects faces, and senses the mood between happy, sad, angry, surprised, disgusted, scared, and neutral, with a percentage rate for each point. It accurately determines
g or not. Skybiometry is a spin-off of a successful biometric company.
face recognition tool that compares faces with stored faces —name tagging photos in social networks. It makes our list because it does determine if a subject is smiling or not. Face++ has a wide set of developer SDKs in various languages, and an online
D1.1-SoA & Benchrmarking
CERTH/HIT
is based on machine learning, tapping into a database of 10,000 facial expression images. The API uses 500 key facial points to analyse 6 basic facial expressions as well as neutral and contempt. Face Reader also detects gaze direction and head orientation. Noldus seems to have a solid amount of research backing its software.
offers wide platform support, and , museum showcases,
cloud analysis engine for
face recognition based on cloud analysis of facial expressions
which allows you detect emotion in photos. Upload a file, and SkyBiometry detects faces, and senses the mood between happy, sad, angry, surprised, disgusted, scared, and neutral, with a percentage rate for each point. It accurately determines
a successful biometric company.
— intended mainly for t does determine if a subject is
in various languages, and an online demo.

ADAS&ME (688900)
March 2017
Figure 70: Smile recognition with Face++
Imotions Imotions is a biometrics research platform that provides software types of bodily cues. Imotions syncs with Emotient’s facial expression technology, and adds extra layers to detect confusion and frustration. Thevalence, or can aggregate previously recorded videos to analysbeen used by Harvard, Procter & Gamble, Yale, the US Air Force, and was even used in a Mythbusters episode.
Figure 71: Imotions detects different types of bodily cues based on layers
CrowdEmotion CrowdEmotion offers an API that uses facial recognition to detectemotions, as defined by Psychologistsadness). Their online demo will analysvisualizations. They offer an API sandbox, along with free monthly usage for live testing.
Figure 72: Analysis of face points in real
D1.1
Page 125 of 238
Smile recognition with Face++
is a biometrics research platform that provides software and hardware for monitoring many types of bodily cues. Imotions syncs with Emotient’s facial expression technology, and adds extra layers to detect confusion and frustration. The Imotions API can monitor video live fe
iously recorded videos to analyse for emotions. Imotion software has been used by Harvard, Procter & Gamble, Yale, the US Air Force, and was even used in
Imotions detects different types of bodily cues based on layers
API that uses facial recognition to detect the time series of the six universal as defined by Psychologist Paul Ekman (happiness, surprise, anger, disgust, fear and
will analyse facial points in real-time video, and respond with detailed They offer an API sandbox, along with free monthly usage for live testing.
Analysis of face points in real-time video (CrowdEmotion)
D1.1-SoA & Benchrmarking
CERTH/HIT
and hardware for monitoring many types of bodily cues. Imotions syncs with Emotient’s facial expression technology, and adds extra
can monitor video live feeds to extract e for emotions. Imotion software has
been used by Harvard, Procter & Gamble, Yale, the US Air Force, and was even used in
the time series of the six universal (happiness, surprise, anger, disgust, fear and
time video, and respond with detailed They offer an API sandbox, along with free monthly usage for live testing.

ADAS&ME (688900)
March 2017
FacioMetrics Founded at Carnegie Mellon University (CMU),incorporating face tracking, pose and gaze tracking, and expression analysis into apps. Theirvideo outlines some creative use cases in virtual reality scenarios. The software can be testedthe Intraface iOS app.
Figure 73: Faciometrics expression analysis
4.1.5.3 Speech to Emotion Software
Lastly, humans also interact with machines via speech. There are plenty ofthe market, whose results could be this is why an easy-to-consume web APIrare.
Good Vibrations The Good Vibrations API senses mood from recorded voice. Thebiological signals to perform a real time analysis of the user’s emotion to sense stress, pleasure, or disorder. They’re not really web APIs, butallows call centres to analyse emotion, andrecorded voice.
Vokaturi Vokaturi software purportedly can “understand the emotion in a speaker’s voice in the same way a human can.” With the Open Vokaturi SDKdatabase of speech recordings, the Vokaturi software will compute percent likelihoods for 5 emotive states: neutrality, happiness, sadness, anger, and fear. They provide code samples for working in C and Python.
4.1.6 Environmental sensing technologies
Vehicle-highway information systems research. Sensors mounted on vehicles are usually used in order to improve the identification of surrounding environment. They are often supported by other systems (e.g. control and information processing units). This section includes products and sensors that can bincrease environmental awareness. Product name – Stereo video camera Driver assistance systems
Producer/ Manufacturer Bosch Mobility Solutions Contact information / Website (URL)Robert Bosch GmbH Bosch Service Centre Postfach 30 02 20
D1.1
Page 126 of 238
Founded at Carnegie Mellon University (CMU), FacioMetrics is a company that provides SDKs for pose and gaze tracking, and expression analysis into apps. Their
outlines some creative use cases in virtual reality scenarios. The software can be tested
Faciometrics expression analysis
Speech to Emotion Software
Lastly, humans also interact with machines via speech. There are plenty of speech recognition APIsthe market, whose results could be processed by other sentiment analysis APIs listed above. Perhaps
consume web API, that instantly recognizes emotion from recorded voice
enses mood from recorded voice. The API and SDKbiological signals to perform a real time analysis of the user’s emotion to sense stress, pleasure, or
They’re not really web APIs, but EMOSpeech is an enterprise software application the emotion, and Audeering software detects emotion, tone, and gender in
software purportedly can “understand the emotion in a speaker’s voice in the same way a Open Vokaturi SDK, developers can integrate Vokaturi into
database of speech recordings, the Vokaturi software will compute percent likelihoods for 5 emotive states: neutrality, happiness, sadness, anger, and fear. They provide code samples for working in C and
sensing technologies
highway information systems are among the highlights of intelligent transportation system Sensors mounted on vehicles are usually used in order to improve the identification of
surrounding environment. They are often supported by other systems (e.g. control and information processing units). This section includes products and sensors that can be mounted to vehicles to increase environmental awareness.
Stereo video camera Driver assistance systems - Road sign assistant
Contact information / Website (URL)
D1.1-SoA & Benchrmarking
CERTH/HIT
is a company that provides SDKs for pose and gaze tracking, and expression analysis into apps. Their demo
outlines some creative use cases in virtual reality scenarios. The software can be tested using
speech recognition APIs on processed by other sentiment analysis APIs listed above. Perhaps
that instantly recognizes emotion from recorded voice, is
API and SDK use universal biological signals to perform a real time analysis of the user’s emotion to sense stress, pleasure, or
is an enterprise software application that software detects emotion, tone, and gender in
software purportedly can “understand the emotion in a speaker’s voice in the same way a turi into their apps. Given a
database of speech recordings, the Vokaturi software will compute percent likelihoods for 5 emotive states: neutrality, happiness, sadness, anger, and fear. They provide code samples for working in C and
intelligent transportation system Sensors mounted on vehicles are usually used in order to improve the identification of
surrounding environment. They are often supported by other systems (e.g. control and information e mounted to vehicles to
Road sign assistant

ADAS&ME (688900) D1.1-SoA & Benchrmarking
March 2017 Page 127 of 238 CERTH/HIT
70442 Stuttgart Germany +49 (0)711 400 40990 Email: N/A / URL: http://products.bosch-mobility-solutions.com/en/ Short description With the stereo camera, Bosch offers a scalable platform that combines the established functions of a mono camera with the benefits of the three-dimensional (3D) environment detection offered by stereo technology. Its range of functions can be adapted to customer requirements on a large scale. Images
Figure 74: Can detect and display road sign in the vehicle dashboard (source: Bosch Mobility Solutions)
Technical specifications / requirements The stereo camera's two CMOS (complementary metal oxide semiconductor) colour imagers have a resolution of 1,280 x 960 pixels. Using a powerful lens system, the camera records a horizontal field of view of 50 degrees and offers a 3-D measurement range of more than 50 meters. ADAS&ME relevance (aspects covered):
Can display or directly assist automated driving system to recognize road signs. The three-dimensional recording of the vehicle’s surroundings also provides the basis for the automated driving functions. Relevant to UCs C and D. ADAS&ME irrelevance (aspects not covered): System probably cannot integrate into motorbikes. Price: N/A Product name – MPC577xK
Producer/ Manufacturer NXP® Semiconductors N.V Contact information / Website (URL) NXP Semiconductors Netherlands B.V. High Tech Campus 60 5656 AG Eindhoven The Netherlands Tel: +33 (0)1 82 88 48 40 Email: N/A / URL: http://www.nxp.com/ Short description Ultra-Reliable MPC577xK MCU for Automotive ADAS & Industrial Radar Applications. The MPC577xK family can be used without additional external components to the MCU, that are typically used in existing radar systems, such as an FPGA, ADC, DAC and SRAM thus reducing the overall number of components within the system, the size of the PCB and the complexity of software. The MPC577xK MCU family when combined with the MR2001 77 GHz packaged radar front-end chipset offers a system level radar solution for ADAS applications such as adaptive cruise control, emergency braking systems and blind-spot detection, as well as industrial applications.

ADAS&ME (688900) D1.1-SoA & Benchrmarking
March 2017 Page 128 of 238 CERTH/HIT
Images
Figure 75: MPC5xxx 32-bit MCU for ADAS Applications (source: NXP® Semiconductors) Technical specifications / requirements The MPC577xK family of 32-bit MCUs, built on Power Architecture® technology, provides digital and analog integration and performance within one chip for next-generation radar-based advanced driver assistance systems (ADAS) and industrial applications. Radar processing platform:
• Signal processing toolbox (SPT): FFT accelerator, DMA • ADC Input: 8 x SD – 10 MHz, 4x 12-bit SAR -1 MHz • DAC: 2Ms/s 8-bit DAC
ADAS&ME relevance (aspects covered):
Millimetre Wave Radar detects what is around the car. Acting as the "eyes" of the car, it enables the measuring of aspects such as the distance from other cars to a high degree of accuracy. Can manage and direct vehicle’s automated functions (relevant to UCs C and D). ADAS&ME irrelevance (aspects not covered): Cannot monitor other aspects than moving vehicles. Price: N/A.
Product name – Optical Fog Sensor - OFS
Producer/ Manufacturer Optical Sensors Contact information / Website (URL) Sten Löfving Optical sensors Stora Badhusgatan 18 Hiss 4 Våning 2 SE-411 21 Gothenburg, Sweden Tel: +46(0)31 711 2535 Email: [email protected] / http://www.opticalsensors.se/ Short description OFSMk2 is a sensor for visibility. The power consumption is advocated to be low. The main application is for traffic purposes. Using so called backscatter technique it measures the amount of water particles i e fog in the air that limit the visibility. The sensor is used at different places for different applications. The sensor is microprocessor controlled making possible some features like RS232 output giving: a) the calculated visibility in meters and b) measured ambient light etc. The raw signal V is analog and it is a measure of the amount of backscattered light from the overlap zone. So the more fog in the overlap zone the more signal.
Images

ADAS&ME (688900) D1.1-SoA & Benchrmarking
March 2017 Page 129 of 238 CERTH/HIT
Figure 76: Sensor’s principle (source: Optical Sensors) Technical specifications / requirements The microprocessor also controls the analog output giving the visibility directly (VIS =1 km gives 1 Volt, and VIS = 500 meters gives 0.5 Volt etc.). If the visibility is larger than 5000 meters the analog output will saturate at 5 Volts. This output is also updated every 60 seconds. During the first minute of operation after switch-on the signal on the analog output will therefore be zero.
Dimensions: 120*120*90 mm, Weight: about 1kg, Warm up time: about 1 minute, Current consumption: 200 mA from a 12 Volt ( 11-15) supply (without heating about 60 mA), Outputs: RS232 2400 baud 8N1, analog 0-5 Volt, optional switch that changes state at 1000 meters visibility, Temp. range: -20 to +50 deg C, Laser output power: less than 5 mW. Laser safety class: 3R, Laser wavelength: 650nm, Housing: IP 65 aluminium box, openings sealed with O-rings, Visibility range: visibility shorter than 10 km - down to 20 meters.
ADAS&ME relevance (aspects covered):
Determine visibility ahead of the vehicle (relevant to UCs C and D). System is not bound to certain car manufacturing company. ADAS&ME irrelevance (aspects not covered): No automation involved/ no automated functions. Measurements might not be easy to be taken. Difficult to be installed on motorbikes. Price: $119.00. It costs +$10 for compatibility with Android devices.
Product name – Condition Patrol DSP310
Producer/ Manufacturer Vaisala Corporation Contact information / Website (URL) P.O. Box 26, FI-00421 Helsinki, Finland Tel: +358 989 491 Email: [email protected] / URL: http://www.vaisala.com/ Short description Vaisala Condition Patrol is a mobile weather station. Offers weather data and ways to collect and view the information. The Condition Patrol provides the following mobile measurements:
• Road Condition (Dry, Moist, Wet, Snow, Ice) • Surface Temperature • Grip (Slipperiness) • Dew Point Temperature • Air Temperature • Humidity • Layer Thicknesses
Images

ADAS&ME (688900) D1.1-SoA & Benchrmarking
March 2017 Page 130 of 238 CERTH/HIT
Figure 77: Overview of the system (source: Vaisala Corporation) Technical specifications / requirements The Vaisala Condition Patrol DSP310 is a solution available to road weather maintenance professionals. The Condition Patrol uses technology to provide decision makers with a complete mobile weather solution to monitor their road network. The system collects the data and displays it on a smart phone on the dashboard of the vehicle.
ADAS&ME relevance (aspects covered):
Monitoring vehicle’s surrounding weather environment. It can give details for temperature and special road condition, such as ice or low friction surfaces (relevant to UCs C and D). ADAS&ME irrelevance (aspects not covered): No automation involved/ no automated functions. Price: N/A.
Product name – First Sensor - MEMS inertial sensor
Producer/ Manufacturer First Sensor AG Contact information / Website (URL) Peter-Behrens-Straße 15 12459 Berlin T +49 30 6399 2399 F +49 30 6399 2333 Email: [email protected] / URL: https://www.first-sensor.com/en Short description The capacitive inclinometers and accelerometers are based on single crystal silicon sensor elements and utilize micromachining technology to achieve large signal-to noise ratios and stability over temperature. Therefore, they are advocated to be able to detect extremely small changes in inclination or acceleration.
Images
Figure 78: MEMS inertial sensor (source: FirstSensor) Technical specifications / requirements

ADAS&ME (688900) D1.1-SoA & Benchrmarking
March 2017 Page 131 of 238 CERTH/HIT
All inertial sensors are customizable and can be adapted or developed to fit specific requirements or applications. The inertial sensors are packaged in a tailored ceramic housing with 28 pins, that is similar to a standard LCC28 package (11.4x11.4x2.0 mm) ADAS&ME relevance (aspects covered):
This device can monitor tilts and acceleration of the vehicle. System can monitor changes in motorbikes and hence extract useful data of the road or environment (road pavement inclinations and cracks, changes in stability because of wind, etc.) (relevant to UCs C and D). ADAS&ME irrelevance (aspects not covered): No automation involved/ no automated functions. Not useful for other vehicles than motorbikes. Price: N/A.
Product name – HDL-32E
Producer/ Manufacturer Velodyne LiDAR, Inc. Contact information / Website (URL) 345 Digital Drive, Morgan Hill, CA 95037 USA Tel:408.465.2800,408.465.299 Email: [email protected] / URL: http://velodynelidar.com/
Short description The HDL-32E LiDAR sensor is small built and features 32 lasers across a 40° vertical field of view. The HDL-32E measures only 5.7" high x 3.4" in diameter, weighs less than two kilograms and was designed to be used for autonomous navigation, 3D mobile mapping and other LiDAR applications. Images
Figure 79: LiDAR scanner (source: Velodyne LiDAR Inc) Technical specifications / requirements
• ± 10° Vertical FoV • Dual Returns • 16 Channels • 100 m Range • 300,000 Points per Second • 360° Horizontal FOV • Low Power Consumption • Protective Design • Connectors: RJ45 / M12
ADAS&ME relevance (aspects covered):
Road mapping and environmental sensing through LIDAR technology Can be used in different vehicle types (relevant to UCs C and D). ADAS&ME irrelevance (aspects not covered): Maybe be difficult to implement to motorbikes. Price: N/A

ADAS&ME (688900) D1.1-SoA & Benchrmarking
March 2017 Page 132 of 238 CERTH/HIT
Product name – MobileEyeSystem
Producer/ Manufacturer Mobileeye Contact information / Website (URL) 1350 Broadway New York, NY 10018 Tel: 1-877-867-4900 Fax: 1-516-467-1366 Email: N/A / URL: http://www.mobileye.com/ Short description Mobileye uses an artificial vision sensor that views the road ahead and identifies vehicles, pedestrians and cyclists in the vehicle’s path. The high-resolution vision sensor is a toll-tag sized black box that mounts on the inside windshield, where it’s able to communicate with the EyeWatch™ visual display (also located inside the cab). Using audible and visual alerts for an array of different hazards, the system sends a warning to a-read display for the driver if corrective action needs to be taken. Images
Figure 80: Look through the lense of the Mobileye system (source: Mobileye) Technical specifications / requirements For enhanced analysis, aggregated data can be exported to a third-party telematics or fleet management systems, providing visibility of your fleet and insights into driver behaviour. This is a real-time solution. All alerts are available via the Mobileye CAN channel for telematics and third-party integrators. ADAS&ME relevance (aspects covered): Alternative system to identify the environment. It does include automation (relevant to UCs C and D). ADAS&ME irrelevance (aspects not covered):
Cannot be used for Motorbike drivers. Price: N/A Product name – MB8450 Car
Producer/ Manufacturer MaxBotix Inc. Contact information / Website (URL) 13860 Shawkia Drive Brainerd, MN 56401 Phone: 00-1-218-454-0766 Fax: 00-1-218-454-0768 Email: [email protected] / URL: http://www.maxbotix.com/ Short description The MB8450 Car Detection Sensor is a USB ultrasonic proximity sensor designed to detect the side of a vehicle that drives up alongside the sensor. The MB8450 Car Detection Sensor features a

ADAS&ME (688900) D1.1-SoA & Benchrmarking
March 2017 Page 133 of 238 CERTH/HIT
simultaneous multi-sensor design which allows the sensor to operate in the presence of other ultrasonic sensors. Images
Figure 81: MB8450 Car Detection Sensor (source: MaxBotix Inc.) Technical specifications / requirements Users can integrate many sensors into one system. The MB8450 Car Detection Sensor offers a controlled beam that is designed to reject small objects (clutter) outside of the central beam area without detecting frivolous or unwanted targets. The MB8450 Car Detection Sensor automatically calibrates to its environment after power up, before taking the first reading. Because this power up calibration only occurs on power up, it is recommended that users power off and then on the sensor when temperature or humidity conditions change. ADAS&ME relevance (aspects covered):
Ultrasonic sensor which detects moving objects very close to a vehicle. System is not bound to certain car manufacturing company. Can be used for all kind of vehicles (truck, car and motorbikes) (relevant to UCs C and D). ADAS&ME irrelevance (aspects not covered): No automation involved/ no automated functions. Price: $89.95
Product name – NovAtel CORRECT
Producer/ Manufacturer NovAtel Inc. Contact information / Website (URL) 1120 - 68th Avenue N.E. Calgary, Alberta, Canada T2E 8S5 1-800-668-2835
Email: [email protected] / URL: http://www.novatel.com/ Short description NovAtel CORRECT is the positioning algorithm on NovAtel's GNSS receivers that handles corrections from a variety of sources, including RTK, PPP, SBAS and DGPS. The user selects the preferred method of correction (Figure 82). Images
Figure 82: Preferred correction method (source: NovAtel)
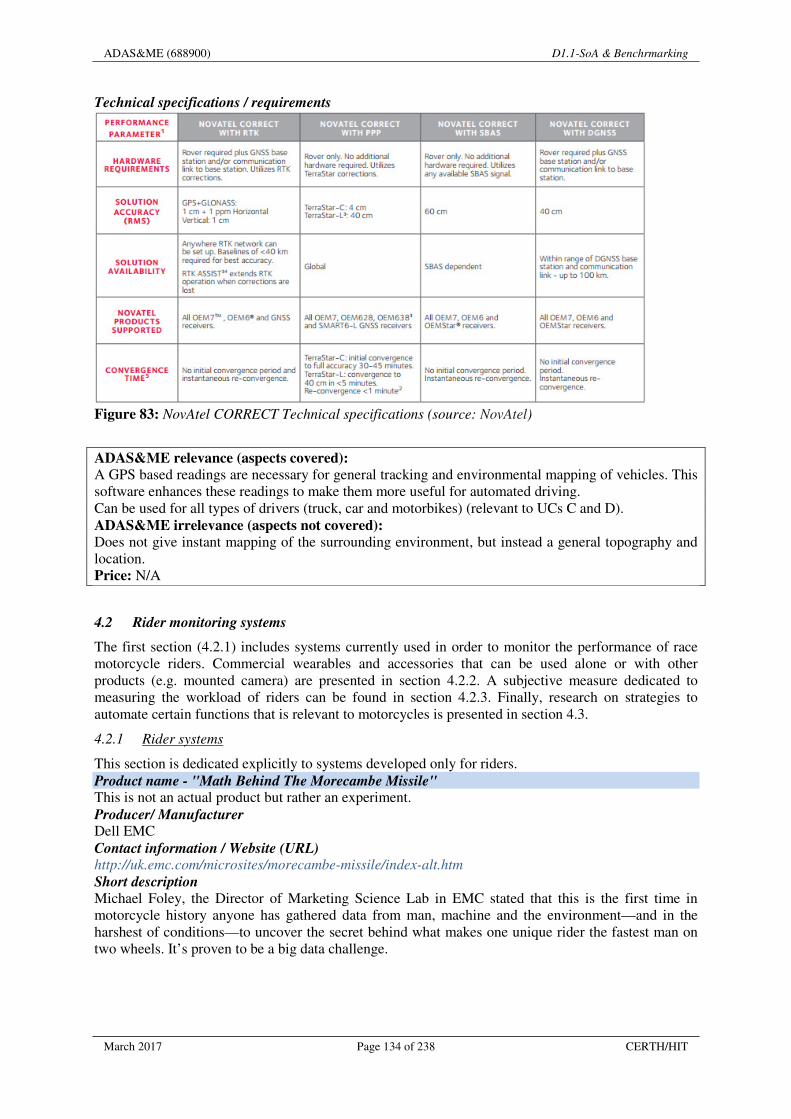
ADAS&ME (688900) D1.1-SoA & Benchrmarking
March 2017 Page 134 of 238 CERTH/HIT
Technical specifications / requirements
Figure 83: NovAtel CORRECT Technical specifications (source: NovAtel)
ADAS&ME relevance (aspects covered):
A GPS based readings are necessary for general tracking and environmental mapping of vehicles. This software enhances these readings to make them more useful for automated driving. Can be used for all types of drivers (truck, car and motorbikes) (relevant to UCs C and D). ADAS&ME irrelevance (aspects not covered):
Does not give instant mapping of the surrounding environment, but instead a general topography and location. Price: N/A
4.2 Rider monitoring systems
The first section (4.2.1) includes systems currently used in order to monitor the performance of race motorcycle riders. Commercial wearables and accessories that can be used alone or with other products (e.g. mounted camera) are presented in section 4.2.2. A subjective measure dedicated to measuring the workload of riders can be found in section 4.2.3. Finally, research on strategies to automate certain functions that is relevant to motorcycles is presented in section 4.3.
4.2.1 Rider systems
This section is dedicated explicitly to systems developed only for riders. Product name - "Math Behind The Morecambe Missile" This is not an actual product but rather an experiment. Producer/ Manufacturer Dell EMC Contact information / Website (URL) http://uk.emc.com/microsites/morecambe-missile/index-alt.htm
Short description Michael Foley, the Director of Marketing Science Lab in EMC stated that this is the first time in motorcycle history anyone has gathered data from man, machine and the environment—and in the harshest of conditions—to uncover the secret behind what makes one unique rider the fastest man on two wheels. It’s proven to be a big data challenge.

ADAS&ME (688900)
March 2017
Images
Figure 84: Rider (left) and bike (right)
Technical specifications / requirementsAll variables shown in Figure 84Human: Heart rate, time/ duration, breathing rate, calories consumption.Human-machine: Latitude, longitude, gyroscope, accelerometer.Machine (bike): GPS location, distancNo information on measuring units / system was found. ADAS&ME relevance (aspects covered)
Relevant UCs E and F. One of the first experiment regarding the recording and correlation of phywith the performance of the rider. ADAS&ME irrelevance (aspects not covered)
Physical behaviour: only heart rate/breathing ratePsychological behaviour: No Price: - Product name – WIKO IMU is a device that monitors physical activityhow the athlete performs the physical activity and in return, improving hissmart analysis of the information at individual and collective level.Some existing application areas are shown in
Producer/ Manufacturer
D1.1
Page 135 of 238
Rider (left) and bike (right) variables collected
Technical specifications / requirements 84 are collected. In particular, the variables collected are
Heart rate, time/ duration, breathing rate, calories consumption. Latitude, longitude, gyroscope, accelerometer.
GPS location, distance, RPM, speed, gear, gear speed, yaw, banking angle.No information on measuring units / system was found. ADAS&ME relevance (aspects covered):
One of the first experiment regarding the recording and correlation of physical behaviour of the rider with the performance of the rider.
AS&ME irrelevance (aspects not covered):
Physical behaviour: only heart rate/breathing rate;
IMU is a device that monitors physical activity, providing a constant-flow of data in real time about w the athlete performs the physical activity and in return, improving his/her performance through a
smart analysis of the information at individual and collective level. Some existing application areas are shown in Figure 85 below:
Figure 85: WIKO application areas
D1.1-SoA & Benchrmarking
CERTH/HIT
are collected. In particular, the variables collected are:
, yaw, banking angle.
sical behaviour of the rider
flow of data in real time about performance through a

ADAS&ME (688900) D1.1-SoA & Benchrmarking
March 2017 Page 136 of 238 CERTH/HIT
RealTrack System
Contact information / Website (URL) http://www.realtracksystems.com/index.php?lang=en
Short description Wimu is a smart device, designed to give control over workouts. It has a user "push and record" technology and it also collects data from external devices. Monitors physical activity; providing a constant-flow of data in real time about how the athlete performs the physical activity and in return, improving his/her performance, through a smart analysis of the information at individual and collective level. Cinematic variables such as acceleration, speed, crossed distance or physiological ones such as heart rate, impacts, among others; and tactical variables, are collected by Wimu sensors and then displayed by Qüiko and Wisee, the software provided with the device. There is a potential to be transferred/used in the case of a motorcycle rider. Images
Figure 86: Wise product
Technical specifications / requirements Qüiko is a horizontal tool that offers the possibility to process and analyse the different sensors from several Wimus device and any other sensors you could connect (using ANT+ technology); • Stored data playback; • Data export: XML, EXCEL, HTML, TXT, etc.
ADAS&ME relevance (aspects covered):
Relevant UCs E and F. Provides a constant-flow of data in real time about how the rider performs the physical activity and in return, improving his/her performance through a smart analysis of the information at individual and collective level. ADAS&ME irrelevance (aspects not covered): Physical behaviour: only heart rate; Psychological behaviour: No. Price: 1,633 € Product name - NO PRODUCT NAME, it was an experiment
Producer/ Manufacturer DAINESE / MEDIASET Contact information / Website (URL)

ADAS&ME (688900) D1.1-SoA & Benchrmarking
March 2017 Page 137 of 238 CERTH/HIT
http://www.sportmediaset.mediaset.it/video/superbike/biaggi-il-battito-onboard_69679-2015.shtml Short description Recording the heart rate of the rider (MAX BIAGGI) during Misano SBK race in 2015. Mediaset collect the date from different side (Rider HR, motorbike dynamics, and position of the motorbike in circuit), showing all the information during TV broadcast of the race. Images
Figure 87: Rider heart rate measures during the race
ADAS&ME relevance (aspects covered):
Relevant UCs E and F. Physical behaviour: only heart rate. ADAS&ME irrelevance (aspects not covered): Physical behaviour: only heart rate. Psychological behaviour: No. Price: -
Product name - One: Performance Tracking System for Motorcyclists
Producer/ Manufacturer BRAIN Contact information / Website (URL) http://brainsomeness.com/ Short description BRAIN One is a portable, stand-alone smart telemetry device for motorsports. It tracks rider’s performance, provides feedback in real-time and stores motorcycle performance data. It is standalone device that attaches to the motorcycle without cables or wires and begins a recording session that feeds directly to the mobile phone with the push of a button or, if you don’t have the smartphone with you, stores information into the internal memory until it’s ready to be synced. Images
Figure 88: Brain telemetry device for motorsports

ADAS&ME (688900) D1.1-SoA & Benchrmarking
March 2017 Page 138 of 238 CERTH/HIT
Technical specifications / requirements
Figure 89: Indicators and sensors used to collect these data (Brain)
ADAS&ME relevance (aspects covered):
Physical behaviour: NO Relevant UCs E and F. ADAS&ME irrelevance (aspects not covered): ONLY telemetry device. Price: 300€ - 500€ Product name - D|AIR RACING
Producer/ Manufacturer DAINESE / MEDIASET Contact information / Website (URL) http://www.dainese.com/it_it/d-air/racing
Short description D-air® Racing is the intelligent protective air-bag based system for motorbike riders on the track. The range of products which use this air-bag system includes D-air® Racing Mugello, the top of the range made-to-measure suit in kangaroo leather and D-air® Racing Misano, the entry level suit in cowhide made in standard sizes. For World Championship riders only, Dainese have also created D-air® Armor, the open platform air-bag based on D-air® technology. D-air® Racing was designed to be used exclusively on the track and is not for road use. Images

ADAS&ME (688900) D1.1-SoA & Benchrmarking
March 2017 Page 139 of 238 CERTH/HIT
Figure 90: D-Air Racing suit
Technical specifications / requirements Realizing that the Dainese D-Air Racing suit had three accelerometers, three gyroscopes and a GPS.
Figure 91: Dainese D-Air Racing suit parts and sensors
ADAS&ME relevance (aspects covered):
Relevant UCs E and F. ADAS&ME irrelevance (aspects not covered):
Physical behaviour: NO; ONLY telemetry device; In addition to deploying an airbag that protects a rider’s neck, chest, and shoulders, the Dainese D-Air system also provides a telemetry package that track riders can use in lieu of a basic motorcycle data acquisition system. Price: 2000€ Product name - LVL Hydration Monitor (Dehydration)
Producer/ Manufacturer LVL
BSxinsight Contact information / Website (URL) http://www.onelvl.com/
Short description The new LVL Hydration Monitor keeps tabs on your internal water levels and lets you know when it’s time to imbibe. Mostly intended for athletes monitoring but it could be used also by riders. For everyone else, it’s a simple reminder that we probably all need to drink more water throughout the day to perform better mentally and emotionally, and it’s as simple as wearing a fitness tracker and measures activity, also. It measures hydration levels in real time, including sweat rates to show what you’re losing. It then combines that data with heart rate from the built in sensors, activity level and

ADAS&ME (688900) D1.1-SoA & Benchrmarking
March 2017 Page 140 of 238 CERTH/HIT
calculated caloric expenditure during both rest and activity, to make hydration and refuelling recommendations. It adds in mood, sleep and performance analytics, suggesting how much you need to drink to optimize all three. Images
Figure 92: LVL wristband
Figure 93: Wristband features to communicate mood, hydration levels, heart rate
Technical specifications / requirements The bonus is that they also measure your heart rate at a claimed 8x to 10x. The device and its prototypes were tested on more than 250 people and are reported to be as accurate as urine, body weight and blood tests, meeting or exceeding the requirements for first responders and the military. Heart rate measurement claims to be within 2.7bpm of actual, compared to a claimed +/-14bpm with other devices.
Figure 94: LVL measures
ADAS&ME relevance (aspects covered): Relevant UCs E and F; It measures dehydration and mood, it is wearable, and rather cheap. It will be available for purchase soon. ADAS&ME irrelevance (aspects not covered): Not adjustable or open to change and re-
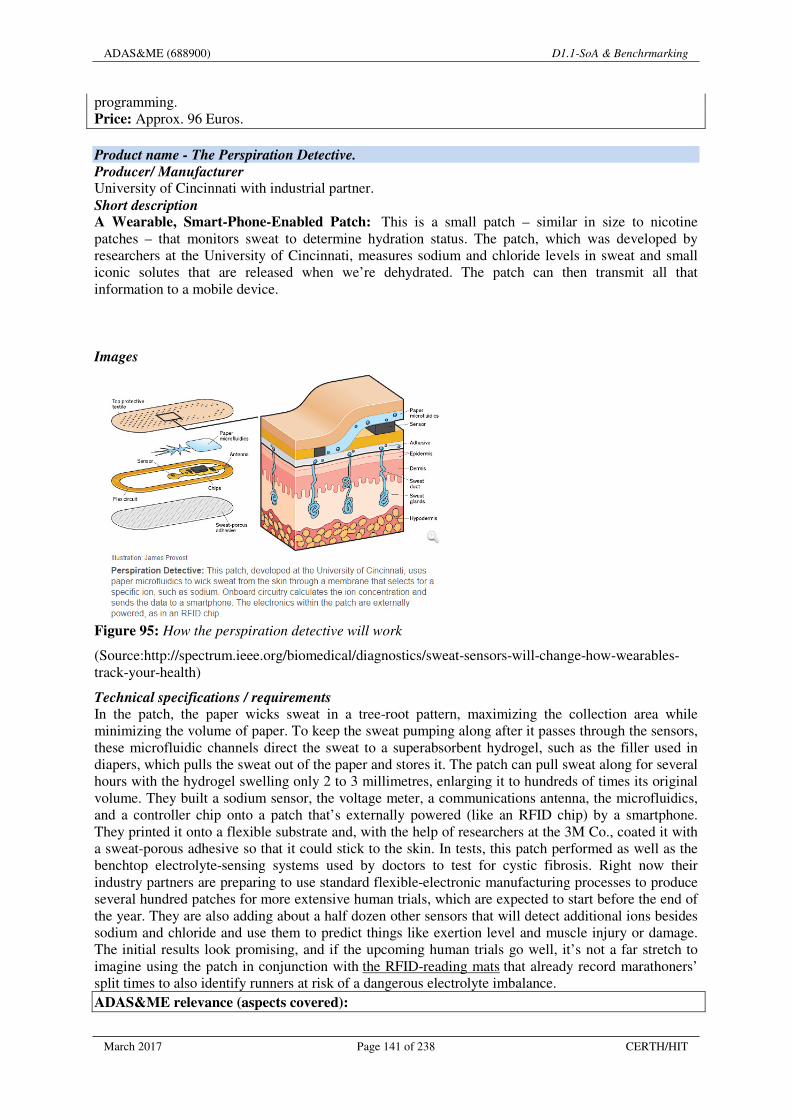
ADAS&ME (688900) D1.1-SoA & Benchrmarking
March 2017 Page 141 of 238 CERTH/HIT
programming. Price: Approx. 96 Euros. Product name - The Perspiration Detective.
Producer/ Manufacturer University of Cincinnati with industrial partner. Short description A Wearable, Smart-Phone-Enabled Patch: This is a small patch – similar in size to nicotine patches – that monitors sweat to determine hydration status. The patch, which was developed by researchers at the University of Cincinnati, measures sodium and chloride levels in sweat and small iconic solutes that are released when we’re dehydrated. The patch can then transmit all that information to a mobile device.
Images
Figure 95: How the perspiration detective will work
(Source:http://spectrum.ieee.org/biomedical/diagnostics/sweat-sensors-will-change-how-wearables-track-your-health)
Technical specifications / requirements In the patch, the paper wicks sweat in a tree-root pattern, maximizing the collection area while minimizing the volume of paper. To keep the sweat pumping along after it passes through the sensors, these microfluidic channels direct the sweat to a superabsorbent hydrogel, such as the filler used in diapers, which pulls the sweat out of the paper and stores it. The patch can pull sweat along for several hours with the hydrogel swelling only 2 to 3 millimetres, enlarging it to hundreds of times its original volume. They built a sodium sensor, the voltage meter, a communications antenna, the microfluidics, and a controller chip onto a patch that’s externally powered (like an RFID chip) by a smartphone. They printed it onto a flexible substrate and, with the help of researchers at the 3M Co., coated it with a sweat-porous adhesive so that it could stick to the skin. In tests, this patch performed as well as the benchtop electrolyte-sensing systems used by doctors to test for cystic fibrosis. Right now their industry partners are preparing to use standard flexible-electronic manufacturing processes to produce several hundred patches for more extensive human trials, which are expected to start before the end of the year. They are also adding about a half dozen other sensors that will detect additional ions besides sodium and chloride and use them to predict things like exertion level and muscle injury or damage. The initial results look promising, and if the upcoming human trials go well, it’s not a far stretch to imagine using the patch in conjunction with the RFID-reading mats that already record marathoners’ split times to also identify runners at risk of a dangerous electrolyte imbalance. ADAS&ME relevance (aspects covered):

ADAS&ME (688900) D1.1-SoA & Benchrmarking
March 2017 Page 142 of 238 CERTH/HIT
Relevant UCs E and F; Detects and warns about dehydration. Can share results through mobile (i.e., with others). ADAS&ME irrelevance (aspects not covered): Just a wristband, not in vehicle or motorcycle tested.
Not a product yet. Price: N/A yet.
Product name – Frostbite detector and alarm
Producer/ Manufacturer Caleb Hanneman
Contact information / Website (URL) https://hackaday.io/project/11841-frostbite-detector-and-alarm
Short description A small pocketable or wearable device that can warn the user of prolonged exposure to cold conditions. This device is meant to reduce the number of injuries and deaths due to frostbite. The device is meant to notify the user that they have been exposed to cold temperatures for too long of a period of time. Frostbite can occur within 5 minutes, particularly at low temperatures. Images
Figure 96: The frostbite detector and alarm prototype
Technical specifications / requirements The device is small, pocketable, and battery powered, with future units possible featuring rechargeable lithium batteries. The device is meant to reduce rates of frostbite by notifying the user of conditions where frostbite is imminent with a solid LED, and when to take shelter with a flashing LED.
ADAS&ME relevance (aspects covered):
Relevant to UCs E and F; Small and easy to carry; Warns user of potential frostbite. ADAS&ME irrelevance (aspects not covered):
Simple, aimed to be used by children; Under development; Not yet there and not standardised; it is a prototype. Price: Not relevant (yet).
Product name - A Sensor System Integrated Into The Steering Wheel That Can Monitor The
Driver's State Of Health While Driving
Producer/ Manufacturer Jakob Neuhäuser / Technische Universitaet Muenchen Short description Scientists at the Technische Universitaet Muenchen have developed a sensor system, integrated into the steering wheel that can monitor the driver's state of health while driving. When a stress situation is detected, phone calls can be blocked, for instance, or the volume of the radio turned down automatically. With more serious problems the system could turn on the hazard warning lights, reduce the speed or even induce automated emergency braking. The driver can use his/her time behind the wheel for a minor health check. At the same time the device might be used to recognize the onset of fainting spells or heart attacks. Together with researchers from the BMW Group, scientists at the TU Muenchen Chair of Micro Technology and Medical Device Technology (MiMed) directed by Professor Tim C. Lueth, have developed a system that monitors vital signs, such as heart rate, skin conductance and oxygen saturation in the blood via simple sensors in the
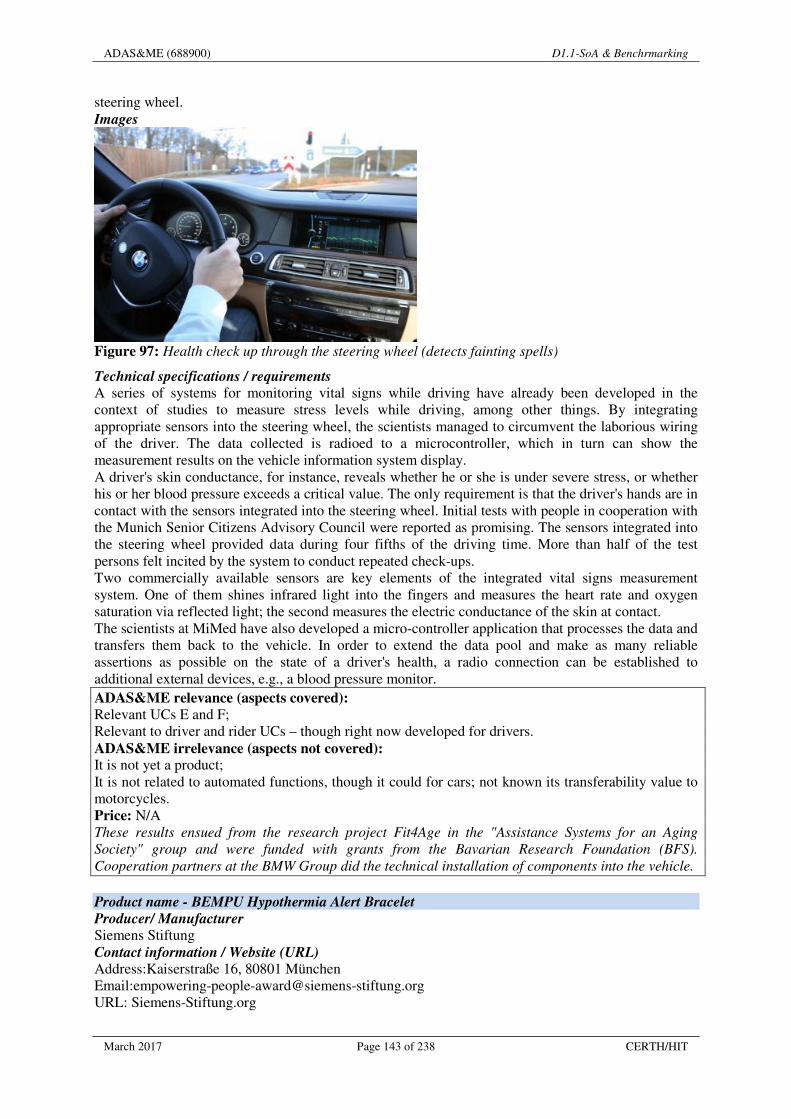
ADAS&ME (688900) D1.1-SoA & Benchrmarking
March 2017 Page 143 of 238 CERTH/HIT
steering wheel. Images
Figure 97: Health check up through the steering wheel (detects fainting spells)
Technical specifications / requirements A series of systems for monitoring vital signs while driving have already been developed in the context of studies to measure stress levels while driving, among other things. By integrating appropriate sensors into the steering wheel, the scientists managed to circumvent the laborious wiring of the driver. The data collected is radioed to a microcontroller, which in turn can show the measurement results on the vehicle information system display. A driver's skin conductance, for instance, reveals whether he or she is under severe stress, or whether his or her blood pressure exceeds a critical value. The only requirement is that the driver's hands are in contact with the sensors integrated into the steering wheel. Initial tests with people in cooperation with the Munich Senior Citizens Advisory Council were reported as promising. The sensors integrated into the steering wheel provided data during four fifths of the driving time. More than half of the test persons felt incited by the system to conduct repeated check-ups. Two commercially available sensors are key elements of the integrated vital signs measurement system. One of them shines infrared light into the fingers and measures the heart rate and oxygen saturation via reflected light; the second measures the electric conductance of the skin at contact. The scientists at MiMed have also developed a micro-controller application that processes the data and transfers them back to the vehicle. In order to extend the data pool and make as many reliable assertions as possible on the state of a driver's health, a radio connection can be established to additional external devices, e.g., a blood pressure monitor. ADAS&ME relevance (aspects covered):
Relevant UCs E and F; Relevant to driver and rider UCs – though right now developed for drivers. ADAS&ME irrelevance (aspects not covered): It is not yet a product; It is not related to automated functions, though it could for cars; not known its transferability value to motorcycles. Price: N/A These results ensued from the research project Fit4Age in the "Assistance Systems for an Aging
Society" group and were funded with grants from the Bavarian Research Foundation (BFS).
Cooperation partners at the BMW Group did the technical installation of components into the vehicle.
Product name - BEMPU Hypothermia Alert Bracelet
Producer/ Manufacturer Siemens Stiftung Contact information / Website (URL) Address:Kaiserstraße 16, 80801 München Email:[email protected] URL: Siemens-Stiftung.org
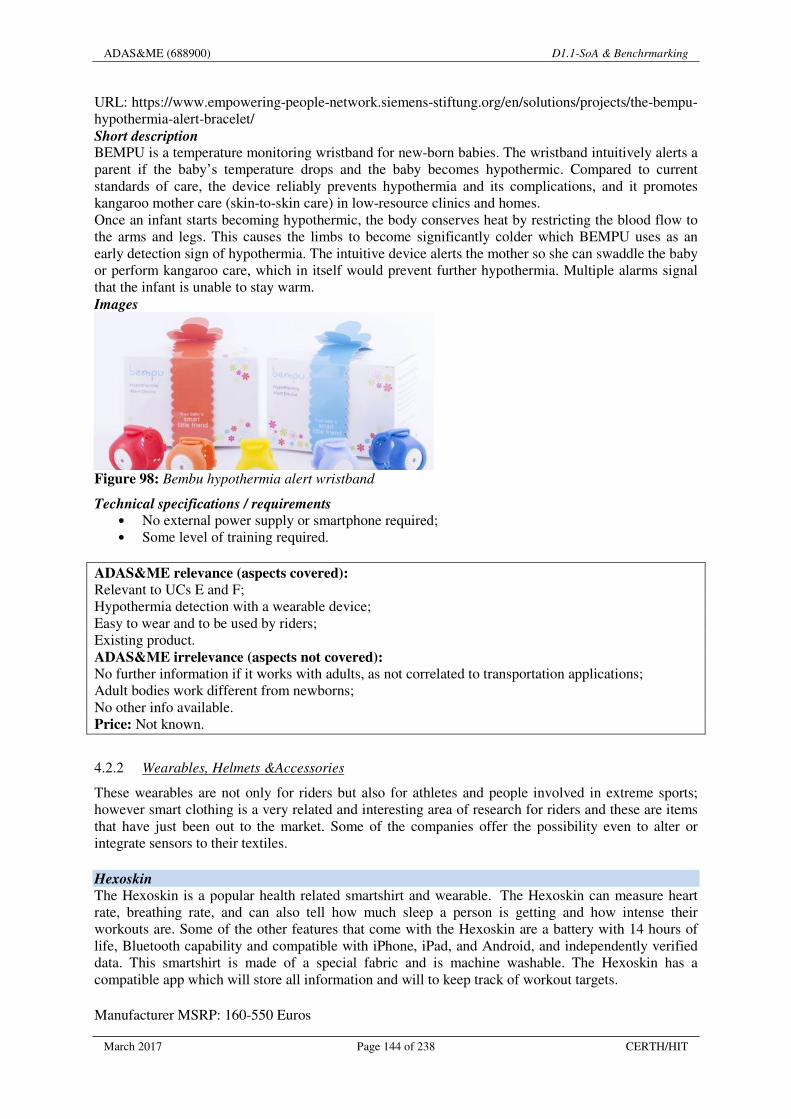
ADAS&ME (688900) D1.1-SoA & Benchrmarking
March 2017 Page 144 of 238 CERTH/HIT
URL: https://www.empowering-people-network.siemens-stiftung.org/en/solutions/projects/the-bempu-hypothermia-alert-bracelet/ Short description BEMPU is a temperature monitoring wristband for new-born babies. The wristband intuitively alerts a parent if the baby’s temperature drops and the baby becomes hypothermic. Compared to current standards of care, the device reliably prevents hypothermia and its complications, and it promotes kangaroo mother care (skin-to-skin care) in low-resource clinics and homes. Once an infant starts becoming hypothermic, the body conserves heat by restricting the blood flow to the arms and legs. This causes the limbs to become significantly colder which BEMPU uses as an early detection sign of hypothermia. The intuitive device alerts the mother so she can swaddle the baby or perform kangaroo care, which in itself would prevent further hypothermia. Multiple alarms signal that the infant is unable to stay warm. Images
Figure 98: Bembu hypothermia alert wristband
Technical specifications / requirements • No external power supply or smartphone required; • Some level of training required.
ADAS&ME relevance (aspects covered):
Relevant to UCs E and F; Hypothermia detection with a wearable device; Easy to wear and to be used by riders; Existing product. ADAS&ME irrelevance (aspects not covered):
No further information if it works with adults, as not correlated to transportation applications; Adult bodies work different from newborns; No other info available. Price: Not known.
4.2.2 Wearables, Helmets &Accessories
These wearables are not only for riders but also for athletes and people involved in extreme sports; however smart clothing is a very related and interesting area of research for riders and these are items that have just been out to the market. Some of the companies offer the possibility even to alter or integrate sensors to their textiles.
Hexoskin The Hexoskin is a popular health related smartshirt and wearable. The Hexoskin can measure heart rate, breathing rate, and can also tell how much sleep a person is getting and how intense their workouts are. Some of the other features that come with the Hexoskin are a battery with 14 hours of life, Bluetooth capability and compatible with iPhone, iPad, and Android, and independently verified data. This smartshirt is made of a special fabric and is machine washable. The Hexoskin has a compatible app which will store all information and will to keep track of workout targets.
Manufacturer MSRP: 160-550 Euros

ADAS&ME (688900) D1.1-SoA & Benchrmarking
March 2017 Page 145 of 238 CERTH/HIT
Where to Buy: Hexoskin Product Page: Hexoskin
Cityzen Sciences Cityzen Sciences is a French based company that has been in the smartclothes business since 2008. They are noted for their D-Shirt, which is short for Digital Shirt. Microsensors are embedded all throughout the shirt and they are able to keep track of information, such as temperature, heart beat and heart rate, and the speed and intensity of workouts. Cityzen Sciences can also customize smartclothes for clients. This company can be contacted at their website at www.cityzensciences.fr.
Manufacturer MSRP: N/A Where to Buy: Cityzen Sciences Product Page: Cityzen Sciences
OMsignal The biometric smartwear from OMsignal has fitness tracking abilities and can track heartbeat and breathing. It has the compatible app in order to track health and fitness information. The shirt is not very bulky and is able to keep the biometric information by using a small black box woven into the shirt. The OMsignal has moisture control, odour control, and is also machine washable. It also has the compression feature which helps with circulation and muscle recovery.
Manufacturer MSRP: $249 Where to Buy: OMsignal Product Page: OMsignal
Clothing+ Clothing+ is a new and emerging company who specializes in wearable sensors that are embedded in clothing. The company started developing the first heart beat and rate sensor for a shirt back in 1998 and then they came out with a sensor strap in 2002. The company is based in Finland and Hong Kong. Clothing+ can be contracted about their biometric smartclothes and the logistics about their product at www.clothingplus.fi.
Manufacturer MSRP: N/A Where to Buy: Clothing Plus Product Page: Clothing Plus
Xsensio Xsensio develop monitors and sensors that are woven into this smartgarment that give ECG readings, core body temperature, and can also alert a runner if they are becoming dehydrated. Xsensio is partnered with the Swiss Institute of Technology Lausanne and they have a strong force of engineers. Product release and shipping information can be found at www.xsensio.com.
Manufacturer MSRP: N/A Where to Buy: Xsensio Product Page: Xsensio
R-shirt R-shirt is a French based company that uses a small waterproof chip that is sewn into the clothes. Depending on the needs and wants of the customer, R-shirt is able to customize R-shirt’s iBeacon chip is compatible with both iOS and Android processing systems.
Manufacturer MSRP: N/A Where to Buy: R-shirt

ADAS&ME (688900) D1.1-SoA & Benchrmarking
March 2017 Page 146 of 238 CERTH/HIT
Product Page: R-shirt
Skully The AR-1’s features include rear-view camera and a transparent, Infinite Focus HUD that’s projected against the visor. Turn by turn directions are sourced through mobile phone; the helmet lets the rider keep it in his/her pocket with hands-free calling.
Figure 99: Skully AR-1 helmet
Forcite Alpine Helmet
The Forcite Alpine is equipped with GPS tracking, an altimeter, motion and impact sensors, Wi-Fi, Bluetooth, fog lights, HD video and integrated speakers.
Figure 100: Forcite alpine helmet
LiveMap helmet
LiveMap is a motorcycle helmet that uses augmented reality for navigation. Street names, speed, and turn-by-turn directions are displayed directly over the world around you, negating the need to shift focus from the road. Slow to a stop, and you can pop up your map. The LiveMap smart helmet also includes a microphone and earphones for voice control.
Figure 101: LiveMap helmet

ADAS&ME (688900) D1.1-SoA & Benchrmarking
March 2017 Page 147 of 238 CERTH/HIT
NandLogic Encephalon Apart from increasingly standard GPS, accelerometer, and gyroscope, it is equipped with other features: ambient light sensors, headlights, turn signals, brake lights, collision warnings, and a fan for summer.
Figure 102: NandLogic Encephalon helmet
Mohawk The Mohawk is a camera, tracker, and emergency alert system all rolled into one. It automatically records the last two minutes of audio and video, like an airplane’s black box. The waterproof housing and mount are made to fit on any kind of helmet, and the handlebar controls make it easy to keep hands on the bars, as do the optional wrist-based mounts.
Figure 103: The Mohawk system mounted on a helmet
Beartek Gloves
Beartek gloves have the capability to use Bluetooth to sync to your phone, or WiFi to sync to your GoPro Action Sports Camera. Once synced, you don’t need to take your hand off the handlebars to control your gadgets. For example, touching your thumb to your index finger will turn on your camera. Price: 240 Euros (Amazon).
4.2.3 Subjective measure
A subjective measure that has been developed within the framework of the SAFERIDER EU Project is the RALI, an adaptation of DALI instrument. RALI (Riding Activity Load Index) The procedure to set up DALI was to ask various experts involved in the driving tasks studies to define which were, in their opinion, the main factors inducing mental workload for people driving a vehicle equipped with an on-board system (car phone, driving aid systems, radio, etc.). This

ADAS&ME (688900) D1.1-SoA & Benchrmarking
March 2017 Page 148 of 238 CERTH/HIT
investigation led to the following definitions for the workload dimensions of the DALI: Effort of attention, Visual demand, Auditory demand, Temporal demand, Interference and Situational stress. Evaluation occurs on a 5-point rating scale (1: Low to 5: High). The RALI version has the following factors: Visual demand, auditory demand, Temporal demand, system interference, effort of attention, situation own coping, situational stress, emotions handling vehicles and was developed by the IFSTTAR team (Lot et al., 2009).
4.2.4 Automation strategies and patterns for motorcycles
In this section, certain automation strategies that could be applicable to ADAS&ME rider systems and relevant patterns are included that do not necessarily fall under the literature review or benchmarking of existing systems. The following table presents the main publications as presented in previous chapters. The only missing column is the connection with UCs, because this review refers to the UCs for motorcycles in general. In addition, the complete list of literature summaries can be found in Annex 2; here only the most interesting studies for stabilisation of motorcycles are presented. Table 18 does not include all the results, only the ones that propose strategies or functions relevant to stabilisation of motorcycles to be uptaken within the project.

ADAS&ME (688900) D1.1-SoA & Benchrmarking
March 2017 Page 149 of 238 CERTH/HIT
Table 18: Summary of literature review- Automation strategies for motorcycles
Publication Objective Measured Results Relevance to
ADAS&ME
Key
Kanjanawanishkul et al.
(2015) LQR and MPC
controller design and comparison for a
stationary self-balancing bicycle robot with a
reaction wheel
Simulation tests conducted for three
control strategies: linear quadratic regulator
(LQR), linear model predictive control
(LMPC), and nonlinear model predictive control (NMPC).
Little, almost only numeric simulation
The stabilization performed using a reaction wheel is
interesting and should be considered. Stabilizing a bicycle is much easier
(lower weight and inertia). LQR and MPC to be kept in consideration.
Savino et al. (2016)
Considerations on the
acceptability of unexpected automatic
decelerations
16 riders were involved
in the tests and were exposed to random and
unexpected brake activations along a rectilinear path at a nominal speed of 40
km/h
Riders seem to accept
and manage unexpected
decelerations (-0.15g), with minor to
moderate effort. However this is a
really first test and the scenario is very limited
The information about the
reaction to unexpected decelerations is good for the implementation of the
recovery mode. The deceleration could be
obtained with a more sophisticated control
Yetkin (2013) Stabilization of Autonomous Bicycle
Equations of motion of a bicycle with a wheel mounted on its bottom are derived and a first
order sliding mode controller is designed to
achieve the goal of stabilization
Very little, the test was performed with a
limited range of speeds and not on open roads
The stabilization performed using a gyro is interesting and should be considered. Stabilizing a bicycle is much easier
(lower weight and inertia). Make a
motorcycle curving only with lean control (no
steering control) could be

ADAS&ME (688900) D1.1-SoA & Benchrmarking
March 2017 Page 150 of 238 CERTH/HIT
Publication Objective Measured Results Relevance to
ADAS&ME
Key
interesting.
Kaplan (2010) Design of an Active-Assistance Balancing
Mechanism for a Bicycle
inclinometer or gyro+accelerometer
Almost zero: testing only possible in
controlled environment. The study remained a simple university
project.
The stabilization of a bicycle is much easier
(lighter with less inertia). - It is not considered the
presence of the rider with all the disturbances he can
make (e.g. actions on steer).
- The solution with these mechanical arms is not
good for market, there are already on market similar solutions for paraplegic
riders
Beznos et al. (1998)
Control of Autonomous Motion of Two- Wheel
Bicycle with Gyroscopic Stabilisation
Simulation tests to
develop a stabilization system using gyroscopic
stabilization. Then a mini-bicycle was built and first tested were
made in lab
Results were very
limited, the prototype was tested only in lab and the stabilization performances were
rather poor
Stabilisation using a couple of gyros is
interesting and should be considered. Of course
stabilizing a mini-bicycle is much easier.

ADAS&ME (688900) D1.1-SoA & Benchrmarking
March 2017 Page 151 of 238 CERTH/HIT
4.3 Transfer of knowledge from aviation, rail and maritime
This section focusses on knowledge transfer from other transportation areas. A complete review of literature can be found in Annex 3. The following table summarises key knowledge that can be transferred from each transportation area to ADAS&ME.
Table 19: Knowledge transfer from other transport areas
Transportation
area
(publication)
Knowledge transfer ADAS&ME relevance
Aviation (Roveda et al. 2016)
A combination of several data categories (i.e., HR, RR, R-R intervals, and HRV) may provide an indicator for the quality of sleep and thus may be a way to track sleep-stress-emotion changes in pilots and astronauts in particular, and the public in general.
The platform described incorporates many of the sensors that are to be tested for ADAS&ME.
Aviation (Bias et al. 2016)
Proposed approach proved to be highly effective when dealing with contaminated and noisy data. Due to insufficient number of participants no general hypothesis can be drawn from performed analysis.
The utilization of the power of frequency bands as fatigue indicators will be part of the ADAS&ME approach.
Aviation (Cakir et al., 2016)
An LDA based classification system for mental workload was developed based on features extracted from fNIR data. The results seem to be affected by the presence of noise during the recording
The proposed sensoring method with the current technology can only be used (for practical applications) by riders.
Aviation
(Borghini et al. 2015)
The present study suggested as cognitive neurometrics could provide more objective and quantitative information with respect to the subjective methodologies, in order to test and compare different avionic technologies in terms of requested mental workload.
The use of EEG measures to quantify mental workload which is related to fatigue/stress can be used for monitoring driver's state. The results could also be exploited during the HMI design.
Aviation
(Oh et al. 2015)
Boosting, stacking, and voting showed very reliable performance as expected. In particular, stacking and voting could be easily extensible through a hierarchical structure particularly when any new feature set is included in the future to produce more reliable results.
Ensemble learning is a valid candidate for state classification.
Aviation
(Wei et al. 2014)
The dynamic flight simulation experiments show that four indexes, i.e., flight operation accuracy, reaction time, SDNN and NASA_TLX scale, are significantly sensitive to the change of flight task-related mental workload.
SDNN can be used as indicator of mental workload.
Aviation (Aricò et al. 2014)
By combining information coming from different biosignals (e.g., EEG and HR), it is possible to have more reliable and faster information about the mental states of the user. It has been also demonstrated that i) the system is able to significantly differentiate three workload levels related
This study is only concerned with the mental workload. The idea is to be used as part of a system that "could intervene in real-time before the operator becomes overloaded while performing safety-critical tasks". The extracted indicators can

ADAS&ME (688900) D1.1-SoA & Benchrmarking
March 2017 Page 152 of 238 CERTH/HIT
Transportation
area
(publication)
Knowledge transfer ADAS&ME relevance
to the three difficulty level tasks employed with a high reliability; ii) the subjective features used for the evaluation of the mental workload remain stable over one week.
be tested within ADAS&ME.
Aviation (Borgini et al. 2014)
Review of the literature suggests that a coherent sequence of changes for EEG, EOG and HR variables can be measured during the transition from normal drive, high mental workload and eventually mental fatigue and drowsiness. In particular, increased EEG power in theta band and a decrease in alpha band occurred in high mental workload. Successively, increased EEG power in theta as well as delta and alpha bands characterise the transition between mental workload and mental fatigue. Drowsiness is also characterised by increased blink rate and decreased HR values.
This paper does not only address pilots but drivers as well. Therefore it is directly related to the scopes of ADAS&ME.
Aviation (Sauvet et al. 2014)
The best concordance between automatic detection and visual scoring was observed within the O1-M2 channel, using the ratio of energies in frequency bands.
This study is only concerned with one state condition. No Assistant System and a relative mechanism is considered. The approach is actually one that has been already been tested in drivers.
Aviation
(Luig & Sontacchi 2014)
There is no ‘universal descriptor’ for changes in stress level, but different events lead to changes in different parameters.
Speech is one of the targeted measurements of ADAS&ME. The database is available on request (Access is subject to approval and limited to academic institutions only.) for non-commercial research purposes.
Aviation (Gentili et al. 2014)
This study confirms and extends previous research by identifying multiple biomarkers to assess cognitive workload and attentional reserve during progressive simulated piloting task demands. EEG power and HRV were used to assess cognitive workload while the ERPs assessed attentional reserve. Cognitive workload and attentional reserve were negatively related.
The extracted biomarkers could be used as part of the ADAS&ME system.
Aviation
(Lehrer at al. 2010)
Technical solutions are available only in exceptional cases in especially transport modes aviation and sea. The available solutions are rather old, don’t use state-of-the-art technology and less innovative compared to what has been developed for car and truck industry. There is reason to believe that rail is the transport mode were you most easily can use less innovative solutions like “dead man’s switch” and
The report contains a thorough investigation of available countermeasures of fatigue. Some of them could be part of ADAS&ME. The leading partner is also involved in ADAS&ME.

ADAS&ME (688900) D1.1-SoA & Benchrmarking
March 2017 Page 153 of 238 CERTH/HIT
Transportation
area
(publication)
Knowledge transfer ADAS&ME relevance
activation monitoring. Maritime (Varoneckas et al., 2015)
According to the authors "The study results demonstrated that sea farer’s functional status mostly depends on the physical and mental fatigue during operational activity. The functional status is also influenced by gender, age, physical fitness, pain, boredom and emotions."
ADAS&ME will also have a data repository where, however, the most crucial information will come from sensors instead of questionnaires.
Maritime (Arima et al., 2013)
The index of the sympathetic nervous system (SNS) can be a useful index to detect subject’s psychological condition. The facial monitoring system can detect and follow subject’s face even though he/she walks around in a navigation bridge.
The sympathetic and parasympathetic indices can be part of the indicators used by ADAS&ME. Multiple cameras could also be part of the monitoring system. The proposed method however has not been properly validated.
Maritime
(Barnett et al., 2012)
Sleepiness and neurobehavioral performance, as measured by the EEG electrodes, are particularly affected towards the end of the 0000-0600 watch. Sleepiness and fatigue are enhanced and brain performance reduced. In addition, there is a gradual increase of fatigue during the work periods as the week progresses.
It is nor clearly described how the EEG recordings were utilized.
Rail (Sinha et al., 2016)
A prototype in its very early stage was presented.
No verified results presented for the effectiveness of the methods.
Rail
(Macii etal., 2015)
The full design process of a novel dead-man’s vigilance device (DMVD) was presented.
The vigilance detector is well suited for trains but might not be adequate for drivers/riders since the rules that trick the detector might not be realistic outside the locomotive setting. On the other hand the methodological approach might be of interest if an FPGA implementation it pursuit.
Rail (Rahman et al., 2013)
The results reveal that the mean alpha power values are higher during rainy night condition, which indicate that the train drivers experience reduced levels of vigilance. The EEG measurements taken at the PZ locations (i.e., points that contribute to the primary visual perception of humans) show a decrease in mental workload towards the end of the driving period for rainy night condition, which clearly indicates an increased level of sleepiness..
Standard frequent band indicator. Can be used at ADAS&ME.
Rail (Jap et al., 2011)
Simultaneous decreases in beta and increases in theta activity have been shown as the train drivers entered the repetitive phase of transition from the alert state to a
The proposed indicators could be part of ADAS&ME "indicator's bank".
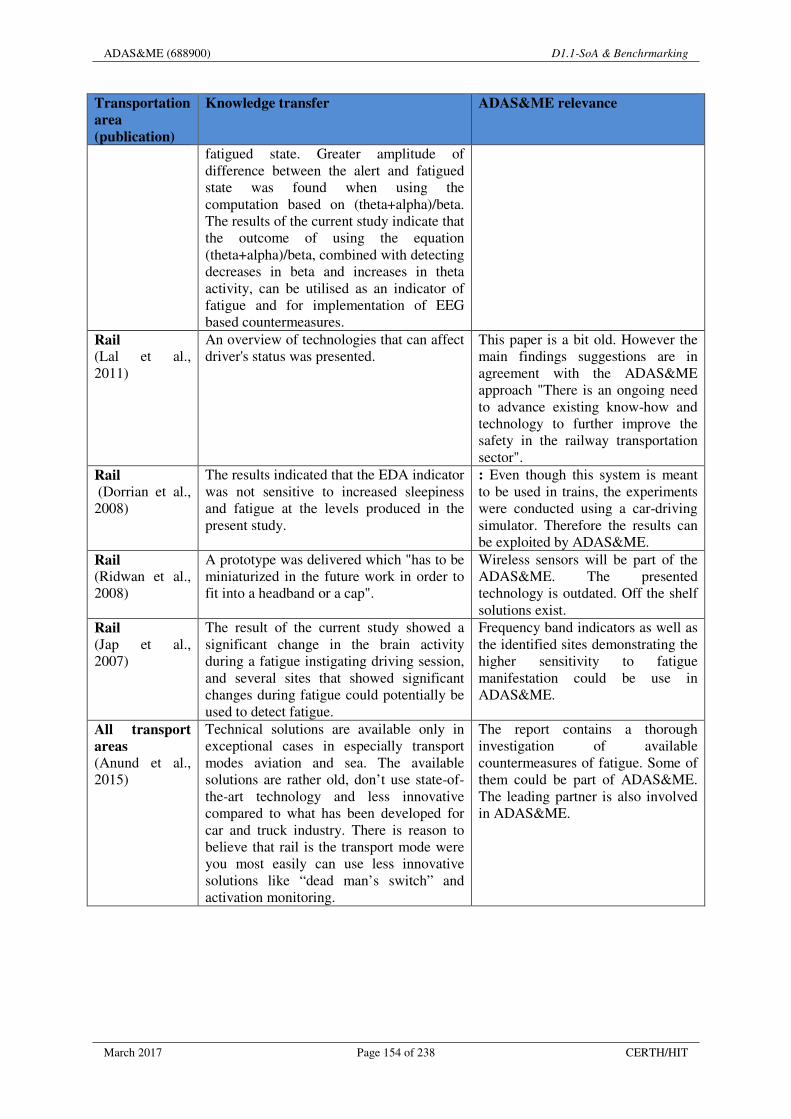
ADAS&ME (688900) D1.1-SoA & Benchrmarking
March 2017 Page 154 of 238 CERTH/HIT
Transportation
area
(publication)
Knowledge transfer ADAS&ME relevance
fatigued state. Greater amplitude of difference between the alert and fatigued state was found when using the computation based on (theta+alpha)/beta. The results of the current study indicate that the outcome of using the equation (theta+alpha)/beta, combined with detecting decreases in beta and increases in theta activity, can be utilised as an indicator of fatigue and for implementation of EEG based countermeasures.
Rail (Lal et al., 2011)
An overview of technologies that can affect driver's status was presented.
This paper is a bit old. However the main findings suggestions are in agreement with the ADAS&ME approach "There is an ongoing need to advance existing know-how and technology to further improve the safety in the railway transportation sector".
Rail
(Dorrian et al., 2008)
The results indicated that the EDA indicator was not sensitive to increased sleepiness and fatigue at the levels produced in the present study.
: Even though this system is meant to be used in trains, the experiments were conducted using a car-driving simulator. Therefore the results can be exploited by ADAS&ME.
Rail (Ridwan et al., 2008)
A prototype was delivered which "has to be miniaturized in the future work in order to fit into a headband or a cap".
Wireless sensors will be part of the ADAS&ME. The presented technology is outdated. Off the shelf solutions exist.
Rail
(Jap et al., 2007)
The result of the current study showed a significant change in the brain activity during a fatigue instigating driving session, and several sites that showed significant changes during fatigue could potentially be used to detect fatigue.
Frequency band indicators as well as the identified sites demonstrating the higher sensitivity to fatigue manifestation could be use in ADAS&ME.
All transport
areas
(Anund et al., 2015)
Technical solutions are available only in exceptional cases in especially transport modes aviation and sea. The available solutions are rather old, don’t use state-of-the-art technology and less innovative compared to what has been developed for car and truck industry. There is reason to believe that rail is the transport mode were you most easily can use less innovative solutions like “dead man’s switch” and activation monitoring.
The report contains a thorough investigation of available countermeasures of fatigue. Some of them could be part of ADAS&ME. The leading partner is also involved in ADAS&ME.

ADAS&ME (688900) D1.1-SoA & Benchrmarking
March 2017 Page 155 of 238 CERTH/HIT
5 Alignment of results
This chapter focuses on how the results of the literature review and SoA are in line with the priorities set by high profile organizations in transport and safety, namely ACEM, ENCAP and the CATRE project that has just started and more importantly investigate the connection between these priorities and the ADAS&ME UCs and the respective work to be carried out in the project (i.e. detection and monitoring of affective states per UC and/ or vehicle type).
5.1 Alignment with ACEM priorities
ACEM (http://www.acem.eu/), the European Association of Motorcycle Manufacturers, is the trade association that represents manufacturers of powered-two and three-wheelers as well as quadricycles (L-category vehicles) in Europe. ACEM members include 15 manufacturing companies and 17 national industry associations in 14 different European countries. About 156,300 jobs depend on the motorcycle, moped, tricycle and quadricycle industry in Europe. ACEM works closely with the EU institutions, as well as with a wide range of stakeholders, in different policy-areas. These include type-approval of L-category vehicles, environmental legislation, road safety and transport policies, international trade negotiations, etc.
5.1.1 Objective
The effort to align the ADAS&ME Use Cases E “Long-range attentive touring with motorbike”& F “Rider Faint” with ACEM’s Safety Strategy was identified as a necessary process, in order to both provide strong basis to ADAS&ME and identify possible synergies with other initiatives regarding riders’ safety. The approach followed started by the identification of ACEM’s priorities, followed by the in-depth analysis on priorities directly relevant to ADAS&ME and resulted to the interpretation of the potential synergies and disagreements with the ADAS&ME objectives.
5.1.2 ACEM priorities
ACEM safety strategy, entitled “The Safe Ride to the Future” was launched on 24th September 2014 (www.acem.eu/publications/item/333-the-safe-ride-to-the-future-acem-road-safety-strategy). It is a working document which is continuously revised and its updates are presented in a dedicated annual meeting.
The approach of the association to the topic is typically holistic, therefore there are actions oriented to: 1. Public institutions [Priority 1]: to enhance the in-force legislations, to keep PTWs (Powered-
Two-Wheelers) at the centre of transport strategies and policies, to foster the innovative design and the proper maintenance of road infrastructure;
2. End users [Priority 2]: to improve their riding skills (e.g., through post license training), to promote the usage of adequate PPE (Personal Protective Equipment) and to enhance the other road users’ awareness towards riders;
3. Research and development [Priority 3] of new safety devices, both active and passive. This is addressed by OEMs individually or by joining forces with other partners (research centres, other OEMs, Tier-1 suppliers, etc.) in specific national or European projects.
The third action point is directly relevant to ADAS&ME and is further analysed hereafter. Currently, ACEM actions are mainly focusing on two technological pillars: eCall and Cooperative ITS (C-ITS) systems.
3.1 For what concerns eCall [Priority 3.1], ACEM is an associate member of the i-HeERO project for the harmonised eCall European development. i-HeERO (where “i” stands for infrastructure) is aimed at the preparation of the PSAP (Public Safety Answering Points) in Member States for the deployment of eCall based on the pan-European ‘112’ emergency number. A specific section is dedicated to prepare the deployment of eCall systems for powered two-wheeled vehicles. The goal is to set the basis for a reliable and economically feasible eCall system using PSAP. The project started in January 2015, lasts 36 months and is partially financed by the EU under the Connected Europe Fund Annual Program (more information is available at:

ADAS&ME (688900) D1.1-SoA & Benchrmarking
March 2017 Page 156 of 238 CERTH/HIT
http://iheero.eu/). 3.2 With regard to C-ITS systems [Priority 3.2], all ACEM members have signed a MoU
(Memorandum of Understanding) in 2014, where they commit to have at least one of their models available for sale equipped with C-ITS technology by 2020, either as standard equipment or as optional equipment. Goals of the MoU are to embrace and become involved in C-ITS deployment movement in the transport area and to draw attention to and maximise benefit of C-ITS technology to protect PTWs as vulnerable road users. The MoU brought to the creation of the CMC (Connected Motorcycle Consortium), where ACEM is involved as associate partner. The CMC objectives are to integrate PTWs into global future ITS strategies, to join forces of the PTW industry towards the creation of a common approach for ITS technologies and to achieve a successful implementation and deployment of ITS functions on PTWs (for further info please refer to: www.cmc-info.net).
Regarding road vehicle automation, ACEM has made the following statement, which although it is not included in its roadmap yet, it forms its official position in the topic when it was specifically asked. For the purpose of this document we will consider this statement as Priority 4: “Practically all automotive manufacturers are involved in research, development and demonstration
of different levels of vehicle automation. Compared to cars (and trucks), full automation/autonomy is
not relevant/feasible for PTWs because of technical complexity and the vehicle’s characteristics.
Contrary to cars, PTWs have 3D dynamics, leaning and complex behaviour; the rider forms an
integral active part of the vehicle and has a physical influence on the vehicle dynamics.
The PTW industry is nevertheless looking at various levels of driver support/assistance functions such
as for example cruise control, adaptive cruise control, and particular PTW rider assistance systems.
ACEM expects that, together with other VRUs (Vulnerable Road Users), PTWs will continue to be
“recognized” by other road vehicles, depending on the level of automation either by the driver or by
the automated vehicle/system.
As a matter of fact, automated vehicles can offer benefits for cooperative safety: unambiguous
behaviour (e.g., no unexpected manoeuvres, zero traffic rules violations, etc.) and self-path prediction
are two key items able to provide important information to PTW riders about what the intentions of
automated vehicles.
Note: A possible future risk is that automated vehicles will gradually “displace” non/less-automated
vehicles such as motorcycles from the main road infrastructure. ACEM should continue to demand
that PTWs should be allowed to circulate freely together with other road vehicles. Automated vehicles
should be separated from traffic of non-automated vehicles if recognition of other road vehicles/users
is not / cannot be guaranteed. However, current road capacity should not be reduced to accommodate
separate roads/space for automated vehicles.”
5.1.3 Results
Alignment to Priority 2 Going in-depth Priority 1, one of the main factors, which leads riders not to wear adequate protective gear, is thermal discomfort during the summer (see as a partial bibliography (deRome et al., 2016) and (deRome et al., 2011). To develop an innovative protective gear, which assists the rider, monitoring his thermal state and dehydration and provide instant advice such as suggested rests, may highly contribute to spread the usage of adequate personal protective equipment. A possible future evolution, beyond ADAS&ME, could be to develop innovative garments able to automatically balance rider’s temperature (e.g., opening or closing vents on the jacket or even enabling a cooling system). Alignment to Priority 3.1 With regard to the eCall technology, the system to be developed in ADAS&ME will be able to monitor the rider’s psycho-physical state, information that, in case of sudden illness or crash could be sent to the PSAPs. This information could be extremely worthy for first-aiders. Speaking of which it has to be highlighted that Activity 3.5 of the i-HeERO project is focusing on developing a system capable to measure injuries severity (for further information:http://iheero.eu/library). Furthermore, vital parameters could be added in the eCall triggering algorithm, in order to reduce false positives.

ADAS&ME (688900) D1.1-SoA & Benchrmarking
March 2017 Page 157 of 238 CERTH/HIT
The timing is also good: the i-HeERO project is expected to end in December 2017, however it is not planning to develop a working system to be put into market, but rather set the basis of the system, in terms of: requirements, minimally complex architecture and reliable triggering algorithm . It is therefore unlikely that a pan-European system for PTWs will be ready before 2020-2021, thus a possible integration of ADAS&ME results with an eCall system is foreseen as an excellent future opportunity. Alignment to Priority 3.2
ADAS&ME develops functionalities which provide information about the riding environment such as weather conditions, etc. which are in line with ACEM’s MoU for adopting C-ITS features by 2020. Here the timing is good as well: ACEM’s MoU requests to OEMs to equip one of their bikes with at least one C-ITS feature by 2020, while ADAS&ME ending March 2020. After ADAS&ME, a possible improvement of the system developed in UC E and UC F could include the communication to the surrounding vehicles, through a V2V system, of information such as the sudden illness of the rider and, even that the motorcycle has activated a safety system (e.g., a system that modifies the motorcycle speed or even tries to stop it autonomously and safely). The communication with the surrounding traffic will be able to enhance the safety of all road participants, by increasing drivers’ attention and reducing crash risk in case of rider critical state. Alignment to Priority 4 About automation, ACEM is aware that OEMs (and Tier 1 suppliers) are investigating such systems and does not obstruct them. Their position expresses general statements about motorcycles peculiarities, which limit the maximum automation level achievable, and highlight that the other vehicles will have to continue detecting PTWs. Therefore it is not possible to state that the automation features included in UC E and UC F are in line with the association’s priorities or not, however they can be considered as an alignment gap.
5.1.4 Conclusion
The following table (Table 20) presents the main outcomes of the alignment process for this section with regards to agreement and disagreement of each priority to objectives of ADAS&ME as a project and the content of relevant UCs.
Table 20: Overview of alignment results to ACEM priorities
AC
EM
Priority Agreement /Possible
Future Synergies
Disagreement Gaps
Protective gear Improve assistance (thermal comfort) to spread the use of PPE
eCall Add psycho-physical state to the information sent to PSAP to improve the aid. Use vital parameters to improve crash detection and reduce false positives.
C-ITS Weather info; Communicate rider states to other vehicles and relevant PTW automation manoeuvres to avoid critical situations
Automation systems
Automation targeted in ADAS&ME (recovery mode, active capsize control system)

ADAS&ME (688900)
March 2017
5.2 Alignment with ERTRAC prorities
ERTRAC is the European Road Transport Research Advisory Council. According to webpage (ertrac.org), it is the European technology platform which brings together road transport stakeholders to develop a common vision for road transport research in Europe. The mission of ERTRAC is “to provide a framework to focus on the coordinated efforts of public and private
resources on the necessary research activities”
supported by the European Commission.
5.2.1 Objective
The objective of this alignment is to identify to what extent the results from A.1.1 are in line with the goals and priorities given by ERTRAC in the ERTRAC Automated Driving Roadmap. The outcome should be an understanding whether thexisting gaps that need to be further addressed.
5.2.2 ERTRAC’S priorities
The ERTRAC priorities and goals elaborated in this document are summarized from the ERTRAC Automated Driving Roadmap (linkERTRAC are: safety, energy efficiency, reliability of schedules, and urban accessibility
specifically, the given priorities have an impact on: Safety: reduce accidents caused by human errors. Efficiency and environmental objectives
time in congested traffic. Smoother traffic will help to emissions of the vehicles.
Accessibility: facilitate access to city
Automated driving is considered an opportunity to support all these challenges. These priorities in relation to automation research are illustr
Figure 104: ERTRAC Strategic Research Agenda, System approach to Road Transport Societal
Further, automation is considered to support automated driving is activated) and impaired users). In order to enable automated driving, the vehicles need to precision and reliability. Efforts should focus on e.g.data sources, V2X. Vehicle communication will have a great impact on reliability and safety and is a prerequisite to enable automated driving functions. Trust and safety are issues concerned by professional drivers that have an impact on social and user acceptance. becomes important, and highly automated vehicles should enable a safe interaction and usage.
D1.1
Page 158 of 238
Alignment with ERTRAC prorities
ERTRAC is the European Road Transport Research Advisory Council. According to ), it is the European technology platform which brings together road transport
stakeholders to develop a common vision for road transport research in Europe. The mission of ovide a framework to focus on the coordinated efforts of public and private
resources on the necessary research activities” (ertrac.org/mission). ERTRAC is recognized and Commission.
The objective of this alignment is to identify to what extent the results from A.1.1 are in line with the goals and priorities given by ERTRAC in the ERTRAC Automated Driving Roadmap. The outcome should be an understanding whether the performed activity covers given priorities, or if there are existing gaps that need to be further addressed.
The ERTRAC priorities and goals elaborated in this document are summarized from the ERTRAC link). Key societal needs identified in the Strategic Research Agenda of
safety, energy efficiency, reliability of schedules, and urban accessibility
specifically, the given priorities have an impact on: : reduce accidents caused by human errors.
Efficiency and environmental objectives: increase transport system efficiency and reduce time in congested traffic. Smoother traffic will help to decrease the energy consumption and emissions of the vehicles.
: facilitate access to city centres.
Automated driving is considered an opportunity to support all these challenges. These priorities in relation to automation research are illustrated in Figure 104 below.
ERTRAC Strategic Research Agenda, System approach to Road Transport Societal
Challenges
Further, automation is considered to support comfort (enable user’s freedom for other activities when automated driving is activated) and social inclusion (ensure mobility for all, including elderly and
In order to enable automated driving, the vehicles need to perceive the environment
precision and reliability. Efforts should focus on e.g., integration of sensors and to manage different data sources, V2X. Vehicle communication will have a great impact on reliability and safety and is a prerequisite to enable automated driving functions. Trust and safety are issues concerned by
rivers that have an impact on social and user acceptance. Human factors and HMI
becomes important, and highly automated vehicles should enable a safe interaction and usage.
D1.1-SoA & Benchrmarking
CERTH/HIT
ERTRAC is the European Road Transport Research Advisory Council. According to the ERTRAC ), it is the European technology platform which brings together road transport
stakeholders to develop a common vision for road transport research in Europe. The mission of ovide a framework to focus on the coordinated efforts of public and private
). ERTRAC is recognized and
The objective of this alignment is to identify to what extent the results from A.1.1 are in line with the goals and priorities given by ERTRAC in the ERTRAC Automated Driving Roadmap. The outcome
e performed activity covers given priorities, or if there are
The ERTRAC priorities and goals elaborated in this document are summarized from the ERTRAC ). Key societal needs identified in the Strategic Research Agenda of
safety, energy efficiency, reliability of schedules, and urban accessibility. More
: increase transport system efficiency and reduce decrease the energy consumption and
Automated driving is considered an opportunity to support all these challenges. These priorities in
ERTRAC Strategic Research Agenda, System approach to Road Transport Societal
ble user’s freedom for other activities when (ensure mobility for all, including elderly and
perceive the environment with very high integration of sensors and to manage different
data sources, V2X. Vehicle communication will have a great impact on reliability and safety and is a prerequisite to enable automated driving functions. Trust and safety are issues concerned by
Human factors and HMI becomes important, and highly automated vehicles should enable a safe interaction and usage.

ADAS&ME (688900) D1.1-SoA & Benchrmarking
March 2017 Page 159 of 238 CERTH/HIT
Technological functions and driver monitoring should support interaction between all involved automated components and functions – and manage miss usage, e.g., falling asleep or not taking back control. Specific challenges are mentioned in the ERTRAC Automated Driving Roadmap (link), relevant to ADAS&ME: (1) driver’s situation assessment, inattention and distraction are some main causes for road accidents, and (2) environment perception capabilities of sensor systems, functional safety, HMI and monitoring strategies.
5.2.3 Alignment
The focus is on creating connections between the goals and priorities identified within the ERTRAC roadmap, and the Use Cases (A-G) elaborated within ADAS&ME. The alignment connects affective states and driver monitoring systems explored in A1.1 with each Use Case and ERTRAC priorities. The connections give information about how the results from A1.1 support the developed Use Cases and further ERTRAC goals.
5.2.3.1 Alignment methodology
The alignment is performed based on the ERTRAC goals and priorities, to which the Use Cases (A-G) and results from A1.1 are related. Each Use Case support different ERTRAC priorities and each priority is related to the Use Case(s) and affective states or monitoring systems that best aligns with the given priority. Five affective states are included in the alignment, based on the project scope (ADAS&ME - Part B, Annex 1 to the Grant Agreement, 2016) and results from the literature review performed in A1.1: fatigue, stress, emotions, inattention, and rider impairment. Specific efforts are focused on how to detect driver rest. The results from the benchmarking (A1.1) are related to these affective states, to ensure that all states are covered by the investigated monitoring systems.
5.2.4 Results
5.2.4.1 Alignment to Safety
The priority can be related to all Use Cases that aim to prevent accidents on road or reduce accident risk. Increased safety is in focus in all the investigated Use Cases (A-G), based on the predefined Use Case descriptions (ADAS&ME - Annex 1 to the Grant Agreement, 2016). Several efforts to increase safety are made within the project. Existing high risk driving situations are reduced through alerting drivers that enter an inappropriate state for driving, e.g., drowsiness in Use Case A. In several Use Cases (A-D, G) safety is enhanced through enabling safe transitions between driver and vehicle. A number of driver and mental and psychological states are in the project description (ADAS&ME - Annex 1 to the Grant Agreement, 2016) defined to be related high rate crashes, such as stress, sub-optimal emotions, inattention or drowsiness. Sleepiness/drowsiness/fatigue is frequently addressed in the results of A1.1 and a variety of solutions and indicators of the state is proposed, e.g. EEG, ANOVA, PERCLOS and KSS. Some monitoring systems to use for investigation of fatigue are eye tracking (e.g., SmartEye or FaceLab) and detection of heart rate (e.g. Real Track System). These results are well aligned with the ERTRAC priority safety and can be used to manage safety challenges mentioned in the ERTRAC Automation Roadmap, such as miss-usage, e.g., falling asleep or not taking back control. For instance, monitoring and development of HMI systems that addresses the investigated states should (1) enable detection and prevention of dangerous driving situations and (2) enable driver rest – supporting the ERTRAC priority of increased safety. 5.2.4.2 Alignment to Efficiency and Environmental Objectives
This ERTRAC priority has some alignment to the Use Cases but limited alignment to the results of A1.1. HMI systems developed for all Use Cases (A-G) are dependent on environmental sensing. Environmental sensing is well aligned to ERTAC priorities, considering vehicles’ need to perceive the environment (ERTRAC Automation Roadmap). Further, several Use Cases (E, F, D) support enhancement of V2V and V2X communication that is well aligned to the ERTAC priority considering increased efficiency in congested traffic (ERTRAC Automation Roadmap). For instance, efficiency can be enhanced by environmental sensing, which is performed in the project but not benchmarked in A1.1. Detection of rest is related to the affective state fatigue and is investigated in e.g., Use Case A and

ADAS&ME (688900) D1.1-SoA & Benchrmarking
March 2017 Page 160 of 238 CERTH/HIT
reflected in the results of A1.1. The possibility to rest can be related to work efficiency – if a driver can rest during automated drive, the total driving period can be extended. Identification of benefits related to automation, of which rest is one, is a part of the ERTRAC strategy towards increased social acceptance towards automation. This can be also lined with ADAS&ME UC B which targets the better management of the driving range with efficient drive – supporting the ERTAC priority efficiency. Reduced fuel or power consumption can be interpreted as an environmental objective of ERTRAC. This is in focus in Use Case B, which aims to increase the willingness to use electric vehicles. Overall reduced consumption is not focus in the project research but should be achieved through application of a higher level of automated driving. 5.2.4.3 Alignment to Accessibility
Increased accessibility might be achieved through the implementation of Use Case G, in which the bus driver is allowed the appropriate time to monitor passengers’ embarkation/ disembarkation, enhancing the mobility of all travellers. HMI solutions that enable automation (and thereby accessibility) have been also investigated in A1.1, fostering the enhanced interaction of the driver both with the automated system and the passengers. 5.2.4.4 Alignment to Comfort
Increased comfort and released time for driver to focus on other work tasks is achieved in several Use Cases (A, C, G, E), in which the driver e.g., can use secondary devices or help passengers to board and disembark. The willingness to perform secondary tasks might be achieved by building trust in the technology, through appropriate and personalised HMI development and communication with the driver. HMI solutions are addressed in the results of A1.1, and are further dependent on the investigated affective states (fatigue, stress, inattention, etc.). Furthermore, rest is enabled in the majority of the Use Cases, supporting the ERTRAC priority of increased driver comfort. 5.2.4.5 Alignment to Social Inclusion
Use Case G enables mobility for elderly and impaired users, since the proposed automation allows the bus driver to help passengers to embark and disembark. As stated in the ERTRAC priority comfort, the possibility to release time for these activities depends on the offered HMI solutions and further supported by the investigated affective states.
5.2.5 Conclusion
The following table (Table 21) presents the main outcomes of the alignment process for this section with regards to agreement and disagreement of each priority to objectives of ADAS&ME as a project and the content of relevant UCs.

ADAS&ME (688900) D1.1-SoA & Benchrmarking
March 2017 Page 161 of 238 CERTH/HIT
Table 21: Overview of alignment results to ERTRAC’s priorities E
RT
RA
C
Priority Agreement Disagreement Gaps
Safety
Fulfilled in ADAS&ME through investigation of all affective states (driver fatigue, inattention, etc.). Seek to reduce accidents caused by human error – achieved through different driver monitoring systems: heart rate, EEG, activity data, eye-tracking, etc. Priority is addressed in all Use Cases (A-G)
No disagreements are found between the results from A1.1. and ERTRAC priorities. The priorities in ERTRAC are broadly described while the results from A1.1. are detailed descriptions of states and monitoring systems – i.e., it is not always clear how well these align.
Energy
efficiency and
Environmental
Objectives
Enable increased efficiency due to detection of rest, investigated in UCA. Enable environmental objectives and decreased power consumption is achieved through UCB.
--- Environmental sensors are not investigated in A1.1., but in other work packages.
Accessibility
Some fulfilment through enabling the driver to help older passengers in UCG. Detection of states and HMI design should support bus driver to focus on other work.
--- Low focus on accessibility within ADAS&ME
Comfort
Fulfilled through enabling user’s freedom for other activities and rest during automated driving, investigated in some Use Cases (A, C, G, and E). Aligned with monitoring systems that detect rest, e.g. eye-tracking and heart rate. HMI design should support driver to do other work (includes all investigated affective states)
--- Identification of what other activities users are able to do during automated drive
Social inclusion
Limited fulfilment through enabling driver to help older passengers in UCG. Poor alignment with results from A1.1 – detection of states and HMI design should support bus driver to focus on other work.
--- Low focus on enabling mobility for all users in ADAS&ME

ADAS&ME (688900) D1.1-SoA & Benchrmarking
March 2017 Page 162 of 238 CERTH/HIT
5.3 Alignment with Trilateral Working Group on Automation (EU-US-Japan) – CARTRE project
5.3.1 Objectives
Automated Road Transport (ART) is seen as one of the key technologies and major technological advancements influencing and shaping our future mobility and quality of life. The ART technology encompasses passenger cars, public transport vehicles, and urban and interurban freight transport and also extends to the road, IT and telecommunication infrastructure needed to guarantee safe and efficient operations of the vehicles. The European Commission places a high priority on the deployment of automated road transport. It has set up two projects that will work together with a broad range of international stakeholders to ensure that these technologies are deployed in a coordinated and harmonised manner, which will accelerate the implementation of safe and connected automated driving in Europe. CARTRE and SCOUT projects are offering a joint networking platform towards the alignment of road vehicle automation activities in Europe (http://connectedautomateddriving.eu). SCOUT brings together the automotive, telecommunications and ICT industries to conceive use cases and business models to leverage the investments into technology development. It targets to promote a common roadmap of the automotive and the telecommunication and digital sectors for the development and accelerated implementation of safe and connected and high-degree automated driving in Europe. CARTRE brings together more than sixty organisations with view to consolidate the current industry and policy fragmentation surrounding the development of automation in road transport. CARTRE will run for two years and aims to establish a joint stakeholders forum in order to coordinate and harmonise automated road transport approaches at European (e.g. strategic alignment of national action plans for automated driving) and international level (in particular with the US and Japan).
5.3.2 CARTRE’s priorities
CARTRE Coordination Action addresses the following priorities: • Accelerate development and deployment of automated road transport by increasing market
and policy certainties.
• Support the development of clearer and more consistent policies for EU Member States in
collaboration with industry players, ensuring that automated road transport systems
and services are compatible at EU level and are deployed in a coherent way.
• Create a solid knowledgebase of all European activities, to support current activities and
structure research outcomes by enablers and thematic areas.
• Setup a platform for sharing and re-using data and experiences from different automated
road transport systems.
• Actively support Field Operational Tests (FOTs) and pilots carried out at National and
European levels.
• Work on future visions, potential impacts and research gaps in the deployment of automated
road transport.
5.3.3 Methodology
CARTRE is a project that has started near the fall of the VRA project, during which the Trilateral Working Group EU-US-Japan on road vehicle automation was established. Within CARTRE several ADAS&ME partners are involved (CERTH, IDIADA, VALEO, TOMTOM, CONTI, DLR, IFSTTAR), therefore offering a great networking opportunity to communicate the ADAS&ME solutions and innovation. A first step is to connect the actions and results of A1.1.
5.3.4 Results
The related CARTRE project objectives are the following: OBJ-01 Establish European leadership through public-private collaboration for development
and deployment of ART

ADAS&ME (688900) D1.1-SoA & Benchrmarking
March 2017 Page 163 of 238 CERTH/HIT
OBJ-02 Support international cooperation activities in the area of road automation at global level, in particular with the US and Japan
OBJ-03 Support Strategic alignment of national action plans for automated driving OBJ-04 Ensure that stakeholders are well informed of past, current OBJ-05 Actively support ART pilots and test beds OBJ-06 Report on progress of ART projects on enablers and thematic areas OBJ-07 Facilitate exchange of data, experience and knowledge for comparing and deploying
results from pilots OBJ-08 Foster a common evaluation framework across ART projects OBJ-09 Describe possible deployment alternatives and evaluate their impacts OBJ-10 Reach out to stakeholders, decision makers and wider public OBJ-11 Establish annual international conferences, and workshops in Europe
5.3.5 Conclusion
The following table (Table 22) presents the main outcomes of the alignment process for this section with regards to agreement and disagreement of each priority to objectives of ADAS&ME as a project and the content of relevant UCs.
Table 22: Overview of alignment results to CARTRE’s priorities
CA
RT
RE
Priority Agreement /Possible
Synergies
Disagreement Gaps
Objectives 1, 3, 4, 6, 10, 11
Improve knowledge transfer across domains to better understand measuring complex states such as faint and rest, not covered in literature
Not known yet if there will be any
Measuring complex states such as faint and rest, not covered in literature
Objectives 2, 5, 7, 8, 9
Learn from countries already implemented and deployed automation
Cultural, policy, legislative and transportation and infrastructure variations and differences need to be considered in order communication to be effective. Disruptive technologies do not adhere the same in different countries.
Automated vehicles’ technologies are not the same as automated functions. Therefore, the technology and know-how gap might exist and transferability might not solve them.
5.4 Alignment with Euro NCAP priorities
5.4.1 Objectives
As it is known, in June 2014, Euro NCAP announced its plans on how it will further develop its 5-star overall safety rating system over the next years. New goals and priorities were set for updating the assessment programme in order to promote and reward continued safety improvements in vehicles on the European market. This proves how challenging a task is to define future rating targets for the next generation of safety systems, whose technical performance, market availability, test limitations, driver acceptance, etc. can only be assumed.
5.4.2 NCAP’s priorities
Test and assessment protocols for ADAS started in 2014 through the IWI WG (Information, Warning
ADAS&ME (688900) D1.1-SoA & Benchrmarking
March 2017 Page 164 of 238 CERTH/HIT
and Intervention Working Group). Initially this group, absolutely targeted safety systems, was called HMI WG (Human Machine Interface Working Group), but soon was renamed to be more representative to the discussion on the covered functions.
Also in 2014, IDIADA, as a Euro NCAP official test house, gets involved in the IWI WG and starts to work on the validation and assessment process of ADAS (Advanced Driver Assistance Systems).
OICAS’s contribution was really important to this group as this institution offered a well-defined categorization of the Advanced Driver Assistant Systems (ADAS) in which they were working on.
OICA (Organisation Internationale des Constructeurs d'Automobiles) represents the global automotive industry that drives economic progress. They connect people, products and services to enhance quality of life and sustainable mobility. They are committed to technological innovation in the areas of safety, environment, fuel efficiency, and they seek global harmonization of safety and environmental standards to benefit all countries.
This organization considered that there were three different categories for ADAS as active safety systems. Thus, it clusters such systems in Category A, Category B and Category C.
• Category A: INFORMATION and WARNING (classic driver assistance). When only indirect influence on the dynamic driving task by the driver exists. It means that the driver controls everything.
• Category B: AUTOMATIC (from advanced driver assistance towards “automated driving”). When it has direct influence on the dynamic driving task but the driver can always switch off or override the system.
• Category C: INTERVENING in EMERGENCY (close to accident situations). When it has direct influence on the dynamic driving task but the driver is definitely not able to master the situation.
Under these main categories OICA identified three different subcategories divided by the “existence of threat” criteria. These subcategories are:
• No threat. Information only • Abstract threat (i.e. a distance warning, when the car in front is not braking) • Concrete threat (i.e. a Forward Collision Warning FCW when the car in front is braking)
Combining these different ideas, the Working Group introduced a subdivision of each function and decided to define what type of “HMI” must be given to the driver for each case (DEFAULT STATUS, Quantity in modality, etc.). In this regard, IWI WG also decided to focus on the requirements for information provision after an intervention is enabled for Category C. Specifically, what type of information is necessary to communicate after an intervention happens; how to achieve a “Come back to driving awareness”. IWI WG allocates the systems in these categories and subcategories to get clues on understanding what type of HMI is needed to achieve the aims proposed.
Currently, IWI WG appears to have all “Category A” ADAS well advanced and we may also consider the same for “Category C” as well. Regarding “Category B”, it is clearly the most complicated of the three categories in several testing fields. For HMI under “Category C,” we have to consider a continuous interaction, which means extra attention. It appears that the dependent and independent variables and the test protocol in these cases demand more accurate situations (special sensors, new parameters, extra instrumentation, different kind of results, complex requirements, quantity of essays to make verdicts, etc.). It is therefore a great challenge pursuing required features such as consistency, balance and fairness in future protocols.
Taking up Euro NCAP strategy lines, last rating review from Euro NCAP highlighted that from year 2018 onwards it is expected that five star cars will have to gradually demonstrate higher levels of crash avoidance performance. To achieve this, a multi-sensor solution is expected to be a prerequisite. Even more, the next generation of systems that will emerge in the years 2020 and after will offer even higher performance. Beyond 2020 Euro NCAP will monitor and stimulate the development and market availability of key technology such as C-ITS and driver monitoring systems for inclusion into its rating scheme from 2020 onwards.
Euro NCAP has started a dialogue with industry regarding the information, warning and intervention (IWI) strategy related to safety functions. It intends to develop general guidelines that will support the

ADAS&ME (688900) D1.1-SoA & Benchrmarking
March 2017 Page 165 of 238 CERTH/HIT
relevant protocols implemented from 2018 onwards.
As Euro NCAP says “It is vital that any expansion of Euro NCAP activities is based on robust scientific procedures and best practices which are open and transparent. This is critical for ensuring that Euro NCAP maintains its credibility among the automotive stakeholders as well as the community in general”. In particular, the IWI WG mind distraction and inattention is aware about this fact and tries to combat and counteract it with protocols, strategies and exhaustive studies and also by being in the loop as much as possible.
5.4.3 Methodology
Independently of all these new developments and achievements, if we look at what is happening nowadays we realize that the new HMI protocols guidelines from IWI are not applied yet. Moreover, it seems that HMI is losing importance in Euro NCAP rating. For example, for 2018 we conclude that:
1. There is no HMI rating, only pre-requisite for AEB: default ON. 2. It is possible to find that AEB Interurban assessment points distribution dedicates only 0.5
points for the HMI (supplementary warning and pre-pre-tensioner). 3. AEB Pedestrian has no HMI, just default ON. 4. LDW has a mechanism to warn, but there is no HMI assessment.
However, when Euro NCAP was informed about ADAS&ME and that the project was looking for an alignment, they showed a high interest to collaborate and attend to dedicated meetings, which are considered as the most appropriate tool, in order to share knowledge and concerns about the future of HMI and driver state monitoring assessment in the upcoming protocols.
Thus, ADAS&ME is investigating the feasibility of inviting Mr. Michiel van Ratingen (Secretary General at Euro NCAP) to seek for collaborative points and strengths. As a next step, ADAS&ME may establish a MoU with Euro NCAP (to safeguard potential confidentiality) and support the exchange of information especially in key safety areas of the forthcoming 2025 Euro NCAP roadmap.
Concluding, the first communication steps towards a strong alignment between ADAS&ME and Euro NCAP have been established and will be further boosted the next few months. The goal is to achieve triggering Euro NCAP to adapt driver monitoring as a key safety priority for its future vision and strategy.
5.4.4 Results
The following Table presents the main results from this alignment effort. It should be kept in mind that this is an ongoing process for the categories included below that are most relevant to UCs C and D.
Table 23: Overview of alignment results to NCAP’s priorities
NC
AP
Priority Agreement /Possible
Synergies
Disagreement Gaps
Category A, B and C
Need for HMI ratings for information, warnings, automation take over, and emergency situations
There is no apparent disagreement; however collaboration has just been established.
Prerequisites are not set for all categories Consideration for different vehicles and use of in-vehicle technologies (e.g. role of automation within IoT)
6 Conclusions
This Deliverable presents the results of a thorough literature review per affective state and relevant UCs as well as a detailed product search per cluster of user type (i.e. driver and rider) and then per affective state that will be addressed within respective UCs. Most systems related to UC A are actually technologies existing in passenger cars that can be/ have
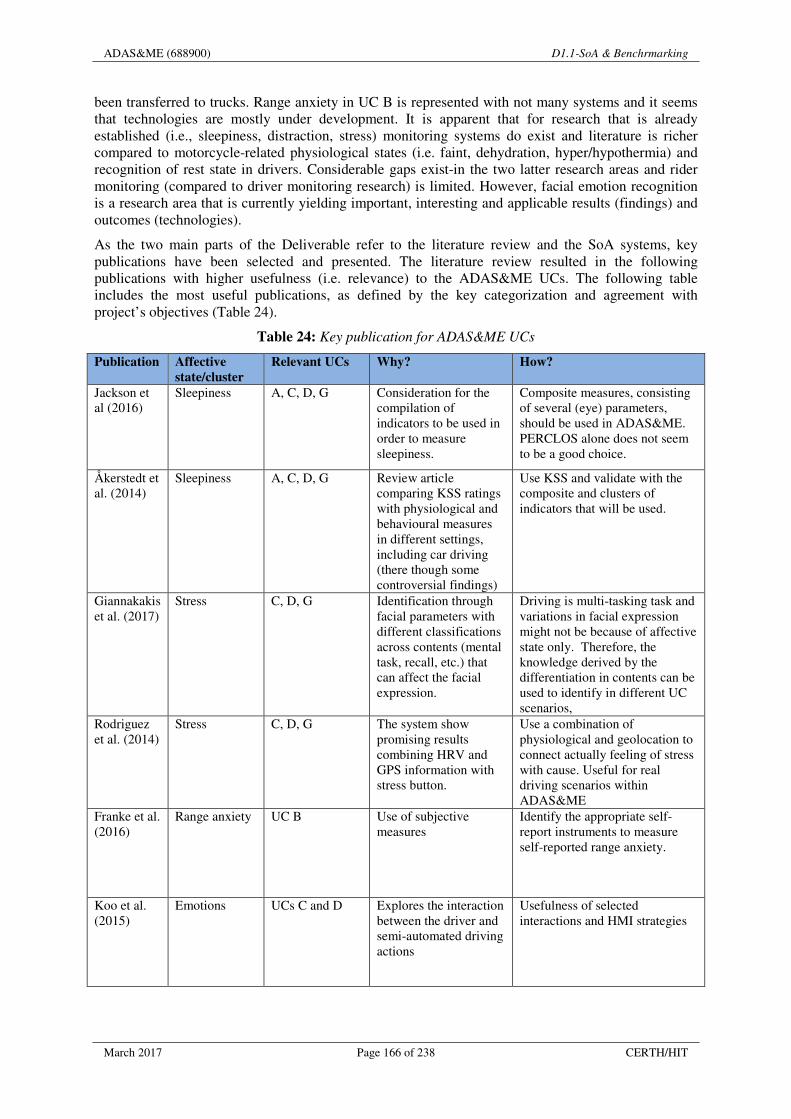
ADAS&ME (688900) D1.1-SoA & Benchrmarking
March 2017 Page 166 of 238 CERTH/HIT
been transferred to trucks. Range anxiety in UC B is represented with not many systems and it seems that technologies are mostly under development. It is apparent that for research that is already established (i.e., sleepiness, distraction, stress) monitoring systems do exist and literature is richer compared to motorcycle-related physiological states (i.e. faint, dehydration, hyper/hypothermia) and recognition of rest state in drivers. Considerable gaps exist-in the two latter research areas and rider monitoring (compared to driver monitoring research) is limited. However, facial emotion recognition is a research area that is currently yielding important, interesting and applicable results (findings) and outcomes (technologies).
As the two main parts of the Deliverable refer to the literature review and the SoA systems, key publications have been selected and presented. The literature review resulted in the following publications with higher usefulness (i.e. relevance) to the ADAS&ME UCs. The following table includes the most useful publications, as defined by the key categorization and agreement with project’s objectives (Table 24).
Table 24: Key publication for ADAS&ME UCs
Publication Affective
state/cluster
Relevant UCs Why? How?
Jackson et al (2016)
Sleepiness A, C, D, G Consideration for the compilation of indicators to be used in order to measure sleepiness.
Composite measures, consisting of several (eye) parameters, should be used in ADAS&ME. PERCLOS alone does not seem to be a good choice.
Åkerstedt et al. (2014)
Sleepiness A, C, D, G Review article comparing KSS ratings with physiological and behavioural measures in different settings, including car driving (there though some controversial findings)
Use KSS and validate with the composite and clusters of indicators that will be used.
Giannakakis et al. (2017)
Stress C, D, G Identification through facial parameters with different classifications across contents (mental task, recall, etc.) that can affect the facial expression.
Driving is multi-tasking task and variations in facial expression might not be because of affective state only. Therefore, the knowledge derived by the differentiation in contents can be used to identify in different UC scenarios,
Rodriguez et al. (2014)
Stress C, D, G The system show promising results combining HRV and GPS information with stress button.
Use a combination of physiological and geolocation to connect actually feeling of stress with cause. Useful for real driving scenarios within ADAS&ME
Franke et al. (2016)
Range anxiety UC B Use of subjective measures
Identify the appropriate self-report instruments to measure self-reported range anxiety.
Koo et al. (2015)
Emotions UCs C and D Explores the interaction between the driver and semi-automated driving actions
Usefulness of selected interactions and HMI strategies

ADAS&ME (688900) D1.1-SoA & Benchrmarking
March 2017 Page 167 of 238 CERTH/HIT
Publication Affective
state/cluster
Relevant UCs Why? How?
Craye & Karray (2015)
Inattention/distraction/
Relevant UCs C, D, G. Indirectly relevant to E.
Each module developed to detect distraction is obtained independently
Independent and easily interchangeable modules could be used for other types of inference, such as fatigue and detection. Very interesting for ADAS&ME, where multi-sourced indicators will be fed to the algorithms.
In addition, all systems searched and added in the Deliverable were rated (1: Low to 5: High) based on the following selected benchmarking indicators. The accumulated ratings (per cluster of systems) are presented in the following line chart (Figure 106) offering a clear and coherent picture across products and systems. The systems were scored by the same 5 internal experts.
− Relevance to UC (high or low) − Relevance to affective state (high or low) − Performance (based on studies) − ADAS (if automated functions are included) − Diversability (if it can be used in more than one type of vehicles) − Handling (self-reported or anticipated easiness to use) − Driver comfort − HMI
In the following line chart (Figure 105), an overview of the benchmarking results is presented.
Figure 106: Benchmarking results
Sc
or
e
(1=
Lo
w
–
5=
Hig
h)

ADAS&ME (688900) D1.1-SoA & Benchrmarking
March 2017 Page 168 of 238 CERTH/HIT
It shows that the physiological measures (of UC E), range anxiety and rest received the lowest scores for ADAS related systems. Range anxiety received the lowest Diversability (i.e. found in different vehicles and/or with other systems/ measures). Environmental sensing scored lowest for comfort and HMI (i.e. limited interaction with users – feel disconnected with no control). Finally, it seems that there is an overlap in some technologies across affective states and UCs and, hence, it will be much more cost-effective to use the same systems to detect different affective states. In addition, collaboration and communication among selected system needs to be achieved with less effort as possible. This is necessary in order to satisfy the detection and monitoring of an affective state.
In conclusion, current systems that are well-defined and validated are the ones that are existing in-vehicle technologies. Sleepiness, fatigue, and stress are well-defined and systems have been tested (i.e. many products exist). Physiological states and rest are supported less by literature and products. It seems that emotional recognition/ detection should be better based on categories than “flow”; at least with existing technologies. Wearables of many forms (e.g. textiles, watches, etc.) are apparently great research “tools” for simultaneously detecting and monitoring multiple affective states (especially stress, activity, temperature, dehydration, GSR) regardless selected vehicle type.

ADAS&ME (688900) D1.1-SoA & Benchrmarking
March 2017 Page 169 of 238 CERTH/HIT
References
Åkerstedt, T., Anund, A., Axelsson, J., & Kecklund, G. (2014). Subjective sleepiness is a sensitive indicator of insufficient sleep and impaired waking function. Journal of sleep research, 23(3), 242-254. Åkerstedt, T., & Gillberg, M. (1990). Subjective and objective sleepiness in the active individual. International Journal of Neuroscience, 52(1-2), 29-37. Apparies, R.J., Riniolo, T.C., Porges, S.W., 1998. A psychophysiological investigation of the effects of driving longer-combination vehicles. Ergonomics 41, 581–592. doi:10.1080/001401398186766. Baker, S., 2004. Real-time non-rigid driver head tracking for driver mental state estimation. Robot. Inst. Bekiaris, E., Nikolaou, S., 2004. Sensors for driver monitoring: current limitations and towards new sensor concepts. Presented at the European Congress on Intelligent Transportation Systems and Services, 4th, 2004, Budapest, Hungary. Bekiaris, E. (1999) SAVE project Final report. Bekiaris, E.; Portouli, E.; Papakostopoulos, V.; Maglaveras, N. On-road experiment for collecting driving behavioural data of sleepy drivers. Somnology 2007, 11, 259–267. Bergasa, L.M., Nuevo, J., Sotelo, M.., Barea, R., Lopez, M.E., 2006. Real-time system for monitoring driver vigilance. IEEE Trans. Intell. Transp. Syst. 7, 63–77. doi:10.1109/TITS.2006.869598 Brookhuis, K. (1995). Integrated systems. Results of experimental tests, recommendations for introduction, Report Deter, Deliverable 18, EC, University of Groningen. Brookhuis, K.A., De Waard, D., 1993. The use of psychophysiology to assess driver status. Ergonomics 36, 1099–1110. doi:10.1080/00140139308967981. Brown, DJ; Brugger, H; Boyd, J; Paal, P (Nov 15, 2012). "Accidental hypothermia.". The New England Journal of Medicine. 367 (20): 1930–8. Byers, J. C., Bittner, A.C., Hill, S.G. (1989). Traditional and raw task load index (TLX) correlations: are paired comparisons necessary? Paper presented at the International Industrial Ergonomics and Safety Conference, Cincinnati, Ohio. Cabanac, Michel (2002). "What is emotion?" Behavioural Processes 60(2): 69-83. Dawson, D., Searle, A. K., & Paterson, J. L. (2014). Look before you (s) leep: evaluating the use of fatigue detection technologies within a fatigue risk management system for the road transport industry. Sleep medicine reviews, 18(2), 141-152. Dement, W. C., Miles, L. E., & Carskadon, M. A. (1982). “White paper” on sleep and aging. Journal of the American Geriatrics Society, 30(1), 25-50. de Rome, Liz, Ivers, Rebecca, Haworth, Narelle L., Heritier, Stephane, Du, Wei, & Fitzharris, Michael (2011) Novice riders and the predictors of riding without motorcycle protective clothing. Accident Analysis and Prevention, 43(3), pp. 1095-1103. Deng, Y. Z. Wu, C. H. Chu and T. Yang, “Evaluating feature selection for stress identification,” Information Reuse and Integration (IRI), 2012 IEEE 13th International Conference on , vol., no., pp. 584-591, 8-10 Aug. 2012.

ADAS&ME (688900) D1.1-SoA & Benchrmarking
March 2017 Page 170 of 238 CERTH/HIT
De Waard, D. (1996). The Measurement of Drivers' Mental Workload., University of Groningen, Groningen. Edenborough, N.; Hammoud, R.; Harbach, A.; Ingold, A.; Kisaˇcanin, B.; Malawey, P.; Newman, T.; Scharenbroch, G.; Skiver, S.; Smith, M.; et al. Driver state monitor from delphi. In Proceedings of the IEEE Computer Society Conference on Computer Vision and Pattern Recognition, Miami, FL, USA, 20–25 June 2005; Volume 2, pp. 1206–1207. Ekman, P. (1999). "Basic Emotions". In: T. Dalgleish and M. Power (Eds.). Handbook of Cognition and Emotion. John Wiley & Sons Ltd, Sussex, UK. Engström, J., Monk, C. A., Hanowski, R. J., Horrey, W. J., Lee, J. D., McGehee, D. V., ... & Victor, T. (2013). A conceptual framework and taxonomy for understanding and categorizing driver inattention. Brussels, Belgium: European Commission. Egelund, N., 1982. Spectral analysis of heart rate variability as an indicator of driver fatigue. Ergonomics 25, 663–672. doi:10.1080/00140138208925026. Esteve, D., Coustre, A, Garajedagui, M. (1995). L’ integration de systemes electroniques dans la voiture su XXI siècle. Cepadues Editions. Exmovere Holdings Inc, 2011. The New Biotechnological Frontier: The Empath Watch. Fernández, A., Usamentiaga, R., Carús, J. L., & Casado, R. (2016). Driver distraction using visual-based sensors and algorithms. Sensors, 16(11), 1805 Gao, H., Yuce, A., Thiran, J.-P., 2014. DETECTING EMOTIONAL STRESS FROM FACIAL EXPRESSIONS FOR DRIVING SAFETY. Presented at the International Conference on Image Processing (ICIP) 2014. Hajime, I. T. O., ATSUMI, B., Hiroshi, U. N. O., & AKAMATSU, M. (2001). Visual distraction while driving: trends in research and standardization. IATSS research, 25(2), 20-28. Hankins, T. C., & Wilson, G. F. (1998). A comparison of heart rate, eye activity, EEG and subjective measures of pilot mental workload during flight. Aviation Space and Environmental Medicine, 69(4), 360-367. Harmon-Jones, E.; Vaughn-Scott, K.; Mohr, S.; Sigelman, J.; Harmon-Jones, C. (2004). "The effect of manipulated sympathy and anger on left and right frontal cortical activity". Emotion. 4: 95–101. Hargutt, V. (2003b). Das Lidschlussverhalten als Indikator für Aufmerksamkeits- und Müdigkeitsprozesse bei Arbeitshandlungen. In VDI-Gesellschaft Fahrzeug- und Verkehrstechnik (Hrsg.), Reihe 17: Biotechnik/Medizintechnik (VDI-Fortschritt-Bericht, Nr. 233). Düsseldorf: VDI-Verlag. Hawley JA, Reilly T (1997). "Fatigue revisited". Journal of sports sciences. 15 (3): 245–6. doi:10.1080/026404197367245. PMID 9232549. Healey, J.., Picard, R.W., 2005. Detecting stress during real-world driving tasks using physiological sensors. IEEE Trans. Intell. Transp. Syst. 6, 156–166. doi:10.1109/TITS.2005.848368. Hendy, K. C., Hamilton, K. M., & Landry, L. N. (1993). Measuring Subjective Workload - When Is One Scale Better Than Many. Human Factors, 35(4), 579-601.

ADAS&ME (688900) D1.1-SoA & Benchrmarking
March 2017 Page 171 of 238 CERTH/HIT
Hoedemaker, M. 2002. Summary Description of Workload Indicators: Workload Measures. Human Machine Interface and the Safety of Traffic in Europe Growth Project. s.l. : HASTE. Institute for Transport Studies. Leeds, UK: University of Leeds., 2002. Horrey, William J., Mary F. Lesch, Marvin J. Dainoff, Michelle M. Robertson, and Y. Ian Noy. "On-board safety monitoring systems for driving: review, knowledge gaps, and framework." Journal of safety research 43, no. 1 (2012): 49-58. Hill, S. G., Lavecchia, H. P., Byers, J. C., Bittner, A. C., Zaklad, A. L., & Christ, R. E. (1992). Comparison of 4 Subjective Workload Rating-Scales. Human Factors, 34(4), 429-439. Hu, S.; Zheng, G. Driver drowsiness detection with eyelid related parameters by support vector machine. Exp. Syst. Appl. 2009, 36, 7651–7658. Ikoma, N., 2014. Hands and Arms Motion Estimation of a Car Driver with Depth Image Sensor by Using Particle Filter, in: Rhee, S.-Y., Park, J., Inoue, A. (Eds.), Soft Computing in Machine Learning, Advances in Intelligent Systems and Computing. Springer International Publishing, pp. 75–84. Jabon, M.E., Bailenson, J.N., Pontikakis, E., Takayama, L., Nass, C., 2011. Facial expression analysis for predicting unsafe driving behavior. IEEE Pervasive Comput. 10, 84–95. doi:10.1109/MPRV.2010.46 Jeong, I.C., Jun, S. hwan, Lee, D. hee, Yoon, H.-R., 2007. Development of Bio Signal Measurement System for Vehicles, in: International Conference on Convergence Information Technology, 2007. Presented at the International Conference on Convergence Information Technology, 2007, pp. 1091–1096. doi:10.1109/ICCIT.2007.140 Jeong, I. C., Lee, D. S., Park, J. I. Ko and H. R. Yoon, “Automobile driver' s stress index provision system that utilizes electrocardiogram,” Intelligent Vehicles Symposium, 2007 IEEE , vol., no., pp. 652-656, 13-15 June 2007. Ji, Q., Yang, X., 2002. Real-Time Eye, Gaze, and Face Pose Tracking for Monitoring Driver Vigilance. Real-Time Imaging 8, 357–377. doi:10.1006/rtim.2002.0279 Ji, Q., Zhu, Z., Lan, P., 2004. Real-time nonintrusive monitoring and prediction of driver fatigue. IEEE Trans. Veh. Technol. 53, 1052–1068. doi:10.1109/TVT.2004.830974. Johns W., Tucker A., Chapman, R. (2005). A New Method for Monitoring the Drowsiness of the Drivers. International Conference on Fatigue Management in Transportation Operations, Seattle, USA, Sep 11-15, 2005. Juhola, M.; Aalto, H.; Joutsijoki, H.; Hirvonen, T.P. The classification of valid and invalid beats of three-dimensional nystagmus eye movement signals using machine learning methods. Adv. Artif. Neural Syst. 2013, 2013, doi:10.1155/2013/972412. Kamaruddin, N., Wahab, A., 2010. Driver behavior analysis through speech emotion understanding, in: 2010 IEEE Intelligent Vehicles Symposium (IV). Presented at the 2010 IEEE Intelligent Vehicles Symposium (IV), pp. 238–243. doi:10.1109/IVS.2010.5548124 Karakitsos D, Karabinis A (September 2008). "Hypothermia therapy after traumatic brain injury in children". N. Engl. J. Med. 359 (11): 1179–80 Katsis, C.D., Katertsidis, N., Ganiatsas, G., Fotiadis, D.., 2008. Toward Emotion Recognition in Car-Racing Drivers: A Biosignal Processing Approach. IEEE Trans. Syst. Man Cybern. Part Syst. Hum. 38, 502–512. doi:10.1109/TSMCA.2008.918624

ADAS&ME (688900) D1.1-SoA & Benchrmarking
March 2017 Page 172 of 238 CERTH/HIT
K. Kircher, C. Ahlstrom.( 2016) Minimum Required Attention: A Human-Centered Approach to Driver Inattention. Human Factors: The Journal of the Human Factors and Ergonomics Society. Kolli, A., Fasih, A., Al Machot, F., Kyamakya, K., 2011. Non-intrusive car driver’s emotion recognition using thermal camera, in: 2011 Joint 3rd Int’l Workshop on Nonlinear Dynamics and Synchronization (INDS) 16th Int’l Symposium on Theoretical Electrical Engineering (ISTET). Presented at the 2011 Joint 3rd Int’l Workshop on Nonlinear Dynamics and Synchronization (INDS) 16th Int’l Symposium on Theoretical Electrical Engineering (ISTET), pp. 1–5. doi:10.1109/INDS.2011.6024802 Kondyli, A., Sisiopiku, V., Barmpoutis, A., 2013. A 3D experimental framework for exploring drivers’ body activity using infrared depth sensors, in: 2013 International Conference on Connected Vehicles and Expo (ICCVE). Presented at the 2013 International Conference on Connected Vehicles and Expo (ICCVE), pp. 574–579. doi:10.1109/ICCVE.2013.6799857. M. Kumar, M. Weippert, R. Vilbrandt, S. Kreuzfeld and R. Stoll, “ Fuzzy Evaluation of Heart Rate Signals for Mental Stress Assessment,” IEEE Transactions on Fuzzy Systems, vol. 15, no. 5, pp. 791-808, Oct. 2007. Ingre, M.; ÅKerstedt, T.; Peters, B. Anund, A.; Kecklund, G. Subjective sleepiness, simulated driving performance and blink duration: Examining individual differences. J. Sleep Res. 2006, 15, 47–53. Ishiguro, H.; Hayashi, T.; Naito, T.; Kasugai, J.; Ogawa, K.; Ohue, K.; Uozumi, S. Development of facial-direction detection sensor. In Proceedings of the 13th Its World Congress, London, UK, 8–12 October 2006. Lazarus, R. S., & Folkman, S. (1984). Stress, appraisal, and coping. New York: Springer. Leng, H., Lin, Y., Zanzi, L.A., 2007. An Experimental Study on Physiological Parameters Toward Driver Emotion Recognition, in: Dainoff, M.J. (Ed.), Ergonomics and Health Aspects of Work with Computers, Lecture Notes in Computer Science. Springer Berlin Heidelberg, pp. 237–246. Li, B.Y.L., Mian, A., Liu, W., Krishna, A., 2013. Using Kinect for face recognition under varying poses, expressions, illumination and disguise, in: 2013 IEEE Workshop on Applications of Computer Vision (WACV). Presented at the 2013 IEEE Workshop on Applications of Computer Vision (WACV), pp. 186–192. doi:10.1109/WACV.2013.6475017. Lin, Y., Leng, H., Yang, G., Cai, H., 2007. An Intelligent Noninvasive Sensor for Driver Pulse Wave Measurement. IEEE Sens. J. 7, 790–799. doi:10.1109/JSEN.2007.894923. Liz de Rome, Elizabeth A. Taylor, Rodney J. Croft, Julie Brown, Michael Fitzharris & Nigel A. S. Taylor (2016) Thermal and cardiovascular strain imposed by motorcycle protective clothing under Australian summer conditions, Ergonomics, 59:4, 504-513, DOI: 10.1080/00140139.2015.1082632 López, J., & Ibañez, N. R. (2012). Development of an active system in order to detect drowsiness. SAE International journal of passenger cars-electronic and electrical systems, 5(2012-01-0283), 125-132. Lot., R., Cossalter, V., Diedricht, F., Pauzie, A., Gelau, C., Montanari, R. (2009). Pilot plans, tools and evaluation methodology. Deliverable 7.1. SAFERIDER EU Project. Mange K; Matsuura D; Cizman B; et al. (1997). "Language guiding therapy: the case of dehydration versus volume depletion". Ann. Intern. Med. 127 (9): 848–53

ADAS&ME (688900) D1.1-SoA & Benchrmarking
March 2017 Page 173 of 238 CERTH/HIT
Matsuda, T., Makikawa, M., 2008. ECG monitoring of a car driver using capacitively-coupled electrodes, in: 30th Annual International Conference of the IEEE Engineering in Medicine and Biology Society, 2008. EMBS 2008. Presented at the 30th Annual International Conference of the IEEE Engineering in Medicine and Biology Society, 2008. EMBS 2008, pp. 1315–1318. doi:10.1109/IEMBS.2008.4649406 Murphy-Chutorian, E., Trivedi, M.M., 2008. HyHOPE: Hybrid Head Orientation and Position Estimation for vision-based driver head tracking, in: 2008 IEEE Intelligent Vehicles Symposium. Presented at the 2008 IEEE Intelligent Vehicles Symposium, pp. 512–517. doi:10.1109/IVS.2008.4621320 Muzet A., Penzel T., Ktonas P., Virkkala T., Anderer P., Dorffner G. (2006). List of needs and suggestions for novel sensors and improved methods for physiological data recording. Deliverable 1.2.2, Sensation EU project, GA: no. 507231. Nwe, T.L., Foo, S.W., De Silva, L.C., 2003. Speech emotion recognition using hidden Markov models. Speech Commun. 41, 603–623. doi:10.1016/S0167-6393(03)00099-2. Nabo, A. Driver attention-dealing with drowsiness and distraction. Available online: http://smarteye.se/wp-content/uploads/2015/01/Nabo-Arne-IVSS-Report.pdf (accessed on 9 December 2016). National Highway Traffic Safety Administration (NHTSA) Driver Distraction Internet Forum (2000). http://www-nrd.nhtsa.dot.gov/departments/nrd-13/driver-distraction O’Hanlon, J.F., Kelley, G.R., 1977. Comparison of Performance and Physiological Changes Between Drivers who Perform Well and Poorly During Prolonged Vehicular Operation, in: Mackie, R.R. (Ed.), Vigilance, NATO Conference Series. Springer US, pp. 87–109. Osaka, M., Murata, H., Fuwamoto, Y., Nanba, S., Sakai, K., Katoh, T., 2008. Application of heart rate variability analysis to electrocardiogram recorded outside the driver’s awareness from an automobile steering wheel. Circ. J. Off. J. Jpn. Circ. Soc. 72, 1867–1873. Otmani, S.; Pebayle, T.; Roge, J.; Muzet, A. Effect of driving duration and partial sleep deprivation on subsequent alertness and performance of car drivers. Physiol. Behav. 2005, 84, 715–724. Ouwerkerk, M., Dandine, P., Bolio, D., Kocielnik, R., Mercurio, J., Huijgen, H., Westerink, J., 2013. Wireless Multi Sensor Bracelet with Discreet Feedback, in: Proceedings of the 4th Conference on Wireless Health, WH ’13. ACM, New York, NY, USA, pp. 6:1–6:8. doi:10.1145/2534088.2534104 R. R. Singh, S. Conjeti and R. Banerjee, “Biosignal based on-road stress monitoring for automotive drivers,” Communications (NCC), 2012 National Conference on, vol., no., pp. 1-5, 3-5 Feb. 2012. Papadelis, C., Chen, Z., Kourtidou-Papadeli, C., Bamidis, P.D., Chouvarda, I., Bekiaris, E., Maglaveras, N., 2007. Monitoring sleepiness with on-board electrophysiological recordings for preventing sleep-deprived traffic accidents. Clin. Neurophysiol. 118, 1906–1922. doi:10.1016/j.clinph.2007.04.031 Park, P., Cha, D. (1998). Comparison of Subjective Mental Workload Assessment Techniques for the Evaluation of In-Vehicle Navigation System Usability. Suwon, Korea: Ajou University Park, S., Trivedi, M., 2005. Driver activity analysis for intelligent vehicles: issues and development framework, in: IEEE Intelligent Vehicles Symposium, 2005. Proceedings. Presented at the IEEE Intelligent Vehicles Symposium, 2005. Proceedings, pp. 644–649. doi:10.1109/IVS.2005.1505176

ADAS&ME (688900) D1.1-SoA & Benchrmarking
March 2017 Page 174 of 238 CERTH/HIT
Pauzié, A. (2008). A method to assess the driver mental workload: The driving activity load index (DALI). IET Intelligent Transport Systems, 2(4), 315-322. Peeters, SY; Hoek, AE; Mollink, SM; Huff, JS (April 2014). "Syncope: risk stratification and clinical decision making.". Emergency medicine practice. 16 (4): 1–22; quiz 22–3. Pierre-Yves, O., 2003. The production and recognition of emotions in speech: features and algorithms. Int. J. Hum.-Comput. Stud., Applications of Affective Computing in Human-Computer Interaction 59, 157–183. doi:10.1016/S1071-5819(02)00141-6. Regan, M. A., & Strayer, D. L. (2014). Towards an understanding of driver inattention: taxonomy and theory. Annals of advances in automotive medicine, 58, 5. Reips, U.-D. and F. Funke (2008) "Interval level measurement with visual analogue scales in Internet-based research: VAS. Rigas, G., Katsis, C. D., Bougia, P. and Fotiadis, D. I. “A reasoning-based framework for car driver’s stress prediction,” Control and Automation, 2008 16th Mediterranean Conference on, vol., no., pp. 627-632, 25-27 June 2008. Ross, P. E., 2014. Robot, you can drive my car; Autonomous driving will push humans into the passenger seat. IEEE SPECTRUM , 51(6), pp. 60-90. Samn SW, Perelli LP . Estimating aircrew fatigue: A technique with implications to airlift operations . Brooks AFB, TX : USAF School of Aerospace Medicine ; 1982 : Technical Report No. SAM-TR- 82-21. Semmer, Norbert, et al. 2007. Occupational stress research: The stress-as-offence-to-self perspective. s.l. : Nottingham University Press, 2007. Shi, Y. M., Nguyen, P. H., Blitz, B. French, S. Fisk, F. De la Torre, A. Smailagic, D. P. Siewiorek, M. Absi, E. Ertin, T. Kamarck and S. Kumar, “Personalized Stress Detection from Physiological Measurements,” International Symposium on Quality of Life Technology, 2010. Shiwu, L., Linhong, W., Zhifa, Y., Bingkui, J., Feiyan, Q. and Zhongkai, Y. “An active driver fatigue identification technique using multiple physiological features,” Mechatronic Science, Electric Engineering and Computer (MEC), 2011 International Conference on , vol., no., pp. 733-737, 19-22 Aug. 2011. Simons-Morton, B. G., Guo, F., Klauer, S. G., Ehsani, J. P., & Pradhan, A. K. (2014). Keep your eyes on the road: Young driver crash risk increases according to duration of distraction. Journal of Adolescent Health, 54(5), S61-S67. Sommer, D.; Golz, M.; Trutschel, U.; Edwards, D. Biosignal based discrimination between slight and strong driver hypovigilance by support-vector machines. In Agents and Artificial Intelligence; Springer: Berlin, Germany, 2010; Volume 67, pp. 177–187. Tawari, A., Trivedi, M., 2010. Speech based emotion classification framework for driver assistance system, in: 2010 IEEE Intelligent Vehicles Symposium (IV). Presented at the 2010 IEEE Intelligent Vehicles Symposium (IV), pp. 174–178. doi:10.1109/IVS.2010.5547956 Veeraraghavan, H., Bird, N., Atev, S., Papanikolopoulos, N., 2007. Classifiers for driver activity monitoring. Transp. Res. Part C Emerg. Technol. 15, 51–67. doi:10.1016/j.trc.2007.01.001 Vural, E., Cetin, M., Ercil, A., Littlewort, G., Bartlett, M., Movellan, J., 2007. Drowsy Driver

ADAS&ME (688900) D1.1-SoA & Benchrmarking
March 2017 Page 175 of 238 CERTH/HIT
Detection Through Facial Movement Analysis, in: Lew, M., Sebe, N., Huang, T.S., Bakker, E.M. (Eds.), Human–Computer Interaction, Lecture Notes in Computer Science. Springer Berlin Heidelberg, pp. 6–18. Watson, T., Krause, J., Le, J., Rao, M.K., 2011. Vehicle Integrated Non-Intrusive Monitoring of Driver Biological Signals (SAE Technical Paper No. 2011-01-1095). SAE International, Warrendale, PA. Zhu, Y., Fujimura, K., 2004. Head pose estimation for driver monitoring, in: 2004 IEEE Intelligent Vehicles Symposium. Presented at the 2004 IEEE Intelligent Vehicles Symposium, pp. 501–506. doi:10.1109/IVS.2004.1336434 Wierwille W. W. (1999). Historical perspective on slow eyelid closure: When PERCLOS? Technical Conference on Ocular Measures of Driver Alertness, Herndon. Websites EyeAlert - Lumeway. EyeAlert Distracted Driving and Fatigue Warning Systems.Available online: http://www.lumeway.com/EA.htm (accessed on 7 December 2016) http://emedicine.medscape.com/article/926249-clinical". emedicine.medscape.com. (accessed on 10 March 2017). http://psychologydictionary.org/confusion/ (accessed on 30/03/17) SeeingMachines. Advanced Driver Fatigue and Distraction Detection. Available online: http://www. seeingmachines.com/ (accessed on 7 December 2016) SAE. Hyundai HCD-14 Genesis Concept Previews Eye-Tracking, Gesture-Recognition Technologies. Available online: http://articles.sae.org/11727/ (accessed on 9 December 2016) SmartEye. Smart Eye Pro. Available online: http://smarteye.se/products/smart-eye-pro/ (accessed on 2 November 2016) VisageTechnologies. Face Tracking and Analysis. Available online: http://www.visagetechnologies.com/ (accessed on 8 December 2016) Volvo. Volvo Cars Introduces New Systems for Alerting Tired And Unconcentrated Drivers. Available online: http://www.mobileye.com/wp-content/uploads/2011/09/Volvo.DriverAlert.pdf (accessed on 8 December 2016)

ADAS&ME (688900) D1.1-SoA & Benchrmarking
March 2017 Page 176 of 238 CERTH/HIT
Annex. 1 Compendium of literature review
Annex 1.1 Affective state: Sleepiness
Jackson, M. L., Kennedy, G. A., Clarke, C., Gullo, M., Swann, P., Downey, L. A., & Howard, M. E. (2016). The utility of automated measures of ocular metrics for detecting driver drowsiness during extended wakefulness. Accident Analysis & Prevention, 87, 127-133. keywords: driver AND (sleepiness OR drowsiness OR fatigue) AND (detection OR monitoring OR predicting) The study aims at the comparison of two drowsiness monitors. Driving simulator performance, KSS and PVT are used as sleepiness indicators. A within-subject design was applied using extended wake to invoke sleepiness. Drivers undertake a 20min night-time motorway drive after 24h sleep deprivation. Used two sleepiness monitors: Copilot (Carnegie Mellon Research Institute) and Optalert (Optalert). Copilot use PERCLOS, Optalert use a composite measure of eyelid velocity, blink duration etc. Copilot (PERCLOS) is really not very good. Optalert metrics increased significantly with KSS and driving performance deterioration. Advantages: - Disadvantages: Optalert showed significant differences between alert and after 24 sleep deprivation, but it is not known how it performs in the transition between these states. Optalert requires a special pair of glasses with cameras and IR illumination. Outcomes: Since the optalert systems outperforms PERCLOS, it may be possible to boost the performance of remote camera systems by using the same sleepiness metric (JDS) as optalert does. Comparison to ADAS&ME: Composite measures, consisting of several (eye) parameters, should be used in ADAS&ME. PERCLOS alone does not seem to be a good choice.
Selvakumar, K., Jerome, J., Rajamani, K., & Shankar, N. (2016). Real-time vision based driver drowsiness detection using partial least squares analysis. Journal of Signal Processing Systems, 85(2), 263-274. keywords: driver AND (sleepiness OR drowsiness OR fatigue) AND (detection OR monitoring OR predicting) A new partial least squares based algorithm for classifying open/closed eyes is presented. Eye/face detection was based on Viola-Jones followed by partial least squares to separate open eyes from closed eyes. Comparison of open/closed eyes of 50 participants was performed. The data were collected during day/night with/without glasses, but the design is only used for data collection, not to invoke sleepiness. PERCLOS is used as a direct measure of sleepiness. Eye detector has a true positive rate of 96%, out of these; between 90-100% accuracy is achieved. Worst performance in darkness with glasses due to reflections (about 90%). Advantages: Works roughly in real-time (3 fps). Disadvantages: No comparison to other techniques. Difficult to know how good the results are. Outcomes: A closed-eyes detector has been developed. It is not really revealed how well it operates in realistic conditions. Comparison to ADAS&ME: The algorithm is based on PERCLOS which may not be an ideal measure of sleepiness. If it really is a robust closed-eyes detector then it can at least be used as a late-stage sleepiness or actual sleep detector. Schömig, N., Hargutt, V., Neukum, A., Petermann-Stock, I., & Othersen, I. (2015). The interaction between highly automated driving and the development of drowsiness. Procedia Manufacturing, 3, 6652-6659. The authors compared 12 motorists with high BEV driving experience (M= 60.500 km) with 12 motorists, who had never driven a BEV before. The test drive was designed to lead to a critical range situation (remaining range <trip length). Investigated the effects of highly automated driving on driver drowsiness while doing nothing compared to while performing a non-driving related additional task. Three experimental conditions: −driving with a highly automated system (HA) −driving with a HA system and additionally performing a Quiz Task (HA+QT) −driving manually during the test phase (MAN)

ADAS&ME (688900) D1.1 – SoA and Benchmarking
March, 2017 Page 177 of 238 CERTH/HIT
After a certain drowsiness level during manual drive, a test phase of 15 minutes was initiated ending with a take-over scenario. Drowsiness was highest when drivers drove manually and highly automated −While performing a secondary task drowsiness level stayed on a relatively low level. −Interesting and motivating tasks for highly automated drive has the potential to raise driver’s alertness to an extent that a massive increase in drowsiness during the activity can be prevented. Drowsiness was highest when drivers drove manually and highly automated. While performing a secondary task drowsiness level stayed on a relatively low level. Interesting and motivating tasks for highly automated drive has the potential to raise driver’s alertness to an extent that a massive increase in drowsiness during the activity can be prevented. Advantages: Address drowsiness in BEV and consideration for driving experience and automation and comparison to manual driving. Disadvantages: Only certain type of vehicle (BEV) and a simulator study. Outcomes: Interesting and motivating tasks can prevent increase of drowsiness. Comparison to ADAS&ME: performing secondary tasks can have a positive effect on avoiding drowsiness. Åkerstedt, T., Anund, A., Axelsson, J., & Kecklund, G. (2014). Subjective sleepiness is a sensitive indicator of insufficient sleep and impaired waking function. Journal of sleep research, 23(3), 242-254. keywords: driver AND (sleepiness OR drowsiness OR fatigue) AND (detection OR monitoring OR predicting) Review article comparing KSS ratings with physiological and behavioural measures in different settings, including car driving. It is actually a descriptive summary of multiple studies. There is an exponential relationship between KSS and (lane departures, slow eye movements, EEG alpha power) and also with subjective ratings on eye symptoms (heavy eye lids, gravel-eyed, difficulties keeping eyes open). Subjective ratings of sleepiness are put forward as a sensitive and valid indicator of sleepiness, which is easy to use and just as valid as other sleepiness measures. Advantages: Easy to use. Disadvantages: Not possible to measure with a sensor. It is subjective in its very nature. Comparison to ADAS&ME: KSS should be used as a reference measure of sleepiness in the ADAS&ME evaluations. Neubauer, C., Matthews, G., & Saxby, D. (2014, September). Fatigue in the Automated Vehicle: Do Games and Conversation Distract or Energize the Driver?. In Proceedings of the Human Factors and Ergonomics Society Annual Meeting (Vol. 58, No. 1, pp. 2053-2057). Sage CA: Los Angeles, CA: SAGE Publications. The study investigated whether secondary media (control, trivia games or cell phone) devices impacted subjective responses and driver performance, during fatigue drives. Subjective state response, vehicle control and reaction time to a sudden event were recorded. The media devices helped improve concurrent driver performance, minimize the loss of task engagement and elevated distress produced by vehicle automation. Media usage was not associated with faster response time. Participants completed a 45-minute simulator drive, randomly assigned to (1) non/partial/total automation and (2) control, trivia or cell phone condition. Participants in the TR and CP conditions were required to engage in a game of "trivia" or hands-free cell phone conversation during two, 10-minutes periods throughout the drive. The STISIM Model 400 simulator, equipped with a 38'' NEC XM3760 monitor. Monitors to record SDLP and reaction time. Secondary devices (cell phone, trivia game). Measures reaction time & SDLP to determine fatigue state. Subjective stress and fatigue states were assessed with the DSSQ: addressing task induced stress, task engagement, distress and worry. Meanwhile the simulator logged variability of lateral position. Response time to an emergency event was tested towards the end of the drive. Subjective stress and fatigue states were assessed pre- and post-drive, with the Dundee Stress State Questionnaire (Matthews, et al., 2002). The DSSQ yields three higher order factors of task engagement, distress and worry. All groups showed relative increases in distress and relative decreases in task engagement. ANOVA run resulted in F(2,171)=18.60, p<.001 and F(2,171)=5.91, p<.01. Engagement was lowest in the control group and highest among drivers in the trivia and cell phone groups, while distress was highest in the control and trivia groups and lowest

ADAS&ME (688900) D1.1 – SoA and Benchmarking
March, 2017 Page 178 of 238 CERTH/HIT
in cell phone group. Automation did not influence stress state response. A significant difference in SDLP was noted between cell phone and control and trivia and control groups, p<.05, but not between the trivia and cell phone groups, p>.05. Advantages: The study showed that usage of secondary media devices may improve vehicle control and reduce driver fatigue. Disadvantages: Beneficial effects of media use may be confined to low-workload driving. Study is performed in a limited simulator and the results may differ from a real life drive. Outcomes: Secondary media devices may help counteract some effects of fatigue while driving. Media conditions elevated task engagement, but did not counteract the slowed braking to an emergency event produced by automation. Cell phone use was effective in reducing distress, trivia game was not. Both automated and control drives produced large magnitude declines in task engagement. Comparison to ADAS&ME: HMI design that support secondary task in low-workload driving can reduce driver fatigue and increase task engagement. Though media usage is not associated with faster response time or lasting driver alertness. Hallvig, D., Anund, A., Fors, C., Kecklund, G., & Åkerstedt, T. (2014). Real driving at night–Predicting lane departures from physiological and subjective sleepiness. Biological psychology, 101, 18-23. keywords: driver AND (sleepiness OR drowsiness OR fatigue) AND (detection OR monitoring OR predicting) Objective is to relate unintentional lane departures to various sleepiness measures (KSS, blink duration, KDS). A within-participant design was applied using extended wake to invoke sleepiness. Drivers drive three times from 90min on a real rural road. The processing unit was based on extract blink duration from EOG, Karolinska drowsiness score from EEG and EOG, and unintentional lane departures based on video analysis. All analyses performed offline and the models applied were Baysian multi-level models (lane departure ~ KSS + blink duration + KDS + session (day/night) + exposure). Advantages: The driver is quite capable of knowing when he/she is sleepy. Disadvantages: KSS cannot be monitored by any system. Outcomes: KSS is the best indicator of lane departures. Blink duration can also be used when customized to an individual. KDS (EEG+EOG-based) is not successful in predicting lane departures. Comparison to ADAS&ME: Measures of sleepiness should be individualized. Jung, S. J., Shin, H. S., & Chung, W. Y. (2014). Driver fatigue and drowsiness monitoring system with embedded electrocardiogram sensor on steering wheel. IET Intelligent Transport Systems, 8(1), 43-50. keywords: driver AND (sleepiness OR drowsiness OR fatigue) AND (detection OR monitoring OR predicting) Measuring ECG with fabric electrodes positioned at the steering wheel. HRV parameters are related to subjective ratings of fatigue and drowsiness. The scenario included 2h driving in the real world with tasks related fatigue (not sleepiness). The technologies used involved Measures ECG via conductive fabric electrodes. Results were only descriptive. Advantages: Interesting sensor. Disadvantages: No proper validation. Outcomes: Not sure, the sensor is not properly tested so it is not possible to say much. Comparison to ADAS&ME: Similar to the steering wheels provided by Autoliv. Other studies, using medical ECG equipment, have had trouble providing reproducible results. McDonald, A. D., Lee, J. D., Schwarz, C., & Brown, T. L. (2014). Steering in a Random Forest Ensemble Learning for Detecting Drowsiness-Related Lane Departures. Human Factors: The Journal of the Human Factors and Ergonomics Society, 56(5), 986-998. Evaluation of whether more advanced steering wheel angle measures can be used to predict drowsy lane departures. 162 drowsy lane departures (ORD>37) are compared to 416 matched alert cases without lane departures (verified by PVT and subjective sleepiness). Several classification algorithms are compared and the winner (random forest) is compared to PERCLOS. This was a simulator study. Lane departures are used as an indicator of sleepiness. Each lane departure was rated using the ORD

ADAS&ME (688900) D1.1 – SoA and Benchmarking
March, 2017 Page 179 of 238 CERTH/HIT
scale (Wierwille 1994) and only lane departures with ORD>37 are used. A matched set of alert non-departures are used. Time series of unprocessed 54-seconds SWA time series data leading up to lane departures (-60s to -6s before departure) are detected via a random forest classifier. The article benchmarks different classifiers: decision tree, neural network, kNN, naive Bayes, SVM, boosted tree and random forest. Performance is comparable, but random forest is the best in terms of AUC. Accuracy of the algorithm was 79% (PERCLOS 55%) and positive predictive value was 80% (PERCLOS 88%). Advantages: The algorithm use SWA which is readily available in all vehicles. The algorithm performs better than PERCLOS, which is supposed to be a valid drowsiness measure. Disadvantages: The parameters of the random forest probably have to be retrained for each vehicle. Outcomes: The steering wheel angle alone, without taking road geometry into account, provides a decent estimate of driver sleepiness. However, the results also indicate that a lack of steering is the key feature used to predict sleepiness. This appears to be a poor indicator on long monotonous motorways (where little steering is needed and where sleepiness is a large problem). Comparison to ADAS&ME: Vehicle measures should not be ruled out for drowsiness detection, but despite what the authors claim, it is probably wise to take road geometry into account. Jin, L., Niu, Q., Jiang, Y., Xian, H., Qin, Y., & Xu, M. (2013). Driver sleepiness detection system based on eye movements variables. Advances in Mechanical Engineering. keywords: driver AND (sleepiness OR drowsiness OR fatigue) AND (detection OR monitoring OR predicting) Classify alert vs. sleep restricted conditions with SVM. Within-subject design (Sleep restriction vs baseline) using restricted sleep and afternoon dip to induce sleepiness. Driving session consisted of 2h low traffic motorway driving. SmartEye Pro system was used to measure PERCLOS, blink rate, fixation time and gaze direction. Gaze direction was calculated as percentage of time that the driver looked in the "normal fixation region", which is an undefined square area. SVM is used to classify eye features to a binary sleepiness decision. The applied model SVM is using PERCLOS, gaze direction, blink rate and fixation time as features. Individual models were used and the accuracy of the general model was 72%. Individualized models showed 85% accuracy. Advantages: Individualized models. Disadvantages: It would have been nice to complement the target class with something more than sleep restriction, for example KSS. It would also have been interesting to see how the developed sleepiness indicator performs over time, not just using an entire 2h drive as input. Outcomes: Individual models were used and the accuracy of the general model was 72%. Individualized models showed 85% accuracy. Comparison to ADAS&ME: The lesson to be learned from this paper is that we can gain a lot by individualized models. Performance drops when a general (group-level) model is applied to an individual driver. Marina, M., Torrado, P., Busquets, A., Ríos, J. G., & Angulo-Barroso, R. (2013). Comparison of an intermittent and continuous forearm muscles fatigue protocol with motorcycle riders and control group. Journal of electromyography and kinesiology, 23(1), 84-93. Motorcycle races’ long duration justify the study of forearm muscles fatigue, especially knowing the frequently associated forearm discomfort pathology. Moreover, while continuous fatigue protocols yield unequivocal results, EMG outcomes from an intermittent protocol are quite controversial. This study examined the forearm muscle fatigue patterns produced during these two protocols, comparing riders with a control group, and relating maximal voluntary contraction with EMG parameters (amplitude – NRMS and median frequency – NMF) of both protocols to the forearm discomfort among motorcycle riders. Twenty riders and 39 controls performed in separate days both protocols simulating the braking gesture and posture of a rider. EMG of flexor digitorum superficialis (FS) and carpi radialis (CR) were monitored. CR revealed more differences among protocols and groups compared to FS. To monitor rider’s inattention, relevant and important to clearly distinguish inattention due to distraction (external cause) and inattention due to fatigue (internal cause).The greater CR activation in riders could be interpreted as a neuromotor strategy to improve braking precision. When FS fatigue increased, the control group progressively shifts toward a bigger CR

ADAS&ME (688900) D1.1 – SoA and Benchmarking
March, 2017 Page 180 of 238 CERTH/HIT
activation, adopting an intermuscular activation pattern closer to riders. Despite the absence of NMF decrement throughout the intermittent protocol, which suggest that we should have shorten the recovery times from the actual 1 min, the superior number of rounds performed by the riders proved that this protocol discriminates better riders against controls and is more related to forearm discomfort. The performance related parameters of the intermittent protocol not only discriminate better the riders from the control group but have also a strong relationship with the level of forearm discomfort within the riders. These results should encourage improving and optimizing specific intermittent fatigue protocols. Both Protocols induce different EMG results, confirming a stronger fatigue round effect in the continuous protocol. The CR was the muscle group that revealed more differences among groups and protocols. Because braking requires fine tuning and precision when racing, the riders possibly are more habituated to coactivate the CR and FS. Moreover, when FS fatigue increased, it seems that the control group progressively shifted toward a larger CR coactivation, adopting an intermuscular activation pattern closer to the one of the riders. The absence of a significant NMF decrement throughout the intermittent protocol, suggests that we should modify recovery times after each MVC shorter than 1 min. Advantages: EMG used as a measure of both fatigues and inattention. Disadvantages: Professional riders have skills not necessarily found in every day or leisure riders (e.g., braking behaviour, speed adjustments). Body position can vary between subjects because the relative position between segments cannot be exactly the same among all participants due to their stature and segment lengths differences. Outcomes: Forearm discomfort might affect inattention. Comparison to ADAS&ME: To monitor rider’s inattention, relevant and important to clearly distinguish inattention due to distraction (external cause) and inattention due to fatigue (internal cause). Craig, A., Tran, Y., Wijesuriya, N., & Nguyen, H. (2012). Regional brain wave activity changes associated with fatigue. Psychophysiology, 49(4), 574-582.keywords: driver AND (sleepiness OR drowsiness OR fatigue) AND (detection OR monitoring OR predicting) Slow wave activity in the alpha and theta bands increase over the entire cortex when fatigued. Also beta increases in frontal regions. ICA-based artefact removal, spectral analyses to investigate brain wave activity in delta, theta, alpha, beta bands. All analyses performed offline. Different measures: long blink durations >400ms (EOG), expert rating of "fatigue related facial behaviours", and deviating off the road for more than 15s. Driving simulator experiment where the drivers (N=30) drove until fatigued (passive task related fatigue). Comparison between alert and fatigued conditions. The changes between alert and fatigued are highly significant, but the size of the change is rather small (typical example: 29.5 -> 30.4 dB). Advantages: The paper reviews 17 papers related to EEG changes and the results of this paper confirms previous results. Disadvantages: There are no results showing the time-evolution between the alert and the highly fatigued states. If only the highly fatigued state can be distinguished from the alert state then it is too late for a detection system. Outcomes: Changes in EEG can be used to detect severe fatigue, but the actual difference is small between alert and fatigued, and the paper says nothing about the transition phase from alert to fatigued. Comparison to ADAS&ME: Even with EEG it is difficult to design a sleepiness detection system. Dong, Y., Hu, Z., Uchimura, K., & Murayama, N. (2011). Driver inattention monitoring system for intelligent vehicles: A review. IEEE transactions on intelligent transportation systems, 12(2), 596-614. The paper review SoA technologies for driver inattention monitoring, classified into (1) distraction and (2) fatigue. Five approaches are addressed: 1. subjective report measures, 2. driver biological measures, 3. driver physical measures, 4. driving performance measures, 5. hybrid measures. Subjective (1) and biological (2) measures are not considered suitable under real driving conditions, but can be rough ground truth indicators. Hybrid measures combining driver physical measures and

ADAS&ME (688900) D1.1 – SoA and Benchmarking
March, 2017 Page 181 of 238 CERTH/HIT
performance measures are believed to give more reliable solutions. Advantages: The paper reviews various DSMSs and relates suitability for real driving conditions. Hybrid measures are supported since they minimize the number of false alarms and maintain a high recognition rate, which promote the acceptance of the system. Disadvantages: The monitoring systems are not related to automated driving. Outcomes: Hybrid measures (esp. physical and performance measures) for driver state monitoring are expected to give more reliable measures than single measures. Subjective and biological measures are not considered suitable under real driving conditions, since they can be intrusive and cause interference. Comparison to ADAS&ME: Recommended to use hybrid measures in driver monitoring. Physical and performance measures are supported, since they are considered to affect the driver less than subjective and biological measures. Senaratne, R., Jap, B., Lal, S., Hsu, A., Halgamuge, S., & Fischer, P. (2011). Comparing two video-based techniques for driver fatigue detection: classification versus optical flow approach. Machine Vision and Applications, 22(4), 597-618. Comparison of classification approaches versus optical flow to estimate eye state (open/closed). The result is used to estimate PERCLOS, which is assumed to be a good sleepiness indicator. Evaluation is done based on the FERET database and on the 9 participants. Comparison of open/closed eyes of 9 participants (5 from behind a desk, 1 from real driving, 4 from simulator). For most comparisons, data acquired from 5 subjects sitting behind a desk and mimicking fatigue are used. Face detection with LMM (Viola-Jones not good enough). Eye detection via adaptive thresholding (find iris near approximate eye location from LMM). The developed system isn't really evaluated in terms of sleepiness, mainly on open/closed eyes with/without glasses (320x240 camera). Classification: Eye pixels or wavelet coefficients are classified as open/closed using MoCC, kNN, SVM, NBC. Optical flow: Lucas-Kanade calculates the velocity of the upper eyelid in relation to the eye brows.
• Using Gabor wavelet coefficients (jets) as features is preferable to raw pixel intensities. • Mean of Class classifier (MoCC) provided best results. • Optical flow techniques are preferable when there is not enough training material
available.
Advantages: - Disadvantages: Despite the many graphs and tables in the paper, the developed algorithms have not been sufficiently evaluated (both in terms of sleepiness and in terms of generalizability on new test subjects). Outcomes: The classification approach is more accurate but requires large amounts of training data. If such data are unavailable, the optical flow approach is preferable. Comparison to ADAS&ME: The algorithm is based on PERCLOS which may not be an ideal measure of sleepiness. If it really is a robust closed-eyes detector then it can at least be used as a late-stage sleepiness or actual sleep detector. Golz, M., Sommer, D., Trutschel, U., Sirois, B., & Edwards, D. (2010). Evaluation of fatigue monitoring technologies. Somnologie-Schlafforschung und Schlafmedizin, 14(3), 187-199. The aim of the paper is to propose how electrophysiological signals can be used to validate video-based fatigue monitoring systems. The video-based systems use PERCLOS to monitor fatigue. KSS, SDLP (standard deviation of lateral position), and a combined measure of EEG and EOG. Correlation analysis between PERCLOS and KSS/SDLP, and nonlinear discriminant analysis (target values obtained by thresholding according to KSS=7). Many different systems. Appendix 3 here contain a summary of each system, including links to companies and costs (when available): http://www.slideshare.net/willred/cat-fatigue-technology-report-2008. PERCLOS correlates with KSS and lane deviations (r>0.9) on a group level when using long analysing windows (>30min). On an individual level and with shorter time windows, PERCLOS fails to estimate KSS and lane deviations. PERCLOS is also considerably worse at detecting high levels of fatigue/sleepiness compare to

ADAS&ME (688900) D1.1 – SoA and Benchmarking
March, 2017 Page 182 of 238 CERTH/HIT
EEG/EOG. Advantages: Correlation levels between PERCLOS, KSS and Lane deviations obtained for a whole 30 minutes’ measurements. Disadvantages PERCLOS is not related to KSS and lane deviations in a useful manner. Outcomes: PERCLOS in itself is practically not very useful for fatigue monitoring. Comparison to ADAS&ME: The authors recommend complementing PERCLOS with other eye/face measures that can also be extracted from the camera, such as pupil diameter and eye movements. Off-the-shelf products are not good enough for sleepiness detection. Liu, C. C., Hosking, S. G., & Lenné, M. G. (2009). Predicting driver drowsiness using vehicle measures: Recent insights and future challenges. Journal of safety research, 40(4), 239-245.keywords: driver AND (sleepiness OR drowsiness OR fatigue) AND (detection OR monitoring OR predicting) This is a review article aimed to assess whether it is possible to predict driver sleepiness using vehicle measures. Τhe reviewed articles use Stanford or Karolinska Sleepiness Scale, blink rate and EEG activity as ground truths. It was found that simple functions such as SDLP and SWM are too rudimentary to predict sleepiness. Individualized composite measures are probably needed. This article aimed to assess whether it is possible to predict driver sleepiness using vehicle measures. Advantages: - Disadvantages: Most papers report results averaged across groups only. It is usually not known how the predictor functions on an individual level. Studies that do investigate performance on an individual level show large differences between participants. Outcomes: Composite vehicle measure has to be explored further. The time window used for deriving the sleepiness estimate was high-lighter. Is it possible to shorten the time windows to get a timely warning without introducing to much noise? Comparison to ADAS&ME: Individualization is brought up (again). It is very beneficial to adapt driver monitoring systems to individual drivers. May, J. F., & Baldwin, C. L. (2009). Driver fatigue: The importance of identifying causal factors of fatigue when considering detection and countermeasure technologies. Transportation Research Part F: Traffic Psychology and Behaviour, 12(3), 218-224. keywords: driver AND (sleepiness OR drowsiness OR fatigue) AND (detection OR monitoring OR predicting) There are different types of fatigue. Sleepiness related fatigue caused by circadian rhythms, sleep deprivation and sleep restriction. Task related fatigue caused by the driving task and the driving environment, can be Active due to overload or Passive due to underload. The paper is theoretical and is an overview of countermeasures and technological aids for driver fatigue: PERCLOS, head-nodding, deadman switch, rumble strips, lane departure and collision avoidance systems. Sleepiness related fatigue is resistant to interventions techniques (only a nap, caffeine or similar will do). Task related fatigue can be countered by alerting the driver with an alarm etc. Advantages: PERCLOS and lane departure/collision avoidance systems are useful to counter multiple driver impairments such as task related fatigue and inattention. Automation at levels 0-3 may counter active task related fatigue. Disadvantages: Head-nodding and deadman switches are only able to detect sleepy drivers after sleep has set in. Automation at levels 0-3 may cause passive task related fatigue. Outcomes: Several systems available to detect and counter fatigue. Comparison to ADAS&ME: An effective countermeasure technology has to take the cause and type of fatigue into account.
Annex 1.2 Affective cluster: Stress
Giannakakis, G., Pediaditis, M., Manousos, D., Kazantzaki, E., Chiarugi, F., Simos, P.G., Marias, K., Tsiknakis, M. (2017). Stress and anxiety detection using facial cues from videos. Biomedical Signal Processing and Control, 31 (89), 101. search keywords: Stress AND Driving

ADAS&ME (688900) D1.1 – SoA and Benchmarking
March, 2017 Page 183 of 238 CERTH/HIT
The aim of the study was to develop an automated identification of a set of facial parameters (semi and non-voluntary). An experimental approach was used for data collection and 23 (16 males - 7 females) participated in the study. This was done in different phases looking at social exposure, emotion recall, stressful images/mental task and stressful videos. The study was conducted in laboratory environment with a camera with a distance of 50 cm with its Field of View (FOV) and application of machine learning techniques. The data pre-processing involved histogram equalization for contract enhancement face detection, and region of interest (ROI) determination. The classification methods that were used and tested are: K-nearest neighbours (K-NN), Generalized Likelihood Ratio, Support Vector Machines (SVM), Naïve Bayes classifier and AdaBoost classifier. In each case, the classifier was trained using 9folds (90% of data) and tested on the remaining data (10% of data). The results in terms of classification accuracy varied between 80-90 % taking into account the most effective classifier. Advantages: The phases for data collection to manipulate stress/Anxiety are interesting. The use of Active Appearance model for stress recognition. Input to mouth motion estimation from an optical flow approach. Information of photoplethysmography is applied to estimate HR. Disadvantages: Done in laboratory. Not on real driving. Outcomes: This systematic review provides evidence that adverse psychosocial work conditions are negatively associated with ANS function as indexed by HRV. Comparison to ADAS&ME: The use of different classification across various contents but not contexts. Real driving requires increased sensitivity and accuracy and no evidence exists; only potential for transferability. Rodrigues, J. G., Kaiseler, M., Aguiar, A., Cunha, J. P. S., & Barros, J. (2015). A mobile sensing approach to stress detection and memory activation for public bus drivers. IEEE Transactions on Intelligent Transportation Systems, 16(6), 3294-3303. search keywords: Stress AND Driving A mobile sensing approach was designed to detect georeferenced stress responses and facilitate memory recall of the stressful situations. Data were collected among public bus drivers in the city of Porto, Portugal (145 h, 36 bus drivers, +2300 km), and results supported the validation of their approach among this population and allowed them determine specific stressor categories within certain areas of the city. Furthermore, data collected throughout the city allowed them to produce a citywide “stress map” that can be used for spotting areas in need of local authority intervention. Participants were wearing t-shirts with ECG sensors (Vital Jacket + Physionet), GPS and button for self-reporting stress event and were driving every day a daily route. The time window for measurements was 100 s. The metrics included the average normal-to-normal (NN) Intervals, the standard deviation of these NN intervals, their low frequency spectral power (LF) between 0.04 Hz and 0.15 Hz, the high frequency power (HF) , between 0.15 Hz and 0.4 Hz, and the ratio LF/HF. The findings suggest that the system can be a promising tool to support applied occupational health interventions for public bus drivers and guide authorities’ interventions to improve these aspects in “future” cities. The system show promising results combining HRV and GPS information with stress button. Advantages: It involves real driving with a simple system using t-shirt for HR detection. Disadvantages: The reference value is self-reporting. Outcomes: The sensor and the approach to connect stress to the geo-graphics, the memory and the speed are interesting. Comparison to ADAS&ME: Good for bus drivers understanding. Highlighting the most stressful contributors as: Other drivers or pedestrians behaviours were the most commonly reported source of stress, reported for 35% of the recalled or tagged events and mentioned at least once by 62% of the 29 bus drivers. Difficulty driving due to urban planning was the second most reported source of stress, reported for 22% of the events recalled or tagged, and mentioned by 41% of the drivers (12/29). Also, events that impact time schedule were a frequently reported source of stress, accounting for 19% of the events and mentioned by 41% of the drivers. Wickens, C. M., Wiesenthal, D. L., & Roseborough, J. E. (2015). In Situ Methodology for Studying
ADAS&ME (688900) D1.1 – SoA and Benchmarking
March, 2017 Page 184 of 238 CERTH/HIT
State Driver Stress: A Between Subjects Design Replication. Journal of Applied Biobehavioral Research, 20(1), 37-51 search keywords: Stress AND Driving Previous studies of driver stress have utilized in-vehicle in situ questionnaires to measure driver stress during the actual commute. These studies demonstrated several important findings, but all adopted a repeated-measures research design where each participant was exposed to counterbalanced high and low congestion conditions. This approach reduced between-subjects variability but increased the possibility of demand characteristics. The current study replicated the findings of the in situ methodology using a between-subjects research design. State stress was greater in heavy traffic. Time urgency, lack of perceived control, and trait susceptibility to perceiving driving as stressful contributed to higher levels of state driver stress. No gender differences in state driver stress were found. Implications of the results and future research directions are discussed. Everyday hassles such as getting to work/school on time likely heighten the frustration and negative affect in the driving environment. Likewise, consistent with the second hypothesis, drivers experiencing a lack of perceived control over the driving situation also reported higher levels of state driver stress. Consistent with the third hypothesis, heavy traffic congestion was associated with reports of greater state driver stress. Traffic congestion blocks the attainment of goals, such as driving at a certain speed, and is therefore interpreted as a negative and frustrating event. Consistent with the fourth hypothesis, drivers with a trait susceptibility to driver stress reported higher levels of in-vehicle state stress. Results of the current study have several important implications for the societal response to driver stress, not the least of which is acknowledging the contribution that traffic congestion and time urgency make to driver stress, and recognizing them as a public health concern. As such, a multifaceted approach to reducing driver stress should be implemented, including organizational changes to reduce traffic congestion (e.g., telecommuting, flextime hours) and promotional campaigns encouraging motorists to remain calm behind the wheel. Advantages: Solid and validated approach. Disadvantages: Not in real life and subjective driven stress reporting. Focus on traffic congestion. Outcomes: Driving style and loci of control are of key importance. Comparison to ADAS&ME: The main outcomes (e.g., lack of perceived control, trait susceptibility) can be used to build up the current driving style as part of the driver’s behaviour that can directly or indirectly affect the affective state the driver experiences. Rigas, G., Goletsis, Y., Bougia, P., & Fotiadis, D. I. (2011). Towards driver's state recognition on real driving conditions. International Journal of Vehicular Technology, 2011. search keywords: Stress AND Driving In this work a methodology for detecting drivers’ stress and fatigue and predicting driving performance is presented. The proposed methodology exploits a set of features obtained from three different sources: (i) physiological signals from the driver (ECG, EDA, and respiration), (ii) video recordings from the driver’s face, and (iii) environmental information. The extracted features are examined in terms of their contribution to the classification of the states under investigation. The most significant indicators are selected and used for classification using various classifiers. The approach has been validated on an annotated dataset collected during real-world driving. The results obtained from the combination of physiological signals, video features and driving environment parameters indicate high classification accuracy (88% using three fatigue scales and 86% using two stress scales). A series of experiments on a simulation environment confirms the association of fatigue states with driving performance. Advantages: Combinations of metrics that can be used in order to identify both stress and fatigue with high accuracy. In addition, consideration is made for environmental information. Disadvantages: Results based only one driver; reliability is not sufficient. Outcomes: Association of fatigue states with driving performance. Comparison to ADAS&ME: Classification of states based on extracted features is extremely relevant to the FER that the project has uptake. The approach is validated and thus within the project we may replicate or replicate parts of it.

ADAS&ME (688900) D1.1 – SoA and Benchmarking
March, 2017 Page 185 of 238 CERTH/HIT
Benoit, A., Bonnaud, L., Caplier, A., Ngo, P., Lawson, L., Trevisan, D. G., & Chanel, G. (2009). Multimodal focus attention and stress detection and feedback in an augmented driver simulator. Personal and Ubiquitous Computing, 13(1), 33-41. search keywords: Stress AND Driving This paper presents a driver simulator, which takes into account the information about the user’s state of mind (level of attention, fatigue state, stress state). The user’s state of mind analysis is based on video data and biological signals. Facial movements such as eyes blinking, yawning, head rotations, etc., are detected on video data: they are used in order to evaluate the fatigue and the attention level of the driver. The user’s electrocardiogram and galvanic skin response are recorded and analysed in order to evaluate the stress level of the driver. Driver simulator software is modified so that the system is able to appropriately react to these critical situations of fatigue and stress: some audio and visual messages are sent to the driver, wheel vibrations are generated and the driver is supposed to react to the alert messages. A multi-threaded system is proposed to support multi-messages sent by the different modalities. Strategies for data fusion and fission are also provided. Some of these components are integrated within the first prototype of OpenInterface: the multimodal similar platform. Video data and biological signals are collected. Advantages: The simulator-based approach is interesting and the combination of video and physiological (especially which data types have been chosen) in relation to feedback output. Disadvantages: testing is not described. Outcomes: Not described. Comparison to ADAS&ME: Difficult to define the relationship with this project as processes and outcomes are not clearly discussed. However, the choice for measuring stress and its relation to multimodal attention is interesting not only for identifying the driving impairment per se because of stress but also the effect it can have in designing the respective HMIs within the project (i.e., multimodality in information/ warning and stress).
Range Anxiety
Franke, T., Rauh, N., Günther, M., Trantow, M., & Krems, J. F. (2016). Which Factors Can Protect Against Range Stress in Everyday Usage of Battery Electric Vehicles? Toward Enhancing Sustainability of Electric Mobility Systems. Human factors, 58(1), 13-26. The authors examined range anxiety in the form of everyday range stress (ERS) in a field study setting. Seventy-two customers leased a BEV for 3 months. The field study was specifically designed to enable examination of factors that can contribute to lower ERS. In particular, study design and sample recruitment were targeted at generating vehicle usage profiles that would lead to relatively frequent experience of situations requiring active management of range resources and thereby potentially leading to experienced range stress. Less frequent encounter with critical range situations, higher practical experience, subjective range competence, tolerance of low range, and experienced trustworthiness of the range estimation system were related to lower ERS. Moreover, range stress was found to be related to range satisfaction and BEV acceptance. Advantages: concrete HMI concepts were tested. Disadvantages: low number of participants. Outcomes: Less frequent encounter with critical range situations, higher practical experience, subjective range competence, tolerance of low range, and experienced trustworthiness of the range estimation system were related to lower ERS. Moreover, range stress was found to be related to range satisfaction and BEV acceptance. Comparison to ADAS&ME: Variables are of interest to be considered. Günther, M., Trantow, M., & Krems, J. F. (2015). Which factors can protect against range stress in everyday usage of battery electric vehicles? Towards enhancing sustainability of electric mobility systems. Human Factors: The Journal of the Human Factors and Ergonomics Society, 0018720815614702. A longitudinal field study with 40 participants was conducted to examine which eco-driving strategies

ADAS&ME (688900) D1.1 – SoA and Benchmarking
March, 2017 Page 186 of 238 CERTH/HIT
users know before and after driving a BEV for 3 months. Furthermore, participant’s knowledge regarding eco-driving strategies with BEVs versus internal combustion engine vehicles (ICEVs) was compared. After 3 months of BEV usage, a driving test was applied in order to investigate the strategies drivers apply to drive energy efficiently and to estimate the effectiveness of these strategies. Results reveal that reported eco-driving strategies for BEVs and ICEVs differ significantly. Users reported significantly more BEV eco-driving strategies after experiencing the BEV for 3 months than before. Furthermore, drivers were able to significantly reduce energy consumption by applying eco-driving strategies in the driving test. Reported eco-driving strategies proofed to be effective. Advantages: driving test on eco-driving skills. Disadvantages: relatively short test drive (4 km). Outcomes: The results imply that eco-driving strategies for ICEVs have to be adapted for BEV eco-driving and that drivers gain a deeper understanding of factors that influence energy consumption by experiencing the BEV for a longer period of time. Based on the results, support of the driver through training or assistance systems is recommended. Comparison to ADAS&ME: The strategies are more important for training EV drivers rather than measuring range anxiety. Khan, T., Williams, M. A., Robertson, D., & Binersley, J. (2012). Designing the human machine interface to address range anxiety. In 26th Electric Vehicle Symposium 2012 (Vol. 1, pp. 216-225). Users' feedback that estimated range of the vehicle is one of the most critical pieces of information for a driver. Combining this with battery state of charge information can provide the driver with a better understanding of the current range of their EV. However accuracy is a key factor to gain trust in range information. EV drivers need dynamic information on factors that influence available range. There is also a requirement for information that will enable drivers to drive economically. Advantages: articles links range anxiety to HMI design. Disadvantages: methodology of the user study / questionnaires is disputable, statistical analysis is lacking. Outcomes: importance of adequate HMI design is emphasized. Comparison to ADAS&ME: However accuracy is a key factor to gain trust in range information. EV drivers need dynamic information on factors that influence available range.
Franke, T., Neumann, I., Bühler, F., Cocron, P., & Krems, J. F. (2012). Experiencing range in an electric vehicle: Understanding psychological barriers. Applied Psychology, 61(3), 368-391. The authors examined the nature of how range is experienced in an EV and whether variables from other adaptation contexts, notably stress, have explanatory power for inter-individual differences in what we term comfortable range. Forty EVs were leased to a sample of users for a 6-month field study. Qualitative and quantitative analyses of range experiences were performed, including regression analyses to examine the role of stress-buffering personality traits and coping skills in comfortable range. Advantages: scientific conceptualization of range experience. Disadvantages: field study approach. Outcomes: providing drivers with a reliable usable range may be more important than enhancing maximal range in an electric mobility system. Comparison to ADAS&ME: Measures are interesting to take into consideration for Use Case B. Annex 1.3 Affective cluster: Emotions
Koo, J., Kwac, J., Ju, W., Steinert, M., Leifer, L., & Nass, C. (2015). Why did my car just do that? Explaining semi-autonomous driving actions to improve driver understanding, trust, and performance. International Journal on Interactive Design and Manufacturing (IJIDeM), 9(4), 269-275. This study explores, in the context of semi-autonomous driving, how the content of the verbalized

ADAS&ME (688900) D1.1 – SoA and Benchmarking
March, 2017 Page 187 of 238 CERTH/HIT
message accompanying the car’s autonomous action affects the driver’s attitude and safety performance. Using a driving simulator with an auto-braking function, we tested different messages that provided advance explanation of the car’s imminent autonomous action. Messages providing only “how” information describing actions (e.g., “The car is braking”) led to poor driving performance, whereas “why” information describing reasoning for actions (e.g., “Obstacle ahead”) was preferred by drivers and led to better driving performance. Providing both “how and why” resulted in the safest driving performance but increased negative feelings in drivers. These results suggest that, to increase overall safety, car makers need to attend not only to the design of autonomous actions but also to the right way to explain these actions to the drivers. Advantages: Explores the interaction between the driver and semi-autonomous driving actions Disadvantages: Simulator study Outcomes: These results suggest that, to increase overall safety, car makers need to attend not only to the design of autonomous actions but also to the right way to explain these actions to the drivers. Comparison with ADAS&ME: Reasons for an action is as important as the action in order drivers to trust and continue to use function, i.e., need to establish connection, i.e., affective design. Mesken, J., Hagenzieker, M. P., Rothengatter, T., & de Waard, D. (2007). Frequency, determinants, and consequences of different drivers’ emotions: An on-the-road study using self-reports,(observed) behaviour, and physiology. Transportation research part F: traffic psychology and behaviour, 10(6), 458-475. In the present study, the frequency, determinants and consequences of three relevant emotions in traffic were investigated. Based on appraisal theory, it was predicted that the combination of three appraisal components (goal congruence, blame and threat) affects the occurrence of anger, anxiety and happiness. Participants (n = 44) filled in a questionnaire containing background and personality variables, and performed a test drive in an instrumented car. During the drive, speed and heart rate were registered and the traffic environment was recorded on video. Participants verbally reported scores for emotions and perceived risk. The most frequently occurring emotion was anxiety, followed by anger and happiness. Emotions while driving were related to emotional traits. Emotions while driving were also related to traffic events: anger and anxiety were both associated with goal incongruent events, and happiness with goal congruent events. Anger was mostly associated with other-blame and anxiety with situation-blame. Anger was mostly associated with events affecting impeded progress, and anxiety with events affecting safety. Anxiety, but not anger or happiness, was associated with increased perceived risk and with increased heart rate. Participants who reported anger drove faster and exceeded the speed limit more often on a 100 km/road section than participants who did not report anger. These and other results are discussed in terms of appraisal theory and state-trait differences in emotion. Advantages: The study includes the collection of various types of measures (e.g., background/ personality variables through questionnaire completion and video recordings). Disadvantages: Anxiety is an affective state that is considered related to many daily activities. In ADAS&ME anxiety is related to range anxiety and relevant only to electric vehicles. Outcomes: Anxiety is the most frequent state very much related to emotional traits, goal congruent events resulting to increased perceived risk and increased heart rate. Comparison with ADAS&ME: The study does not consider assistive or support systems but guides us towards theories and state-trait differences in emotions that we might consider in defining the emotions and selecting the appropriate indicators. Vaa, T. (2007). Modelling driver behaviour on basis of emotions and feelings: intelligent transport systems and behavioural adaptations. In Modelling driver behaviour in automotive environments (pp. 208-232). Springer London. keywords: emotions, driving, automated functions In this paper, we present a methodology and a wearable system for the evaluation of the emotional states of car-racing drivers. The proposed approach performs an assessment of the emotional states using facial electromyograms, electrocardiogram, respiration, and electrodermal activity. The system consists of the following: 1) the multisensorial wearable module; 2) the centralized computing module;

ADAS&ME (688900) D1.1 – SoA and Benchmarking
March, 2017 Page 188 of 238 CERTH/HIT
and 3) the system's interface. The system has been preliminary validated by using data obtained from ten subjects in simulated racing conditions. The emotional classes identified are high stress, low stress, disappointment, and euphoria. Support vector machines (SVMs) and adaptive neuro-fuzzy inference system (ANFIS) have been used for the classification. The overall classification rates achieved by using tenfold cross validation are 79.3% and 76.7% for the SVM and the ANFIS, respectively. Advantages: Wearable system and approach that is of interest and relevance to ADAS&ME project and pilots for most vehicle types (i.e., even riders in controlled simulated environment). Disadvantages: Race car drivers differ significantly from rest of drivers with regards to skills as well as self-control under extreme or risky situations (i.e., personality traits). Outcomes: Classification worked using SVMs and ANFIS with adequate rates. Comparison with ADAS&ME: Testing set up is interesting, the system and sensor selected, the approach and the classification models applied. However, the clusters selected: high/ low stress, disappointment and euphoria may be very relevant for race car drivers but it is still to be decided if this clustering will work for everyday drivers, professional drivers and leisure riders. Jonsson, I., & Harris, H. (2005). Emotions, driving and in-car speech based information systems. The Role of Emotion in Human-Computer Interaction. To investigate the impact of car voices and emotions on driving, they setup driving simulator experiments. For these experiments, they did not rely on participants being in a certain mood or exhibit a certain emotion so they used inducement techniques, audio, video, computer tasks, and visualisation tasks to ensure certain emotions. They also manipulate both the driving scenario and the in-car voices for emotional effect and content. Voice prompts are designed to vary both in linguistic and paralinguistic features such as 1) emotional colouring 2) familiar/unfamiliar voice 3) prompts that provide warnings and information on road conditions and 4) prompts that provide a conversational partner. The data from these studies are evaluated both for driving performance, are the voice systems helpful, and attitude, are the voice system well liked and will hence stay turned on.
Advantages: Investigate emotion recognition through speech based systems with real users taking into consideration both linguistic and paralinguistic features. Disadvantages: Experiments are conducted in simulated but still driving environment. Outcomes: The data from these studies are evaluated both for driving performance, are the voice systems helpful, and attitude, are the voice system well liked and will hence stay turned on. Comparison with ADAS&ME: Testing set up is interesting and especially the categories of prompts can be used to categorize speech outputs and help design the HMI for certain driving instances.
Annex 1.4 Affective cluster: Inattention/distraction/workload
van der Meulen, H., Kun, A. L., & Janssen, C. P. (2016, October). Switching Back to Manual Driving: How Does it Compare to Simply Driving Away After Parking?. In Proceedings of the 8th International Conference on Automotive User Interfaces and Interactive Vehicular Applications (pp. 229-236). ACM. keywords: Distraction monitoring, driver, gaze fixation, inattention, in-vehicle information systems IVIS, naturalistic simulator, percent road centre. Method to monitor driver distraction based on a stereo camera to estimate the face pose and gaze of a driver in real time. A coarse eye direction is composed of face pose estimation to obtain the gaze and driver’s fixation area in the scene, which is a parameter that gives much information about the distraction pattern of the driver. The system provides some consistent statistics, which help psychologists to assess the driver distraction patterns under influence of different in-vehicle information systems (IVISs). These statistics are objective, as the drivers are not required to report their own distraction states. The proposed gaze fixation system has been tested on a set of challenging driving experiments directed by a team of psychologists in a naturalistic driving simulator. This simulator mimics conditions present in real driving, including weather changes, manoeuvring, and distractions due to IVISs. Professional drivers participated in the tests. Several scenarios run in a truck driving simulator in order to test distraction induced by various contexts and evaluated using stereo camera. Data recording on face pose and eye fixation, registered incidents (crashes, near crashes and

ADAS&ME (688900) D1.1 – SoA and Benchmarking
March, 2017 Page 189 of 238 CERTH/HIT
incidents) in the driving simulator, reaction time to events were collected. Several scenarios run in a truck driving simulator in order to test distraction induced by various contexts and evaluated using stereo camera. Reaction times and gaze focalisation behaviour patterns measured on a sample of professional drivers allow evaluating truck driver's distraction under a set of various situations. Advantages: The system does not require any subject-specific calibration; it is robust to fast and wide head rotations and works under low-lighting conditions. Disadvantages: The gaze fixation system has been tested in a driving simulator and not on real road conditions. Outcomes: System evaluating distraction tested in a truck driving environment. Comparison to ADAS&ME: System allowing evaluating truck drivers’ distraction.
Craye, C., & Karray, F. (2015). Driver distraction detection and recognition using RGB-D sensor. arXiv preprint arXiv:1502.00250. keywords: Driver distraction, inattention recognition, computer vision, machine learning. Based on active sensor Kinect and computer vision tools, an efficient module for detecting driver distraction and recognizing the type of distraction has been developed. Based on colour and depth map data from the Kinect, our system is composed of four sub-modules. We call them eye behaviour (detecting gaze and blinking), arm position (is the right arm up, down, right of forward), head orientation, and facial expressions. Each module produces relevant information for assessing driver inattention. They are merged together later on using two different classification strategies: AdaBoost classifier and Hidden Markov Model. Evaluation is done using a driving simulator and 8 drivers of different gender, age and nationality for a total of more than 8 hours of recording. Development of a module to detect driver distraction based on active sensor Kinect and computer vision tools. Module includes: detection of gaze and blinking, detection of arm position (up, down, right of forward), detection of head orientation and facial expressions. Two modules were used, merged together using two different classification strategies: AdaBoost classifier and Hidden Markov Model. Evaluation aimed at driver’s behaviour identification: data from arm position, face orientation, face expression and eye behaviour. Qualitative and quantitative results showed strong and accurate detection and recognition capacity (85% accuracy for the type of distraction and 90% for distraction detection). Advantages: The system based upon Kinect sensor, computer vision and machine learning is suitable for context aware human-machine interaction. Disadvantages: Tests have been conducted only on driving simulator and not on real road. Outcomes: Qualitative and quantitative results showed accurate detection and recognition capacity (85% accuracy for the type of distraction and 90% for distraction detection). Comparison to ADAS&ME: Each module developed to detect distraction is obtained independently and could be used for other types of inference, such as fatigue detection.
Gold, C., Berisha, I., & Bengler, K. (2015, September). Utilization of drivetime–performing non-driving related tasks while driving highly automated. In Proceedings of the Human Factors and Ergonomics Society Annual Meeting (Vol. 59, No. 1, pp. 1666-1670). Sage CA: Los Angeles, CA: SAGE Publications. The study investigated whether different tasks are impeding the drivers' capabilities of regarding control intake over situations. The tasks were chosen with different level of workload and high visual motoric engagement. A cognitive motoric task and laptop based fill in the blank text representing office work like writing emails were also included. The study took place on a driving simulator. The drivers were allowed to drive 45 minutes in a highly automated vehicle on the three lane highway and accomplishing 31 tasks in a permuted order. While performing the task 12 take-over positions were emerged and not every task came with take-over request. T-react time between TOR and first gaze directed away from the task. The T take-over is the time between TOR and conscious beginning of the manoeuvring. The take-over quality was measured by assessing minimum/ maximum longitudinal/lateral acceleration and minimum occurring time to collision (TTC). The driving simulator consists of full vehicle mock up BMW Series 6, equipped with different sensors for

ADAS&ME (688900) D1.1 – SoA and Benchmarking
March, 2017 Page 190 of 238 CERTH/HIT
monitoring driver behaviour and inputs, active steering wheel, seven projectors enabling a front view angle of about 180 degrees as well as mirrors and a freely programmable head up display. The workload and distraction was introduced using visual motoric SURT tasks and cognitive n-Back task. The impact of selected task on take-over performance was measured with 5 dependent variables. For visual distracting SURT and Text, the reaction time T react. For take-over scenarios, T take over time. For measuring the quality of take-over, minimum and maximum, longitudinal and lateral acceleration (a long; a lat) and the minimum occurring time to collision (TTC) within each situation. The driving simulator consists of full vehicle mock up BMW Series 6, equipped with different sensors for monitoring driver behaviour and inputs, active steering wheel, seven projectors enabling a front view angle of about 180 degrees as well as mirrors and a freely programmable head up display. The workload and distraction was introduced using visual motoric SURT tasks and cognitive n-Back task. Mauchly-test on spherecity was used and Analysis of Variance (ANOVA) were used for the analysis react did not show any differences between SURT and TEXT in any condition. Drivers reacted to the TOR on average after 535 ms. In situation left and right ,For depended variables ANOVA showed significant differences for the factor task (F(1.23)=10.106, p<0.001). Mean values and pairwise comparisons (Bonferroni) showed a significance (F(1,23)=5.196,p=.008) Subjective ratings scale, participants reported being highly motivated while engaging in the tasks (M=4.04,SD=0.95) and that of operation of those tasks awhile driving highly automated is rather dangerous (M=3.13,SD=1.19) impairing performance (M=3.29, SD=1.16) and capability of reaction (M=3.71;SD=1.12). On stressful take overs (M=2.23; SD=0.96).On how challenging the take-over (M=1.96; SD=0.92) on how demanding the tasks were (M=2.30; SD=1.13). The stressfulness of take-over showed significant differences between the tasks (F (1,23)=9.777, p<0.001). Advantages: The study provides a good understanding on how non-driving tasks influence the driver behaviour during take over. The secondary tasks are quiet interesting and the method of evaluating the distraction is also very informative. Disadvantages: The cluster sampling was from the university students. The results might vary for the real population. Outcomes: The cognitive demanding tasks are impeding the take-over in cognitive demanding take-over situations and the influence of cognitive tasks is less easy in well-practiced take over conditions. Comparison to ADAS&ME: The study investigated on method using cognitively demanding secondary tasks that influence the take-over performance during highly automated driving. This could useful to include highly demanding cognitive tasks in the ADAS experiments and investigate the performance of drivers' during such situations. Lorenz, L., Kerschbaum, P., & Schumann, J. (2014, September). Designing take over scenarios for automated driving: How does augmented reality support the driver to get back into the loop?. In Proceedings of the Human Factors and Ergonomics Society Annual Meeting (Vol. 58, No. 1, pp. 1681-1685). Sage CA: Los Angeles, CA: SAGE Publications. The study investigated whether augmented reality information can positively influence the take-over process. Two different types of concept were evaluated AR red and AR green. The findings report that the type of augmented reality information does not influence the take-over times, but considerably affects reaction type. The participants were tested with a freeway with three lanes and they can switch on the automation with a button on steering wheel. The instrument cluster displayed the automation states ON and TAKE OVER REQUEST (TOR). The TOR was triggered as soon as the automation reached a system boundary such as an unknown obstacle or accident. The variables measured in this study includes gaze reaction, road fixation, hands on, Take over time, side mirror (time until the driver glances at the side mirror), Indicator (time until the driver uses the indicator). Data like steering angle, pedal positions, status of hands on detection as well as longitudinal and lateral accelerations were recorded with 10 ms cycle time. The gaze behaviour with 40 ms cycle time by the eye tracking system. The results showed that AR red caused the shortest average take over time of 2.86 seconds (SD=0.77 s).Take over time of AR green (M=2.91 s; SD=0.97 s) and control condition (M=3.03 s; SD=0.86 s) were longer. Kruskal - Wallis test revealed no significant difference (H(2)=7.6,p=.68). Drivers of both AR groups (AR red: M=3.09 s; SD=0.87 s;AR groups (AR red: M=3.09 s; SD=0.87 s;AR green (AR red: M=3.22 s; SD=0.54 s) looked at the side mirror later than the drivers of the control condition group. Regarding reaction type, chi square test '(x² (2)=13.20,p=0.1) showed a significant differences

ADAS&ME (688900) D1.1 – SoA and Benchmarking
March, 2017 Page 191 of 238 CERTH/HIT
between the groups. Contrary to 56.3% of participants of AR red group steered and braked and 25% braked only. In AR green and control condition group 76.4% respectively and 66.6% of drivers’ changes lanes without checking the corridor beside the car. The university of Leeds driving simulator was used. The vehicle cab for the simulator was based on Jaguar S- type Vehicle has driver controls within a 4 m diameter spherical projection dome. The road scenes encompass a horizontal field of view of 250 degree and three ear projectors display the scenes in the rear view and side mirrors. The simulator was equipped with eye tracker with camera mounted on the vehicle dashboard. The Lane keeping system (LKS) algorithm was developed by Sharp, Casanova and Symbols (2009), projecting a series of look- ahead points in front of the vehicle before calculating the error from the desired trajectory, weighted according to the proximity of look- ahead points. On activation of LKS, a small LCD panel with back lit displays ACC/LKS when the highly automated driving was active. Three dependent variables were evaluated, driver behaviour, driver fatigue and drivers secondary tasks. The metrics used for driver behaviour were lane keeping or speed choice (TETTC), driver drowsiness was assessed using PERCLOS and secondary tasks were assessed using PRC. TETTC- time exposed time to collision. PECLOS- Percentage eyes closed, PRC- percentage road centre. Advantages: The study provides a good understanding on how the number and the maximum duration of off road glances seem to be suitable gaze parameters to assess and categorise the drivers monitoring behaviour in highly automated driving situation. The study also provides good understanding on the method that should be used to measure the gaze behaviour of visually distracted drivers. Disadvantages: The findings reported here are based on the study conducted in the simulator. The complexity of the environment is minimal, increasing the complexity would have given better insights. Outcomes: After a take-over request visually distracted drivers initially avert their gaze on secondary tasks to the road way and simultaneously establish motor readiness to intervene in the vehicle guidance. Drivers who distribute their visual attention appropriately between driving and the secondary task and regular monitoring the roadway should be able to acquire and maintain high situation awareness. Cognitive and not motor processes determine the take-over performance. Comparison to ADAS&ME: The study investigated on method on how to use gaze behaviour as an indicator of driver readiness to take over control during automated driving. The study also showed that how specific gaze parameters are suitable to assess the adequacy of driver monitoring strategy. This could be useful in ADAS for investigating use case driver monitoring (driver distraction). Mok, B., Johns, M., Lee, K. J., Miller, D., Sirkin, D., Ive, P., & Ju, W. (2015, September). Emergency, automation off: Unstructured transition timing for distracted drivers of automated vehicles. In Intelligent Transportation Systems (ITSC), 2015 IEEE 18th International Conference on (pp. 2458-2464). IEEE. The study investigated driver monitoring capability from a highly distracted state. During this study the participants were allowed experience a highly automated driving using the simulator and the unstructured transition of control occurring in 2 seconds, 5 seconds or 8 seconds before participant encountered a road hazard. The study identified the minimum amount of time in which drivers can take over the control of vehicle safety and comfortably from the automated system in the advent of an impending road hazard. The study took place in a driving simulator. The drivers were tested on three experimental conditions where unstructured transitions of control occurred in 2 seconds, 5 seconds or 8 seconds. The occurrence of the unstructured transitions was indicated by an audible alert: Emergency, Automation Off. During the automated mode the participants were given passive distraction in the form of watching a video on iPad. The critical incident was encountered near to the climax of the video and participants were also prevented from pausing and scanning the through the video to see how they would naturally disengage with the task. The immersive simulator, the Stanford Driving Simulator composed of two parts: a Whole car and a visual display system. The first component is a Toyota Avalon interface for simulation. Both the steering wheel and pedals provide haptic feedback to drivers. The other component which surrounds the car is a 270 degree field of view screen. Utilizing five projectors, this 22- foot diameter cylindrical display together to create seamless simulated driving environment. Wide angle cameras GoPro cameras and microphones inside the Avlon's cabin. Drivers’ emotional state captured using GoPros camera inside the cabin to provide additional video feed of the drivers face for automated emotion analysis. Emotion coding is performed using FACET algorithm (Attention tool software). Driving scenario is created using Internet Scene

ADAS&ME (688900) D1.1 – SoA and Benchmarking
March, 2017 Page 192 of 238 CERTH/HIT
Assembler Software. Sim creator is used to create simulation, providing the audio and video outputs. The driving performance measured by variation in road offset, steering wheel positions and post drive questionnaire. Advantages: The study provides a good understanding on how the number and the maximum duration of off road glances seem to be suitable gaze parameters to assess and categorise the drivers monitoring behaviour in highly automated driving situation. The study also provides good understanding on the method that should be used to measure the gaze behaviour of visually distracted drivers. Disadvantages: - Outcomes: After a take-over request visually distracted drivers initially avert their gaze on secondary tasks to the road way and simultaneously establish motor readiness to intervene in the vehicle guidance. Drivers who distribute their visual attention appropriately between driving and the secondary task and regular monitoring the roadway should be able to acquire and maintain high situation awareness. Cognitive and not motor process determines the take-over performance. Comparison to ADAS&ME: The study investigated on method on how to use gaze behaviour as an indicator of driver readiness to take over control during automated driving. The study also showed that how specific gaze parameters are suitable to assess the adequacy of driver monitoring strategy. This could be useful in ADAS for investigating use case driver monitoring (driver distraction). Gonçalves, J., & Bengler, K. (2015). Driver state monitoring systems–Transferable knowledge manual driving to HAD. Procedia Manufacturing, 3, 3011-3016. The main contribution of this paper is to provide an overview on DSM from a HAD point of view. The paper considers the following distraction categories: visual, auditory, mechanical, and mental; and fatigue metrics: eye based and behaviour based. Eye based metrics will remain an important DSMS. For distraction detection, monitoring of body posture and head rotation is a possible alternative. For fatigue detection, body posture or driver interaction (scratching face, covering mouth, rubbing eyes...) could be future metrics. Reference metrics for distraction detection, obtained from eye-tracking: Glance pattern, mean glance duration and eyes-off-road duration (Visual); Pupil diameter, blink frequency (auditory), head direction (mechanical) and pupil diameter (cognitive). Metrics commonly used for detecting fatigue, obtained by eye-tracking systems: PERCLOS, EYEMEAS, MEANCLOS, AECS, Blink Frequency, Microsleep rate (Eye based). Image processing/cameras: Yawning, Nodding, Slouching, eyebrow rising (behaviour based). Eyes-Off-Road (EOF) measures to detect driver distraction: higher time indicates lower driver awareness. Areas of interest (AOI) allow measurement of glance's space and time dimensions (Glance Pattern): referring to a sequence of AOI fixated by the driver. Mean Glance Duration measures time spent on each AOI: used as an indicator of task engagement/distraction. Fatigue is often measured with eye-based-metrics: raw eyelid behaviour, blink frequency, gaze process. Behaviour-based fatigue measures are: postural adjustments, verbal exchange, ludic activities, self-centred. Advantages: Advantages of reviewed monitoring systems: Eye metrics is valuable due to the ability to obtain relevant data associated with fatigue in a non-intrusive way, and has broad community acceptance. Behaviour based metrics is recognised as a promising source for detecting drowsiness - drivers' change behaviour to counter the fatigue progression. Disadvantages: Disadvantages of reviewed monitoring systems: Eye-tracking drawbacks; data can be noisy. In blink based metrics a non-detected eye may be interpreted as an eyelid closure. Glasses' lens can hinder the pupil detection. Sunglasses or body postures not facing the camera nullify any eye-metric based system. Behaviour based metrics cannot be used alone, since behaviour activities are person dependent. Outcomes: Eye based metrics will remain an important DSMS for fatigue detection. For distraction detection, monitoring body posture and head rotation is a possible alternative. Comparison to ADAS&ME: Image processing/cameras for detecting body postures (fatigue detection) and eye tracking for monitoring fatigue and distraction. Behaviour based metrics is a promising information source for detecting drowsiness but should not be used alone, since these

ADAS&ME (688900) D1.1 – SoA and Benchmarking
March, 2017 Page 193 of 238 CERTH/HIT
activities are person dependent. Use generic algorithms for detecting driver behaviour. Strayer, D. L., Turrill, J., Cooper, J. M., Coleman, J. R., Medeiros-Ward, N., & Biondi, F. (2015). Assessing cognitive distraction in the automobile. Human factors, 57(8), 1300-1324. keywords: Cognitive workload, cognitive distraction, driving, EEG, visual scanning behaviour, divided attention, multitasking Establish a systematic framework for measuring and understanding cognitive distraction in the automobile, defining relationship between mental workload, cognitive distraction, and impaired driving. Across three studies, participants completed eight in-vehicle tasks commonly performed by the driver of an automobile. Primary, secondary, subjective, and physiological measures were collected and integrated into a cognitive distraction scale. In-vehicle activities, such as listening to the radio or an audio book, were associated with a low level of cognitive workload; the conversation activities of talking to a passenger in the vehicle or conversing with a friend on a handheld or hands-free cell phone were associated with a moderate level of cognitive workload; and using a speech-to-text interfaced e-mail system involved a high level of cognitive workload. The following data were collected: Detection Response Task (DRT), Brake reaction time, following distance, glances at hazard locations, subjective workload rating (NASA-TLX), physiological measures (EEG). The cognitive distraction scale provides a comprehensive analysis of several of the cognitive sources of driver distraction. Evaluation of several in-vehicle tasks in context of laboratory control (experiment 1), driving simulator (experiment 2) and instrumented vehicle (experiment 3) with recording of several variables: reaction time, performance, physiological measures, glances. Setting up of a cognitive distraction scale, reflecting the standardized averages for each condition, equally weighting physical, secondary, subjective and physiological measures across the 3 experiments conducted in 3 different contexts. Advantages: Provide a comprehensive analysis of several of the cognitive sources of driver distraction. Disadvantages: Use the NASA-TLX (set up by the NASA for pilot context) rather than the DALI ("Driving Activity Load Index", which is the revised version of NASA-TLX to be adapted to the driving context) to evaluate the driver's workload. Outcomes: Definition of a cognitive distraction scale. Comparison to ADAS&ME: Framework to measure driver distraction associated with different in- vehicle activities. Wu, J., Chang, C. C., Boyle, L. N., & Jenness, J. (2015, September). Impact of In-vehicle Voice Control Systems on Driver Distraction: Insights from Contextual Interviews. In Proceedings of the Human Factors and Ergonomics Society Annual Meeting (Vol. 59, No. 1, pp. 1583-1587). Sage CA: Los Angeles, CA: SAGE Publications. Drivers use of voice interfaces within their own vehicles was explored using contextual interviews. The participants were asked to perform voice control tasks for communication, navigation, accessing information, and entertainment while driving. The interviews were video recorded and a researcher rode along and logged the responses and errors made during the voice interactions. Cognitive workload was assessed using the NASA TLX (Task Load Index). They held contextual interviews of drivers on planned route with 64 participants. Cognitive workload was measured by using the NASA TLX (Task Load Index), measuring the error performance in driving and conducting drivers interview. A visual interface was used. Errors made and cognitive workload has been analysed and showed variability according to the different voice tasks, indicating that varying levels of distraction can occur with voice interfaces. Advantages: Voice communication with systems releases visual constraints and is preferred by the driver. Disadvantages: High quality of voice communication is required in automotive context to avoid driver's workload. Outcomes: Accuracy of speech interface can impact safety. Comparison to ADAS&ME: Voice communication with systems is recommended but has to be robust with high quality.

ADAS&ME (688900) D1.1 – SoA and Benchmarking
March, 2017 Page 194 of 238 CERTH/HIT
Rashid, H., Omar, A. R., Jaafar, R., Abdullah, S. C., Ma’arof, M. I. N., Fauzi, W. M. S. W., & Ismail, M. A. M. (2015). Usage of Wireless Myon 320 Surface Electromyography (sEMG) System in Recording Motorcyclist Muscle Activities on Real Roads: A Case Study. Procedia Manufacturing, 3, 2566-2573. This case study was conducted to determine signal transfer challenges and limitations that researchers tend to experience while using a wireless Myon 320 sEMG system during a real on-road motorcycle riding experiment. Eight muscle groups were evaluated bilaterally involving: upper trapezius (T), triceps brachii (TB), erector spinae (ES), latissimus dorsi (LD), extensor carpi radialis (ECR), sternocleidomastoid (S), gastrocnemius (G) and biceps formaris (BF) muscle groups. One healthy male volunteer participated in this case study riding a 135cc motorcycle which was followed and monitored by a group of researchers in a van. Inconsistent signals were recorded and signal connections were lost a few times. Inability of maintaining the same speed and distance between the motorcycle and the van due to road and traffic conditions were also dangerous for both parties. Suggestively, minimizing these inconsistencies shall give better sEMG data. However, any procedures and experimental setup to minimize these inconsistencies should be observed carefully for the safety of all parties and other road users. Performing wireless sEMG experiment during real on-road motorcycle riding tend to cause inconsistent data to be recorded due to positioning issues between the motorcycle and the van(side by side positioning). By positioning the front of the van in series may minimize these inconsistencies but creates a dangerous manoeuvre for both parties. Meanwhile, real-time monitoring of the sEMG signals transmitted should be practiced throughout the trial to detect any abnormalities, so that on-site remedies can be taken to sustain the data being recorded. However, the sEMG data recorded in this study does reflect the muscle activities characteristics of a motorcyclist during riding a motorcycle in spite of the inconsistencies. As a conclusion, this study provides an insight of what to expect during performing wireless sEMG experiments on real roads involving two moving vehicles. Finally, any procedures and experimental setups involved in such on-road experiment should be observed carefully for the safety of all parties and road users.
Figure 107: Myon 320 surface electromyography (sEMG) system
Advantages: Real-life and real-time sEMG measures and gathering of any related issues. Disadvantages: Performing wireless sEMG experiment during real on-road motorcycle riding tend to cause inconsistent data to be recorded due to positioning issues between the motorcycle and the van (side by side positioning) Outcomes: As a conclusion, this study provides an insight of what to expect during performing wireless sEMG experiments on real roads involving two moving vehicles. Finally, any procedures and experimental setups involved in such on-road experiment should be observed carefully for the safety of all parties and road users. Comparison to ADAS&ME: to monitor rider’s inattention, relevant and important to clearly distinguish inattention due to distraction (external cause) and inattention due to fatigue (internal cause). Bucchianico, D. (2014). Advances in Human Aspects of Transportation. AHFE Conference. Investigation of the effects of ADAS, specifically Lane Departure Warning (LDW), on driving

ADAS&ME (688900) D1.1 – SoA and Benchmarking
March, 2017 Page 195 of 238 CERTH/HIT
performance while participants performed a secondary task (mental math) designed to simulate cognitive effort while driving. The experiment was conducted on a closed-course test track in an instrumented vehicle. Results suggest that cognitive engagement influenced driver control of the vehicle. Effects of cognitive engagement in a secondary task were not mitigated by the presence of LDW. Results were discussed in the framework of a continued need for active input and control from the human operator in vehicles with assistive technologies. Data collected were the following: recording CAN-Bus data from the vehicle: activation of ADAS, steering wheel angle, accelerator position, vehicle speed, engine RPM and brake activation. Video recording of the ground on side view mirror to record lane position and instances of lane departure and video recording of instrument cluster and view of the roadway, performance of secondary tasks did affect vehicle control, specifically variations in steering wheel angle and speed control. Results suggested that passive ADAS technologies such as LDW may not fully compensate for the effects of cognitive distractions on vehicle control. Effects of LDW would work as a reminder to maintain lateral control, rather than a more general reminder to attend to the vehicle’s position. Advantages: Test the capacity of ADAS such as LDW and ACC to potentially compensate loss of vehicle control linked to driver's distraction in real driving context; the results are not convincing but the approach is valuable. Disadvantages: Patterns of results could have been different if the drivers had more time to gain familiarity and experience with ACC and LDW. Outcomes: In real driving context but through a maybe too short appropriation experiment, ADAS technologies happened to be not successful in fully compensating impaired driving capacity linked to high cognitive workload. Comparison to ADAS&ME: Importance of the phase of appropriation of ADAS technologies while running experiments to test the efficiency of these systems. Othman, R., Zhang, Z., Akiduki, T., Suzuki, H., Imamura, T. and Miyake, T. (2014). Development of a driver inattention detection system using dynamic relational network. International Journal of Innovative Computing. Information, and Control., 10 (3), 1189-1205. keywords: Driver inattention, dynamic relational network, sensor diagnosis, intentional driving. Development of a robust driver inattention detection system based on a driver model and dynamic relational network using sensor data such as the quantity of vehicle speed and pedal operation. The system is composed into 3 parts: the sensor diagnosis module, the driver model and the inattentive driving detection module. The sensor diagnosis module using the DRN allowed to analyse and to identify faulty sensors through its measurement data. This driver inattention detection system has been tested with actual data recorded on a highway and the system's diagnosis performance has been evaluated. A driver model and Dynamic relational network (DRN) using vehicle speed and pedal operation were applied. The evaluation methods were the following: recording synchronous data such as video, speech, driving control and physiological signals in real road context. Development of an inattentive driving detection system using a dynamic relational network (DRN) to improve driver model and to exclude faulty sensor's signal, avoiding then false alarm detection. Test of the robustness of this system on real road context with a sample of drivers. Development of a robust driver inattention detection system in order to monitor the driver's state using driver model and dynamic relation network based upon sensor data such as the quantity of vehicle speed and the pedal operation. Advantages: Test of a driver inattention detection system on real road. Disadvantages: Small sample of tested drivers to be really able to test robustness of the detection system. Outcomes: Test on real road for the driver inattention detection system showed a percentage of the confidence score of the system output very high, between 80 to 70%. Comparison to ADAS&ME: Usefulness of a driver model to be included in a driver inattention detection system in addition to sensor diagnosis module to monitor driver's state in the car. Naujoks, F., Mai, C., & Neukum, A. (2014). The effect of urgency of take-over requests during highly automated driving under distraction conditions. Advances in Human Aspects of Transportation, (Part
ADAS&ME (688900) D1.1 – SoA and Benchmarking
March, 2017 Page 196 of 238 CERTH/HIT
I), 431. The study investigated the effectiveness of visual and visual-auditory take-over requests during highly automated driving under distraction conditions. Take-over requests were presented in 3 difficulty level scenarios: easy, moderate and difficult; take over requests were presented either visually or visual-auditory; Participants were asked to perform a secondary task while driving. Time until driver takes hands back on the steering wheel are lower if visual-auditory take-over requests are used in comparison to purely visual ones purely visual take-over requests may not be sufficient to ensure safe transitions. Advantages: -
Disadvantages: -
Outcomes: Time until driver takes hands back on the steering wheel are lower if visual-auditory take-over requests are used in comparison to purely visual ones purely visual take-over requests may not be sufficient to ensure safe transitions. Comparison to ADAS&ME: visual-auditory warning modality seems to be beneficial for take-over requests. Ranney, T. A., Baldwin, G. H., Smith, L. A., Mazzae, E. N., & Pierce, R. S. (2014). Detection Response Task (DRT) Evaluation for Driver Distraction Measurement Application (No. DOT HS 812 077). Research conducted to support development of NHTSA’s Driver Distraction Guidelines for auditory-vocal driver-vehicle interfaces. Experiment conducted in driving and non-driving test venues to evaluate the sensitivity of Detection Response Task (DRT) metrics to differences in attentional load. Three DRT variants were used: Head-mounted DRT (HDRT), Remote DRT (RDRT), and Tactile DRT (TDRT). Differences between test venues were more pronounced than differences between DRT variants. Response times were faster in the non-driving venue but differences between secondary task conditions were consistent across venues. In the driving simulator, TDRT was slightly more sensitive than other DRT variants. Based on testing in the driving simulator, both TDRT and HDRT detected all differences while RDRT performance was weaker. The TDRT had the highest level of test-retest reliability. Potential visual conflicts associated with RDRT and to a lesser extent with HDRT may create problems when used with visual-manual tasks. They measured Detection Response Task (DRT) with 3 variants: Head-mounted DRT (HDRT), Remote DRT (RDRT), and Tactile DRT (TDRT). Single experiment with 2 scenarios: driving and non-driving test venues, participants performing a secondary task to create distraction. To simulate the demands of tasks performed with auditory-vocal interfaces, the research used a delayed response task (n-back) in which participants listened to and repeated simple auditory stimuli (digits). The task allows mental workload to be systematically varied. The n-back has no visual or manual components and thus allows a direct assessment of the effects of different levels of attentional demand on DRT metrics. Participants responded as quickly as possible to each stimulus presentation via button press. In the driving simulator venue, participants performed DRT and secondary tasks while performing a simple car-following task in a low-fidelity fixed-base simulator. In the non-driving test venue, participants performed DRT and secondary tasks with no concurrent driving task, while sitting in the driver’s seat of an identical vehicle. Overall, the TDRT was consistently more sensitive than other DRT variants, albeit marginally, in the driving simulator. Advantages: Test of sensitivity of DRT variant metrics to evaluate driver's distraction to be used at an international level in the framework of the NHTSA Driver Distraction Guidelines Disadvantages: Uncertainty about easiness in using these metrics in real road context. Outcomes: Identification of DRT variants sensitive to driver's distraction. Comparison to ADAS&ME: The variants of this metric DRT may be used in several Use Cases of the project. Mbouna, R. O., Kong, S. G., & Chun, M. G. (2013). Visual analysis of eye state and head pose for driver alertness monitoring. IEEE transactions on intelligent transportation systems, 14(3), 1462-1469. Visual analysis of eye state and head pose (HP) for continuous monitoring of alertness of a vehicle

ADAS&ME (688900) D1.1 – SoA and Benchmarking
March, 2017 Page 197 of 238 CERTH/HIT
driver. The proposed scheme uses visual features such as eye index (EI), pupil activity (PA), and HP to extract critical information on non-alertness of a vehicle driver. EI determines if the eye is open, half closed, or closed from the ratio of pupil height and eye height. PA measures the rate of deviation of the pupil centre from the eye centre over a time period. HP finds the amount of the driver’s head movements by counting the number of video segments that involve a large deviation of three Euler angles of HP, i.e., nodding, shaking, and tilting, from its normal driving position. Experimental results show that the proposed scheme offers high classification accuracy with acceptably low errors and false alarms for people of various ethnicity and gender in real road driving conditions. Α single camera for continuous monitoring was used (detection of the face and the eyes using the AdaBoost algorithm (Viola–Jones algorithm). Metrics were visual features such as eye index (EI), pupil activity (PA), and head pose (HP). Real road experiments were conducted during the day to record video clips with drivers completing 3 driving session: alert, drowsy and distracted. Head pose (HP) provides useful information on the lack of attention, particularly when the driver’s eyes are not visible due to occlusion caused by large head movements. A support vector machine (SVM) is useful to classify a sequence of video segments into alert or non-alert driving events. Advantages: Method to evaluate level of driver's distraction and drowsiness with accuracy has been tested in real road driving context and for various morphologies linked to ethnicity belonging. Disadvantages: Require additional tests due to the low number of participants in the experiment. Outcomes: Use a single camera in addition to combination of information coming from driver's eye and head in order to achieve correct identification of distraction state. Comparison to ADAS&ME: Convincing method applicable in real road driving context to evaluate driver's distraction state. Tango, F., & Botta, M. (2013). Real-time detection system of driver distraction using machine learning. IEEE Transactions on Intelligent Transportation Systems, 14(2), 894-905. keywords: Accident prevention, artificial intelligence and machine learning, driver distraction and inattention, intelligent supporting systems. Show a method for nonintrusive and real-time detection of visual distraction, using vehicle dynamics data and without using the eye-tracker data as inputs to classifiers. Different models based on machine learning (ML) methods are compared. Data for training the models were collected using a static driving simulator, with real human subjects performing a specific secondary task [i.e., a surrogate visual research task (SURT)] while driving. Different training methods, model characteristics, and feature selection criteria have been compared. Different models were used; based on machine learning (ML): support vector machines SVM, static and dynamic neural networks with feedforward FFN and layer-recurrent LRNN, and adaptive neuro-fuzzy inference systems, ANFIS. The evaluation was based on the following: eye position extracted from the video, number of correct answers at the secondary tasks in addition to reaction time, vehicle dynamic data: speed, time to collision, time to lane crossing, steering angle, lateral position, position of the accelerator pedal, position of the brake pedal. Experiment showed that SVM outperformed all the other classifiers. The main finding was the identification of the support vector machine SVM as the ML model outperforming all the other ML methods, providing the highest classification rate for most of the participants. Advantages: Comparison of several ML models to detect driver's distraction. Disadvantages: Experiment conducted in a static driving simulator context. Outcomes: Usefulness of a ML model to detect driver's distraction without using eye-tracker data but rather nonintrusive and real-time vehicle dynamic data. Comparison to ADAS&ME: This model SVM can be useful to define driver's distraction in the objective of design of adaptive PADAS. Dong, Y., & Hu, Z. (2013). Driver Inattention Monitoring System intelligent vehicle (IV) driver inattention monitoring system for Intelligent Vehicles intelligent vehicle (IV). In Transportation Technologies for Sustainability (pp. 395-421). Springer New York. This paper is a review of current state of the knowledge about driver inattention monitoring, with

ADAS&ME (688900) D1.1 – SoA and Benchmarking
March, 2017 Page 198 of 238 CERTH/HIT
inattention classified into 2 categories: distraction and fatigue. As the causes of distraction and fatigue are different, the appropriate corresponding real time inattention monitoring systems are different. A complete literature review of driver inattention monitoring systems: methods, measures, models were conducted. Systems included were the following: Driver Inattention Monitoring System DIMS: Saab Driver Attention Warning System: 2 miniature Infra-Red cameras Toyota DIMS: 1 IR camera Mercedes Attention Assist, Volvo Driver Alert Control camera for the road and sensors of steering wheel movements Delphi Driver State Monitor Computer vision FaceLAB, SmartEye, and InSight. The main units were the following: Saab Driver Attention Warning System: SmartEye software Toyota DIMS: detection of obstacle by Advanced Pre-crash Safety System and warning according to evaluation of Driver Monitoring System Mercedes AA: visual and auditory alert based upon the driver's profile and detection of fatigue Volvo DAC detects uncontrolled movements of the vehicle Delphi DSM: single camera and 2 IR sources to detect driver facial features (eye closure, head pose) FaceLAB: eyelid behaviour. As the goal of a driver’s inattention monitoring system is to reduce driving risk, it is recommended to combine the 3 sources: driver physical variables, driving performance variables and information from IVIS. Advantages: with a one-camera system are that it is cheaper, easier to operate and easier to install in a vehicle. A multi-camera system will, on the other hand, provide higher availability and accuracy for areas that are far from the road centre. Disadvantages: Some measures such as evaluation of driver's workload cannot be conducted in real time. Outcomes: Several systems available to evaluate in real time driver's distraction and driver's fatigue. Comparison to ADAS&ME: To monitor driver’s inattention, relevant and important to clearly distinguish inattention due to distraction (external cause) and inattention due to fatigue (internal cause). Di Stasi, L. L., Contreras, D., Cándido, A., Cañas, J. J., & Catena, A. (2011). Behavioural and eye-movement measures to track improvements in driving skills of vulnerable road users: First-time motorcycle riders. Transportation research part F: traffic psychology and behaviour, 14(1), 26-35. In this paper a method of estimating the mental workload (MWL) of a motorcycle rider was proposed, through the application of machine learning methods. The eye movement parameters of the motorcycle rider are measured under two run objectives, the one leads to a high MWL and the other one leads to a low MWL. The parameters are saccade duration, eye fixation (short stop), tracking frequency, saccade amplitude, and most frequency eye movement velocity. They are taken as explanatory variables for a discriminant function. By applying machine learning methods, we find that we can determine rider’s MWL under pre-set running conditions with a high accuracy (>80%). Participants in this study were 16 healthy men who were experienced in motorcycle operation and qualified to serve as test riders. The experiment was carried out on a 5 km circuit at the Japan Cycle Sports Centre. All participants wore an instrument-equipped helmet. This research aimed to propose a method for detecting increasing of rider MWL during motorcycle operation, we investigated the application of machine learning methods to detect increasing of MWL through the use of eye movement parameters measured under present run objectives set to provide different levels of rider MWL. As a result, discrimination functions were found through machine learning methods that allow us to detect increasing MWL with an accuracy of over 80%, under set experimental conditions. Advantages: Interesting method for measuring workload in riders which is not very common. Disadvantages: Not necessarily related to any of the affective states but rather to behaviour and skills observation. Outcomes: Measurements of rider’s mental workload through machine learning methods. Comparison to ADAS&ME: The method of measurements with the helmet (included in AD
Jain, J. J., & Busso, C. (2011, September). Assessment of driver’s distraction using perceptual

ADAS&ME (688900) D1.1 – SoA and Benchmarking
March, 2017 Page 199 of 238 CERTH/HIT
evaluations, self-assessments and multimodal feature analysis. In 5th Biennial Workshop on DSP for In-Vehicle Systems, Kiel, Germany. Developing feedback systems that can detect the attention level of the driver can play a key role in preventing accidents by alerting the driver about possible hazardous situations. Monitoring driver’s distraction is an important research problem, especially with new forms of technology that are made available to drivers, which can interfere with the primary driving task. An important question is how to define reference labels that can be used as ground truth to train machine learning algorithms to detect distracted drivers. The answer to this question is not simple since drivers are affected by visual, cognitive, auditory, psychological and physical distractions. This study explored and compared three different approaches to characterize driver’s distraction: perceptual evaluation from external evaluators, self-evaluations collected from post driving questionnaires, and analysis of the differences observed across multimodal features from normal patterns. Driver's interview (N=20 interviewees) about their level of self assessed distraction, assessment of distraction by external observers based upon video recordings, analysis of CAN-bus data of the vehicle eye glance behaviour from camera and acoustic information. 3 methods were applied: 1) self-assessments (aims to identify and rank-order distracted tasks as perceived by the drivers themselves), 2) subjective evaluation of localized recordings of the drivers by conducting perceptual evaluations by external raters, 3) identification of salient features across different modalities (CAN Bus signals, eye glance behaviour), and 4) acoustic signal, giving unbiased metrics to describe the deviation in behaviour’s observed when the driver is involved in the secondary tasks. Distraction induced by visual intensive tasks was well captured by the proposed metrics. However, these measurements do not seem to appropriately describe cognitive distractions. Advantages: Analysis of 3 different approaches to characterise drivers' distraction in real road context allowing identification of their advantages and their limits. Disadvantages: Measurements more appropriate for visual distraction rather than cognitive distraction. Outcomes: Identification and description of relevant metrics to describe distracted drivers. Comparison to ADAS&ME: Methodologies to assess driver's distraction are multiple: self-assessed, observation by experts, objective data from the vehicle. To be robust, it is possible to use the combination of the 3 of them. Ahlstrom, C. and Dukic, T. (2010) Comparison of eye tracking systems with one and three cameras. In MB '10 Proceedings of the 7th International Conference on Methods and Techniques in Behavioral Research, Article no. 3, ACM, New York, NY, USA. keywords: Eye tracker, availability, accuracy, precision, driver's distraction, performance evaluation, User/Machine systems Comparison of the performance of a one-camera system with a three-camera system and to investigate if the accuracy and availability of the one camera system is sufficient to monitor driver state. The results indicate that there is not much difference between a single-camera system and a multi-camera system as long as the driver is looking straight ahead. However, with more peripheral gaze directions, the larger coverage that is provided by the additional cameras works in favour of the multi-camera system. A driving simulator experiment was conducted in order to test and to compare availability, accuracy and precision of 2 systems: one-camera system Smart Eye anti-sleep and three-camera system Smart Eye Pro, both from Smart Eye AB with 53 participants (from 30 to 60 years old). Both accuracy and availability deteriorated with distance from the central gaze target, with a larger decrease for the one-camera eye tracking systems as compared to the three-cameras. Advantages: Advantages with a one-camera system are that it is cheaper, easier to operate and easier to install in a vehicle. A multi-camera system will, on the other hand, provide higher availability and accuracy for areas that are far from the road centre. Disadvantages: Experiment conducted in a static driving simulator context; so these systems need to be tested in real road context. Outcomes: Better understanding of limits and advantages in terms of accuracy in using one-camera or three-camera eye tracking systems. Comparison to ADAS&ME: Comparison of 2 systems that could be used in the project to evaluate

ADAS&ME (688900) D1.1 – SoA and Benchmarking
March, 2017 Page 200 of 238 CERTH/HIT
driver's distraction state. Toffetti, A., Wilschut, E., Martens, M., Schieben, A., Rambaldini, A., Merat, N., & Flemisch, F. (2009). CityMobil: Human factor issues regarding highly automated vehicles on eLane. Transportation Research Record: Journal of the Transportation Research Board, (2011), 1-8. In dual mode vehicles, the reactions of drivers are observed in case of system errors or unexpected events, focusing on the transition of control and interface design. An experiment was conducted to compare the two eLane interfaces. (City Mobil project). The design of vocal versus and acoustic user interface was tested using a CRF driving simulator. The participants were asked to drive in the simulated scenario with different situations (automatic and manual overtaking, sudden lane changing). The scenarios included were 1) Manual driving and 2) Automated driving on eLane. The participants were also asked to perform secondary tasks on IVIS (in-Vehicle information system). The CRF driving simulator providing 45 degree vertical and 135 horizontal field of view with a steering wheel placed on a moving base with 6 degrees of freedom. The subjective questionnaire measures were used. Interface evaluation questionnaire and driving performance evaluation questionnaire. Advantages: The study showed the method to investigate two different interfaces: Acoustic and Vocal and its effect of driving performance. AIDE- HMI questionnaire measures were used for the investigation. Disadvantages: This paper highlights only a portion of City Mobil project and only the main results were reported in this study. Outcomes: Driving in automatic mode with the vocal modality is considered safer than acoustic one. At the same time vocal modality can be bit annoying, but this can be solved with dedicated design that allows the deactivation to expert users. In case of automation system fault the vocal modality seems to be the better one because it shortens drivers’ reaction time. The visual information for the acoustic modality is considered more necessary than for the vocal modality. The labels such as «automatic overtaking", "fault" are not problematic and requires a pre warning. Comparison to ADAS&ME: An interface design with a mixed automatic-manual modality is recommended for situation like automated driving in case of medium and low traffic, straight and high velocity streets and manual driving for medium and high traffic in the urban context, overtaking and for mountain streets. Hancock, P. A., Wulf, G., Thom, D., & Fassnacht, P. (1990). Driver workload during differing driving manoeuvres. Accident Analysis & Prevention, 22(3), 281-290. Motorcycle-automobile accidents occur predominantly when the car driver turns left across the motorcyclist’s right-of-way. Efforts to decrease this specific collision configuration, through an increase in motorcycle conspicuity, have concentrated on the physical characteristics of the motorcycle and its rider. The work reported here examines the behaviour of car drivers during different driving sequences, in particular during left-turn manoeuvres. An experiment is reported that used simultaneous video-taping of the driver and the forward-looking scene. Subjects followed a pre-set on-road course and were observed for head movements to determine the possibility of structural interference eye-blink frequency, probe-response time, and probe response error, as measures of cognitive or mental workload. In addition, the subjects completed two major subjective workload evaluations as reflections of effort directed to different components of the driving task. Results indicated that there were significant increases in head movements and mental workload during turn sequences compared to straight driving. This result of higher driver workload may be responsible for increasing the potential for detection failure. Such a propensity is also fostered by the higher structural interference that may be expected during turns. Failures to observe during turning sequences have differing outcomes depending on the presence of opposing traffic, as during the left turn, compared with the absence of such opposition, as occurs in the right turn. Also, the less conspicuous the oncoming vehicle in the left turn scenario, the higher the probability of detection failure. At the present time the least conspicuous powered vehicle is the motorcycle. Advantages: Considers rider’s cognitive load in risk-related scenarios. Disadvantages: Low number of participants. The author assumes that the change in parameters

ADAS&ME (688900) D1.1 – SoA and Benchmarking
March, 2017 Page 201 of 238 CERTH/HIT
measured is because of workload and there is a possibility that other factors are present (e.g., demanding scenario, positive role of increased load that can be translated as acute concentration). Outcomes: Results indicated that there were significant increases in head movements and mental workload during turn sequences compared to straight driving. Comparison to ADAS&ME: Consideration for Use Case scenarios. Includes both objective and subjective measures. Identification of relation between head movements and increase in workload. Nandita Sharma, Tom Gedeon, (2012). Objective measures, sensors and computational techniques for stress recognition and classification: A survey. Computer Methods and Programs in Biomedicine, Elsevier. Volume 108, issue 3, 1287–1301. This survey reviews sensors that have been used to measure stress and investigates techniques for modelling stress. It discusses non-invasive and unobtrusive sensors for measuring computed stress, a term coined in the paper. Sensors that do not impede everyday activities that could be used by those who would like to monitor stress levels on a regular basis (e.g. vehicle drivers, patients with illnesses linked to stress) is the focus of the discussion. The paper investigates common techniques for detecting stress including physiological measures (electroencephalography [EEG], blood volume pulse [BVP], heart rate variability [HRV], etc.) as well as physical signs (eye gaze, pupil diameter, face movement, etc.). Combinations of physical and physiological sensors in research are compared and evaluated. As a conclusion, stress cannot be directly measured but it can be determined by certain characteristics in primary measures. Primary measures have been considered in isolation or in some basic combination. Stress models developed using support vector machines (SVMs) have a reported accuracy of 90.10%. Advantages: Current mechanisms can detect stress and fulfil their purpose. Disadvantages: It is hard to detect stress directly. Physiological based techniques sometimes may be inappropriate to be used. Outcomes: Existing sensors and techniques can be used with a good accuracy to determine primary measures of stress. Potential area of research could be to develop stress detection techniques using physical measure features sufficiently powerful so that individuals are not required to make contact with equipment. Comparison to ADAS&ME: Most of the described techniques can be implemented to vehicles for the UCs of the project. Deepa, Shubha V. Patel, Mallikarjun S. Holi, Ashalatha M. E. (2014). Design and Development of Stress Detector and Sleep Inducer. International Journal of Engineering Research & Technology. Volume 3, issue 5, 2278-0181. The physical strains or psychological tensions cause stress which may result in lack of human efficiency. Stress may be one of the reasons for insomnia the sleep disorder, and insomnia may be one of the causes for stress. The present work deals with the design of stress detector based on the principle of variation of skin resistance in accordance with emotional states and the design of Sleep Inducer based on principle of generation of magnetic field which is almost equal to geo magnetic field. The stress measurement is performed and displayed on a scale of ten with high stress indication using red LED. The sleep inducer induces sleep in two operating modes with the pre-set time of about 15, 30 and 60 minutes. The stress detector works on the principle of detecting the variation in skin resistance in accordance with the emotional states of the person. The resistance is inversely related to the stress experienced. If the stress test is conducted and observed stress is high, the subject may use the sleep inducer which generates magnetic field and helps the subject in reducing stress by inducing good sleep. The designed systems can be improved by integrating the system such that detection of high stress will trigger the sleep inducer circuit with no delay. The designed models can be improved by adding a piezo buzzer, a voice recording and playback device in the circuit. Advantages: The stress meter presented in current work indicates the stress level of the subject based on skin resistance. The skin resistance is sensed by the touchpads and converted to corresponding voltage levels, indicating the stress level. Disadvantages: The sleep inducer design might cause undesirable driving effects.

ADAS&ME (688900) D1.1 – SoA and Benchmarking
March, 2017 Page 202 of 238 CERTH/HIT
Outcomes: The current work describes the design of stress detector model to detect the stress in ten levels. Comparison to ADAS&ME: Stress detector design can be used in the project. Even an ergonomic design of ‘’light’’ sleep inducer using voice recording and playback device in the circuit can give various instructions to reduce stress of the driver. Seoyeon Choi, Soocheol Kim, Jung-Sik Yang, Jung-Hyun Lee, Chulmin Joo, Hyo-Il Jung (2014). Real-time measurement of human salivary cortisol for the assessment of psychological stress using a smartphone. Sensing and Bio-Sensing Research. Volume 2, 8-11. This paper presents a personalized cortisol testing platform based on a smartphone application. It utilizes a sensitive colorimetric LFA strip for specific detection and quantification of cortisol in human saliva. A simple LED is used to light the test strip and quantify its intensity. The smart application (‘‘app’’) measures the light scattering of colorimetric assays and digitally converts images captured by the smartphone into precise cortisol concentrations from human saliva samples. . Salivary cortisol concentration serves as a biomarker of psychological stress. Advantages: A novel technique to measure stress levels using a smartphone. Disadvantages: The colorimetric strip, even though is cheap, has to be bought by the user. The driver may not take the test alone if travelling or if he/she is not aware of the condition. Outcomes: This paper successfully demonstrates that the colour intensity of the test line was well correlated with the cortisol concentration in a range of 1–100 ng/ml when using the smartphone application. Comparison to ADAS&ME: A good portable solution to measure stress levels of the drivers. Oken BS, Chamine I, Wakeland W (2015). A systems approach to stress, stressors and resilience in humans. Behavioural Brain Research. Volume 282, 144-154. This paper has described human stress physiology and psychology from the systems science perspective. Specifically focuses on environmental perturbation stressors that produce significant long-term changes in the human dynamical system and stress responses other than commonly used self-rated scales. Advantages: Described human stress physiology and psychology from the systems science perspective. Disadvantages: The described systems science concepts need further understanding. Outcomes: In addition to measuring stress responses over time, it may be useful to repeat administration of experimental stressors to understand self-reinforcing loops. If a human is exposed to a “tolerable” dose of a stressor that results in return to the original high utility attractor basin, the outcome may be improved resilience. Behavioural and physiological measurements attempting to capture the degree of stress of a system should incorporate the dynamics of the physiological stress response system as well as some measures of the environmental stressors and their perception Comparison to ADAS&ME: Provides a better understanding on the mechanism to measure stress levels of the driver. The stressors which cause this situation should also be explored. Hua Gao, Anil Yuce, Jean-Philippe Thiran (2014). Detecting emotional stress from facial expressions for driving safety. 2014 IEEE International Conference on Image Processing (ICIP). IEEE. Most of the previous work on stress detection applies physiological features (such as electromyogram, electrocardiogram, respiration, and skin conductance). However, those measurements are intrusive, so are less comfortable in real applications. In this work, the authors developed a stress detection system based on the analysis of facial expressions. The system is nonintrusive and is able to run in real-time, which allows immediate reaction upon detection. A near-infrared (NIR) camera is used to capture the near frontal view of the driver’s face. Experimental results demonstrate that the system has a detection rate of 90.5% for the in-door tests and 85% for the in-car tests. Advantages: Non-intrusive system for stress detection of the driver and with a presented high detection accuracy. Disadvantages: The described system might need a more sophisticated adaptation to each driver. Unknown usefulness if installed on a motorbike.

ADAS&ME (688900) D1.1 – SoA and Benchmarking
March, 2017 Page 203 of 238 CERTH/HIT
Outcomes: The proposed best system is able to successfully detect 90.5% of in-door and 85% of in-car test cases. Comparison to ADAS&ME: The system is directly linked to the purposes of the project. The NIR camera is all the required hardware which can be installed behind the steering wheel of a car. Hernandez, Javier; McDuff, Daniel; Benavides, Xavier; Amores, Judith; Maes, Pattie; Picard, Rosalind (2014). AutoEmotive: bringing empathy to the driving experience to manage stress. Proceedings of the 2014 companion publication on Designing interactive systems - DIS Companion '14. This work describes how the stress of drivers can be measured through different types of interactions, and how the information can enable several interactions in the car with the goal of helping to manage stress. These new interactions could help not only to bring empathy to the driving experience but also to improve driver safety and increase social awareness. Advantages: Describes how different driver’s interactions can provide insightful information about stress. Disadvantages: The proposed interactions to manage stress need further investigation and documentation. Outcomes: Acknowledges potentially negative impact of stress while driving and the different modalities from which it can be sensed. Comparison to ADAS&ME: Provides solutions when abnormal levels of stress are detected. The car can automatically adapt and use such interactions with the driver to help better manage stress. Mario Muñoz-Organero, Victor Corcoba-Magaña (2016). Predicting Upcoming Values of Stress While Driving. IEEE Transactions on Intelligent Transportation Systems. Volume: PP, Issue: 99, pages 1-10. he levels of stress while driving affects the way we drive and have an impact on the likelihood of having an accident. Different types of sensors, such as heart rate or skin conductivity sensors, have been previously used to measure stress related features. Estimated stress levels could be used to adapt the driver's environment to minimize distractions in high cognitive demanding situations and to promote stress-friendly driving behaviours. In this paper, the authors evaluate how effectively upcoming stress levels can be predicted considering current stress levels, current driving behavior, and the shape of the road. The use of features, such as the positive kinetic energy and severity of curves on the road to estimate how stress levels will evolve in the next minute. Different machine learning techniques are evaluated and the results for both intra and inter-city driving and for both intra and inter driver data are presented. They have used data from four different drivers with three different car models and a motorbike and more than 220 test drives. Advantages: Predicting stress levels can be very useful to adapt the drive’s environment to minimize distractions. Disadvantages: The accuracy of different users is very limited. Outcomes: Results show that upcoming stress levels can be accurately predicted for a single user (correlation r = 0.99 and classification accuracy 97.5%) but prediction for different users is more limited (correlation r = 0.92 and classification accuracy 46.9%). Comparison to ADAS&ME: If stress levels can be accurately predicted then, automated vehicle may correct several driving decisions in order to reduce driver’s stress. In the case of motorbikes appropriate messages can be transmitted to lead to a more stress-efficient driving. Djordje Bozovic, Maja Racic, Nedeljka Ivkovic (2013). Salivary Cortisol Levels as a Biological Marker of Stress Reaction. Journal of the Academy of Medical Sciences in Bosnia and Herzegovina. med arh. 67(5): 305-384 To determine the validity and psychobiological significance of salivary cortisol as a biomarker of stress in the experiments. The effect of cortisol is made through specific receptors located in the cytoplasm of the target cells. The effect of cortisol is made through specific receptors located in the cytoplasm of the target cells. Determining blood cortisol levels, which has been the most widely used method, is characterized by certain shortcomings. The process of taking blood samples from the vein

ADAS&ME (688900) D1.1 – SoA and Benchmarking
March, 2017 Page 204 of 238 CERTH/HIT
is accompanied by additional stress, which results in falsely positive results. Another flaw is found in the fact that cortisol taken and measured from serum or plasma represents total cortisol, not the free, biologically active one. Cortisol response lags behind ACTH by 5-20 minutes, with peak blood levels achieved in 10-30 min. The transfer of cortisol from blood to saliva takes place rather quickly, within no more than 2-3 min. Advantages: One of the major advantages of salivary cortisol is that samples can be obtained in the natural environment of the study participant as well as in special settings outside the laboratory. Disadvantages: It still remains unclear whether cortisol response to controlled experimental conditions (stressors) may fully apply to the response to actual life stressors. Outcomes: Although, the studies on correlation between saliva cortisol concentrations and free levels of this hormone in blood samples are lacking, salivary cortisol offer a novel approach in research of acute stress biomarkers with its ease of collection and potentially wide scope for application. Comparison to ADAS&ME: If stress levels can be accurately predicted then, automated vehicle may correct several driving decisions in order to reduce driver’s stress. In the case of motorbikes appropriate messages can be transmitted to lead to a more stress-efficient driving. Sunghyun Yoon, Jai Kyoung Sim, Young-Ho Cho (2016). A Flexible and Wearable Human Stress Monitoring Patch. Nature Publishing Group. 67(5): 305-384 The article proposes a human stress monitoring patch which integrates three sensors of skin temperature, skin conductance, and pulsewave in the size of stamp (25 mm × 15 mm × 72 µm) in order to enhance wearing comfort with small skin contact area and high flexibility. The skin contact area is minimized through the invention of an integrated multi-layer structure and the associated microfabrication process; thus being reduced to 1/125 of that of the conventional single-layer multiple sensors. The patch flexibility is increased mainly by the development of flexible pulsewave sensor, made of a flexible piezoelectric membrane supported by a perforated polyimide membrane. In the human physiological range, the fabricated stress patch measures skin temperature with the sensitivity of 0.31 Ω/°C, skin conductance with the sensitivity of 0.28 µV/0.02 µS, and pulse wave with the response time of 70 msec. The skin-attachable stress patch, capable to detect multimodal bio-signals, shows potential for application to wearable emotion monitoring. Advantages: The present patch is weakly affected by external environment changes such as temperature and muscle contractions. The wearing comfort of the patch. Disadvantages: Only experimental results are provided. Outcomes: In summary, the authors design, fabricate, and characterize the human stress monitoring patch composed of a skin temperature sensor, a skin conductance sensor and a pulsewave sensor. The wearing comfort of the patch is enhanced by the windows fabrication and the multi-layer integration using the silver inter-layer electrode. They experimentally show the individual sensors of the patch have proper performances for the comprehensive analysis of human physiological stress. Comparison to ADAS&ME: This patch can be integrated into a wearable device, which can be part of the project C-ITS. Jorn Bakker, Mykola Pechenizkiy, Natalia Sidorova (2011). What’s your current stress level? Detection of stress patterns from GSR sensor data. 2011 IEEE 11th International Conference on Data Mining Workshops (ICDMW). IEEE 2012. In this paper the authors: (1) formulate the problem of stress identification and categorization from the sensor data stream mining perspective, (2) consider a reductionist approach for arousal identification as a drift detection task, (3) highlight the major problems of dealing with GSR data, collected from a watch-style stress measurement device in normal (i.e. in non-lab) settings, and propose simple approaches how to deal with them, and (4) discuss the lessons learnt from the conducted experimental study on real GSR data collected during the recent field study.

ADAS&ME (688900) D1.1 – SoA and Benchmarking
March, 2017 Page 205 of 238 CERTH/HIT
Advantages: The GSR method to detect stress levels can be used in wearable devices and hence by all kind of drivers. Disadvantages: Examples suggest us that interpretation of the GSR data can be rather ambiguous and deciding whether a particular observed pattern corresponds to stress or something else. Outcomes: The detection of stressful events is a challenging task. The information coming from sensor measurements is highly ambiguous and dependent on hidden contexts. The detection of separate stress peaks in the GSR data is also challenging due to the varieties of patterns in the data. Comparison to ADAS&ME: The GSR method should be avoided to be used in the project. Karen Hovsepian, Mustafa al’Absi, Emre Ertin, Thomas Kamarck, Motohiro Nakajima, and Santosh Kumar (2015). Stress: Towards a Gold Standard for Continuous Stress Assessment in the Mobile Environment. ACM Int Conf Ubiquitous Comput. 493-504. In this paper, the authors address several challenges in developing and validating the presented cStress model, which represents a solid step towards establishing a gold standard for continuous stress assessment. cStress analyses a minute’s worth of ECG and respiration data, and, if this minute is not confounded by physical activity, outputs probability of stress. They propose an algorithm and illustrate it on ECG signal and equations which can be used to compute all the marginal probabilities of self-reported stress. Advantages: The proposed cStress model obtains good accuracy on independent data sets in both lab and field. Disadvantages: It needs further improvements in accuracy and reproduction on other independent data sets. Several approaches could be adopted to improve the accuracy such as more convenient data collection methods. Outcomes: In testing, the model obtains a recall of 89% and a false positive rate of 5% on lab data. On field data, the model is able to predict each instantaneous self-report with an accuracy of 72%. Comparison to ADAS&ME: Computational techniques of the system can be used to the data collected from the UCs. Annex 1.5 Affective cluster: Physiological states Balasubramanian, V., & Jagannath, M. (2014). Detecting motorcycle rider local physical fatigue and discomfort using surface electromyography and seat interface pressure. Transportation research part F: traffic psychology and behaviour, 22, 150-158. Whilst motorcycling is an activity of pleasure in most parts of the world, in India it is a regular mode of commuting. Incidence of fatigue is substantially higher among motorcycle riders than drivers of other modes of transport. The objective of this study was to detect physical fatigue due to motorcycle riding for an hour using surface electromyography (sEMG) and seat interface pressure. Twenty healthy male participants performed 60 min of motorcycle riding in a low traffic density environment. Muscle activity was recorded bilaterally from extensor carpi radialis (ECR), biceps brachii (BB), trapezius medial (TM), sternocleldomastoid (S) latissimus dorsi (LD) and erector spinae (ES) muscle groups. Interface seat pressure distribution was monitored using a pressure mapping system. Results showed that participants have significant (p < 0.05) physical fatigue in TM, LD and ES muscle groups during 60 min of motorcycle riding. Seat pressure distribution was found to be non-uniform during the course of motorcycling. Results suggest that the impact on local physical fatigue and seat discomfort are probably due to static seating demand and prolonged sitting posture balance required to ride the motorcycle for an hour. For the tests, every participant rides a moped for 60 minutes in low traffic environment. The authors find that the occurrence of fatigue can be measured on postural muscle groups (erector spinae and latissimus dorsi medial). The present study also shows that while riding the motorcycle yields dominant pressure distribution with peak pressure at the ischium region. Advantages: -
Disadvantages: It is not clear if it is possible to integrate sEMG in the jacket (they used a very
ADAS&ME (688900) D1.1 – SoA and Benchmarking
March, 2017 Page 206 of 238 CERTH/HIT
"clinic" sensor). Not clear if it is really useful to have the seat pad. Outcomes: The authors find that the occurrence of fatigue can be measured on postural muscle groups. Comparison to ADAS&ME: Maybe investigate if there are more efficient and integrateable sEMG sensors. Zwolińska, M. (2013). Case Study of the Impact of Motorcycle Clothing on the Human Body and Its Thermal Insulation. Fibres & Textiles in Eastern Europe. The interest in motorcycles is growing year by year. It should be noted that motorcyclists belong to the group of most vulnerable road users who suffer the most severe consequences of road traffic accidents. During an accident, the only protection for the body is motorcycle clothing. Nevertheless motorcycle clothing hinders heat exchange between the motorcyclist’s body and the environment. Unfortunately the problem of motorcyclists’ assessment of thermal comfort is addressed marginally. Therefore it was decided to measure the thermal insulation of motorcycle clothing and relate values obtained to the possibility of feeling thermal comfort under various weather conditions. Apart from that, a case study under real conditions was carried out with the participation of 2 police officers. The research confirmed the problem related to high values of thermal insulation of motorcycle clothing and transport of moisture from the skin surface. By decreasing the thermal insulation of motorcycle clothing, as well as by increasing the effectiveness of channelling humidity off the skin surface. Furthermore tests of the thermal insulation of motorcycle clothing show the necessity to modify the construction of that type of clothing. The findings confirm that in summer (despite removal of the lining) the users of motorcycle clothing will not feel thermal comfort, which, in turn, can adversely influence their psychomotor skills and, as a result, the safety of driving. Motorcycle clothing is used mainly in summer, hence its thermal insulation should be reduced (but not at the cost of protection against a fall or weather conditions). The test results of selected physiological parameters of police officers also prove that the problem exists. Data relating to the skin temperature or relative humidity in the space between the body and clothing demonstrate that motorcycle clothing can cause thermal stress. High humidity values show the need to improve vaporisation and heat exchange at practically every measuring point. From the relationships presented, it can be concluded that ensemble A turned out to be a better solution from the perspective of physiological parameters; however, differences between the ensembles examined can be a consequence not only of their construction, i.e., the membrane applied, but also of the actual (diversified/heterogeneous) weather conditions. To improve air circulation in motorcycle clothing, producers apply, e.g. improved ventilation systems in the form of air vents placed in the most essential parts of the garment. Thermal comfort can be enhanced by taking out a membrane or, alternatively, by using a membrane which maintains optimal air permeability (to transfer sweat from the body) with improved protective properties against external conditions. The reduction of temperature in the underwear space is achieved by applying linings with PCM (phase change material). In the case of leather clothing, an innovative leather finish is used which makes it possible to e.g., reflect sun rays off the jacket, thus preventing the overheating of clothing. Despite a number of techniques used to improve motorcyclists’ comfort, they are often not sufficient therefore the search for new ways to reduce the thermal load should be pursued. In order to better explore the matter, extensive tests of physiological differences, in particular clothing ensembles (including leather clothes), are planned in the near future. The tests, with a larger number of volunteers, will be repeated in summer, when ambient temperatures are higher. Advantages: Investigation of the effect of clothing gear to increase of rider’s temperature. Disadvantages: A case study, no generalisability. Outcomes: The research confirmed the problem related to high values of thermal insulation of motorcycle clothing and transport of moisture from the skin surface. By decreasing the thermal insulation of motorcycle clothing, as well as by increasing the effectiveness of channelling humidity off the skin surface. Comparison to ADAS&ME: Thermal comfort can be enhanced by taking out a membrane or, alternatively, by using a membrane which maintains optimal air permeability (to transfer sweat from the body) with improved protective properties against external conditions.

ADAS&ME (688900) D1.1 – SoA and Benchmarking
March, 2017 Page 207 of 238 CERTH/HIT
Bogdan, A., Sudoł-Szopińska, I., Łuczak, A., Konarska, M., & Pietrowski, P. (2012). Methods of estimating the effect of integral motorcycle helmets on physiological and psychological performance. International journal of occupational safety and ergonomics, 18(3), 329-342. This article proposes a method for a comprehensive assessment of the effect of integral motorcycle helmets on physiological and cognitive responses of motorcyclists. To verify the reliability of commonly used tests, we conducted experiments with 5 motorcyclists. We recorded changes in physiological parameters (heart rate, local skin temperature, core temperature, air temperature, relative humidity in the space between the helmet and the surface of the head, and the concentration of O2 and CO2 under the helmet) and in psychological parameters (motorcyclists’ reflexes, fatigue, perceptiveness and mood). We also studied changes in the motorcyclists’ subjective sensation of thermal comfort. The results made it possible to identify reliable parameters for assessing the effect of integral helmets on performance, i.e., physiological factors (head skin temperature, internal temperature and concentration of O2 and CO2 under the helmet) and on psychomotor factors (reaction time, attention and vigilance, work performance, concentration and a subjective feeling of mood and fatigue). Technologies used include: an FT 2000 cardiometer for measuring heart rate (HR), local skin temperature and core temperature (Emtel, Poland); a Hygrolab thermometer and hygrometer to measure temperature and relative humidity (RH) in the space between the skin and the clothing or the helmet (Rotronic, Switzerland) and a MCZR/ATB 1.0 meter of choice reaction time (ATB Info-Elektro, Poland). Testing (5 participants) was made in climate chamber in 4 scenarios: V1—in a motorcycle uniform without a helmet, in thermoneutral conditions, i.e., temperature 20 °C, air velocity 0.2 m/s, RH 50%; V2—in a motorcycle uniform without a jacket or a helmet; temperature 30 °C, air velocity 2.0 m/s, RH 45%; levels of heat and noise (88 dB) corresponding to those of an urban agglomeration; V3—in a motorcycle uniform with a helmet, in thermoneutral conditions, i.e., temperature 20 °C, air velocity 0.2 m/s, RH 50%; V4—in a motorcycle uniform with a helmet, without a jacket; temperature 30 °C, air velocity 2.0 m/s, RH 45%; levels of heat and noise (88 dB) corresponding to those of an urban agglomeration. Measurements of mean skin temperature revealed that this was a reliable indicator for evaluating the effect of an integral helmet on a motorcyclist’s physiological parameters. Temperature inside the helmet, to be significant, has to be measured with great precision. Advantages: -
Disadvantages: reflexes and fatigue were measured using psychological test and not using physiological measures. Outcomes: - Comparison to ADAS&ME: What about measuring CO2 and O2 concentrations in the helmet to understand the rider's conditions?
Di Stasi, L. L., Contreras, D., Cándido, A., Cañas, J. J., & Catena, A. (2011). Behavioural and eye-movement measures to track improvements in driving skills of vulnerable road users: First-time motorcycle riders. Transportation research part F: traffic psychology and behaviour, 14(1), 26-35. Motorcyclist deaths and injuries follow the trend in sales rather than in growth in the number of motorcycles, suggesting that fatalities are related to the lack of driver experience with recently purchased motorcycles. The aim of the present investigation was to assess the effects of experience and training in hazard perception. We compared first-time riders (people who are not yet riders/drivers) before and after training in six different riding scenarios to expert motorcycle riders. Thirty-three participants took part in the experiment. Volunteers rode a moped in a fixed-base virtual environment and were presented with a number of pre-set risky events. We used a multidimensional methodology, including behavioural, subjective and eye-movements data. The results revealed differences between experts and first-time riders, as well as the effect of training on the novice group. As expected, training led to an improvement in the riding skills of first-time riders, reducing the number of accidents, improving their capacity to adapt their speed to the situation, reducing trajectory-corrective movements, and changing their pattern of gaze exploration. We identified several behavioural and eye-related measures that are sensitive to both long-term
ADAS&ME (688900) D1.1 – SoA and Benchmarking
March, 2017 Page 208 of 238 CERTH/HIT
experience and training in motorcycle riders. These findings will be useful for the design of on-line monitoring systems to evaluate changes in risk behaviour and of programs for preventing and controlling risk behaviour and improving situation awareness for novice riders, with the ultimate aim of reducing road-user mortality. The multidimensional methodology used here provides useful information on the factors involved in risk behaviour. We identified several behavioural and eye-related measures that are sensitive to both long-term experience and short-term training in motorcycle riders. These findings could be a starting point for educational training programs. They could also be useful in the design of on-line monitoring systems to evaluate changes in risk behaviour and for the design of risk prevention programs. Disadvantages: Results based only one driver; reliability is not sufficient. Outcomes: Association of fatigue states with driving performance. Comparison to ADAS&ME: Classification of states based on extracted features is extremely relevant to the FER that the project has uptake. The approach is validated and thus within the project we may replicate or replicate parts of it. Airaksinen, M., Tuomaala, P., & Holopainen, R. (2007). Modeling human thermal comfort. In Proceedings of Clima (Vol. 2007, pp. 10-4). Thermal comfort standards determine indoor conditions in buildings as well as the energy consumption for heating and cooling purposes. Existing thermal comfort standards are based on steady state thermal conditions, and according to recent research these standards cannot describe thermal comfort accurately enough with transient boundary conditions. In this paper, a method based on Hui (2003) is presented to calculate local and overall human body thermal sensations in time dependent and non-uniform. In addition, local and overall thermal comfort predictions can be performed based on these thermal sensation values. The researchers determined comfort temperatures for every part of the body. Advantages: Use of existing thermal comfort standards. Disadvantages: -
Outcomes: The researchers determined comfort temperatures for every part of the body. Comparison to ADAS&ME: To know the comfort temperatures for everybody region, linked with overall comfort sensation, could be very useful for UC E (ground truth definition). Woods, R. I. (1983). Cooling of motorcyclists in various clothing during winter in Britain. Ergonomics, 26(9), 847-861. Skin and ear-canal temperatures of seven volunteer motorcyclists have been measured during control periods and during rides of up to 161 km at air temperatures below 10°C. 54 km urban road + 40 km motorway path .While wearing their own clothing in air temperatures between 2.6 and 10-C the riders showed changes in heat storage of -438 to - 1611 Wm-'. The average of the three lowest temperatures ("C) recorded from selected sites from different subjects (and the means of the laboratory control values from all seven participants’ standard errors) were: foot, 14.7 (306f 0.93); shin, 21.4 (32.2+ 040); thigh, 17.8 (3 1.8 + 036); abdomen and chest, 25.3 (34.7 + 0.26); forearm, 288 (33.8k0.19; hand, 15.5 (308k 0.58); ear canal, 36.1 (37.2k0.7). The rate at which riders' feet cooled was not closely related to the rates their bodies cooled. Even when there was no body cooling, their feet cooled by at least 3OC hour-', while riding. The thickness of motorcycle clothing and its wind-proofing are both important in preventing cooling. Zip fasteners need special protection beyond that needed merely to keep out rain. Advantages: - Disadvantages: - Outcomes: The rate at which riders' feet cooled was not closely related to the rates their bodies cooled. Comparison to ADAS&ME: The model to calculate skin and body temperature is interesting and could be used in UC E. Parry, M. (1982). Skin temperature and motorcyclists' braking performance. Perceptual and motor

ADAS&ME (688900) D1.1 – SoA and Benchmarking
March, 2017 Page 209 of 238 CERTH/HIT
skills, 54(3_suppl), 1291-1296. 15 male and 12 female students who had previous experience with hand-operated lever-braking systems performed braking tests with their hands at normal temperatures (mean hand temperatures 273°C) and with their hands cooled to give finger temperatures of 6°C and back of hand temperatures of 14°C. Tasks required subjects, in response to a visual stimulus of a red light, to extend their digits to grip a motorcycle brake and pull it on. Reduced times were measured for (a) responding to the stimulus by grabbing the brake lever and pulling it to full braking pressure in the hydraulic system, (b) extending the digits, and (c) flexing the digits and pulling on the brake. In each case conditions produced a significant decrement in performance. This effect may occur when riding a motorbike with cold hands, a common occurrence in Northern Europe. Cold weather affected significantly braking time. Advantages: Measure how cold weather affects braking
Disadvantages: Very old technologies and measures
Outcomes: In each case conditions produced a significant decrement in performance. Comparison to ADAS&ME: Could be feasible for ADSA&ME to measure hands temperatures to give a feedback in UC E. Annex 1.6 Affective state: Rest David Perez Diaz de Cerio, Silvia Ruiz-Boque, Javier Rosell-Ferrer, Juan Ramoscastro, José Luis Valenzuela, Josep M. Colome (2013). The help4mood wearable sensor network for inconspicuous activity measurement. IEEE Wireless Communications. Volume 20, issue 4, 50-56. The Help4Mood EU FP7 project (H4M) proposes to significantly advance the state-of-the-art in computerized support for people with Major Depression by monitoring mood, physical activity and voice characteristics while promoting activities in reaction to examined inputs. Employing actigraphy can provide supplementary data about patients with depression. Nonetheless, its use is not standardized and there is a lack of public analyses about treated patients with depression using this technique, which is the objective of the project. The purpose of the Personal Monitoring System (PMS) used in H4M is to compile objective data about the changes and trends of activity patterns during long periods of time. This would comprise daily activity, rest time and, if possible, sleep quality. The PMS uses inconspicuous methods but keeping the cost associated with sensor installation at the patient’s home to a minimum. This work focuses on the Wireless Sensor Network (WSN) enhancements introduced after real testbeds and considering User Quality of Experience (QoE), mainly oriented to reduce energy consumption and required data transmission and consequently improving the autonomy and range of the sensors. The purpose of the H4M project is applying Information and Communication Technologies to the treatment of patients suffering mild or major depression allowing them to recover at their own home. In this paper the evolution of the initial wire- less sensor network has been described. Advantages: In this article it the code was ported into python, thus all the communications procedures are integrated in single software, and third parties or licensed software is no longer needed. Disadvantages: Security issues have to be further examined as all human activities are recorded into a database. Outcomes: The analysis of the conducted usability tests revealed that many samples stored at the sensors were repetitions. Thus, a simple compression algorithm has been proposed. This algorithm extends the period of time before a download is required. The sensors have gained, in this way, autonomy and extended battery life. Finally, due to changes on the preliminary considerations of the project, a data hub has been implemented. This data hub can be used to extend the coverage area of the system, but it also makes the platform more flexible and efficient, reducing transmission attempts and energy consumption at sensor devices. Comparison to ADAS&ME: A similar architecture can be used to manage all human monitoring sensors. I. Orha, S. Oniga (2015). Wearable sensors network for activity recognition using inertial sensors.

ADAS&ME (688900) D1.1 – SoA and Benchmarking
March, 2017 Page 210 of 238 CERTH/HIT
Carpathian Journal of Electronic and Computer Engineering 8/2 (2015) 3-6. The aim of this paper is to present the implementation of an activity recognition system based on a data acquisition system with inertial sensors. The presented system allows recording sensors data from a wearable system containing two inertial sensors, in files for storage and further processing or real-time tracking of the parameters provided by sensors. Advantages: A system in this study is proposed to recognize seventeen activities or postures as follows: standing, sitting, supine, prone, left lateral recumbent, right lateral recumbent, walking, running, left bending, right bending, squats, settlements and lifting the chair, falls, turns left and right, upstairs, down stairs. Disadvantages: Does not provide any feedback on accuracy. Outcomes: A data acquisition system is proposed using inertial sensors, for acquiring data related to body position and some simple movements. Comparison to ADAS&ME: This system can monitor human activity and hence understand if he is resting in respect to physical activities. Stefan Oniga, Sütő József (2015). Optimal Recognition Method of Human Activities Using Artificial Neural Networks. MEASUREMENT SCIENCE REVIEW. Volume 15, issue 6, 323-327. The aim of this research is an exhaustive analysis of the different factors that may influence the recognition rate of the human activity using wearable sensors data. In the present research it is examined the influence of the number of sensor nodes, the type of sensor node, pre-processing algorithms, type of classifier and its parameters. The experimental results illustrate that the proposed multi-sensor system can achieve overall recognition accuracy over 97 % without any pre-processing using 5 sensors. Obtained a recognition rate over 95 % even for some of the setups with two sensors, adopting the sum of acceleration components and the standard deviation of the sum as pre-processed new features, when using an ANN classifier. Advantages: An optimal setup is proposed for best recognition rates with the lowest hardware and software costs. For an easier access to these data the authors created a Matlab script which extracts data corresponding to all activities performed by a subject in a recording session. Disadvantages: Activities need to be described and predetermined, hence needs a good understanding of the resting state while driving. Outcomes: Better results can be obtained using a better placement of the sensors. With 2 sensors placed on the thigh and wrist and using only the accelerometer data and pre-processed data they obtained very good results as presented. Comparison to ADAS&ME: The proposed system shows a method in which the use of fewer sensor nodes provides an increased comfort to wear and the system is more reliable. Akram Bayat, Marc Pomplun, Duc A. Tran (2014). A Study on Human Activity Recognition Using Accelerometer Data from Smartphones. Procedia Computer Science. Volume 34, issue 6, 450-457. This paper describes how to recognize certain types of human physical activities using acceleration data generated by a user's cell phone. A recognition system is proposed in which a new digital low-pass filter is designed in order to isolate the component of gravity acceleration from that of body acceleration in the raw data. The system was trained and tested in an experiment with multiple human subjects in real-world conditions. High-frequency and low-frequency components of the data were taken into account. Advantages: A model that is capable of recognizing multiple sets of daily activities under real-world conditions, using data collected by a single triaxial accelerometer built into a cell phone does not require infrastructure or vehicle support. Disadvantages: The phone has to be on the driver all the time for recording his activity. Outcomes: Using the average of probabilities as the fusion method could reach an overall accuracy rate of 91.15%. Comparison to ADAS&ME: For future work plans is to extend the activity recognition task in several ways, first to recognize additional activities, such as sleeping or bicycling. Hence it’s a useful tool which can be easily integrated to the project, especially for motorbike drivers.

ADAS&ME (688900) D1.1 – SoA and Benchmarking
March, 2017 Page 211 of 238 CERTH/HIT
Yonglei Zheng, Weng-Keen Wong, Xinze Guan, Stewart Trost (2013). Physical Activity Recognition from Accelerometer Data Using a Multi-Scale Ensemble Method. Proceedings of the Twenty-Fifth Innovative Applications of Artificial Intelligence Conference. 1575-1581. Accurate and detailed measurements of an individual's physical activity are key requirements for helping researchers understand the relationship between physical activity and health. Accelerometers have become the method of choice for measuring physical activity due to their small size, low cost, convenience and their ability to provide objective information about physical activity. However, interpreting accelerometer data once it has been collected can be challenging. In this work, the authors applied machine learning algorithms to the task of physical activity recognition from triaxial accelerometer data. Advantages: The authors proposed the Subwindow Ensemble Model which used an ensemble of classifiers trained on features made up of coarse summary statistics computed from different temporal scales. The SWEM outperformed other baseline algorithms. Disadvantages: Discriminative features existed at different temporal scales for the various activity types. For example, on the OSU Hip dataset, subwindows of size 8 and 9 produced the best results for lying, sitting, and walking while subwindows of size 1 produced the best results for standing and running. Outcomes: The SWEM algorithm achieved very accurate results (≥ 90% for OSU data, > 80% for HASC), which suggests that the algorithm could be viable for deployment. Comparison to ADAS&ME: Algorithms can be integrated to the project even the free-living data consists of a mixture of different activities performed throughout an individual’s day, and thus it is necessary to explore algorithms for segmenting the data and classifying these segments into physical activity types. Catie Chang, Coraline D. Metzger, Gary H. Glover, Jeff H. Duyn, Hans-Jochen Heinze, and Martin Walter (2014). Association between heart rate variability and fluctuations in resting-state functional connectivity. NeuroImage. Volume 68, 93-104. The present study explores the link between endogenous dynamics of functional connectivity and autonomic state in an eyes-closed resting condition. Using a sliding window analysis on resting state fMRI data from 35 young, healthy male subjects, the authors examined how heart rate variability (HRV) co-varies with temporal changes in whole-brain functional connectivity with seed regions previously described to mediate effects of vigilance and arousal (amygdala and dorsal anterior cingulate cortex; Dacca). Advantages: This work provides evidence for neural (BOLD functional connectivity) correlates of distinct autonomous nervous states as characterized by HRV, suggesting a physiological contribution to the observed non-stationarity of resting state connectivity between particular regions that may ultimately translate to a psychological dimension of time-varying vigilance states. Disadvantages: The present analysis took steps toward understanding the relationship between fluctuations in functional connectivity using HRV as an indicator of state change. While HRV is by no means a complete picture of the “vigilance state” of an individual, and it has only indirect connections to both psychological and autonomic processes, the finding that salience network modulation occurs in concert with HRV variations lends support to a representation of psychological states by transient resting-state connectivity. Outcomes: Correlations between sliding-window measures of HRV and respiration are shown. The RMSSD metric of HRV using both the heart rate and inter-beat-interval time series were strongly correlated (0.90±0.09). Significant covariation was observed of HRV with regional connectivity over the resting-state scan. Comparison to ADAS&ME: Provides a strong basis to include HRV sensors to monitor the driver’s resting condition. Zhengjun Li, Aniseh Kadivar, John Pluta, John Dunlop, and Ze Wang, (2012). Test-retest Stability Analysis of Resting Brain Activity Revealed by BOLD fMRI. JMRI. 36(2): 344-354. Simulations were used to assess the sensitivity of SRFC, ReHo, and ALFF to noise interference.

ADAS&ME (688900) D1.1 – SoA and Benchmarking
March, 2017 Page 212 of 238 CERTH/HIT
Repeat resting blood-oxygen-level-dependent (BOLD) fMRI were acquired from 32 healthy subjects. The intra-class correlation coefficient (ICC) was used to assess the stability of the 4 metrics. Advantages: The authors assessed the sensitivity and test-retest stability of several resting fMRI-based SBA metrics using synthetic and in-vivo data. SRFC, ReHo, and ALFF were demonstrated to be stable to noise interference. Disadvantages: Difficult to use such technology and if so it can’t be for al. Outcomes: The neighbourhood size for calculating ReHo should be larger than 20 voxels. ICC>0.5 and cluster size>11 should be used to assess ICC for ACC/PCC SRFC, ReHo and ALFF at each voxel. BOLD fMRI-based SBA can be reliably measured using ACC/PCC SRFC, ReHo and ALFF after two months Comparison to ADAS&ME: Very important as noise is a major factory especially for the motorbike tests. Nicolas Vigneau-Roy, Michael Bernier, Maxime Descoteaux, and Kevin Whittingstall (2013). Regional Variations in Vascular Density Correlate With Resting-State and Task-Evoked Blood Oxygen Level-Dependent Signal Amplitude. Human Brain Mapping. Volume 35, Issue 5, 1906-1920. Using the variation of the oxy/deoxygenated blood ratio and blood volume in the brain following neural activation, the BOLD signal is a surrogate measure of neural activity, reflecting hemodynamic changes caused by a complex interaction of cerebral blood flow (CBF), cerebral blood volume (CBV), and cerebral metabolic rate of oxygen (CMRO2). In this study, the authors use a novel method to reinvestigate the well-known, yet often neglected impact of cerebral vascularization on the interpretation of RS and task-evoked BOLD signals. They first developed an automated approach of segmenting vessels based on susceptibility-weighted images (SWIs) from which they then compute regional measures of VAD at various spatial scales Advantages: The main advantage of the BOLD signal is that it is relatively easy to measure and thus is often used as a proxy for comparing brain function across population groups. Disadvantages: It makes it difficult to interpret whether differences in BOLD between cortical areas reflect true differences in neural activity or vascular structure. Outcomes: The findings add to the growing body of evidence, suggesting that regional variations in GMD (as derived from VBM) are not strong predictors of the BOLD response amplitude. Comparison to ADAS&ME: Correlates to the resting state of the driver, both in means of brain or physical activities. Qi Xu, Yazhi Quan, Lei Yang, and Jiping He (2013). An Adaptive Algorithm for the Determination of the Onset and Offset of Muscle Contraction by EMG Signal Processing. IEEE TRANSACTIONS ON NEURAL SYSTEMS AND REHABILITATION ENGINEERING, volume 21, issue 1, 65-73. Electromyography (EMG), which mainly reflects the electrical properties of a muscle, has been proven to be a useful tool for interpretation of muscle activities and its varying characteristics in both normal and pathological cases. The implicit assumption underlying most threshold-based methods is that the EMG signal power from a contracted muscle is much greater than that from the same muscle being relaxed. In most cases, sEMG signals have a good signal-to-noise ratio (SNR), so these methods perform well in detecting the onset time when SNR is larger than 10 dB [23]. However, sEMG of small and deep muscles as well as sEMG recorded in patients with neuromuscular diseases may not meet this SNR requirement, which motivates the search for more sophisticated statistical methods. In this paper, it is addressed the problem of the onset and offset identification of muscle contraction timing by sEMG signal processing based on statistically optimal decisions. Due to the specific dependence of the detection accuracy on the decision threshold, it is important to determine a proper threshold value for accurate sEMG signal analysis. The proposed statistically optimized method was applied first to simulated signals in a broad interval of SNR to investigate the dependence of estimated error on SNR and decision threshold. Then the new approach, aimed at detecting the muscular activation intervals, was tested on the simulated signals to evaluate its performance and detection capabilities. Advantages: The detection of muscle activation intervals provides important clinical information, allowing the investigation of the temporal activation patterns of muscle groups.

ADAS&ME (688900) D1.1 – SoA and Benchmarking
March, 2017 Page 213 of 238 CERTH/HIT
Disadvantages: The algorithm’s accuracy is directly related to the speed. A bigger computational time provides better accuracy, but this might not be practicable for driving conditions. Outcomes: In this paper, an improved ML algorithm with an adaptive threshold technique was devised to face the task of detecting both onset and offset timing of muscle contraction by sEMG signal processing in the case of low SNR. Comparison to ADAS&ME: Using EMG method to detect the resting state is very useful since it can also be implemented into a small wearable device usable by all kind of drivers. Eliasz Kańtoch, Piotr Augustyniak (2012). Human Activity Surveillance based on Wearable Body Sensor Network. Computing in Cardiology, 325-328. This paper presents a health monitoring system which integrates wearable and battery-operated ECG, movement (accelerometer), temperature and GPS sensors which send data to monitoring gateway via wireless Bluetooth network. Algorithms were developed that process and analyse signals in real time in order to calculate heart rate, activity, temperature and locate the patient. The main advantage of the system is algorithms optimization for real time data processing. Advantages: A body sensor network consists of one or more wearable network nodes, capable of sensing physiological signs. These nodes are placed on the human body as tiny patches or can even be attached to user’s clothes. Disadvantages: The proposed system needs further testing including more activities. Outcomes: The achieved results are satisfactory for the monitoring purposes. However, more tests are needed to develop system that will focus on prevention and early detection of health conditions. Comparison to ADAS&ME: Using EMG method to detect the resting state is very useful since it can also be implemented into a small wearable device usable by all kind of drivers. Annex 1.7 Environmental sensing Barbara Barbagli, Gianfranco Manes, Rodolfo Facchini, Antonio Manes (2012). Acoustic Sensor Network for Vehicle Traffic Monitoring. The First International Conference on Advances in Vehicular Systems, Technologies and Applications. 1–6. In this paper, we propose a Wireless Sensor Network that utilizes a microphone array to detect the sound waves generated by the road vehicles. System nodes process sound signals locally to extract traffic parameters on site rather than transmitting the measurements, in order to save both in energy and in bandwidth. The basic principle of the sensing technique is to measure the temporal variation of the differential time of arrival of the acoustic signal at each pair of sensors with an algorithm based on a generalized cross-correlation method. The collected information are transmitted to a central server and made available to a remote user. In comparison with existing traffic sensors, the proposed system offers lower installation and maintenance costs, is less intrusive to environment and allows the detection of traffic congestion location. Advantages: Low installation and maintenance costs. Disadvantages: Results are only experimental. Outcomes: The signal processing algorithm and the vehicle detection procedure are described. Experimental results of long-time period operation are shown. The developed system shows the following key features: (i) provides a complete picture state of the traffic flow at an larger scale and in real-time (ii) collect information coming from two different devices (iii) presents low installation and maintenance cost (iv) is able to large scale deployment. Comparison to ADAS&ME: Can easily be installed on all kind of vehicles to monitor near traffic. Kangyan Wang, Rui Wang, Yutian Feng, Haiyan Zhang, Qunfeng Huang, Yanliang Jin Youzheng Zhang (2014). Vehicle recognition in acoustic sensor networks via sparse representation. 2014 IEEE International Conference on Multimedia and Expo Workshops (ICMEW). This paper presents a new approach to recognize the types of moving vehicles in a distributed, wireless sensor network, based on sparse signal representation. Through a sparse representation computed by l1-minimization, it proposes a general classification algorithm for acoustic object recognition. This

ADAS&ME (688900) D1.1 – SoA and Benchmarking
March, 2017 Page 214 of 238 CERTH/HIT
algorithm first uses Mel frequency cepstral coefficients to extract the acoustic features of vehicles and then constructs an over-complete dictionary by the training feature sets and represents the test feature sets sparsely. The objective vehicles will be recognized by solving the optimization problem of sparse representation. Advantages: Provides a general classification algorithm for acoustic object recognition. Disadvantages: The experiments are based on the data sets of military vehicles collected by DARPA. The algorithm need to be further tested. Outcomes: the results show that the proposed algorithm model gives good performance on vehicle recognition. Compared with other classification algorithms, the method improves the precision of recognition. Comparison to ADAS&ME: Acoustic sensors are a good and low cost solution to monitor the traffic near the vehicle. Juan Jesús Castillo Aguilar, Juan Antonio Cabrera Carrillo, Antonio Jesús Guerra Fernández, Enrique Carabias (2015). Robust Road Condition Detection System Using In-Vehicle Standard Sensors. Sensors (Basel). 15(12): 32056–32078. In this work, the authors try to detect the road condition the vehicle is being driven on, using the standard sensors installed in commercial vehicles. Vehicle models were programmed in on-board systems to perform real-time estimations of the forces of contact between the wheel and road and the speed of the vehicle. Subsequently, a fuzzy logic block is used to obtain an index representing the road condition. Finally, an artificial neural network was used to provide the optimal slip for each surface. Advantages: Uses vehicle’s standard equipment. Disadvantages: Gives and instant detection of road condition. Does not detect upcoming road abnormally or dangerous zones. Outcomes: These simulations show the ability of the proposal to yield accurate values of the road condition index and optimal sliding when changes have been made in the adhesion characteristics of the road condition in both straight and curved trajectories. Comparison to ADAS&ME: Road condition index and sliding is an important factor of the vehicle’s environment. Xiaofeng Tang, Feng Gao, Guoyan Xu, Nenggen Ding, Yao Cai, Mingming Ma and Jianxing Liu (2014). Sensor Systems for Vehicle Environment Perception in a Highway Intelligent Space System. Sensors 2014. 14, 8513-8527. A Highway Intelligent Space System (HISS) is proposed to study vehicle environment perception in this paper. The nature of HISS is that a space sensors system using laser, ultrasonic or radar sensors are installed in a highway environment and communication technology is used to realize the information exchange between the HISS server and vehicles, which provides vehicles with the surrounding road information. In order to verify the accuracy and feasibility of the HISS, a traditional vehicle-mounted sensor system for environment perception is used to obtain the relative driving state. the simulation results shows that using the HISS for environment perception can arrive at the same results detected by a traditional vehicle-mounted sensors system. Advantages: Provides a good comparison between infrastructure and vehicle-mounted sensors. Disadvantages: High cost of installation and maintenance. Outcomes: The simulation results demonstrate that using HISS can realize vehicle driving state prediction and ensure vehicle driving process stability. Comparison to ADAS&ME: A highway Intelligent Space System is very expensive. ADAS&ME uses only the traditional vehicle-mounted sensors which provide the same results. Ryan W. Wolcott and Ryan M. Eustice (2014). Visual Localization within LIDAR Maps for Automated Urban Driving. 2014 IEEE/RSJ International Conference on Intelligent Robots and Systems (IROS 2014). IEEE. The most common sensor on these platforms, a three-dimensional (3D) light detection and ranging (LIDAR) scanner, generates dense point clouds with measures of surface reflectivity-which other state-of-the-art localization methods have shown are capable of centimetre-level accuracy.

ADAS&ME (688900) D1.1 – SoA and Benchmarking
March, 2017 Page 215 of 238 CERTH/HIT
Alternatively, the paper seeks to obtain comparable localization accuracy with significantly cheaper, commodity cameras. Results are shown for two different datasets, a 3.0 km and a 1.5 km trajectory, where they also compare against the state-of-the-art in LIDAR map-based localization. In this paper, the authors propose exploiting 3D prior maps (augmented with surface reflectivities) constructed by a survey vehicle equipped with 3D LIDAR scanners. They localize a vehicle by comparing imagery from a monocular camera against several candidate views, seeking to maximize normalized mutual information (NMI). Advantages: Provides an implementation system and algorithm in order to use single monocular camera for visual localization. Disadvantages: The described system needs further testing as the camera has several environmental sensitivities (e.g. light). Outcomes: A comparison of the algorithm against the state-of the-art LIDAR-only automated vehicle localization, revealing that their approach can achieve a similar order of magnitude error rate, with a sensor that is several orders of magnitude cheaper. Comparison to ADAS&ME: A camera can be easily installed on all kind of vehicles. This is a very cost-effective solution. Preston Hartzella, Craig Glenniea, Kivanc Biberb, Shuhab Khan (2014). Application of multispectral LiDAR to automated virtual outcrop geology. ISPRS Journal of Photogrammetry and Remote Sensing. Volume 88, 147-155. The radiometric calibration of the TLS intensity values is investigated and the classification performance of the multispectral TLS intensity and calibrated reflectance datasets evaluated and compared to classification performed with passive visible wavelength imagery. Advantages: Topology of the surrounding environment can be detected using existing commercial hardware. Disadvantages: Quantitative classification results based on ROI definitions revealed that while radiometrically calibrated TLS reflectance values were more effective than raw TLS intensities, RGB information from passive digital photography was equally or more effective in discriminating the rock outcrop units in this study, depending on class selection. Outcomes: Results indicate that rock types can be successfully identified with radiometrically calibrated multispectral TLS data, with enhanced classification performance when fused with passive visible imagery. Comparison to ADAS&ME: This can be useful to detect rough environments, such as a dirt road. Kim, Dongwook, Chung, Taeyoung Yi, Kyoungsu (2015). Lane-level localization using around view monitoring camera for automated urban driving. FAST-zero'15: 3rd International Symposium on Future Active Safety Technology Toward zero traffic accidents. 343-348. This paper describes a method of lane-level localization for automated driving using around view monitoring (AVM) camera. The maps are created beforehand using an AVM camera and RTK GPS. A pose estimation of vehicle was derived from a low-cost GPS and an iterative closest point(ICP) match of real-time sensor data to lane map. And the estimated pose was used as an observation inside a Kalman filter framework. The proposed algorithm will be useful in the implementation of automated driving Advantages: Has cheap components, easy to implement. Disadvantages: Requires further testing on real-life accuracy. Outcomes: The performance of proposed localization algorithm (esp. lateral and yaw error) allows a lateral control precise enough to be applicable. At the moment (generally crossroads), the localization error is accumulated slightly. Comparison to ADAS&ME: Can be used as an alternative or complementary solution to sense the environment or specific aspects of it. Vicente Milanés, David F. Llorca, Jorge Villagra, Joshué Pérez, Carlos Fernández, Ignacio Parra, Carlos González, Miguel A. Sotelo (2013). Intelligent automatic overtaking system using vision for vehicle detection. Expert Systems with Applications. Volume 39, issue 3, 3362-3373.

ADAS&ME (688900) D1.1 – SoA and Benchmarking
March, 2017 Page 216 of 238 CERTH/HIT
This paper describes the authors approach to automation of one the riskiest autonomous manoeuvres involving vehicles – overtaking. The proposal is based on a stereo vision system to detect the preceding vehicle and then to activate the autonomous overtaking system. An overtaking manoeuvre is a driving action involving a rapid movement to negotiate an obstacle. This movement includes a steering wheel turn combined with a speed increase. The former is applied to perform a double change of lane - first to overtake the obstacle, and then to return to the original lane in a progressive steering change. Advantages: Can sense dangerous situations on the surrounding traffic and also propose an overtaking manoeuvre action methodology. The overtaking manoeuvre is a common practice for motorbike drivers. Disadvantages: It still remains unclear whether cortisol response to controlled experimental conditions (stressors) may fully apply to the response to actual life stressors. Outcomes: While the results achieved are promising, there still remain several questions in need of further investigation. Among them, the detection of oncoming traffic via stereo vision, increasing the vehicle detection range, and performing the autonomous lateral displacement at greater speeds. Comparison to ADAS&ME: The system can be part of an advanced driver assistance system or automated to aid driving in very difficult or dangerous tasks. Michael Milford (2013). Vision-based place recognition: how low can you go?. The International Journal of Robotics Research. 32(7) 766–789. The primary contribution of this paper is to show that in path-like environments, vision-based place recognition can be achieved using sequences of remarkably small and/or poor-quality images. The localization algorithm used, SeqSLAM, sacrifices single frame localization capability in order to achieve more robust recognition using sequences of images, and the results demonstrate that such an approach can be successfully deployed in a range of environments and situations. Advantages: Performing localization using a sequence of images rather than a single image removes the requirement that the image matching scheme needs to be able to reliably calculate a single global image match. Disadvantages: The use of sequences rather than individual images introduces two types of lag. Outcomes: The establishment of an quite simple functioning localization algorithm (SeqSLAM). Comparison to ADAS&ME: Can be used to detect road geometry and assist automated driving. Changsun Ahn, Huei Peng, and H. Eric Tseng (2011). Robust Estimation of Road Friction Coefficient. American Control Conference on O'Farrell Street. 961-985. This study presents four methods to estimate the friction coefficient based on four different excitation conditions: medium lateral excitation, large lateral excitation, small longitudinal excitation, and large longitudinal excitation. For the lateral excitation cases, the estimation is based on vehicle lateral/yaw dynamics and Brush tire model, whereas for the longitudinal excitation cases, the estimation basis is the relationship between the tire longitudinal slip and traction force. These four methods are then integrated to increase the working range of the estimator and to improve robustness. The performance of the integrated estimation algorithm is verified through experimental data collected on several surface conditions. Advantages: Knowledge of the friction coefficient of the road is thus important for the design and analysis of vehicle control systems, especially active safety systems. Disadvantages: one of the estimators is developed based on a small longitudinal slip model so that it cannot handle large longitudinal slip cases. Outcomes: The algorithm works well under sudden surface changes and varying steering excitations. Comparison to ADAS&ME: Can be used as alternative method to determine road condition (cracks, ice, side slip angle etc.).
ADAS&ME (688900) D1.1 – SoA and Benchmarking
March, 2017 Page 217 of 238 CERTH/HIT
Annex 2. Automation strategies for motorcycles
Savino, G., Pierini, M., Thompson, J., Fitzharris, M., & Lenné, M. G. (2016). Exploratory field trial of motorcycle autonomous emergency braking (MAEB): considerations on the acceptability of unexpected automatic decelerations. Traffic injury prevention, 17(8), 855-862. Objective. Autonomous emergency braking (AEB) acts to slow down a vehicle when an unavoidable impending collision is detected. In addition to documented benefits when applied to passenger cars, AEB has also shown potential when applied to motorcycles (MAEB). However, the feasibility of MAEB as practically applied to motorcycles in the real world is not well understood. Methods. In this study we performed a field trial involving 16 riders on a test motorcycle subjected to automatic decelerations, thus simulating MAEB activation. The tests were conducted along a rectilinear path at nominal speed of 40 km/h and with mean deceleration of 0.15 g (15% of full braking) deployed at random times. Riders were also exposed to one final undeclared brake activation with the aim of providing genuinely unexpected automatic braking events. Results. Participants were consistently able to manage automatic decelerations of the vehicle with minor to moderate effort. Results of undeclared activations were consistent with those of standard runs. Conclusions. This study demonstrated the feasibility of a moderate automatic deceleration in a scenario of motorcycle travelling in a straight path, supporting the notion that the application of AEB on motorcycles is practicable. Furthermore, the proposed field trial can be used as a reference for future regulation or consumer tests in order to address safety and acceptability of unexpected automatic decelerations on a motorcycle. The tests were conducted along a rectilinear path (not on public roads) with 16 participants. Riders can react well to unexpected 0.15g decelerations, with minor to moderate effort. Advantages:- Disadvantages: The scenario is very limited. Outcomes: The outcome is important, this is a first very limited test, but results show that reaction to unexpected decelerations is good. This is a good starting point for other experiments and to develop automated features, like autonomous emergency braking. Comparison to ADAS&ME: The information about the reaction to unexpected decelerations is good for the implementation of the recovery mode. The deceleration was obtained simply turning off the engine, while we can think of more sophisticated controls. Konanur, P. (2005). Application of Genetic Algorithms to a Multi-Agent Autonomous Pilot for Motorcycles (Doctoral dissertation, Indiana University South Bend). The Physics behind motorcycle driving are well understood and implemented by studying the laws of kinetics and kinematics behind the operation of the single track motor vehicle. In this thesis I worked with an application which is currently using OpenGL and implements an interactive motorcycle simulator which is based on the laws of physics. This application involves a multi-agent pilot capable of autonomously driving the vehicle using some configurable equations. I have applied genetic algorithms to find suitable values for the parameters of the pilot by testing it in a non-graphical environment, and I visually verified the results of the genetic algorithms with the graphical interface application. The performance of the pilot derived by the genetic algorithms is also compared with the manually configured pilot. Advantages:- Disadvantages: - Outcomes: No significant outcome. Comparison to ADAS&ME: No interest for ADAS&ME. The paper deals with algorithms to implement in an autonomous robot rider (the author has only made simulations on computer). Savino, G., Giovannini, F., Baldanzini, N., Pierini, M., & Rizzi, M. (2013). Assessing the potential benefits of the motorcycle autonomous emergency braking using detailed crash reconstructions. Traffic injury prevention, 14(sup1), S40-S49. The aim of this study was to assess the feasibility and quantitative potential benefits of a motorcycle autonomous emergency braking (MAEB) system in fatal rear-end crashes. A further aim was to identify possible criticalities of this safety system in the field of powered 2-wheelers (PTWs; e.g., any additional risk introduced by the system itself).

ADAS&ME (688900) D1.1 – SoA and Benchmarking
March, 2017 Page 218 of 238 CERTH/HIT
Advantages:- Disadvantages: - Outcomes: - Comparison to ADAS&ME: No direct advantage for us. It can only be cited as investigation of an autonomous function. Savino, G., Giovannini, F., Piantini, S., Baldanzini, N., & Pierini, M. (2015). Autonomous emergency braking for cornering motorcycle. In Proceedings of Conference Enhanced Safety of Vehicles (ESV). Autonomous emergency braking (AEB) has been indicated as a potential safety application not just for passenger cars and heavy goods vehicles, but also for motorcycles and powered two-wheelers (PTWs) at large. Motorcycle AEB (MAEB) was designed to produce autonomous deceleration of a host PTW in case of inevitable collision. Previous studies limited MAEB to the case of a PTW travelling along a straight, as the activation of AEB was considered hazardous for a leaning vehicle. This study aims to extend the applicability of MAEB to cornering scenarios. From the InSAFE database, three suitable PTW-to-car crash cases were identified and reconstructed via numerical simulations. For each case, a baseline simulation was tuned in order to reflect the kinematics and the collision configuration identified by the original InSAFE crash reconstruction. Then, for each crash case two additional simulations were performed, assuming that MAEB and MAEB+ respectively were active on the PTW at the time of the crash. Finally, the baseline results and the results obtained with MAEB and MAEB+ were compared to analyse the possible effects of these crash mitigation systems. Advantages:- Disadvantages: - Outcomes: Results are good but very limited (only computer simulation). Need for further and deeper investigations. Comparison to ADAS&ME: Only simulation, AEB based only on braking. Savino, G., Rizzi, M., Brown, J., Piantini, S., Meredith, L., Albanese, B., & Fitzharris, M. (2014). Further development of motorcycle autonomous emergency braking (MAEB), what can in-depth studies tell us? A multinational study. Traffic injury prevention, 15(sup1), S165-S172. In 2006, Motorcycle Autonomous Emergency Braking (MAEB) was developed by a European Consortium (Powered Two Wheeler Integrated Safety, PISa) as a crash severity countermeasure for riders. This system can detect an obstacle through sensors in the front of the motorcycle and brakes automatically to achieve a 0.3 g deceleration if the collision is inevitable and the rider does not react. However, if the rider does brake, full braking force is applied automatically. Previous research into the potential benefits of MAEB has shown encouraging results. However, this was based onMAEB triggering algorithms designed for motorcycle crashes involving impacts with fixed objects and rear-end crashes. To estimate the full potential benefit of MAEB, there is a need to understand the full spectrum of motorcycle crashes and further develop triggering algorithms that apply to a wider spectrum of crash scenarios. Advantages:- Disadvantages: - Outcomes: - Comparison to ADAS&ME: Not relevant, dealing only with potential impact of autonomous Emergency Braking. Savino, G., Pierini, M., Rizzi, M., Frampton, R., & Thompson, J. (2013). Can Experienced Riders Benefit from an Autonomous Emergency Braking System?. In International Motorcycle Safety Conference. Powered two wheelers (PTWs) are becoming increasingly popular in Europe but the risk of rider injury in a traffic crash far exceeds that for car occupants. The European Powered Two wheeler Integrated Safety project (PISa), identified autonomous emergency braking (MAEB) as a priority area

ADAS&ME (688900) D1.1 – SoA and Benchmarking
March, 2017 Page 219 of 238 CERTH/HIT
for reducing the injury consequences of PTW crashes. This study assessed the potential effectiveness of the PISa MAEB system, specifically in relation to its potential benefit for experienced riders. A sample of fifty-eight in-depth PTW crashes representing typical European crash scenarios were examined, of which half involved a rider with MAIS 2+ injury. An expert team analysed the data to determine the extent to which the MAEB would have affected the crash. In 39 cases (67% of the sample) the MAEB showed high potential to mitigate the crash outcome. Results indicated that, not only does the MAEB have potential to help novice riders but could also considerably improve safety for more experienced riders. The results shown here could encourage further development and acceptance of such systems. Advantages:- Disadvantages: - Outcomes: - Comparison to ADAS&ME: No direct advantage for us. It can only be cited as investigation of an autonomous function. Sharp, R. S. (2007). Motorcycle steering control by road preview. Journal of dynamic systems, measurement, and control, 129(4), 373-381. The main objectives of the work described are to devise an effective path-based motorcycle simulation capability and to add to understanding of how riders control motorcycles. Optimal linear preview control theory was previously applied to the tracking of a roadway by a car, using a simple car model operating in fixed control. Similar theory is applied to path control of motorcycles. The simple car previously employed is replaced by a much more elaborate motorcycle. The steering angle control used previously is changed into steering torque control. Rider upper body lean torque is also allowed as a control input. The machine speed is considered constant but is a parameter of the motion. The objective of the optimal control is to minimize a weighted sum of tracking errors, rider lean angle and control power. The time-invariant optimal control corresponding to a white noise disturbance and to an infinite optimization horizon is found for many situations, involving variations in machine speed and performance priorities. Tight controls, corresponding to high weightings on performance, and loose controls, corresponding to high weightings on control power, are identified. Results show the expected pattern for preview control, that information well into the future is of limited value in determining the present control inputs. Full system performance is achievable with only finite preview. The extent of the preview necessary for full performance is determined as a function of machine speed and performance priorities. This necessary preview is found to be in accord with conventional wisdom of motorcycle riding and rider training. Optimal path tracking preview controls are shown to represent the inverse dynamics of the motorcycle. New light is shed on the relative effectiveness of steering torque and body lean torque controls. Simulations of an optimally controlled motorcycle and rider combination are conducted. A typical lane change path and an S-shaped path from the literature are used. For a chosen speed, optimal controls are installed on the machine for which they were derived and simulation results showing tracking performance, control inputs, and other responses are included. Transformation of the problem from a global description, in which the optimal control is found, to a local description corresponding to the rider’s view, is described. It is concluded that a motorcycle rider model representing a useful combination of steering control capability and computational economy has been established. The model yields new insights into rider and motorcycle behaviour. The work consisted of numerical simulation starting from a theoretical model. One of the results is that the steering torque effect on the vehicle dynamics and trajectories is bigger than leaning torque effect. Advantages:- Disadvantages: - Outcomes: - Comparison to ADAS&ME: The result about steer and lean angle control should be taken into account. Levandowski, A., Schultz, A., Smart, C., Krasnov, A., Song, D., Lee, H., ... & Wang, F. (2010). Autonomous Motorcycle Platform and Navigation–Blue Team DARPA Grand Challenge 2005. Blue Team Autonomous Motorcycle Platform-DARPA. DARPA. Web, 1.

ADAS&ME (688900) D1.1 – SoA and Benchmarking
March, 2017 Page 220 of 238 CERTH/HIT
UC Berkley developed in 2004 and 2005 an autonomous motorcycle called "Ghostrider". It was sponsored by DARPA. In January 2003, the Pentagon challenged engineers, students and hobbyists to create by the following year an off-road vehicle that can find its own way across up to 200 miles of rocky desert. Berkeley's Blue Team took the challenge one step further: How do you make a motorcycle that drives itself? The technologies used include: an IMU to determine motorcycle attitude, cameras and GPS to explore surrounding areas and mechanical arms to right the bike after a fall. Stability is performed by an embedded PC with an AMD Geode NX1500 1GHz Processor. Vision processing and navigation is performed on a Supermicro SuperServer with two AMD Opteron Dual Core 2.2 GHz processors. Researchers used a simple PID control that worked well. Bike dynamics was controlled using steering angle and engine torque as input variables. Advantages: Tele-operated vehicle (sort of drone for military missions). Disadvantages: No stabilization at very slow speeds (null speed). Outcomes: It is difficult to understand the outcome of a military oriented application. Comparison to ADAS&ME: It concentrates on the navigation system (navigation and controls), but not on the stabilization (CMG), they control steering (which can be very critical on a motorcycle).They don't use momentum control to directionate the bike. It can be useful to understand the control strategy. To right the vehicle after a fall they use 2 mechanical arms. Yi, J., Song, D., Levandowski, A., & Jayasuriya, S. (2006, May). Trajectory tracking and balance stabilization control of autonomous motorcycles. In Robotics and Automation, 2006. ICRA 2006. Proceedings 2006 IEEE International Conference on (pp. 2583-2589). IEEE. In this paper, we present a trajectory tracking control algorithm for an autonomous motorcycle for the DARPA Grand Challenge. The mathematical dynamic model of the autonomous motorcycle is based on the existing work in modelling a bicycle and is extended to capture the steering effect on self-stabilization. The trajectory tracking control is designed using an external/internal model decomposition approach, and the motorcycle balancing is developed by the nonlinear control methods. The motorcycle balancing is guaranteed by the system internal equilibria calculation and by the trajectory and system dynamics requirements. The motion planning algorithms are based on the fused global positioning systems (GPS) and on-board computer vision systems information. The proposed control system is validated by numerical simulations, which are based on a real prototype motorcycle system. Stabilization (also at null speeds) is performed only with steering, while the decision of the optimal trajectory is made fusing info coming from a camera and GPS dynamics is controlled using steering angle and engine torque as input variables. Disadvantages: Stabilisation at v=0 using steering is probably not applicable on manned and heavy motorcycles. Outcomes: It is difficult to understand the outcome of a military oriented application. Comparison to ADAS&ME: Not interesting for ADAS&ME: - keep the bike stable at v=0 moving the steer is likely not applicable for manned motorcycles -To take into consideration dynamic model, if we'll need it for our applications. Yi, J., Zhang, Y., & Song, D. (2009, December). Autonomous motorcycles for agile manoeuvres, part i: Dynamic modelling. In Decision and Control, 2009 held jointly with the 2009 28th Chinese Control Conference. CDC/CCC 2009. Proceedings of the 48th IEEE Conference on (pp. 4613-4618). IEEE. The researchers have developed a dynamic model for a two-wheeler, also taking into account slide. The result is a theoretical dynamic model, taking into account also slide. Advantages: - Disadvantages: Limited, because for autonomous applications it considers only turning by steering and not by leaning. Outcomes: A little indirect validation is made in the following document. Comparison to ADAS&ME: To take into consideration dynamic model, if we'll need it for our applications. Yi, J., Zhang, Y., & Song, D. (2009, December). Autonomous motorcycles for agile manoeuvres, part

ADAS&ME (688900) D1.1 – SoA and Benchmarking
March, 2017 Page 221 of 238 CERTH/HIT
i: Dynamic modelling. In Decision and Control, 2009 held jointly with the 2009 28th Chinese Control Conference. CDC/CCC 2009. Proceedings of the 48th IEEE Conference on (pp. 4613-4618). IEEE. In this paper, we present trajectory tracking and balancing of autonomous motorcycles for agile manoeuvres. Based on the newly developed autonomous motorcycle dynamics in the companion paper, we present a nonlinear control design. The control systems design is based on the external/internal convertible (EIC) dynamical structure of the motorcycle dynamics. The control design of the EIC systems guarantees an exponential convergence of the motorcycle trajectory to a neighbourhood of the desired profiles while the roll motion converges to a neighbourhood of the desired equilibria that are estimated under a given desired trajectory. The effectiveness of the integrated control systems are demonstrated and validated by two numerical examples based on a racing motorcycle prototype. A theoretical derivation of a motorcycle control model was created where bike dynamics is controlled using steering angle and engine torque as input variables. Advantages: - Disadvantages: This is a dynamic model (not considering what happens at v=0). Outcomes: The control model was not implemented on a real system. To verify it they compared the model derived trajectory with the one performed by a real motorcycle (2 examples performed) . Comparison to ADAS&ME: To take into consideration the control model, if we'll need it for our applications. Zhang, Y., Li, J., Yi, J., & Song, D. (2011, May). Balance control and analysis of stationary riderless motorcycles. In Robotics and Automation (ICRA), 2011 IEEE International Conference on (pp. 3018-3023). IEEE. We present balancing control analysis of a stationary riderless motorcycle. We first present the motorcycle dynamics with an accurate steering mechanism model with consideration of lateral movement of the tire/ground contact point. A nonlinear balance controller is then designed. We estimate the domain of attraction (DOA) of motorcycle dynamics under which the stationary motorcycle can be stabilized by steering. For a typical motorcycle/bicycle configuration, we find that the DOA is relatively small and thus balancing control by only steering at stationary is challenging. The balance control and DOA estimation schemes are validated by experiments conducted on the Rutgers autonomous motorcycle. The attitudes of the motorcycle platform are obtained by a novel estimation scheme that fuses measurements from global positioning systems (GPS) and inertial measurement units (IMU). We also present the experiments of the GPS/IMU-based attitude estimation scheme in the paper. Stabilization (also at null speeds) is performed only with steering and bike dynamics is controlled using steering angle and engine torque as input variables. Advantages: - Disadvantages: Stabilisation at v=0 using steering is probably not applicable on manned and heavy motorcycles. Outcomes: - Comparison to ADAS&ME: Not interesting for ADAS&ME since we already have a good dynamic estimation system. Furthermore keeping the bike stable at v=0 moving the steer is potentially critic for motorbikes This paper uses the same dynamic model of the previous document Nenner, U., Linker, R., & Gutman, P. O. (2010). Robust feedback stabilization of an unmanned motorcycle. Control Engineering Practice, 18(8), 970-978. This paper details the design and implementation of a robust controller that stabilizes an unmanned motorcycle. A linearized model and Quantitative Feedback Theory (QFT) are used to derive a low order cascaded controller that stabilizes the motorcycle for velocities ranging from 2.5 to 6.5 [m/s]. Stabilization is achieved by measuring the roll angle and roll rate and controlling the steering torque. The approach is validated through simulations and experiments with a 50cc scooter whose throttle, brakes, and reference roll angle are radio-controlled. Technologies used include: 1 inclinometer, 1 vibrating ring gyro, and 1 24V DC motor to control the steer, microcontroller (PIC18 series) programmed in C, and electro-actuated mechanical steering mechanism.

ADAS&ME (688900) D1.1 – SoA and Benchmarking
March, 2017 Page 222 of 238 CERTH/HIT
The output is just one simple test (little tour on asphalt at very low speed, including small slopes) and the control system works in the only test performed. Advantages: - Disadvantages: Limited to a short range of speeds (from 9 to 23.4 km/h). It considers a scooter which is easier to stabilize (lighter and with lower centre of mass). Outcomes: The control was implemented on the real system and worked, but there was only one test case. Comparison to ADAS&ME: In this paper it is remarked that between curving using only steering and curving using only leaning, the first is better, but steer control can be critical (also from a functional safety point of view). From a technical point of view it is easier to stabilise a scooter rather than a motorcycle (lower weight and centre of mass closer to the ground). Shafiekhani, A., Mahjoob, M. J., & Roozegar, M. Adaptive Neuro-Fuzzy control of an unmanned bicycle. In this work, an adaptive critic-based neuro-fuzzy is presented for an unmanned bicycle. The only information available for the critic agent is the system feedback which is interpreted as the last action the controller has performed in the previous state. The signal produced by the critic agent is used alongside the back propagation of error algorithm to tune online conclusion parts of the fuzzy inference rules. Stability and roll angle tracking controls for an unmanned bicycle are presented. The effectiveness of the control schemes is proved by simulation results. The stabilization is once again performed with steering angle control. The control system uses a neuro fuzzy strategy. The dynamics model is very similar to the ones used in the papers for PTWs. Advantages: - Disadvantages: - Outcomes: - Comparison to ADAS&ME: It may be interesting to use a neuro fuzzy controller. Yetkin, H. (2013). Stabilization of Autonomous Bicycle (Doctoral dissertation, The Ohio State University). In this thesis, we utilize the precession eject of the gyroscope to stabilize the bicycle both at zero forward velocity and varying velocities. Equations of the motion of a bicycle with a wheel mounted on its bottom are derived and a first order sliding mode controller is designed to achieve the goal of stabilization. In order to verify the designed feedback controller, two experimental setups are built; an inverted pendulum setup and a bicycle setup. SMC design for the static bicycle model is tested on both the inverted pendulum and the bicycle setups. In order to judge the performance of the controller, a well-tuned PID controller is also tested on these setups. Then, in the light of the experimental results obtained on the inverted pendulum setup, a controller scheme for the stabilizing control of an autonomous bicycle is designed and tested on various road structures through simulation environment. Technologies used: (Lean angle sensor) CMG for stabilization, Control: PD and sliding mode controller, Arduino microcontroller, CMG moved by a DC electric motor, LOW (only one sensor, which is the lean angle sensor). Stabilisation is performed using a gyro. The dynamic model is derived using a Lagrangian approach. The authors consider to control the bicycle along a given path using only lean effect (no steering) resulting in numeric simulation and small rides in controlled environment. Advantages: Stabilization using gyroscopic effect should be considered Disadvantages: Rider is not considered. Test case is poor. Outcomes: Very little, the test was performed with a limited range of speeds and not on open roads. Comparison to ADAS&ME: The stabilization performed using a gyro is interesting and should be considered. Stabilizing a bicycle is much easier (lower weight and inertia). Make a motorcycle curving only with lean control (no steering control) could be interesting. Yavin, Y. (2005). Point-to-point and collision avoidance control of the motion of an autonomous bicycle. Computers & Mathematics with Applications, 50(10-12), 1525-1542.

ADAS&ME (688900) D1.1 – SoA and Benchmarking
March, 2017 Page 223 of 238 CERTH/HIT
This work deals with the stabilization and collision avoidance control of a riderless bicycle (see Figure 1). It is assumed here that the bicycle is controlled by a pedalling torque, a directional torque, and by a rotor mounted on the crossbar that generates a tilting torque. Given two points rA, rB, and a circular obstacle in the horizontal plane. Also, given a time interval [0, t/], where 0 < tf < co. It is shown here that by applying a kind of inverse dynamics control, the motion of the bicycle is stabilized while simultaneously controlling its speed and direction in such a manner that the point of contact between the bicycle's rear wheel and the horizontal plane will be able, during [0, tf], to move from rA to rB without hitting the obstacle. Stabilisation is performed using steering control and a reaction wheel (a disc rotor is better than a blade rotor because it can damp better the system oscillations). The dynamic Model was derived using Lagrangian approach. Advantages: Stabilisation using a reaction wheel should be considered. Disadvantages: Rider is not considered. Outcomes: Only numeric simulation. Comparison to ADAS&ME: The stabilization performed using a reaction wheel is interesting and should be considered. Stabilizing a bicycle is much easier (lower weight and inertia). Steering control may be critical. Beznos, A. V., Formal'Sky, A. M., Gurfinkel, E. V., Jicharev, D. N., Lensky, A. V., Savitsky, K. V., & Tchesalin, L. S. (1998, May). Control of autonomous motion of two-wheel bicycle with gyroscopic stabilisation. In Robotics and Automation, 1998. Proceedings. 1998 IEEE International Conference on (Vol. 3, pp. 2670-2675). IEEE. A bicycle with a gyroscopic stabilisation capable of autonomous motion along a straight line as well as along a curve is described. The stabilization unit consists of two coupled gyroscopes spinning in opposite directions. It makes use of a gyroscopic torque due to the precession of gyroscopes. This torque counteracts the destabilising torque due to gravity forces. The control law of the actuator drive making the gyroscopes to process is described. The stabilization is performed using both steering angle control and a couple of gyros. Advantages: Stabilization using gyroscopic effect should be considered. Disadvantages: Only numeric simulation. Rider not considered. Outcomes: Only numeric simulation. Comparison to ADAS&ME: The stabilization performed using a couple of gyro is very interesting and should be considered. Steer control may be critical. Stabilizing a bicycle is much easier (lower weight and inertia). Bickford, D. (2013). Path Following and Stabilization of an Autonomous Bicycle. In this thesis we present the systematic multi-loop control approach outlined in Figure 1.1 to stabilize a modern bicycle. An important feature is that the technique guarantees asymptotic convergence to constant curvature paths. A key advantage of our technique is that it uses linear control theory, which readily enables stability analysis and controller tuning. Stabilisation is performed using steering control and is limited to very low speeds. The dynamic model is derived using a Lagrangian approach. Advantages: It is the only paper considering the rider (as a rigid rider). Disadvantages: Only numeric simulation. Purely theoretical (no discussion on sensors and actuators). Outcomes: Little, almost only numeric simulation. Comparison to ADAS&ME: Very detailed for path following. Schematising rider as a rigid rider to be considered. LQR to be kept in consideration. Kanjanawanishkul, K. (2015). LQR and MPC controller design and comparison for a stationary self-balancing bicycle robot with a reaction wheel. Kybernetika, 51(1), 173-191. A self-balancing bicycle robot based on the concept of an inverted pendulum is an unstable and nonlinear system. To stabilize the system in this work, the following three main components are required, i.e., (1) an IMU sensor that detects the tilt angle of the bicycle robot, (2) a controller that is used to control motion of a reaction wheel, and (3) a reaction wheel that is employed to produce

ADAS&ME (688900) D1.1 – SoA and Benchmarking
March, 2017 Page 224 of 238 CERTH/HIT
reactionary torque to balance the bicycle robot. In this paper, we propose three control strategies: linear quadratic regulator (LQR), linear model predictive control (LMPC), and nonlinear model predictive control (NMPC). Several simulation tests have been conducted in order to show that our proposed control laws can achieve stabilisation and make the system balance. Furthermore, LMPC and NMPC controllers can deal with state and input constraints explicitly. Stabilisation is performed using a reaction wheel and the dynamic model derived using a Lagrangian approach. Advantages: Stabilization using a reaction wheel should be considered. LQR and MPC controls are sophisticated. Disadvantages: Rider is not considered. Only numeric simulation. Outcomes: Little, almost only numeric simulation. Comparison to ADAS&ME: The stabilization performed using a reaction wheel is interesting and should be considered. Stabilizing a bicycle is much easier (lower weight and inertia). LQR and MPC to be kept in consideration. Gallaspy, J. M., & Hung, J. Y. (1999). Gyroscopic stabilization of a stationary unmanned bicycle. Auburn (AL): Auburn University. This paper presents a method for stabilizing an unmanned bicycle in the upright position. Nonlinear dynamics of the bicycle and control gyroscope are modelled using Lagrange’s method. Then, a linear approximate model is developed to design a controller to stabilize the bicycle. An 8-bit fixed-point microcontroller computes control commands to actuate the gyroscope gimbal axis, thus producing a restoring torque on the bicycle frame. Simulations using MATLAB/SIMULINK are analysed, and experimental results are summarized. Finally, recommendations for further work are given in the concluding remarks. Stabilisation is performed using a gyro and the model derived using a Lagrangian approach. Bicycle is stabilised at v=0, but the activity is limited only to numeric simulation. Advantages: Stabilization using gyroscopic effect should be considered. Disadvantages: Rider is not considered. Test case very, very poor. Outcomes: Very little, almost only numeric simulation. Comparison to ADAS&ME: The stabilization performed using a gyro is interesting and should be considered. Stabilizing a bicycle is much easier (lower weight and inertia). Chih-Keng, C. H. E. N., & Thanh-Son, D. A. O. (2007). Genetic fuzzy control for path-tracking of an autonomous robotic bicycle. Journal of system design and dynamics, 1(3), 536-547. Due to its non-holonomic constraints and a highly unstable nature, the autonomous bicycle is difficult to be controlled for tracking a target path while retaining its balance. As a result of the non-holonomic constraint conditions, the instantaneous velocity of the vehicle is limited to certain directions. Constraints of this kind occur under the no-slip condition. In this study, the problem of optimization of fuzzy logic controllers (FLCs) for path-tracking of an autonomous robotic bicycle using genetic algorithm (GA) is focused. In order to implement path-tracking algorithm, strategies for balancing and tracking a given roll-angle are also addressed. The proposed strategy optimizes FLCs by keeping the rule-table fixed and tuning their membership functions by introducing the scaling factors (SFs) and deforming coefficients (DCs). The numerical simulations prove the effectiveness of the proposed structure of the genetic fuzzy controller for the developed bicycle system. Stabilisation is performed using steering control, but the activity is limited only to numeric simulation. Advantages: Fuzzy Logic Control with tuning of the input and output membership functions performed by GA (very sophisticated control). Disadvantages: Only numeric simulation. Rider not considered Outcomes: Very little: only numeric simulation. Comparison to ADAS&ME: It is far easier to stabilise a bicycle than a bike. As already said steer control is very problematic for motorcycles that will be on market. Fuzzy control to be kept in consideration.

ADAS&ME (688900) D1.1 – SoA and Benchmarking
March, 2017 Page 225 of 238 CERTH/HIT
Dzung, D., Regruto, D., Andreo, D., & Cerone, V. (2009). Experimental results on LPV stabilization of a riderless bicycle. In American Control Conference. In this paper the problem of designing a control system aiming at automatically balancing a riderless bicycle in the upright position is considered. Such a problem is formulated as the design of a linear-parameter-varying (LPV) state feedback controller which guarantees stability of the bicycle when the velocity ranges in a given interval and its derivative is bounded. The designed control system has been implemented on a real riderless bicycle equipped with suitable sensors and actuators, exploiting the processing platform ABB PEC80. The obtained experimental results showed the effectiveness of the proposed approach. Advantages: LPV control could be interesting. Disadvantages: simulation performed at limited speeds. They researchers are considering a tele operated bicycle. Outcomes: Very little, the test was performed with a limited range of speeds and not on open roads. Comparison to ADAS&ME: It is far easier to stabilise a bicycle than a bike. As already said steer control is very problematic for motorcycles that will be on market. LPV control to be kept in consideration. Colvin, G. (2014). Development and Validation of Control Moment Gyroscopic Stabilization (Doctoral dissertation, The Ohio State University). Two wheeled vehicles offer many advantages over other configurations such as greater manoeuvrability, smaller size, and greater efficiency. These advantages come at the sacrifice of stability and safety. The goal of this work is to improve the stability and safety of a two wheeled vehicle by the development of Control Moment Gyroscopic Stabilization. This technology integrated into a vehicle can deliver unparalleled manoeuvrability and stability for users compared to any vehicle in use today. The goal of my work was to develop and validate the system of gyroscopic stabilization to be implemented into a vehicle. To validate the concept, a MATLAB/Simulink program was created, modelling the behavior and response of an unstable body with gyroscopic stabilization applied. After completing multiple simulations on this model, a physical structure, similar to an inverted pendulum, was constructed and CMG stabilization has been tested on this setup. Gyroscopic stabilization has been validated in this configuration and has led to further study in multiple degree of freedom situations. The implementation of a vehicle which utilizes this technology can generate safer and more manoeuvrable vehicles for the public, military, and recreational users. Advantages: Stabilization using gyroscopic effect should be considered. Disadvantages: Rider is not considered. Test case is poor. Outcomes: Very little, almost only numeric simulation. Comparison to ADAS&ME: The stabilization performed using a gyro is interesting and should be considered. Stabilizing a bicycle is much easier (lower weight and inertia). Sliding mode controller could be considered. Lam, P. Y. (2012). Design and Development of a Self-Balancing Bicycle Using Control Moment Gyro (Doctoral dissertation). This work uses a control moment gyro (CMG) as an actuator. The control moment gyro (CMG) is typically used in a spacecraft to orient the vessel [5]. Appling a CMG as an actuator to balance a bicycle is a creative and novel approach; and is the first of its kind for balancing of a bicycle. Simulation exercises showed that a PD controller is adequate to for balancing the bicycle. A real-time controller was implemented on a kid-size bicycle and the bicycle was successfully balanced and able to move forward, reversing and small angle turning. Further research such as adaptive control can be added to the system so that the system can react to changes in payload. Advantages: Stabilization using gyroscopic effect should be considered. Disadvantages: Rider is not considered. The model is not "robust". Outcomes: Very little, the test was performed with a limited range of speeds and not on open roads. Comparison to ADAS&ME: The stabilization performed using a gyro is interesting and should be considered. Steer control may be critical. Stabilizing a bicycle is much easier (lower weight and inertia).

ADAS&ME (688900) D1.1 – SoA and Benchmarking
March, 2017 Page 226 of 238 CERTH/HIT
Annex 3. Transfer of knowledge from other transportation areas
Wei, Z., Zhuang, D., Wanyan, X., Liu, C. and Zhuang, H., 2014. A model for discrimination and prediction of mental workload of aircraft cockpit display interface. Chinese Journal of Aeronautics, 27(5), pp.1070-1077. This study constructs a new comprehensive evaluation model based on the Bayesian Fisher discrimination and classification method, by designing flight simulation tasks at different levels of mental workloads. The subjects were asked to perform the whole dynamic process of flight simulation in a flight simulator, including take-off, climb, cruise, approach and landing. Each flight simulation task lasted for 13 min, and mental workloads were manipulated in separate conditions by adjusting the quantity of flight indicators and refresh frequencies time) of abnormal information. The duration of abnormal information was 2 s and inter-stimulus interval between abnormal information was random. During the simulation flight, each subject was instructed to monitor the flight indicators presented on the head-up display, and had to detect and respond to abnormal information quickly and accurately. An experimental design method, similar to that of Latin square design, was adopted to counterbalance the sequence of the flight simulation tasks to reduce the effects of sequence to the experiment results. Sixteen flying cadets from Beihang University were recruited to participate in the present study, ranging in age from 21 to 28 years (age= 24.6± 3.2 years). Bayesian Fisher discrimination and classification method were applied and Repetitive measure analysis of variance (ANOVA) as well as cross-validation. Heart rate and heart rate variability parameters were measured. The verification by the cross check method shows that the comprehensive evaluation model had the highest discrimination and prediction accuracy (85.42%), followed in succession by reaction time index (79.17%), accuracy index (77.08%), NASA_TLX scale (64.58%) and physiological indexes SDNN (39.58%). Advantages: -
Disadvantages: The automatically monitored indicators have the lowest impact in the developed model. Outcomes: The dynamic flight simulation experiments show that four indexes, i.e., flight operation accuracy, reaction time, SDNN and NASA_TLX scale, are significantly sensitive to the change of flight task-related mental workload. Comparison to ADAS&ME: SDNN can be used as indicator of mental workload. Aricò, P., Borghini, G., Graziani, I., Taya, F., Sun, Y., Bezerianos, A., Thakor, N.V., Cincotti, F. and Babiloni, F., 2014, August. Towards a multimodal bioelectrical framework for the online mental workload evaluation. In 2014 36th Annual International Conference of the IEEE Engineering in Medicine and Biology Society (pp. 3001-3004). IEEE. In this study, a framework able to classify online different levels of mental workload induced during a simulated flight by using the combination of the Electroencephalogram (EEG) and the Heart Rate (HR) biosignals has been proposed. Ten healthy subjects were involved in the experimental protocol, performing the NASA - Multi Attribute Task Battery (MATB) over three different difficulty levels in order to simulate three classic showcases in a flight scene (cruise flight phase, flight level maintaining, and emergencies). The analyses showed that the proposed system is able to estimate online the mental workload of the subjects over the three different conditions reaching a high discriminability (p<.05). In addition, it has been found that the classification parameters remained stable within a week, without recalibrating the system with new parameters. Scalp EEG has been recorded from 16 EEG electrodes (FPz, F3, Fz, F4, AF3, AF4, C3, Cz, C4, P3, Pz, P4, POz, O1, Oz, O2) referenced to the earlobes and grounded to the AFz electrode (sample rate of 256Hz). Also, the HR and the vertical EOG activity were recorded at the same time of the EEG. The system has been entirely implemented in Matlab®, using the TOBI interfaces. All the post processing of the signals seems to have been performed in Matlab. Ross validation, Area Under Curve (AUC) of the Receiver Operating Characteristic, Repeated measures ANOVA. Stepwise Linear Discriminant Analysis was applied. Too many to be included all. The ANOVA analyses revealed that the score distributions related to the different subtasks (Easy, Medium and Hard) for all the three classifiers were significantly separated (EEG-based:

ADAS&ME (688900) D1.1 – SoA and Benchmarking
March, 2017 Page 227 of 238 CERTH/HIT
F(2,18)=37.84, p=10^-6; HR-based: F(2,18)=13.69, p=2.4x10^-3, Fusion-based: F(2,18)=36.52, p=10^-7). Advantages: The approach seems to be robust against different subjects. The authors claim that it could be enough to calibrate the system with the specific parameters of the operator once and then just use it without further adjustments maintaining a high reliability over at least a one-week period. Disadvantages: The best performance was acquired using all EEG recordings. The system has only been tested in a simulation environment. Outcomes: By combining information coming from different biosignals (e.g., EEG and HR), it is possible to have more reliable and faster information about the mental states of the user.. It has been also demonstrated that i) the system is able to significantly differentiate three workload levels related to the three difficulty level tasks employed with a high reliability; ii) the subjective features used for the evaluation of the mental workload remain stable over one week. Comparison to ADAS&ME: This study is only concerned with the mental workload. The idea is to be used as part of a system that "could intervene in real-time before the operator becomes overloaded while performing safety-critical tasks". The extracted indicators can be tested within ADAS&ME. Borghini, G., Astolfi, L., Vecchiato, G., Mattia, D. and Babiloni, F., 2014. Measuring neurophysiological signals in aircraft pilots and car drivers for the assessment of mental workload, fatigue and drowsiness. Neuroscience & Biobehavioral Reviews, 44, pp.58-75. This paper reviews published papers related to neurophysiological measurements (electroencephalography: EEG, electrooculography EOG; heart rate: HR) in pilots/drivers during their driving tasks. The aim is to summarise the main neurophysiological findings related to the measurements of pilot/driver’s brain activity during drive performance and how particular aspects of this brain activity could be connected with the important concepts of “mental workload”, “mental fatigue” or “situational awareness”. Overall: From the review of the current literature, it appears that the accuracy of the detection of the mental states in driver/pilot using neurophysiologic signals such as EEG, EOG and HR is close to 90%. Advantages: The paper provides an extensive list of available systems. Disadvantages: Identified shortcoming by this paper (not a disadvantage of the paper per se): "However, no device or convincing algorithm has been published or practically applied for a robust online recognition of such mental states to date. " Outcomes: Review of the literature suggests that a coherent sequence of changes for EEG, EOG and HR variables exists during the transition from normal drive, high mental workload and eventually mental fatigue and drowsiness. In particular, increased EEG power in theta band and a decrease in alpha band occurred in high mental workload. Successively, increased EEG power in theta as well as delta and alpha bands characterise the transition between mental workload and mental fatigue. Drowsiness is also characterised by increased blink rate and decreased HR values. Comparison to ADAS&ME: This paper does not only address pilots but drivers as well. Therefore it is directly related to the scopes of ADAS&ME. Sauvet, F., Bougard, C., Coroenne, M., Lely, L., Van Beers, P., Elbaz, M., Guillard, M., Leger, D. and Chennaoui, M., 2014. In-flight automatic detection of vigilance states using a single EEG channel. IEEE Transactions on Biomedical Engineering, 61(12), pp.2840-2847. These conditions, voluntary or even involuntary sleep periods may occur, increasing the risk of accidents. The aim of this study was to assess the performance of an in-flight automatic detection system of low vigilance states using a single electroencephalogram channel. Fourteen healthy pilots voluntarily wore a miniaturized brain electrical activity recording device during long-haul flights. The authors claiming that their results confirm the efficiency of a miniaturized single electroencephalographic channel recording device, associated with an automatic detection algorithm, in order to detect low-vigilance states during real flights. A miniaturized multichannel ambulatory recording device (Actiwave, CamNtech Ltd England) was used to collect two EEG derivations (C3-M2 and O1-M2) and a transversal EOG channel (E1-M2 and E2-M2). The data were post-processed
ADAS&ME (688900) D1.1 – SoA and Benchmarking
March, 2017 Page 228 of 238 CERTH/HIT
with Matlab. The area under the curve was calculated aiming to compare thresholds. The study was carried out during 15 operational real flights of more than 8 h. Recordings were carried out mainly during overnight flights. After pre-flight briefing, 30 min before the flight, electrodes and recording devices were installed by a medic for each pilot. The quality of the signal was visually checked after a 2 min recording period (1 min with opened eyes and 1 min with closed eyes), using a software developed on MATLAB. This period was considered as an awake and artefact free period and was then used as a reference period. Data were recorded continuously for each subject from before take-off to after landing, while they performed their regular activities. FPrate was upper (5%) for α and β indices. The best TP rate was observed using β, ratio and fuzzy fusion (i.e., between 0.87 and 0.92). Moreover, using β, (α + θ)/β ratio and fuzzy fusion, the percentage of good classification (sensitivity) was > 90, κ > 0.80, and AUC > 0.9. The TPrate, the percentage of good classification, AUC, and κ were all higher for the (α + θ)/β ratio method using the O1-M2 channel than the C3-M2 channel (p < 0.05). Advantages: It requires the use of only one EEG recording and a quite simple processing procedure. Disadvantages: It was tested only on 14 participants. One of them declared that he would not be willing to wear again that specific apparatus. Outcomes: The best concordance between automatic detection and visual scoring was observed within the O1-M2 channel, using the ratio of energies in frequency bands. Comparison to ADAS&ME: This study is only concerned with one state condition. No Assistant System and a relative mechanism are considered. The approach is actually one that has been already been tested in drivers. Çakır, M.P., Vural, M., Koç, S.Ö. and Toktaş, A., 2016, July. Real-Time Monitoring of Cognitive Workload of Airline Pilots in a Flight Simulator with fNIR Optical Brain Imaging Technology. In International Conference on Augmented Cognition (pp. 147-158). Springer International Publishing. In this study a preliminary LDA based classifier was developed and evaluated that aim to predict low, moderate and high mental workload states of pilots in real-time based on a set of features computed over a moving window of HbO and HbR measures obtained from 16 locations distributed on the prefrontal cortex. Tests were carried out at a thales Airbus A320 simulator, Functional near-infrared spectroscopy (fNIR) system developed at Drexel University (Philadelphia, PA), manufactured and supplied by fNIR Devices LLC (Potomac, MD; www.fnirdevices.com). A flexible head-piece (sensor pad), and a control box for hardware management. The fNIR sensor holds 4 light sources and 10 detectors, which obtains oxygenation measures at 16 optodes on the prefrontal cortex. Data were collected with COBI Studio software for data acquisition, DAQ Station module of fNIRSoft for real-time low level processing of fNIR data, and a software application for real-time classification of mental workload level of the participant. A script executed by the DAQ station converts raw signals into HbO and HbR measures by using the Modified Beer Lambert Law by considering the first 10 s as a baseline. The script also computes the mean, standard deviation, slope, minimum, maximum and range values for HbO and HbR signals, Linear Discriminant Model for classification. Data from one pilot for training and data from the rest 7 pilots for testing. Labelling: A training dataset was prepared by performing a qualitative analysis of the video files to judge the level of mental workload experienced by the subject during each of the three scenarios. Pilots’ self-assessments of their mental workload which is collected after the experiment and the differences between the scenarios in terms of the presence of unexpected events such as failures are used as additional cues while manually marking the episodes for low, moderate and high mental workload. Pilots performed 4 flight scenarios during the experiment. The first scenario involved a free play task that took about an hour including sensor installation and demonstration of the flight simulator. After a rest period, the second scenario was run, which started in cruise mode and ended with normal workload landing. After the second scenario there was a lunch break. The third scenario also included cruise mode flight followed by a landing which was diverted to a different airport by the ATC, with the aim to increase the mental workload level. The final scenario simulated a high workload landing by having the ATC to initiate a sudden go-around due to late aircraft incursion on runway. During the climb an instrument failure (e.g., flap or engine failure) was initiated in order to further increase the mental workload level. The initial classifier was trained over a single pilot who ran through all three flight-scenarios with an accuracy of 92 %. This model was then used to predict the mental workload levels of the remaining 7 pilots in real-time while
ADAS&ME (688900) D1.1 – SoA and Benchmarking
March, 2017 Page 229 of 238 CERTH/HIT
they were running the scenarios. A qualitative analysis of 69 events sampled from these simulated flights showed that the model trained over a single pilot could predict the expected workload level in 68 % of the cases. Advantages: n alternative method for brain activity monitoring. (Functional near-infrared spectroscopy (fNIR) is a neuroimaging modality that enables continuous, non-invasive, and portable monitoring of changes in blood oxygenation and blood volume related to human brain function). Disadvantages: The placement of the sensor does not seem user friendly. Outcomes: An LDA based classification system for mental workload was developed based on features extracted from fNIR data. The results seem to be affected by the presence of noise during the recording. Comparison to ADAS&ME: The proposed sensoring method with the current technology can only be used (for practical applications) by riders. Anund, A., Fors, C., Kecklund, G., Leeuwen, W. V., & Åkerstedt, T. (2015). Countermeasures for fatigue in transportation: a review of existing methods for drivers on road, rail, sea and in aviation. Statens väg-och transportforskningsinstitut. The overall aim with this study was to gather knowledge about countermeasures for driver fatigue (including sleepiness) in road, rail, sea and air transportation. The knowledge has been used as an input for evaluating advantages and disadvantages with different countermeasures and to estimate their potential to be used regardless mode of transportation. The method used was a literature review and a workshop with experts from all transportation modes. At the workshop the effectiveness of countermeasures for a single mode, but also regardless mode were discussed and a ranking was done. The report discuss the potential of fighting fatigue among drivers for specific mode of transport but also from a more generic point of view, considering scheduling, model prediction of fatigue risk, legislation, a just culture, technical solutions, infrastructure, education, self-administered alertness interventions and fatigue risk management (FRM). The overall judgement was that a just culture, education, possibility to nap and schedules taking the humans limitations into consideration as the most effective countermeasures to fight fatigue, regardless mode of transportation. Advantages: The report contains all fatigue related countermeasures up to 2014 Disadvantages: - Outcomes: Technical solutions are available only in exceptional cases in especially transport modes aviation and sea. The available solutions are rather old, don’t use state-of-the-art technology and less innovative compared to what has been developed for car and truck industry. There is reason to believe that rail is the transport mode were you most easily can use less innovative solutions like “dead man’s switch” and activation monitoring. Comparison to ADAS&ME: The report contains a thorough investigation of available countermeasures of fatigue. Some of them could be part of ADAS&ME. The leading partner is also involved in ADAS&ME. Lehrer, P., Karavidas, M., Lu, S.E., Vaschillo, E., Vaschillo, B. and Cheng, A., 2010. Cardiac data increase association between self-report and both expert ratings of task load and task performance in flight simulator tasks: An exploratory study. International Journal of Psychophysiology, 76(2), pp.80-87. The aim of this study was to evaluate whether cardiac data add sensitivity for assessing flight task mental workload and pilot performance under simulated flight conditions, over that provided by a simpler, inexpensive, and well-validated self-report measure. After physiological monitoring equipment was attached, the following tasks were administered, in a single session, each task lasting for approximately 5min. First assessed baseline physiology and reactivity using a standardized “plain vanilla” baseline. The WinCPRS software program (Absolute Aliens Oy, Turku, Finland) was used for analysis. A number of HRV parameters were calculated. Motion was detected from a crystal accelerometer embedded in the LifeShirt at the anterior surface of the abdomen, Models: random

ADAS&ME (688900) D1.1 – SoA and Benchmarking
March, 2017 Page 230 of 238 CERTH/HIT
effects logistic regression models, mixed model analysis. Eighteen standard flight tasks were then presented. The tasks were grouped in three flight phases, presented in the following order: Takeoff, in-flight (climb, cruise, descent), and approach/landing. Testing involved a total activity time of 90 to 110 min in a two hour period, allowing approximately 10 to 15 min for debriefing and resetting the flight simulator for the next task. Task load (high [H], moderate [M], low [L]) was determined by a senior flight simulator operator. the area under the receiver operating characteristic (To determine whether there were fewer false positive and negative detections of high task load with cardiac measures added to the TLX vs. with the TLX alone) and Akaike's Information Criterion (AIC) (Akaike, 1974) to evaluate the improvement of model fit (prediction) of evaluator scores by the cardiac measures over TLX alone. Advantages: Evaluate the sensitivity of cardiac data to workload using TLX alone and with cardiac measures. Heart rate is particularly useful for operational assessments because it is inexpensive and simple to acquire and analyse. Disadvantages: Because of the small number of participants, some of our statistical findings may have resulted from response peculiarities of particular participants. Outcomes: Technical solutions are available only in exceptional cases in especially transport modes aviation and sea. The available solutions are rather old, don’t use state-of-the-art technology and less innovative compared to what has been developed for car and truck industry. There is reason to believe that rail is the transport mode were you most easily can use less innovative solutions like “dead man’s switch” and activation monitoring. Comparison to ADAS&ME: EKG indicators can be part of the ADAS&ME system. Luig, J., & Sontacchi, A. (2014). A speech database for stress monitoring in the cockpit. Proceedings of the Institution of Mechanical Engineers, Part G: Journal of Aerospace Engineering, 228(2), 284-296. keywords: pilot stress monitoring flight This article presents a new database of speech produced under cognitive load for the purpose of non-invasive psychological stress monitoring. The recording session consisted of four different challenging scenarios (F1–F4) plus one ‘reference flight’ (F0) at the very beginning. The four scenarios are: [A] cockpit preparation, [B] take-off and initial climb, [C] en route flight, [D] approach and landing. A strain trajectory, graded by experience, had been sketched by the instructors for each of the four demanding scenarios. Measures of interest: perceived, substantial imbalance between demand and response capability, under conditions where failure to meet the demand has important and the perceived consequences. The Fokker F70/100 series full flight simulator at Aviation Academy Austria (AAA, Neusiedl/See, Austria (www.aviationacademy.at) glass cockpit simulator was used. A patch written in the graphical programming language PureData (pd) was used to record all relevant channels to the hard disk and to create speech activity information data at the same time - standard headset microphones - beat-to-beat heart rate signal was recorded with a high-precision (8 kHz sampling rate, 16-bit resolution.) mobile measurement device, the ChronoCord. The ChronoCord offers the opportunity to set marker flags at the push of a button, so that heart rate and speech data could easily be synchronized by setting an ‘acoustical marker’ while pushing the button at the same time. HRV parameters were calculated as potential stress indicators. Speech parameters with prosodic relevance were extracted. The discriminative power of the HRV parameters is investigated through paired one-way ANOVA comparisons. Results are reported using colour matrix coding (significance matrix). Advantages: Recording and analysing speech is the least intrusive way of stress monitoring with promising result. Disadvantages: Paired one-way ANOVA comparisons of HRV parameters before, during, and after each single event evidence statistically significant differences in HRV parameters for nearly half of the events (7/15). This is not satisfactory. Outcomes: there is no ‘universal descriptor’ for changes in stress level, but different events lead to changes in different parameters. Comparison to ADAS&ME: Speech is one of the targeted measurements of ADAS&ME. The database is available on request (Access is subject to approval and limited to academic institutions

ADAS&ME (688900) D1.1 – SoA and Benchmarking
March, 2017 Page 231 of 238 CERTH/HIT
only.) for non-commercial research purposes. Gentili, R. J., Rietschel, J. C., Jaquess, K. J., Lo, L. C., Prevost, C. M., Miller, M. W., & Hatfield, B. D. (2014, August). Brain biomarkers based assessment of cognitive workload in pilots under various task demands. In Engineering in Medicine and Biology Society (EMBC), 2014 36th Annual International Conference of the IEEE (pp. 5860-5863). IEEE. This study is an initial step in identifying and selecting multiple biomarkers to form a composite metric sensitive to the dynamic construct of cognitive workload and attentional reserve. Each scenario was composed of a 1-minute familiarization period followed by a 10-minute flight challenge during which performance (i.e., airspeed, altitude, heading, and vertical speed) was recorded. The three progressively challenging scenarios (S1, S2, and S3) were defined as follows: i) S1 (low demand). A flight simulator (Prepar3D® v1.4, T-6A Texan II SP2 USN aircraft, Lockheed Martin Corporation™) – Four dry-sensor EEG (g-Tech™, Schiedlberg, - ECG sensor) was used. The EEG: To estimate cognitive workload, spectral analysis was used using a Fast Fourier transform (1-Hz resolution). The spectral power was then computed for each scenario. The frequency bins were log-transformed and summed to obtain spectral power for the Theta (3-8 Hz) / Alpha (8-13 Hz) ratio. ECG: The square root of the mean squared successive differences (RMSSD) was calculated. A one-way ANOVA tests were used for assessing differences for different scenarios, measures etc. Thirty-eight healthy young participants (ages ranged from 19 to 23 years). Although differences in the RMSSD were not significant when comparing the three scenarios (p>0.05), it was found to be significantly lower for the individuals who perceived the task as demanding a high degree of concentration (p<0.05), which indicates a reduction of vagal influence on the heart under elevated load. EEG spectral analysis revealed that the theta/alpha ratio increased as the challenge increased; significant differences were found between all levels of challenge (S1 vs.S2: p<0.05; S2 vs. S3: p<0.01; S1 vs. S3: p<0.001) Advantages: A dry EEG system composed of only few sensors does not require using conductive gel and the very limited number of sensors can reduce the preparatory and computational burden, which is promising for operational settings. Disadvantages: simulation only. Outcomes: This study confirms and extends previous research by identifying multiple biomarkers to assess cognitive workload and attentional reserve during progressive simulated piloting task demands. EEG power and HRV were used to assess cognitive workload while the ERPs assessed attentional reserve. Cognitive workload and attentional reserve were negatively related. Comparison to ADAS&ME: The extracted biomarkers could be used as part of the ADAS&ME system. Oh, H., Hatfield, B. D., Jaquess, K. J., Lo, L. C., Tan, Y. Y., Prevost, M. C., & Blanco, J. A. (2015, August). A Composite Cognitive Workload Assessment System in Pilots Under Various Task Demands Using Ensemble Learning. In International Conference on Augmented Cognition (pp. 91-100). Springer International Publishing. Thus, this study aims to devise an ensemble model that is able to select optimal features from multiple metrics for a more accurate classification according to three levels of task demand to determine an operator’s current cognitive workload in ecologically valid tasks. Tuning: the optimal model was selected by taking the minimum balance (BAL) error (εBAL) to balance large biases due to a small sample size, which is a convex combination of resubstitution (RESB) and cross-validation (CV) errors. - Performance assessment: Lastly, the classifiers were assessed using the confusion matrix and the Receiver-Operating Characteristic (ROC) curve, and the rank of attributes was assessed through the ReliefF algorithm. Three systems were employed: (1) electrocortical and physiological data acquisition system, (2) a flight simulator cockpit and the Flight Data Recorder (FDR) known as one part of the black box, and (3) auditory stimuli with synchronous trigger delivery system-Four active gel-free EEG electrodes (g.SAHARA electrodes®) - Presentation®(v18.1, Neurobehavioral Systems) delivered auditory probes to the subjects through earphones - ECG sensor. EEG. Thirty-nine healthy volunteers (35 men and 4 women) between the ages of 19 and 24 years. The re-referenced EEG were processed using an IIR filter with a 20-Hz low-

ADAS&ME (688900) D1.1 – SoA and Benchmarking
March, 2017 Page 232 of 238 CERTH/HIT
pass cut-off frequency and 48-dB/octave roll-off. Next, each baseline of 1-s epochs that were time-locked to the auditory stimuli was corrected using the pre-stimulus interval (−100 to 0 ms). Those epochs retaining significant artefacts (e.g., eye-blink, etc.) were excluded. The remaining epochs were averaged per sensor for each scenario. The average ERP amplitudes were derived for the novelty P3 (P3a; 270 to 370 ms). ECG. HRV was measured through the following methods along with average heart rate, which are appropriate for short 5 min samples from the middle section of the whole 10 min experiment: (1) SDNN, (2) RMSSD, (3) the low (LF; 0.04 to 0.15 Hz) and high frequency (HF; 0.15 to 0.4 Hz) ratio (LF/HF) of R-R intervals using a Welch’s method. Five individual classifiers were examined: classification trees (CTREE), k-nearest neighbours (kNN), quadratic discriminant analysis (QDA), naïve Bayes (NB), and error-correcting output codes using support vector machine (ECOC-SVM). For an ensemble of classifiers, bagging, boosting, stacking, and voting algorithms were scrutinized. Specifically, bagging derived the final prediction through a simple majority rule from multiple CTREEs Boosting combined weak CTREEs using a weighted majority rule, where each classifier was sequentially built as a better model than previous classifiers by considering misclassified observations. Unlike bagging and boosting, stacking employed a higher level model (CTREE) to combine five base learners (i.e., individual classifiers) rather than using one algebraic rule, and voting averaged the predictions of the five base learners. Advantages: Ensemble learning is a very powerful classification scheme. Disadvantages: The use of such methods makes the results hard to interpret. Outcomes: Boosting, stacking, and voting showed very reliable performance as expected. In particular, stacking and voting could be easily extensible through a hierarchical structure particularly when any new feature set is included in the future to produce more reliable results. Comparison to ADAS&ME: Ensemble learning is a valid candidate for state classification. Binias, B., Myszor, D., Niezabitowski, M., & Cyran, K. A. (2016, May). Evaluation of alertness and mental fatigue among participants of simulated flight sessions. In Carpathian Control Conference (ICCC), 2016 17th International (pp. 76-81). IEEE. During the experiment measurements, each subject was asked to repeat a basic manoeuvre on a simulator for 15 to 20 times. There were no significant breaks between consequent sessions. These were intermittent only by the procedure of restarting the position of simulated plane on the airstrip. Each session consisted of 6 basic events: take-off, for right turns and landing. Each event was signalized to the participant by an auditory cue (sound of a gong). The total duration of one session was approximately 7 minutes. In total each of the performed measurements took about 3 hours. Flight Navigation and Procedures Trainer Level II simulators: • Elite S812 FNPT II in Cessna 172RG variant, • Elite S923 FNPT II MCC in Piper Seneca III variant - The EEG data used in this research was recorded using the Emotiv EPOC+ Headset -electrodes AF3 and AF4 were used for EOG. Band-pass filtering was applied to the recorded signals. Thresholding was used to remove artifacts. A variant of the Common Average Reference (CAR) method is used for spatial filtering. Normalized Beta and Theta power are used as indicator of mental condition. 5 people, with no or little previous experience with flight simulators participated in the study. No statistically valid results were derived "“Due to insufficient number of participants, achieved results should be treated more as evaluation of the proposed signal processing and data analysis methods, rather than proof of experimental hypothesis”". Advantages: Cheap and easy to use equipment. Disadvantages: no statistically valid results. Only simulations were involved. Outcomes: Proposed approach proved to be highly effective when dealing with contaminated and noisy data. Due to insufficient number of participants no general hypothesis can be drawn from performed analysis. Comparison to ADAS&ME: The utilization of the power of frequency bands as fatigue indicators will be part of the ADAS&ME approach. Roveda, J.M., Fink, W., Chen, K. and Wu, W.T., 2016, March. Psychological health monitoring for

ADAS&ME (688900) D1.1 – SoA and Benchmarking
March, 2017 Page 233 of 238 CERTH/HIT
pilots and astronauts by tracking sleep-stress-emotion changes. In Aerospace Conference, 2016 IEEE (pp. 1-9). IEEE. This paper employs sensors and real time sensory data processing to quantify and interpret sleep quality and stress levels. The prognostics sensors include the Phillips Actiwatch for sleep monitoring and electrocardiogram (ECG) sensor for heart rate and heart rate variability (HRV) to monitor emotion changes. Data were collected before, during, and after sleep for the single case study. No other information is provided. Phillips Actiwatch for sleep monitoring and electrocardiogram (ECG) sensor for heart rate and heart rate variability (HRV) to monitor emotion changes. BioPatch incorporates ECG sensor, accelerometer, and temperature sensor, respiration rate detector onto one single chip. A Samsung smartphone accepts measurements from wearable sensors through Bluetooth communications. The Android Operating system is used to create Application Program Interface (API) between the wearable sensor node and the smartphone. On the cloud, various data analysis and data mining approaches are exploited to provide reliable stress level estimation. Advantages: An integrated monitoring system was presented. Disadvantages: The assessment was not performed during driving but for a whole day using only one subject. Outcomes: A combination of several data categories (i.e., HR, RR, R-R intervals, and HRV) may provide an indicator for the quality of sleep and thus may be a way to track sleep-stress-emotion changes in pilots and astronauts in particular, and the public in general. Comparison to ADAS&ME: The platform described incorporates many of the sensors that are to be tested for ADAS&ME. Borghini, G., Aricò, P., Di Flumeri, G., Salinari, S., Colosimo, A., Bonelli, S., & Babiloni, F. (2015, August). Avionic technology testing by using a cognitive neurometric index: A study with professional helicopter pilots. In Engineering in Medicine and Biology Society (EMBC), 2015 37th Annual International Conference of the IEEE (pp. 6182-6185). IEEE. This study investigates the possibility to evaluate the impact of different avionic technologies on the mental workload of helicopter’s pilots by measuring their brain activity with the EEG during a series of simulated missions. EEG is used as gold standard for assessing mental workload. Helicopter simulator (AW189 helicopter’s cockpit). Electroencephalogram (EEG) has been recorded by the digital monitoring BEmicro system (EBNeuro, Italy). Each pilot wore the EEG-cap under the headset and the eight EEG channels (F3, Fz, F4, AF3, AF4, P3, Pz, and P4) have been collected simultaneously with a sampling frequency of 256 (Hz). The study was conducted with a helicopter simulator (AW189 helicopter’s cockpit). Electroencephalogram (EEG) has been recorded by the digital monitoring BEmicro system (EBNeuro, Italy). Each pilot wore the EEG-cap under the headset and the eight EEG channels (F3, Fz, F4, AF3, AF4, P3, Pz, and P4) have been collected simultaneously with a sampling frequency of 256 (Hz). The EEG signal of each experimental condition has been digitally band-pass filtered by a 4th order Butterworth filter (low-pass filter cut-off frequency: 30 (Hz), high-pass filter cut-off frequency: 1 (Hz)) and then artefacts have been removed by using the Gratton method and other specific procedures of the EEGLAB toolbox based on threshold methods. At this point, the EEG has been segmented in epochs of 4 (sec), shifted of 0.5 (sec) and then the EEG PSD has been estimated by using the Fast Fourier Transform (FFT) in the EEG frequency bands defined, for each pilot, by using the Individual Alpha Frequency (IAF) value. The MWL is then calculated. Simple statistical test (t-test) is used for comparing MWL (normalized by the Coefficient of Determination) considering all the different visual conditions. Twenty-seven flight scenarios have been defined as combination of visibility, display and symbology and they have been proposed randomly to the pilots in order to avoid habituation and expectation effects. The hypothesis was that the integration of FG or RO could reduce significantly the mental workload in different operational and visibility conditions when compared to the use of only the FC. The results showed that the use of the HUD significantly decreased (p<10^-5) the workload level for the accomplishment of the scenarios with respect to the HMD. The execution of same flight conditions have been significantly easier than those with the only FC, both with the HMD (p<10-5) and the HUD (p<.05). In fact, in the condition with only FC, the MWL was statistically higher (p<.05) than with the FC+FG.

ADAS&ME (688900) D1.1 – SoA and Benchmarking
March, 2017 Page 234 of 238 CERTH/HIT
Advantages: - Disadvantages: The results are based on simulation trials. Outcomes: The present study suggested as cognitive neurometrics could provide more objective and quantitative information with respect to the subjective methodologies, in order to test and compare different avionic technologies in terms of requested mental workload. Comparison to ADAS&ME: The use of EEG measures to quantify mental workload which is related to fatigue/stress can be used for monitoring driver's state. The results could also be exploited during the HMI design. Barnett, M., Pekcan, C., & Gatfield, D. (2012, April). The use of linked simulators in project “HORIZON”: Research into seafarer fatigue. MARSIM. Project “HORIZON” (http://www.warsashacademy.co.uk/about/resources/final-horizon-report-final-as-printed.pdf?t=1477776993979) was a Framework 7 European funded research study to investigate the effects of fatigue on the cognitive performance of ships’ watch keeping officers, using a range of linked simulators and under different watch patterns and conditions of workload. The simulator-based experiments were focussed on two different watch patterns – the conventional 4 hours on, and 8 hours off regime, and the more arduous 6 on and 6 off watch pattern. This paper describes the scenario used in the Warsash experiment, the participants in the study, the measurements used, and some initial findings. EEG and Bridge Simulator, produced by Kongsberg, were used. EEG recordings (from 20 participants) measure the electrical activity of the brain, through several electrodes that are attached on the head. The participants were fitted with these on two occasions during the week by specialists. This occurred on the second and sixth days, and the participants wore them for a complete 24 hour period, thus wearing them for two watches and for two rest periods. Advantages: - Disadvantages: - Outcomes: Sleepiness and neurobehavioral performance, as measured by the EEG electrodes, are particularly affected towards the end of the 0000-0600 watch. Sleepiness and fatigue are enhanced and brain performance reduced. In addition, there is a gradual increase of fatigue during the work periods as the week progresses. Comparison to ADAS&ME: It does not clearly describe how the EEG recordings were utilized. Varoneckas, G., Martinkenas, A., Andruskiene, J., Stankus, A., Mazrimaite, L., & Livens, A. (2015). Web-based Databank for Assessment of Seafarers’ Functional Status During Sea Missions. Safety of Marine Transport: Marine Navigation and Safety of Sea Transportation, 49. This paper concentrates on the development of data bank for seafarers’ functional status assessment. The Web system is based on client-server architecture and the international open source technologies including Apache web server, PHP scripts and MySQL database. Database was created using MySQL, Apache, PHP, Java scripts. Holter Monitoring. Different statistical, spectral and non-linear dynamic parameters of RR interval time series are stored in the databank. Advantages: The main operational advantage of the developed system is the access to the data bank for several users at the same time. Disadvantages: The automatic monitoring part off the HR is not clearly described. Outcomes: According to the authors "The study results demonstrated that sea farer’s functional status mostly depends on the physical and mental fatigue during operational activity. The functional status is also influenced by gender, age, physical fitness, pain, boredom and emotions." Comparison to ADAS&ME: ADA&ME will also have a data repository where, however, the most crucial information will come from sensors instead of questionnaires. Arima, M., & Kii, S. (2013, June). Development of an Autonomous Human Monitoring System for Preventative Safety in Sea Transportation. In ASME 2013 32nd International Conference on Ocean, Offshore and Arctic Engineering (pp. V02AT02A040-V02AT02A040). American Society of Mechanical Engineers. This paper deals with autonomous facial expression monitoring system and ECG analysis using a mini physiological measuring system. Microsoft’s ‘KINECT for Windows’ sensor and multiple network

ADAS&ME (688900) D1.1 – SoA and Benchmarking
March, 2017 Page 235 of 238 CERTH/HIT
cameras (Canon’s VB-M40). The KINECT sensor has a colour sensor, an infrared (IR) emitter and an IR depth sensor for detecting human body and estimating his/her three-dimensional position in real time. A mini Electro Mechanical Systems (mEMS) apparatus was newly developed by ERATO Maenaka Human-Sensing Fusion Project.Contours of both eyes and mouth can be quantified by using the Fourier Descriptors. The relationship between six fundamental emotions and facial expression was modelled using the neural network technique. Indices for representing the sympathetic and parasympathetic nervous system were derived using the PSD of the R-R time series data. Primarily qualitative assessments of the system based on one field trip were collected. Face of navigation officer (only one participant) was followed by the KII system during operation near Shodo-shima Island in Seto Inland Sea, Japan. The officer was walking around in the navigation bridge for ensuring the safety of a ship. Only qualitative analysis is presented. Advantages: The proposed face monitoring system can track the user while he is moving around. Disadvantages: There is no quantitative measurement of the performance of the system. Outcomes: The index of the sympathetic nervous system (SNS) can be a useful index to detect subject’s psychological condition. The facial monitoring system can detect and follow subject’s face even though he/she walks around in a navigation bridge. Comparison to ADAS&ME: The sympathetic and parasympathetic indices can be part of the indicators used by ADAS&ME. Multiple cameras could also be part of the monitoring system. The proposed method however has not been properly validated. Macii, D., Dalpez, S., Passerone, R., Corrà, M., Avancini, M., & Benciolini, L. (2015). A safety instrumented system for rolling stocks: Methodology, design process and safety analysis. Measurement, 67, 164-176. In this paper, the design process of a novel dead-man’s vigilance devices (DMVDs), is described with a special emphasis on safety issues. Vigilance detection relies on the measurement of the time intervals between two consecutive switches of one of the signals coming from one of the input electromechanical devices used by the operator to move the rolling stock. Emergency brake was investigated. Advantages: easy to implement. Disadvantages: The vigilance detector is not measuring any physiological measures. Outcomes: The full design process of a novel dead-man’s vigilance device (DMVD) was presented. Comparison to ADAS&ME: The vigilance detector is well suited for trains but might not be adequate for drivers/riders since the rules that trick the detector might not be realistic outside the locomotive setting. On the other hand the methodological approach might be of interest if an FPGA implementation it pursuit. Dorrian, J., Lamond, N., Kozuchowski, K. and Dawson, D., 2008. The driver vigilance telemetric control system (DVTCS): Investigating sensitivity to experimentally induced sleep loss and fatigue. Behavior research methods, 40(4), pp.1016-1025. The aim of this study was to investigate whether a new device, designed to detect lowered states of arousal using electrodermal activity (EDA), would be sensitive to experimentally induced sleepiness and fatigue. The device consists of a wrist and a ring component (worn by the individual) that send signals to a box with a luminescent-rule-style vigilance indicator. For validation a standard montage of electrodes was applied to each participant’s face and scalp, to allow continuous monitoring of brain activity (EEG) and eye movements (EOG). The York driving simulation program (DriveSim 3.00, York Computer Technologies, Kingston, ON) was used. The indicator counts down as lowered states of arousal are detected. When vigilance, as indicated by ring or wrist EDA, reaches sufficiently low levels, an alarm sounds, and the driver is required to press a response button. This was a repeated measures study, in which 15 participants underwent a period of 28 h of sustained wakefulness (independent variable). Dependent variables, recorded every 2 h, included psychomotor vigilance response times, subjective fatigue, driving simulator performance, and DVTCS output. Within-participants comparisons were used to investigate the impact of hours they were awake

ADAS&ME (688900) D1.1 – SoA and Benchmarking
March, 2017 Page 236 of 238 CERTH/HIT
(experimentally induced fatigue). Repeated measures ANOVA with one within-subjects factor (hours of wakefulness) (GLM procedure, SPSS 13 for Mac OSX). The Greenhouse–Geisser procedure was applied to correct for sphericity. Fifteen individuals (6 of them female, 9 male) participated in the study. Average vigilance, as indicated by the DVTCS device, did not significantly change across the testing period. The number of seconds that it indicated zero vigilance varied significantly (p <.05), with 2100 and 2300 h significantly ( p <.05) higher than 0900 h on Day 1 (Table 1). However, in real terms, this change represented an average of between 4 and 5 sec out of a test total of 600 sec 2)DVTCS indicators did not significantly ( p <.05) vary during the driving simulator task. Advantages: comfortable sensor. Disadvantages: The results suggest that the vigilance indicator part of the DVTCS device is not sensitive to the fatigue levels produced in the present study. Outcomes: The results indicated that the EDA indicator was not sensitive to increased sleepiness and fatigue at the levels produced in the present study. Comparison to ADAS&ME: Even though this system is meant to be used in trains, the experiments were conducted using a car-driving simulator. Therefore the results can be exploited by ADAS&ME. Lal, S., Lal, S. J., Fisher, P., Penzel, T., & Agbinya, J. (2011, November). Brief overview of technology and applications in railway operator safety. In Broadband and Biomedical Communications (IB2Com), 2011 6th International Conference on (pp. 252-258). IEEE. This paper provides a brief review of the know how in the area of safety in the railway environment back in 2011. This is a review paper. No specific equipment is described in particular. An overview of different approaches and factors that are related to fatigue is presented. More space is devoted the "standard" frequency related indicators and the past work of the authors. Advantages: - Disadvantages: - Outcomes: an overview of technologies that can affect driver's status was presented. Comparison to ADAS&ME: This paper is a bit old. However the main findings suggestions are in agreement with the ADAS@ME approach "There is an ongoing need to advance existing know-how and technology to further improve the safety in the railway transportation sector". Sinha, U., Mehta, K. K., & Shrivastava, A. K. (2016) Real Time Implementation for Monitoring Drowsiness Condition of a Train Driver using Brain Wave Sensor. A system for processing brain activity in order to be used for drowsiness is described. The development is still in its infancy. A single channel, wireless headset that monitors the brain activity was used. No results were presented regarding the effectiveness of the system. Advantages: Single channel wireless EEG. Disadvantages: Battery needs recharging every 7-8 hours. Outcomes: A prototype in its very early stage was presented. Comparison to ADAS&ME: No verified results presented for the effectiveness of the methods. Rahman, A., Izzah, N., Dawal, S. Z. M., & Bahreininejad, A. (2013). The Effects of Driving Environment on the Mental Workload of Train Drivers. In Advanced Engineering Forum (Vol. 10, pp. 93-99). Trans Tech Publications. In this study, the mental activity of human operators is investigated via experiment, whereby each participant is required to drive under three environmental conditions (i.e., clear sunny day, rainy day and rainy night). The brain activity of each participant was recorded using EEG BIOPAC MP150 System equipped with AcqKnowledge 4.0 software as well as Electrode Cap (CAP100C). The electrooculogram (EOG) was used to detect the presence of eye blinks in the EEG data. A computer-based train driving simulator (Mitsubishi Electric Advance, Japan) provided by Keretapi Tanah Melayu Berhad (KTMB). Fast Fourier Transform (FFT) analysis was performed to extract and estimate the mean alpha power. The Friedman Test was used to analyse the significant difference between the mean alpha power data for the three train driving sessions. Fifteen train drivers (male) were recruited to participate in the experiment, aged between 24 to 48 years old (40 ± 6.9 years) and working experience of 14 ± 6.1 years. Three sessions were conducted to simulate three driving

ADAS&ME (688900) D1.1 – SoA and Benchmarking
March, 2017 Page 237 of 238 CERTH/HIT
conditions, one session for clear sunny day, rainy day and rainy night, respectively. The participants were requested to complete 60 minutes of monotonous train driving session, in which each session has a total duration of 20 minutes. The measurement procedure was repeated for each session, and the participants were given a 5-minutes break after each session. The participants were required to complete all three driving sessions and they were given a few minutes to familiarize themselves with the controls and the experimental setup in order to perform the train driving task. The difference in mean alpha power values at the FZ and PZ locations is found to be statistically significant for the three driving conditions, P = 0.042. Advantages: Easy to compute indicators. Disadvantages: Well-known indicator. No new knowledge provided. Outcomes: The results reveal that the mean alpha power values are higher during rainy night condition, which indicate that the train drivers experience reduced levels of vigilance. The EEG measurements taken at the PZ locations (i.e., points that contribute to the primary visual perception of humans) show a decrease in mental workload towards the end of the driving period for rainy night condition, which clearly indicates an increased level of sleepiness. Comparison to ADAS&ME: standard frequent band indicator. Can be used at ADAS&ME. Jap, B. T., Lal, S., Fischer, P., & Bekiaris, E. (2007, August). Using spectral analysis to extract frequency components from electroencephalography: Application for fatigue countermeasure in train drivers. In Wireless Broadband and Ultra Wideband Communications, 2007. AusWireless 2007. The 2nd International Conference on (pp. 13-13). IEEE. Investigation of spectral measures that can act as fatigue indicators evaluated using simulation driving sessions. Thirty two channel of EEG, using NeuroScan system (Compumedics, Australia) and a driving simulator were used. 52 non-professional drivers participated in the study. Thirty-two channel of EEG, using NeuroScan system (Compumedics, Australia), was collected simultaneously during a 5-minute active driving session followed by 1-hour of monotonous and continuous driving. Blood pressure and heart rate were collected before and after the driving task. Significant differences were found at temporal sites only for alpha (F = 2.0, p = 0.030), and beta (F = 2.3, p = 0.011). - Delta showed significant differences for the frontal site (F = 3.5, p < 0.001), theta showed significant differences for central (F = 2.3, p = 0.013), frontal (F = 2.3, p = 0.013), and parietal (F = 3.6, p < 0.001). Beta activity revealed significant difference between alert baseline and time section 10 (p = 0.031). Post-hoc Bonferroni analysis for delta activity at frontal site revealed significant differences in activities between alert baseline and time sections 1 (p < 0.001), and 2 (p= 0.024), and between time sections 1-4 (p = 0.017), 1-5 (p = 0.021), 1-8 (p = 0.008), 1-9 (p = 0.036), and 1-10 (p = 0.032). - Post-hoc Bonferroni analysis for theta activity for central (p = 0.006), and frontal (p = 0.006) sites revealed significant differences between alert baseline and time section 2, -whereas result for parietal site revealed significant differences between alert baseline and time section 2 (p < 0.001), and between time sections 2-4 (p = 0.028), 2-5 (p = 0.015), 2-6 (p = 0.037), 2-7 (p = 0.048), 2-8 (p = 0.035), 2-9 (p =0.023), and 2-10 (p = 0.021). Advantages: Indicators are simple to compute. Disadvantages: too many electrodes involved. The study was performed using a simulator. Outcomes: The result of the current study showed a significant change in the brain activity during a fatigue instigating driving session, and several sites that showed significant changes during fatigue could potentially be used to detect fatigue. Comparison to ADAS&ME: Frequency band indicators as well as the identified sites demonstrating the higher sensitivity to fatigue manifestation could be use in ADAS&ME. Ridwan, S. D., Thompson, R., Jap, B. T., Lal, S., & Fischer, P. (2008, November). Single channel wireless EEG: Proposed application in train drivers. In Broadband Communications, Information Technology & Biomedical Applications, 2008 Third International Conference on (pp. 58-63). IEEE. A prototype or a single channel wireless EEG section was presented. The design was still in experimental phase. The whole system presented is a wireless single channel EEG sensor (LabVIEW programming language (National Instrument, version 8.2)). 1 subject was used to test the functionality
ADAS&ME (688900) D1.1 – SoA and Benchmarking
March, 2017 Page 238 of 238 CERTH/HIT
of the sensor. ECG and EEG signals were recorded once by a single subject. Advantages: Wireless technology. Disadvantages: The prototype is obsolete. Outcomes: A prototype was delivered which "has to be miniaturized in the future work in order to fit into a headband or a cap". Comparison to ADAS&ME: Wireless sensors will be part of the ADAS&ME. The presented technology is outdated. Off the shelf solutions exist. Jap, B. T., Lal, S., & Fischer, P. (2011). Comparing combinations of EEG activity in train drivers during monotonous driving. Expert Systems with Applications, 38(1), 996-1003. Investigation of several frequency related measures that could act as fatigue indicators evaluated using simulation driving sessions. A computer-based train driver simulator, Trainz Classics Railroad Simulator 1st and 2nd edition (Auran Holdings Pty Ltd., Australia), was used. Simultaneous physiological recording was obtained during the monotonous train-driving session using FlexComp physiological system (ThoughtTechnology Ltd., USA). Two channels of EEG (from frontal and temporal sites) and one channel of electrooculogram (EOG) were acquired with a sample rate of 2048 samples per second. A bipolar montage was used when recording the EEG channels. A bipolar montage recorded the difference between two active EEG electrodes (Stern & Engel, 2005). The international 10–20 system for EEG electrode placement was used when attaching the active electrodes (Jasper, 1958). The two active electrodes for the frontal site were attached at the Frontal-Polar 1 (FP1) and FP2 sites, and to the temporal, T3 and T4 sites. The reference electrodes were attached to the ear lobes to reduce the common-mode noise present at the active electrodes (Winter & Webster, 1983). The EOG was used to identify blinks artefacts. Blood pressure and heart rate was recorded before and after the driving task. Analysis performed using in-house software, developed with LabVIEW programming language (National Instrument, version 8.2). A total of 50 male train drivers, aged 21–65 years. All participants were asked to complete 30–40 min of a monotonous driving session. The participants were allowed approximately 5 min of practice driving session to be familiarised them with the controls used to drive the train. After the practice driving session, the monotonous driving session commenced. Participants were instructed to drive the train as normal, and to pick up passengers at all stations. Statistical analysis was performed for consecutive time segments (ANOVA and Post-hoc Fisher LSD analysis was applied following ANOVA to identify where exactly the differences existed. Due to the extent of the results section only the major finding is reported here: Significant differences was also found for equation (theta + alpha)/beta between S2 and S3 (p = 0.01), S4 (p = 0.004), S5 (p = 0.01), and S8 (p = 0.01), and between S4 and S6 (p = 0.03), and between S5 and S6 (p = 0.048).Where Si, i=1,2,…,10 are consecutive non-overlapping sections. Advantages: The results seem to be in agreement with the literature. The measures/indicators presented can be easily estimated. Very few electrodes required. Disadvantages: The fatigue state is subjectively assigned. Outcomes: Simultaneous decreases in beta and increases in theta activity have been shown as the train drivers entered the repetitive phase of transition from the alert state to a fatigued state. A greater amplitude of difference between the alert and fatigued state was found when using the computation based on (theta+alpha)/beta. The results of the current study indicate that the outcome of using the equation (theta+alpha)/beta, combined with detecting decreases in beta and increases in theta activity, can be utilised as an indicator of fatigue and for implementation of EEG based countermeasures. Comparison to ADAS&ME: The proposed indicators could be part of ADAS&ME "indicator's bank".