cyclic creep and fatigue of td-nicr (thoria-dispersion ... · (thoria-dispersion-strengthened...
TRANSCRIPT
CYCLIC CREEP A N D FATIGUE OF TD-NiCr (THORIA-DISPERSION-STRENGTHENED NICKEL-CHROMIUM), TD-Ni, AND NiCr SHEET AT 1200 C
by Marvin H. Hirschberg, David A. Spera, and Stanley J. Klima
Lewis Reseurch Center Cleveiand, Ohio 44135
N A T I O N A L AERONAUTICS A N D SPACE A D M I N I S T R A T I O N W A S H I N G T O N , D. C. FEBRUARY 1972 -<2 <'f .
https://ntrs.nasa.gov/search.jsp?R=19720007871 2018-06-12T00:40:23+00:00Z

TECH LIBRARY KAFB, NM
I Illill IIIII lllll lllll lllll118 11111 1111 Ill1 0333370
1. Report No. 2. Government Accession No. 3. Recipient's u t a i o g NO.
NASA TN D-6649 I
5. Report Date
6, Performing Organization Code
February 1972 CYCLIC CREEP AND FATIGUE OF TD-NiCr 4. Title and Subtitle
(THORIA-DISPERSION-STRENGTHENED NICKEL -CHROMIUM), TD-Ni, AND NiCr SHEET AT 1200 C
Marvin H. Hirschberg, David A. Spera, and Stanley J. Klima 7. Author(s) 8. Performing Organization Report No.
E -660 1 10. Work Unit No.
134 -03 9. Performing Organization Name and Address
11. Contract or Grant No. Lewis Research Center National Aeronautics and Space Administration Cleveland, Ohio 44135 13. Type of Report and Period Covered
2. Sponsoring Agency Name and Address Technical Note National Aeronautics and Space Administration 14. Sponsoring Agency Code Washington, D. C . 20546
15. Supplementary Notes
16. Abstract
The resis tance of thin TD-NiCr sheet t o cyclic deformation was compared with that of TD-Ni and a conventional nickel-chromium alloy. Strains were determined by a calibration technique which combines room-temperature s t ra in gage and deflection measurements with high- temperature deflection measurements. Analyses of the cyclic tests using measured tensile and creep-rupture data indicated that the TD-NiCr and NiCr alloy specimens failed by a cyclic c reep mechanism. The TD-Ni specimens, on the other hand, failed by a fatigue mechanism.
17. Key Words (Suggested by Author(s) ) 18. Distribution Statement Mechanical behavior of mater ia ls ; Low- cycle fatigue; Fatigue; Cyclic creep; Creep
Unclassified - unlimited
19. Security Classif. (of this report) 20. Security Classif. (of this page) 21. NO. of Pages 22. Price'
Unclassified Unclassified 29 $3.00
' For sale by the National Technical Information Service, Springfield, Virginia 22151
CYCLIC CREEP AND FATIGUE OF TD-NiCr (THORIA-DISPERSION-
STRENGTH EN ED N IC KEL-CH R OM I U MI, TD -N i,
AND N i C r SHEET A T 1200 C
by M a r v i n H. Hirschberg, David A. Spera, a n d Stanley J. K l ima
Lewis Research Center
SUMMARY
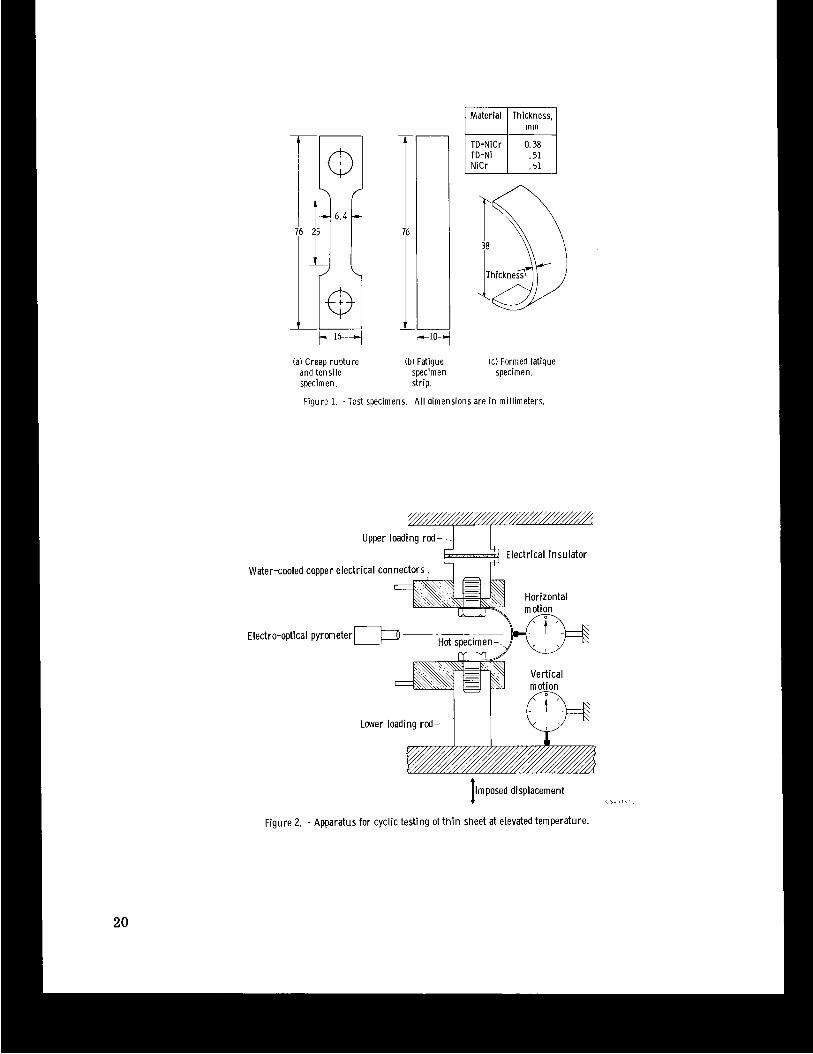
Testing and calibration procedures a r e presented that make it possible to generate strain-range-against-life data from very simple, thin, sheet specimens subjected to cyclic flexure at elevated temperature. The resistance of thin TD-NiCr sheet to this type of cyclic deformation was evaluated at 1200 C in air and compared with that of TD- Ni and a conventional nickel-chromium alloy. The test specimens were s t r ips of sheet material 0.38 o r 0 . 5 1 millimeter thick, 10 millimeters wide, and 76 millimeters long, bent into semicircular arcs . The strips were self resistance heated in air and cycled by square-wave end displacement at 0.05 hertz. Strains were determined by a calibration technique which combined room -temperature strain gage and deflection measurements with high-temperatur e deflection measurements.
Analyses of the cyclic tests using tensile and creep-rupture data indicated that the TD-NiCr and NiCr alloy specimens failed by a cyclic creep mechanism. The TD-Ni specimens, on the other hand, failed by a fatigue mechanism. Metallographic examina- tion of failed specimens confirmed the expected failure modes. The TD-NiCr and NiCr specimens exhibited intergranular cracking, and the TD-Ni exhibited transgranular cracking.
INTRODUCTION
This investigation was undertaken in order to obtain a relatively fast and simple evaluation of the elevated-temperature fatigue resistance of three commercial nickel- bas e sheet materials under very restrictive loading and temperature conditions. These materials were a thoria-dispersion-strengthened nickel-chromium alloy (TD-NiCr), a thoria-dispersion-strengthened nickel alloy (TD-Ni), and a conventional nickel-chromium
alloy (NiCr). All materials were evaluated in a static air environment at 1200 C. These test conditions, with the exception of velocity, simulated potential reentry conditions to be encountered by the skin material of the NASA Space Shuttle Vehicle (ref. 1). There is presently very limited cyclic data available for TD-NiCr , which is a candidate Space Shuttle material. Such data, along with cyclic life comparisons with more conventional materials are needed to assist designers responsible for choosing materials for this specific application. Although the TD-Ni and NiCr materials a r e not candidates for the Space Shuttle Vehicle, they were included in this investigation to provide a basis for comparison.
The design of Space Shuttle skin structure requires high-strain, low-life cyclic data; reversed strain-cycling tests provide the most useful data for this type of application (ref. 2). The common and most direct method of generating these data would be by fully reversed axial strain-cycling tests. Such testing techniques a r e available and widely employed for conventional specimens tested at moderate temperatures (refs. 3 to 7). For thin sheet at temperatures as high as 1200 C, the conventional techniques a r e limited due to complexities encountered in putting thin sheet into direct compression. When this is attempted, buckling usually results and cracks form due to high localized stresses.
It has been shown that bending tes ts can be used to generate useful strain-range- against-life information (refs. 8 and 9). A fully reversed bending test was therefore em- ployed in this investigation. The surface strain ranges experienced by the sheet spec- imens were calculated from a strain and deflection calibration procedure. Along with these cyclic tests, conventional elevated-temperature tensile and creep-rupture data were generated for the three materials.
Comparison was made of the cyclic lives obtained for the three materials investi- gated. Correlations were obtained between cyclic lives and predictions from theory by using tensile and creep-rupture data. A metallurgical investigation of the failed spec- imens was made to assist in understanding the observed cyclic behavior (transgranular o r intergranular modes of cracking).
MATERIALS AND SPECIMENS
Mater ia Is
The sheet materials used in this investigation were a thoria-dispersion-strengthened nickel-chromium alloy (TD-NiCr), a thoria-dispersion-strengthened nickel alloy (TD- Nil, and a conventional nickel-chromium alloy (NiCr). The TD-Ni and NiCr alloys were 0. 51 millimeter thick, while the TD-NiCr was 0. 38 millimeter thick. These materials were commercially available. The chemical analysis for each alloy is listed in table I .
2
Specimen s
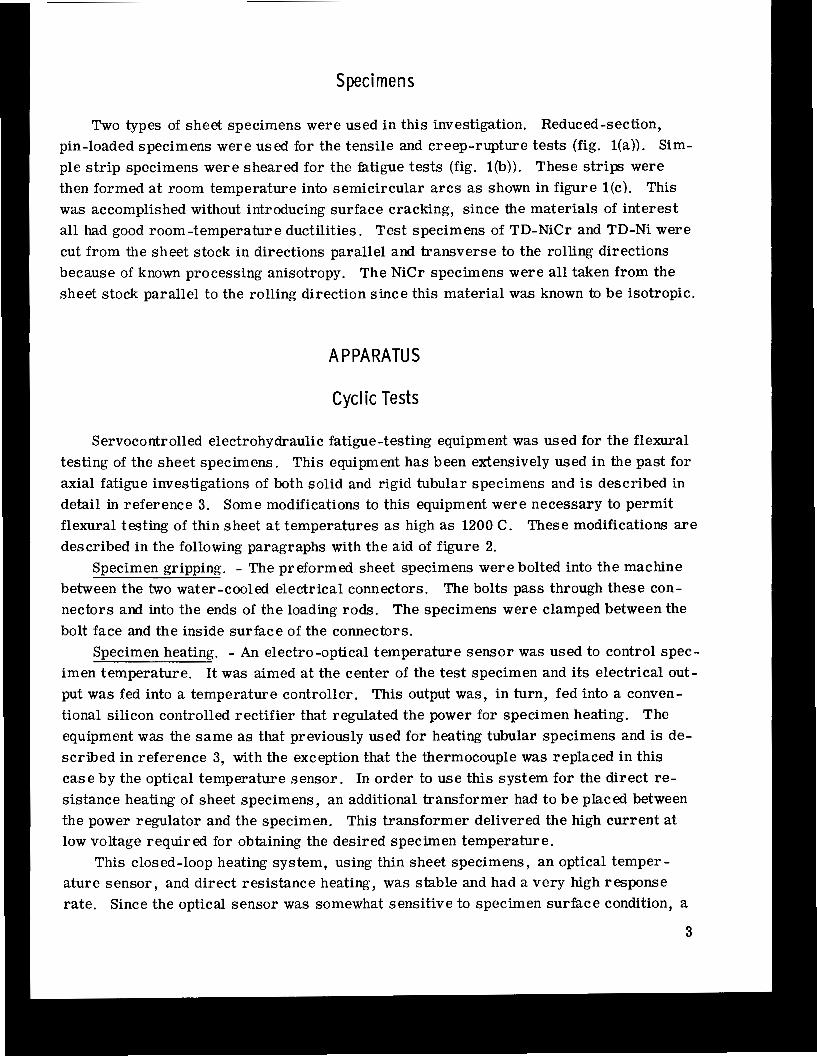
Two types of sheet specimens were used in this investigation. Reduced-section, pin-loaded specimens were used for the tensile and creep-rupture tests (fig. l(a)). Sim- ple s t r ip specimens were sheared for the fatigue tests (fig. l(b)). These strips were then formed at room temperature into semicircular a r c s as shown in figure l(c). This was accomplished without introducing surface cracking, since the materials of interest all had good room-temperature ductilities. Test specimens of TD-NiCr and TD-Ni were cut from the sheet stock in directions parallel and transverse to the rolling directions because of known processing anisotropy. The NiCr specimens were all taken from the sheet stock parallel to the rolling direction since this material was known to be isotropic.
A P PA RATU S
Cycl ic Tests
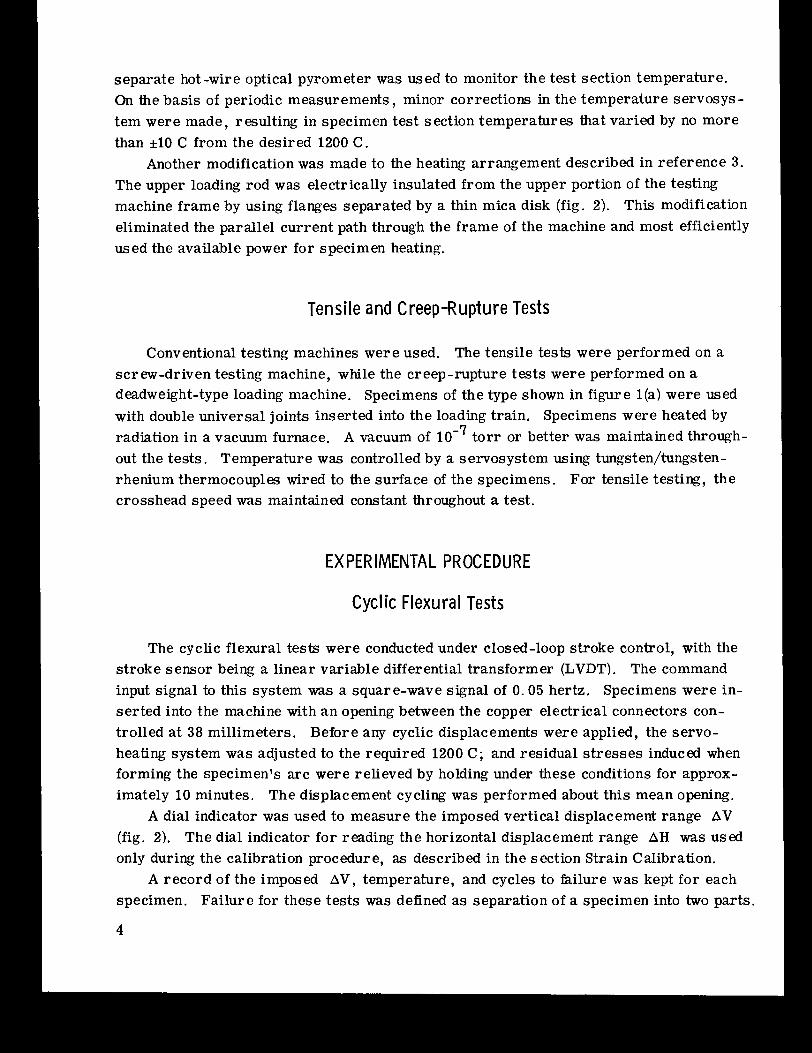
Servocontrolled electrohydraulic fatigue-testing equipment was used for the flexural testing of the sheet specimens. This equipment has been extensively used in the past for axial fatigue investigations of both solid and rigid tubular specimens and is described in detail in reference 3. Some modifications to this equipment were necessary to permit flexural testing of thin sheet at temperatures as high as 1200 C. These modifications a r e described in the following paragraphs with the aid of figure 2.
Specimen gripping. - The preformed sheet specimens were bolted into the machine between the two water-cooled electrical connectors. The bolts pass through these con- nectors and into the ends of the loading rods. The specimens were clamped between the bolt face and the inside surface of the connectors.
Specimen heating. - An electro-optical temperature sensor was used to control spec- imen temperature. It was aimed at the center of the test specimen and its electrical out- put was fed into a temperature controller. This output was, in turn, fed into a conven- tional silicon controlled rectifier that regulated the power for specimen heating. The equipment was the same as that previously used for heating tubular specimens and is de- scribed in reference 3, with the exception that the thermocouple was replaced in this case by the optical temperature sensor. In order to use this system for the direct re- sistance heating of sheet specimens, an additional transformer had to b e placed between the power regulator and the specimen. This transformer delivered the high current at low voltage required for obtaining the desired specimen temperature.
This closed-loop heating system, using thin sheet specimens, an optical temper - ature sensor, and direct resistance heating, was stable and had a very high response rate. Since the optical sensor was somewhat sensitive to specimen surface condition, a
separate hot -wire optical pyrometer was used to monitor the test section temperature. On the basis of periodic measurements, minor corrections in the temperature servosys- tem were made, resulting in specimen test section temperatures that varied by no more than A 0 C from the desired 1200 C.
Another modification was made to the heating arrangement described in reference 3. The upper loading rod was electrically insulated from the upper portion of the testing machine frame by using flanges separated by a thin mica disk (fig. 2). This modification eliminated the parallel current path through the frame of the machine and most efficiently used the available power for specimen heating.
Tensi le and Creep-Rupture Tests
Conventional testing machines were used. The tensile tests were performed on a screw-driven testing machine, while the creep-rupture tests were performed on a deadweight-type loading machine. Specimens of the type shown in figure l(a) were used with double universal joints inserted into the loading train. Specimens were heated by radiation in a vacuum furnace. A vacuum of out the tests. Temperature was controlled by a servosystem using tungsten/tungsten- rhenium thermocouples wired to the surface of the specimens. For tensile testing, the crosshead speed was maintained constant throughout a test.
to r r or better was maintained through-
EX PER IMENTAL PROCEDURE
Cycl ic F lexura l Tests
The cyclic flexural tests were conducted under closed-loop stroke control, with the stroke sensor being a linear variable differential transformer (LVDT). The command input signal to this system was a square-wave signal of 0.05 hertz. Specimens were in- serted into the machine with an opening between the copper electrical connectors con- trolled at 38 millimeters. Before any cyclic displacements were applied, the servo- heating system was adjusted to the required 1200 C; and residual s t resses induced when forming the specimen's arc were relieved by holding under these conditions for approx- imately 10 minutes. The displacement cycling was performed about this mean opening.
A dial indicator was used to measure the imposed vertical displacement range AV (fig. 2). The dial indicator for reading the horizontal displacement range AH was used only during the calibration procedure, as described in the section Strain Calibration.
A record of the imposed AV, temperature, and cycles to failure w a s kept for each
When this occurred, the electrical continuity through the specimen was interrupted and the testing machine was automatically shut down. In all cases, failure occurred in the mid-section of the specimen. It should be noted that under test conditions other than those used in this investigation, failures might possibly occur near the grips and neces- sitate a redesign of the specimen. A simple necked-down section, similar to the tensile and creep-rupture specimens in figure l(a), could be used to ensure that failure would occur at the desired location.
Tensile and Creep-Rupture Tests
The theory to be used to analyze the cyclic data in this investigation requires both tensile and creep-rupture data. These data were generated in vacuum at 1200 C. The test conditions and results a r e listed in table I1 for the three materials investigated.
Stra in Ca I ibrat ion
The objective of this investigation was to generate strain-range-against -life infor - mation for the three sheet materials at 1200 C. The flexural-type test employed does not, however, lend itself to a direct measurement of the required surface strain range at this very high temperature. A calibration procedure was devised which results in an es- timate of the surface strain range for any given imposed displacement range.
The calibration method is based on the assumption that the surface strain range is proportional to the horizontal displacement range AH rather than to AV, as would be the more conventional assumption. In a sense, this assumes that AH is a better indi- cator of changes in surface curvature at the test section than is AV, and that we have "elastic strain invariance" (ref. 2 , p. 194) based on the horizontal displacement range. A more detailed description of the calibration procedure is presented in the appendix.
Meta I log rap h y
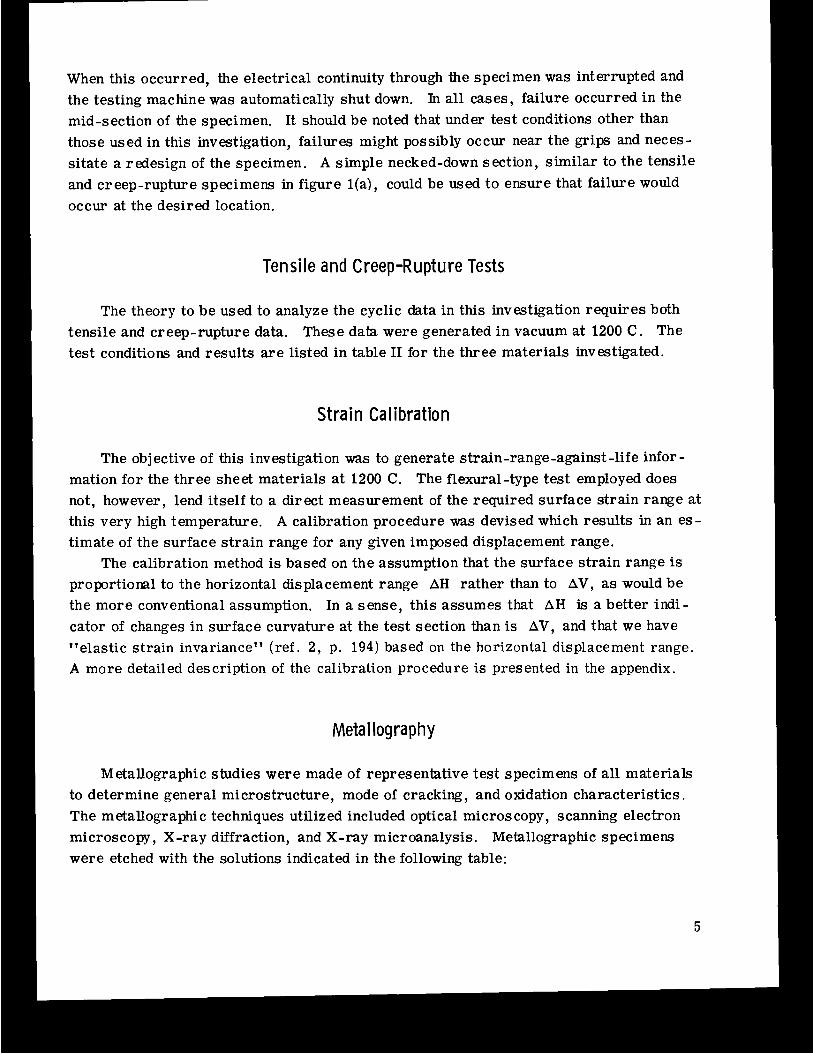
Metallographic studies were made of representative test specimens of all materials to determine general microstructure, mode of cracking, and oxidation characteristics. The metallographic techniques utilized included optical microscopy, scanning electron microscopy, X-ray diffraction, and X-ray microanalysis. were etched with the solutions indicated in the following table:
Metallographic specimens
5
Alloy
TD-NiCr
NiCr
TD-Ni
Etchant
100 ml HZO, 10 ml H2S04, 2 g C r 0 3
92 ml HC1, 5 ml H2S04, 3 ml HN03
45 ml lactic acid, 4 5 ml ethanol, 10 ml HCI
ANALYTICAL PROCEDURE
The general theory used to analyze the data in this study is described in detail in reference 10. This theory considers both low-cycle fatigue and cyclic creep as possible failure mechanisms. Low-cycle fatigue is considered to be a cycle-dependent mode of failure characterized by transgranular cracking. On the other hand, cyclic creep is con- sidered to be a time-dependent mode of failure characterized by intergranular cracking.
In the present investigation, the theory was used to indicate the most likely mode of failure for each of the three materials. If an accurate knowledge of basic mechanical material properties and imposed s t resses had been available, this theory could also have been used for predicting life.
Low-Cycle Fatigue Fa i lu re
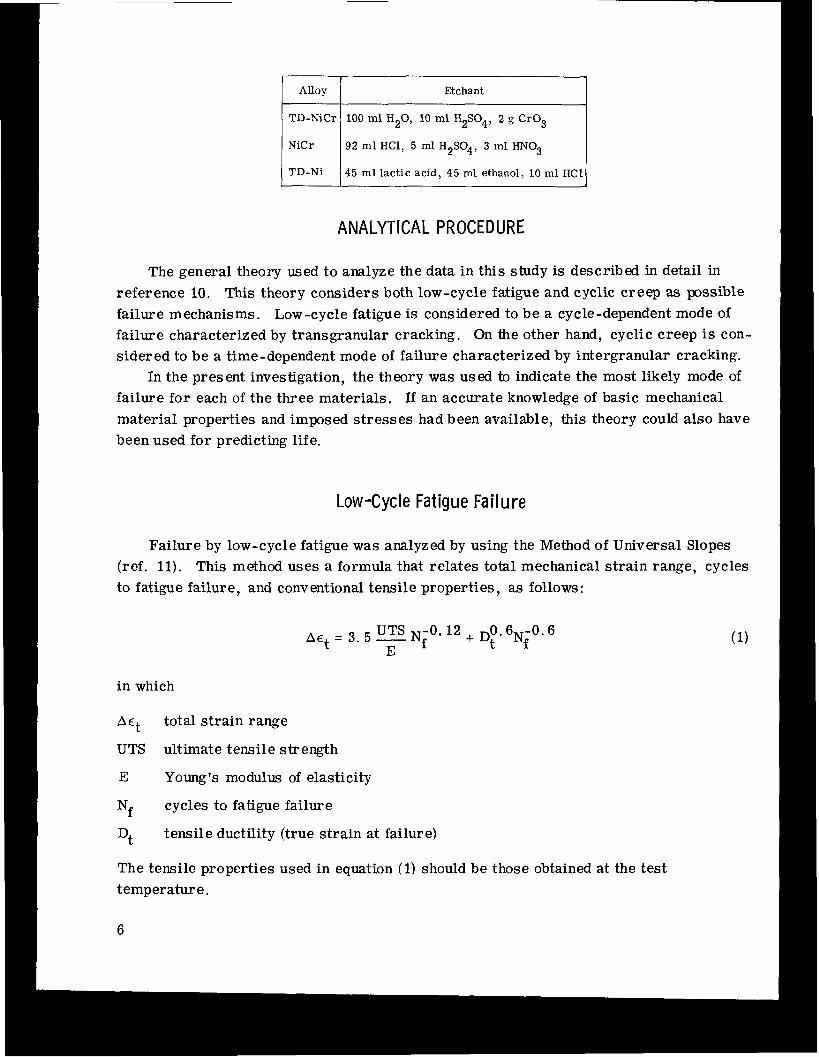
Failure by low-cycle fatigue was analyzed by using the Method of Universal Slopes (ref. 11). This method uses a formula that relates total mechanical strain range, cycles to fatigue failure, and conventional tensile properties, as follows:
0.12 + DF.6 -0.6 Nf AC - 3.5 - UTS Ni E t -
in which
Act total strain range
UTS ultimate tensile strength
E Young's modulus of elasticity
Nf cycles to fatigue failure
Dt tensile ductility (true strain at failure)
The tensile properties used i n equation (1) should be those obtained at the test temperature.
6

Cycl ic-C reep Fai u r e
Failure by cyclic creep was analyzed by using the method of life fractions. Life fractions were calculated by either a stress-t ime o r a strain-cycle approach, whichever was more suitable to a particular alloy. For example, the tensile stress amplitudes were assumed constant and could be estimated for both the TD-NiCr and TD-Ni because they behaved in a quasi-elastic manner. For these two alloys, failure would theoreti- cally occur when the accumulated time under tensile s t r e s s equaled the conventional creep-rupture time at that same stress, o r
in which Nc cycles to creep failure
At
tr
This approach is called an exhaustion of creep-rupture life. For the relatively weak NiCr, creep strain per cycle could be estimated more ac-
curately than the stress amplitude. This material might be classified as quasi-plastic. Failure would theoretically occur when the accumulated creep strain in tension equaled the conventional creep ductility, or
tension time for one square-wave cycle (for 0.05 Hz, A t = 1/6 min)
t ime to rupture at stress, equal to square-wave stress amplitude
Nc Aec = Dc (3)
in which
AcC creep strain per cycle
Dc
This approach is called a linear exhaustion of creep ductility.
creep ductility (true strain at rupture)
RESULTS AND DISCUSSION
Tensi le and C reep-R u p t u r e Test R esu Its
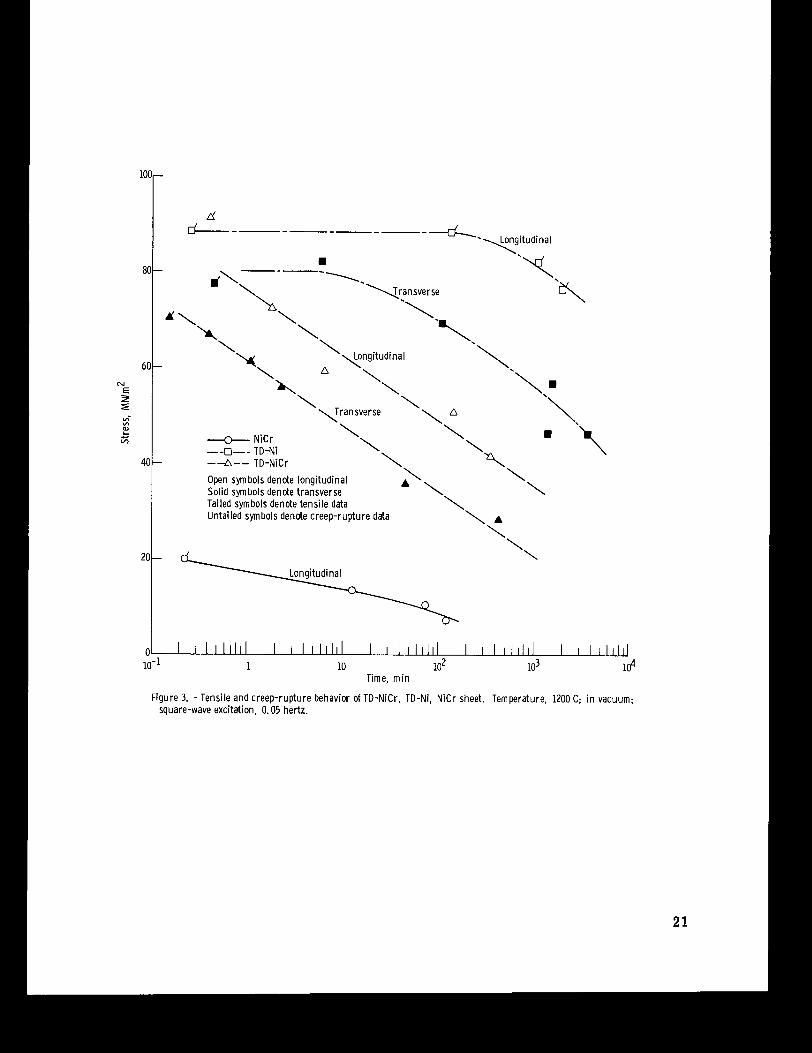
The tensile and creep-rupture test results for the three materials in this investiga- tion are all listed in table I1 and plotted in figure 3 . In this figure, the ultimate tensile strength was arbitrarily plotted at one-fourth of the total t ime taken to perform the ten- s i le test. When this procedure was used, the tensile data seemed to correlate well with the short-time creep-rupture data.
7
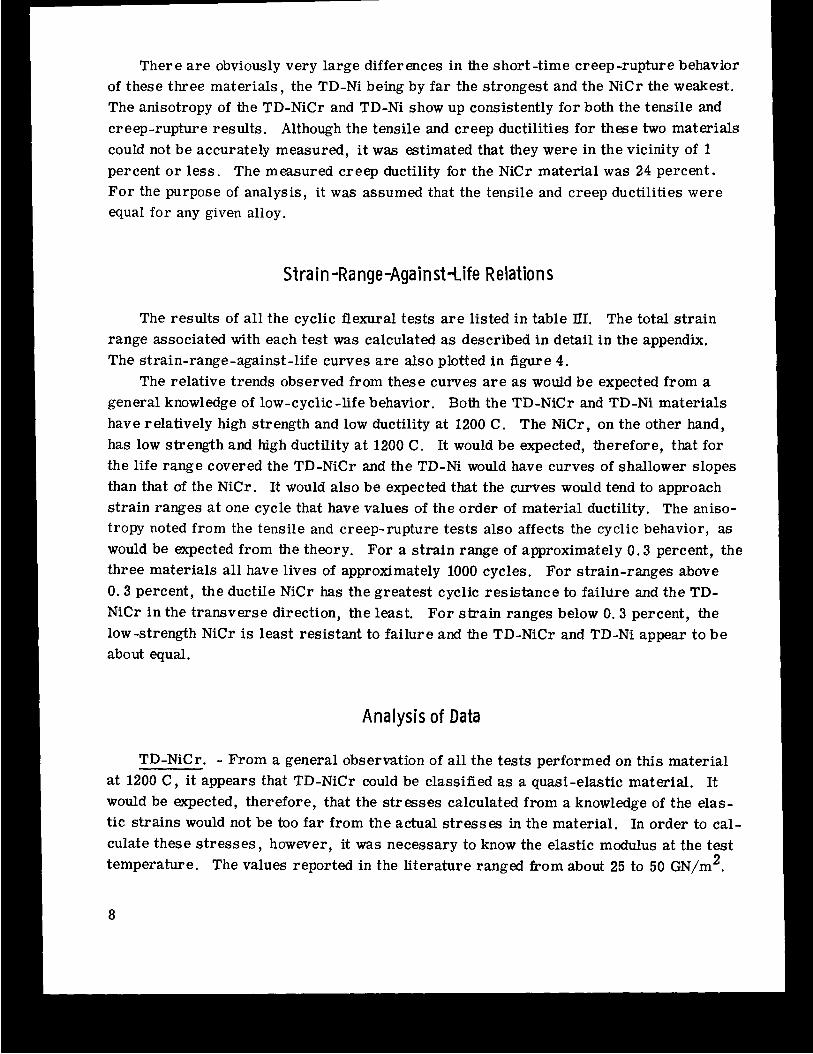
There a r e obviously very large differences in the short -time creep-rupture behavior of these three materials, the TD-Ni being by far the strongest and the NiCr the weakest. The anisotropy of the TD-NiCr and TD-Ni show up consistently for both the tensile and creep-rupture results. Although the tensile and creep ductilities for these two materials could not be accurately measured, it was estimated that they were in the vicinity of 1 percent o r less . The measured creep ductility for the NiCr material w a s 24 percent. Fo r the purpose of analysis, it was assumed that the tensile and creep ductilities were equal for any given alloy.
St ra in -Range-Against -Life Relations
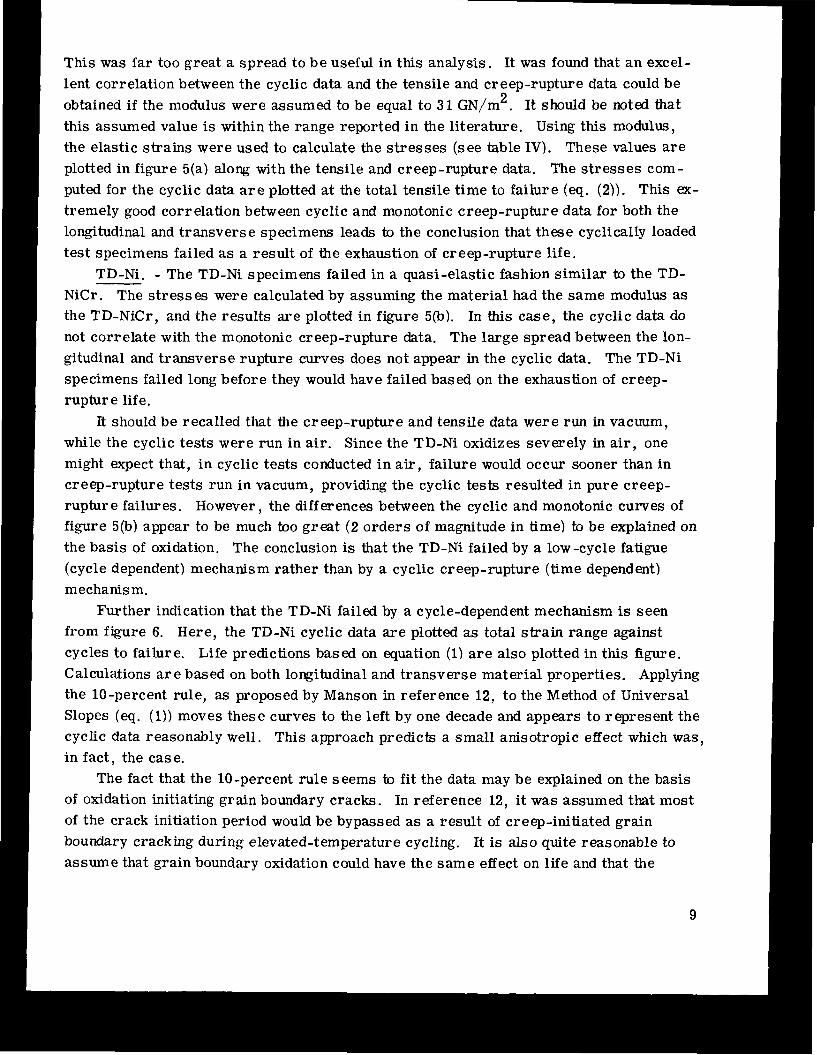
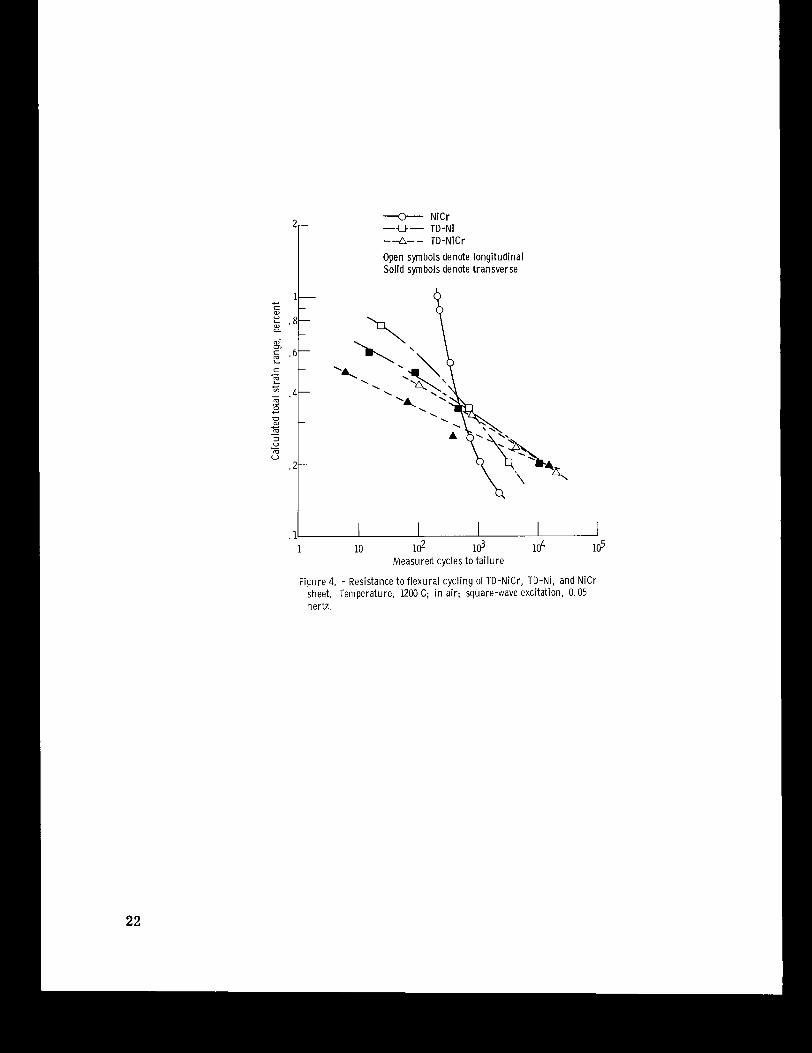
The results of a l l the cyclic flexural tests are listed in table III. The total strain range associated with each test was calculated as described in detail in the appendix. The strain-range-against-life curves a r e also plotted in figure 4.
The relative trends observed from these curves are as would be expected from a general knowledge of low-cyclic -life behavior. Both the TD-NiCr and TD-Ni materials have relatively high strength and low ductility at 1200 C. The NiCr, on the other hand, has low strength and high ductility at 1200 C. It would be expected, therefore, that for the life range covered the TD-NiCr and the TD-Ni would have curves of shallower slopes than that of the NiCr. It would also be expected that the curves would tend to approach strain ranges at one cycle that have values of the order of material ductility. The aniso- tropy noted from the tensile and creep-rupture tests also affects the cyclic behavior, as would be expected from the theory. For a s t ra in range of approximately 0.3 percent, the three materials all have lives of approximately 1000 cycles. For strain-ranges above 0.3 percent, the ductile NiCr has the greatest cyclic resistance to failure and the TD- NiCr in the transverse direction, the least. Fo r strain ranges below 0.3 percent, the low-strength NiCr is least resistant to failure and the TD-NiCr and TD-Ni appear to b e about equal.
Analysis of Data
TD-NiCr. - From a general observation of all the tests performed on this material at 1200 C , it appears that TD-NiCr could be classified as a quasi-elastic material. It would be expected, therefore, that the stresses calculated from a knowledge of the elas- tic strains would not be too far from the actual stresses in the material. In order to cal- culate these s t resses , however, it was necessary to know the elastic modulus at the test temperature. The values reported in the literature ranged from about 25 to 50 GN/m 2 .
8
This was far too great a spread to be useful in this analysis. It was found that an excel- lent correlation between the cyclic data and the tensile and creep-rupture data could be
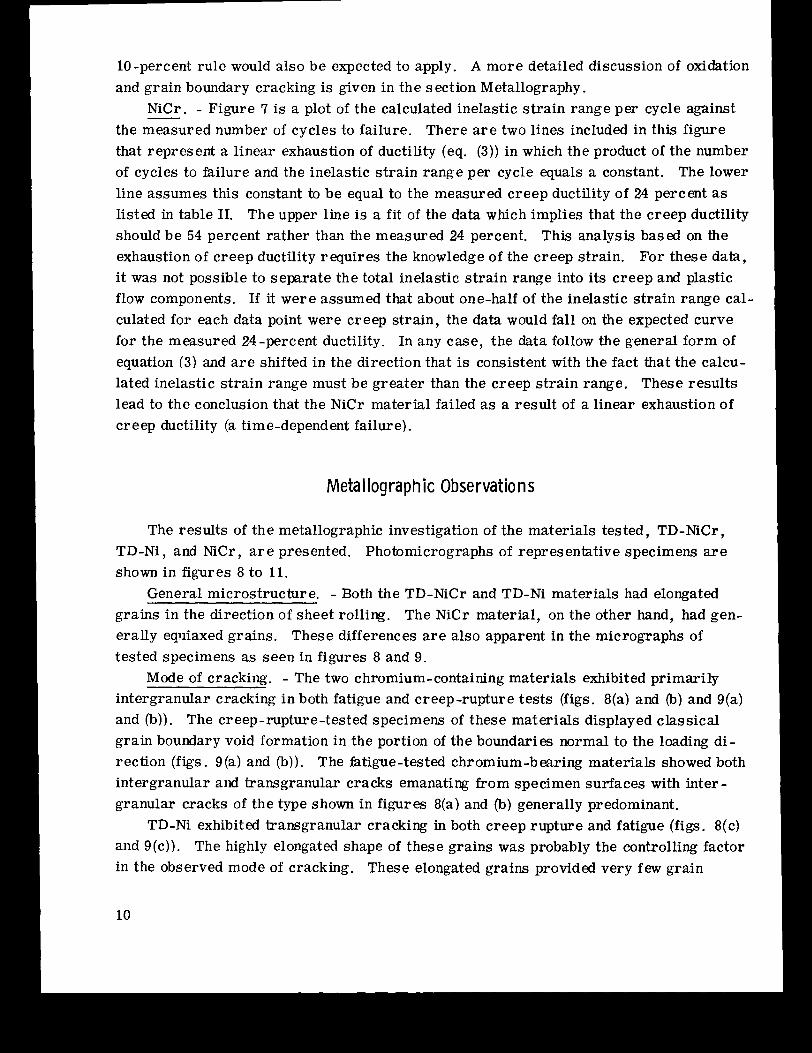
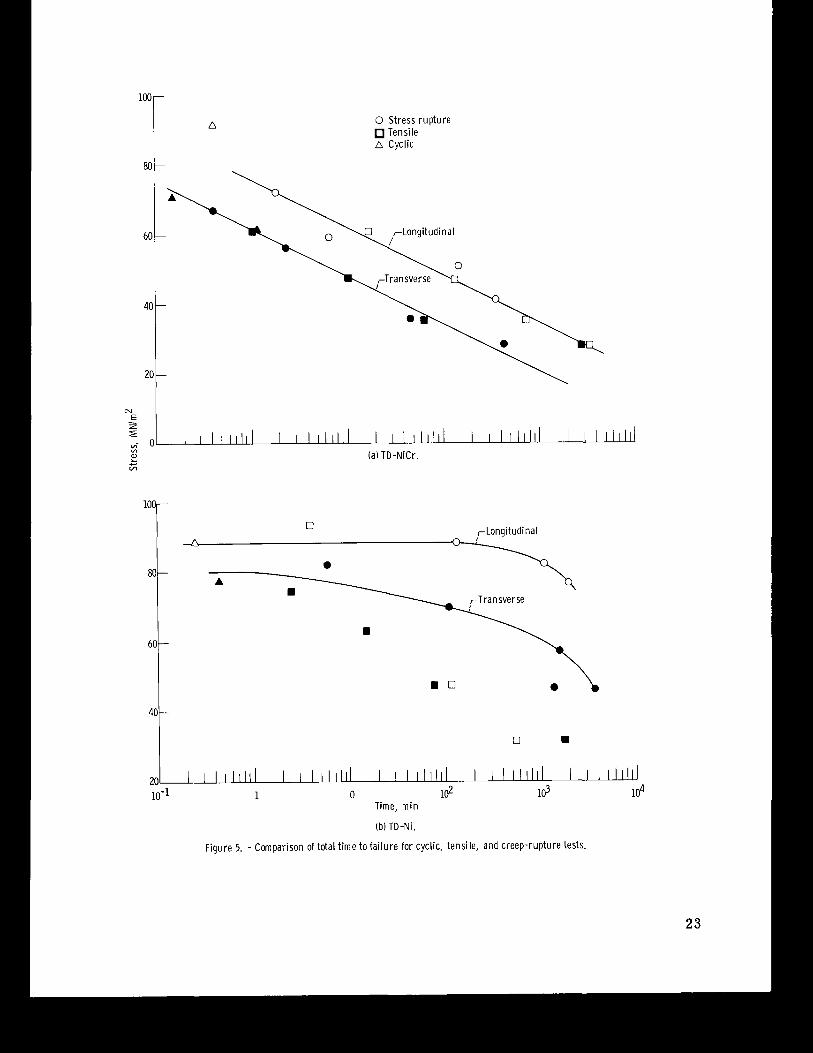
2 obtained i f the modulus were assumed to be equal to 31 GN,” . It should be noted that this assumed value is within the range reported in the literature. Using this modulus, the elastic strains were used to calculate the s t resses (see table IV). These values a r e plotted in figure 5(a) along with the tensile and creep-rupture data. The s t resses com- puted for the cyclic data a r e plotted at the total tensile time to failure (eq. (2)). This ex- tremely good correlation between cyclic and monotonic creep-rupture data for both the longitudinal and transverse specimens leads to the conclusion that these cyclically loaded test specimens failed as a result of the exhaustion of creep-rupture l ife.
TD-Ni. - The TD-Ni specimens failed in a quasi-elastic fashion similar to the TD- NiCr . The s t resses were calculated by assuming the material had the same modulus as the TD-NiCr, and the results a re plotted in figure 5@). In this case, the cyclic data do not correlate with the monotonic creep-rupture data. The large spread between the lon- gitudinal and transverse rupture curves does not appear in the cyclic data. The TD-Ni specimens failed long before they would have failed based on the exhaustion of creep- rupture life.
It should be recalled that the creep-rupture and tensile data were run in vacuum, while the cyclic tests were run in air. Since the TD-Ni oxidizes severely in air, one might expect that, in cyclic tests conducted in a i r , failure would occur sooner than in creep-rupture tests run in vacuum, providing the cyclic tests resulted in pure creep- rupture failures. However, the differences between the cyclic and monotonic curves of figure 5(b) appear to be much too great (2 orders of magnitude in time) to be explained on the basis of oxidation. The conclusion is that the TD-Ni failed by a low -cycle fatigue (cycle dependent) mechanism rather than by a cyclic creep-rupture (time dependent) mechanism.
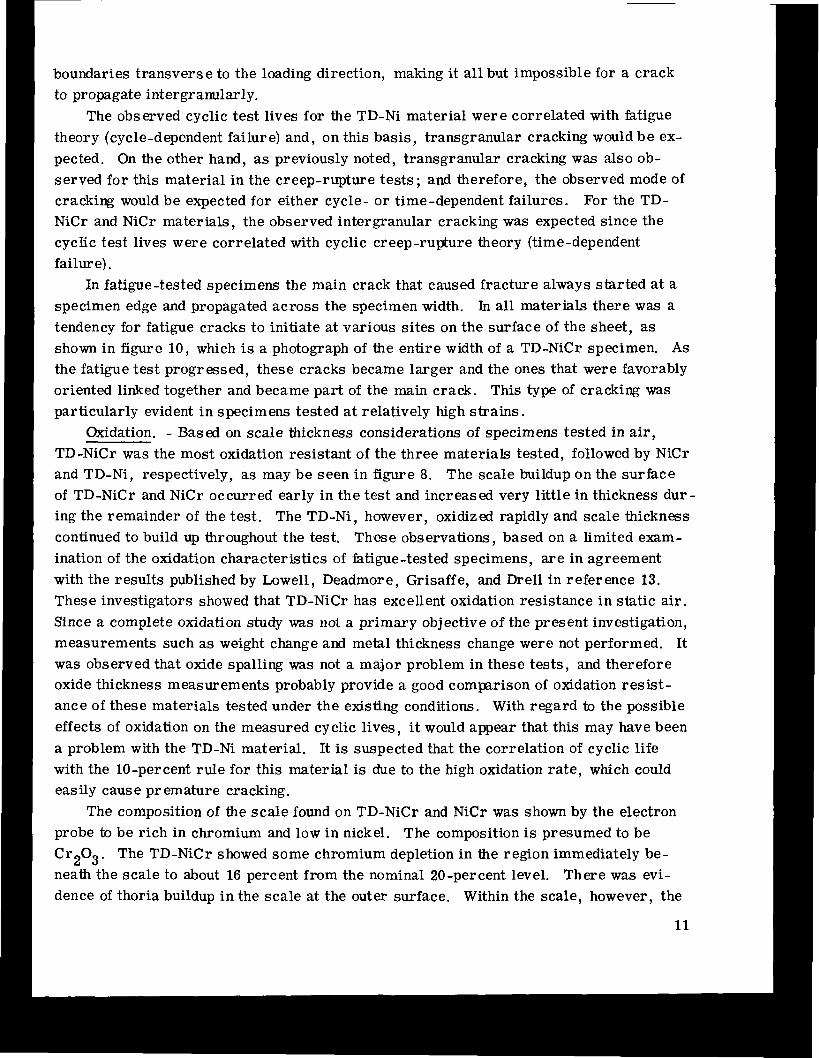
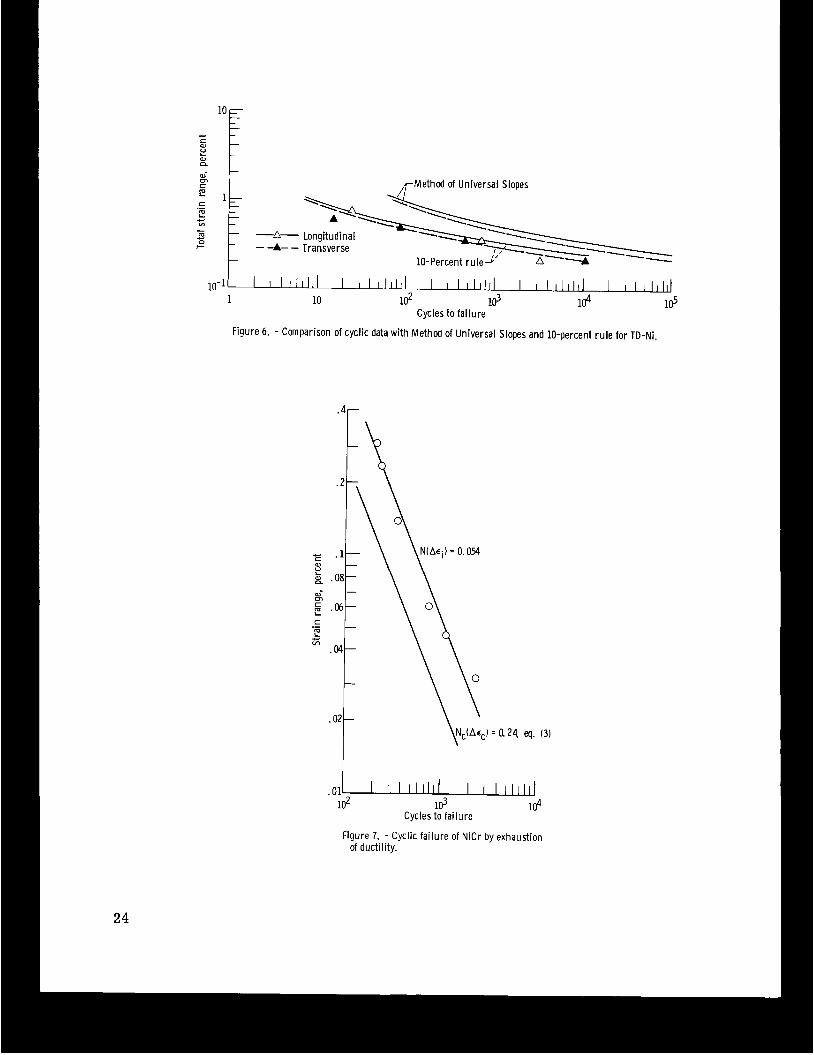
from figure 6. Here, the TD-Ni cyclic data are plotted as total strain range against cycles to failure. Life predictions based on equation (1) are also plotted in this figure. Calculations a r e based on both longitudinal and transverse material properties. Applying the 10-percent rule, as proposed by Manson in reference 12, to the Method of Universal Slopes (eq. (1)) moves these curves to the left by one decade and appears to represent the cyclic data reasonably well. This approach predicts a small anisotropic effect which was, in fact , the cas e.
The fact that the 10-percent rule seems to fit the data may be explained on the basis of oxidation initiating grain boundary cracks. In reference 12, it was assumed that most of the crack initiation period would be bypassed as a result of creep-initiated grain boundary cracking during elevated-temperature cycling. It is also quite reasonable to assume that grain boundary oxidation could have the same effect on life and that the
Further indication that the TD-Ni failed by a cycle-dependent mechanism is seen
9
10-percent rule would also be expected to apply. A more detailed discussion of oxidation and grain boundary cracking is given in the section Metallography.
the measured number of cycles to failure. There a r e two lines included in this figure that represent a linear exhaustion of ductility (eq. (3)) in which the product of the number of cycles to failure and the inelastic strain range per cycle equals a constant. The lower line assumes this constant to be equal to the measured creep ductility of 24 percent as listed in table 11. The upper line is a fit of the data which implies that the creep ductility should be 54 percent rather than the measured 24 percent. This analysis based on the exhaustion of creep ductility requires the knowledge of the creep strain. For these data, it was not possible to separate the total inelastic strain range into its creep and plastic flow components. If it were assumed that about one-half of the inelastic strain range cal- culated for each data point were creep strain, the data would fall on the expected curve for the measured 24-percent ductility. In any case, the data follow the general form of equation (3) and a r e shifted in the direction that is consistent with the fact that the calcu- lated inelastic strain range must be greater than the creep strain range. These results lead to the conclusion that the NiCr material failed as a result of a linear exhaustion of creep ductility (a time-dependent failure).
NiCr. - Figure 7 is a plot of the calculated inelastic strain range per cycle against
Meta I log rap h ic Observations
The results of the metallographic investigation of the materials tested, TD-NiCr, TD-Ni, and NiCr, a r e presented. Photomicrographs of representative specimens are shown in figures 8 to 11.
General microstructure. - Both the TD-NiCr and TD-Ni materials had elongated grains in the direction of sheet rolling. The NiCr material, on the other hand, had gen- erally ecpiiaxed grains. These differences a r e also apparent in the micrographs of tested specimens as seen in figures 8 and 9.
Mode of cracking. - The two chromium-containing materials exhibited primarily intergranular cracking in both fatigue and creep-rupture tests (figs. 8(a) and (b) and 9(a) and (b)). The creep-rupture-tested specimens of these materials displayed classical grain boundary void formation in the portion of the boundaries normal to the loading di- rection (figs. 9(a) and (b)). The fatigue-tested chromium-bearing materials showed both intergranular and transgranular cracks emanating from specimen surfaces with inter - granular cracks of the type shown in figures 8(a) and (b) generally predominant.
TD-Ni exhibited transgranular cracking in both creep rupture and fatigue (figs. 8(c) I and 9(c)). The highly elongated shape of these grains was probably the controlling factor
boundaries transverse to the loading direction, making it all but impossible for a crack to propagate intergranularly.
The observed cyclic test lives for the TD-Ni material were correlated with fatigue theory (cycle-dependent failure) and, on this basis, transgranular cracking would b e ex- pected. On the other hand, as previously noted, transgranular cracking was also ob- served for this material in the creep-rupture tes ts ; and therefore, the observed mode of cracking would be expected for either cycle- o r time-dependent failures. For the TD- NiCr and NiCr materials, the observed intergranular cracking was expected since the cyclic test lives were correlated with cyclic creep-rupture theory (time-dependent failure).
In fatigue-tested specimens the main crack that caused fracture always started at a specimen edge and propagated across the specimen width. h all materials there was a tendency for fatigue cracks to initiate at various sites on the surface of the sheet, as shown in figure 10, which is a photograph of the entire width of a TD-NiCr specimen. As the fatigue test progressed, these cracks became larger and the ones that were favorably oriented linked together and became part of the main crack. This type of cracking was particularly evident in specimens tested at relatively high strains.
TD-NiCr was the most oxidation resistant of the three materials tested, followed by NiCr and TD-Ni, respectively, as may be seen in figure 8. The scale buildup on the surface of TD-NiCr and NiCr occurred early in the test and increased very little in thickness dur - ing the remainder of the test. The TD-Ni, however, oxidized rapidly and scale thickness continued to build up throughout the test. These observations, based on a limited exam- , ination of the oxidation characteristics of fatigue-tested specimens, a r e in agreement with the results published by Lowell, Deadmore, Grisaffe, and Drell in reference 13. These investigators showed that TD-NiCr has excellent oxidation resistance i n static air. Since a complete oxidation study was not a primary objective of the present investigation, measurements such as weight change and metal thickness change were not performed. It was observed that oxide spalling was not a major problem in these tests, and therefore oxide thickness measurements probably provide a good comparison of oxidation resist- ance of these materials tested under the existing conditions. With regard to the possible effects of oxidation on the measured cyclic lives, it would appear that this may have been a problem with the TD-Ni material. It is suspected that the correlation of cyclic life with the 10-percent rule for this material is due to the high oxidation rate, which could easily cause premature cracking.
probe to be rich in chromium and low in nickel. The composition is presumed to be Cra03. The TD-NiCr showed some chromium depletion in the region immediately be- neath the scale to about 16 percent from the nominal 20-percent level. There was evi- dence of thoria buildup in the scale at the outer surface. Within the scale, however, the
Oxidation. - Based on scale thickness considerations of specimens tested in air,
The composition of the scale found on TD-NiCr and NiCr was shown by the electron
thoria content was low. Figure 11 shows the surface morphology of a tested TD-NiCr fatigue specimen. The angular particles prolruding from the specimen surface were an- alyzed by X-ray to be Cr203 single crystals. They were probably formed by redeposi- tion of C r 2 0 3 vapors that evaporated from the specimen surface during the test. The formation of these single crystals was typical of most of the fatigue-tested TD-NiCr specimens but was not observed on NiCr specimens. NiO was also observed on the su r - face of TD-NiCr specimens near the specimen corners and the area immediately su r - rounding many cracks. Many of the secondary cracks in the specimen of figure 10 are surrounded by small regions of NiO. It is probable that NiO formed after the chromium was depleted in these previously cracked regions of the specimen. The oxide inside the fatigue cracks was shown by the electron probe to be high in chromium and is probably Cr203. Nickel content of the oxide in the cracks was low.
probe to be high in nickel and tended to fill all surface cracks. The electron probe also revealed a buildup of thoria in the scale-metal interface region. This may be the result of oxidation of the nickel at the specimen surface, leaving thoria behind at a higher con- centration than in the virgin material.
The oxide formed on the surface of TD-Ni specimens was shown by the electron
CONCLUDING REMARKS
We have presented testing and calibration procedures which make it possible to gen- erate strain-range-against-life data from very simple, thin, sheet specimens subjected to cyclic flexure a t elevated temperature. These procedures also have potential applica- tion to other types of investigations such as evaluating (1) the cyclic behavior of different sheet materials, (2) the effects of varying temperature on any one material, (3) surface coatings and their effects (e. g . , bonding and cracking) on material behavior, (4) the ef- fects of changes in material processing (e .g . , rolling) on life, and (5) theories for pre- dicting cyclic life.
With regard to the TD-NiCr material tested in this investigation, it would appear that, for Space Shuttle application, this alloy could be considered "well behaved. 1 1 The cyclic flexural failures obtained were determined to b e of the time-dependent type and could be predicted if the tensile and creep-rupture properties of the material were known.
SUMMARY OF RESULTS
An investigation was conducted to determine the cyclic flexural resistance of three nickel-base sheet materials tested at 1200 C in air. These materials were TD-NiCr, TD-Ni, and NiCr. The following major results were obtained:
12
1. A relatively simple cyclic flexural test was developed and used to obtain strain-
2. The TD-NiCr and NiCr materials failed due to time-dependent cyclic creep and range-against -life information for thin sheet materials at elevated temperature.
exhibited intergranular cracking. The TD-Ni material failed due to cycle-dependent fatigue and exhibited transgranular cracking.
3. The failure lives and modes of cracking for the three materials were correlated, by means of theories, with tensile and creep-rupture data.
4. As expected, the TD-NiCr had the best oxidation resistance of the three alloys tested, while the TD-Ni had the poorest. The TD-NiCr formed both Cr203 and NiO oxides. The high oxidation rate of TD-Ni may have resulted in premature cracking of the surface, thereby reducing the fatigue life to that predicted by the 10 percent rule.
Lewis Research Center, National Aeronautics and Space Administration,
Cleveland, Ohio, November 8, 1971, 134 -03.
13
The calibration method is based on the assumption that the surface strain range is proportional to the horizontal displacement range. Since it is more convenient to meas- u r e vertical displacement range during an actual test rather than the horizontal displace- ment range, the adopted procedure is as follows:
(1) Obtain an elastic calibration of vertical-against -horizontal displacement range. For convenience, this is performed at room temperature.
(2) Obtain a calibration of horizontal displacement range against surface strain range at room temperature.
(3) Obtain a calibration of vertical-against-horizontal displacement range for the desired temperature and loading wave shape. These calibrations can then be used to obtain the elastic and inelastic strain ranges for a given vertical displacement range at elevated temperature. The following illustrates this calibration procedure.
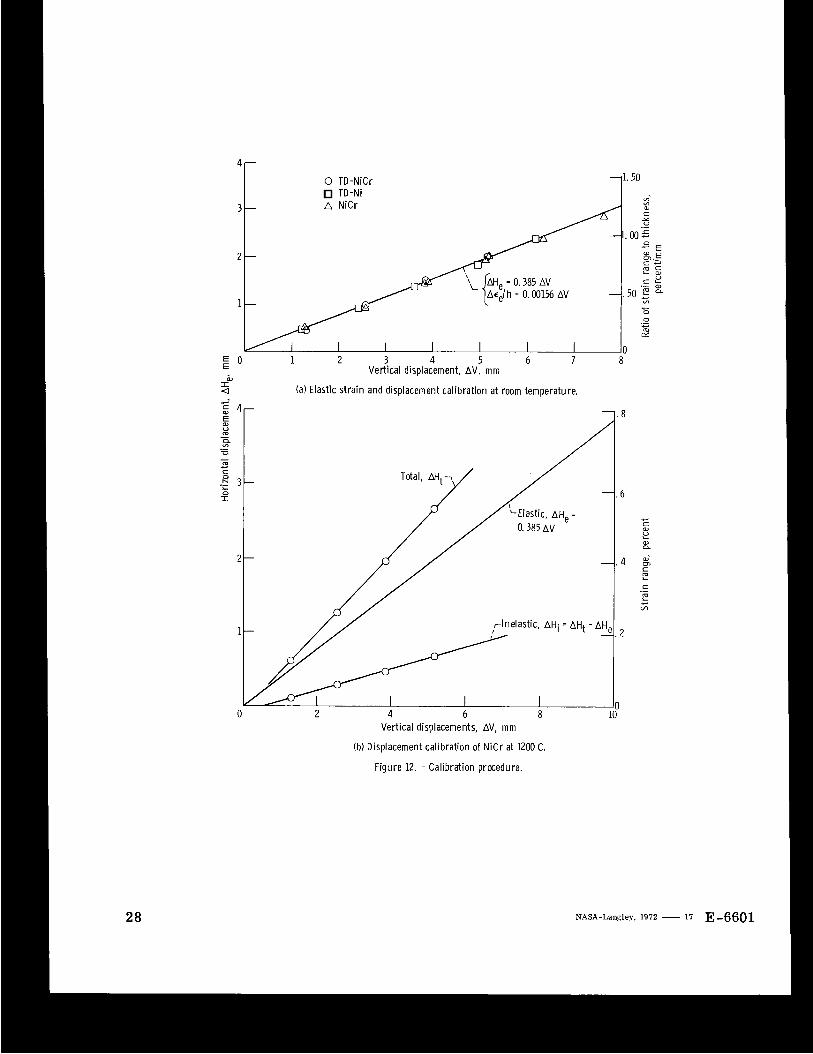
The results of the elastic measurements at room temperature (step (1) listed above) of the horizontal-against-vertical displacement ranges for the three materials are shown in figure 12(a) and can be represented by the equation I where
AV imposed vertical displacement range
AHe resultant elastic horizontal displacement range
A sheet specimen instrumented with conventional foil-type resistance strain gages provided a calibration of surface strain range against horizontal displacement range (step (2) listed above). Since we were dealing with thin sheet i n bending and the gage thickness was an appreciable percentage of the specimen thickness, the measured strains were corrected to give true surface strains. using a TD-NiCr specimen of 0.38 millimeter thickness and resulted in the following relationship :
This calibration was performed by
AEe/h = 0.00405 AHe
where
Ace h thickness of sheet material
14
elastically measured surface strain range
Furthermore, since we are dealing with the elastic portion of the calibration procedure, equation (5) is applicable to all three materials. This relationship is also included in figure 12(a) by adding the Ace/h scale that is 0.00405 times the AHe scale. These experimentally determined coefficients a r e approximately 10 percent greater than ideal- ized theory (ref. 14) would predict.
The final portion of the calibration procedure involves the elevated-temperatur e dis - placement measurements (step (3) listed above). Figure 12(b) is an example of such a calibration obtained for the NiCr material in which the elevated-temperature horizontal displacement range is plotted against the imposed vertical displacement range. Included in this figure is the previously obtained elastic calibration line (eq. (4)). Subtracting this elastic AHe from the measured total horizontal displacement range AHt for a given AV results in the inelastic value AHi which is also plotted in this figure.
By using equation (51, the strain scale can also be included in figure 12(b). For the NiCr, with a sheet thickness of 0.51 millimeter, the strain scale is 0.00207 times the AH scale. The placing of this strain scale on the elevated-temperature deflection cal- ibration plot is, in essence, the assumption of "elastic strain invariance, ( ? in which the strain range is linearly related to the horizontal deflection range.
mine the strain ranges associated with the NiCr specimen listed i n row 4 of table 111, use was made of figure 12(b). This specimen w a s subjected to a vertical displacement range AV of 5.08 millimeters. By entering figure 12@) at this value of the abscissa, the left- hand ordinate scale was used to obtain the total, elastic, and inelastic horizontal dis- placement ranges. These values were 2.63, 1.96, and 0.67 millimeter, respectively. The right -hand ordinate scale of strain range was also used to obtain the total, elastic, and inelastic s t ra in ranges of 0.544, 0.406, and 0.139 percent, respectively. The AH and A € values for all the other specimens were obtained in this same manner and a re listed in table IV.
A specific example of how these calibration curves were used follows. To deter-
REFERENCES
1. Anon. : NASA Space Shuttle Technology Conference. Vol. 2: Structures and Materials. NASA TM X-2273, 1971.
2. Manson, S. S . : Thermal Stress and Low-Cycle Fatigue. McGraw-Hill Book Co., Inc. , 1966.
3 . Hirschberg, M. H. : A Low Cycle Fatigue Testing Facility. Manual on Low Cycle FatigueTesting. Spec. Tech. Publ. 465, ASTM, 1969, pp. 67-86.
4 . Wells, C. H. : Elevated Temperature Testing Methods. Manual on Low Cycle FatigueTesting. Spec. Tech. Publ. 465, ASTM, 1969, pp. 87-99.
5. Slot, T. ; Stentz, R. H. ; and Berling, J. T. : Controlled-Strain Testing ~ r o c ~ d u r e s . Manual on Low Cycle Fatigue Testing. Spec. Tech. Publ. 465, ASTM, 1969, pp. 100-128.
6. Lord, D. C. ; and Coffin, L. F., Jr. : High Temperature Materials Behavior. Manual on Low Cycle Fatigue Testing. Spec. Tech. Publ. 465, ASTM, 1969, pp. 129-148.
7 . Carden, A. E. : Thermal Fatigue Evaluation. Manual on Low Cycle Fatigue Testing. Spec. Tech. Publ. 465, ASTM, 1969, pp. 163-188.
8 . Gross, M. R. : Engineering Materials Evaluation by Reversed Bending. Manual on Low Cycle Fatigue Testing. Spec. Tech. Publ. 465, ASTM, 1969, pp. 149-162.
9 . Gross, M. R. ; and Czyryca, E. J. : Correlations Between Flexural and Direct Stress Low-Cycle Fatigue Tests. Annapolis Div., Rep. 2460, Naval Ship Research and Development Center, Aug. 1967. (Available as AD-656746. )
10. Spera, David A. : The Calculation of Elevated-Temperature Cyclic Life Considering Low-Cycle Fatigue and Creep. NASA TN D-5317, 1969.
11. Manson, S. S. : Fatigue: A Complex Subject - Some Simple Approximations. Exp. Mech., vol. 5 , no. 7 , July 1965, pp. 193-226.
Mech., vol. 2, no. 1, M a r . 1966, pp. 327-363. 12. Manson, S. S. : Interfaces Between Fatigue, Creep, and Fracture. Int. J. -act.
13. Lowell, Carl E. ; Deadmore, Daniel L. ; Grisaffe, Salvatore J. ; and Drell, Isadore L. : Oxidation of Ni-20Cr-2Th02 and Ni-30Cr- 1.5Si at 800, 1000, and 1200 C. NASA TN D-6290, 1971.
14. Timoshenko, Stephen: Strength of Materials. Part I. Third ed., D. Van Nostrand Co., Inc., 1955, p. 379.
16
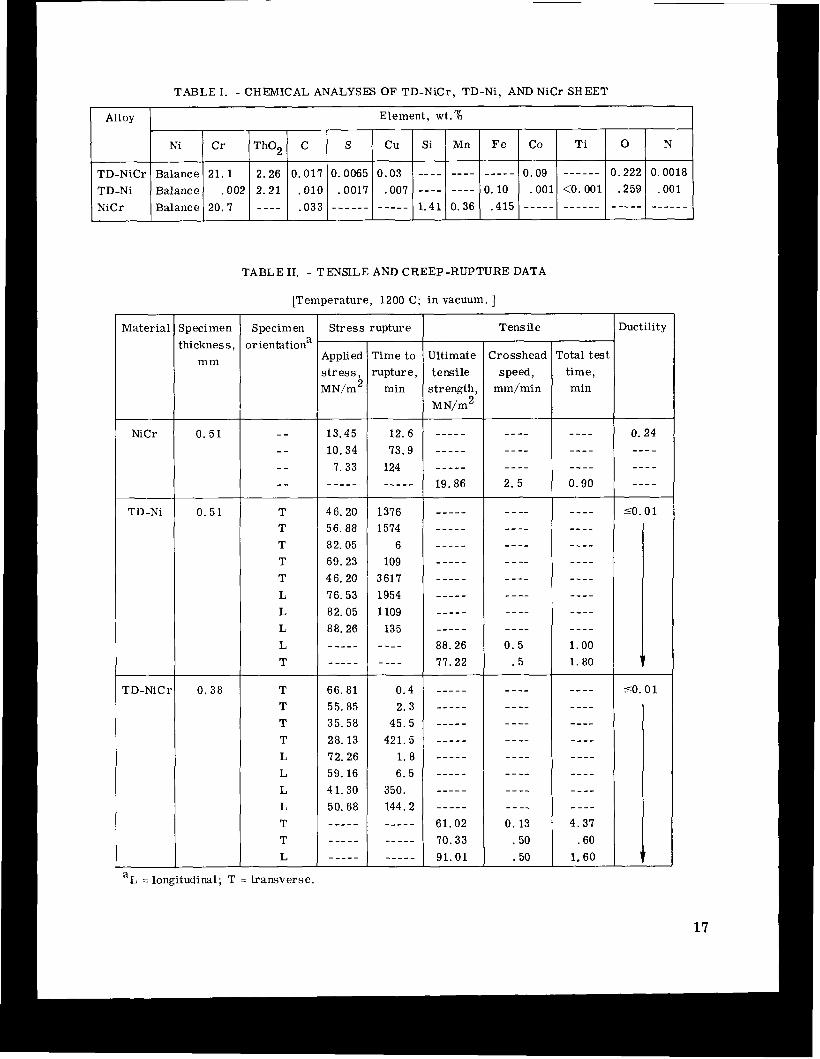
TABLE I. - CHEMICAL ANALYSES OF TD-NiCr, TD-Ni, AND NiCr SHEET
Alloy Element, wt.%
Ni Cr Tho2 C S Cu Si Mn F e Co Ti 0 N
TD-NiCr Balance 21 .1 2.26 0.017 0.0065 0.03 ---- ---- ----- 0.09 - - -_-- 0.222 0.0018
TD-Ni Balance . 002 2 .21 .010 .0017 .007 ---- ---- 0.10 .001 <0.001 .259 .001 NiCr Balance 20.7 - - - - - - - - - - ----- _ _ - _ _ _ 1.41 0.36 -415 _ _ _ _ _ _ _ _ _ _ _ ----- .033
TABLE 11. - TENSILE AND CREEP -RUPTURE DATA
[Temperature, 1200 C; i n vacuum. ]
specimen hicknes s,
mm
S pecim en orientationa
Stress rupture Ductility Tensile
3-0 sshead speed,
mm/min
lppli ec ;tress: vIN/m'
r ime to rupture,
min
Ultimate tensile strength , MN/m2
rota1 test time, min
0. 5 1 13.45 10.34
7. 33 - - - - -
12. 6 73.9
124 -----
T T T T T L L L L T
1376 1574
6 109
3617 1954 1109
135 - - _ _ - - _ _
0.4 2.3
45.5 421.5
1. 8 6.5
350. 144.2 ----- - - _ _ _ - _ _ - _
SO. 01
7
46.20 56.88 82.05 69.23 46.20 76.53 82.05 88.26 - - - - - - -_ - -
66.81 55.85 35.58 28.13 72.26 59.16 41.30 50.68 ----- - - _ _ - - -_ - -
0 . 5 1
0 .38 5 0 . 0 1 T T T T L L L L T T L
aL = longitudinal; T = transverse.
17
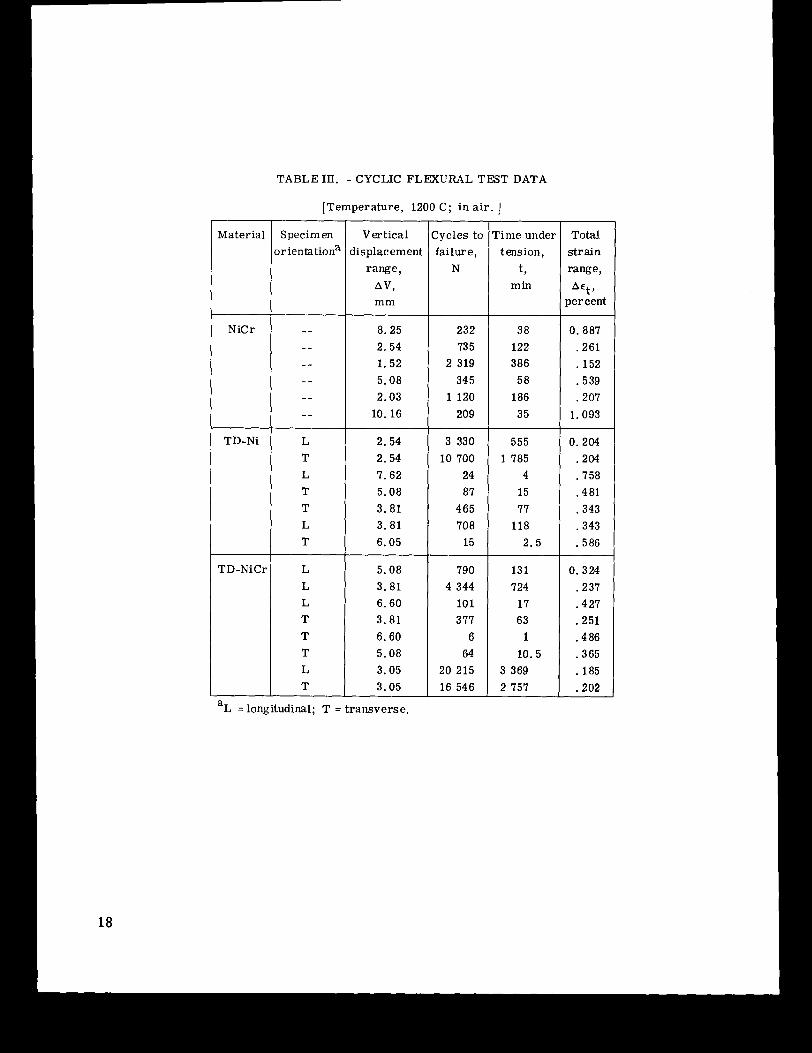
TABLE In. - CYCLIC FLEXURAL TEST DATA
[Temperature, 1200 C; in a i r . ]
Material Specimen orientationa
NiCr - - _ - - -
I - -
I L
TD-Ni ---I- TD-Ni
TD-NiCr L L L T T T L T
Vert ica 1 lisplacement
range, AV? mm
8. 25 2.54 1. 52 5.08 2.03
10. 16
2.54 2.54 7.62 5.08 3 .81 3.81 6.05
5.08 3 .81 6.60 3.81 6.60 5.08 3.05 3.05
Zycles to Time under failure, tension,
N t , min
232 38 73 5 122
2 319 386 345 58
1 1 2 0 186 209 35
3 330 555 10 700 1 7 8 5
24 4 87 15
465 77 708 118
15 2.5
790 13 1
4 344 724 101 17 377 63
6 1 64 10.5
20 215 3 369 16 546 2 757
Total strain range,
?er cent AEt 3
0.887 . 2 6 1 . 152 .539 .207
1.093
0.204 .204 .758 . 4 8 1 .343 .343 . 586
0.324 .237 .427 .251 .486 .365 . 185 .202
aL = longitudinal; T = transverse.
18
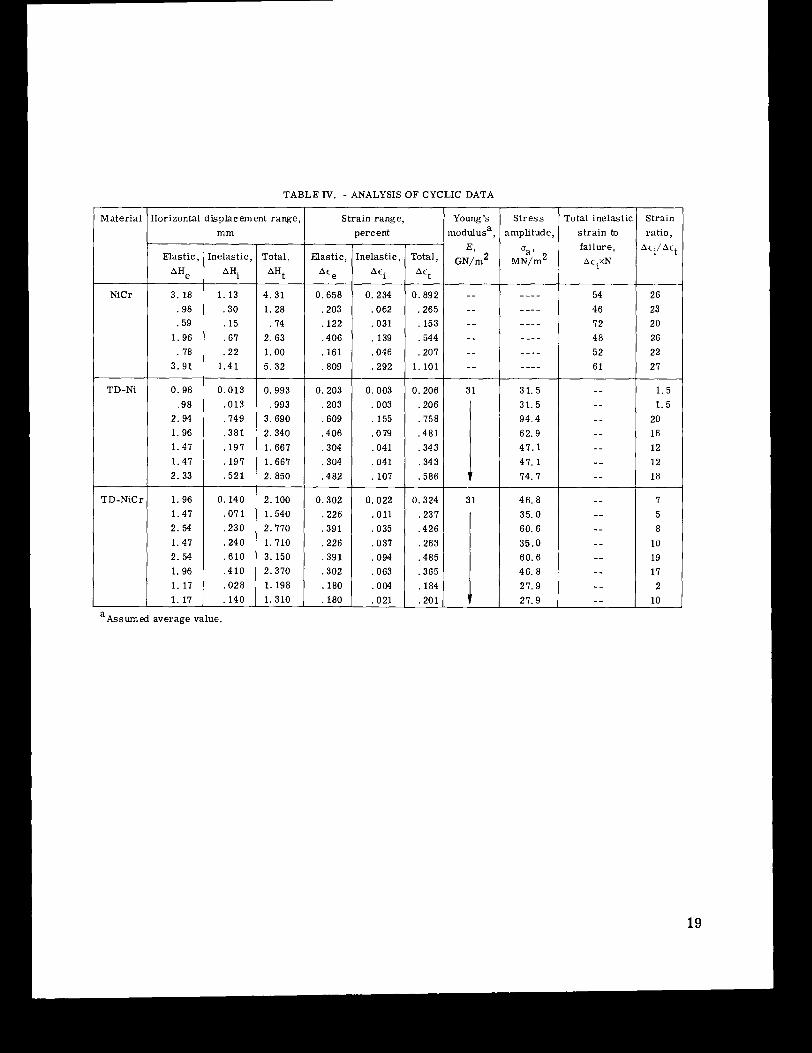
TABLE IV. - ANALYSIS OF CYCLIC DATA
Total inelastic s t ra in to failure, AciXN
Material Strain ratio,
Aci/Act
jorizontal displacement range
54 46 72 48 52 6 1
_ _ _ _ _ _ - _ - _ - _ --
_ _ -_ -_ - _ -- -- -_ - _
Strain range,
26 23 20 26 22 27
1.5 1.5
20 16 12 12 18
7 5 8
10 19 17 2
10
Young’s nodulusa,
E, G N / ~
S t ress amplitude
ua 9
MN/m2
mm percent
Elastic, Inelastic AHi
Total,
AHt
Elastic
“e
[nelastic AEi
Total,
Act
NiCr 3. 18 . 9 8 . 5 9
1. 96 . 78
3 . 9 1
4 . 3 1 1. 28
.74 2. 63 1.00 5 .32
0.658 ,203 .122 ,406 . 1 6 1 ,809
0 .892 ,265 ,153 ,544 ,207
1 .101
1. 13 . 3 0 . 1 5 . 6 7 . 2 2
1 . 4 1
0.013 ,013 ,749 , 3 8 1 . 197 . 1 9 7 . 5 2 1
0.234 . 0 6 2 , 0 3 1 . 139 ,046 . 2 9 2
0.003 . 003 ,155 ,079 . 0 4 1 , 0 4 1 . 107
0.022 , 0 1 1 .035 ,037 . 094 .063 .OM . 0 2 1
TD-Ni 0. 98 . 9 8
2.94 1. 96 1.47 1 .47 2.33
0.993 ,993
3.690 2. 340 1.667 1.667 2.850
0.206 ,206 , 7 5 8 , 4 8 1 ,343 , 3 4 3 ,586
0.324 ,237 ,426 ,263 .485 .365 . 184 ,201
-
-
0.203 .203 .609 ,406 .304 ,304 .482
0.302 ,226 , 3 9 1 .226 , 3 9 1 ,302 . 180 . 180
31. 5 31. 5 94 .4 62.9 4 7 . 1 4 7 . 1 74 .7
46. 8 35 .0 60. 6 35.0 60. 6 46. 8 27.9 27.9
TD-NiCr 0 .140 .07 1 . 2 3 0 . 2 4 0 . 6 1 0 , 4 1 0 , 0 2 8 . 1 4 0
1. 96 1 . 4 1 2 . 5 4 1 .47 2. 54 1. 96 1. 17 1. 17
2.100 1.540 2.770 1. 710 3.150 2.370 1. 198 1. 310
a ~ s u m e d average value.
19
Material Thickness, m
(a) Creep rupture (b) Fatigue (c ) Formed fatigue and tensile specimen specimen. specimen. strip.
Figure 1. - T e s t specimens. Al l dimensions are in millimeters.
Lpper loadi
Electrical insulator Water-cooled comer electrical connectors, 7 r'
Horizontal m 0%
Water -cooled copper elect r ica I connect
Electro-optical p y r o m e t e r m ~ - ~ ~
Lower loading rod- .
Electro-optical p y r o m e t e r m ~ ~
Lower loading rod- . 11,p Imposed displacement
L,. 4 >i 1
Figure 2. - Apparatus for cyclic testing of thin sheet at elevated temperature.
20
N E z a vi
- v) m L 5;
'. &
y- \Transverse
d\,----
\ \ A \ \
Open symbols denote longitudinal Solid symbols denote transverse Tailed symbols denote tensile data \ Untailed symbols denote creep-rupture data \ A
\
I I I 1 1 1 1 1 I I 1 1 1 1 1 1 I 1 1 1 1 1 1 1 I I I11111 I I 1 1 1 1 1 1 1 10 102 103 104
Time, m i n
Figure 3. -Tensi le and creep-rupture behavior of TD-NiCr, TD-Ni, NiCr sheet. Temperature, 1200 C; in vacuum; square-wave excitation, 0.05 hertz.
21
2-
1- c c - a, u
a .E- -
a- m 5 .6- L
c - m L c
.- 2 .4- m c 0 c U a - m 3 U m 0
c - -
.2-
- NiCr -U- TD-Ni -SI-- TD-NiCr
Open symbols denote longitudinal Solid symbols denote transverse
.1 1 10 102 103 104 105
Measured cycles t o fa i lure
Figure 4. - Resistance to f lexural cycling of TD-NiCr, TD-Ni, and NiCr sheet. Temperature, 1200 C; in air; square-wave excitation, 0.05 hertz.
22
l o r
n 0 Stress rupture Tensile
D Cyclic
80 -
60 -
40 -
20 -
N E z 5 .-..
m - 0 I l 1 l 1 1 1 1 I I 1 1 1 1 1 1 I I I I I I I I I I I11111 I 1 l l l l l 1 (a) TD-NiCr. VI a,
L I Vl
loor 0 ,-Lonqitudinal 1 60
. - A I
n ! v
0
1
20 I I I11111 I I I11111 I I I I I I I I I l1l l111 I 1 l l l l l l 10-1 1 0 102 103 104
Time, m i n
(b) TD-Ni
Figure 5. - Comparison of total t ime to fa i lure for cyclic, tensile, and creep-rupture tests.
method of Universal Slooes
- Lc-
c m - +- Longitudinal 0
+ - - -A- - Transverse --- - - 10-Percent r u l e Ll--
1 10 102 103 104 105 10-1 I I I t l l l l I I l l l l l I I I I I I I I I I I I I l I 1 , l I I 1 1 1 l 1
Cycles to fa i lure
Figure 6. - Comparison of cyclic data with Method of Universal Slopes and 10-percent r u l e for TD-Ni.
= 0.24, eq. (3)
. 01 I l11111l I I I I I l l l 102 103 104
Cycles to fa i lure
Figure 7. - Cyclic fa i lure of NiCr by exhaustion of ducti l i ty.
24
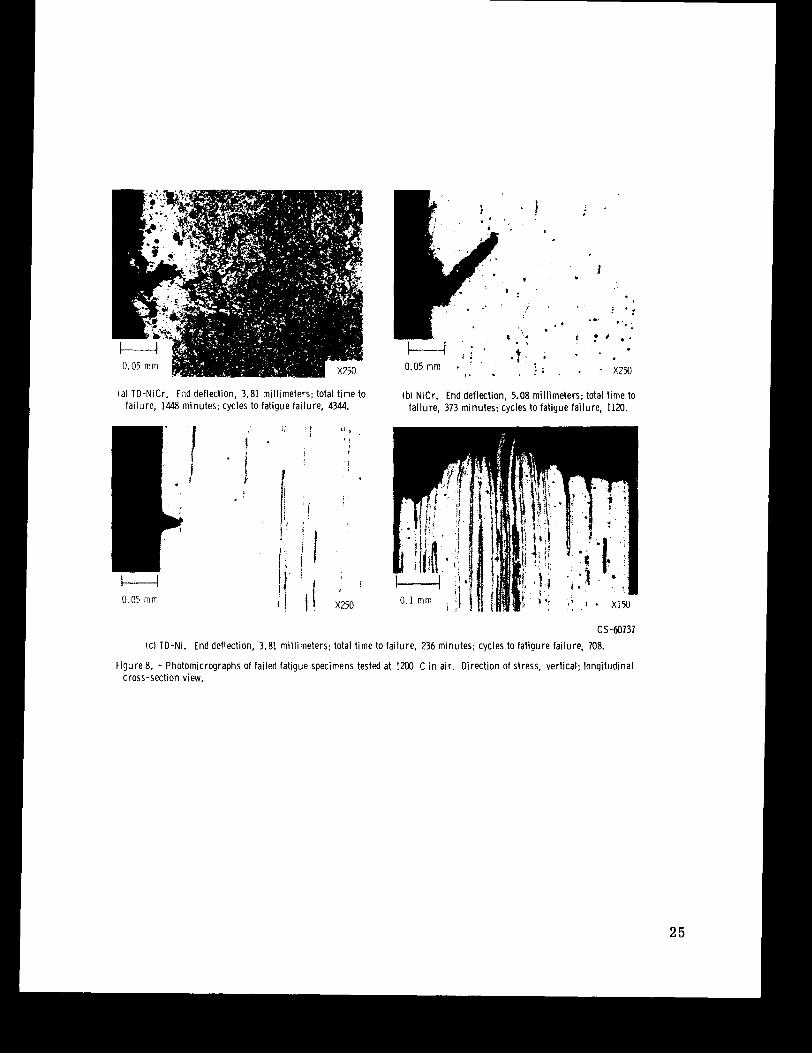
(a) TD-NiCr. End deflection, 3.81 millimeters; total time to (b) NiCr. End deflection, 5.08 millimeters; total t ime to failure, 1448 minutes; cycles to fatigue failure, 4344. failure, 373 minutes; cycles to fatigue failure, 1120.
U 0.05 mm
' i ' i , ' !
i
X2H)
cs-60737
(c) TD-Ni. End deflection, 3.81 millimeters; total time to failure, 236 minutes; cycles to fatigure failure, 708.
Figure 8. - Photomicrographs of failed fatigue specimens tested at 1200 C in air. Direction of stress, vertical; longitudinal cross-section view.
25
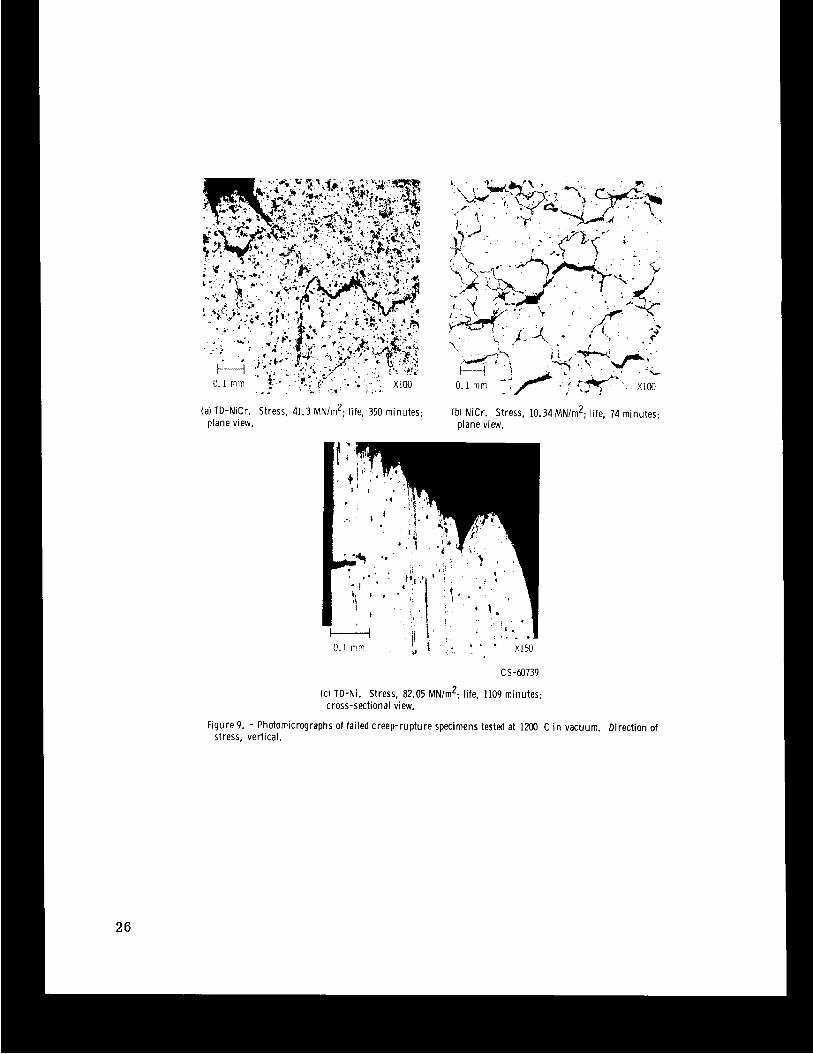
(a)TD-NiCr. Stress, 41.3 MN/m2; life, 350 minutes; (b) NiCr. Stress, 10.34MN/m2; life, 74 minutes; plane view. plane view.
. ' t , :_ .1 x150 il , , I . I
U b l 3 ' * 0.1 imm
cs-60739
(c) TD-Ni. Stress, 82.05 M N d ; life, 1109 minutes; cross-sectional view.
Figure 9. stress,
- Photomicrographs vertical.
of failed creep-rupture specimens tested at 1200 C i n vacuum. Direction of

A Secondary cracks 4- Nio
r-Main crack \ \ / \
Figure 10. - Surface crack formation. TD-NiCr tested at 1200 C i n air. -X?O.
C S -60740
(35-60738
Figure 11. - Surface morphology of TD-NiCr tested at 1200 C i n air. X60.
27
4 r 0 TD-NiCr
TD-Ni A NiCr
b I 4 (a) Elastic strain and displacement calibration at room temperature. c
n VI u ._ /
8
8
6
c c m u L m n
4 g c e
e c ._ c 1/1
2
Vertical displacements, AV, mm
(b) Displacement calibration of NiCr at 1200 C.
Figure 12. - Calibration procedure.
28