customer satisfaction on facility services in terminal 2 ... · customer satisfaction on facility...
TRANSCRIPT

Customer satisfaction on facility services in terminal 2
of Tampere Airport
Anastasia Chumakova
Bachelor’s thesis
April 2014
Degree Programme in
Tourism
TAMPEREEN AMMATTIKORKEAKOULU
Tampere University of Applied Sciences

2
ABSTRACT
Tampereen Ammattikorkeakoulu
Tampere University of Applied Sciences
Degree Programme in Tourism
ANASTASIA CHUMAKOVA
Customer satisfaction on facility services in terminal 2 of Tampere Airport
Bachelor’s thesis 58 pages, appendices 3 pages
April 2014
The main goal of this thesis was to find appropriate solutions to problems which are
related to facility services in terminal 2 of Tampere Airport. Customer satisfaction
survey is an effective tool to inquire what customer really needs and expects. Therefore
measuring the level of customer satisfaction on terminal facilities was an objective for
this research. Suggestions for improvements was proposed based on the results of
survey and used theories.
Researchers use various methods to evaluate customer satisfaction on service which is
offered to client. This particular case was conducted with quantitative research method.
Online questionnaire was used for data collecting. Statistical information was processed
with MS Excel software and analyzed using SERVQUAL technique and theory which
is related to airport terminal characteristics and technical requirements.
The level of customer satisfaction on terminal facilities was poor. Results of the survey
ascertained that facilities’ size, level of comfort in premises and obsolescence of interior
were parameters that customers were mostly displeased with. There were also some not
that acute problems related to cleanness of facilities, its safety and signage that allow
passengers to easily orientate between zones of terminal.
Suggestions that were provided at the final part of the thesis concentrate on adapting
terminal facilities to the needs of passengers. The list of recommendations covers all
aspects that caused passengers’ dissatisfaction on facility services. Special attention was
paid to size of premises and interior refreshment.
Key words: customer satisfaction, service improvement, airport environment

3
ACKNOWLEDGEMENT
This research was accomplished in spring 2014 and is fulfilling the requirements for
Bachelor’s Degree in Hospitality Management at the Tampere University of Applied
Sciences. I want to thank some people for support and belief in me.
I must say, first and foremost, this thesis is devoted to my beloved family. My parents
gave me a marvelous opportunity to complete a part of my education abroad. I am so
grateful for their trust in me and priceless countenance throughout my life.
It gives me pleasure in acknowledging the support of my supervisor, Sari Matala.
Without her persistent help and guidance throughout the whole research process this
paper would not have materialized.
I thank customer service supervisor at Airpro OY, Anni Mäkelä, for permission to
conduct a research on topic that I have chosen. Moreover, my mentor Mikko Honkala
has given me constructive comments and suggestions which I highly appreciate. Special
thanks also to Tuula Andersson and my friend Arja Niemi, who provided assistance in
data collecting process.
I would like to thank my teachers Irja Petilä, Pirkko Varis, Liisa Tyllilä, Sami Salonen,
Kaarina Järveläinen for cognitive lectures, enthralling discussions and interesting
workshops, my tutoring teacher Heikki Toijala and study counselor Janne Hopeela for
their significant help in planning and accomplishing studies at TAMK. As my first
academic year was spent at Kajaani University of Applied Sciences I would also like to
express my gratitude towards my teachers Peter Stricker, Ruusa Tanhuanpää, Mikko
Keränen for their interesting in-depth teaching during my studies at KAMK.
I owe a very important dept to my closest friends Victoria Moiseeva, Maria
Pokryshkina, Elizaveta Nazarova, Vladislav Ermoshin, Ekaterina Nikitina, Yana
Antonenko, Dinh Quynh Mai as they always encourage and motivate me to reach my
goals. My heartfelt appreciation goes to my dear friend Oxana Kolyasnikova as she is
the one who inspired me to choose my thesis topic and cheered me up especially at the
first stages of my research process.
“There is nothing impossible to him who will try.” - Alexander the Great

4
TABLE OF CONTENTS
1 INTRODUCTION ......................................................................................................... 5
2 RESEARCH PLAN ....................................................................................................... 6
2.1 Thesis topic .............................................................................................................. 6
2.2 Theories and concepts ............................................................................................. 7
2.2.1 Service improvement and service quality ......................................................... 7
2.2.2 Customer satisfaction ........................................................................................ 9
2.2.3 SERVQUAL method ...................................................................................... 10
2.2.4 Airport terminal and its facilities .................................................................... 11
2.3 Research questions ................................................................................................ 13
2.4 Research data ......................................................................................................... 13
2.5 Structure of the research ........................................................................................ 15
3 TAMPERE AIRPORT, TERMINAL CHARACTERISTICS AND CUSTOMER
SATISFACTION DETERMINANTS ............................................................................ 16
3.1 Introduction to Tampere Airport and Terminal 2 .................................................. 16
3.2 Entrance concourse, departure and arrival lounges ............................................... 19
3.3 Terminal characteristics......................................................................................... 21
3.4 Passenger types ...................................................................................................... 23
3.5 Customer satisfaction determinants ....................................................................... 24
4 CUSTOMER SATISFACTION IN TERMINAL 2 OF TAMPERE AIRPORT ......... 26
4.1 General information about respondents ................................................................ 27
4.2 Relation to Tampere Airport (Terminal 2) ............................................................ 30
4.3 Customer satisfaction on terminal facilities .......................................................... 35
4.4 Improvements in terminal facilities ....................................................................... 44
5 SUMMARY AND SUGGESTIONS FOR IMPROVEMENTS .................................. 49
5.1 Summary of the survey .......................................................................................... 49
5.2 Suggestions for terminal facilities ......................................................................... 50
5.3 Suggestions for the overall interior of terminal facilities ...................................... 53
6 CONCLUSION ............................................................................................................ 55
REFERENCES ................................................................................................................ 57
Book references ........................................................................................................... 57
Online references ......................................................................................................... 57
APPENDICIES ............................................................................................................... 59
Appendix 1: Thesis questionnaire ............................................................................... 59

5
1 INTRODUCTION
Nowadays people hardly imagine their life without traveling in spite of the fact that
mass tourism is relatively new industry which has been actively growing merely since
the middle of the 20th
century. For many people traveling has become not only a way of
spending their leave, but a lifestyle. This could not be possible without cheap air travel.
Each passenger must spend in the terminal at least few hours before his departure.
Preparations and waiting for the flight are pretty nerve-racking process, which claims
for specific conditions that should to be offered to each traveler in the terminal. This
research is focused on integral part of air traveling process.
Facilities of terminal 2 of Tampere Airport serve as the subject for this research.
Researcher aims to find ways of modernizing terminal public premises in accordance
with the needs of customers. The main objective of the research is to measure the level
of customer satisfaction towards facility services which are offered in the entrance
concourse, departure and arrival lounges. Solutions are based on the results of customer
satisfaction survey and theories which are applied to the research.
The research is conducted using quantitative method. The data is collected with the help
of online questionnaire and processed with MS Excel. The data is analyzed with
SERVQUAL method and special theory which is related to terminal facility
requirements.
Chapter 2 explains more about all the peculiarities of the research.

6
2 RESEARCH PLAN
2.1 Thesis topic
Among Finns Tampere is recognized as the best city to live in. Such kind of places
attracts many people, not only residents of Finland, but tourists as well. In many cases
airport is the first spot that tourist see when the plane lands. No one disagrees that the
first impression is very important, thence airport and its facilities should have a positive
effect on people who are coming to the city/country for the first time, while travelers
who leave the country should get a good impression before their plane takes off. This
happens only if the traveler was satisfied with the services offered at the airport.
Being such a wonderful city, Tampere must have good respectable modern airport. In
this paper the main focus is directed to Tampere International Airport, Terminal 2.
Despite the fact that Terminal 2 is relatively cheap terminal and cooperates with such
budget airlines like RyanAir, it still has to be presentable as it serves not only locals but
foreign travelers as well, for whom image of an airport may reflect an idea about the
country on the whole.
The author chose this topic due to several reasons. First of all, the idea was really
attractive to her as she is planning to continue her career in the field of air
transportation. Therefore working on this research might be helpful for understanding
the basics of airport’s operation as it is very large and complex enterprise. Another
reason was numerous complaints from her friends and acquaintances, who consider the
second terminal of Tampere International Airport as one of the most inconvenient they
have ever been to in Finland.
The main aim of the research is to find the ways of adapting the second terminal of
Tampere Airport to the needs of customers. Based on the results of customer
satisfaction survey, researcher aims to identify gaps in facility services of the terminal
and give suggestions concerning their improvement so that they look contemporary and
comfortable for travelers.
The objective of this research is to get to know whether the customers are satisfied with
the services offered by the airport. For this purpose, the level of customer satisfaction

7
has to be measured. Based on the results of the survey, possible problems related to
customer service will be identified. Furthermore, researcher attempts to find possible
solutions for these problems using theories which are applied to this research. These
solutions will serve as improvements for services offered in the terminal.
2.2 Theories and concepts
There are several theories that make a basis for this research. As the main goal for the
research is to define what is wrong in facility services and give some advices on how to
develop them, service improvement is identified as a main theory. Customer satisfaction
theory will help to understand what customers feel about facility services in the
terminal. Together with SERVQUAL method they are chosen for developing and
analyzing quantitative data that will be gathered by means of questionnaire. As airport
terminal facilities are examined in this research, theory which is somehow related to
terminal facilities operation and their appearance also play a significant role in the
research.
As for research concepts, they a bit differ from theories planned to be used. Reasoning
from research goal, customer satisfaction survey will be mainly directed at service
quality. However, service improvement and airport facilities act not only as a theories,
but concepts as well.
2.2.1 Service improvement and service quality
Service improvements are simply defined as changes in features of service that already
exists in the market. It tightly correlates with service quality. Enhancing a quality allows
to improve service itself. (Zeithaml, Parasuraman & Berry 1990, 9.)
However, service quality is not an easy thing to evaluate. The main actor in evaluating it
is a customer. Only he is a judge for the quality of service (Grigoroudis and Siskos
2010, 9). Therefore, knowing customer’s opinion is a key to company’s success. Due to
the process nature of service, customer has to evaluate not only the rendered service
product, but also a process of service delivery (Grönroos 2001, 47).

8
Obviously, service quality is an intricate phenomenon. To quote from Zeithaml,
Parasuraman and Berry (1990, 19), “service quality, as perceived by customers, can be
defined as the extent of discrepancy between customers’ expectations or desires and
their perceptions”. Reasoning from this notion, researchers claims that key factors that
affects customers’ expectations are word-of-mouth communications, personal needs,
past experience and external communications such as advertising and various
promotions (Zeithaml, Parasuraman & Berry 1990, 19).
Service quality has 10 important aspects that play an important role in its estimation
made by consumer. These dimensions are tangibles, reliability, responsiveness,
competence, courtesy, credibility, security, access, communication and understanding
the customer. And only five of these dimensions were included to the famous
SERVQUAL technique, which is described in chapter 2.2.3 in details. (Zeithaml,
Parasuraman & Berry 1990, 20-23.)
Grönroos states that quality enhancement has to be an ongoing process. That means
organization should always work on improving the quality of services offered to clients.
The constant quality enhancement benefits in increasing customer satisfaction, which
should be measured at regular intervals. (Grönroos 2001, 98.)
FIGURE 1: Customer Perceptions of Quality and Customer Satisfaction (Zeithaml,
Bitner & Gremler 2009, 103)
Service Quality
Product Quality
Price
Situational factors
Personal Factors
Customer Satisfaction
Customer Loyalty
Reliability
Responsiveness
Assurance
Empathy
Tangibles

9
FIGURE 1 reflects the correlation between service quality and customer satisfaction.
Being one of determinants of customer satisfaction, service quality is focused on service
dimensions, which are reliability, responsiveness, assurance, empathy and tangibles.
Customer satisfaction is more broadened notion that also depends on product quality,
price, situational factors and personal factors. (Zeithaml, Bitner & Gremler 2009, 103.)
2.2.2 Customer satisfaction
The main principles of continuous improvement require the development of a specific
customer satisfaction measurement process. In this way, any improvement action is
based on standards that take into account customer expectations and needs.
(Grigoroudis and Siskos 2010, 1.) Nowadays customer satisfaction survey is often used
in these purposes. Following research will be also conducted by means of this method
as author intends to identify problems, which are related to facility services offered in
the terminal, through determining customers’ opinion on service quality. Thereby,
customer satisfaction survey is an essential part of this research. And customer
satisfaction itself serves as a theory, which also will be implemented in this research.
“Customer satisfaction measurement is now considered as the most reliable feedback,
taking into account that it provides in an effective, direct, meaningful and objective way
the customers’ preferences and expectations” (Grigoroudis and Siskos 2010, 1). It is a
key to success for any kind of organizations. According to Asian Productivity
Organization (2000, 3), customer satisfaction is a function performance relative to the
customer’s expectation. In other words, customer is satisfied when he gets a little bit
more than he was promised to. Dissatisfaction with the service or product can be easily
defined as a failure to meet customer’s expectations and needs (Zeithaml, Bitner &
Gremler 2009, 104).
Apparently, the main goal of any organization is to satisfy each customer. However, it is
not an easy thing as every single person has his own idea of what is perfect customer
service. (Asian Productivity Organization 2000, 3.) For example, one will be satisfied
with plastic chairs to sit in while waiting for his flight in the waiting room, but another
needs a highly comfortable chair with a convertible seat. To all appearances, if the
organization wants to satisfy everyone, it has to take proper account of preferences of
those clients, who have higher level of expectations.

10
2.2.3 SERVQUAL method
The customer satisfaction survey will be conducted with the help of SERVQUAL,
which is an instrument for measuring service quality (Zeithaml, Parasuraman & Berry
1990, 23). In the current research it is certainly used in addition to customer satisfaction
theory and terminal design theory.
SERVQUAL method was developed by Zeithaml, Parasuraman and Berry. It is based
on 5 main dimensions of service quality. These dimensions are tangibles, reliability,
responsiveness, assurance and empathy (Zeithaml, Parasuraman & Berry 1990, 23-26).
Tangibles determine the attractiveness of facilities, equipment and materials used by the
company, also for personnel appearance. Reliability barely means that service is
carefully delivered to customer without any mistakes the first time in accordance with
all understandings. Responsiveness explains the willingness of service personnel to
provide a customer with prompt service by responding quite actively to his request.
Assurance is evidence of importance of trust and confidence that employees give to
client by convincing him of their professional skills and behaving politely. This brings
safety to a customer while he purchases a service. Empathy is company’s ability to
understand a need of each particular client by giving personal attention to him and
doing its best in order to answer to his request. (Grönroos 2001, 74-76.)
As it is based on 5 dimensions of service quality, SERVQUAL shows a discrepancy
between customers’ expectations and their experiences. These 5 determinants are
normally explained with 22 attributes. (Zeithaml, Parasuraman & Berry 1990, 33.)
Usually, questioner implements seven-point scale (from “Strongly Disagree” to
“Strongly Agree”) in the questionnaire, in which respondents are aimed to state their
opinion towards what they expected from the service and how this service was
performed at the end. Due to these determinants and attributes the overall service
quality score can be identified. Each service must be described with individual
approach. Therefore, it is not advisable to implement the original version of the
technique. It has to be customized in accordance with each particular situation in which
the service is performed. (Grönroos 2001, 76.)
SERVQUAL serves as a basement for questionnaire in this research. As the main
emphasis of the research is laid on facility services its questionnaire is chiefly based on
tangible dimension of model. All 22 attributes are not also used in the questionnaire.

11
They are replaced with special characteristics of terminal facilities that ensue from
terminal design theory.
2.2.4 Airport terminal and its facilities
It is a well-known fact that airport has a very complex organization. Its features must be
taken into account while carrying out research process. Thence it is fair to include
airport facilities to the theoretical part of this research.
As long as airport is a “business card” of the country, it has to look unforgettable and
even fabulous so that each user can take an advantage out of it. Those users can be
divided into 5 categories: passengers, airport personnel, airport administration, airline
companies and of course the country itself. (Edwards B. 2005, 130.)
An airport is a meeting ground and exchange point for people and goods arriving and
departing on a variety of air and surface vehicles having differing spatial and other
requirements. With the view of operational control airport is divided into 2 zones: air
side (AIR) and land side (LAND). (ENO Foundation for Transportation 1986, 53.) On
the assumption of international context, all airports can be divided into 3 categories:
gateway airports, regional international airports and domestic airports. Reasoning from
this classification, Pirkkala Lentoasema is a regional international airport.
Terminal is defined as a building that serves as an interface between AIR and LAND of
an airport. It operates mainly for air travelers and air load. Based on their function,
terminals are divided into 2 types: each airport has a passenger terminal and a terminal
for cargo. (ENO Foundation for Transportation 1986, 53.) Most terminal buildings
consists of six distinct territories on departure (entrance concourse; flight check-in and
information; shops, bars, restaurants; passport control; departure lounge and duty-free
shops; pier and gate to plane) and four territories on arrival (arrivals lounge, baggage
reclaim, customs and immigration control, exit hall) (Edwards B. 2005, 143).
Passenger terminal has 4 essential roles. It serves as a transport hub as people (for
example, from bus to plane). Then it checks and control passengers by means of ticket
check, customs and immigration control. Next its significant function is providing
passengers with different services, such as cafes, restaurants or duty-free shops. And at
12
the end it also organizes passengers in separate groups and makes them ready to start a
journey. (Edwards B. 2005, 131-133.)
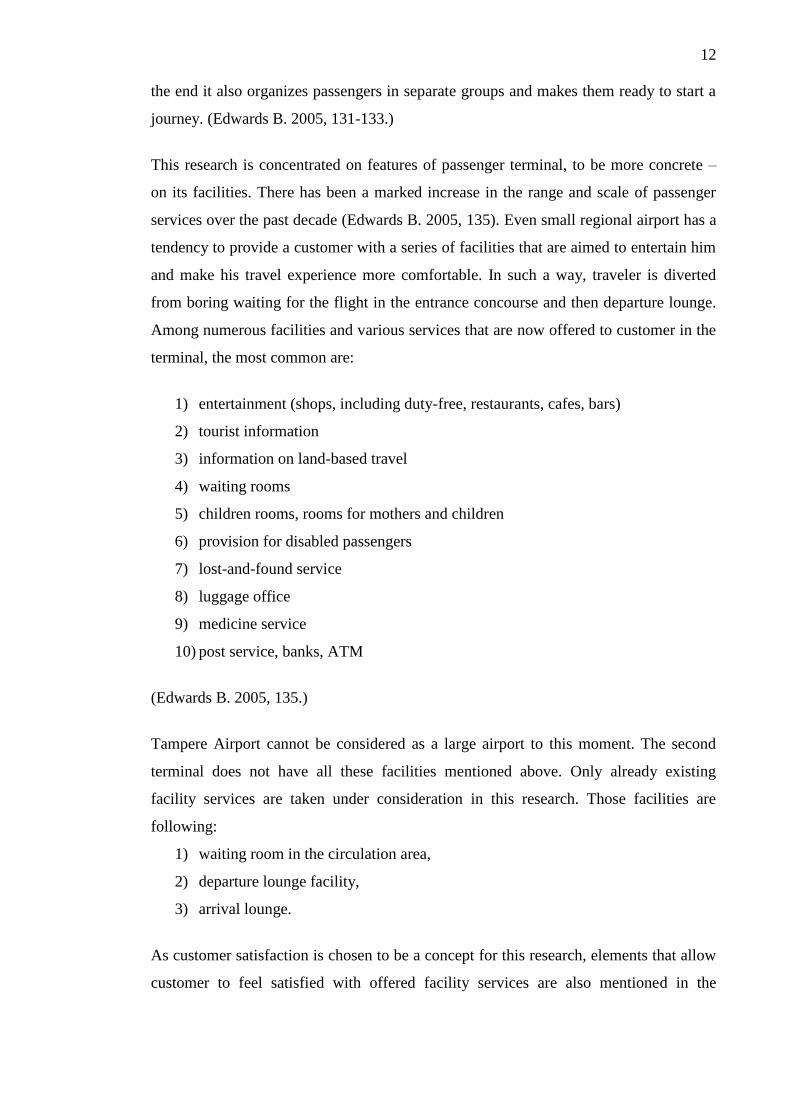
This research is concentrated on features of passenger terminal, to be more concrete –
on its facilities. There has been a marked increase in the range and scale of passenger
services over the past decade (Edwards B. 2005, 135). Even small regional airport has a
tendency to provide a customer with a series of facilities that are aimed to entertain him
and make his travel experience more comfortable. In such a way, traveler is diverted
from boring waiting for the flight in the entrance concourse and then departure lounge.
Among numerous facilities and various services that are now offered to customer in the
terminal, the most common are:
1) entertainment (shops, including duty-free, restaurants, cafes, bars)
2) tourist information
3) information on land-based travel
4) waiting rooms
5) children rooms, rooms for mothers and children
6) provision for disabled passengers
7) lost-and-found service
8) luggage office
9) medicine service
10) post service, banks, ATM
(Edwards B. 2005, 135.)
Tampere Airport cannot be considered as a large airport to this moment. The second
terminal does not have all these facilities mentioned above. Only already existing
facility services are taken under consideration in this research. Those facilities are
following:
1) waiting room in the circulation area,
2) departure lounge facility,
3) arrival lounge.
As customer satisfaction is chosen to be a concept for this research, elements that allow
customer to feel satisfied with offered facility services are also mentioned in the

13
theoretical part. More detailed theoretical description of these elements can be found in
Chapter 3.
Of course, departure and arrival lounges as well as entrance concourse are not the only
facilities in the terminal. There are also facility services that are provided by Airpro
(information desk, travel shop and café zone). However, they cannot be scrutinized
within this research.
2.3 Research questions
Research questions which are mentioned below were formulated on the basis of
research goals and objectives. The result of the research is aimed to answer several
questions. The main question, which became a reason for conducting a research, is
following:
How to improve and modernize the airport facilities in accordance with
customers’ needs?
There are also a few sub-questions that will help to obtain an answer to the main
research question. Those are:
What is customers’ opinion towards service quality in Tampere Airport
(Terminal 2)? Are they satisfied with these services?
What are the main issues related to customer service?
The answers for these questions will be found with the help of customer satisfaction
survey results and analyzed theories.
2.4 Research data
The empirical data will be gathered through conducting a customer satisfaction survey.
To make it clear, survey is a research strategy, closely associated with the deductive
approach, in which the researcher selects a sample of informants from a population and
administers a standardized questionnaire to them (Altinay and Paraskevas 2008, 81).

14
Customer satisfaction survey is aimed to obtain customer’s opinion about offered
services.
Consequently, questionnaire is used as a research technique. It is highly recognized as
an effective and affordable way of collecting data. “Researchers use a pre-determined,
structured set of questions to obtain information from a sample of respondents and
record it.” Questionnaire shows its high efficiency in gathering information when it is
needed to interrogate a large number of people. (Altinay and Paraskevas 2008, 120.)
No doubt that the most effective way of implementing the survey is right after the
service was perceived, while memories and feelings are still fresh in respondents’ mind.
But in this particular case completing questionnaires via face-to-face contact with
respondents in the terminal is quite time-consuming process as it is not so easy to catch
people while they leave an airport. Therefore researcher has decided to conduct online
questionnaire due to its quickness in completing. The process of completing
questionnaire by respondent himself is called self-administered (Altinay and Paraskevas
2008, 122). Online survey also belongs to this type of questionnaires.
Conducing survey in the Internet has forcible advantages over other kinds of
questionnaires. First of all, it is low-cost way to ask respondents’ opinion. Moreover,
online survey is able to attract more participants as respondents are not forced to answer
questions immediately. They can find appropriate time for completing the
questionnaire, which reduces chances to get incorrect answers. As for disadvantages,
online survey does not involve human contact. Therefore sometimes it is hard to
interpret an answer of respondents. It follows from this that all questions have to be
carefully composed. The instruction for questionnaire should intelligibly explain the
procedure of answering the questions. (Evans & Mathur 2005.)
The quantitative data collected with the help of questionnaire will be processed using
Microsoft Excel program. Pivot charts and tables will be used in order to create cross-
tabulation tables and charts.
Processed information will be later analyzed using theory and researcher’s reflection on
this research case. Conclusions concerning improvements are made by means of
analyzed results of customer satisfaction survey and theories used for conducting this
research.

15
2.5 Structure of the research
Chapter 3 introduces the case of current research. It provides more detailed information
about Tampere Airport and its second terminal in particular. Terminal characteristics
and customer satisfaction determinants are also presented in this part of the report.
Chapter 4 is devoted to the analysis of customer satisfaction survey results, which are
presented in figures. Data is analyzed by means of researcher’s own thinking and
research theory.
All the findings of customer satisfaction survey are summarized in Chapter 5. Based on
the results of questionnaire and theory, which is reviewed in Chapter 3, suggestions for
improvements for the facilities of terminal 2 are provided.
Chapter 6 serves as the conclusion for the entire work. It also includes researcher’s
recommendations and ideas for further research on given studied object.

16
3 TAMPERE AIRPORT, TERMINAL CHARACTERISTICS AND CUSTOMER
SATISFACTION DETERMINANTS
3.1 Introduction to Tampere Airport and Terminal 2
Tampere Airport (in Finnish: Pirkkaalan Lentoasema) is located in neighboring town
called Pirkkala, which is in 13 kilometers to southwest from the city center of Tampere.
It belongs to a state owned company Finavia. This chain operates 25 airports all over
the country. Tampere Airport is also a headquarters for Satakunta Air Command.
Thereby it is not only public airport, but military too. The first terminal is opened for
travelers every day from 05:00 till 01:30. However, the second terminal is opened in
accordance with the timetable of departure and arrivals. Basically, it opens only 2 hours
before flight. Following airlines are currently using Tampere Airport:
Terminal 1: Finnair, Flybe, airBaltic, SAS
Terminal 2: Ryanair (Finavia 2013.)
Talking about technical characteristics, Tampere Airport has only one runway, which
length is approximately 2700 meters and 45 meters in width, which is enough for all
aircraft types that an airport can accommodate. An airport elevation is 119 meters above
mean sea level. (Finavia 2012.)
FIGURE 2: Plan of Tampere Airport area (ФонтанкаFi 2013)
The history of Tampere Airport starts in 1936, when at first it was founded in Härmälä,
which is a district in Tampere. At that time it was used only for domestic fights
(Helsinki, Oulu, Kemi and Vaasa). First international flight to Stockholm was made
only in 50th
. In 1979 Tampere Airport changed the location. Since that year it has been
17
opened for travelers in Pirkkala. In 1997 Tampere Airport was voted the airport of the
year in Finland. (Finavia 2013.) From year to year airport is becoming one of the most
essential airports of the country by giving a possibility to its customers to travel by
popular low-cost airlines.
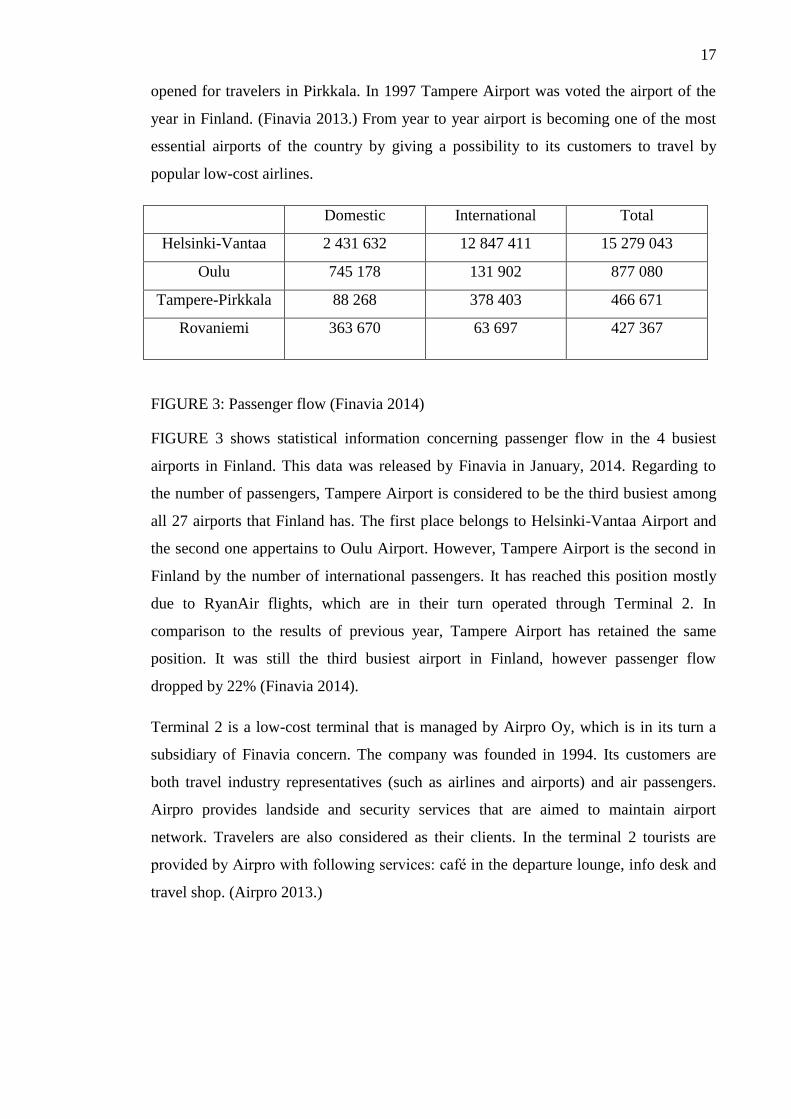
Domestic International Total
Helsinki-Vantaa 2 431 632 12 847 411 15 279 043
Oulu 745 178 131 902 877 080
Tampere-Pirkkala 88 268 378 403 466 671
Rovaniemi 363 670 63 697 427 367
FIGURE 3: Passenger flow (Finavia 2014)
FIGURE 3 shows statistical information concerning passenger flow in the 4 busiest
airports in Finland. This data was released by Finavia in January, 2014. Regarding to
the number of passengers, Tampere Airport is considered to be the third busiest among
all 27 airports that Finland has. The first place belongs to Helsinki-Vantaa Airport and
the second one appertains to Oulu Airport. However, Tampere Airport is the second in
Finland by the number of international passengers. It has reached this position mostly
due to RyanAir flights, which are in their turn operated through Terminal 2. In
comparison to the results of previous year, Tampere Airport has retained the same
position. It was still the third busiest airport in Finland, however passenger flow
dropped by 22% (Finavia 2014).
Terminal 2 is a low-cost terminal that is managed by Airpro Oy, which is in its turn a
subsidiary of Finavia concern. The company was founded in 1994. Its customers are
both travel industry representatives (such as airlines and airports) and air passengers.
Airpro provides landside and security services that are aimed to maintain airport
network. Travelers are also considered as their clients. In the terminal 2 tourists are
provided by Airpro with following services: café in the departure lounge, info desk and
travel shop. (Airpro 2013.)

18
PICTURE 1: The entrance to terminal 2 of Tampere Airport (Picture: Arja Niemi
01.03.2014)
All passenger concourses (entrance concourse, departure and arrival lounges) are on one
level. One exception is a departure zone, which entertainment part (travel shop and
cafe) is located on the first floor as it is depicted in FIGURE 3.
FIGURE 4: Plan of Terminal 2, Tampere Airport (ФонтанкаFi 2013)
First floor
Ground floor

19
Basically, information desk is located inside a relatively small premise. All needed
information that tourists always tend to receive might be found from here. Moreover, it
is a place to purchase small snacks and drinks to consume while waiting for a check-in.
Newspapers, magazines and small souvenirs are also offered for sale.
Café and a travel shop are waiting for passengers behind the passport control zone.
From here customers can order tea or coffee accompanied with small snacks such as
sandwiches or chocolate. Café has a right to sell alcohol drinks as well. Travel shop
offers a wide range of newspapers and magazines as well as Finnish souvenirs.
As it has already been mentioned above, RyanAir is the only company currently using
the second terminal. It is an Irish low-cost airline, which was founded in 1985.
Nowadays it is recognized as Europe’s only ultra-low cost carrier. Its fleet includes 303
Boeing 737-800 aircrafts, which seating capacity is 189 seats. Ryanair has worked in
Finland since 2003. It started flights to Tampere-Pirkkala in April 2003. (Ryanair 2013.)
Nowadays there are 10 destinations to choose the one from: flights to Budapest, Bremen
and London-Stansted are operated all year long and summer timetable is also valid for
flights to Alicante, Bergamo, Barcelona-Girona, Kaunas, Malaga, Palma de Mallorca
and Hahn. Travelers have also a possibility to fly by RyanAir from Lappeenranta.
However, merely 3 routes are available from Lappeenranta Airport: to Barcelona-
Girona, Milano-Bergamo and Düsseldorf-Weeze, which is seasonal.
Ryanair follows online check-in policy. This means that passenger must check-in online
15 days prior to 4 hours before scheduled flight departure time. Traveler arrives to the
airport with already printed boarding pass. Therefore passport and visas are only
documents that have to be shown to the check-in agent at the airport. (Ryanair 2013.)
The same rule concerning check-in process for Ryanair flights works in Tampere
Airport.
3.2 Entrance concourse, departure and arrival lounges
Entrance concourse can be also called a circulation area of the terminal. Circulation area
starts from the entrance to the building and ends before the check-in desk. This is a
place, which is shared by departing and arrived customers and general public. Pictures 3
and 4 just depict this facility of terminal 2.

20
PICTURE 2 & 3: The entrance concourse of terminal 2 (Pirctures: Arja Niemi
01.03.2014)
Circulation area has to be spacious enough as it has to accommodate large number of
people and also different activities spots. At the same time premises like ticket-sale
office or toilet should not block a visibility or passenger flow route. It is really
significant to design this facility with clear distinctions of different zones. So that
passengers and people, who came to the airport with some other purposes, can easily
find their way. (Edwards B. 2005, 139.)
The departure lounge is a terminal area which is located in airside concourse.
Consequently, it is an area where passengers spend their time after such procedures like
immigration, customs and security checks. Normally, this area is divided into three
zones: common departure lounge, gate lounge and transfer lounge. (Edwards B. 2005,
156.) In the most cases these zones are combined in one complex. Smaller terminals
such as Terminal 2 of Tampere Airport have only one common departure lounge.
Common departure lounge includes waiting rooms and different kinds of services that
are offered to travelers. Those services are normally following: bars, restaurants, cafes,
duty free shops, toilets and children zones. Stereotypically, departure lounge is
supposed to have quite much of natural light and good views over the airport area.
(Edwards B. 2005, 156.)

21
PICTURE 4 Departure lounge in the terminal 2 (Picture: Arja Niemi 01.03.2014)
As is customary, waiting halls in the departure lounge have to have at least 1m2 per each
passenger. And according to recommendations, departure lounge itself has to provide
traveler with 2 square meters of space. (Edwards B. 2005, 156.) These regulations are
given to prevent an area from crowding.
Arrival lounge is a space where passengers head to right after their plane lands. It is an
area where travelers gather for a short period of time. Basically, passengers pass
through immigration control here. And if airport is kind of small ones, this zone is also
used as a waiting room for those who need to reclaim their luggage. Right after customs
control travelers appear in arrival concourse (Edwards B. 2005, 98). It is worthy of
mentioning that in small regional airports arrival concourse is often combined with
entrance concourse.
3.3 Terminal characteristics
In terms of architecture, airports are all different. But there are some characteristics that
inhere in each terminal building. Functionality is one of the most essential qualities:
terminal has to be in operation so that its work can be evaluated at any time. As
travelers spend in the building some amount of time, they need to be entertained while
they are waiting for their flight. Thereby terminal space must be sensibly thought
through. All areas, where customer tends to appear, should be legible. Moreover,

22
terminal architectural design is advisable to be memorable for the customer, in other
words it should look aesthetic. This can be reached by using specific constructions and
finishes. Furthermore, terminal should have enough space for each person, who is
visiting it. It has to be comfortable and convenient not only for passengers, but for staff
and greeters as well. Safety and security issues are also important in this sense.
(Edwards B. 2005, 136.)
Stress was defines as one of the main problems passengers face in the airport. In order
to reduce it designers use special tips. First of all, terminals have to be constructed in a
way that brings a feeling of quietness to the overall atmosphere of the terminal
premises. Elements of nature such as flowerpots and natural materials in the interior are
also used in order to remove tension. In order to eliminate confusion and ambiguity,
terminal has to be spacious and equipped with special signs that help passenger to
orientate in the terminal space. Furthermore, the facility has to be well illuminated.
(Edwards B. 2005, 130.)
It is obvious that customers do not get fully satisfied with the overall level of offered
service if they do not feel secure. Therefore, security issue should be also well-
considered while creating terminal design. For example, big French windows that are
now included to the interior of almost each airport terminal are not only a trend in
terminal design but also a tool of airport security measures. By making premises lighter,
they allow security guards to take current situation under control. Moreover, closed
circuit television works much more effective with glazed walls.
There are 3 main tools that are now efficiently used for monitoring what is happening
inside and outside the terminal. Those are surveillance, space syntax and territoriality
(Edwards B. 2005, 170). Surveillance can be defined as closed observation or
supervision executed by patrolling guards or with a help of closed circuit television
(Dictionary.com 2014).
The main idea of space syntax theory is that people feel safe when the space they are is
occupied at optimum level. In case if it is overcrowded and vice versa under-occupied,
people tend to lose the feeling of security. Keeping terminal areas at optimum level of
space syntax is not an easy task to accomplish. It should be already taken into account
on the step of terminal architecture planning.

23
The same should be done with territoriality method. According to its aspects, even
passengers and staff should be involved in the process of monitoring the situation in the
area they are currently located in. Design of airport areas is also well-considered in a
way that it is easy for people to repulse deviant and anti-social behavior. (Edwards B.
2005, 170-172.) The security can be maintained in the highest level only when all these
elements are implemented.
In such complex buildings like airport terminal signage plays very essential role. As it
was mentioned above, passengers feel uncomfortable and stressed when they are lost on
their way. Even in a matter of small terminals signs are critical to the efficient terminal
operation.
In order to succeed in orientating in different facilities passengers should receive a
signal which is provided by well-placed signs and memorable physical elements. Here
come the rules for efficient signage placing:
Way-finding elements have to be blended with the terminal environment so that
passengers do not get distracted in vain.
The design of signage components should be accomplished in common style.
All way-finding characteristics have to be disjointed from elements of
advertising such as billboards and commercial posters.
Signs are meant to be placed in strategically considered positions.
(Landa F. 1997, 38.)
3.4 Passenger types
All people travel with different purposes. This is megascopically seen in any airport.
Some of those travelers are in business trip. These people always seem to be in a rush
carrying just small hand luggage. In contrast to businessmen, families are always
surrounded by heavy suitcases and move slowly from one spot to another. There are
also long-haul travelers, who tend to be tired after long flights, and transit passenger,
who are in a hurry on their way to connecting flight. Elder travelers, people in the
wheelchair, as well as mothers with infants are worthy of special attention. Each airport
must provide services that might be inquired by these categories of passengers.

24
Such variety of passenger kinds brings a challenge for terminal facilities. Terminal has
to be designed in accordance with needs of all passenger categories. As a matter of fact,
queues are one of the main reasons for customers to be dissatisfied with the airport.
Queues not only waste terminal space, but can also give a bad impression of the airport.
(Edwards B. 2005, 145-147.)
3.5 Customer satisfaction determinants
Apart from factors reflected in FIGURE 1, there are also few things which might affect
customer satisfaction on received service. For instance, personal factors such as
customer’s emotions may influence satisfaction (Zeithaml, Bitner & Gremler 2009,
105).
Product and service features very often serve as a determinant for customer satisfaction.
To put it more precisely, services features gives the impression, which customer later
estimates (Zeithaml, Bitner & Gremler 2009, 105). In airport facilities essential service
features might include waiting rooms comfort, cafes and restaurants, availability of
space for children, staff’s friendliness and efficiency and so on. Researchers claim that
customers of services often make compromises between different service features. For
example, client can turn the blind eye on quality of service in case if they were totally
satisfied with a low price for this service. However, it tightly depends on the service
type and its criticality. (Ostrom & Iacobucci 1995.)
Customer satisfaction does not always depend only on specific service features. It
might be also influenced by client’s emotional state. Good emotional state may
strengthen positive feelings about the service. On the contrary, consumer’s bad mood
can negatively affect service perception. Moreover, customer dissatisfaction is mightily
influenced by senses of anger, depression, guilt and humiliation. (Zeithaml, Bitner &
Gremler 2009, 104-105.)
As long as customer takes part in the process of service production, he is partly
responsible for the outcome of perceived service. Due to different attributions, which
are defined as the perceived causes of events, consumer evaluates the service even
before he gets it ready (Zeithaml, Bitner & Gremler 2009, 106). Sometimes it affects on
the overall perception of satisfaction. For example, customer might feel less displeased

25
if the flight is delayed because of the storm as this reason is external and cannot be
controlled by the airline. However, flight caused by the strike of airline employees is
another story. And customers feel quite dissatisfied on such way of service performance
as in this case airline has to do its best in order to take situation under control.
Unfair treatment of customers may bring a loss for business by causing customers’
dissatisfaction. Therefore it is really important to treat all customers equally.
Satisfaction on service is strongly influenced by a perception of fairness (Zeithaml,
Bitner & Gremler 2009, 105).
Furthermore, other people can also influence consumer satisfaction on service
(Zeithaml, Bitner & Gremler 2009, 106). For example, if traveler went for a trip with
somebody else, he will also take in account the opinion of a person, who accompanies
him in the trip.

26
4 CUSTOMER SATISFACTION IN TERMINAL 2 OF TAMPERE AIRPORT
The statistical information for the given research was gathered by dint of customer
satisfaction survey. Therefore researcher composed a questionnaire which was based on
research theory such as SERVQUAL technique (Zeithaml, Parasuraman & Berry 1990)
and specific requirements for airport terminal facilities (Edwards B. 2005). According
to researcher’s own experience, people do not tend to spend much time on answering
survey questions. Therefore only 15 questions were included to this particular
questionnaire, which fit to one webpage. As is customary, questionnaires normally
contain questions of different types. Therefore the research survey was comprised of 6
closed questions, 3 open questions, 3 scale questions and 1 dichotomous question.
The survey was logically divided into three parts due to their belonging to certain
topics. The first part of questionnaire comprehended 4 questions that were aimed at
define informants’ general attributes such as gender, age, country of residence and their
traveling preferences. The main goal of questionnaires’ second part was their relation
with the second terminal of Tampere Airport. It included just three questions which
could be also named as introductory questions to the main part of the survey.
Last 8 questions formed the backbone for the analytical section of the current research
as they were intended to collect the most essential data about respondents’ attitudes and
opinions towards terminal facility services. Most of them are based on peculiarities of
research theories. For example, scale questions were composed rest upon dimensions of
SERVQUAL. A special role was played by tangible dimension as it is tightly dealing
with appearance of facilities, which are evidently the main aspect of current research.
Open questions in the third part of survey were mainly aimed at inquiring people’s
suggestions how terminal facilities can be improved. It is always better to ask directly
from consumers than trying to find possible hints from theory as customers always
know what they want to obtain at the end.
Researcher chose online survey as the most appropriate alternative to questionnaires
completed via face-to-face contact. The survey was conducted on QuestBack website,
which is known as one of the most popular and reliable softwares for multichannel
feedback collection (QuestBack 2014).

27
The survey was opened for public on 14th
of January and close on 1st of February, 2014.
Right after it was released, link to the questionnaire was posted to different social media
websites (VK, Facebook, LinkedIn) and sent to certain groups of TAMK’s email
system. Target audience was approximately comprised of 1500 people. As a result, only
130 of them gave answers to offered questions. Consequently, the response rate was 8.6
per cent, which is acceptable taking into account a fact that not everyone from these
people was familiar with Tampere Airport services.
4.1 General information about respondents
As it is clearly seen from FIGURE 5 the majority of respondents are females (88
respondents). Only 42 men (32%) took part in the survey. As Blagoveshenskiy explains,
men are less active in participating in different kinds of surveys (Blagoveshenskiy
2009). All the more, the survey was held online, which gives a possibility to postpone
answering to questions. And it is morally easier to reject online survey than the one
offered via face-to-face contact.
FIGURE 5: Question 1: Gender of respondents
The pie chart represented below in FUGURE 6 deals with the age of respondents. It is
clearly seen from the chart that the biggest age group is people at the age of 18-24.
There were 69 informants (53%) who identified themselves as young people. 50
participants (38%) said that their age is on the interval from 25-34. The smallest number
Man
32%
Woman
68%
Gender

28
very presented by adult categories: 9 respondents at the age 35-44 (7%) and only 2
persons older than 45 (2%). There were no informants under 18.
FIGURE 6: Question 2: Respondents’ age
The reason why the great majority of respondents are young people is simple.
Questionnaire was promoted mainly in social networks which are used by researcher
and in the TAMK’s email system. Therefore most of the informants are at the same age
category with researcher.
FIGURE 7: Question 3: Respondents’ country of residence
0%
53,08% 38,46%
6,92%
1,54%
Respondents' age
Under 18
18-24
25-34
35-44
45-
0 20 40 60 80 100 120
Finland
Russia
Sweden
Hungary
Scotland
Lithuania
Italy
Germany
Turkey
Spain
Czech Republic
France
Netherlands
India
Country of residence

29
The next graph (FIGURE 7) illustrates the list of countries that respondents consider as
their abode. Finland (76% of respondents) evidently excels against other mentioned in
the table countries. This can be easily explained by the fact that questionnaire was done
by a person living in Finland and offered to people who live in Finland or used to stay
here for some period of time. And the clearest reason is location of the airport. As it is
located in Finland, great number of its users is definitely people who live in Finland.
Being on the second position Russia was recorded as a country of residence only by 13
persons (10%). It is explainable with 2 cases. First of all, survey was also posted in
Russian social network. Moreover, Russia is located next to Finland. Therefore people,
who live close to Russian-Finnish border, conceive a liking for traveling from Finland,
especially because of the low price for the flight tickets.
It is not a secret Ryanair offers flights from Tampere to Bremen and Budapest. That is
the main reason why the third place is shared by representatives of Germany and
Hungary (4 people from each country), for whom it is quite handy to take a direct flight
to Tampere as it is cheaper than going through Helsinki and no need to change means of
transport on their way.
FIGURE 8: Question 4: With whom you are normally travelling?
Results that are shown below in FIGURE 8 report the following facts. Most of the
respondents 41% are traveling on their own. The second largest number of respondents
36% has admitted that they prefer traveling with their friends. 29 participants (22%) do
not mind exploring the world with their family members. And only one person (1%)
41%
22%
36%
1%
Respondents' travel companions
No companions
Family
Friends
Colleagues

30
said that it is fine for him to travel with his colleagues. Despite the fact, that the
majority of respondents travel on their own or simply with friends, it is mistaken to
forget about other passenger categories as airport terminal must provide services for
each passenger group (Edwards B. 2005, 146).
4.2 Relation to Tampere Airport (Terminal 2)
This section of question results analysis is aimed to ascertain respondents’ relation with
the terminal. It includes 3 questions that deal with informants’ traveling history, their
last flight via Terminal 2 and reasons for choosing this route. Moreover, results analysis
of question, which is aimed to inquire customers’ future plans concerning traveling via
this terminal and cross-tabulation analysis were also included to this section.
According to showings in FUGURE 9, more than a half of informants (57%) have
traveled with Ryanair for more than 3 times. Other 22% has been traveled with Ryanair
and consequently used terminal services 2 times so far. Consequently there are factors
that keep customers choosing flying via terminal 2. Moreover it means these people are
well acquainted with terminal facilities and ready to provide weighted opinion to what
is happening there and how they are satisfied with its services.
FIGURE 9: Question 5: Number of trips via Tampere Airport (Terminal 2)
The rest of respondents were customers of the second terminal just once. However, even
their memories can serve as essential information for the current research. It is no less
22%
22% 57%
Just once
2 times
3 or more times
Number of trips

31
significant than knowing respondents’ traveling history, statistical information of which
is depicted in the subsequent table.
Straight line of time was divided into 7 intervals as it is possible to see in FIGURE 10.
Number of respondents grows steadily from year 2008 to year 2013. Superiority of year
2013 (66 respondents) is sharply defined in the graph. Most of the respondents had their
last trip with Ryanair via Terminal 2 of Tampere Airport at that period of time. 5
respondents recorded year 2014. This means more than a half of informants had quiet
fresh memories about their traveling experience with Ryanair, which is essential for the
research.
FIGURE 10: Question 6: Last time of traveling
Furthermore, there were quite many informants who traveled through terminal 2 in 2012
(30 people) and 2011 (20 people). And only 9 respondents had traveled in period
between year 2008 and year 2010 for their last time.
Reasoning from the results shown in FIGURE 11 it is clearly seen that the main reason
why respondents choose traveling via terminal 2 of Tampere Airport is low ticket cost.
Almost the half of informants chose this response category. The second reason is living
nearby the airport (41% of participants). That is quite obvious assuming that the
majority of respondents were residents of Finland and the questionnaire was promoted
mainly among people living in Tampere region. In addition some participants (5%)
mentioned that both cheapness of tickets and being a resident of Tampere area had
influenced on their decision. 2 people (1%) admitted traveling via this terminal was the
2 3 4
20
30
66
5
0
10
20
30
40
50
60
70
2008 2009 2010 2011 2012 2013 2014
Last time of Traveling N

32
best option for them at the time of planning the trip. 4% stated they had some external
reasons besides their personal ones.
FIGURE 11: Question 7: Why did you choose traveling with Ryanair via this airport?
Respondents’ answers to the penultimate question (FIGURE 12) the large number of
travelers (88%), who took part in the survey, avowed they will definitely use terminal 2
as a transport hub again and there is no matter for them how well facility services are
provided in the terminal. Only 12% of informants said they would never travel through
it again. It was inquired from open response part of the question (question 15) that half
of the rejecters have not planned to visit Finland anymore. This was the only reason for
them not to travel via terminal 2. Another moiety lives in Finland. The most common
reason for them is their preference to travel from Helsinki. However, some of them do
not mind to travel via terminal 2 of Tampere Airport if there is no better option.
Answer Count Percent 20% 40% 60% 80% 100%
1. Yes 115 88%
2. No 15 12%
Total 130 100%
FIGURE 12: Question 14: Are you thinking of choosing Tampere Airport (Terminal 2)
as a transport hub again?
41%
49%
5% 1%
4%
Tampere resident
Cheap tickets
Both
Best choice
Other
Reasons of choice

33
The rest of respondents basically repeated their answers to question 7. In most cases it
was mentioned again that the only reason why they were ready to choose Tampere
Airport (Terminal 2) anew was cheap flight tickets. It is explainable with the following
fact. First of all, the great number of respondents (91%) is young people at the age 18-
34. In this period of life people are studying somewhere or just beginning their career.
Therefore they tend to choose the cheapest options available as they always try to save
some money. They do not pay much attention to long queues to passport control desk
and condition of facilities.
Some respondents imparted that they are loyal customers of Ryanair services. Few of
them have never flown with any other airlines. They will keep flying with this airline as
long as the price for flight ticket is at least moderate in comparison to other airlines’
tariffs. For these people there are only 2 options: either flying from Lappeenranta or
going traveling from Tampere as Ryanair operates only in these airports.
Important criteria were also convenience of airport’s location and interesting routes
provided by Ryanair. The graph which is depicted below partly explains given opinion.
As it is clearly seen, most of the people, whose answer is ‘YES’, live in Finland. It is
quite opportune for them to travel via Tampere Airport despite of all possible
inconveniences.
FIGURE 13: Correlation between respondents’ countries of residence and their
willingness to travel via Terminal 2 of Tampere Airport again
0
20
40
60
80
100
120
No Yes
Country of residence/willingness to travel
again Turkey
Sweden
Spain
Scotland
Russia
Netherlands
Lithuania
Italy
India
Hungary
Germany
France
Finland
Czech Republic

34
In most cases, representatives of other countries answer ‘YES’ too. Direct flights to and
from Germany, Hungary, Italy and Spain (during summer season) keep customers
choosing traveling with Ryanair. Even though some of them admitted it was not cheaper
than going via Helsinki-Vantaa Airport.
According to customer satisfaction theory, consumer satisfaction can be affected by his
companions, who accompany him in a trip (Zeithaml, Bitner & Gremler 2009, 106).
However, in the case of given research such tendency is not traced. Results depicted in
FIGURE 14 prove this note.
FIGURE 14: Correlation between respondents’ preferences in choosing companions for
traveling and their willingness to travel with Ryanair via Tampere Airport again
Most of the respondents are willing to travel through terminal 2 and their decision is not
virtually influenced by people, who travel together with them. Only 8 out of 77
informants, who mentioned their preference to travel with colleagues, their family or
friends, do not want to travel via Tampere Airport anymore. Most likely, these 8
rejecters have other more significant arguments for their standpoint.
Consequently, choosing traveling via terminal 2 of Tampere Airport has two ponderable
advantages. First and the main plus is moderateness of flight ticket prices. It is cheaper
(or at least not more expensive) than going through Helsinki. The second advantage is
its convenience for Tampere region residents and people, who live nearby airports that
are connected with Tampere Airport due to routes availability.
From all thoughts expressed above, the following conclusion can be made: terminal
facility conditions do not influence on decision-making process. This conclusion
7 3 5
46
1
28
40
0
10
20
30
40
50
60
Alone Colleagues Family Friends
Yes
No

35
confirms customer satisfaction theory: people make compromises between different
service features (Ostrom & Iacobucci 1995). As the price for the ticket is low they do
not care about services provided in the terminal. And people choose airline and its
services at first, not a terminal they leave from or depart to. However, the majority of
respondents admitted that they want terminal to look in appropriate way, which means
its facilities need to be renovated a bit.
4.3 Customer satisfaction on terminal facilities
As it was explained above, level of customer satisfaction on terminal facilities is
identified with the help of SERVQUAL scale and requirements that are set for efficient
operation of terminal facilities. Satisfaction on facility services in entrance concourse,
departure and arrival lounges is analyzed in accordance with tangible dimension of
SERVQUAL model and terminal design theory. The overall level of facility services is
also decomposed in the present part of the research.
Tangible dimension of SERVQUAL determines the attractiveness of physical facilities,
equipment and materials used by the company to provide customer with the service,
other customers in service facilities and personnel appearance (Grönroos 2001, 74-75).
In order to evaluate the level of customer satisfaction in the terminal facilities several
parameters are used and those are comfort and convenience, cleanness, facility’s
interior, size of facility, orientation signs and safety.
NB! To avoid redundancy of description, results of survey concerning observable
facilities are combined into joint graphs. For the same reason, all the numbers are
presented on average in this section whereas exact relationships between table elements
are presented in figures.

36
FIGURE 15: Comfort and convenience of the terminal facilities
Comfort and convenience is one of the most important parameters in question of
consumer satisfaction on facility services. Traveling can be sometimes quite stressful.
During intervals between changing means of transport people tend to take some rest.
Therefore waiting rooms in the airport terminal have to favor customers’ state of
composure. (Edwards B. 2005, 136.) Such things like comfortable seats can help
travelers to feel more relaxed before and after the flight.
Customer satisfaction on convenience and comfort in terminal facilities is expressed in
FIGURE 15. Despite the fact, that 88% of respondents are willing to travel via terminal
2 again, the level of dissatisfaction on convenience in the terminal facilities is quite
high. Almost a quarter of respondents are completely dissatisfied and 35% are more or
less displeased with this parameter. 32% of participants evaluate the convenience of
terminal facilities as average. The number of satisfied customers is not sufficient: only
9% are rather satisfied or highly satisfied. And the most inconvenient concourse is
departure lounge – for 63% of all 130 informants it does not correspond with a concept
of comfortableness. The average score for convenience in terminal facilities is 2.3 on 5-
point rating scale, which is apparently not good.
3% 5%
32%
38% 21%
3% 7%
27%
38% 25%
2% 7%
37% 29%
25%
0%
5%
10%
15%
20%
25%
30%
35%
40%
45%
highly
satisfied
somewhat
satisfied
average somewhat
dissatisfied
dissatisfied
entrance concourse
departure lounge
arrival lounge
Comfort and convenience

37
FIGURE 16: Cleanness in the terminal facilities
FIGURE 16 illustrates customers’ perception of cleanness in the terminal facilities.
Cleanness is one of constituents of physical appearance of service. It can also greatly
affect on overall customer’s perception of service provided by a company. (Grönroos
2001, 74.) People often do not feel comfortable in places that are not cleaned in an
appropriate way. And it is usually hard to retain customers who are discontented with
untidy premises where service is performed.
The situation with cleanness (FIGURE 16) is evidently better than with convenience of
these premises. The average score is 3.09. Opinions of respondents are mixed enough.
Nearly 41.5% of participants admitted that cleanness of facilities is at customary level.
A bit more than a quarter of respondents are roughly satisfied with this parameter. There
were also customers (18%), who consider level of cleanness as quite poor. Nearly 7%
are totally dissatisfied with it as well as other 7% are highly satisfied.
Interior of the premises also plays a role of no small importance. Well-planned interior
that includes well-considered combination of all its elements can create a good
impression on customers (Zeithaml, Bitner & Gremler 2009, 105). This positive
impression can also influence an overall perception of service.
8%
28%
40%
18%
6% 7%
28%
42%
15%
8% 5%
25%
41%
20%
8%
0%
5%
10%
15%
20%
25%
30%
35%
40%
45%
highly
satisfied
somewhat
satisfied
average somewhat
dissatisfied
dissatisfied
entrance concourse
departure lounge
arrival lounge
Cleanness

38
FIGURE 17: Interior of the terminal facilities
The data obtained from FIGURE 17 determines the level of satisfaction with facilities’
interior. And again the results establish a fact that customers are displeased with state of
interior in the terminal. Only 3% of respondents are totally satisfied and 12% are fine
with it. Other informants’ opinion fluctuates between average, more or less dissatisfied
and totally dissatisfied. Showings of arrival concourse interior look a little better than
showings of departure lounge and entrance concourse. It is explainable by a fact that
people tend to escape from arrival lounges as fast as they can whereas they spend quite
much time in entrance concourse and departure lounge while waiting for their flight
(Edwards B. 2005). Therefore they do not have so much time for concentrating on
interior appearance in arrival lounge. The average score for state of interior in the
terminal facilities is 2.26. This result leaves much to be desired.
The problem of spaciousness is quite acute when it comes to such public places like
airport terminal. In any cases public areas in terminal have to be roomy enough to fit a
certain number of people: passengers, greeters and airport personnel. Limited space can
cause customers’ discontent wholly easily. (Edwards B. 2005, 136.)
2% 7%
27%
35%
28%
4%
10%
24%
35%
28%
3%
8%
34%
28%
27%
0%
5%
10%
15%
20%
25%
30%
35%
40%
highly
satisfied
somewhat
satisfied
average somewhat
dissatisfied
dissatisfied
entrance concourse
departure lounge
arrival lounge
Interior

39
FIGURE 18: Size of facilities
FIGURE 18 illustrates the evaluation of terminal premises size. Graph gradually rises
and at the point of ‘somewhat dissatisfied’ reaches the maximum. 38% admitted they
are more or less dissatisfied and 31% was totally dissatisfied with the size of entrance
concourse. 37% did not like the level of spaciousness in the departure lounge and 33%
was correspondingly displeased with it. Thereby, it is logical to infer that respondents
are not satisfied with the size of premises. Only a small part of respondents (3%)
estimates their satisfaction at a high level. 8% claimed they were rather satisfied than
not. The average score for the spaciousness in the terminal facilities is 2.16. According
to informants’ opinion, most cramped facilities are entrance concourse and departure
lounge. Showings of arrival lounge are just a bit better in graph. This small advantage
over other facilities is clarified by the same reason as in the analysis of the previous
parameter. People do not spend much time in arrival lounge. Therefore they do not pay
much attention on surroundings and facility conditions.
Safety is located on the second level of well-known hierarchy of needs that was
developed by Abraham Maslow (Kotler & Keller 2012, 183). People do not get fully
satisfied with the service if they do not feel safe at the moment when service is being
performed (Zeithaml, Bitner & Gremler 2009, 105). Therefore safety is included to the
list of parameters that may affect customers’ perception of service and hence their
satisfaction on it. FIGURE 19 just represents informants’ reflection on safety in the
terminal facilities.
3%
8%
19%
38%
31%
3%
8%
19%
37% 33%
4% 8%
25% 31% 32%
0%
5%
10%
15%
20%
25%
30%
35%
40%
45%
highly
satisfied
somewhat
satisfied
average somewhat
dissatisfied
dissatisfied
entrance
concourse
departure
lounge
arrival lounge
Size of facilities

40
FIGURE 19: Safety in the terminal facilities
Results show that there is no well-defined tendency among respondents concerning their
attitude toward safety in the terminal. Relatively small group of respondents (5%) is
strongly dissatisfied with it. 14% are kind of dissatisfied. And the same number of
people (14%) is conversely totally satisfied. 34% admitted they are more satisfied with
the matter of security than not. 33% evaluates it as average. The average score for safety
and security in the terminal facilities is 3.36. This showing states safety matters are
more or less ordinary in this case.
Customer satisfaction theory explains this result by external and internal features that
somehow affect customers’ perception of security in the terminal (Zeithaml, Bitner &
Gremler 2009). One reason might be a stereotype that Finland is one of the safest places
in the world and there is nothing here to be afraid of. So when outbound tourist visits
Finland, he already knows that everything in Finland is safe. Thus his satisfaction on
security might be deliberately influenced by word of mouth. Another weightier reason,
that might influence customers’ perception in this case, is the size of terminal premises.
As there is not so much space provided, customers can control the situation themselves
in addition to personnel, whose duty is to monitor what is happening inside and outside
the terminal.
Orientation signs are absolutely must-have elements of any type of terminals. Even in a
matter of small terminals signs are critical to the efficient terminal operation. Passengers
15%
35%
31%
13%
5%
16%
32%
33%
15%
4%
10%
33%
35%
15%
6%
0%
5%
10%
15%
20%
25%
30%
35%
40%
highly
satisfied
somewhat
satisfied
average somewhat
dissatisfied
dissatisfied
entrance concourse
departure lounge
arrival lounge
Safety

41
feel uncomfortable and stressed when they are lost on their way. (Edwards B. 2005,
130.) Any problems related to use of signage may influence on customers’ satisfaction.
FIGURE 20: Orientation signs in the terminal facilities
As it is visible in FIGURE 20, the results are allotted in a similar way as ones
concerning safety matter in the terminal. The average score is 3.26 on 5-point rating
scale like it was counted in all previous sets. 38% of informants assessed orientation
signs at average level. Results also show considerable number of satisfied customers
(30%) and customers that are highly satisfied (12%). However, 13% left discontented
with the state of orientation signs. Furthermore, 7% are totally dissatisfied. Thereby
there is no consensus of opinion in this question as respondents have different various
thoughts about use of orientation signs in the terminal. Although it is possible to assume
that level of satisfaction on orientation signs converges to average. The difference
between the facilities in terms of efficient orientation signs use is not that noticeable.
And again as in the analysis of preceding parameters the best showings belong to arrival
lounge. It can be accounted by the notion that arrival lounge is a facility with the only
direction that everyone follows whereas departure and entrance lounges are bigger
premises where people have more area to circulate.
It has to be mentioned that even though orientation signs and security showed better
results than other parameters they are still need to be well considered in the process of
renovation the terminal.
15%
27%
38%
14%
6%
12%
28%
38%
13% 8%
9%
35%
37%
12% 8%
0%
5%
10%
15%
20%
25%
30%
35%
40%
45%
highly
satisfied
somewhat
satisfied
average somewhat
dissatisfied
dissatisfied
entrance concourse
departure lounge
arrival lounge
Orientation signs

42
In addition questionnaire contained a question that was aimed to inquire into the overall
level of satisfaction on terminal facilities. By answering to this question respondents
gave a grade to the facility service which was performed in the terminal. The results are
illustrated in the pie-chart below.
FIGURE 21: Question 11: Overall level of satisfaction
As it is visually shown in the FIGURE 21, the biggest group of respondents (44%)
evaluated their satisfaction on terminal facilities at average. These results adequately
correspond to the results of analysis of terminal facilities in terms of different
parameters. A quarter of respondents admitted that in their point of view facility
services are bad. This also agrees with the results mentioned above as there were quite
many negative responses on various facility characteristics. However, other informants
stated their satisfaction on facility services as good (24%), very good (6%) and excellent
(less than 1%).
There was an additional question for those whose answer was ‘BAD’. It was asked in
order to get to know the reasons why they left disappointed about terminal facilities
service. These reasons are presented in FIGURE 22 below.
1%
6%
24%
44%
25%
Overall level of satisfaction
excellent
very good
good
average
bad

43
Reasons N of respondents
lack of space 13
old-fashioned 12
uncomfortable 9
no entertainment 7
dirty 4
everything is BAD 3
unfriendly staff 3
issues with Ryanair 2
no sings 1
FIGURE 22: Question 12: Respondents explanation of their dissatisfaction
And again results agree closely with all the results which were previously introduced.
According to givens from FIGURE 22, the most acute cause of customers’
dissatisfaction is lack of space in the terminal facilities that are used by passengers. As
respondents states this problem especially appears when people start queuing to the
passport control desk thereby they occupy almost all available space of entrance
concourse. Another strong factor is terminal overall appearance. Participants are totally
displeased with its old-fashioned design. Some of them stated they had a feeling that
ceiling and walls would collapse, which apparently made them perceive unprotected.
There were quite many reasons which were all combined to joint one named ‘lack of
convenience’. Inconvenience of terminal facilities makes an atmosphere stressed which
definitely affects customer satisfaction (Edwards B. 2005, 130). Terminal facilities have
problems with offering comfort for its customers. In particular there is lack of seats in
the waiting rooms. Moreover, seats that are offered are not comfortable enough. During
winter time passengers feel cold whereas during summer it is quite hot inside building.
Therefore customers are complaining about bad air-conditioning and heating systems in
the terminal. One person was dissatisfied with lack of orientation signs. The issue of
cleanness was expressed in this section as well. According to respondents’ point of
view, the most neglected and unclean place is WC, other common areas do not look
cleaner though.

44
Few respondents could not state definite reasons. Other causes were not really related to
the case of current research. However, they were named by respondents as reasons of
their dissatisfaction it is quite logical to mention them here as well.
2 persons had problems related to Ryanair customer service. This is external factor that
influences customers’ emotional state and thereby their overall perception of service
(Zeithaml, Bitner & Gremler 2009, 104-105). 3 informants were not satisfied with the
personnel attitude as they stated terminal staff is often unfriendly to customers.
Personnel appearance and attitude are also included to tangible dimension of
SERVQUAL model (Grönroos 2001, 74-75). However, it was not allowed by terminal
authorities to include this parameter to survey.
Furthermore respondents are dissatisfied with lack of entertainment in the terminal.
Even though, café and travel shop are individual facilities that are not included to this
particular research, few comments are to be mentioned here. Concerning these facilities
participants are mainly dissatisfied with the scanty offering of goods, which are in their
opinion overpriced. Some of them are missing duty free store in the terminal.
The tendency of the whole rating section claims that customers incline to be rather
dissatisfied with facility services in the terminal. The most problematic parameters that
customers are most concerned with are identified in this section. Those are lack of
comfort and convenience, extremely limited space in the common areas and a need of
upgrading these facilities. However, showings of other parameters were not adequate
enough. Therefore all the issues related to cleanness, safety and orientation signs are to
be obviated as well.
4.4 Improvements in terminal facilities
All the suggestions of survey participants are readily apparent from the results which
are introduced above. Answers given by respondents totally correspond to their
reflection concerning satisfaction on terminal facility services. FIGURE 23 combines all
the ideas that are suggested by respondents.

45
Things to be improved N Other suggestions N
More space 46 Parking machine 1
Cleanness 6 Trainings for staff 6
More comfort 16 Café assortment and prices 8
More Seats 26 Duty free store 8
Wi-Fi 2 Equipment upgrading 2
Interior & Exterior 27
Floor 2
Walls 11
Light 6 Terminal to be rebuilt 16
Finishes 4
Lockers for luggage 2 No need to renovate 8
Signage and directions 5
Queue issue 7
Playground for children 1
FIGURE 23: Question 13: Improvements in the terminal
As outcome of customer satisfaction survey shows, size of facilities is the most acute
problem in the terminal. 46 respondents suggested making all public areas larger.
Especially it applies to entrance concourse and departure lounge as those are places
where people wait for their flight and queue. Informants state that situation gets even
more escalated during high season. Some people complained about irrational queues
that tend to be in the entrance concourse and departure lounge. Therefore it was
suggested that personnel should control the process and organize queuing people in a
way that they do not congest the entire area. Another problem which often leads to
bustle and confusion is lack of clarity concerning orientation signs. Particularly it refers
to explicating directions. One person wants exit sign from arrival lounge to be more
visible. It is also a need of indicator panel that shows arriving and departing flights in
real time.
Furthermore, quite many respondents suffer from lack of comfort in the terminal
facilities. One of the most frequent pretensions is scanty of seats in the waiting areas.
People suggest removing all totally uncomfortable and hard chairs by replacing them
with more modern options that can offer a high level of comfort even for extended
periods. Few respondents admitted they had problems with Wi-Fi connection in the
terminal. So they want Internet service to be improved as well. It has been already
mentioned that people cannot feel comfortable in untidy and negligent environment.
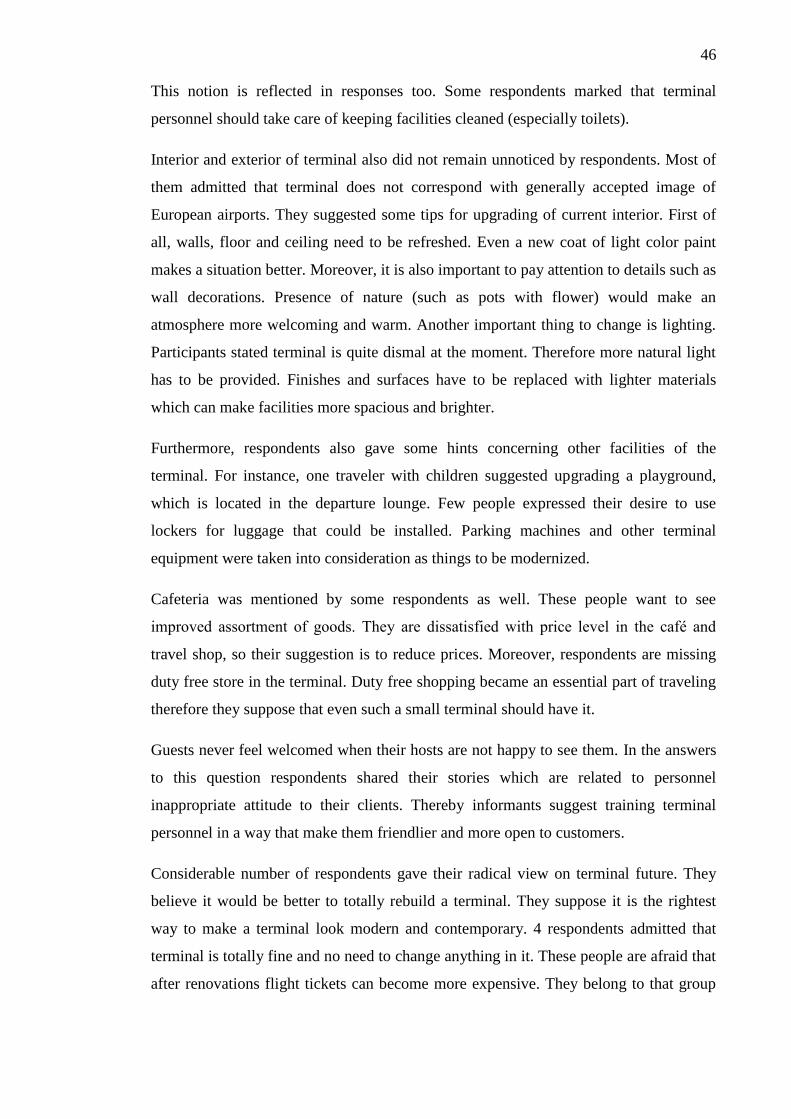
46
This notion is reflected in responses too. Some respondents marked that terminal
personnel should take care of keeping facilities cleaned (especially toilets).
Interior and exterior of terminal also did not remain unnoticed by respondents. Most of
them admitted that terminal does not correspond with generally accepted image of
European airports. They suggested some tips for upgrading of current interior. First of
all, walls, floor and ceiling need to be refreshed. Even a new coat of light color paint
makes a situation better. Moreover, it is also important to pay attention to details such as
wall decorations. Presence of nature (such as pots with flower) would make an
atmosphere more welcoming and warm. Another important thing to change is lighting.
Participants stated terminal is quite dismal at the moment. Therefore more natural light
has to be provided. Finishes and surfaces have to be replaced with lighter materials
which can make facilities more spacious and brighter.
Furthermore, respondents also gave some hints concerning other facilities of the
terminal. For instance, one traveler with children suggested upgrading a playground,
which is located in the departure lounge. Few people expressed their desire to use
lockers for luggage that could be installed. Parking machines and other terminal
equipment were taken into consideration as things to be modernized.
Cafeteria was mentioned by some respondents as well. These people want to see
improved assortment of goods. They are dissatisfied with price level in the café and
travel shop, so their suggestion is to reduce prices. Moreover, respondents are missing
duty free store in the terminal. Duty free shopping became an essential part of traveling
therefore they suppose that even such a small terminal should have it.
Guests never feel welcomed when their hosts are not happy to see them. In the answers
to this question respondents shared their stories which are related to personnel
inappropriate attitude to their clients. Thereby informants suggest training terminal
personnel in a way that make them friendlier and more open to customers.
Considerable number of respondents gave their radical view on terminal future. They
believe it would be better to totally rebuild a terminal. They suppose it is the rightest
way to make a terminal look modern and contemporary. 4 respondents admitted that
terminal is totally fine and no need to change anything in it. These people are afraid that
after renovations flight tickets can become more expensive. They belong to that group

47
of people who do not need good quality of service till the price for this service is low or
acceptable for them.
There is also essential to understand that each age group might have some specific
requirements to facility services. To get to know these distinctions of preferences
information about age, gender and respondents’ personal suggestions for improving
terminal facilities are to be compared. As question 13 is open-response question, it is
interpreted in a bit different way in comparison to interpretation in FIGURE 23.
Space Interior Seats Comfort Cleanness Other
Man 9 12 8 3 1 19
18-24 2 6 4 1
6
25-34 5 4 4 2 1 9
35-44 2 2
3
45-...
1
Woman 37 38 18 13 5 17
18-24 21 25 10 9 4 10
25-34 14 13 6 3 1 7
35-44 1
2 1
45-... 1
Grand
Total 46 50 26 16 6 36
FIGURE 24: Correlation between respondents’ age (question 2), gender (question 1)
and their advices (question 13)
The difference in needs and wants of various age and gender groups is shown in cross-
tabulation report in FIGURE 24. Women and men have a bit different requirements.
Knowing that men were only one third of all people who participated in the survey,
several notions cannot retain unnoticed. Women are especially concerned more about
cleanness in the terminal. Space, interior and comfort are also important factors for
them. For men’s part, they are more interested in concomitant factors that are
marginally related to appearance of facilities. These factors are combined in section
‘other’, which include things like improvements of food and beverage assortment, new
machines and equipment in the terminal, personnel trainings, availability of duty free
store, and lockers for luggage, etc. New and comfortable seating places are equally
needed to both men and women.
As for age groups, it is hard to define the difference as most of the respondents are
young people at the age of 18-24. Comparing age groups 18-24 and 25-34 huge

48
differences in their requirements were not defined. Numbers presented in FIGURE 24
more or less correspond to percentage correlation which is illustrated in FIGURE 6.
Consequently, these two are groups have rather the same requirements for terminal
facilities. To assess the needs of other age groups, more correct sampling has to be
made in the process of data collecting.

49
5 SUMMARY AND SUGGESTIONS FOR IMPROVEMENTS
5.1 Summary of the survey
Customer satisfaction survey is in the core of importance for the current research. By
means of questionnaire researcher obtained information about problems which are
related to customer service in the terminal facilities. Based on the results of this survey
suggestions for developing terminal facilities are introduced.
There were some changes in the research conducting process. They were made due to
policy of terminal authorities. It was initially planned to choose entrance concourse,
departure lounge, travel shop, café and info-desk as under-researched facilities.
However, the final list of facilities included entrance concourse, departure lounge and
arrival lounge. Therefore it was decided to replace face-to-face questionnaire with
online survey as it would not be possible to collect needed number of answers in a short
period of time.
The great majority of survey participants are female (68%). The biggest group of
respondents is at the age of 18-24 and the second biggest is between 25 and 34 years
old. Consequently the survey mostly reflects the opinion of young people. Residents of
Finland were presented in a majority and as survey results showed most of them were
from Tampere region. 10% of respondents were from Russia. Representatives of other
counties were evenly distributed. It was a bit surprising to get to know that most of the
people prefer to travel alone. The number of respondents who travel with their friends is
just a bit smaller though.
Informants are active travelers as a half of them admitted that they have already traveled
more than 3 times via terminal 2 of Tampere Airport. Few people asserted they are loyal
customers of Ryanair and have never chosen any other airline company to travel with.
Respondents’ travel history stated that most of them traveled from terminal 2 in 2013
for the last time. This means their answers are more or less correct as their memories
about the last trip are still fresh in their mind. There were two main reasons why people
choose traveling via terminal 2: it was either explained by low cost of flight tickets or
by the fact that Tampere is their place of residence. 88% answered ‘YES’ in a question
which was aimed to determine how many of them are willing to travel via terminal 2
again. As an explanation most of them avowed they do not pay much attention to

50
terminal facilities conditions until the flight ticket is affordable for them. Researcher
clarifies this occurrence by the age of respondents (most of them are young people) and
their place of residence (Tampere region). However it was mentioned people do not
want tourists from other countries to see terminal in a current condition as airport is like
a cover page of the book which does not tell a lot about content but has to look
attractive.
Questionnaire was based only on tangible dimension of SERVQUAL scale as the main
reason for this research was to identify problems in facility services of terminal 2. And
appearance of facilities belongs exactly to tangible dimension. Overall level of customer
satisfaction on facility services was estimated by respondents as average. It is worthy to
notice that this level was rather fluctuating between ‘average’ and ‘bad’ throughout the
entire rating section. Safety was the only parameter customers were more or less
satisfied with, although this showing smoothly tends to change into average. Cleanness
was rated fair. Rationality of orientation signs placement was not good but not bad as
well.
The highest level of dissatisfaction was given to following parameters: comfort of the
facilities, its size and interior. Size of premises got the lowest score, which means it is
the most acute gap. In open questions respondents explained their pretensions to these
characteristics of terminal facilities. Moreover they gave some useful tips for facility
improvements which are supposed to be made in the future. These hints are included to
the following chapters.
Based on the showings which are presented in chapter 4.3 facility services in the arrival
lounge are performed better than in the entrance concourse and departure lounge.
Reason for this notion is quite obvious: people spend more time in the waiting rooms
therefore they are more concerned about their comfort stay in the entrance and departure
concourses.
5.2 Suggestions for terminal facilities
Entrance concourse and is an area which tends to be most crowded as it is opened for
each group category: travelers, general public and personnel. Lack of space is clearly
seen here. It was proved by respondents’ answers to survey. Enlargement is normally
envisaged in modern terminals. Terminal 2 of Tampere Airport was built 35 years ago.

51
And probably it is not adapted for possible enlargement of its building. However, the
problem of space can be solved in another way.
Issues can be also successfully removed by following easier method. First of all, space
should be clarified. Waiting area is ridiculously split by passport control area into two
sections. It is better to keep them more separated though. Therefore space has to be
exempted from totally useless things. It mostly refers to tape barrier, which starts
straight from the entrance to the terminal. This trick can help to provide people with a
feeling of clarity, especially for those who enter terminal for the first time. Moreover,
few stands that occupy significant part of waiting area are never used as well. It is
worthy to remove them because this space can be efficiently used by passengers who
wait for control procedures there.
According to Ryanair’s policy, there is no need to arrive 2 hours before departure as
check-in is usually made online. However, most of the tourists ensure from possible
unpleasant circumstances and arrive to the terminal beforehand. Furthermore, Tampere
Airport is popular among Russian tourists who spend at least 6 hours in order to get to
Tampere. Besides this all the control procedures and flight itself might be quite stressful
for some people. Therefore all these people should be provided with comfort and feeling
of calmness before their flight.
In order to turn entrance concourse into a comfortable place to spend time in not so
many things are needed. Most of the respondents beg to replace chairs with more
contemporary and cozy ones. It is also significant to add more seating place to this area
as now there are approximately 20 seats for 189 passengers that can be accommodated
by Ryanair’s aircrafts. World of technology claims to install certain number of sockets
which allows travelers to charge their devices before the departure. Some informants
were complaining about Wi-Fi operation. They stated Wi-Fi does not work well when
big number of passengers connects to it.
In addition, there is a need to install special monitor that will show all the departures
and arrivals. Nowadays, it is only installed in the first terminal. It is not convenient to
check information there when flight is from or to the second terminal. The monitor has
to be hung to the wall in a visible place. A corner in the waiting area would be the best
position for it.

52
Survey has shown that problems of the departure lounge are quite similar to those that
entrance concourse has. The main reasons of customer dissatisfaction on departure
lounge are limited space and scanty seats. There are no difficulties in just adding more
chairs to the waiting room. But in order to make more space where no one would feel
constrained an extension to departure lounge has to be built. There is no possibility to
enlarge an area without making special constructions.
For the convenience recharge station can be installed here as well because passengers
always seek for a place where they can charge their phone batteries and laptops.
Children’s playground could be updated too. For example, it might be designed in style
of Angry Birds game. It is a good opportunity to remind that this worldwide popular
game was created in Finland.
Problem of space is also acute in arrival lounge. By making one joint extension to the
side, which is in front of aerodrome, both arrival and departure lounges get additional
space. Other suggestions for arrival concourse are related to upgrading of interior. They
are proposed in chapter 5.3.
Cleanness is another issue in the terminal facilities. Better cleaning plan has to be
developed. And special attention is to be paid on the sanitary zones. Rubbish bins
should match with interior design concept.
Signage should better be reconsidered too. It concerns all types of signs. Passengers
should get clear guidance not only while finding their way to the plane, but also to such
facilities like café or toilet. All the signs need to share a common philosophy and placed
in the right position. The design of signs can be the same as in Terminal 1.
Some respondents complained about air-conditioning system. It is quite stuffy in the
entrance concourse and departure lounge during warm summer days, especially when
the facilities get crowded. No doubts, passengers can stay outside while waiting for
check-in process. But they cannot do the same in the departure lounge as it is forbidden
to leave the terminal before boarding is announced. Therefore good ventilation system
and air-conditioner are more than just desired. And of course the facilities should be
better heated in winter.
There is an interesting issue with safety. In the process of research it became clear that
safety is tightly interconnected with other characteristics of facilities. To be more
concrete, it might depend on size of premises. People do not feel safe if they stay in

53
crowded place. Therefore solving the main terminal problem which is definitely lack of
public space safety issue partly gets resolved too. Moreover, personnel have to control
the crowd which appears in waiting room and especially in the departure lounge, when
people queue in order to be the first who enters the aircraft. This simple action helps to
reduce anxiety which passengers might have.
5.3 Suggestions for the overall interior of terminal facilities
The majority of respondents expressed their dissatisfaction with the interior of terminal
premises. In their point of view it looks quite old-fashioned and wan. Taking into
account a fact that this terminal is operated by low-cost airlines people do not expect it
to be classy and high-tech. They just want to spend their time in the place that looks
aesthetic and renovated. Therefore terminal interior tends to be rather redecorated than
changed totally. All the recommendations concerning interior are general and can be
applied to each facility.
It is necessary to start with refreshing walls, floor and ceilings. Special attention has to
be paid to walls. It would be nice to repaint them in lighter colors which have ability to
make an atmosphere of the room calm and relaxing. Moreover they are well perceived
and neutral for people’s eyes. Light walls are the most popular in the interior due to its
universality. They are always well coupled with other colors used in the interior.
Another good suggestion is using wallpapers in the interior. Wallpaper with the city of
Tampere in it can be placed in the arrival lounge so that inbound tourists can get a
preview of the city they are arriving to. Advertising billboards can be placed in the
arrival lounge in order to promote tourism in Tampere region. It should be especially
orientated to Russian travelers. Normally they do not stay in Tampere as they straightly
head to Russia right after they have arrived.
Interior would look dull without decorations. Simple up-to-date posters with useful for
travelers information could be one of the best options for the walls. Elements of nature
cannot be forgotten as well especially since Finland has been well known for its unique
and almost untouched nature. Besides it they are efficient in reducing stress and tension.
Therefore flowerpots and natural finishes definitely should be used in these purposes.
It was indentified that terminal needs some correction of lighting system. There is an
obvious lack of natural light and lamps are not that bright as well. The most common

54
way of making facilities lighter is to install big French windows. They automatically
provide all the premises with considerable portion of daylight. In addition they are an
efficient part of airport security system. As they make premises lighter they give an
opportunity to security guards to take current situation in the terminal under control.
Lamps that have yellow luminescence could be replaced with ones that shine with white
color. LED light bulbs could be a good option in this sense. They exactly give white
bright light. What is also important they are energy-efficient and allow to save some
money on electricity bills.

55
6 CONCLUSION
The main goal of the research was to identify problems in facility services of terminal 2
and find possible solutions which would help to adapt terminal to customer wants and
needs. In order to reach this aim defining the level of customer satisfaction on facility
services was determined as the main objective of the research. The research goal as well
as research objectives were successfully achieved in spite of the fact that original
research plan had been changed a little during the working process. Research questions
also found their answers. Survey technique was implemented with success.
Results of customer satisfaction survey have shown that passengers are rather
dissatisfied with facility services in the terminal. But there is no need to worry as most
of the respondents stated they do not expect to see something extraordinary in the low-
cost terminal. They just want to see terminal facilities renovated and clean. Therefore
recommendations are mostly orientated to change the appearance of facilities.
Probably, next time it would be better to conduct a face-to-face survey instead of online
questionnaire. There is no doubt online questionnaire is very handy method of
collecting quantitative data. However, it is impossible to share emotions while filling
the questionnaire online. Researcher can observe people reaction to questions and
probably hear some comments which can be used as unofficial data for the research.
Moreover, it is more convenient to do sampling using face-to-face survey as researcher
can choose and configure respondents by himself.
Customer satisfaction survey should not be a one-time action. It has to be an ongoing
process as it is important to constantly work on developing service and improving its
quality. In order to complete the picture detailed customer satisfaction survey has to be
conducted. It should examine not only the tangibles, but other service quality
determinant too. Thereby the suggestion for further research would be to research
customer satisfaction on other terminal facility services by means of entire SERVQUAL
method.
Another interesting topic for the research is finding the ways of attracting more Russian
tourists to Tampere airport as it is getting more and more popular among tourists from
Russia to travel from Finland to different European destinations. However, most of

56
them choose Helsinki-Vantaa Airport or Lappeenranta Airport. Tampere Airport is not
so popular yet, but it has a good potential to be so.

57
REFERENCES
Book references
Altinay L. & Paraskevas A. 2008. Planning Research in Hospitality and Tourism. First
edition. Oxford: Elsevier, LTD.
Asian Productivity Organization, 2000. Customer Satisfaction in the Service Sector.
Tokyo: Sanshusha Co., Ltd.
Edwards B. 2005. The Modern Airport Terminal: New approaches to airport
architecture. Second edition. Oxford: Alden Press.
Grigoroudis E. & Siskos Y. 2010. Customer Satisfaction Evaluation: Methods for
Measuring and Implementing Service Quality. First edition. New York: Springer
Science + Business Media, LLC.
Grönroos C. 2001. Service Management and Marketing: a customer relationship
management approach. Second edition. Chichester: John Wiley & Sons Ltd.
Kotler P. & Keller K.L. 2012. Marketing management. 14th
edition. Essex: Pearson
Education Limited
Landa F. 1997. Accessible public signing. The Architects’ Journal. P.38
Ostrom A. & Iacobucci D. 1995. Consumer Trade-Offs and the Evaluation of Services.
Journal of Marketing. 59. pp. 17-28.
Zeithaml V.A., Parasuraman A. & Berry L.L. 1990. Delivering Service Quality:
Balancing Customer Perceptions and Expectations. First edition. New York: A Division
of Macmillan, Inc.
Zeithaml V.A., Bitner M.J., Gremler D.D. 2009. Service Marketing: Integrating
Customer Focus Across the Firm. Fifth edition. New York: McGraw-Hill Companies,
Inc.
Online references
Airpro OY. 2013. Airpro konserni. Read: 23.11.2013
http://www.airpro.fi/airpro-konserni
Airpo OY. 2013. Palvelut Tampere-Pirkkala. Read: 23.11.2013
http://www.airpro.fi/tampere-pirkkala
Blagoveshenskiy Y. 2009. Мытари на социальном поприще (Publicans in social
field). Read: 02.02.2014
http://wciom.ru/fileadmin/Monitoring/91/2009_3(91)_10_Blagodtotycrbq.pdf
Dictionary.com. 2014. Survellaince. Read: 30.1.2014

58
http://dictionary.reference.com/browse/surveillance
Evans J. & Mathur A. 2005. The value of online surveys. Read: 9.12.2013
http://shlee.myweb.uga.edu/onlinesurvey/valueofonlinesurveys.pdf
Finavia. 2012. AIP Suomi/Finland. Read: 24.11.2013
https://ais.fi/ais/eaip/pdf/aerodromes/EF_AD_2_EFTP_EN.pdf
Finavia. 2013. Matkustajat 2012. Read: 21.11.2013
http://archive.finavia.fi/files/kronodoc/2284/212999/Matkustajat%20lentoasemittain%2
0suo-fi.pdf
Finavia. 2013. Tampere-Pirkkalan lentoasema lysyesti. Read: 20.11.2013
http://www.finavia.fi/fi/tampere-pirkkala/lyhyesti/
Finavia. 2013. Tampere-Pirkkalan lentoaseman terminaalitietoja. Read: 20.11.2013
http://www.finavia.fi/fi/tampere-pirkkala/terminaali/
Finavia. 2014. Matkustajat 2013. Read: 31.1.2014
https://dxww91gv4d0rs.cloudfront.net/file/dl/i/7ovU7g/mhQXyaxXxQl7G8S-
vhHBrQ/Matkustajatlentoasemittainsuo-fi.pdf
Questback. 2014. A world leader in Enterprise Feedback Management and Social CRM.
Read: 02.02.2014
http://www.questback.com/questback
Ryanair. 2013. General Terms and Conditions of Carriage. Read: 24.11.2013
http://www.ryanair.com/en/terms-and-conditions#article6
Ryanair. 2013. About us. Read: 23.11.2013
http://www.ryanair.com/en/about
Ryanair. 2013. Ryanair juhlii Suomessa: kymmenen vuotta – neljä miljoonaa
matkustajaa. Read: 21.11.2013
http://www.ryanair.com/fi/news/ryanair-juhlii-suomessa-kymmenen-vuotta-nelja-
miljoonaa-matkustajaa
ФонтанкаFi. 2013. Как устроен аэропорт (How airport looks like). Read: 11.12.2013
http://fontanka.fi/districts/pages/88-
%D0%9A%D0%B0%D0%BA_%D1%83%D1%81%D1%82%D1%80%D0%BE%D0
%B5%D0%BD_%D0%B0%D1%8D%D1%80%D0%BE%D0%BF%D0%BE%D1%80
%D1%82/

59
APPENDICIES
Appendix 1: Thesis questionnaire
Questionnaire
Instruction: Please tick ( ) the appropriate box or complete the answer. There is no
right or wrong answer. Please choose the answer which represents your opinion.
1) Gender*
⃝ Man ⃝ Woman
2) Age*
⃝ Under 18 ⃝ 18-24 ⃝ 25-34 ⃝ 35-44 ⃝ 45-…
3) Country of residence*_______________________________________________
4) With whom you are normally travelling?*
⃝ Alone
⃝ With my family
⃝ With friends
⃝ With colleagues
5) How many times have you traveled via Tampere Airport (Terminal 2)?*
⃝ Just once
⃝ 2 times
⃝ 3 or more
6) When was your last time of traveling via Tampere Airport (Terminal 2)?* Name
the year: ___________
7) Why did you choose traveling with Ryanair via this airport?*
⃝ I am a resident of Tampere region
⃝ Flight tickets were cheap
⃝ Other
reasons_______________________________________________________

60
8) How would you estimate the following characteristics of terminal entrance
concourse?*
highly
satisfied
somewhat
satisfied
average somewhat
dissatisfied
highly
dissatisfied
Comfort &
Convenience
⃝ ⃝ ⃝ ⃝ ⃝
Cleanness ⃝ ⃝ ⃝ ⃝ ⃝
Interior ⃝ ⃝ ⃝ ⃝ ⃝
Spacious
enough
⃝ ⃝ ⃝ ⃝ ⃝
Orientation
signs
⃝ ⃝ ⃝ ⃝ ⃝
Safety ⃝ ⃝ ⃝ ⃝ ⃝
9) How would you estimate the following characteristics of terminal departure
lounge?*
highly
satisfied
somewhat
satisfied
average somewhat
dissatisfied
highly
dissatisfied
Comfort &
Convenience
⃝ ⃝ ⃝ ⃝ ⃝
Cleanness ⃝ ⃝ ⃝ ⃝ ⃝
Interior ⃝ ⃝ ⃝ ⃝ ⃝
Spacious
enough
⃝ ⃝ ⃝ ⃝ ⃝
Orientation
signs
⃝ ⃝ ⃝ ⃝ ⃝
Safety ⃝ ⃝ ⃝ ⃝ ⃝
10) How would you estimate the following characteristics of terminal arrival
lounge?*
highly
satisfied
somewhat
satisfied
average somewhat
dissatisfied
highly
dissatisfied
Comfort &
Convenience
⃝ ⃝ ⃝ ⃝ ⃝
Cleanness ⃝ ⃝ ⃝ ⃝ ⃝
Interior ⃝ ⃝ ⃝ ⃝ ⃝
Spacious
enough
⃝ ⃝ ⃝ ⃝ ⃝
Orientation
signs
⃝ ⃝ ⃝ ⃝ ⃝
Safety ⃝ ⃝ ⃝ ⃝ ⃝

61
11) How do you estimate the overall level of facility services offered in the
terminal?*
⃝ Excellent ⃝ Very good ⃝ Good ⃝ Average ⃝ Bad
12) If your answer to previous question was BAD, then explain WHY?
________________________________________________________________
________________________________________________________________
13) What would you suggest to improve terminal facilities?*
________________________________________________________________
________________________________________________________________
________________________________________________________________
14) Are you thinking of choosing Tampere Airport (Terminal 2) as a transport hub
again?*
⃝ Yes
⃝ No
15) Explain briefly your choice*
________________________________________________________________
________________________________________________________________
Thank YOU for YOUR cooperation!