customer purchasing behavior analysis on barnes & noble and amazon in base sas
TRANSCRIPT

Abhishek
Meera
Shilpa

Exploring Data


Building Count Dataset• Users that bought from Barsne&Noble
• Users that bought from Amazon
• Users that bought from both Amazon and BarnesAndNoble
• Users that bought only from Amazon and not from BarnesAndNoble
• Adding Demographic details to AmazonOnlyTable.For the data, since no one bought from BarnesAndNoble, total_books=0
• Creating Table for people who bought from BarnesAndNoble along with demographic details
• Combining the Bndemographic table with amazononlydemographic table to obtain the final table required for regression

Building Poisson Regression Model
Count of Quantity Quantity Actual Predicted
7639 0 1524.750499 0.4762498
753 1 150.2994012 0.3499975
362 2 72.25548902 0.1319051
175 3 34.93013972 0.0339198
126 4 25.1497006 0.0066854
82 5 16.36726547 0.0010758
74 6 14.77045908 0.00014705
30 7 5.988023952 1.7538E-05
48 8 9.580838323 1.86E-06
31 9 6.18762475 1.78E-07
20 10 3.992015968 1.69E-08
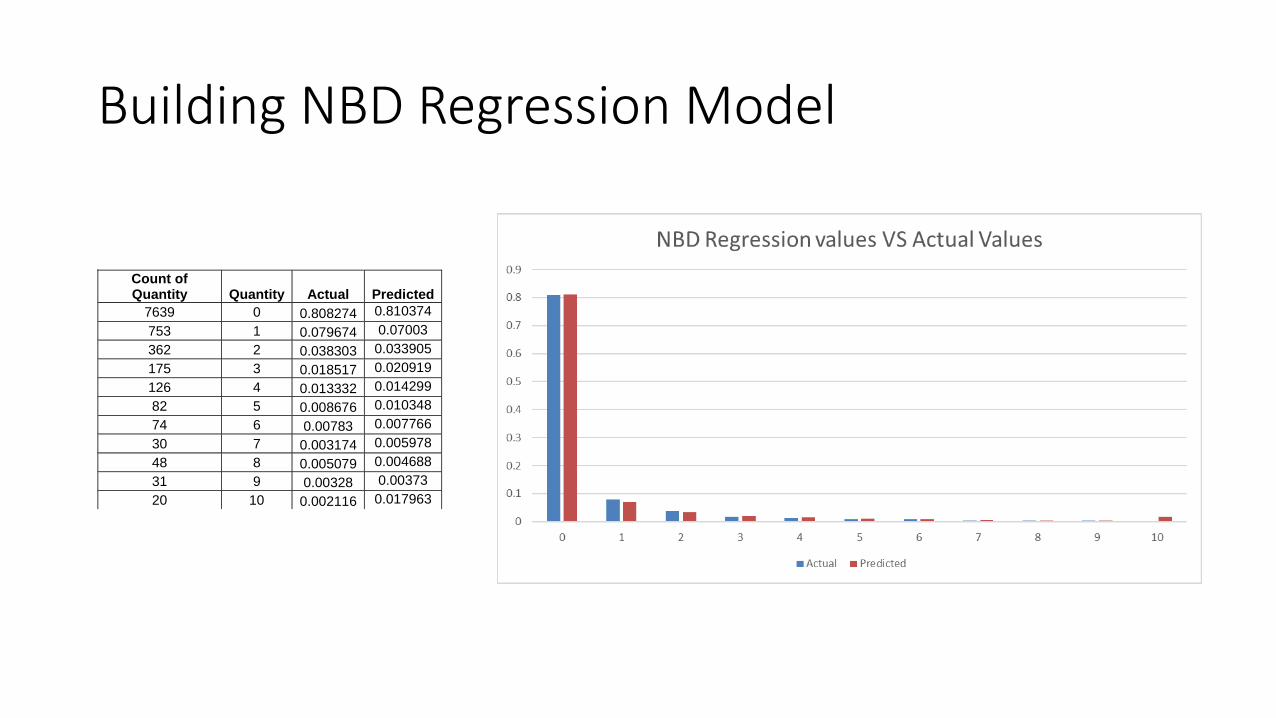
Building NBD Regression Model
Count of Quantity Quantity Actual Predicted
7639 0 0.808274 0.810374
753 1 0.079674 0.07003
362 2 0.038303 0.033905
175 3 0.018517 0.020919
126 4 0.013332 0.014299
82 5 0.008676 0.010348
74 6 0.00783 0.007766
30 7 0.003174 0.005978
48 8 0.005079 0.004688
31 9 0.00328 0.00373
20 10 0.002116 0.017963

Comparision
• NDB Regression fits the data better than the Poisson Regression Model and can be used for prediction.
• In comparison to Poisson Distribution is LL value 18819, NBD LL value is 8359. AIC and BIC values for NBD is better than Poisson Reg.

Tuning the NDB Model
Adding variables one by one and testing model
Added only Region. Added only Child
Added only Race.

Tuning the NDB Model
• Creation of New variable
DATE
Holidayvariable
Weekend variable
Holiday Shopping Tendency(0,1,2)
Week end Shopping
Tendency(0,1,2)
Customer:Percentage of
Holiday shopping
Customer: Percentage of
Weekend shopping

Tuning the NDB Model
• Creation of New variable
Log Likelihood
B8- Week end shopping TendencyB9-Holiday Shopping Tendency

Tuning the NDB Model
• Interaction Variable
Household size * child
Holiday shoppin trend * Weekend Shopping Trend income * age
Log Likelihood

Why Certain Customers Prefer Amazon Over BN?

Facts:• # of bookings for Amazon is 5 times more
• Missing values in education field was more than 60%
Logistic Regression:
• Dependent variable used is domain_type
• class variables: education and region
• New variable: total_books
• Replaced 99 by ‘.’ in education

Results

Inferences
• 56.7% of the values were being predicted well
• Education and region influence the results
• Region 1 and region 3 had relatively more probability as well

Our Learning and Takeaway
• Getting the data in the right format
• Some simple basic assumptions resulted in a final solution
• Creating count model from scratch
• Better understanding of Poisson and NBD model