customer insight using rant&rave to gain operational feedback and customer satisfaction using...
TRANSCRIPT

Page 1

Page 2 Page 3
Contents Foreword
Welcome to the Value for Money (VFM) self assessment for 2016/2017 from Together Housing Group.
Each year we undertake a review of how we comply with the Homes and Communities Agency (HCA) Value for Money Standard. Together Housing Group believes in real value for our residents and strives to achieve it in all we do. This report explains how we have performed during 2016/2017, and how we intend to continue to deliver VFM in the future. The Board has a central role in driving VFM throughout Together Housing Group.
The report gives details on the £20.0 million by 2020 efficiency work streams which have already saved £17.9 million. These savings have been made by improving performance such as reducing the amount we lose in rent when homes are empty or by efficiency savings in areas such as better systems delivering the same with less. This has not been an easy process but it is one that was required to balance budgets following the Government’s decision to reduce social housing rents.
We believe that the new sector scorecard being developed is a good way of comparing performance between housing associations. In addition to signing up to the pilot we’ve used the scorecard as a way of benchmarking performance against other housing associations in this report. Moving forward we intend to analyse data from the sector scorecard regularly to measure our performance.We are not complacent and there is more we can do.
Housing is not about operating margins, rent collection rates or costs per repairs – it’s about people having a great place to live with their families. This report quite rightly gives a lot of financial and benchmarking data but the real difference Together Housing makes is to people’s lives.
Dave ProcterChair of the Board
Page
Foreword 3
1. Introduction 5
1.1 Strategic Approach to Value for Money1.2 Together Housing Group 1.3 Legal and governance1.4 Together Housing Association 1.5 Operating environment
2. Business Overview 10
2.1 Financial Performance2.2 £20.0 million by 2020 efficiency work streams2.3 Commercial activity
3. Maintaining and building homes 16
3.1 Existing Homes 3.2 New Homes
4. Social Purpose 18
5. How we compare 21
5.1 Analysis of benchmarking data 5.2 Development - capacity and supply 5.3 Outcomes delivered 5.4 Effective asset management 5.5 Operating efficiencies
6. Conclusion 25
Page 4 Page 5
Figure 1
.
1. Introduction
This is the annual Value for Money (VFM) self assessment undertaken by the Together Housing Group for 2016/2017. It has been prepared to meet the requirements of our regulator the Homes and Communities Agency (HCA).
Together Housing takes Value for Money very seriously and each year we undertake rigorous self assessment against the HCA’s Value for Money standard.
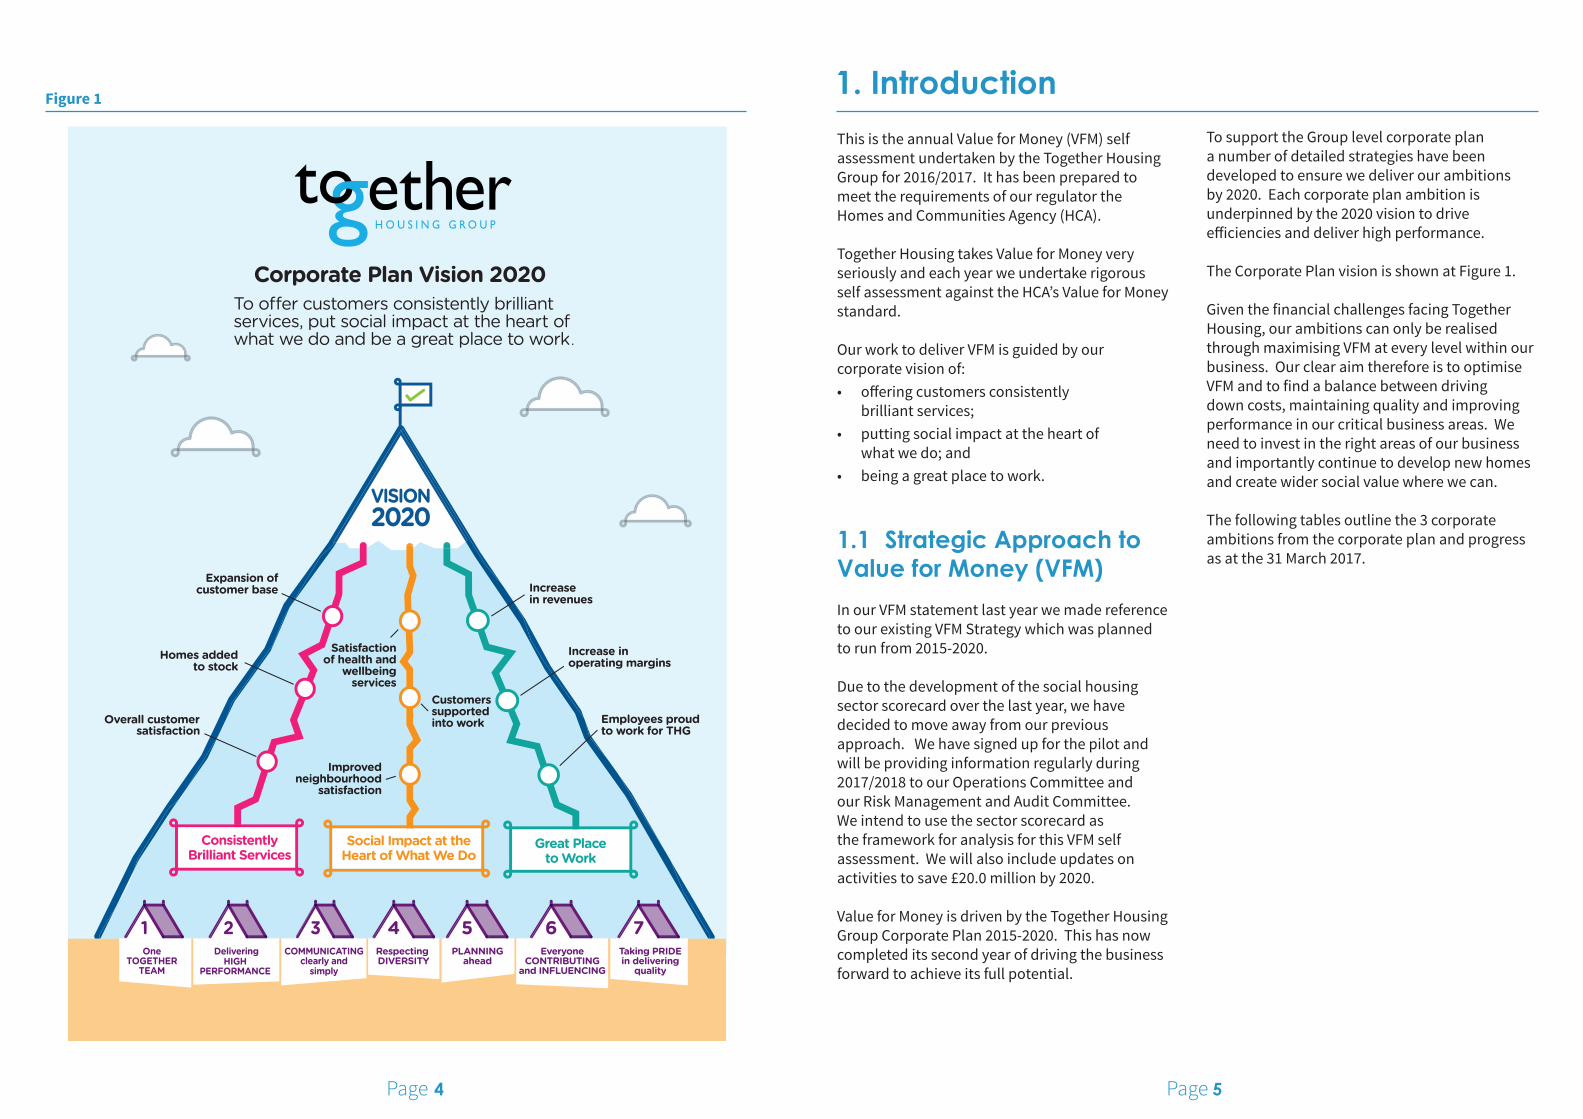
Our work to deliver VFM is guided by our corporate vision of: • offering customers consistently
brilliant services;• putting social impact at the heart of
what we do; and • being a great place to work.
1.1 Strategic Approach to Value for Money (VFM)
In our VFM statement last year we made reference to our existing VFM Strategy which was planned to run from 2015-2020.
Due to the development of the social housing sector scorecard over the last year, we have decided to move away from our previous approach. We have signed up for the pilot and will be providing information regularly during 2017/2018 to our Operations Committee and our Risk Management and Audit Committee. We intend to use the sector scorecard as the framework for analysis for this VFM self assessment. We will also include updates on activities to save £20.0 million by 2020.
Value for Money is driven by the Together Housing Group Corporate Plan 2015-2020. This has now completed its second year of driving the business forward to achieve its full potential.
To support the Group level corporate plan a number of detailed strategies have been developed to ensure we deliver our ambitions by 2020. Each corporate plan ambition is underpinned by the 2020 vision to drive efficiencies and deliver high performance.
The Corporate Plan vision is shown at Figure 1.
Given the financial challenges facing Together Housing, our ambitions can only be realised through maximising VFM at every level within our business. Our clear aim therefore is to optimise VFM and to find a balance between driving down costs, maintaining quality and improving performance in our critical business areas. We need to invest in the right areas of our business and importantly continue to develop new homes and create wider social value where we can.
The following tables outline the 3 corporate ambitions from the corporate plan and progress as at the 31 March 2017.

Page 6 Page 7
Ambition 3: Having a social impact
Specific Goals Measures of success by 2020
Baselineat 31 March2015
Performance 2015/16
Progress at end of 2016/17
Target 2016/17
Contributing to better neighbourhoods
Improved resident satisfaction within our neighbourhoods by 10%
85.1% 87.4% 87.4% 87.5%
Offering more jobs and training
250 residents will have been supported into work
n/a 177 131 125
Improving health and wellbeing
Number of residents receiving health and wellbeing services tell us their health has improved
n/a 804 1,429 370
Together Housing Group comprises a number of separate and distinct companies and these are attached in Appendix 1.
This Value for Money statement is a group wide publication – i.e. it covers the entire remit of Together Housing Group. This includes social housing activities which are primarily located in Together Housing Association and non-social housing activities located in other Group companies.
The primary focus of the analysis within the VFM self assessment is Together Housing Association which accounts for over 80% of Group turnover (see Appendix 2).
1.2 Together Housing Group 1.3 Legal and governance
Substantial legal and governance changes took place in April 2016. This required an extensive consultation with tenants and approval from our regulator – the Homes and Communities Agency. As a result, we moved away from our legacy housing associations – Chevin Housing, Twin Valley Homes, Pennine Housing 2000, Housing Pendle and Green Vale Homes - into one company. This is known as Together Housing Association which owns and manages our properties and employs all of our staff.
Ambition 1: Delivering High PerformanceSpecific Goals
Measures of success by 2020
Baselineat 31 March2015
Performance 2015/16
Progress at end of 2016/17 Target 2016/17
Offering Brilliant Services
Our overall customer satisfaction will be 90%
86.8% 87.1% 87.8% * 88.3%
Being Cost Effective
Outperform our business plan by 5%
n/a 14.6% 46.3%5% improvement
in operating surplus
Recognised as a great employer
80% of our employees are proud to work for our organisation
60% 60% 71% 80%
* This figure relates to 31 January 2017 not 31 March 2017. After January 2017, we moved to a new system of customer insight using Rant&Rave to gain operational feedback and customer satisfaction using the Housemark STAR methodology.
Ambition 2: Continuous Growth
Specific GoalsMeasures of success by 2020
Baselineat 31 March2015
Performance 2015/16
Progress at end of 2016/17
Target 2016/17
Providing more homes
2,500 new homes are added to our stock
N/A 505 139 500
Serving more customers
Our customer base expands by 10%
40,331 41,019 40,847 41,944
Generating more revenue
Generate £10 million through commercial activity
£8.7m £9.6m £12.9m £9.2m

Page 8 Page 9
1.4 Together Housing Association
The major activity of Together Housing Association is the management and development of social housing.
Together Housing Association at a glance:
• owns or manages 38,026 homes
• provides housing related services for over 40,000 customers
• covers a huge geographical area across 30 Local Authorities
• employ 1,145 full time equivalent staff
• has a turnover of £173.8 million
Together Housing has homes across the North of England and into the North Midlands. The density of stock in local authorities is shown in Figure 2.
1.5 Operating Environment
We have seen continuing change within in the social housing sector over the last 12 months. The impact of the cut in rents by 1 per cent each year for four years started in April 2016.
This cut in our income means that our need to achieve value for money has never been greater. This, together with the uncertainty following the referendum vote to leave the EU in June 2016, the triggering of Article 50 in late March 2017 and the proposed changes to the funding of supported housing, has only made us more focussed and more driven to achieve Value for Money savings.
Figure 2Location of Together Housing Group homes by local authority
Supported housing plays an important role within Together Housing Association. Whilst the vast majority of our stock is general needs housing, we have over 1,600 supported housing homes. This includes a diverse portfolio of stock such as for people with learning disabilities, older people and women escaping domestic violence. Proposed changes to the Local Housing Allowance are likely to impact on this area of activity.
Changes to welfare benefits means that it’s harder for many of our tenants to pay the rent. The roll out of Universal Credit – the Government’s flagship single benefit payments system - has already commenced in a number of Local Authority areas where the Group operates such as Harrogate, Hambleton and Craven.
In 2015, the Government made a commitment to extend Right to Buy to housing association tenants. Housing associations nationally made an offer to the Government to implement this commitment through a voluntary rather than statutory approach. Pilots are taking place to test this new Right to Buy approach. Together Housing is watching these pilots carefully to understand take up by residents and to assess the financial implications for the organisation.
SCARBOROUGH
RYEDALE
SHEFFIELD
BARNSLEY
KIRKLEES
CALDERDALE
PENDLE
NORTH LINCS
DONCASTER
WAKEFIELD
SELBYLEEDS
YORK
HARROGATE
BRADFORD
CRAVEN
RICHMONDSHIRE
CUMBRIA
HULL
EAST RIDING OF YORKSHIRE
HAMBLETON
SEFTON
ROTHERHAM
EAST LINDSEY
N.E LINCS
WEST LINDSEY
NORTH LINCOLNSHIRE
NORTH KESTEVEN
SOUTH KESTEVEN
BOSTON
NOTTINGHAMSHIRE
CHESTERFIELD
N.E. DERBYSHIRE
AMBER VALLEY
SOUTH DERBYSHIREEAST STAFFS
DERBY
DERBYSHIREDALES
STAFFORDSHIREMOORLANDS
NEWCASTLE UNDER LYME STOKE ON TRENT
HIGH PEAK
BASSETLAW
LINCOLNBOLSOVER
RIBBLE VALLEY
BURNLEY
HYNDBURN
BLACKBURNWITH DARWEN
ROSSENDALE
ROCHDALE
OLDHAM
BURYBOLTON
SALFORD
WARRINGTONMANCHESTER
CHESHIRE WEST AND CHESTER
CHESHIRE EAST
WIRRAL
WIGAN
ST HELENS
KNOWLSEYLIVERPOOL
WEST LANCASHIRE
PRESTONFLYDE
SEFTON
WYRE
LANCASTER
SOUTH RIBBLE
CHORLEY
COUNTY DURHAM
>50001000-4999500-999100-499<100

Page 10 Page 11
2. Business overview
This section reflects the approach we take to VFM. In the last Value for Money statement for 2015/2016 we stated that were developing an approach to identify where and how savings could be achieved. This approach has come to fruition during 2016/2017 and is our way of achieving our objectives set out in the Corporate Plan by 2020.
2.1 2016/17 Financial Performance Our approach to financial management is to protect core services and our assets whilst retaining sufficient capacity to grow. This is notwithstanding the fall in rental income caused by the cumulative impact of the Government’s decision to reduce social housing rents by 1% per year until 2020. Protecting services and assets and enabling growth will be achieved by increasing revenues whilst intelligently reducing costs and targeting our resources on core activities. We recognise that we need to increase our operating margin and this has been a major focus of our financial performance over the last year.
Together Housing Group is a strong and viable company. The Homes and Communities Agency (HCA), in a regulatory judgement in December 2016, concluded that we should maintain the V1 rating (the highest rating available on the V1 to V4 scale).
The HCA concluded the following:
Together Housing Group’s financial plans are consistent with, and support, its financial strategy. Together Housing Group has an adequately funded business plan, sufficient security in place, and is forecast to continue to meet its financial covenants under a wide range of scenarios.
A detailed section on benchmarking performance with other housing associations is found at “Section 5 – How we compare”. However, through the report comparisons were available are given using the HouseMark benchmarking service, which enables associations to compare performance against each other.
2015/16 2016/17 Upper Quartile
Turnover £168.8m £173.8m n/a
Overheads as % of adjusted turnover 8.4% 8.5% 8.4%
Costs per unit £3,416 £2,562 See section 5
Operating Costs £127.9m £120.5m n/a
Operating Margin 24.2% 30.7% See section 5
Increase in operating margin 2.2% 6.5% n/a
Figure 3 (below) shows financial performance for Together Housing Association over the previous two years 2015/16 or 2016/17.
Together Housing compares itself against landlords holding more than 5,000 homes who operate within the North of England. This gives a group of 73 associations against which we can compare ourselves and the upper quartile shows the top 25% performing landlords. It is important to recognise that we have not compared ourselves to average performance, but to the best performing housing associations in the North.
Together Housing Association has delivered strong financial performance during 2016/2017. Despite the 1% reduction in social housing rents turnover has increased by over £5.0 million and this is driven by new properties coming on stream and conversions to higher affordable rents.
The cost per unit has fallen by 25% to £2,562 during 2016/2017. A major reason for this has been a reduction in spend on planned and cyclical maintenance. During 2016/2017 reductions in planned maintenance have already saved £5.4 million towards the need to save £20.0 million by 2020. Another major contributor to the reduction in costs has been a reduction in spending on responsive repairs which has decreased by £3.3 million as part of the £20.0 million by 2020 efficiency programme.
The implementation of the active asset strategy, and the fact that we are validating all work prior to committing to replacement, has generated additional saving by sweating the assets components where appropriate. We are finding that the quality of materials installed has improved the life cycles previously used, thus resulting in extending the life of a component. We have also begun to address some of the under-performing stock via our Strategic Investment Group, who regularly meet to evaluate all the stock and have plans in place to deal with the worst performing stock, with a view to long term solutions.
Further details on comparing financial performance with other housing associations can be found in Section 5.
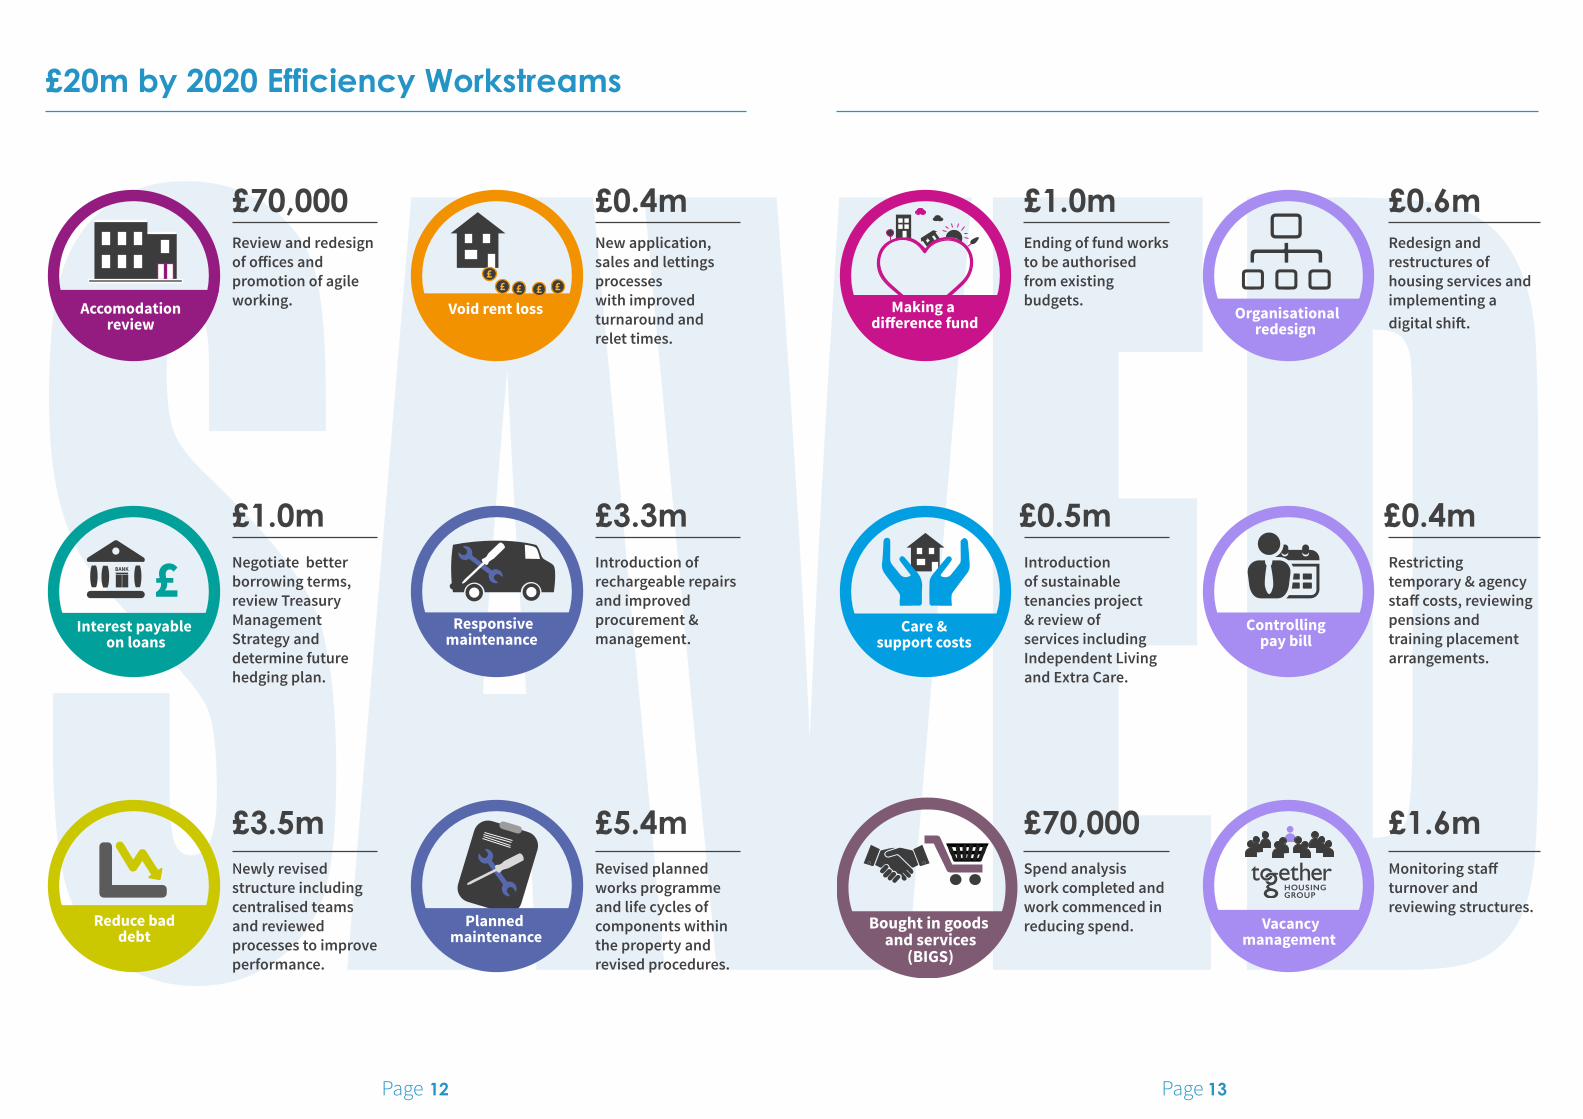
2.2 £20 million by 2020 efficiency workstreams
In the VFM self assessment last year we gave some details of our plan to save around £20.0 million by 2020 to balance the loss of revenues arising from the Governments Emergency Budget announcement. In 2015/16 the Board established a strategy to achieve £20.0 million of savings by 2020 to address the reduction in revenue anticipated following the rent cuts by the Government.
A programme of projects covering a number of service areas across the Group was developed and implemented in 2015/16. These ‘2020 projects’ are ongoing, and have an aim of making significant savings as well as improving performance by 2020.
It is the Group’s strategy to seek further improvements to create additional capacity to increase the housing supply.
The 2020 workstreams are as follows:
• Void Rent loss• Accommodation Review• Responsive Maintenance• Planned Maintenance• Provision for Bad Debts• Making a Difference Fund• Care & Support Costs• Bought in goods & services (BIGS) • Interest payable on loans• Organisational redesign• Controlling pay bill• Vacancy Management
The following pages outline our efficiency savings during 2016/17 towards our final 2020 savings figure.
Page 12 Page 13
£20m by 2020 Efficiency Workstreams
Planned maintenance
Reduce baddebt
Revised planned works programme and life cycles of components within the property and revised procedures.
Newly revised structure including centralised teams and reviewed processes to improve performance.
£5.4m£3.5m
Interest payable on loans
Responsivemaintenance
Introduction of rechargeable repairsand improved procurement & management.
Negotiate better borrowing terms,review Treasury Management Strategy and determine future hedging plan.
£3.3m£1.0m
Accomodation review
Void rent loss
New application, sales and lettings processes with improved turnaround and relet times.
Review and redesign of offices and promotion of agile working.
£0.4m£70,000
Spend analysis work completed and work commenced in reducing spend.
£70,000
Vacancymanagement
Monitoring staff turnover and reviewing structures.
£1.6m
Planned Maintenance
Care & support costs
Introduction of sustainable tenancies project & review of services including Independent Living and Extra Care.
£0.5m
Controlling pay bill
Restricting temporary & agency staff costs, reviewing pensions and training placement arrangements.
£0.4m
Making a di�erence fund
Ending of fund works to be authorised from existing budgets.
£1.0m
Organisationalredesign
Redesign and restructures of housing services and implementing adigital shift.
£0.6m
Bought in goods and services
(BIGS)

Page 14 Page 15
2.3 Commercial activitiy
Together Housing Group generates considerable income outside of the core social housing part of the business (Together Housing Association) as shown in Figure 4.
During 2015/2016 activities generated £9.6 million of income which accounted for 4.3% of the Group’s turnover. This overall figure rose to £13.2 million in 2016/2017 accounting for 6.4% of Group turnover.
2015/2016 Turnover (£/m)
% of Group Turnover
2016/2017 Turnover (£/m)
% of Group Turnover
SP+ Development SalesThis company is responsible for the construction and sale of housing properties located within Pendleton, Salford.
4.6 2.0% 6.3 3.1%
Shared ownershipThis relates to sales of a proportion of the equity in a shared ownership home.
1.3 0.6% 2.5 1.2%
Market RentThis refers to income for market rent properties which is usually higher than social/affordable rents.
0.5 0.2% 0.4 0.2%
Key Worker RentThese are properties for rent by those classified as key workers e.g. NHS, emergency services and education.
0.1 0.03% 0.1 0.1%
Private Sector Leasehold ManagementThis relates to management of the services provided to schemes where the property owners have bought the leasehold. This is common within blocks of flats.
0.7 0.3% 0.4 0.2%
Other LettingsRelates to all non-residential lettings such as garages and shops on our estates.
0.3 0.2% 0.3 0.2%
Newground Together CICA Community Interest Company which carries out activities which benefit communities and operates as a social enterprise.
1.2 0.5% 1.8 0.9%
Together Roof EnergyThe activity involves delivering solar panels onto Together Housing Association properties.
1.4 0.6% 1.5 0.7%
Total 10.1 4.4% 13.3 6.6%
The key drivers of the £3.6 million increase in turnover have been greater sales of homes in Pendleton, Salford (through SP+ Development), more Shared Ownership sales and increased revenue from Newground CIC.
Our overall aim in our Growth Strategy is by 2020 to ensure that 25% of overall turnover in the Group is derived from non core activities. We recognise that we have a considerable way to go to achieve this challenging target.
Figure 4 - Commercial activity undertaken by Together Housing Group.
Building homes

Page 16 Page 17
3. Maintaining and building homes
The properties we own and manage are Together Housing Association’s biggest asset.
This section focuses on two areas. The first focuses on how we maintain our existing homes through planned improvements, undertaking repairs or managing homes. The second area focuses on the new homes we have built during the 2016/2017 year.
3.1 Existing homesExpenditure on our existing homes through planned maintenance and day to day repairs was the largest item of expenditure for Together Housing Association during 2016/2017. This amounted to £48.6 million during the year. Our overall aim is to improve the long term viability of our homes and maximise value for money through the following approach:
• Focussing resources on stock performance ensures that we only invest in the right assets, to the right standard, in the right places, for the right cost and the right return.
• Indentifying and managing our poor performing stock using our Insight model we are able to understand which homes are performing poorly. Where schemes are identified as needing more robust interventions then we consider large scale stock investment, remodelling, change of tenure type or disposal.
• Reducing responsive repairs spend.
• Reducing void cost and times.
KPI Measure 2015/16 2016/17 Upper Quartile
Major repair cost per unit £873 £531 £568
The cost reductions in the planned programmes have been achieved by revising planned works programme and life cycles of components within individual properties.
Our new approach of validating investment works prior to starting on site means we can extend the life cycle of components and not carry out work where decent homes standard has already been met.
We recognise that reducing spend on planned maintenance may lead to increased costs for repairs in the medium to long term and are keeping a close eye on this. This explains why the ratio of responsive repairs to planned maintenance has increased to 1.5 from 1.0 the previous year (2015/16).
KPI Measure 2015/16 2016/17 UpperQuartile
Ratio of responsive repairs to planned maintenance
1.0 1.5 See section 5
Maintenance cost per unit £882 £769 £769
Average days to carry out a responsive repair
9.8 7.9 5.9
Average cost per repair £112 £119 not
available
Average cost of void repair £2,472 £2,229 not
available
As already mentioned a major contributor to the reduction in costs has been a reduction in spending on responsive repairs which has decreased by £3.3 million as part of the £20.0 million by 2020 efficiency programme.
A contributor to these savings has been the introduction of tenant rechargeable repairs where we are now charging residents for the following types of repairs:
• repairs due to deliberate damage caused by the tenant or another person at their property;
• repairs due to misuse or abuse of the property; and
• repairs due to unauthorised improvements or modifications to the property.
While the average number of days to complete a responsive repair has decreased from 9.8 days to 7.9 days, this remains above the top performing housing associations in the North of England.
The future focus for Property Services Team is to ensure we continue to provide an effective responsive repairs service and also to invest in planned maintenance when we need to do so. We are monitoring the impact of reducing spend on planned maintenance to ensure that it does not lead to large increases in responsive repairs spending.
KPI Measure 2015/16 2016/17 Upper Quartile
Occupancy 98.7% 98.7% SeeSection 5
Management Cost per unit £1,142 £874 £730
Rent collection rate % 98.7% 100.3% See
Section 5
Current tenant arrears % 3.0% 2.6% 1.7%
Void loss % 2.7% 2.1% 0.7%
Tenancy turnover % 10.3% 10.0% 7.8%
Average relet times (days) 44 36.1 17.5
Indicators such as the rent collection rate, current tenant arrears, tenancy turnover and average relet times have improved.
Many of the housing management indicators do remain high when compared to our best performing peer group of housing associations in the North of England.
This is due to the fact we operate in some housing markets with low demand where we are in direct competition with the private rented sector. It is also due to the fact we have sought to focus on our difficult to let properties which perform less well.
3.2 New homes In addition to maintaining existing homes we also build new ones for people in housing need. Our performance in building new homes is shown in the table below.
KPI Measure 2015/16 2016/17 UpperQuartile
Homes developed 505 139 See
Section 5
Homes developed as % of units owned
1.4% 0.4% SeeSection 5
There was a major decline in the number of homes completed and this fell by over 70% from the previous year. The main cause of this was the 1% rent reduction which affects the future revenue for new homes which meant a delay in some schemes while they needed to be remodelled. A revised strategy has been developed to ensure the delivery of the objective set out in the Corporate Plan of 2,500 affordable homes over 5 years.
Moving forward into 2016-2017, the focus is to ensure the annual delivery target of 500 new homes a year is maintained to enable the delivery of 2,500 homes from 2015-2020. Many of the previously unviable schemes have been remodelled to ensure delivery or new sites for development have been sought. We also intend to continue to seek sites outside our traditional operating area to create a greater footprint.

Page 18 Page 19
Newground Together is a charity covering the North of England, promoting the environment for social good and improving the prospects and living conditions of local people.
The aim of Newground is: To build sustainable communities, working
with partners to help improve people’s lives, their prospects and potential, and the places where they live, work and play.
During 2016/17 Newground Together awarded 28 grants and commissions with a total value of £1.5 million working in partnership with like-minded organisations, Newground delivery partners secured £1.5 million additional funding creating a total programme value of over £3 million.
These innovative projects touched the lives of many people, making a social impact in three corporate priority areas; improving health and wellbeing, improving neighbourhoods and supporting people into training and employment.
4. Social Purpose
99,190 HOURS
Young people engaged in community projects
85,234 HOURS Adults engaged in community projects
1,374 PEOPLE Accessing financial advice
272 SESSIONS Delivered in schools
Contributing to better neighbourhoods
Newground contributes to better neighbourhoods across the North of England in the following ways:
3,844 PEOPLE Took part in physical activity
251REFERRALS Health and wellbeing
238 PEOPLE Gained an accredited qualification
54,684 HOURS Training delivered
906 PEOPLE
Received employment advice
126 PEOPLE Supported into employment
Offering more jobs and training
Newground funds many work and skills programmes to assist residents and local people through the following activities:
Improving health and wellbeing
Newground improves the health and wellbeing of local communities in the following way:
These activities are possible due to donations received from Together Housing Group and surpluses gift aided from the Charity’s subsidiary social enterprise, Newground CIC. Newground Together will continue to commission programmes and award grants which further the Charity’s objects.
There will be a focus on employment and training as a key means of generating activity in neighbourhoods and promoting physical and mental wellbeing.

Page 20 Page 21
5. How do we compare?Social PurposeThis section of the VFM self assessment aims to compare the performance of Together Housing Association against other housing associations using the indications within the new Sector Scorecard. On its own, benchmarking will not tell us everything about the business, but it enables us to ask the right questions. It also gives stakeholders a yardstick to judge how well Together Housing Association performs.
We benchmark performance using the HouseMark benchmarking service, which enables members to compare against each other and against other ‘best in class’ performers within the peer group. Together Housing compares itself against landlords holding more than 5,000 homes who operate within the North of England.
Sector Scorecard
This gives a group of 73 peers against which we can gauge how well we are performing. The later analysis shows Together’s performance against that of the top 25% performing landlords (Upper Quartile).
The analysis is structured around the new Sector Scorecard indicators. These are being tested through an extensive year-long pilot which Together Housing is participating in.
We believe that these new proposed common indicators provide an easy way to compare performance. These indicators have therefore been used as the basis for this benchmarking section.

Page 22 Page 23
Increases in revenue and reductions in costs have meant a sizeable increase in the margin for Together Housing Association.
The margin has increased by 6.2% from 2015/2016 to reach 30.5% in 2016/2017 which is above our target of 27%. However, this remains below top performing housing associations in the North of England who achieve an average margin of 32.9%. A good earnings margin is fundamental to ensuring the organisation is generating sufficient funds to enable it to invest in its future operations.
A large part of this increase in operating margin has been driven by an increased in efficiency generated by our active asset management strategy. This has enabled Together Housing Association to extend component lifecycles within properties and thereby reduce the amount of our planned investment programme.
As already stated, we are monitoring the impact reductions in planned maintenance spending to ensure that it does not lead to increases in responsive repairs spending.
Measure 15/16 16/17 Upper Quartile
Operating margin 24.2% 30.7% 32.9%
Measures the amount of surplus generated from turnover on day-to-day activities
Earnings before interest, tax, depreciation and amortisation MRI (as % of Interest )
156.6% 222.1% 310.5%
This is an approximation of cash generated. Presenting it as a percentage of interest shows the level of headroom on meeting interest payments on outstanding debt.
Earnings before interest, tax, depreciation and amortisation (EBITDA MRI) is used to measure financial strength, and also to assess the level of headroom on meeting interest payments on outstanding debt. This indicator has risen from 156.6% in 2015/2016 to 223.0% in 2016/2017. Our financial strength is important as it creates the investment capacity for growth of new homes and new commercial activities. Any investment is required to generate a long term return.
5.2 Development
Measure 15/16 16/17 Upper Quartile
Units developed
505 139 144
No. of new homes built.
Units developed as % of units owned
1.4% 0.4% 1.7%
No. of new homes built as a % of total homes.
Gearing 59.9% 44.4% 34.5%
Proportion of borrowing in relation to the size of the asset base.
An explanation as to the large decrease in the number of new homes being built and our intention to build 500 new homes a year until 2020 can be found at section 3.2.
Despite this large drop in the number of new homes being built during 2016/2017, Together Housing Association still performed in line with the best performing housing association in the North in terms of the total number of homes built. However, when this is shown as a percentage of our number of existing homes, this performance is less than a quarter of highly performing housing associations. We believe that if we are able to build 500 new homes a year it will help to redress this balance.
Measure 15/16 16/17 Upper Quartile
% of respondents satisfied with the overall service provided.
86% 86% 91.6%
Customers satisfied that their rent provides value for money.
£ invested in new housing supply for every £ generated from Operations
n/a £0.52 £0.31
£ invested in Communities for every £ generated from Operations
n/a £0.03 £0.01
Our aim is to ensure that we meet our vision to provide consistently brilliant services to our customers and we measure this is a number of different ways. This indicator of customer satisfaction is based on the most recent Survey of Tenants and Residents (STAR) undertaken in 2015.
5.3 Outcomes delivered
5.1 Business health It is also important to recognise that we build homes in other parts of the Together Housing Group (outside Together Housing Association). For example, during 2016/17 we developed 43 homes for sale in Salford through SP + Development.
Gearing shows the proportion of borrowing in comparison with our asset base and this declined from the previous year, although this gearing figure remains above the best performing housing associations in the North. A major contributory factor here is the decline in the number of new homes being built. We recognise that we have continued capacity to build more homes and have a 500 year new homes annual target for coming years.
This showed that while our performance is strong at 86% of residents being satisfied that their rent provides value for money, this falls below that of the highest performing housing associations in the North who achieve 91%.
Unlike some housing associations with dispersed properties Together Housing has at its heart four stock transfers in Calderdale, Rossendale, Pendle and Blackburn with Darwen. We therefore invest more in community activity than the Upper Quartile of our peer group Northern housing associations at £0.03 per £ generated as opposed to £0.01 per £ generated.
5.4 Asset management
Measure 15/16 16/17 Upper Quartile
Return on capital employed (ROCE) 4.3% 5.3% 7.3%
How capital and debt are used to generate a financial return.
Occupancy 98.7% 98.7% 99.7%
Efficiency in turning around void stock.
Responsive repair spend as % planned unit costs
1.0 1.5 0.5
Ratio of responsive repairs to planned maintenance.
The Return on Capital Employed (ROCE) shows how well housing associations are using capital and debt to generate a financial return. By increasing the return Together Housing Association makes money available to re-invest. The last year saw almost a 1% increase in ROCE to 5.3% but this still falls below the best performing Northern associations in our peer group who achieve 7.3%.

Page 24 Page 25
6. ConclusionReflecting on our performance overall during 2016/2017, we are in a strong position to demonstrate continuing improvements in value for money.
Our key financial metrics such as operating margin and our operating costs have improved and the cost per unit has decreased by 25%. A lot of these changes have been driven by our ambitious “2020 project” which aims to increase performance or gain efficiencies to the value of £20.0 million by 2020.
Given the significant financial challenges of the next few years we cannot rest on our laurels. We need to continue to drive for value for money in all we do. This is what we will strive to deliver in 2017/2018 and for the years to come.
5.5 Operating efficiencies
Measure 15/16 16/17 Upper Quartile
Total Cost Per Unit £3,416 £2,562 £2,828
Total cost to manage an individual property.
Rent Collected 99.8% 100.3% 100.1%
Total amount of rent collected in the year.
Overheads as % of adjusted turnover
8.4% 8.5% 8.4%
Proportion of turnover required for overheads.
In section 2 we give the reasons for the decrease in the total cost per unit which have primarily focused on reducing responsive repairs and a slowdown in spending on planned and cyclical maintenance.
Our occupancy level of 98.7% remains below that of Upper Quartile performance of other housing associations who achieve 99.7%. This is due to the fact we operate in some housing markets with low demand where we are in direct competition with the private rented sector.
We are also identifying poorly performing schemes which might need more robust interventions.
In section 3 we outlined the reasons for the large increase in the ratio of responsive repairs to planned maintenance and we are keeping a close eye on this. The level of this ratio can alter drastically depending on the timing of planned maintenance programmes by respective housing associations. We therefore believe that one year of data is not sufficient to draw any effective conclusions, however, we will closely monitor data from the sector scorecard to understand any relevant trends.
Benchmarking shows that we are currently spending £266 per property less than the Upper Quartile performers in our Northern Peer Group.
As a long term asset business we recognise that we must balance efficiency with investment. We also must ensure that our properties are effectively maintained so that they remain desirable to existing and new customers.
Our rent collected and overheads as percentage of adjusted turnover are approximately in line with the best performing housing associations in the North.

Page 27 Page 26
Together Housing
Finance PLC
Harewood Housing
Society Ltd
Appendix 1
Together Housing
Association Ltd
Newground Together
Newground CIC
Synergy Housing
Solutions Ltd
Pendleton Together
Holdings Ltd
Together Roof
Energy LTD
SP +Development
Together Roof Energy
SPV Ltd
Pendleton Together
Operating Ltd
Together Housing Group Limited
Company name
Revenue In 2015/16 (£/m)
Revenue in 2016/2017 (£/m) Brief description of activities
Together Housing Group 225.4 204.4
The development and management of social housing and a number of commercial activities.
Together Housing Association 168.8 173.8
The development and management of social housing. Key business streams are general needs housing and supported housing.
Harewood Housing Society 1.2 0.9
This is a non-charitable housing society. The company also manages commercial, shared ownership and leasehold properties.
Newground Together 1.8 1.7
Focuses on conservation, protection and improvement of the physical and natural environment.
Newground Together CIC 5.6 5.3
This is a Community Interest Company which undertakes projects which benefit communities.
Together Roof Energy SPV 1.4 1.5
This company manages and monitors investments in solar photo voltaic units on behalf of the Together Housing Group.
Pendleton Together Operating Limited 41.6 16.9
Special Purpose Vehicle for the Salford Private Finance Initiative (PFI) Project.
Synergy Housing Solutions 19.7 24.4
Provides development services to social housing providers for the delivery of new build properties.
SP + Development 4.6 6.3
This is a company set up as a Special Purpose Vehicle for the construction and sale of housing properties located within Pendleton Salford.
Joint ventures 0.8 0.3This includes companies such as the Rossendale, Together and Barnfield (RTB) Partnership and Woodnook.
Appendix 2
This is a simplified version of the group structure which excludes joint ventures and dormant companies.

Registered OfficeTogether Housing Group
Bull Green HouseHalifax
HX1 2EB
www.togetherhousing.group