current status of the energy transition
TRANSCRIPT

National University of Singapore
Current Status of the Energy Transition
Associate Prof. Scott V. Valentine, Assistant Dean (Research)
Lee Kuan Yew School of Public Policy

On the surface - gloom
But trends tell another story…
Source: BP Statistical Review of World Energy 2017

Trends 1 & 2
Price Inflation and Market Volatility
Fuel stock 2015 Proven
reserves
2015
Production
Reserves to
Production
Oil (billion barrels) 1698 33.5 50.7
Natural Gas (trillion cbm) 187 3.5 52.8
Coal (million tonnes) 891531 7820 114
BP Statistical Review of World Energy 2017
Fuel stock 1995 Proven
reserves
Change
Oil (billion barrels) 1126 572 (51%)
Natural Gas (trillion cbm) 120 67 (56%)
Coal (million tonnes) 1031610 -140079 (-14%)
Next 20 years
Energy
demand
+30%

Oil Prices ($/barrel)
Source: BP Statistical Review of World Energy 2017

Gas Prices ($/mmBTU)
Source: BP Statistical Review of World Energy 2017

Coal Prices (US$tonne)
Source: BP Statistical Review of World Energy 2017
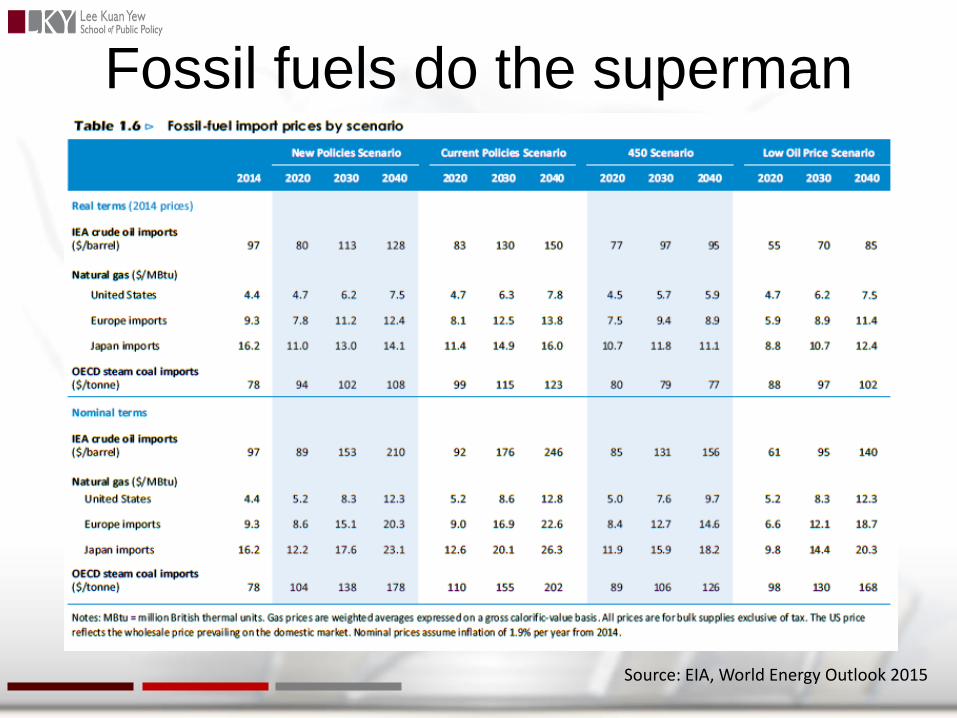
Fossil fuels do the superman
Source: EIA, World Energy Outlook 2015

Trend 3
The Strategic Need to Diversity

Trend 4
The Needs to Sever Links to Instability
CIA World Factbook

Not Much Better for Natural Gas
CIA World Factbook (2014 data)

Trend 5
Improved Understanding of Environmental /
Health Connections
US annually:
• Vehicle emissions:
• 58,000
premature
deaths
• Power plant
emissions:
• 54,000
premature
deaths
(Caiazzo et al., 2013)
China and India 2015
- Around 2.2 million deaths annually from air
pollution (State of Global Air 2017)

Trend 6
Enhanced Evidence of CC Severity
• Hurricane Sandy (2012): US$65 Billion
• 41 Extreme Weather events in 2013
– Damages over US$1 billion each
• Before:
– Benefit now; Pay later
• Now:
– Pay now; Pay later

Trend 7
Disparate Approaches to Nuclear Power
• Before:
– Installed nuclear power capacity growth +38%
~ +208% by 2030 (World Nuclear Association,
2008).
– 60+ nations investigating adoption of nuclear
power (Sovacool and Valentine, 2012).
• Post Fukushima:
– Financial Woes: Westinghouse, Toshiba,
Areva
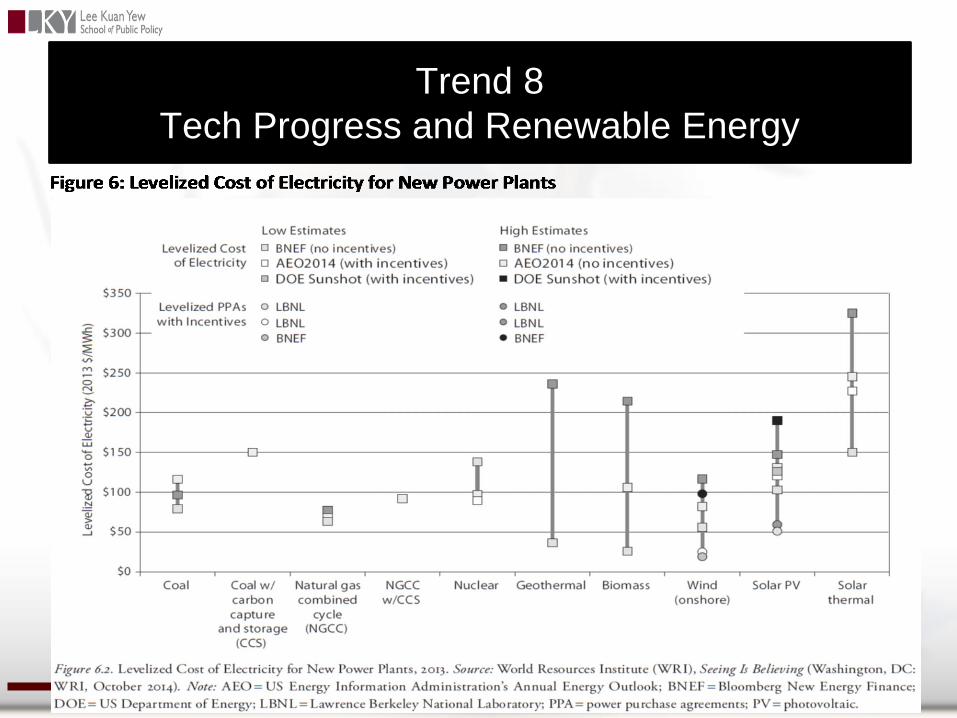
Trend 8
Tech Progress and Renewable Energy

Trend 9
The Rise of Government and Market Support for
Renewable Energy
Source: REN21 (REN21, 2017)
Investment in Renewable Energy: 2006-2016

Critical Mass of Investment
Source: REN21 (REN21, 2017)
Investment in Renewable Energy: 2006-2016

Trend 10:
First mover advantages
Clean-tech sector - €4 trillion in sales by 2025 (Roland Berger Strategy Consultants, 2011).
Source: Bloomberg New Energy Finance

The Wild Card?