cumulative frequency mrs. aldous, mr. beetz & mr. thauvette dl sl mathematics
TRANSCRIPT

CUMULATIVE FREQUENCYMrs. Aldous, Mr. Beetz & Mr. ThauvetteDL SL Mathematics

You should be able to:
Construct and analyse cumulative frequency diagrams.
Use a cumulative frequency graph to estimate median quartiles and percentiles.
Use a cumulative frequency graph to estimate the interquartile range (IQR).
Question
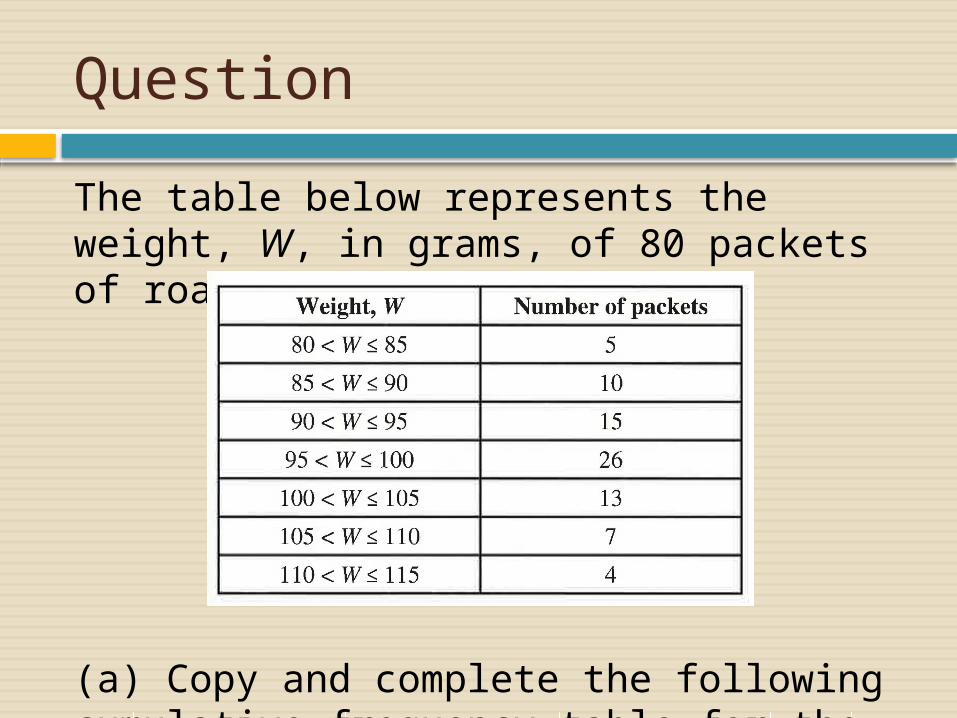
The table below represents the weight, W, in grams, of 80 packets of roasted peanuts.
(a) Copy and complete the following cumulative frequency table for the above data.
Continued…
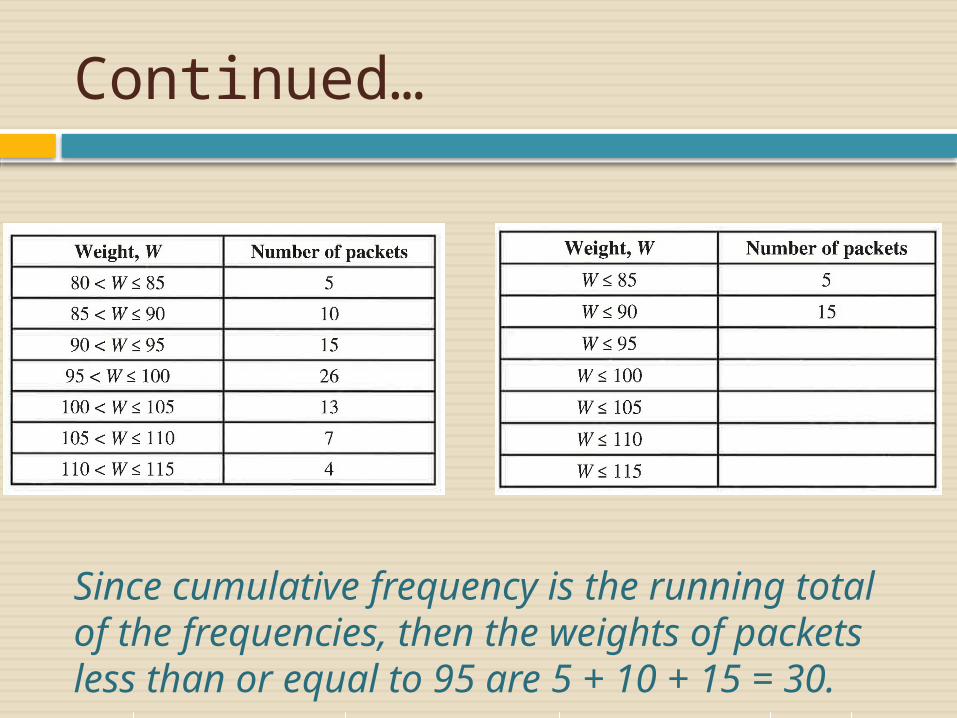
Since cumulative frequency is the running total of the frequencies, then the weights of packets less than or equal to 95 are 5 + 10 + 15 = 30.

Continued…
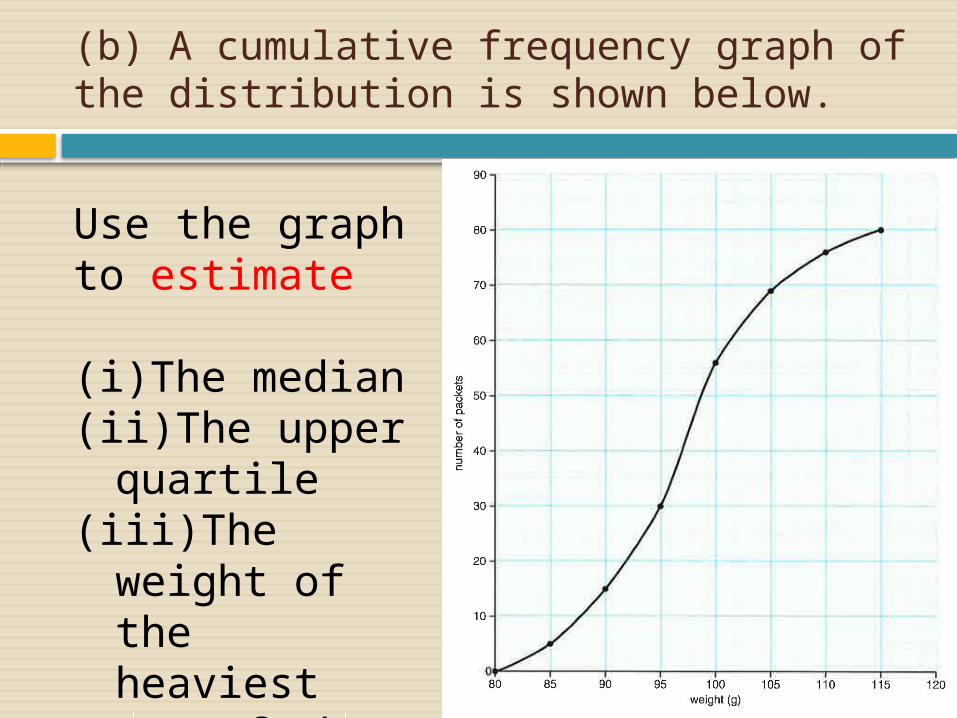
(b) A cumulative frequency graph of the distribution is shown below.
Use the graph to estimate
(i)The median(ii)The upper
quartile(iii)The weight
of the heaviest 10% of the packets.

From the graph the following values can be observed:

Important notes:
Be prepared to draw lines on a cumulative frequency graph when estimating values as a way of showing your work.
Clearly identify the quartiles when using the cumulative frequency graph to determine the IQR.

You should know:
Cumulative frequency is the total number of occurrences up to a particular value, that is, the running total.
The cumulative frequency graph is obtained by plotting cumulative frequencies against upper interval boundaries.
A cumulative frequency graph (or table) can be used to find the number of scores that lie above or below a certain value, k.
k% of the data lie below the kth percentile. For example, 80% of the data lie below the 80th percentile (and hence, 20% lie above).