cultivation of chlorella vulgaris in nutrient solution ... · acknowledgement i wish to thank my...
TRANSCRIPT

Master’s thesis • 30 ECTS
Självständigt arbete vid LTJ-fakulteten, SLU
Department of Horticulture
Alnarp 2012
Cultivation of Chlorella vulgaris in nutrient solution from greenhouse tomato production - A possibility to reduce nutrient levels and produce commercially
interesting metabolites
Odling av Chlorella vulgaris i näringslösning från
tomatproduktion i växthus
- En möjlighet att reducera näringsnivåer och producera kommersiellt
intressanta metaboliter
Stina Månsson

A English Title Cultivation of Chlorella vulgaris in nutrient solution from greenhouse tomato production - A possibility to reduce nutrient levels and produce
commercially interesting metabolites
S Swedish Title Odling av Chlorella vulgaris i näringslösning från tomatproduktion i växthus - En möjlighet att reducera näringsnivåer och producera
kommersiellt intressanta metaboliter
a Author Stina Månsson
S Supervisor Malin Hultberg, SLU
Department of Horticulture
Examiner Sammar Khalil, SLU
Department of Horticulture
Credit 30 ECTS
Level E, A2E
Course title Examensarbete inom Hortonomprogrammet, 30 hp
Course code EX0544
Programme Horticulture Science Programme
Place of Publication Alnarp
Year of Publication 2012
Picture cover Chlorella vulgaris magnified 100 times. Photo: Stina Månsson
Title of Series Självständigt arbete vid LTJ-fakulteten, SLU
Online Publication http://stud.epsilon.slu.se
Key Words Microalgae, Chlorella vulgaris, greenhouse, hydroponics, nutrient reduction, polyunsaturated fatty acids

ACKNOWLEDGEMENT
I wish to thank my supervisor Malin Hultberg for all help during my work. I appreciate
the quick and thoughtful feedback I received during the process. I also wish to thank
Anders Carlsson for the fatty acid analyse, Karl-Erik Gustavsson for the help with
carotenoid measurements and my examiner Sammar Khalil. Finally, I wish to thank all
further persons who, in different ways, helped me during the process.
Stina Månsson
Alnarp 2012
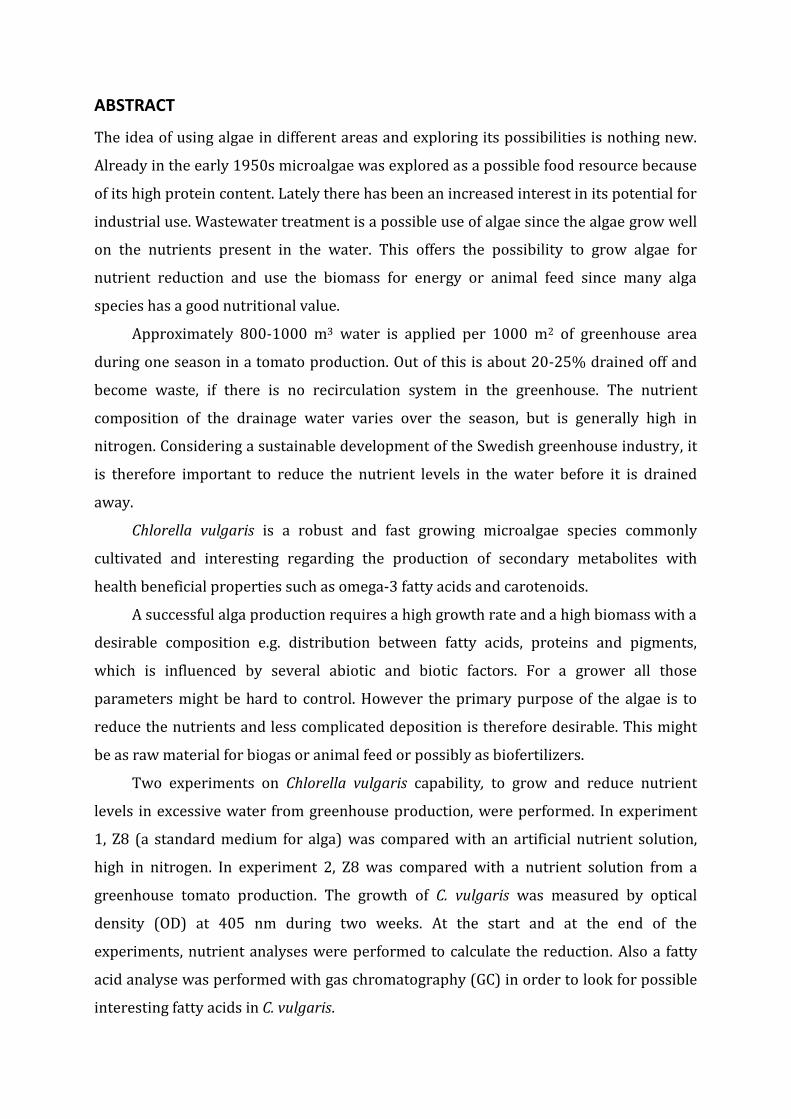
ABSTRACT
The idea of using algae in different areas and exploring its possibilities is nothing new.
Already in the early 1950s microalgae was explored as a possible food resource because
of its high protein content. Lately there has been an increased interest in its potential for
industrial use. Wastewater treatment is a possible use of algae since the algae grow well
on the nutrients present in the water. This offers the possibility to grow algae for
nutrient reduction and use the biomass for energy or animal feed since many alga
species has a good nutritional value.
Approximately 800-1000 m3 water is applied per 1000 m2 of greenhouse area
during one season in a tomato production. Out of this is about 20-25% drained off and
become waste, if there is no recirculation system in the greenhouse. The nutrient
composition of the drainage water varies over the season, but is generally high in
nitrogen. Considering a sustainable development of the Swedish greenhouse industry, it
is therefore important to reduce the nutrient levels in the water before it is drained
away.
Chlorella vulgaris is a robust and fast growing microalgae species commonly
cultivated and interesting regarding the production of secondary metabolites with
health beneficial properties such as omega-3 fatty acids and carotenoids.
A successful alga production requires a high growth rate and a high biomass with a
desirable composition e.g. distribution between fatty acids, proteins and pigments,
which is influenced by several abiotic and biotic factors. For a grower all those
parameters might be hard to control. However the primary purpose of the algae is to
reduce the nutrients and less complicated deposition is therefore desirable. This might
be as raw material for biogas or animal feed or possibly as biofertilizers.
Two experiments on Chlorella vulgaris capability, to grow and reduce nutrient
levels in excessive water from greenhouse production, were performed. In experiment
1, Z8 (a standard medium for alga) was compared with an artificial nutrient solution,
high in nitrogen. In experiment 2, Z8 was compared with a nutrient solution from a
greenhouse tomato production. The growth of C. vulgaris was measured by optical
density (OD) at 405 nm during two weeks. At the start and at the end of the
experiments, nutrient analyses were performed to calculate the reduction. Also a fatty
acid analyse was performed with gas chromatography (GC) in order to look for possible
interesting fatty acids in C. vulgaris.

The results gave a significant reduction of nutrients, which indicate that Chlorella
vulgaris can grow and reduce nutrient levels in a nutrient solution with a distribution
that can be expected from a tomato production. On the other hand it is uncertain if C.
vulgaris can compete strong enough in a nutrient solution that contains several other
microorganisms.
The iron reduction in both experiments was close to 100% and it might be possible
that the iron deficiency limited the growth.
The result from the fatty acid analysis was consistent with earlier reported results
of fatty acid composition in Chlorella vulgaris and no longer fatty acids then 18:3 were
found.
In a larger system outside the lab, the amount of biomass and the purity as well as
the obtained nutrient reduction will all give a variable result from time to time and
between growers due to all culture parameters that are hard to control and
environmental conditions which will fluctuate.
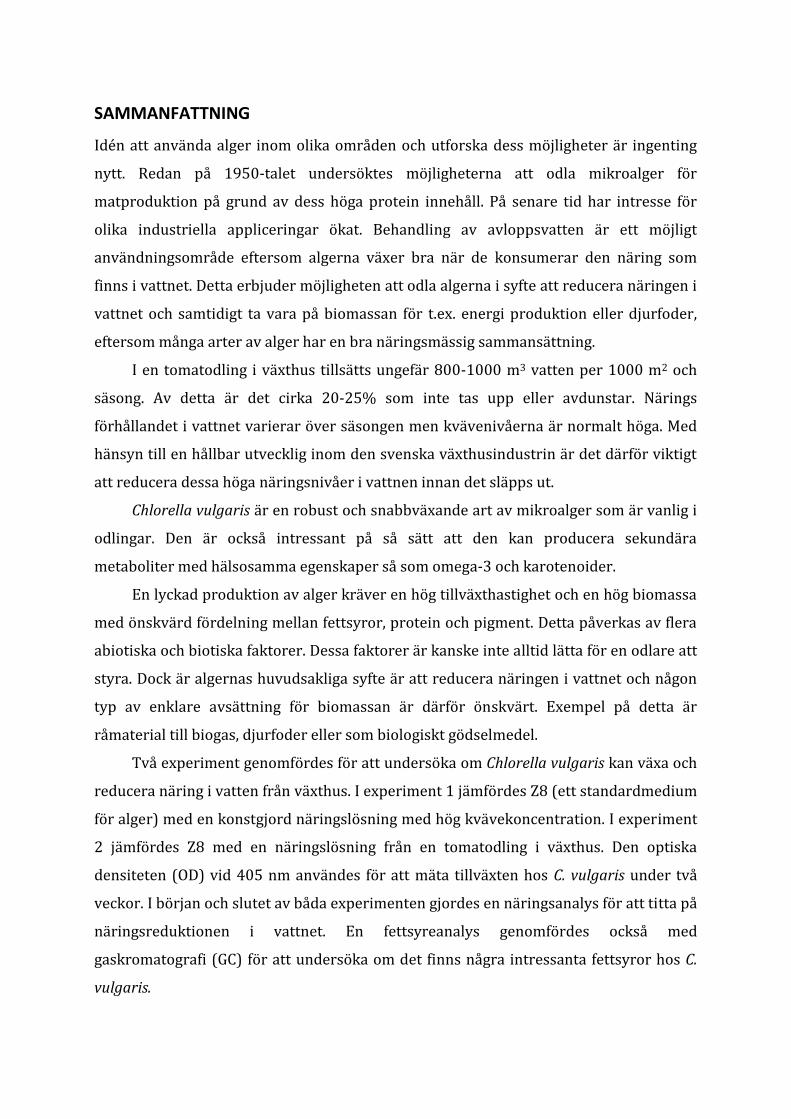
SAMMANFATTNING
Idén att använda alger inom olika områden och utforska dess möjligheter är ingenting
nytt. Redan på 1950-talet undersöktes möjligheterna att odla mikroalger för
matproduktion på grund av dess höga protein innehåll. På senare tid har intresse för
olika industriella appliceringar ökat. Behandling av avloppsvatten är ett möjligt
användningsområde eftersom algerna växer bra när de konsumerar den näring som
finns i vattnet. Detta erbjuder möjligheten att odla algerna i syfte att reducera näringen i
vattnet och samtidigt ta vara på biomassan för t.ex. energi produktion eller djurfoder,
eftersom många arter av alger har en bra näringsmässig sammansättning.
I en tomatodling i växthus tillsätts ungefär 800-1000 m3 vatten per 1000 m2 och
säsong. Av detta är det cirka 20-25% som inte tas upp eller avdunstar. Närings
förhållandet i vattnet varierar över säsongen men kvävenivåerna är normalt höga. Med
hänsyn till en hållbar utvecklig inom den svenska växthusindustrin är det därför viktigt
att reducera dessa höga näringsnivåer i vattnen innan det släpps ut.
Chlorella vulgaris är en robust och snabbväxande art av mikroalger som är vanlig i
odlingar. Den är också intressant på så sätt att den kan producera sekundära
metaboliter med hälsosamma egenskaper så som omega-3 och karotenoider.
En lyckad produktion av alger kräver en hög tillväxthastighet och en hög biomassa
med önskvärd fördelning mellan fettsyror, protein och pigment. Detta påverkas av flera
abiotiska och biotiska faktorer. Dessa faktorer är kanske inte alltid lätta för en odlare att
styra. Dock är algernas huvudsakliga syfte är att reducera näringen i vattnet och någon
typ av enklare avsättning för biomassan är därför önskvärt. Exempel på detta är
råmaterial till biogas, djurfoder eller som biologiskt gödselmedel.
Två experiment genomfördes för att undersöka om Chlorella vulgaris kan växa och
reducera näring i vatten från växthus. I experiment 1 jämfördes Z8 (ett standardmedium
för alger) med en konstgjord näringslösning med hög kvävekoncentration. I experiment
2 jämfördes Z8 med en näringslösning från en tomatodling i växthus. Den optiska
densiteten (OD) vid 405 nm användes för att mäta tillväxten hos C. vulgaris under två
veckor. I början och slutet av båda experimenten gjordes en näringsanalys för att titta på
näringsreduktionen i vattnet. En fettsyreanalys genomfördes också med
gaskromatografi (GC) för att undersöka om det finns några intressanta fettsyror hos C.
vulgaris.

Resultaten visade på en signifikant reducering av näringen. Det indikerar att
Chlorella vulgaris kan odlas för att reducera näringsnivåer i överblivet vatten från
växthus med tomatproduktion. Det är dock oklart om C. vulgaris kan konkurrera
tillräckligt starkt i näringslösningar som innehåller många andra mikroorganismer.
Reduktionen av järn var nära 100% vid båda experimenten och det är möjligt att
järnet begränsade tillväxten hos algerna i näringslösningen.
Resultatet från fettanalysen överensstämde med tidigare rapporterad
fettsyresammansättning hos Chlorella vulgaris och inga längre fettsyror än 18:3 hittades.
I ett storskaligt system hos en odlare kommer mängden biomassa och dess renhet
och lika så uppnådd näringsreduktion att ge ett varierande resultat från gång till gång
och mellan olika odlare. Det beror på svårigheten att styra alla odlingsparametrar samt
att omgivande förhållanden varierar.

INDEX
1 INTRODUCTION ........................................................................................................................................... 1
1.1 Objectives ............................................................................................................................................... 2
1.2 Limitations ............................................................................................................................................. 2
2 BACKGROUND ............................................................................................................................................... 3
2.1 Greenhouse companies in Sweden ............................................................................................... 3
2.1.1 Nutrition composition of the wastewater from greenhouse production .............. 4
2.2 Algae ......................................................................................................................................................... 4
2.2.1 Chlorella vulgaris ......................................................................................................................... 5
2.2.2 Fatty acids in alga ........................................................................................................................ 6
2.2.3 Pigments in Chlorella vulgaris ................................................................................................ 7
2.3 Perspectives on algal cultivation in the horticultural sector .............................................. 8
2.3.1 Maintains and requirement for the alga production ..................................................... 8
2.3.2 Possible use of the alga biomass ........................................................................................ 10
3 MATERIAL AND METHODS .................................................................................................................. 12
3.1 Microalgae ........................................................................................................................................... 12
3.2 Cultivation of Chlorella vulgaris .................................................................................................. 12
3.2.1 Experiment 1 ............................................................................................................................... 12
3.2.2 Experiment 2 ............................................................................................................................... 13
3.2.3 Analysis of nutrient reduction ............................................................................................... 13
3.3 Production of metabolites ............................................................................................................. 13
3.3.1 Fatty acids .................................................................................................................................... 13
3.3.2 Induction of carotenoid production .................................................................................... 13
3.4 Statistic analyses ............................................................................................................................... 15
4 RESULTS ....................................................................................................................................................... 16
4.1 Cultivation of Chlorella vulgaris in greenhouse .................................................................... 16
4.2 Nutrient reduction ........................................................................................................................... 17
4.3 Fatty acid composition ................................................................................................................... 18
4.4 Growth and pigment formation under LED light ................................................................. 19
5 DISCUSSION ................................................................................................................................................ 22
6 CONCLUSIONS ............................................................................................................................................ 28
6.1 Conclusions ......................................................................................................................................... 28
6.2 Further studies .................................................................................................................................. 28
7 REFERENCES .............................................................................................................................................. 30
1
1 INTRODUCTION
The idea of using algae in different areas and exploring its possibilities is nothing new.
Already in the early 1950s microalgae was explored as a possible food resource because
of its high protein content (Pufelski et al., 2010; Becker, 1994). But lately there has been
an increased interest in its potential for industrial use. As an example there is an
extensive amount of articles dealing with the possibility to grow algae for production of
biofuel (Hu et al., 2008; Putt, 2008). Algae are fast growing and can be cultivated in
systems that don’t require agricultural land and thereby it doesn’t compete with the
food supply (Mercer & Armenta, 2011). Wastewater treatment is another possible use of
algae since they grow well on the nutrients present in the water (Larsdotter, 2006). This
offer the possibility to grow the algae for nutrient reduction and use the biomass for
energy or animal feed since many alga species has a good nutritional value. They also
produce valuable secondary metabolites such as pigments and polyunsaturated fatty
acids, which offers commercial applications within the medical-, cosmetic- and health
industry. In some countries like Kina, Japan, India and USA there is a tradition of
growing algae (Spolaore et al., 2005), but in Sweden it is still a rather unexplored area.
This study is a part of a larger research project lasting January 2012 to December
2012, at the department of horticulture, at SLU, Alnarp. The aim of the research project
is to examine the possibilities to grow algae producing commercially interesting
metabolites for nutrient reduction in nursery wastewater. Several greenhouse growers
in Sweden are using hydroponic systems, where the greenhouse culture is grown only in
a nutrient solution. In a hydroponic system the nutrient is added in a water solution and
the excessive nutrient rich water is collected and recirculated or just drained away. It is
desirable to have a closed system in the greenhouse where the water is recirculated, but
far from all greenhouses in Sweden has this possibility today. Discharging the used
nutrient solution, containing high levels of nitrogen and phosphor and sometimes also
pesticide residues (Löfkvist et al., 2009), has a negative impact on the environment.
According to the Swedish environmental code (Regeringskansliet, 2000) it is forbidden
to let wastewater out into the field, water areas or the groundwater. This also includes
water from greenhouses with high levels of nutrients (Hansson & Johansson, 2007). If
not recirculated, the excessive water from a greenhouse, which in a tomato production
of 2000 m2 can be as much as 500 m3 during a season (Hansson, 2003), therefore needs
2
to be cleaned in some way. One way to do this could be with microalgae since they
reduce the nutrient level in the water as they grow.
1.1 Objectives
This report looks into the possibilities of growing the microalgae Chlorella vulgaris in
order to clean excessive nutrient solution from greenhouses. C vulgaris is also
interesting regarding the production of secondary metabolites with health beneficial
properties. The main questions for this study are:
How well does Chlorella vulgaris grow in a nutrient solution that can be expected
as waste from a greenhouse with tomato production?
What effect has the growth of Chlorella vulgaris on reduction of nutrients in the
water?
What interesting metabolites can be found in Chlorella vulgaris and how can those
be utilized?
1.2 Limitations
This study focus only on the microalgae Chlorella vulgaris, which is a robust and fast
growing species (Pufelski et al., 2010). There are several other algae that could be of
interest in a study like this. Different algae have different requirement and the results of
the present study are only valid for C. vulgaris. Also, there are several metabolites
produced by C. vulgaris that could be of interest but this study focus on fatty acids and
carotenoids. The study do not go into details about how the metabolites can be extracted
and purified, since this is still an expensive and energy intensive process (Mercer &
Armenta, 2011), neither is the harvest of the cells studied.

3
2 BACKGROUND
2.1 Greenhouse companies in Sweden
In year 2008 there were 784 greenhouse companies in Sweden with an average
greenhouse area of 3 390 m2 (SJV, 2008). Out of this is approximately 350 000 m2
tomato production distributed on 198 companies. Between year 1984 and 2008 there
has been a decrease in numbers of greenhouse companies and during the same period
an increase of the average greenhouse area. Most companies, about 150, have a heated
greenhouse in the range of 1000-2000 m2.
For application and collection of water there are different systems, which can be
used. For those growers who grow their plants in a substrate, normally channels are
used, either on the floor, on tables or hanging from the sealing (Löfkvist et al., 2009).
Some growers use a system with furrows on the ground where excessive water is
collected and lead away. There are also growers that have drainage system underneath
the greenhouse. According to a study over water collection systems in Swedish
greenhouses, performed during the autumn 2006, approximately 2/3 of all greenhouses
had some sort of collecting system (Löfkvist et al., 2009). In table 1 and 2 it is specified
what collecting systems that were used and how the drainage water was used (only
vegetable growers are included).
Another way to cultivate, which becomes more and more popular, is without a
substrate. Instead only a nutrient solution is used. This is known as hydroponic systems
and requires a recirculation system for the water. According to Löfkvist et al. (2009), the
growers put little attention on what is happening to the drainage water. Considering a
sustainable development of the Swedish greenhouse industry it is important to avoid
leakage of the drainage water to the catchment.
Table 1. Systems used for water collection in greenhouses among vegetable growers in Sweden. The numbers are presented as percentage of companies and total greenhouse area it corresponds to.
Water collecting systems Vegetables
(% of companies) Area m2
Channels 24 290 000
Furrows 37 255 000 Other 6 29 000 No collection of water 38 210 000
(Löfkvist et al., 2009)
4
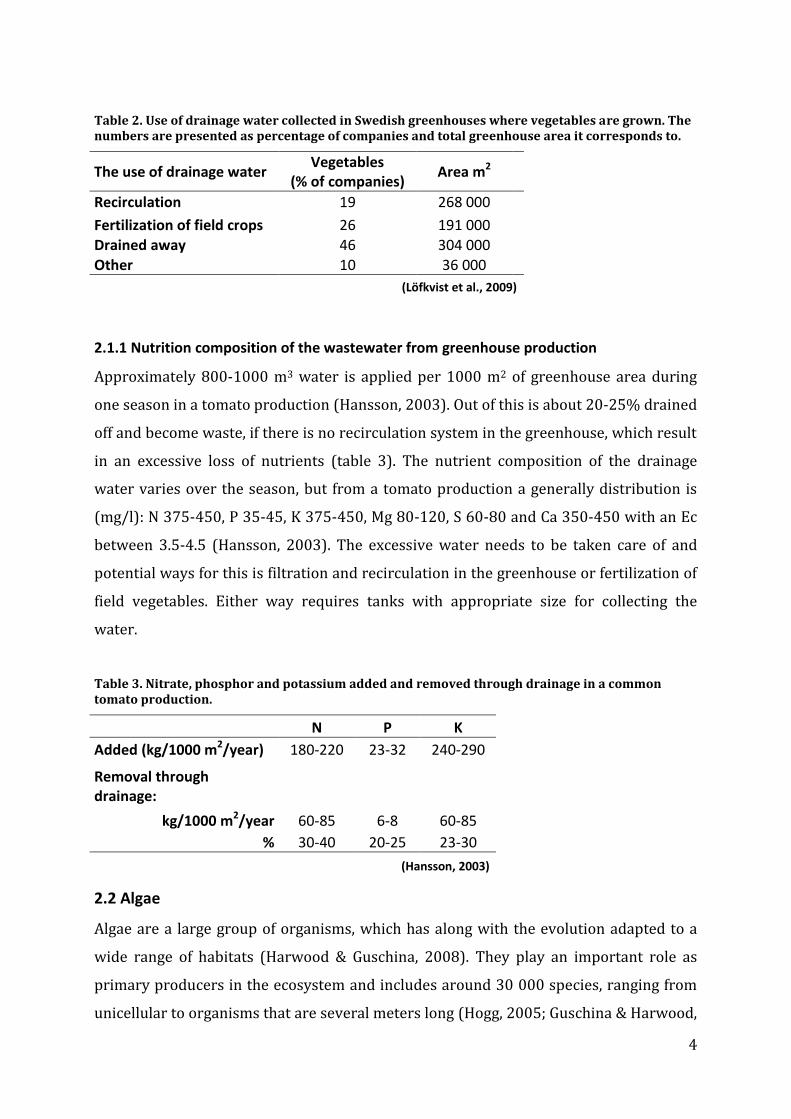
Table 2. Use of drainage water collected in Swedish greenhouses where vegetables are grown. The numbers are presented as percentage of companies and total greenhouse area it corresponds to.
The use of drainage water Vegetables
(% of companies) Area m2
Recirculation 19 268 000
Fertilization of field crops 26 191 000 Drained away 46 304 000 Other 10 36 000
(Löfkvist et al., 2009)
2.1.1 Nutrition composition of the wastewater from greenhouse production
Approximately 800-1000 m3 water is applied per 1000 m2 of greenhouse area during
one season in a tomato production (Hansson, 2003). Out of this is about 20-25% drained
off and become waste, if there is no recirculation system in the greenhouse, which result
in an excessive loss of nutrients (table 3). The nutrient composition of the drainage
water varies over the season, but from a tomato production a generally distribution is
(mg/l): N 375-450, P 35-45, K 375-450, Mg 80-120, S 60-80 and Ca 350-450 with an Ec
between 3.5-4.5 (Hansson, 2003). The excessive water needs to be taken care of and
potential ways for this is filtration and recirculation in the greenhouse or fertilization of
field vegetables. Either way requires tanks with appropriate size for collecting the
water.
Table 3. Nitrate, phosphor and potassium added and removed through drainage in a common tomato production.
N P K
Added (kg/1000 m2/year) 180-220 23-32 240-290
Removal through drainage:
kg/1000 m2/year 60-85 6-8 60-85
% 30-40 20-25 23-30
(Hansson, 2003)
2.2 Algae
Algae are a large group of organisms, which has along with the evolution adapted to a
wide range of habitats (Harwood & Guschina, 2008). They play an important role as
primary producers in the ecosystem and includes around 30 000 species, ranging from
unicellular to organisms that are several meters long (Hogg, 2005; Guschina & Harwood,

5
2006). All algae are eukaryotic and almost all have a cell wall consisting of cellulose. The
algae are separated taxonomically mainly based on the pigments they possess, main
components in their cell wall and storage compound. Some of the major groups are
Euglenophyta, Pyrrophyta, Chrysophyta, Chlorophyta (green algae), Phaeophyta (brown
algae) and Rhodophyta (red algae).
The group Chlorophyta includes both unicellular and multicellular organisms and
are similar to the plants in several ways. They hold chlorophyll a and b and some
carotenoids, their main storage compound is starch and their cell wall is made of
cellulose (Harwood & Guschina, 2008). Just like plants, algae lives out of carbon dioxide
and sun energy.
Microalgae are small organisms, normally unicellular. This heterogeneous group of
organisms offers a rich source that could be applied and used for animal feed, food,
cosmetics, fuel and pharmaceutical (Olaizola, 2003). On the other hand it is still a less
studied group due to its largeness and only a few thousands strains are kept in
collections. When it comes to the chemical content, only a few hundred has been
evaluated and of those has a handful been cultivated for industrial purposes (Olaizola,
2003).
2.2.1 Chlorella vulgaris
The green alga Chlorella vulgaris (figure 1) is a commonly cultivated species, according
to Spolaore et al. (2005), the annual dry weight production of Chlorella is about 2000 t.
It is a small green, micro alga only 2-10 µm in diameter and it has a high content of
proteins. According to Spolaore et al. 2005, C. vulgaris is estimated to compose of 51-
58% protein, 12-17% carbohydrate and 14-22% lipid (calculated as % of dry matter),
but it depends on environmental conditions under which C. vulgaris has grown and
variations can be seen. According to Putt (2008) the lipid content can be up to 30%
under certain conditions. Seyfabadi et al. (2010) reported a protein concentration of 33-
46% when performing experiments with different light regimes. C. vulgaris also
produces other metabolites such as pigments and can be grown both autotrophically
and heterotrophically (Seyfabadi et al., 2010). Autotrophic means that the cell collects
the energy from the light through photosynthesis, while heterotrophic growth only
requires a carbon source as energy (Larsdotter, 2006).

6
According to Putt (2008) Chlorella vulgaris has the potential to double in cell
number every 8 hour at a temperature between 20-35oC during autotrophic growth,
provided that nutrients and light is not limiting the growth.
Figure 1. Chlorella vulgaris seen in microscope magnified 100 times. The red line is equal to 10 µm. A: Two separate cells. B: A group of cells, different in size and generation phase. (Photo S. Månsson)
2.2.2 Fatty acids in alga
Fatty acids are divided in saturated, unsaturated and polyunsaturated. The saturated
ones has no double bindings like 16:0 (palmitic acid), unsaturated fatty acids has one
double bound, e.g. 18:1 (oleic acid) and the polyunsaturated fatty acid (PUFA) has more
than one double binding. Omega-3, which is a type of polyunsaturated fatty acids, has
repeatedly been proved to be essential for the human body and important for
preventing cardiovascular diseases (Rymer et al., 2009; Cannon, 2009; Harris, 2004).The
omega-3 fatty acid alpha-linolenic acid (ALA) act as precursor for eicosapentaenoic acid
(EPA) and docosahexaenoic acid (DHA), which has an anti-inflammatory effect in the
body (Cannon, 2009). Also omega-6 fatty acids are important for a balanced diet.
Linoleic acid is an important omega-6 fatty acid that acts as a precursor for arachidonic
acid (AA). Both omega-3 and omega-6 fatty acids have an essential role in the human
body as components of membranes and receptor sites.
Neither omega-3 nor omega-6 can be synthesised by the human body and need to
be assimilated through our diet. With the western diet of today the risk of omega-6
deficiency is minimal since the ratio of intake between omega-6 and omega-3 is
suggested to be about 10:1, while the recommended ratio are 3:1 (Cannon, 2009).

7
Omega-3 is normally assimilated from fish through our diet. Fish oil is an excellent
source of omega-3 since it contains already synthesised DHA and EPA, which is the
active form of omega-3 in the body. The human body can convert ALA to DHA and EPA
but very inefficient. Also, omega-6 and omega-3 go through the same delta-6 desaturase
enzymatic pathway and thereby compete with each other (Cannon, 2009).
Today there is a huge market of nutritional supplements, which offering the
possibility to consume fish oil. But increasing demand for omega-3, due to health aspects
and increasing population, is raising the question about the sustainability of today’s
production of omega-3 (Cannon, 2009). Many fish species are threatened by extinction
due to overfishing, which has a great impact on the ecosystem and on the living
conditions for humans resident in certain areas. A necessary development is to change
the human behaviour concerning fishing but also to find alternative sources for
production of omega-3.
The fish does not synthesise DHA and EPA themselves but receive these fatty acids
by eating microalgae (Harris, 2004), i.e. certain microalgae can be a possible source for
essential omega-3 fatty acids. According to Cannon (2009) there is collected evidence
that oil from microalgae can meet the human need for essential omega-3 fatty acids.
Over the past years PUFAs in microalgae (both marine and freshwater) has been
subjected to an increased research and commercial interest. Already some species are
used to a large extent in order to produce PUFAs for aquaculture (Guschina & Harwood,
2005).
2.2.3 Pigments in Chlorella vulgaris
Except from fatty acids, other interesting secondary metabolites produced in Chlorella
vulgaris are pigments. The main pigments are chlorophyll a and chlorophyll b but also
carotenoids such as betacaroten, zeaxanthin and astaxanthin have been reported in C.
vulgaris (Gouveia et al., 1995). The characteristic orange colour of carotenoids is due to
its absorbance between 400 and 500 nm (Taiz & Zeiger, 2006). The synthesis of
carotenoids is restricted to the plant world and found mainly in fungi, algae and higher
plants. Animals need to assimilate those through the food (Gouveia et al., 1995).
In plants carotenoids acts as accessory pigments in photosynthesis and can protect
against oxidation and light stress (Taiz & Zeiger, 2006). The biosynthetic pathway of
8
carotenoid formation is well understood but still its duration will be affected by abiotic
stress factors such as salinity, light and nutrient deficiency (Gouveia et al., 1995).
Interestingly it has been reported that it is possible to stimulated production of
carotenoids in Chlorella vulgaris when they are cultivated under certain stress
conditions such as high light intensity and low nutrient levels (Gouveia et al., 1995).
2.3 Perspectives on algal cultivation in the horticultural sector
2.3.1 Maintains and requirement for the alga production
A successful alga production requires a high growth rate and a high biomass with a
desirable composition e.g. distribution between fatty acids, proteins and pigments,
which is crucial for the nutritional value of the alga biomass (Seyfabadi et al., 2010). This
is influenced by several abiotic factors:
Light: The light is important since it drives the photosynthesis and both duration and
intensity has an impact (Seyfabadi et al., 2010). The day length affects the growth rate
indirect by affecting the circadian rhythm of photosynthesis, respiration and cell
division. In natural conditions alga are exposed to changes in day length over the
year. Studies have shown that response in growth rate and photosynthesis to day
length varies with species, but also depends on other abiotic factors such as
temperature and phosphor availability (Litchman et al., 2003). According to results
from experiments performed by Litchman et al. (2003), the maximum rate of
photosynthesis, in green algae, is very sensitive to phosphor limitations. Light can
often be a limiting factor in algal mass cultivation system since the cells shadowing
each other (Seyfabadi et al., 2010).
pH: A natural pH is desirable, or slightly acid, in order to prevent precipitation of
nutrients (Becker, 1994). The pH will rise as the algae grow and consume the carbon
dissolved in the water. If CO2 is not added to the nutrient solution and the buffering
capacity is low, pH will reach over 9 which will inhibit the algae growth.
Temperature: A suitable temperature range for most algae is 15-25oC (Larsdotter,
2006). To high temperature will inhibit the growth, but this is normally not a problem
in Sweden. Another problem, which are of concern in Sweden, might be
photoinhibition that occur when light intensity is high but the temperature is low
(Larsdotter, 2006).
9
Nutrients: Nitrogen is a very important nutrient since more than 10% of the alga
biomass can consist of it and since it is a main problem during eutrophication. Algae
can normally assimilate nitrogen both from nitrate, ammonia and nitrite, but the
latter one is toxic at too high levels. The chemical composition of Chlorella vulgaris
varies depending on N-source and concentration. According to Becker (1994) the
lipid content of Chlorella vulgaris decreased with a higher concentration of nitrogen.
At the same time there was an increase in protein content. The amount of lipids and
proteins also varied depending on if the nitrogen was supplied as NH4Cl or KNO3.
Phosphor is another key nutrient important for energy transfer and synthesis of
nucleic acids in the cell. Sulphur is important since it has an essential role in several
amino acids. Also magnesium is important due to its key position in the chlorophyll
molecule. Trace elements are important even though the required amounts are very
small.
Carbon source: A desirable ratio, suitable for most algae, between N:P:C in the
substrate are 8:1:50 or even 16:1:106 (Pufelski et al., 2010). About 50% of the alga
biomass is made up of carbon and is therefore needed to a large extent for good
growth (Becker, 1994). The algae need the carbon for the photosynthesis, just like
plants. A carbon source could be added as CO2 into the growing solution, or as an
organic source such as sugar. The natural CO2 present in the air is not sufficient to
maintain optimal growth.
Biotic factors that will influent the rate of success are the presence of pathogens such as
bacteria and viruses, predation by zooplankton and competition (de la Noue et al.,
1992).
Today there are some systems worked out for large-scale production of
microalgae. The two main systems are open ponds and closed photobioreactors that are
divided into covered raceways and tubular reactors (Larsdotter, 2006). Open ponds are
harder to control since they are more affected by the surrounding conditions and can
easy be contaminated. On the other hand they are more easy to construct and operate
and can be preferable from an economic aspects. A third and less tested way to grow the
algae is by immobilise them. They are trapped in a solid medium allowing water and
nutrient diffuse to the cell. The greatest advantage with this method is that the harvest is

10
taken care of, which normally can be rather complicated, especially for Chlorella vulgaris
due to its small size (Pufelski et al., 2010).
2.3.2 Possible use of the alga biomass
As can be seen in figure 2 there are several potential ways to use the alga biomass. Some
of them already established like food and food additives, and others still explored such
as fuels and biogas. Becker (1994) suggests several specified applications of
commercially produced algae e.g. food (protein supplements), feed (protein and vitamin
supplement for poultry, cattle, pigs and fish), pigments (β-carotene as food colour and
food supplement as provitamin A), fine chemicals (fatty acids, lipids, amino acids,
vitamins), fuel (oil, biogas), hormones (auxins, gibberllins, cytokines) and others (bio
fertilizer, waste treatment).
Since there is a lack of PUFAs in today’s western diet, Rymer et al. (2009) suggest
that one way to increase the consumption of PUFAs in the human diet is by the
enrichment of staple foods e.g poultry meat. In fact, incorporation of alga into animal
feed is a rather common application. About 30% of today’s total algae production is used
for this purpose. The main use is in aquacultures but the biomass can also be used in
feed for pets or farm animals (Spolaore et al., 2005). Aspect important to consider for
this kind of application is toxics, distribution between DHA, EPA and AA and vitamins
present in the algae. Pigment content is also important and opens up for applications as
natural food colorant, e.g. in orange juice and additives in animal feed mainly for poultry
and fish. According to Gouveia et al. (1995) the biomass of Chlorella vulgaris can be used
as natural colorant in eggs and trout flesh. For the purpose of colouring egg yolk it is
important to have a maximum level of lutein/zeaxanthin in the biomass at harvest.
The greenhouse sector provides already existing recourses that could be used to
grow algae e.g. competence among growers, water rich in nutrients as a waste product,
greenhouses, artificial lightning etc. There is a growing market for alga in Sweden and
companies specialised in production of algae start to emerge. One of the few Swedish
companies for commercial production of alga started in year 2010 in Simrishamn
(Simrisalg, n.d). The company offers algae for energy and environmental purposes, such
as refining of carbon dioxide from fumes of recycling of nutrients from wastewater and
greenhouse production. They also offer consulting service with in the area.
AstaReal AB is another company with Swedish originators. Now the company is
hold by foreign owners but still with some production in Sweden. The company is

11
specialized in producing astaxanthin from the micro alga Heamatococcus pluviailis, used
as supplement in food and animal feed (BioReal, n.d).
Figure 2. Resources available from the horticultural sector that could be used for algal cultivation and possible use of the recovered algal biomass.

12
3 MATERIAL AND METHODS
3.1 Microalgae
The microalga used in the experiments was Chlorella vulgaris, strain 211/11b, which is a
green alga belonging to the division Chlorophyta and class Trebouxiophyceae (CCAP, n.d).
The strain has its origin from freshwater in Holland and was ordered from SAMS – CCAP
(the Scottish association for marine science - culture collection of algae and protozoa).
The strain was routinely cultured in Z8 (Niva, 1976) for long time storage. Z8 is a
standard growth medium for green algae with the following composition of (mg/l): N 87
(provided as nitrate), P 5.6, K 14, Mg 2.4, S 3.2, Ca 14, Na 135.7, Cl 10.9 and Fe 5.7, trace
element (µg/l): Na2WO4·H2O 3.3, (NH4)6Mo7O24·4H2O 8.8, KBr 12, KJ 8.3, ZnSO4·7H2O
28.7, Cd(NO3)2·4H2O 15.5, Co(NO3)2·6H2O 14.6, CuSO4·5H2O 12.5, NiSO4(NH4)2SO4·6H2O
19.8, Cr(NO3)3·9H2O 4.1, V2O5 0.89, Al2(SO4)3K2SO4·24H2O 47.4, H3BO3 310, MnSO4·4H2O
223.
3.2 Cultivation of Chlorella vulgaris
The experiments were performed in a greenhouse with a 16h/8h day/night regime with
an added light, from 400 W high pressure sodium (HPS) lamps, of 100 µmol m-2 s-1,
measured as photosynthetic active irradiation. The irradiation on the greenhouse was
553 ± 83 Wh/m2/d during experiment 1 and 1640 ± 670 Wh/m2/d during experiment 2.
It is estimated that out of this irradiation 60% reaches the greenhouse chamber. The
temperature in the greenhouse was set to 20°C. Both experiments were performed as
batch cultures in 0.5 l flasks for each sample. Four replicates were used in each
treatment and the samples were continuously aerated to prevent settling of the algae.
3.2.1 Experiment 1
The growth in the standard medium Z8 (Niva, 1976) was compared with growth in an
artificial nursery drainage solution, described in Christensen & Hansson (2010), with
the following composition (mg/l): N 520 (provided as nitrate), P 63.6, K 442, Mg 44.7, S
88.2, Ca 499, Na 99, Cl 9.23, Fe 4.1, Mn 1.1, B 0.1, Zn 0.8, Cu 0.1, Mo 0.1 and pH 6.4. The
start density was 2.0 x 10⁵ cells/ml. The microalga growth was monitored every 24
hours by counting the cells in a haemocytometer and by reading the optical density at
405 nm with a spectrophotometer. The experiment was terminated after 20 days.
13
3.2.2 Experiment 2
The growth in the standard medium Z8 (Niva, 1976) was compared with growth in
nutrient solution from a tomato cultivation with the following composition (mg/l): N
383 (provided as nitrate), P 33.9, K 387, Mg 67, S 36, Ca 335, Na 22.4, Cl 13.9, Fe 2.15,
Mn 0.358, B 0.330, Zn 0.500, Cu 0.169, Mo 0.083 and pH 6.3. The start density was 1 x
104 cells/ml. The microalgae growth was monitored by reading the optical density at
405 nm at day 0, 2, 5, 7, 9, 12 and 14. At the same time was also pH and Ec measured.
The evaporation was compensated with distilled water and the experiment was
terminated after 14 days.
3.2.3 Analysis of nutrient reduction
For nutrient analysis the samples were filtered in GF/C filters followed by sterile
filtration. The nutrient concentration were analysed by the company LMI AB,
Helsingborg (table 4). LMI AB is an accredited laboratory that analysis the nutrition
concentration with ICP-OES (inductively coupled plasma - optical emission
spectrometer) according to the ISO 11885:2009 standard.
3.3 Production of metabolites
3.3.1 Fatty acids
For analysis of fatty acids alga biomass from experiment 1 was used. When stationary
phase was reached C. vulgaris was centrifuged down at 3250 g for 20 min. The analyses
were performed on both fresh and lyophilized biomass with gas chromatography (GC),
by Anders Carlsson, SLU, Alnarp. The method is described in Banas et al. (2006) and
gives a picture of the fatty acid distribution in a sample.
3.3.2 Induction of carotenoid production
Chlorella vulgaris was cultivated under the conditions described above for five days in
Z8. The culture was then diluted with an equal volume of water (aq. dest.) and allowed
to grow under LED light of six different colours, in order to examine the possibility to
stimulate pigment production. The light colours used were blue (460 nm), green (525
nm), red (620 nm), yellow (585 nm), purple (eight parts of 660 nm and one part of 460
nm) and white (430-730 nm). Seven microtitreplates with 12 wells was used, one per
each light treatment (green, blue, red, purple, yellow, white and one reference in
greenhouse light). Each well were filled with 5 ml, 2.5 ml distilled water and 2.5 ml cell
14
solution, which gave a start density of 1.7 x 10⁷ cells/ml. The six LED luminaries
(Trädgårdsteknik AB, Ängelholm, Sweden) were switched on 24 h/day and placed at
different distance, over a cart (0,5 x 0,5 m), in order to give the same irradiance of 60
µmol ·m-2 ·s-1. Each luminar had a rated power of 90 W but measurements showed some
differences between the actual powers. In order to avoid contamination from other
wavelength, each cart was wrapped in plastic, black on the outside and white on the
inside for maximal reflection.
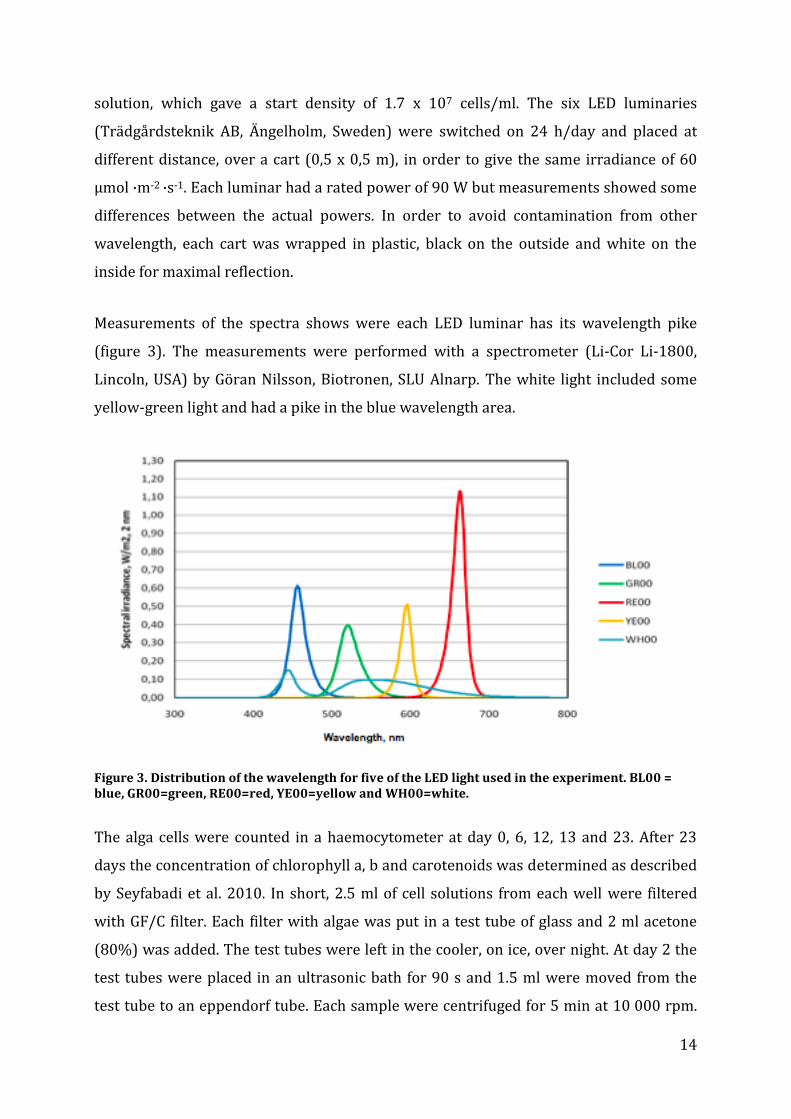
Measurements of the spectra shows were each LED luminar has its wavelength pike
(figure 3). The measurements were performed with a spectrometer (Li-Cor Li-1800,
Lincoln, USA) by Göran Nilsson, Biotronen, SLU Alnarp. The white light included some
yellow-green light and had a pike in the blue wavelength area.
Figure 3. Distribution of the wavelength for five of the LED light used in the experiment. BL00 = blue, GR00=green, RE00=red, YE00=yellow and WH00=white.
The alga cells were counted in a haemocytometer at day 0, 6, 12, 13 and 23. After 23
days the concentration of chlorophyll a, b and carotenoids was determined as described
by Seyfabadi et al. 2010. In short, 2.5 ml of cell solutions from each well were filtered
with GF/C filter. Each filter with algae was put in a test tube of glass and 2 ml acetone
(80%) was added. The test tubes were left in the cooler, on ice, over night. At day 2 the
test tubes were placed in an ultrasonic bath for 90 s and 1.5 ml were moved from the
test tube to an eppendorf tube. Each sample were centrifuged for 5 min at 10 000 rpm.

15
The absorbance was measured at 3 different wavelengths 470 nm, 647 nm and 663 nm.
The following calculations presented by Lichtenthaler & Wellburn (1983) were used to
determine the amount of pigment in the samples:
Chlorophyll a = 12.21*A663-2.81*A647
Chlorophyll b = 20.13*A647-5.03*A663
Carotenoid = (1000*A470-3.27*Ca-104*Cb)/229
3.4 Statistic analyses
The greenhouse experiments on growth and nutrient reduction was performed with
four replicates and repeated once. The reduction in nutrient concentration was
compared with paired t-test (Minitab 16). The experiment with different light quality
was performed with three replicates. The number of cells and amounts of pigment were
analysed with a one-way ANOVA followed by Tukey’s multiple comparison test (Minitab
16). Differences were considered significant at P<0.05.
16
4 RESULTS
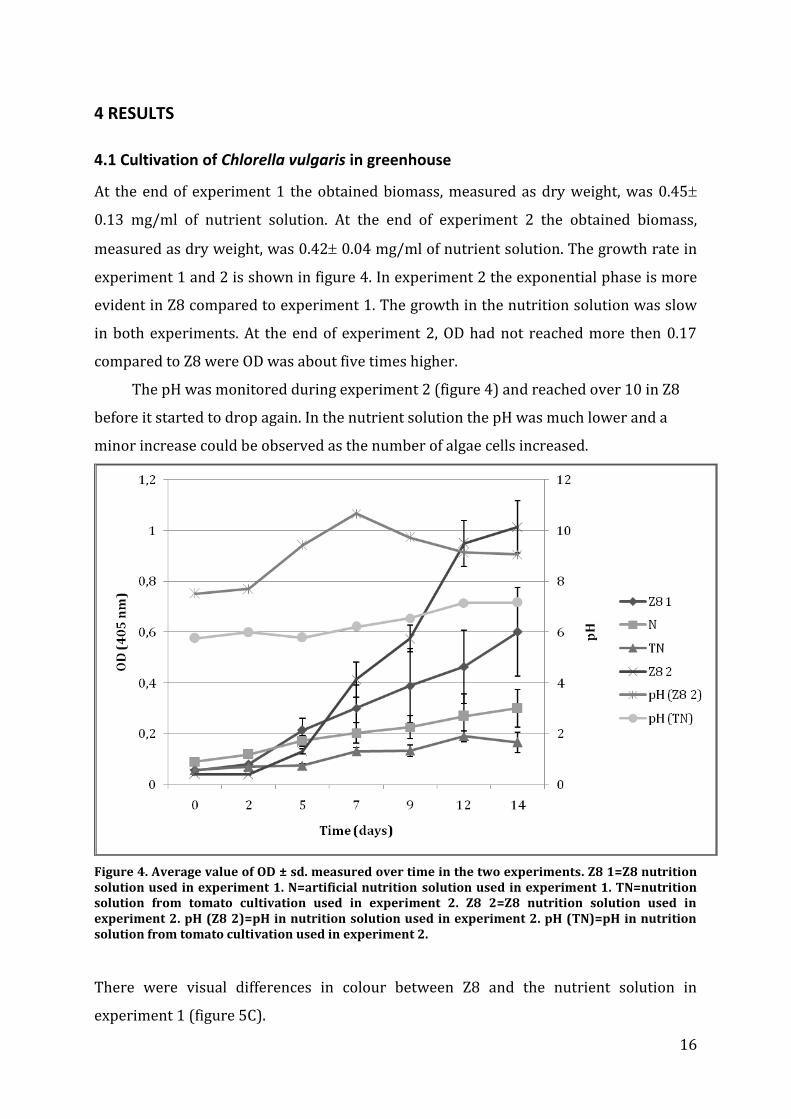
4.1 Cultivation of Chlorella vulgaris in greenhouse
At the end of experiment 1 the obtained biomass, measured as dry weight, was 0.45
0.13 mg/ml of nutrient solution. At the end of experiment 2 the obtained biomass,
measured as dry weight, was 0.42 0.04 mg/ml of nutrient solution. The growth rate in
experiment 1 and 2 is shown in figure 4. In experiment 2 the exponential phase is more
evident in Z8 compared to experiment 1. The growth in the nutrition solution was slow
in both experiments. At the end of experiment 2, OD had not reached more then 0.17
compared to Z8 were OD was about five times higher.
The pH was monitored during experiment 2 (figure 4) and reached over 10 in Z8
before it started to drop again. In the nutrient solution the pH was much lower and a
minor increase could be observed as the number of algae cells increased.
Figure 4. Average value of OD ± sd. measured over time in the two experiments. Z8 1=Z8 nutrition solution used in experiment 1. N=artificial nutrition solution used in experiment 1. TN=nutrition solution from tomato cultivation used in experiment 2. Z8 2=Z8 nutrition solution used in experiment 2. pH (Z8 2)=pH in nutrition solution used in experiment 2. pH (TN)=pH in nutrition solution from tomato cultivation used in experiment 2.
There were visual differences in colour between Z8 and the nutrient solution in
experiment 1 (figure 5C).

17
Visual observations in microscope during experiment 2 confirmed the difference in
viability and growth phase between Z8 and the nutrition solution (TN) (figure 5A and
5B). There were a higher cell density in Z8 at day 7, some of the cells were already dead
and parts of broken cells can be observed in figure 5A. At day 14 there was a decline in
OD in the nutrition solution (TN) and microorganisms larger then Chlorella vulgaris, and
with two flagella, was observed (figure 5D).
Figure 5. A: Chlorella vulgaris in nutrient solution, experiment 2. The red line equals 10 µm. B: Chlorella vulgaris in Z8, experiment 2. The red line equals 10 µm. C: colour difference between Z8 (left side) and nutrient solution (right side) during experiment 1. (Photo: S. Månsson) D: unidentified microorganism observed in the nutrient solution during experiment ,2 (photo: A. Persson).
4.2 Nutrient reduction
In experiment 1, a very low reduction of nitrogen was observed (table 4), however there
was a large and significant reduction of phosphor. There was also a significant reduction
in calcium, iron, manganese and zinc. A slightly increase in pH from 6.4 to 6.7 was
observed, but the Ec (electric conductivity) was unchanged. In experiment 2, Ec was

18
monitored over time but no large changes were observed. At the end Ec had decreased
by 0.66 and significant reduction could be observed for several of the nutrients. Nitrate,
potassium, manganese and sulphur had been reduced by 15-20%. Phosphor had been
reduced by nearly 50% and several of the micronutrients had a great reduction.
However, there was a slight increase in boron and chloride. In both experiments a
significant and large reduction of iron was observed.
Table 4. Nutrient concentration in solution at the start and at the end of the experiments, including pH and Ec (electric conductivity) values. The obtained nutrient reduction is also presented as percentage. Reduction in nutrient concentration was analysed with paired t-test (Minitab 16) and significant decrease compared to the control is indicated with a letter.
N1 N
2 Reduction TN
1 TN
2 Reduction
pH 6,4 6,7 6,3 7,3
Ec (mS/cm) 4,70 4,57 3,66 3,00
mg/l mg/l % mg/l mg/l %
NO3-N 520 a 504 b 3,1 383 a 321 b 16,2
NH4-N <0,100 <0,100 3,6 0,5 86,1
P 63,9 a 15,3 b 76,1 33,9 a 18 b 46,9
K 442 a 455 a -2,9 387 a 323 b 16,5
Mg 44,7 a 46,4 b -3,8 67 a 56 b 16,4
S 88,2 a 95 b -7,7 36 a 29 b 19,4
Ca 499 a 453 b 9,2 335 a 283 b 15,5
Na 99 a 108 b -9,1 22,4 a 25,2 b -12,5
Fe 4,06 a 0,004 b 99,9 2,15 a 0,002 b 99,9
Mn 1,1 a 0,27 b 75,5 0,36 a 0,09 b 74,9
B 0,12 a 0,15 b -19,7 0,33 a 0,37 b -12,1
Zn 0,75 a 0,46 b 39,3 0,50 a 0,23 b 60,0
Cu 0,12 a 0,12 a 0,0 0,17 a 0,13 b 24,9
Mo 0,101 a 0,107 b -5,9 0,083 a 0,070 b 15,7
Cl 9,2 a 11,4 b -23,8 13,9 a 15,7 b -12,9
N1=Nutrient solution used in experiment 1, analysed 2012-02-13. N2=Nutrient solution used in experiment 1, analysed 2012-03-09. TN1=Nutrient solution used in experiment 2, analysed 2012-03-29. TN2=Nutrient solution used in experiment 2, analysed 2012-04-27.
4.3 Fatty acid composition
No difference was observed between the fatty acid profiles of fresh or lyophilized
material. The fatty acid analyse of fresh biomass from C. vulgaris grown in Z8 is shown
in figure 6. The dominating fatty acid was α-linolenic acid (18:3), which was 34% of total
amount of fatty acids. Hexadecatrienoic acid (16:3) was 16% of the total amount of fatty
acids and palmitic acid (16:0) was 13%. Other fatty acids found in the sample were oleic
acid (18:1) and linoleic acid (18:2).

19
Figure 6. Fatty acid composition analyse of Chlorella vulgaris. The upper part of the figure is an image illustrating the peaks for each fatty acid. The lower part specifies in a table the retention time, peak area and percentage for each fatty acid.
4.4 Growth and pigment formation under LED light
The growth in the different light conditions is presented in figure 7. The red light gave
the fastest growth rate. At the end of the experiment the white light treatment had the
highest concentrations of cells and the fewest cells were observed in the greenhouse
treatment. This treatment is, however, not comparable due to different environmental
conditions, such as day length and temperature. The cell number in the red LED
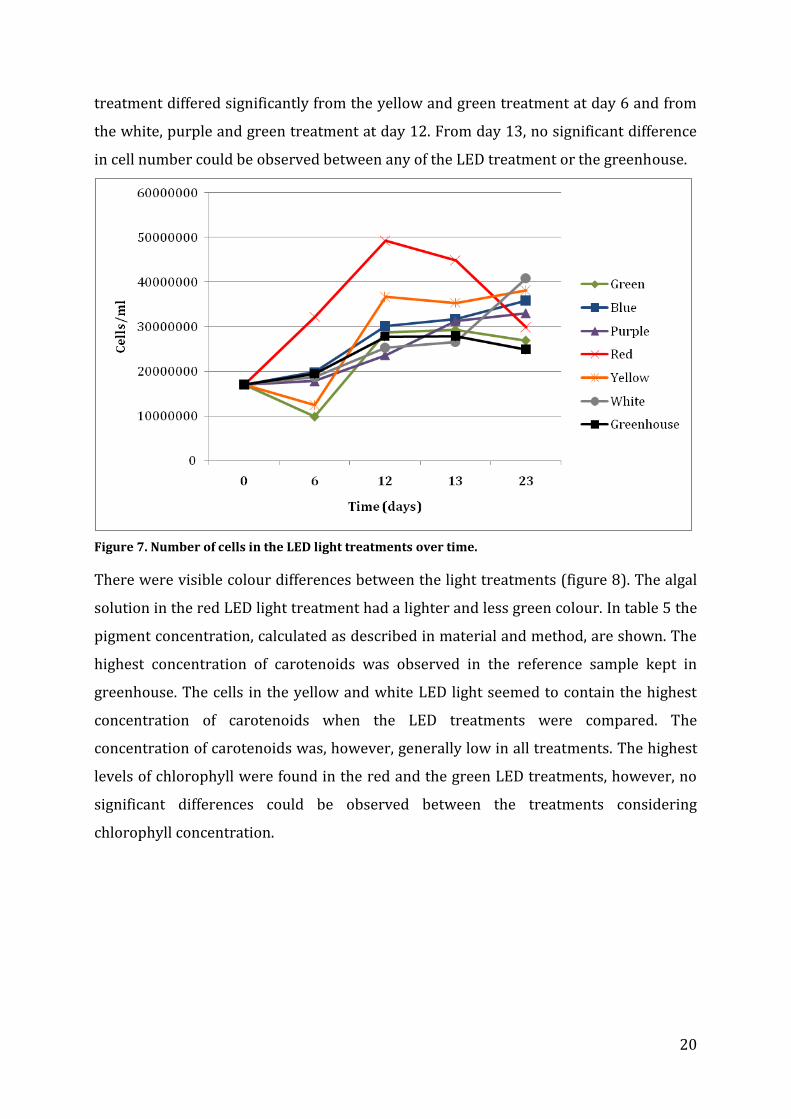
20
treatment differed significantly from the yellow and green treatment at day 6 and from
the white, purple and green treatment at day 12. From day 13, no significant difference
in cell number could be observed between any of the LED treatment or the greenhouse.
Figure 7. Number of cells in the LED light treatments over time.
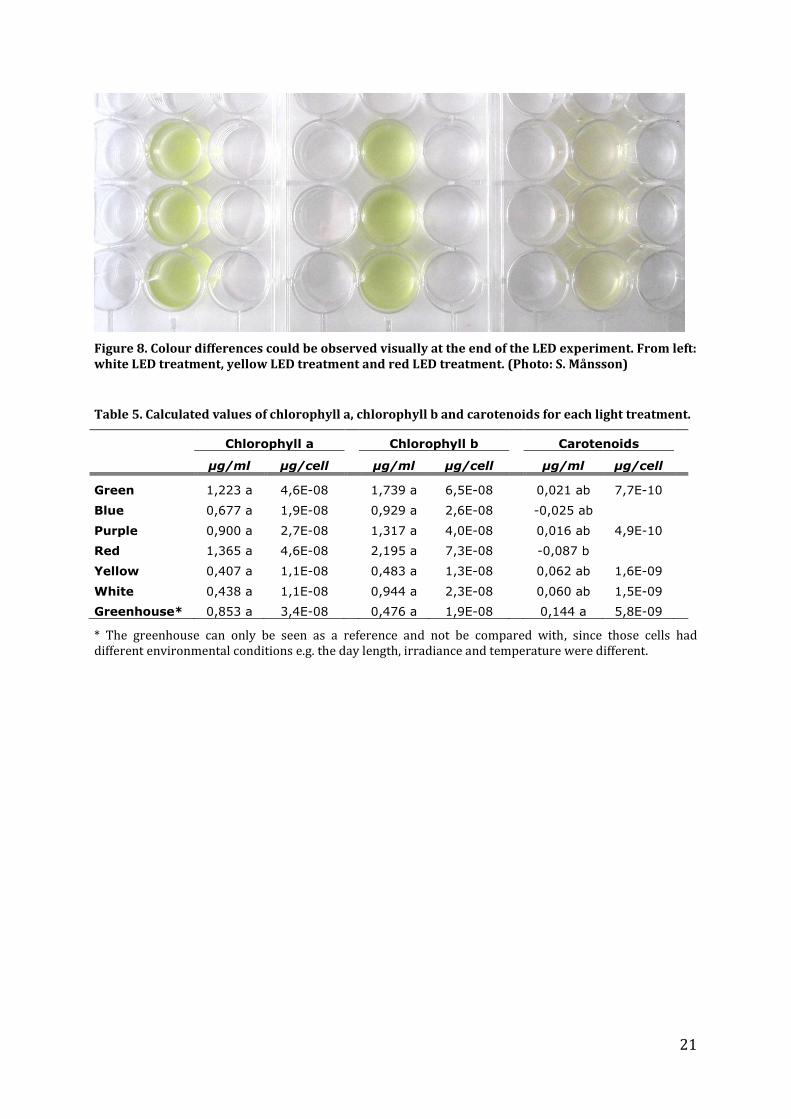
There were visible colour differences between the light treatments (figure 8). The algal
solution in the red LED light treatment had a lighter and less green colour. In table 5 the
pigment concentration, calculated as described in material and method, are shown. The
highest concentration of carotenoids was observed in the reference sample kept in
greenhouse. The cells in the yellow and white LED light seemed to contain the highest
concentration of carotenoids when the LED treatments were compared. The
concentration of carotenoids was, however, generally low in all treatments. The highest
levels of chlorophyll were found in the red and the green LED treatments, however, no
significant differences could be observed between the treatments considering
chlorophyll concentration.
21
Figure 8. Colour differences could be observed visually at the end of the LED experiment. From left: white LED treatment, yellow LED treatment and red LED treatment. (Photo: S. Månsson)
Table 5. Calculated values of chlorophyll a, chlorophyll b and carotenoids for each light treatment.
Chlorophyll a Chlorophyll b Carotenoids
µg/ml µg/cell µg/ml µg/cell µg/ml µg/cell
Green 1,223 a 4,6E-08 1,739 a 6,5E-08 0,021 ab 7,7E-10
Blue 0,677 a 1,9E-08 0,929 a 2,6E-08 -0,025 ab
Purple 0,900 a 2,7E-08 1,317 a 4,0E-08 0,016 ab 4,9E-10
Red 1,365 a 4,6E-08 2,195 a 7,3E-08 -0,087 b
Yellow 0,407 a 1,1E-08 0,483 a 1,3E-08 0,062 ab 1,6E-09
White 0,438 a 1,1E-08 0,944 a 2,3E-08 0,060 ab 1,5E-09
Greenhouse* 0,853 a 3,4E-08 0,476 a 1,9E-08 0,144 a 5,8E-09
* The greenhouse can only be seen as a reference and not be compared with, since those cells had different environmental conditions e.g. the day length, irradiance and temperature were different.
22
5 DISCUSSION The faster growth rate in Z8 compared to the growth rate in the nutrient solution can be
explained by an adaption period. Since the nutrient solution contained higher level of
nutrients it might have been necessary for the cells to adapt to these levels before they
could start their growth. All cells had been maintained in Z8 before the experiment
started and were well adapted to these conditions. It might have be possible to receive a
faster growth from start in the nutrient solution if the cells had been grown in this
solution for acclimatized before the experiment, this approach will be tested in later
experiments.
In experiment 1 an artificial nutrient solution, which had not been in contact with
plant roots, was used. This experiment showed that growth was possible, however,
there was a concern that a used nutrition solution would contain several other
microorganisms and thereby provide too much competition for Chlorella vulgaris. To
sterilize the nutrient solution would be too costly and the nutrient solution, used in
experiment 2, was therefore filtered in order to remove larger grazing microorganisms.
Using a non-sterile solution also means that the organisms have to compete for nutrients
and light. In order to obtain a monoculture of a certain alga species, it has to be a very
competitive and strong species. For nutrient reduction a monoculture is not required
since other microorganisms also consume the nutrients during growth, but if the cells
should be harvested and used for a certain purpose a monoculture is required.
In experiment 2, unidentified microorganisms were observed in the microscope
and the decreasing value of OD after 14 days might suggest predation. According to
Larsdotter (2006) protozoa and rotifers are the biggest threat to the alga in wastewater
treatment. Bacteria can also be a problem but since the majority of algae are autotrophic
and not assimilate organic carbon, unlike most bacteria, they do not compete for the
same carbon source (Pufelski et al., 2010). However, they still compete for the nutrients
such as nitrogen and phosphor. In this present study this competition is not believed to
be of any problem since there were very high concentrations of nutrients available in
the nutrient solution.
In order to establish Chlorella vulgaris as a monoculture in a nutrient solution from
a greenhouse production, other microorganisms would preferable need to be killed. This
could be done with e.g hydrogen peroxide since it has the advantage of being broken
down fast. On the other hand, this will introduce an additional step for the grower and
23
dealing with chemicals is always negative from a work environmental point of view.
Methods discussed in the literature (Larsdotter, 2006) are e.g decrease the pH to about
2 in the nutrient solution for a short time, which kills rotifers and protozoa but not algae,
or increase the ammonia concentration, which can lower the contamination by
zooplankton. However those methods are hard to implement in large scale cultivations
(Larsdotter, 2006).
In the present work growth was monitored by measuring change in the optical density.
This method does not tell anything about what is in the sample or the state of the cells
but works well within a certain range. When cells start to die, OD will continue to
increase to some extent, but it does not tell anything about the number of cells present
any longer. It is also impossible to tell with this method whether the sample contain
many small cells or fewer larger cells. This can be seen in a parallel experiment
performed by Ardal (2012) where the density for cells of Chlorella vulgaris was
measured at 405 nm with a spectrophotometer and also counted in a haemocytometer.
It was clear that the density and number of cells over time follow each other in the
beginning, but when stationary phase was reach the optical density continued to rise.
Already before the stationary phase was reached OD was higher in Z8 then in the
nutrition solution. As discussed by Ardal (2012) this had to do with the fact that the cells
in Z8 were larger, possibly indicating a lack of a certain nutrients in the nutrient
solution. In fact, also the unsatisfactory growth in the nutrient solution might suggest a
deficiency. Although the solution contains high concentrations of nutrients, the balance
between the nutrients is not optimized for algal growth and therefore there is a risk that
some nutrient becomes limiting.
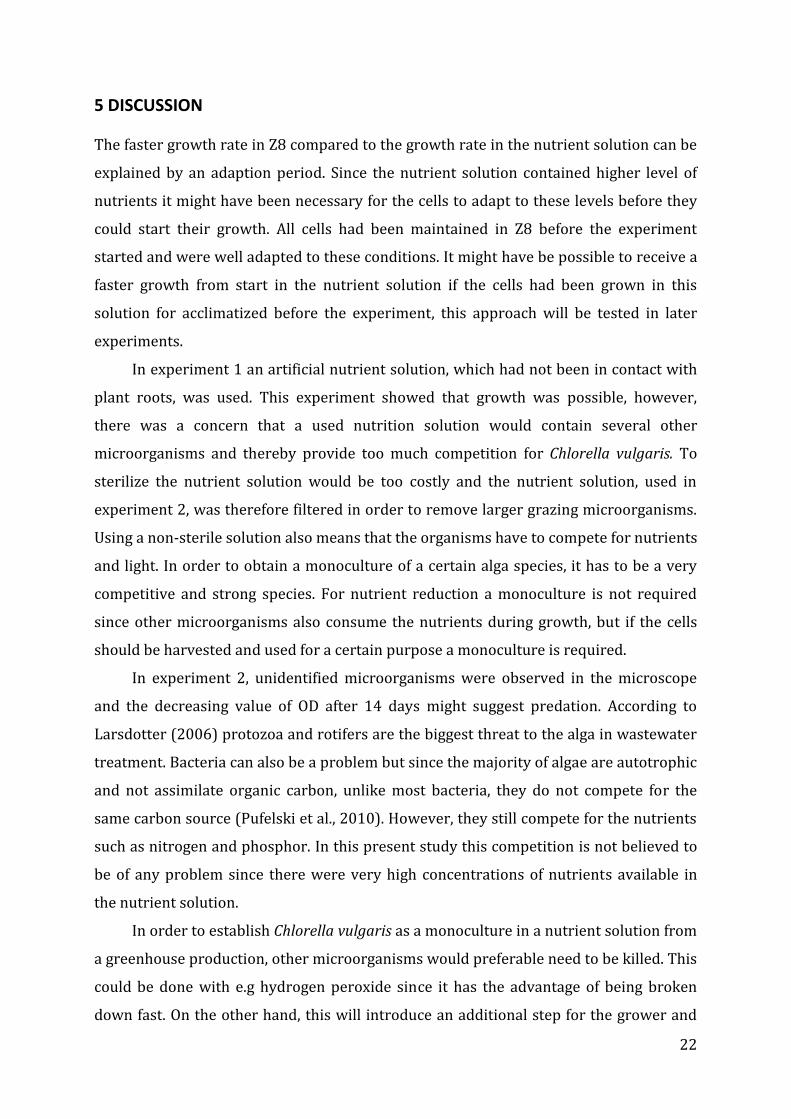
Iron has an important role in the photosynthetic electron transport over the
membranes (Behrenfeld et al., 2006). According to Liu et al. (2007) increased attention
has been put on the function of iron on microalgae growth over the last years. However
the article also point out that, as far as they know, it is still unknown if iron deficiency is
one of the main factors limiting alga growth productivity in batch cultures. In both
experiments in this study the iron reduction was close to 100%. Therefore it might be
possible that the iron deficiency limited the growth. It might also be that the observed
colour difference between Z8 and the nutrient solution in experiment 1 had something
to do with a nutrient deficiency.

24
The experiments in the present study were performed in a simple cultivation system, in
small scale and the results in an up scaled system might have looked different. De la
Noue et al. (1992) pointed out the fact that it is a great difference between small-scale
trails in the laboratory compared to outdoor large-scale systems where it is hard to
control both the abiotic and biotic factors influencing the growth of microalga due to
large variations in effluent composition and environmental conditions. On the other
hand those simple conditions used in the present study are more or less equivalent with
the reality in a greenhouse company. There is natural sunlight, quite often artificial light
to some extent and nutrient solution is not sterile. Still this is only in small scale and in
order for it function in a greenhouse and on a larger scale several issues has to be
solved. However, as stated by Olaizola 2003, “scale up is an engineering problem, not a
biological one”. The application has to be fast and easy for the grower and give a result
worth the effort. In some way circulation, airing and harvest has to be worked out.
In this small-scale experiment, centrifugation can be used to separate the cells
from the nutrient solution. This method is both too complicated and economically
ineffective in a large-scale cultivation (Larsdotter, 2006). Suggested methods for harvest
from the literature are e.g. sedimentation, filtration or immobilised systems.
If the weight from the obtained biomass in this study were used to calculate the
potential biomass that could be reached in an average greenhouse company with
tomatoes, it would approximately be 180 kg of alga biomass measured as dry weight.
This calculation is done with a greenhouse of 2000 m2 tomato production where 1000
m3 water/1000 m2/year are applied with a loss of 20%. This will give 4*108 ml nutrition
enriched wastewater per season. Assume that the obtained biomass as dry weight is the
same as in experiment 1, 0.45 mg/ml, this will give 180 kg of alga biomass over one
season. If 20% of this dry weight is lipids and the result from the fatty acid analyse in
this study is used, this will give about 12 kg of α-linolenic acid (18:3).
Since optimal algae growth require a high ration of carbon (Becker, 1994), the
airing in this experiment is not enough since air contain a relatively low concentration of
CO2. It would therefore been possible to obtain a higher biomass in the experiment if
CO2 were added. The reason why it was not added is the effort to keep the cultivation
system as simple as possible.
25
The large reduction of phosphor in experiment 1 is probably due to a precipitation of
phosphor with calcium and maybe also with iron. In this experiment several of the
nutrients looked like they have increased but this has to do with the fact that there was
no compensation for the evaporation, which led to a concentration of the nutrient
solution during this experiment. In experiment 2 the significant reduction shows that it
is possible to remove nutrients from greenhouse water by using algae. Still it is a very
small reduction and inefficient considering the total concentration. Possibly a system
with a repeated growth and harvest would be potential development.
Considering phosphor in experiment 2, a slightly cloudy colour was observed in
the nutrient solution after start. This might be a precipitation of phosphor due to the
airing. If there is a precipitation also in this experiment this will be misleading since the
result will reflect a greater reduction in phosphor then the algae actually has
accomplished. However, the potential to precipitated phosphor by an increase in pH due
to algal growth can possibly be of interest for reduction and recovery of phosphor.
There is a discussion about which start density of algae that is suitable for an effective
nutritional removal. According to Lau et al. (1994), who observed the nutrient removal
in waste water with three different inoculum densities of Chlorella vulgaris, the larger
inoculum density of 1x10⁷ cells/ml gave the best result. This result was explained by the
fact that the efficiency of the nutrient removal is correlated to the physiological state of
the cells, the higher alga density, the faster growth and thereby a faster removal. In this
current study a lower start density was used based on the believe that it is more
sustainable to produce the biomass from the nutrients present in the actual system. The
obtained nutrition removal (table 4) might appear unsatisfying in this present study but
too much attention should not be put on the percentage number. Lau et al. (1994)
reported a nitrogen reduction close to 90%, but the actual amount of nitrogen present in
the water at the beginning of the experiment were 10 times lower the in this study.
The fact that excessive water from greenhouses contains high levels of nutrients
and the fact that fare from all growers have a purification or recirculation system, makes
it even more urgent to find possible and sustainable solutions.
If the grower should use alga to reduce the nutrition level in the excessive water,
deposition for the alga biomass is needed. Otherwise it just becomes a waste product.
26
One way is to sell the biomass to a specialized company, but this requires that there is a
company like that. It requires a fairly large amount of biomass in order to make it
economically feasible. It also requires high quality of the biomass i.e. purity and right
chemical composition. As taken up in the background of this study, environmental
conditions and culture parameters affect the chemical composition of the algae at
harvest. For a grower all those parameters might be hard to control. However the
primary purpose of the algae is to reduce the nutrients and less complicated deposition
is therefore desirable. This might be as raw material for biogas or animal feed or
possibly as biofertilizers.
The result from the fatty acid analysis is consistent with earlier reported results of fatty
acid composition in Chlorella vulgaris (Petkov & Garcia, 2005). Due to lack of time, the
fatty acids composition from experiment 2 has not been analysed yet. But probably it
would have been some difference between the results in experiment 1 and 2 due to the
fact that the nutrient solution used in experiment 2 had been used for tomato cultivation
and thereby had been in contact with the root area, which has an intense microbial life.
The fatty acid analyse would therefore have included some other microorganisms like
bacteria, which has another fatty acid composition. Fatty acids with odd numbers e.g.
15:0 is a clear sign that the sample is contaminated by bacteria (Petkov & Garcia, 2005).
The problem with contamination and thereby reports about wrong fatty acid
composition of Chlorella vulgaris are discussed by Petkov & Garcia (2005). There are no
long fatty acids (>20 carbon) to be found in C. vulgaris, instead those fatty acids mainly
appear in marine algae (Petkov & Garcia, 2005).
The fact that no longer fatty acids then 18:3 were found makes the algae biomass
less valuable as feed or food. According to Harris (2004), α-linolenic acid (18:3) (ALA) is
mainly used as energy in the human body. It is a precursor of DHA but only about 1-9%
is converted. Consume ALA in comparison to already synthesized DHA is therefore
rather ineffective.
Since light intensity has been shown to affect pigment composition in Chlorella
(Seyfabadi et al. 2010) we determined to examine if it was possible to induce pigment
formation by different light quality. The reason why the cell solution was diluted and
kept in an abnormally long photoperiod was with the intention to stress the cells.
27
According to Gouveia et al. (1995) the biosynthesis of carotenoids in algae can be
affected by stress e.g. salinity, light and nitrogen availability.
For the cells in the LED experiment there were a visible difference between the
treatments (figure 8), and a pigment extraction was therefore performed. The result
from this extraction did not correspond to the visual appearance of the sample, which
indicated a higher carotenoid production in the red treatment. Since the lights had
different wavelength a difference in growth and development could be expected due to
the fact that certain wavelengths are easily absorbed during the photosynthesis. No
literature was found on the subject, which indicates that it is still a new and unexplored
subject. Other articles (Seyfabadi et al., 2010; Litchman et al., 2003) only pointing out
the fact that light intensity and durability has an important impact on the growth, but
obviously this also should include the quality of the light.
The cells kept in greenhouse cannot be compared with those under the LED-light
since those differences might have to do with variance in day length conditions,
irradiance and temperature. When focusing on the cells under the LED light both visual
differences and variation in pigment composition were observed. The obtained amount
chlorophyll a was very low in all treatments (table 5) compared to results reported by
Seyfabadi et al. (2010). At an irradiance level of approximately 60 µmol ·m-2 ·s-1, the
same as in this experiment, reported levels of chlorophyll a were about ten times higher
than the obtained results in this study. Also a few of the results from the pigment
measurement had a negative value. This is likely an effect of the method. The approach
and calculations might not have been suitable for the small amount cell solution used
and therefore the obtained results might not reflect the actual levels of pigment in the
cells. An improvement could be to use a larger amount cell solution and to be more
careful with exposing the cells to light since carotenoids are easily broken down by light
when outside of the cell. The question still remains why there was a clear visible
difference observed in the red light, though the method possibly can be blamed as
discussed above, further experiments are needed.

28
6 CONCLUSIONS
6.1 Conclusions
Chlorella vulgaris can grow and reduce the nutrient levels in a nutrient solution
with a distribution that can be expected from a tomato production. A nutrient
solution from a real tomato production includes several other microorganisms,
despite of filtration, and that is a problem. It is uncertain if C. vulgaris can
compete strong enough under those conditions.
It is possible to obtain a significant reduction in nutrient levels by cultivation of
Chlorella vulgaris under simple conditions in a nutrient solution from
greenhouse tomato production. The initial nutrient levels though, which should
be reduced are high and will influence the result.
The amount of biomass and the purity as well as the obtained nutrient
reduction will all give a variable result from time to time and between growers
due to all culture parameters that are hard to control and environmental
conditions which will fluctuate.
There are interesting metabolites in Chlorella vulgaris such as carotenoids that
can be used for different industrial purposes. The fatty acids on the other hand,
to be found in C. vulgaris is not long enough to be truly interesting.
6.2 Further studies
The experiments from this study can be developed in several ways, some examples are:
maintain the alga in a nutrient solution that are sterile filtrated, instead of Z8,
in order for the algae to adapt
add CO2
examine the effect of adding iron
This study is performed with only one strain of Chlorella vulgaris and others can be
examined. It might also be possible to use genetic modification (GM) in order to improve
the quality and concentration of desirable metabolites produced by C. vulgaris.

29
The use of LED light is still a rather unexplored area regarding algae and might be
used as a tool in order to control the production of specific metabolites. That requires
detailed knowledge about how microalgae respond to certain wavelengths. One way to
begin is to cultivate larger volumes of algae under LED light of different wavelengths for
pigment and fatty acid analyses.
30
7 REFERENCES
Ardal, E. (2012). (Unpublished). Cultivation of microalgae in the horticulture industry – is it possible to grow microalgae that produce valuable metabolites in nutrient solution from greenhouse horticulture? SLU, Alnarp. Banas, A., Debski, H., Banas, W., Heneen, W. K., Dahlqvist, A., Bafor, M., Gummeson, P-O., Marttila, S., Ekman, Å., Carlsson, A. S. & Stymne, S. (2006). Lipids in grain tissues of oat (Avena sativa): difference in content, time of deposition and fatty acid composition. Journal of Experimental Botany 58 (2007), 2463-2470. Becker, E. W. (1994). Microalgae. Biotechnology and Microbiology. [online]. Cambridge: Cambridge University Press. Available from: http://www.google.se/books?hl=sv&lr=&id=KAKx4I7NWEYC&oi=fnd&pg=PA1&dq=Becker,+E.+W.+(1994).+Microalgae.+Biotechnology+and+Microbiology&ots=00auRHNTkQ&sig=eK1-EJFVVYz0BqAsOt387qRJxqc&redir_esc=y#v=onepage&q=Becker%2C%20E.%20W.%20(1994).%20Microalgae.%20Biotechnology%20and%20Microbiology&f=false [15-05-12]. Behrenfeld, M. J., Worthington, K., Sherrell, R. M., Chavez, F. P., Strutton, P., McPhaden, M. & Shea, D. M. (2006). Controls in tropical Pacific Ocean productivity revealed through nutrient stress diagnostics. Nature 442 (2006), 1025-1028. BioReal. (n.d). [online]. Available at: www.bioreal.se [21-05-12]. Cannon, D. (2009). From fish oil to microalgae oil. A win-win shift for humans and our habitat. Diet and Nutrition 5 (2009), 299-303. CCAP. (n.d). Strain information: 211/11b [online]. Available from: http://www.ccap.ac.uk/strain_info.php?Strain_No=211/11B [20-04-12]. De la Noue, J., Laliberté, G. & Proulx, D. (1992). Algae and wastewater. Journal of applied phycology 4 (1992), 247-254. Gouveia, L., Veloso, V., Reis, A., Fernandes, H., Novais, J. & Empis, J. (1995). Evolution of pigment composition in Chlorella vulgaris. Bioresource Technology 57 (1996), 157-163. Guschina, I. A. & Harwood, J. L. (2006). Lipids and lipid metabolism in eukaryotic algae. Progress in lipid research 45 (2006), 160-186. Hansson, T. & Johansson, A-K. (2007). Goda exempel på rening av returvatten från odling av grönsaker och prydnadsväxter i växthus. Jordbruksinformation 4. Jordbruksverket: Jönköping. (only available in Swedish) Hansson, T. (2003). Dräneringevatten I växthus – uppsamling och användning minskar miljöbelastningen. Jordbruksinformation 16. Jordbruksverket: Jönköping. (only available in Swedish)

31
Harris, W. (2004). Fish oil supplementation: evidence for health benefits. Cleveland clinic journal of medicine 71 (2004), 208-221. Harwood, J.L. & Guschina, I.A. (2008). The versatility of algae and their lipid metabolism. Biochimie 91 (2009), 679-684. Hogg, S. (2005). Essential microbiology. West Sussex: John Wiley & Sons Ltd. Hu, Q., Sommerfeld, M., Jarvis, E., Ghirardi, M., Posewitz, M., Seibert, M. & Darzins, A. (2008). Microalgal triacylglycerols as feedstocks for biofuel production: perspectives and advances. The plant journal 54 (2008), 621-639. Larsdotter, K. (2006). Wastewater treatment with microalgae – a literature review. Vatten 62:31-38. Lau, P.S., Tam, N.F.Y. & Wong, Y.S. (1994). Effect of algal density on nutrient removal from primary settled wastewater. Environmental pollution 89 (1995), 59-66. Lichtenthaler, H.K & Wellburn, A.R. (1983). Determination of total carotenoids and chlorophylls a and b of leaf extracts in different solvents. Biochemical Society Transactions, 603, 591-592. Litchman, E., Steiner, D. & Bossard, P. (2003). Photosynthetic and growth responses of three freshwater algae to phosphorus limitation and day length. Freshwater biology, 48, 2141-2148. Liu, Z., Wang, G. & Zhou, B. (2007). Effect of iron on growth and lipid accumulation in Chlorella vulgaris. Bioresource Technology 99 (2008), 4717-4722. Löfkvist, K., Hansson, T. & Svensson, S. A. (2009). Losses of pesticides to soil and water from greenhouse uses – an overview of possible risk factors. [online]. Available from: http://pub.epsilon.slu.se/3661/1/LTJ-rapport_2009_6.pdf [15-05-12]. Mercer, P & Armenta, R.E. (2011). Developments in oil extraction from microalgae. European journal of lipid science and technology 113 (2011), 539-547. Min, M., Wang, L., Li, Y., Mohr, M. J., Hu, B., Zhou, W., Chen, P. & Ruan, R. (2010). Cultivating Chlorella sp. in a pilot-scale photobioreactor using centrate wastewater for microalgae biomass production and wastewater nutrient removal. Applied Biochem Biotechnol 165 (2011), 123-137. Olaizola, M. (2003). Commercial development of microalgal biotechnology: from the test tube to the marketplace. Biomolecular engineering 20 (2003), 459-466. Regeringskansliet. (2000). The Swedish environmental code. [online]. Available from: http://www.regeringen.se/sb/d/108/a/1348 [15-05-12]. Petkov, G & Garcia, G. (2005).Which are fatty acids of the green alga Chlorella? Biochemical Systematics and Ecology 35 (2007), 281-285.

32
Pufelski, N., Aravinthan, V. & Yusaf, T. (2010). How effective is microalgae treatment of nursery wastewater for nutrient removal? Southern region engineering conference, 11-12 November 2010, Toowoomba, Australia. Putt, R. (2008). Algae as a biodiesel feedstock: a feasibility assessment. [online]. Available from: http://216.226.178.189/C17/ATF/Document%20Library/Algae%20as%20a%20Biodiesel%20Feedstock.pdf [15-05-12]. Rymer, C., Gibbs, R.A. & Givens, D.I. (2009). Comparison of algal and fish sources on the oxidative stability of pultry meat and its enrichment with omega-3 polyunsaturated fatty acids. Poultry science 89 (2010), 150-159. Seyfabadi, J., Ramezanpour, Z. & Khoeyi, Z.A. (2010). Protein, fatty acid and pigment content of Chlorella vulgaris under different light regimes. Journal of applied phycology 23 (2011), 721-726. Simrisalg. (n.d). [online]. Available at: www. simrisalg.se http://www.algaeindustrymagazine.com/swedens-simris-alg-and-the-dark-horse-factor/[15-05-12]. SJV - Swedish board of agriculture. (2008). The 2008 horticultural census. [online]. Available from: http://www.sjv.se/webdav/files/SJV/Amnesomraden/Statistik%2C%20fakta/Tradgardsodling/JO33/JO33SM0901_korrigerad/JO33SM0901_korrigerad/JO33SM0901.pdf [17-04-12]. Spolaore, P., Joannis-Cassan, C., Duran, E. & Isambert, A. (2005). Commercial applications of microalgae. Journal of bioscience and bioengineering 101:2, 87-96. Taiz, Lincoln & Zeiger¸ Eduardo. (2006). Plant Physiology. 4 ed. Sunderland: Sinauer Associates, Inc., Publishers