culp, inc
TRANSCRIPT

CULP, INC.NYSE: CULPFirst Quarter Fiscal 2022Summary Financial Information
September 1, 2021
2
FIRST QUARTER FISCAL 2022 FINANCIAL SUMMARY
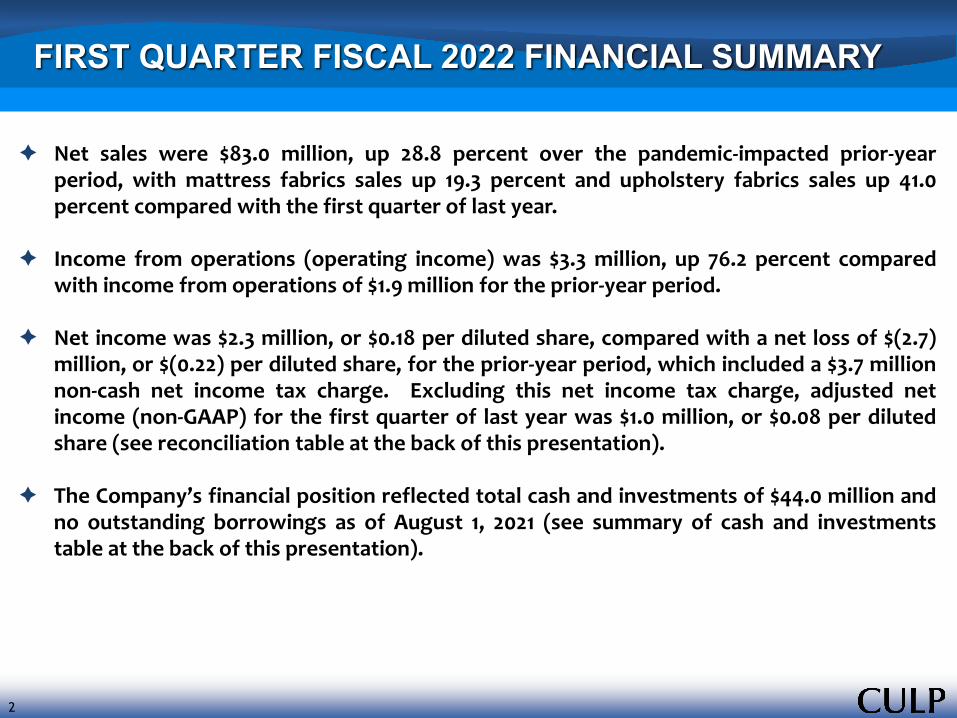
Net sales were $83.0 million, up 28.8 percent over the pandemic-impacted prior-yearperiod, with mattress fabrics sales up 19.3 percent and upholstery fabrics sales up 41.0percent compared with the first quarter of last year.
Income from operations (operating income) was $3.3 million, up 76.2 percent comparedwith income from operations of $1.9 million for the prior-year period.
Net income was $2.3 million, or $0.18 per diluted share, compared with a net loss of $(2.7)million, or $(0.22) per diluted share, for the prior-year period, which included a $3.7 millionnon-cash net income tax charge. Excluding this net income tax charge, adjusted netincome (non-GAAP) for the first quarter of last year was $1.0 million, or $0.08 per dilutedshare (see reconciliation table at the back of this presentation).
The Company’s financial position reflected total cash and investments of $44.0 million andno outstanding borrowings as of August 1, 2021 (see summary of cash and investmentstable at the back of this presentation).

3
FIRST QUARTER FISCAL 2022 FINANCIAL SUMMARY (cont’d)
Cash flow from operations and free cash flow were $1.6 million and negative $(782,000),respectively, for the first quarter of fiscal 2022 (see reconciliation table at the back of thispresentation).
The company announced its regular quarterly cash dividend of 11 cents per share, payablein October 2021. At an annual indicated dividend of $0.44 per share, the yield is 3.34percent, based upon a closing stock price of $13.17 per share on August 31, 2021.
The company repurchased 48,686 shares of Culp common stock during the first quarterof fiscal 2022, and, has subsequently repurchased an additional 47,767 shares throughAugust 31, 2021, leaving approximately $3.6 million available under the company’srecently reinstated share repurchase program.
4
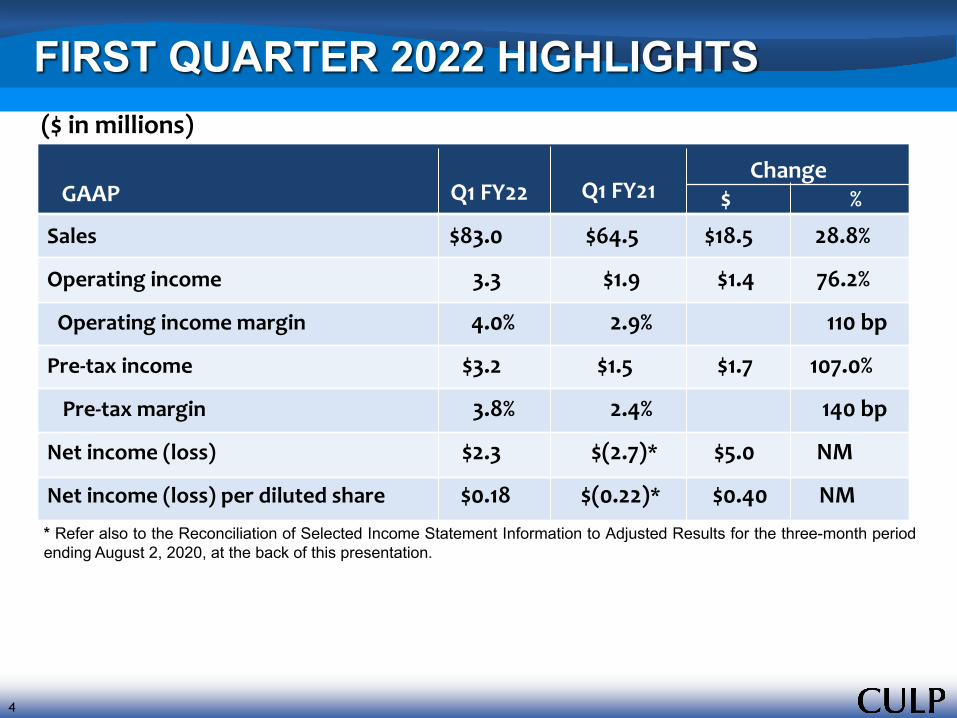
FIRST QUARTER 2022 HIGHLIGHTS($ in millions)
Q1 FY22 Q1 FY21Change
$ %Sales $83.0 $64.5 $18.5 28.8%
Operating income 3.3 $1.9 $1.4 76.2%
Operating income margin 4.0% 2.9% 110 bp
Pre-tax income $3.2 $1.5 $1.7 107.0%
Pre-tax margin 3.8% 2.4% 140 bp
Net income (loss) $2.3 $(2.7)* $5.0 NM
Net income (loss) per diluted share $0.18 $(0.22)* $0.40 NM* Refer also to the Reconciliation of Selected Income Statement Information to Adjusted Results for the three-month periodending August 2, 2020, at the back of this presentation.
GAAP

5
FIRST QUARTER 2022 HIGHLIGHTS($ in millions)
Q1 21 Q1 FY20Change
$ %Adjusted (Non-GAAP) *
* Refer to preceding Slide 5 for GAAP presentation as well as the Reconciliation of Selected Income StatementInformation to Adjusted Results for the three-month period ending August 2, 2020, at the back of this presentation. TheReconciliation of Selected Income Statement Information to Adjusted Results only reflects adjustments for the first quarterof fiscal 2021, as there were no adjustments for the first quarter of fiscal 2022 (and, accordingly, the Q1 FY22 numbersshown in the table above reflect net income and net income per diluted share on a GAAP basis).
Adjusted (Non-GAAP)* Q1 FY22
Q1 FY21
Change$ %
Adjusted income (loss) $2.3 $1.0 $1.3 134.9%
Adjusted income (loss) per share $0.18 $0.08 $.10 125.0%

6
Q1 SALES & OPERATING INCOME BRIDGES($ in millions)
Change$ %
Sales Change$ %
Q1 2021 $64.5
Mattress fabrics increase 7.0 19.3%
Upholstery fabrics increase 11.6 41.0%
Q1 2022 $83.0 28.8%
Operating Income Change$ %
Q1 2021 $1.9
Mattress fabrics increase 1.8 95.7%
Upholstery fabrics increase 0.2 7.3%
Unallocated corporate expense increase 0.5 23.4%
Q1 2022 $3.3 76.2%

7
NET CASH, INVESTMENTS, AND EQUITY($ and share amounts in millions)
Q1 FY22 Q4 FY21 Q1 FY21
Cash and cash equivalents $26.1 $37.0 $40.0
Short-term investments (Available for Sale) 9.7 5.6 1.0
Short-term investments (Held-to-Maturity) 1.7 3.2 5.1
Long-term investments (Held-to-Maturity) 6.6 1.1 1.3
Total cash and investments $44.1 $46.9 $47.4
Total debt $ 0.0 $ 0.0 $ 0.0
Net cash and investments $44.1 $46.9 $47.4
Shareholders’ equity attributable to Culp, Inc. $129.5 $129.0 $125.9
Shares outstanding 12,276 12,313 12,292
Book value per share $10.55 $10.48 $10.24
Tangible Book value per share $10.32 $10.23 $9.97

8
FREE CASH FLOW*($ in millions)
Q1 FY22 Q1 FY21
Net income 2.3 (2.7)
Depreciation, amortization, & stock-based compensation 2.1 2.1
Deferred taxes, other (0.3) 3.7
Gross cash flow 4.1 3.1
Cash flow from working capital and changes in other assets/liabilities (2.5) 7.5
Cash flow from operations 1.6 10.6
Capital expenditures, including payments that are vendor financed (2.0) (0.5)
Investment in unconsolidated joint venture 0.0 (0.1)
Other (0.4) 0.0
Free cash flow $(0.8) $10.0* See reconciliation at the back of this presentation.
9
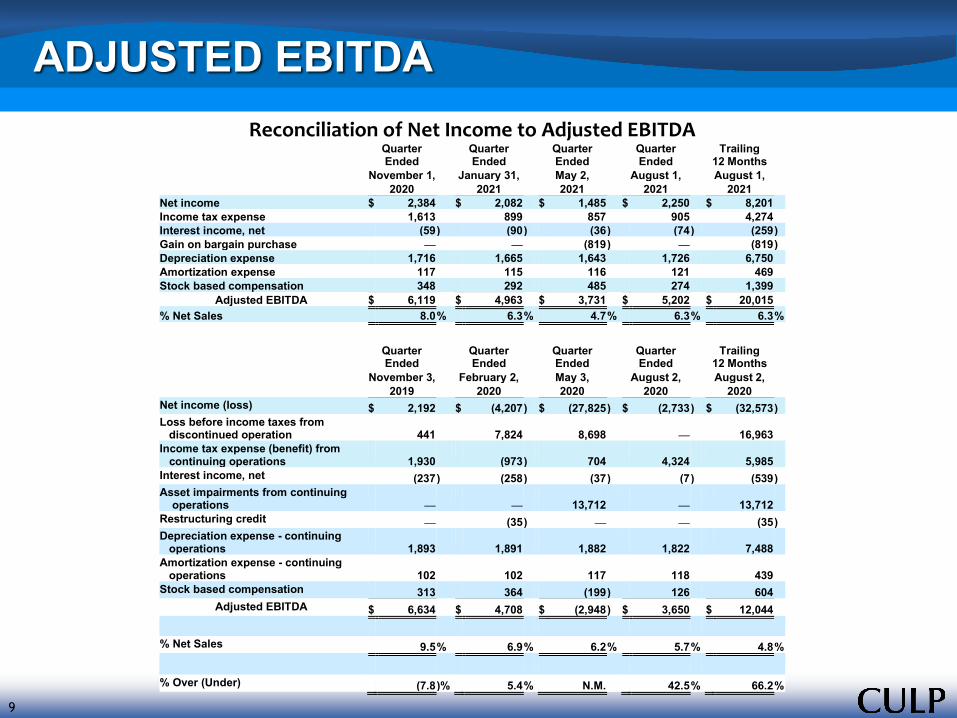
ADJUSTED EBITDAReconciliation of Net Income to Adjusted EBITDA
Quarter Ended
Quarter Ended
Quarter Ended
Quarter Ended
Trailing 12 Months
November 1, January 31, May 2, August 1, August 1, 2020 2021 2021 2021 2021
Net income $ 2,384 $ 2,082 $ 1,485 $ 2,250 $ 8,201 Income tax expense 1,613 899 857 905 4,274 Interest income, net (59 ) (90 ) (36 ) (74 ) (259 ) Gain on bargain purchase — — (819 ) — (819 ) Depreciation expense 1,716 1,665 1,643 1,726 6,750 Amortization expense 117 115 116 121 469 Stock based compensation 348 292 485 274 1,399
Adjusted EBITDA $ 6,119 $ 4,963 $ 3,731 $ 5,202 $ 20,015 % Net Sales 8.0 % 6.3 % 4.7 % 6.3 % 6.3 %
Quarter Ended
Quarter Ended
Quarter Ended
Quarter Ended
Trailing 12 Months
November 3, February 2, May 3, August 2, August 2, 2019 2020 2020 2020 2020
Net income (loss) $ 2,192 $ (4,207 ) $ (27,825 ) $ (2,733 ) $ (32,573 ) Loss before income taxes from discontinued operation 441 7,824 8,698 — 16,963 Income tax expense (benefit) from continuing operations 1,930 (973 ) 704 4,324 5,985 Interest income, net (237 ) (258 ) (37 ) (7 ) (539 ) Asset impairments from continuing operations — — 13,712 — 13,712 Restructuring credit — (35 ) — — (35 ) Depreciation expense - continuing operations 1,893 1,891 1,882 1,822 7,488 Amortization expense - continuing operations 102 102 117 118 439 Stock based compensation 313 364 (199 ) 126 604
Adjusted EBITDA $ 6,634 $ 4,708 $ (2,948 ) $ 3,650 $ 12,044
% Net Sales 9.5 % 6.9 % 6.2 % 5.7 % 4.8 %
% Over (Under) (7.8 )% 5.4 % N.M. 42.5 % 66.2 %

10
OPERATING WORKING CAPITAL($ in millions)
May 1, 2016 May 3, 2015 % Change
* Sales used in the calculation is an annualized amount derived from the year-to-date net sales.
** Accounts payable also includes accounts payable – capital expenditures.
August 1, 2021
May 2, 2021
August 2, 2020
Accounts receivable, net $35.0 $37.7 $29.9
Inventories, net 58.6 55.9 40.4
Accounts payable (45.3) (42.5) (25.7)
Accounts payable – capital expenditures (0.0) (0.3) (0.3)
Operating working capital $48.3 $50.8 $44.3
Percent of sales* 14.5% 16.9% 17.1%
Days sales outstanding 37.6 42.8 41.2
Inventory turns 4.9 4.8 5.3
Days accounts payable outstanding** 58.5 58.0 44.3
11
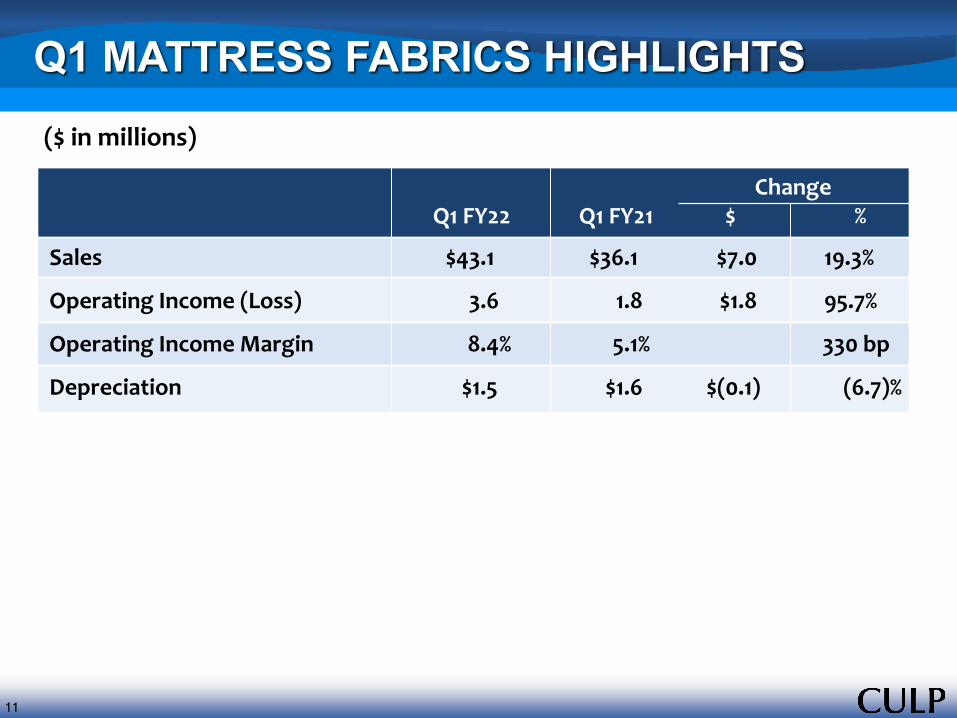
Q1 MATTRESS FABRICS HIGHLIGHTS($ in millions)
Q1 FY22 Q1 FY21Change
$ %
Sales $43.1 $36.1 $7.0 19.3%
Operating Income (Loss) 3.6 1.8 $1.8 95.7%
Operating Income Margin 8.4% 5.1% 330 bp
Depreciation $1.5 $1.6 $(0.1) (6.7)%
12
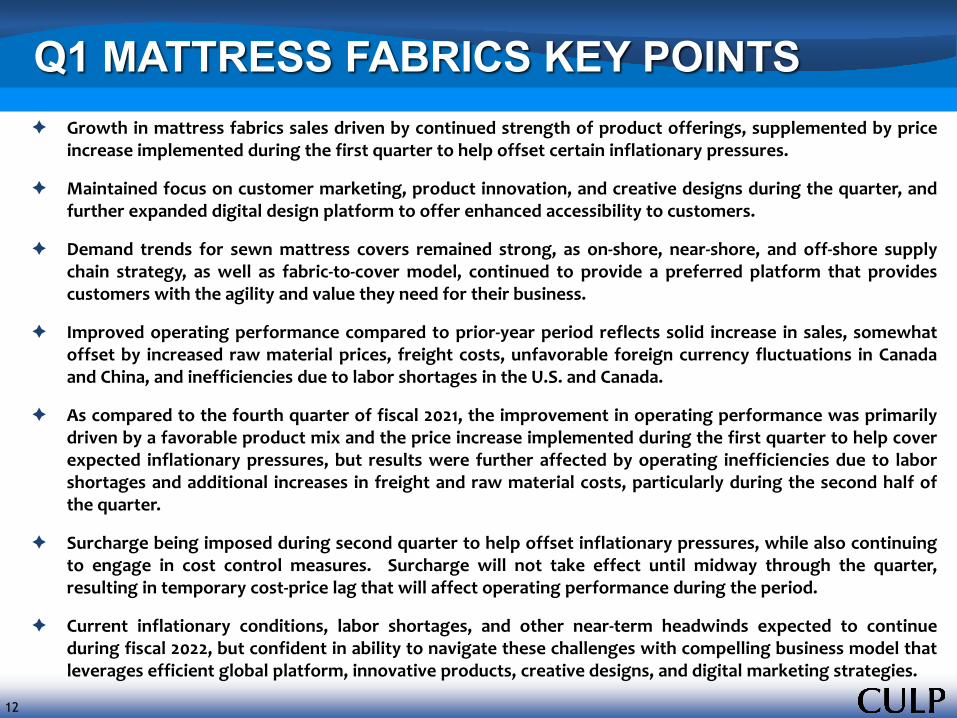
Q1 MATTRESS FABRICS KEY POINTS Growth in mattress fabrics sales driven by continued strength of product offerings, supplemented by price
increase implemented during the first quarter to help offset certain inflationary pressures.
Maintained focus on customer marketing, product innovation, and creative designs during the quarter, andfurther expanded digital design platform to offer enhanced accessibility to customers.
Demand trends for sewn mattress covers remained strong, as on-shore, near-shore, and off-shore supplychain strategy, as well as fabric-to-cover model, continued to provide a preferred platform that providescustomers with the agility and value they need for their business.
Improved operating performance compared to prior-year period reflects solid increase in sales, somewhatoffset by increased raw material prices, freight costs, unfavorable foreign currency fluctuations in Canadaand China, and inefficiencies due to labor shortages in the U.S. and Canada.
As compared to the fourth quarter of fiscal 2021, the improvement in operating performance was primarilydriven by a favorable product mix and the price increase implemented during the first quarter to help coverexpected inflationary pressures, but results were further affected by operating inefficiencies due to laborshortages and additional increases in freight and raw material costs, particularly during the second half ofthe quarter.
Surcharge being imposed during second quarter to help offset inflationary pressures, while also continuingto engage in cost control measures. Surcharge will not take effect until midway through the quarter,resulting in temporary cost-price lag that will affect operating performance during the period.
Current inflationary conditions, labor shortages, and other near-term headwinds expected to continueduring fiscal 2022, but confident in ability to navigate these challenges with compelling business model thatleverages efficient global platform, innovative products, creative designs, and digital marketing strategies.
13
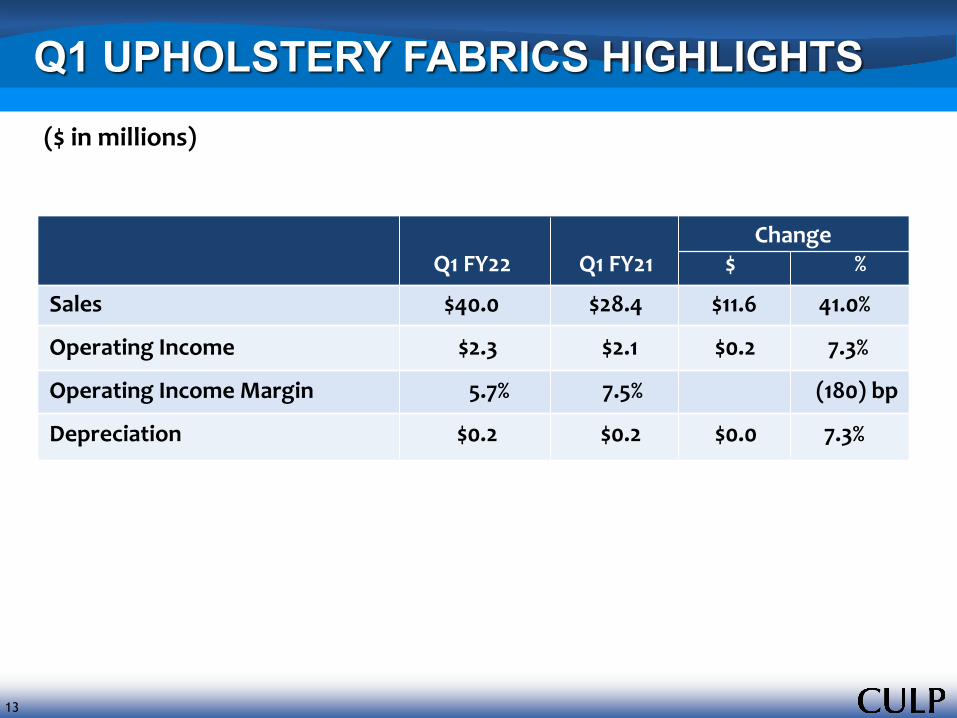
Q1 UPHOLSTERY FABRICS HIGHLIGHTS ($ in millions)
Q1 FY22 Q1 FY21Change
$ %
Sales $40.0 $28.4 $11.6 41.0%
Operating Income $2.3 $2.1 $0.2 7.3%
Operating Income Margin 5.7% 7.5% (180) bp
Depreciation $0.2 $0.2 $0.0 7.3%

14
Q1 UPHOLSTERY FABRICS KEY POINTS Strong growth in sales for first quarter, driven by significant increase in residential business
compared to prior-year period, and supplemented by price increase effective during the quarter.
Continued to benefit from growth in market share reach, flexibility of Asian platform, and success ofproduct innovation strategy, including ongoing popularity of LiveSmart® portfolio of products.
Hospitality business, particularly Read Window Products, remained under significant pressure fromongoing COVID-19 disruption that continues to affect travel and leisure industries.
Operating performance for first quarter, as compared to prior-year period and fourth quarter of fiscal2021, was negatively affected by dramatic increase in freight costs and lower sales in Read WindowProducts business, as well as start-up costs for new Haiti facility. Operating performance ascompared to prior-year period also pressured by foreign currency fluctuations in China.
Previously implemented price increase helped offset foreign currency exchange rate fluctuations tosome extent, as intended, and an additional freight surcharge is being imposed during the secondquarter to help cover the continued rise in freight costs.
Began to see growing backlog in Read Window Products business during first quarter, but given thetypically longer-term (six to nine month) time frame for project installations, there is a temporary lagbetween impact of pandemic-related disruption and improved results for this business.
Strong backlog in residential upholstery business reflects continued favorable demand.
Expect near-term headwinds, including rising freight and labor costs, customer supply chainconstraints, and ongoing pandemic-related disruption to temporarily pressure business during fiscal2022, but well positioned to sustain and enhance competitive advantage over long term withproduct-driven strategy, flexible Asian platform, upcoming addition of new Haiti platform, and long-term supplier relationships.

CULP, INC.NYSE:CULP www.culp.comInvestor Contact:Ken Bowling, Chief Financial Officer
336-881-5630
16
FORWARD LOOKING STATEMENTS
This presentation contains “forward-looking statements” within the meaning of the federal securities laws, including the Private Securities LitigationReform Act of 1995 (Section 27A of the Securities Act of 1933 and Section 21E of the Securities and Exchange Act of 1934). Such statements areinherently subject to risks and uncertainties that may cause actual events and results to differ materially from such statements. Further, forwardlooking statements are intended to speak only as of the date on which they are made, and we disclaim any duty to update such statements to reflectany changes in management’s expectations or any change in the assumptions or circumstances on which such statements are based, whether due tonew information, future events, or otherwise. Forward-looking statements are statements that include projections, expectations, or beliefs aboutfuture events or results or otherwise are not statements of historical fact. Such statements are often but not always characterized by qualifyingwords such as “expect,” “believe,” “anticipate,” “estimate,” “intend,” “plan,” “project,” and their derivatives, and include but are not limited tostatements about expectations for our future operations, production levels, new product launches, sales, profit margins, profitability, operatingincome, capital expenditures, working capital levels, income taxes, SG&A or other expenses, pre-tax income, earnings, cash flow, and otherperformance or liquidity measures, as well as any statements regarding potential acquisitions, future economic or industry trends, public healthepidemics, or future developments. There can be no assurance that we will realize these expectations or meet our guidance, or that these beliefs willprove correct.
Factors that could influence the matters discussed in such statements include the level of housing starts and sales of existing homes, consumerconfidence, trends in disposable income, and general economic conditions. Decreases in these economic indicators could have a negative effect onour business and prospects. Likewise, increases in interest rates, particularly home mortgage rates, and increases in consumer debt or the generalrate of inflation, could affect us adversely. The future performance of our business depends in part on our success in conducting and finalizingacquisition negotiations and integrating acquired businesses into our existing operations. Changes in consumer tastes or preferences towardproducts not produced by us could erode demand for our products. Changes in tariffs or trade policy, or changes in the value of the U.S. dollar versusother currencies, could affect our financial results because a significant portion of our operations are located outside the United States.Strengthening of the U.S. dollar against other currencies could make our products less competitive on the basis of price in markets outside theUnited States, and strengthening of currencies in Canada and China can have a negative impact on our sales of products produced in those places.Also, economic or political instability in international areas could affect our operations or sources of goods in those areas, as well as demand for ourproducts in international markets. The impact of public health epidemics on employees, customers, suppliers, and the global economy, such as theglobal coronavirus pandemic currently affecting countries around the world, could also adversely affect our operations and financial performance.In addition, the impact of potential goodwill or intangible asset impairments could affect our financial results. Finally, increases in market prices forpetrochemical products can significantly affect the prices we pay for raw materials, and in turn, increase our operating costs and decrease ourprofitability. Further information about these factors, as well as other factors that could affect our future operations or financial results and thematters discussed in forward-looking statements, is included in Item 1A “Risk Factors” in our most recent Form 10-K and form 10-Q reports filed withthe Securities and Exchange Commission. A forward-looking statement is neither a prediction nor a guarantee of future events or circumstances, andthose future events or circumstances may not occur.

17
ABOUT NON-GAAP FINANCIAL INFORMATION
This presentation contains adjusted income statement information, which discloses adjusted net income (loss) and adjusted earnings per share, non-GAAP performance measures that eliminate (a non-cash income tax charge in connection with a full valuation allowance against the Company’s U.S.net deferred income tax assets, as well as a non-cash income tax benefit resulting from the re-establishment of certain U.S. Federal net operatingloss carryforwards in connection with the recently enacted final regulations regarding the Global Intangible Low Taxed Income (“GILTI”) taxprovisions of the Tax Cuts and Jobs Act of 2017. The company has included this adjusted information in order to show operational performanceexcluding the effects of this non-cash income tax charge and non-cash income tax benefit, which are not expected to occur on a regular basis.Details of these calculations and a reconciliation to information from our GAAP financial statements are set forth in the back of this presentation.Management believes this presentation aids in the comparison of financial results among comparable financial periods. We note, however, that thisadjusted income statement information should not be viewed in isolation or as a substitute for net income or earnings per share calculated inaccordance with GAAP. In addition, the calculation of the company’s income taxes involves numerous estimates and assumptions, which we havemade in good faith.
This presentation contains disclosures about free cash flow, a non-GAAP liquidity measure that we define as net cash provided by (used in)operating activities, less cash capital expenditures, plus any proceeds from sale of property, plant, and equipment, less investment inunconsolidated joint venture, plus proceeds from life insurance policies, less premium payments on life insurance policies, less payments on vendor-financed capital expenditures, plus proceeds from the sale of long-term investments associated with our rabbi trust, less the purchase of long-terminvestments associated with our rabbi trust, and plus or minus the effects of foreign currency exchange rate changes on cash and cash equivalents,in each case to the extent any such amount is incurred during the period presented. Details of these calculations and a reconciliation to informationfrom our GAAP financial statements are set forth in the back of this presentation. Management believes the disclosure of free cash flow providesuseful information to investors because it measures our available cash flow for potential debt repayment, stock repurchases, dividends, additions tocash and investments, or other corporate purposes. We note, however, that not all of the company’s free cash flow is available for discretionaryspending, as we may have mandatory debt payments and other cash requirements that must be deducted from our cash available for future use. Inoperating our business, management uses free cash flow to make decisions about what commitments of cash to make for operations, such ascapital expenditures (and financing arrangements for these expenditures), purchases of inventory or supplies, SG&A expenditure levels,compensation, and other commitments of cash, while still allowing for adequate cash to meet known future commitments for cash, such as debtrepayment, and also for making decisions about dividend payments and share repurchases.
18
ABOUT NON-GAAP FINANCIAL INFORMATION (2)
This presentation contains disclosures about our Adjusted EBITDA, which is a non-GAAP performance measure that reflects net income (loss)excluding loss before income taxes from discontinued operations, income tax expense (benefit) from continuing operations, and net interestincome, as well as depreciation and amortization expense from continuing operations, and stock-based compensation expense. This measure alsoexcludes asset impairment charges from continuing operations, gain on bargain purchase, restructuring and related charges and credits, as well asother non-recurring charges and credits associated with our business. Details of these calculations and a reconciliation to information from ourGAAP financial statements are set forth in this presentation. We believe presentation of Adjusted EBITDA is useful to investors because earningsbefore interest income and expense, income taxes, depreciation and amortization, and similar performance measures that exclude certain chargesfrom earnings, are often used by investors and financial analysts in evaluating and comparing companies in our industry. We note, however, thatsuch measures are not defined uniformly by various companies, with differing expenses being excluded from net income to calculate theseperformance measures. For this reason, Adjusted EBITDA should not be viewed in isolation by investors and should not be used as a substitute fornet income calculated in accordance with GAAP, nor should it be used for direct comparisons with similarly titled performance measures reportedby other companies. Use of Adjusted EBITDA as an analytical tool has limitations in that this measure does not reflect all expenses that arenecessary to fund and operate our business, including funds required to pay taxes, service our debt, and fund capital expenditures, among others.Management uses Adjusted EBITDA to help it analyze the company’s earnings and operating performance, by excluding the effects of expenses thatdepend upon capital structure and debt level, tax provisions, and non-cash items such as depreciation, amortization and stock-based compensationexpense that do not require immediate uses of cash.

19
Q1 RECONCILIATION OF SELECTED INCOME STATEMENT INFORMATION TO ADJUSTED RESULTS

20
RECONCILIATION OF FREE CASH FLOW
RECONCILIATION OF FREE CASH FLOW FOR THE THREE MONTHS ENDED AUGUST 1, 2021, AND AUGUST 2, 2020
(UNAUDITED)(AMOUNTS IN THOUSANDS)