cs 273p machine learning and data mining spring 2019 prof...
TRANSCRIPT

Introduction
PROF XIAOHUI XIESPRING 2019
CS 273P Machine Learning and Data Mining
Slides courtesy of Alex Ihler

Machine Learning
Introduction to Machine Learning
Course Logistics
Data and Visualization
Supervised Learning

Artificial Intelligence (AI)
● Building “intelligent systems”● Lots of parts to intelligent behavior
RoboCup
Darpa GC (Stanley)
Chess (Deep Blue v. Kasparov)

Machine learning (ML)
● One (important) part of AI● Making predictions (or decisions)● Getting better with experience (data)● Problems whose solutions are “hard to describe”

This course
Math Programming
StatisticsProbabilityLinear Algebra Optimization
Data StructuresAlgorithms
Computational ComplexityData Management

Types of prediction problems
● Supervised learning○ “Labeled” training data○ Every example has a desired target value (a “best answer”)○ Reward prediction being close to target
○ Classification: a discrete-valued prediction (often: action / decision)○ Regression: a continuous-valued prediction

Types of prediction problems
● Supervised learning● Unsupervised learning
○ No known target values○ No targets = nothing to predict?○ Reward “patterns” or “explaining features”○ Often, data mining
romance?
serious?
escapist?
The PrincessDiaries
The Lion King
Braveheart
Lethal Weapon
Independence Day
Amadeus
The Color Purple
Dumb and Dumber
Ocean’s 11
Sense and Sensibility
action?

Human Gene Expression Data
Hastie, Tibshirani, & Friedman 2009
• 6830x64 matrix of real numbers• Rows correspond to genes,
columns to tissue samples• Cluster rows (genes) to deduce
function of unknown genes from experimentally known genes with similar profiles
• Cluster columns (samples) to hypothesize disease profiles

Types of prediction problems
● Supervised learning● Unsupervised learning● Semi-supervised learning
○ Similar to supervised○ some data have unknown target values
● Ex: medical data○ Lots of patient data, few known outcomes
● Ex: image tagging○ Lots of images on Flikr, but only some of them tagged

Types of prediction problems
● Supervised learning● Unsupervised learning● Semi-supervised learning● Reinforcement learning
● “Indirect” feedback on quality○ No answers, just “better” or “worse”○ Feedback may be delayed

Summary
What is machine learning?● Computer science + Math (Optimization & Statistics)● How do we learn from data to improve performance
Types of machine learning● Supervised learning● Unsupervised learning● Semi-supervised learning● Reinforcement learning

Machine Learning
Introduction to Machine Learning
Course Logistics
Data and Visualization
Supervised Learning

Online resources
Course websitehttps://www.ics.uci.edu/~xhx/courses/CS273P/
Canvas:https://canvas.eee.uci.edu/courses/17579
Piazza:https://piazza.com/uci/spring2019/cs273p/home

Course Staff
● Instructor: Prof. Xiaohui XieResearch Interests: AI/Machine Learning, Image analysis, Applications in biology and medicine …
● Teaching Assistant: Deying Kong● Reader: Yoshitomo Matsubara
Lecture: TuTh 3:30-4:50p in SH 128
Lab: F 5:00-5:50p in SH 174
Contact us on Piazza We may be delayed on email, or miss it.

Grading
● Midterm: During normal lecture period on Tuesday May 7th.
● Final: Tue, Jun 11, 4-6pm
● No rescheduling except in extraordinary, unexpected circumstances!
● No late assignments will be accepted except for legitimate medical reasons

Programming Assignments
• We will drop lowest grade
5 Programming Assignments
• Submit relevant code snippets• We will not run it, but will read it
• Statement of collaboration, if any• Only limited discussions allowed
Source Code (Python)
• Learn to apply ML techniques• Submission is a “report”
Objective

Project
• Team size should be 2• Larger teams not allowed
• More details coming later (most work after midterm)
• Short report due at the end of the quarter
Groups for the Project

Participation
Surveys and Course Evaluation● Occasional polls on Canvas● Participate in Course Evals
Discussions on Piazza● Ask questions about material● Answer posted questions● Up vote helpful resources● Post useful links related to the course
Lecture attendance is required

Programming
Discussion session
• Present demos• Questions about coding• Hints for homeworks• Led by TA
Python Notebooks
Math

Machine Learning
Introduction to Machine Learning
Course Logistics
Data and Visualization
Supervised Learning
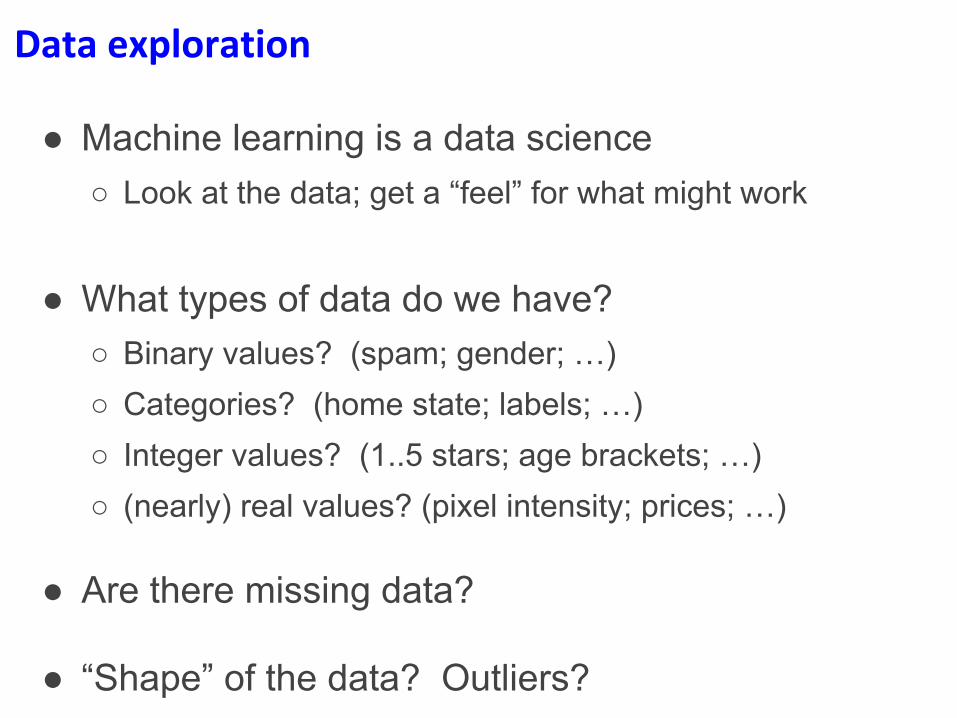
Data exploration
● Machine learning is a data science○ Look at the data; get a “feel” for what might work
● What types of data do we have?○ Binary values? (spam; gender; …)○ Categories? (home state; labels; …) ○ Integer values? (1..5 stars; age brackets; …)○ (nearly) real values? (pixel intensity; prices; …)
● Are there missing data?
● “Shape” of the data? Outliers?

Scientific software
● Python○ Numpy, MatPlotLib, SciPy…
● Matlab○ Octave (free)
● R○ Used mainly in statistics
● C++○ For performance, not prototyping
● And other, more specialized languages for modeling…

Representing data
• Example: Fisher’s “Iris” data http://en.wikipedia.org/wiki/Iris_flower_data_set
• Three different types of iris– “Class”, y
• Four “features”, x1,…,x4– Length & width of
sepals & petals
• 150 examples (data points)

Intro to Basic Terminology and Notations

Representing the data in Python
● Have m observations (data points)
● Each observation is a vector consisting of n features
● Often, represent this as a “data matrix”
import numpy as np #import numpyiris = np.genfromtxt("data/iris.txt",delimiter=None)X = iris[:,0:4] # load data and split into features, targetsY = iris[:,4]print(X.shape) # 150 data points; 4 features each (150, 4)

Basic statistics
● Look at basic information about features○ Average value? (mean, median, etc.)○ “Spread”? (standard deviation, etc.)○ Maximum / Minimum values?
print(np.mean(X, axis=0)) # compute mean of each feature [ 5.8433 3.0573 3.7580 1.1993 ]print(np.std(X, axis=0)) #compute standard deviation of each feature [ 0.8281 0.4359 1.7653 0.7622 ]print(np.max(X, axis=0)) # largest value per feature [ 7.9411 4.3632 6.8606 2.5236 ]print(np.min(X, axis=0)) # smallest value per feature [ 4.2985 1.9708 1.0331 0.0536 ]

Histograms
● Count the data falling in each of K bins○ “Summarize” data as a length-K vector of counts (& plot)○ Value of K determines “summarization”; depends on # of data
■ K too big: every data point falls in its own bin; just “memorizes”■ K too small: all data in one or two bins; oversimplifies
% Histograms in MatPlotLibimport matplotlib.pyplot as pltX1 = X[:,0] # extract first feature Bins = np.linspace(4,8,17) # use explicit bin locationsplt.hist( X1, bins=Bins ) # generate the plot

Scatterplots
● Illustrate the relationship between two features
% Plotting in MatPlotLibplt.plot(X[:,0], X[:,1], ’b.’); % plot data points as blue dots

Scatterplots
● For more than two features we can use a pair plot:

Supervised learning and targets
● Supervised learning: predict target values● For discrete targets, often visualize with color
plt.hist( [X[Y==c,1] for c in np.unique(Y)] , bins=20, histtype='barstacked’)
ml.histy(X[:,1], Y, bins=20)
colors = ['b','g','r']for c in np.unique(Y): plt.plot( X[Y==c,0], X[Y==c,1], 'o', color=colors[int(c)] )

Machine Learning
Introduction to Machine Learning
Course Logistics
Data and Visualization
Supervised Learning

How does machine learning work?
● “Meta-programming”○ Predict – apply rules to examples○ Score – get feedback on performance○ Learn – change predictor to do better
Program (“Learner”)
Characterized by some “parameters” θ
Procedure (using θ) that outputs a prediction
Training data (examples)
Features (x)
Learning algorithm
Change θImprove performance
Feedback / Target values(y)
Score performance(“cost function”)
“predict”
“train”

How does machine learning work?
Program (“Learner”)
Characterized by some “parameters” θ
Procedure (using θ) that outputs a prediction
Training data (examples)
Features (x)
Learning algorithm
Change θImprove performance
Feedback / Target values(y)
Score performance(“cost function”)
“predict”
“train”
● Notation○ Features x○ Targets y○ Predictions ŷ = f(x ; θ)○ Parameters θ

Regression; Scatter plots
● Suggests a relationship between x and y● Prediction: new x, what is y?
0 10 200
20
40T
arge
t y
Feature x
x(new)
y(new) =?

Nearest neighbor regression
● Find training datum x(i) closest to x(new) Predict y(i)
0 10 200
20
40
x(new)
y(new) =?T
arge
t y
Feature x

Nearest neighbor regression
● Defines a function f(x) implicitly● “Form” is piecewise constant
0 10 200
20
40
Tar
get
y
Feature x
“Predictor”:Given new features: Find nearest example Return its value

Linear regression
● Define form of function f(x) explicitly● Find a good f(x) within that family
0 10 200
20
40
Tar
get
y
Feature x
“Predictor”:Evaluate line:
return r

Measuring error
0 20
0
Error or “residual”
Prediction
Observation

Regression vs. Classification
Regression
Features xReal-valued target y
Predict continuous function ŷ(x)
y
x
Classification
Features xDiscrete class c (usually 0/1 or +1/-1 )Predict discrete function ŷ(x)
y
x
x
“flatten”

Classification
X1
X2
?

Classification
X1
X2
?
All points where we decide 1
All points where we decide -1
Decision Boundary

Upcoming
● Sign up on Piazza○ All course announcements will be done through Piazza! You may miss
information announcements if you are not on Piazza.
● Homework 1 will be up soon. ○ Meanwhile, get familiar with Python, Numpy, Matplotlib

Acknowledgement
Based on slides by Alex Ihler