crossed random-effect modeling: examining the effects of ... · scoring rubrics when grading...
TRANSCRIPT

Eurasian Journal of Educational Research, Issue 57, 2014, 1-28
Crossed Random-Effect Modeling: Examining the Effects
of Teacher Experience and Rubric Use in Performance
Assessments
Adnan KAN**
Okan BULUT***
Suggested Citation:
Kan, A., & Bulut, O. (2014). Crossed random-effect modeling: examining the effects
of teacher experience and rubric use in performance assessments. Eurasian
Journal of Educational Research, 57, 1-28. doi: dx.doi.org/10.14689/ejer.2014.57.4
Abstract
Problem Statement: Performance assessments have emerged as an
alternative method to measure what a student knows and can do. One of
the shortcomings of performance assessments is the subjectivity and
inconsistency of raters in scoring. A common criticism of performance
assessments is the subjective nature of scoring procedures. The
effectiveness of the performance assessment procedure depends highly on
the quality and coordination of teacher and rubric. To gain a better
understanding of the interaction between teachers and performance
assessments, it is crucial to examine the effects of teacher-related factors
and how teachers interact with scoring rubrics when grading performance
assessments. One of these factors is teachers’ work and scoring experience.
When grading performance assessments, the experienced teachers may be
expected to grade student performances more objectively through their
experience in instruction and evaluation than the teachers with less
teaching and scoring experience.
Purpose of Study: This study investigates the impact of rubric use and
teaching experience on teachers’ scoring behaviors in performance
assessments. The effects of teaching experience and rubric use on the
consistency of scores assigned by teachers is examined through an
empirical study.
**Corresponding author: Dr., Department of Education Sciences, Gazi University, Ankara, Turkey. E-mail: [email protected] ***Dr., Department of Educational Psychology, University of Alberta, Edmonton, Alberta, Canada. E-mail: [email protected]

2 Adnan Kan & Okan Bulut
Methods: Crossed random-effects modeling was used to estimate rater
effects, consistency among the teachers, and the effect of teaching
experience.
Findings and Results: Results indicated that lack of a scoring guide may
cause the teachers to establish their performance criteria and score tasks
inconsistently. When teachers used a rubric, inter-rater reliability
substantially increased. Experienced teachers and teachers with little
teaching experience exhibited different severity patterns in scoring.
Conclusions and Recommendations: Based upon the results of this study, it
appears that teachers who have more teaching experience tend to score
performance tasks more leniently than teachers who do not have long
years of teaching experience. The differences in the teachers’ scoring due
to their teaching experience became negligible when all teachers used a
scoring rubric. In addition to teaching experience, the potential effects of
other external factors should also be considered to make the use of rubrics
more effective in performance assessments. This study illustrated an
alternative methodology to estimate variance components and the effects
of fixed factors within the same analysis. A big advantage of this modeling
approach over generalizability theory is that it allows for the separation of
random and fixed effects from each other. Although the findings of this
study enrich the limited knowledge about the effects of rubric use and
teaching experience on teachers’ scoring behaviors, further research is
needed to understand the reasons why these factors are influential.
Keywords: Performance assessment, rubric, teaching experience,
reliability, rater effects, crossed random effects model.
In the last two decades, most educators in K-12 and higher education institutions
have started focusing on critical thinking and problem solving abilities rather than
factual knowledge and lower-level cognitive skills. To prioritize critical thinking and
problem solving skills in instruction, the evaluation policies and procedures have
also been changing from the conventional testing of knowledge to ―evaluation for
learning‖ (Dochy, Gijbels, & Segers, 2006). To measure critical thinking, traditional
methods of assessment (e.g., paper and pencil assessments, multiple-choice tests) do
not seem to be adequate. Standardized test scores and traditional ways of reporting
grades provide a narrow and arbitrary measuring system that does not give any
additional information about instructional purposes (Routman, 1991). Therefore, the
inadequacy of the existing assessment methods has led to the development of
alternative testing methods—such as performance assessments—that prompt
students to use higher-order thinking skills such as analysis, synthesis, and
evaluation.
Although standardized tests have dominated student assessment systems and
assessment policies such as No Child Left Behind for years, educators in the United
States and other nations have been able to move to utilizing performance

Eurasian Journal of Educational Research 3
assessments and portfolios as an alternative against standardized testing for
assessing student performances. The essence of reality in an assessment is to provide
more valid information about the competence of the student and to reflect
complexity in the real world rather than solely focusing on the truth where the
context is the only source for the learning process (Darling-Hammond & Synder,
2000). As Palm (2008) mentioned, the performance assessment method is viewed as
providing more opportunities to measure complex skills and communication, which
are considered important competencies and disciplinary knowledge needed in
today’s society. In comparison to conventional assessment methods, performance
assessments allow students to become more open in their responses (Messick, 1996).
On such assessments, students are required to perform a task rather than select an
answer from a ready-made list, such as multiple-choice items. As a result,
performance assessments are able to take control of more elusive part of learning in
such a way that students are required to deal with realistic and authentic problems.
Despite their many advantages over traditional assessment methods,
performance assessments have not been considered as the main tool for student
assessment. A common criticism of performance assessments is the subjective nature
of scoring procedures. While questions in traditional assessments can easily be
scored as right or wrong, the difference is not as clear-cut with performance
assessments (Brualdi, 1998). Two important steps are required to minimize the role of
subjectivity in performance assessments. First, a scoring mechanism should be
developed to grade performance assessments in a reliable way. This scoring
mechanism should consist of performance level descriptors (PLDs) that provide
information to teachers and students about the skill and knowledge a student needs
to demonstrate along with a scoring rubric that indicates what criteria should be
used to evaluate students’ performances. The second step is to provide training to
teachers or raters about how to use PLDs and rubrics to make judgments about
students’ performance on a task.
The effectiveness of the performance assessment procedure highly depends on
the quality and coordination of teacher and rubric. To have a better understanding of
the interaction between teachers and rubrics, potential factors that may influence
scoring procedures should be carefully examined. One of these factors is teachers’
work and scoring experience. Experienced teachers may be expected to grade
students’ performances more objectively because of their experience in instruction
and evaluation. Of course, this does not necessarily mean that teachers with little
experience would score inconsistently. Rather, teachers who have recently started
their careers can be more objective and consistent in scoring performance
assessments since performance-based assessment systems have recently been a core
part of teacher education programs. To gain a better understanding of the interaction
between teachers and performance assessments, it is crucial to examine the effects of
teacher-related factors (e.g., teaching experience) and how teachers interact with
scoring rubrics when grading performance assessments. This study investigates the
impact of teaching experience and rubric use on teachers’ scoring behaviors in

4 Adnan Kan & Okan Bulut
performance assessments. The effects of teaching experience and rubric use on the
consistency of scores assigned by teachers is examined through an empirical study.
Rubrics in Performance Assessments
Performance assessments require grading strategies that are commonly used in
the applied sciences, performing arts, fine arts, and Olympic competitions. For
example, in the context of the science laboratory, students are graded based on their
performance of manipulating variables, using scientific apparatus, identifying
hypotheses, making measurements and calculations, organizing and managing data,
and the communication of results (Slater & Ryan, 1993). Studies that have closely
looked at performance assessments indicate that, if the evaluation criteria are clear
and there are available examples to show levels of competency, performance
assessments are highly consistent across different raters (Kulm & Malcom, 1991;
O’Neil, 1992). To assure that raters implement a consistent grading procedure across
all examinees, scoring guidelines called ―rubrics‖ are used for scoring performance
assessments.
Rubrics are the vehicles that provide a useful mechanism to translate students’
achievement into assessments (Schafer, Swanson, Bené, & Newberry, 2001). Rubrics
provide a description of various levels of performance for a certain task, and define
what varying levels of mastery should look like (Hafner & Hafner, 2003). To produce
valid and reliable results, a rubric should provide enough information to help raters
to assess student performances (Stuhlmann, Daniel, Dellinger, Denny, & Powers,
1999). Rubrics usually consist of a scoring scale from 3 to 5 points depending on the
evaluation criteria. Each of the points corresponds to a certain level of performance
on a particular task (Wiener & Cohen, 1997). The scoring criteria on the rubric must
correspond with the pre-specified standards, and distinguish between levels of
performance (Farr & Tone, 1998).
Previous research has indicated that when raters use rating scales or rubrics
inconsistently, it may result in a wide range of misleading scores (Hadden, 1991;
Wigglesworth, 1994). Inconsistent use of rubrics may occur due to a lack of
understanding of the construct or the rubric. Raters may attempt to use wide range
of non-criterion information when scoring performances (Ang-Aw & Goh, 2011). In
classrooms, teachers can easily familiarize themselves with scoring rubrics because
they are supposed to know the construct to be measured and performance levels to
be achieved. However, it does not guarantee that each teacher comprehends a rubric
in the same way. As teachers become more competent and experienced with
instructional practices, they can use scoring rubrics and performance assessments
more effectively in their classrooms.
The teacher’s role in assessments is crucial because they make judgments about
the quality of a student's performance. Brennan (2000) contends that, in most
performance assessments, raters do not often cause a considerable variability in
observed scores. However, this does not necessarily mean that this variability is
always negligible, and so it should be ignored. Differentiation among raters’ scoring
behaviors may be an important source of score variation because raters’ scoring

Eurasian Journal of Educational Research 5
behaviors have a direct impact on the reliability and validity of performance
assessments. There are several factors that may affect raters’ scoring performances,
such as rater training, rubric use, quality of rubrics, and multiple scoring occasions.
In addition, teacher characteristics such as teaching background, teaching experience,
and scoring experience may also influence the way teachers approach the scoring of
performance assessments.
Receiving decent training on how to score performance tasks using a rubric may
positively influence the way that raters understand and score tasks in an assessment
(Schafer et al., 2001; Stuhlmann et al., 1999). Of course, training raters does not
necessarily assure that all raters interact with the scoring rubric and the assessment
in the same way. Despite receiving the same training about scoring rubrics, raters
may evaluate student performances differently because of their own construct of a
good performance (Lumley, 1998; Schafer et al., 2001). As Eckes (2008) highlighted,
raters may differ not only in the way they understand and apply the scoring criteria,
but also in the level of subjectivity they incorporate into scoring, and in the degree to
which their ratings are consistent across examinees, scoring criteria, and tasks. Even
though teachers use the same rubric, they may differ in terms of their scoring
severity based upon their familiarity with rubrics and performance assessments.
Factors such as the background and scoring experience of the raters have also
been shown to affect raters’ scoring practices (Eckes, 2008; Hamp-Lyons, 1991). In
addition to scoring experience, the teaching experience of teachers is also an
important criterion that has been used by many countries (e.g., England, France, and
Canada) to recruit raters who score the nation-wide exams. Teaching experience as a
rater selection criterion has frequently become embedded in the cultural expectations
associated with the tests (Royal-Dawson & Baird, 2009). For instance, in the UK, the
Assessment and Qualifications Alliance (AQA) requires raters selected for national
examinations to have suitable academic qualifications, and at least three terms of
teaching experience that should be recent and relevant.
Although teaching experience has been a criterion for rater selection, there is very
little research about the effect of teaching experience on scoring and how to select
raters who can score more accurately (e.g. Pinot de Moira, 2003; Royal-Dawson &
Baird, 2009). Since performance and portfolio assessments are relatively newer
techniques in comparison to conventional testing, new teachers may be expected to
be more familiar with performance assessments and rubrics for scoring portfolios
and performance tasks. However, experienced teachers are also advantageous
because they are more likely to have a better sense of assigning coherent scores
across examinees based upon their experience. Previous research suggests that raters
with little experience tend to score tasks more severely than experienced raters
(Shohamy, Gordon, & Kraemer, 1992; Weigle, 1999). However, Myford and Mislevy
(1994) and Meyer (2000) found that teaching experience had only a negligible impact
on predictions of rater severity.
These rater-related issues bring us to the question of whether severity in scoring
or inconsistency among raters is more noteworthy. Since performance and portfolio

6 Adnan Kan & Okan Bulut
assessments in classrooms are mostly graded by a single teacher, the issue of
inconsistency among raters is not likely to occur. In that case, exposing all of the
students’ responses to the bias of a single rater, which is known as rater severity, is a
more serious issue. However, in large-scale testing programs, the main concern is
often inconsistency rather than severity in scoring. Variations across raters in scoring
severity can be accounted for by adjusting candidates’ scores (Baird & Mac, 1999). To
examine the consistency among raters or across scoring occasions, different measures
of consistency such as inter-rater and intra-rater reliability coefficients can be used.
Reliability of Performance Assessments
Raters, tasks, and other sources of score variation can influence the precision of
performance assessments (Brennan, 2000). Each source brings different types of
issues that may influence the consistency of scoring within or between raters. There
are several methods to determine consistency of scores across raters or occasions,
such as Cohen’s kappa statistic (Cohen, 1960), Pearson correlation coefficient, and
coefficient alpha (Crocker & Algina, 1986). All of these reliability coefficients have
been used to examine a single source of measurement error in students’ scores. An
alternative way to examine the consistency of scores is to obtain measurement
estimates based on a summary score for each participant, taking into account the
extent to which each judge influences the score. The most common example of this
method is generalizability theory, which allows for estimating reliability by
examining multiple sources of errors and their possible interactions simultaneously
(Brennan, 2001; Shavelson & Webb, 1991).
Unlike a single error term in classical test theory (CTT) that is the total variation
in scores due to error, generalizability (G) theory allows for the examination of
multiple sources of error simultaneously (Shavelson & Webb, 1991). G theory
extends the idea of total variation consisting of true score and error variations in CTT
by ascribing variations in observations to specific sources, such as persons, raters,
tasks, etc. In G theory, sources of random variation are defined as facets. A
generalizability model can separate out random variations due to each facet that
contribute to the total error variation. Detecting the variation due to each facet can
provide a mechanism for optimizing the reliability of performance assessments.
In generalizability studies, participants, tasks, and raters are either nested or
crossed. Crossed designs are those where every condition of each facet is repeated for
every condition of the other facets (e.g., each rater grades all tasks responded to by
all persons). Differences in rater severity are taken into account at the level of the
individual person, facets, or group (Stemler, 2004). For a study with three crossed
random facets (e.g., person x rater x task), random variation due to each of these
facets, and their two-way and three-way interactions, are estimated. In this example,
the total observed score variance (Xprt) is decomposed into seven variance
components:
2 2 2 2 2 2 2 2( )prt p r t pr pt rt prtX (1)

Eurasian Journal of Educational Research 7
Variance components are used to compute a generalizability coefficient that is the
ratio of score variance to the sum of score variance and residual variance. The
generalizability coefficient is analogous to the reliability coefficient in CTT (Brennan,
2000; Shavelson & Webb, 2005). As intraclass correlation coefficients, the
generalizability coefficient can be computed by dividing the score variance among
persons by the sum of score variance and error variance. In a crossed person-by-item
design, the generalizability coefficient can be shown as follows:
2
2
2 2
(p)
(p) (δ)E
(2)
where σ2(p) is universe score variance or true score variance and σ2(δ) is the relative
error vaiance of the scores, which is basically the sum of σ2(pt), σ2(pr), and σ2(prt).
The relative error variance in G theory corresponds to residual or error variance in
CTT. As with most reliability indices, the larger Eρ2, the higher reliability the scores
have.
Although G theory is able to break down different sources of error variation, it
does not allow for the estimation of fixed covariates (i.e., fixed effects) in addition to
error variation (i.e., random effects). A more sophisticated approach, mixed-effects
modeling, can overcome this limitation by estimating random and fixed effects
together and allowing additional covariates to be included in the model.
Random-Effects Modeling
G theory is accepted as the equivalent of the random effects model of the
analysis of variance (ANOVA). The variability in scores is examined rather than
estimation of universe scores because the facets are assumed to be randomly selected
from some relevant universe, as in random-effects ANOVA (Ward, 1986). Facets in
the generalizability model are defined as random effects in the random-effects
ANOVA model. Mixed-effects modeling is a general framework that combines both
linear regression and random effects modeling. Mixed-effects models are primarily
used to describe linear or non-linear relationships between a dependent variable and
some covariates in data that are grouped according to one or more classification
factors (Pinheiro & Bates, 2000, p. 57).
Random effects in mixed-effect models correspond to facets in G theory.
Random variation due to the facets and their interactions are captured by estimating
random effects. Unlike hierarchical or multilevel models in which random effects
must be assumed to be nested, mixed effects models allow random effects to be
crossed. Because all facets are crossed with each other, this model can be called a
crossed random-effects model. A crossed random-effects model with three crossed
facets (e.g., persons, tasks, and raters) can be shown as follows:
jik jik i i j j k k jikY X Tt P p R r .
(3)

8 Adnan Kan & Okan Bulut
In Equation 3, Yjik is the score of person j on task i determined by rater k, and β is
the fixed-effect coefficient that is an identical intercept term for all the facets in the
model. The next term, Xjik, is a design matrix that includes the fixed-effect regressors
for person j on task i graded by rater k. Similar to Xjik, Ti, Pj, and Rk are the design
matrices that represent the random-effect regressors for persons, tasks, and raters.
The multiplicators of the design matrices are the random-effect coefficients for
persons, tasks, and raters. These random effects are assumed to have a multivariate
normal distribution, ti, pj, rk ~ N(0, σ2Σ), which allows reach random effect to vary by
its group. These terms are thought of as random variables rather than as parameters.
Therefore, they are similar in this respect to the errors (Fox, 2002). The last term in
the equation, εjik, is the error term for the score of person j on task i given by rater k.
The error terms are also assumed to be multivariately normally distributed, εjik ~ N(0,
σ2I). The error term, εjik, in the crossed random-effects model corresponds to the
three-way interaction, σ2(prt), in G theory.
Two-way and three-way interactions of persons, tasks, and raters can be used as
sources of random variation in the crossed random-effects model. For instance, the
interaction between tasks and raters (i.e. TxR) can be included in the model as a
random effect to explain the random variation in the scores due to this interaction. It
should also be noted that Equation 1 does not include any predictors (i.e. fixed
effects) in the model. As described earlier, a crossed random-effects model can
simultaneously estimate fixed effects and crossed random effects. Assuming there
are fixed effects to be estimated in the model, Equation 3 can be rewritten in a short
form as:
ijk jik jik jikY X Z b , (4)
where β includes all fixed-effect coefficients and b includes all random-effect
coefficients in the model. The design matrices for fixed and random effects are
represented by Xjik and Zjik, and εjik is the vector of residual error of the scores across
all facets.
In a crossed random-effects model, additional predictors that denote fixed
effects can be either continuous or categorical. If the predictor is categorical, one of its
categories becomes the reference group as a result of the dummy coding scheme. In
the context of performance assessments, the joint analysis of random and fixed
effects allows testing whether persons, tasks, raters, and the interactions of these
components contribute to scores independently. Furthermore, the impact of
predictors that are not expected to vary randomly (i.e. fixed effects) can be tested.
Models with different random and fixed effects can be compared based on log
likelihood and deviance statistics (Raudenbush & Bryk 2002, p. 60-61).
Interrater and Intrarater Reliability
As explained earlier, variances of random facets can be used to compute a
reliability coefficient that is the proportion of true score variation to the observed

Eurasian Journal of Educational Research 9
score variation. This type of reliability coefficient indicates the extent which a given
assessment measures persons’ true scores. Other reliability coefficients can also be
computed to examine how raters influence the variability in persons’ observed
scores. Depending on the design of the study, two types of reliability coefficient can
be used. These are inter-rater and intra-rater reliability coefficients. When multiple
raters grade students’ responses to the same task or different tasks, the correlation
between the scores assigned by the raters becomes an indicator of inter-rater
reliability (Brennan, 2003). The inter-rater reliability coefficient shows the consistency
of measurements across raters and the extent to which the raters are interchangeable
(Eliasziw, Young, Woodbury, & Fryday-Field, 1994). In a person x task x rater (i.e., p
x t x r) design, the inter-rater reliability coefficient for a single occasion is:
2 2
2
int 2 2 2 2
(p) (pt)
(p) (pt) (pr) (ptr)errater
.
(5)
When Equation 5 is reorganized using the notation in crossed random-effects
modeling (see Equation 3), it can be written as:
2
int
j ji
errater
j ji jk jik
p pt
p pt pr
.
(6)
Inter-rater reliability is useful for measurements that are carried out on a single
occasion. When raters grade items on multiple occasions, a rater’s consistency
(assigning the same or similar scores across occasions (om = 1,….., M) can be checked
by using an intra-rater reliability coefficient. For a single item in a person x rater x
occasion design, intra-rater reliability can be defined as:
2 2
2
int 2 2 2 2
(p) (pr)
(p) (pr) (po) (pro)rarater
.
(7)
Equation 7 can also be written again using random-effect components from the
crossed random-effects model as follows:
2
int
j jk
rarater
j jk jm jmk
p pr
p pr po
.
(8)
The intra-rater reliability coefficient can be computed for each item separately by
averaging the scores from each task over raters. As Brennan (2003) suggested,
additional complexities may arise when interpreting these reliability coefficients
because it may be difficult to determine whether a facet should be defined as random

10 Adnan Kan & Okan Bulut
or fixed in the study. Yet, they can still be very informative when researchers try to
assure that raters are functioning as expected.
Method
Research Design
The aim of this study is to examine the effects of teaching experience and rubric
use on teachers’ grading behaviors across different occasions in a performance
assessment. A performance task was given to the eighth-grade students, and their
responses were graded by 17 teachers with and without a rubric. A crossed random-
effects modeling approach was used to examine the individual contributions of
students, tasks, teachers, and the interactions of these components with the
variations in students’ scores. In addition, rubric use, teachers’ work experience, and
the duration between grading periods are used as fixed-effects in the model. Two
research questions addressed in this study are: 1) How does the rubric use influence
the scoring of performance assessments? 2) Is there any interaction between teachers’
work experience and their grading behaviors? The following sections describe the
sample, data collection procedure, and statistical techniques used for data analysis.
Participants and Data Collection
The participants of this study were 50 eighth-grade students and 17 math
teachers. The sample of teachers was chosen to represent a wide range of experience.
Years of experience as a teacher ranged from one year to 26 years in the sample.
Students, teachers, and performance tasks were fully crossed facets. All students in
the sample responded to the same questions in a performance assessment. The
responses of all the students were graded by each of the seventeen teachers.
The content of the performance assessment in this study was graphical
comprehension in mathematics. In the literature, researchers have focused on the
three sublevels of graph comprehension (Friel, Bright, & Curcio, 2001; Wainer, 1992).
These sublevels are translation, interpretation, and extrapolation/interpolation.
Translation represents a change in the form of a communication (Friel et al., 2001).
Translation occurs when one interprets a graph at a descriptive level and comments
on the structure of the graph (Jolliffe, 1991; Wood, 1968). Interpretation means
organizing the information in the graph and determining which information is more
important or necessary (Wood, 1968). Interpretation happens when one looks for
relationships among specifiers in a graph or between a specifier and a labeled axis
(Friel et al., 2001). Extrapolation/interpolation means understanding the data in a
graph and making inferences or conclusions. Extrapolation and interpolation occur
when one extrapolates or interpolates by perceiving trends shown in graphical data
or by specifying implications (Wood, 1968).
By using the three sublevels of graphical comprehension, a performance
assessment task was developed by the researchers along with the math teachers to
assess students’ graphical interpretation skills. The assessment consisted of four

Eurasian Journal of Educational Research 11
open-ended questions that measure the understanding and interpretation of
graphical representations of mathematical data. The first two questions included bar
charts, and the other two questions were based on line charts. The first bar and line
chart questions focused on the relationship between two facts for a single variable
(e.g. distance by time for a bike) whereas the charts in the second bar and line chart
items were about the relationship between two facts for two separate variables (e.g.
phone bills by month for home and cell phones). Figure 1 shows an example of these
items. All of the items required students to understand the graphical representation
and create a story based on their interpretation of the graph. Students’ graphical
interpretation skills were evaluated based on how they interpreted the data in the
graph, made conclusions, and related the information within a story.
After the students completed the performance assessment, each of the 17
teachers was asked to grade students’ responses to the four questions. All questions
carried an equal value in scoring. Each question was worth twenty-five points. The
teachers graded the questions on four occasions. First, the teachers were asked to
grade students’ responses based on their own scoring criteria without a scoring
rubric. Three weeks after the first grading occasion, the teachers graded the questions
again, but this time they were given an analytic rubric based on the performance
criteria determined for this assessment. An analytic rubric (see Appendix) was
preferred because extra details in the analytic rubric were anticipated to help
teachers to follow the same performance criteria.
Figure 1. Example questions with line graphs for a single variable (left) and two
separate variables (right) in the performance assessment.
To examine the effect of time on the consistency of raters' scores, the third
occasion took place ten weeks after the second occasion. As in the first occasion, the
teachers graded students’ responses without using a rubric. The last grading
occasion was three weeks after the third occasion. The teachers scored the questions
by using the same scoring rubric that they used on the second scoring occasion. To

12 Adnan Kan & Okan Bulut
prevent the teachers from remembering students’ responses from previous scoring
occasions, the order of the students’ answer sheets were scrambled, and different
identification numbers were assigned to the students for each occasion.
Data Analysis
The design of this study consisted of three random facets that were fully crossed
with each other. These facets were persons, tasks (i.e. questions), and raters (i.e.
teachers). In addition to these facets, occasion was another source of variation, which
was crossed with tasks and raters. The impact of these sources of variation on
students’ scores was examined using crossed random-effects models. All facets and
their interactions were treated as random effects in the models. In addition to the
random effects, there were two predictors that were used as fixed effects. These
predictors were teachers’ work experience and rubric use. Work experience (ranging
from 1 to 26) represents how many years a teacher has served in a school. This was
self-reported information provided by the participating teachers of the study. Rubric
use was a categorical variable. Occasions in which the teachers used a scoring rubric
were coded as one, and other occasions without rubric use were coded as zero.
Four crossed random-effects models were used to address the research questions
explained earlier. The first two models aimed to identify variations in the scores due
to the raters within occasions and across occasions. Model 1 was based on a p x t x r
design, which included random effects for persons, raters, tasks, and their two-way
interactions. Model 1 was run for each occasion separately, and the inter-rater
reliability coefficient was computed for each occasion by using Equation 6. Model 2
used a p x r x o design. It estimates random effects for persons, raters, occasions, and
their interactions. Model 2 was run for each task separately, and intra-rater reliability
coefficients were computed. When intra-rater reliability coefficients were computed,
the person x occasion interaction was not included because the same responses from
the students were graded by the raters across four occasions, and so there was no
interaction between students and occasions.
Model 3 was an overall model that treated all of the facets and their interactions
(i.e., persons, tasks, and occasions) as random effects. Because students’ responses to
the questions were fixed across occasions, the interaction between students and
occasions was not included in the model. The last model, Model 4, estimated fixed
effects for teachers’ work experience and rubric use in addition to all random effects
in Model 3. The purpose of this model was to estimate the effects of rubric use and
work experience on teachers’ grading behaviors after accounting for the effects of all
facets.
All of the models were estimated using the lme4 package (Bates, Maechler, &
Bolker, 2011) in R (R development core team, 2012). The lme4 package can estimate
mixed-effects models with a fast algorithm for parameter estimation (see Bates, 2005;
West, Welch, & Gałlechki, 2007). The lme4 package requires a long data format (i.e.
multiple rows for each person). The data structure is presented in Table 1.

Eurasian Journal of Educational Research 13
Table 1 Structure of the Facets in the Data.
Student Question Score Teacher Experience Occasion Rubric
1 1 15 1 5 1 0
1 2 25 1 5 1 0
1 3 20 1 5 1 0
1 4 15 1 5 1 0
1 1 10 1 5 2 1
1 2 11 1 5 2 1
1 3 8 1 5 2 1
1 4 11 1 5 2 1
1 1 20 1 5 3 0
1 2 20 1 5 3 0
1 3 20 1 5 3 0
1 4 20 1 5 3 0
1 1 13 1 5 4 1
1 2 12 1 5 4 1
1 3 9 1 5 4 1
1 4 11 1 5 4 1
Note: Only scores of student 1 given by teacher 1 is shown here.
Results
Table 2 shows that the p x t x r design (Model 1) estimated seven variance
components associated with persons, tasks, raters, person-by-task interaction,
person-by-rater interaction, task-by-rater interaction, and person-by-task-by-rater
interaction. The p x t x r design was estimated separately for each of the four scoring
occasions. In the first and third occasions, the largest variance component was
attributable to student-by-task-by-rater interaction and students, respectively. The
largest variance component was attributable to student-by-task interaction on the
second and fourth occasions, accounting for more than 25% of total score variance.
This was a desirable result because it indicates that most score variability was
explained by the differences in students’ graphical comprehension abilities rather
than the raters.
A slight difference was found between the occasions in terms of inter-rater
reliability estimates. Inter-rater reliability was fairly higher when the teachers were
given a scoring rubric for the second and fourth occasion. This means that the scores
assigned by the teachers exhibited better consistency when they were given a scoring
rubric. Also, the amount of total variance decreased by as much as 70% when a
scoring rubric was used for grading. The proportions of person-by-rater and rater-
by-task interactions to the total variance were almost the same across four occasions,
although the actual amount of these interactions was much smaller on the second
and last occasions. This suggests that measurement errors due to the rater facet were
reduced when a scoring guide was introduced to the raters.

14 Adnan Kan & Okan Bulut
Table 2 Estimated Random Effects and Inter-rater Reliability Coefficients in Model 1 Across Four
Occasions.
Facet Occasion 1 Occasion 2 Occasion 3 Occasion 4
b % b % b % b %
p 13.65 24 3.55 23 13.73 27 3.47 18
t 1.56 3 0.28 2 1.64 3 0.49 3
r 4.19 7 2.21 14 5.26 10 3.43 20
p x t 14.55 25 4.76 31 13.69 27 4.61 27
p x r 3.86 7 0.76 5 3.72 7 0.91 5
r x t 1.24 2 0.39 3 0.99 2 0.47 3
p x t x r 18.51 32 3.57 23 14.72 25 3.52 23 2
.56 .66 .59 .65
Note: p: person; t: question; r: rater. ρ2= Inter-rater reliability; b = estimated random effect; % = Percent of total variability.
Table 3 shows the results from the p x r x o design (Model 2), which estimated six
variance components. As explained earlier, this model was run for each question
separately to compute intra-rater reliability across four occasions. The results
indicated that the largest variance component was attributable to students in all four
questions. Person-by-rater-by-occasion interaction was the second largest source of
the variation within the questions. The highest variation (52%) in the scores due to
the students was observed in the last question (question 4). This question also
exhibited the highest intra-rater reliability. The rater effect was similar across the four
questions. This indicates that teachers’ severity or leniency in scoring followed a
similar pattern across the questions.
On the second and last occasions, where the teachers used a scoring rubric, the
mean scores for the questions became smaller (see Figure 2). This suggests that
teachers tend to score more severely when they use a rubric for scoring the
performance assessment items. In addition to the shrinkage in the mean scores, the
questions showed fewer scoring errors when the teachers used a scoring rubric on
the second and last occasions.

Eurasian Journal of Educational Research 15
Table 3 Estimated Random Effects and Intrarater Reliability Coefficients in Model 2 Across Four
Questions.
Facet Question 1 Question 2 Question 3 Question 4
b % b % b % b %
p 11.59 33 14.11 41 16.49 39 22.28 52
r 1.25 3 2.01 6 2.87 7 2.36 6
o 5.82 16 3.71 11 5.69 13 2.42 6
p x r 2.91 8 1.33 4 1.63 4 2.34 5
r x o 1.68 5 2.59 7 3.34 8 1.93 5
p x r x
o 12.34 35
10.84 31 12.55 29 11.14 26
2
.54 .59 .59 .69
Note: p: person; r: rater; o: occasion; ρ2= Intra-rater reliability; b = estimated random effect; % = Percent of total variability.
Table 4 contains the variance component estimates and percentages of total
variation for all facets and two-way interaction effects for Model 3 and 4. Model 3
was a p x t x r x o design that included ten variance components. It estimated random
effects for persons, raters, tasks, occasions, and their interactions. Among the ten
variance components, person and person-by-task effects were the highest. The
percentage of variation among the raters was high, indicating a questionable level of
intra-rater reliability. Variation among the raters was almost the same as the
variation due to the interaction between raters and occasions. This variation also
suggests considerable discrepancies between the raters.
Figure 2. Mean and confidence intervals of the questions across four occasions.

16 Adnan Kan & Okan Bulut
Table 4 Estimated Random and Fixed Effects for Model 3 and 4.
Effects Model 3 Model 4
b SE b SE
Random p 7.58 1.36 7.58 1.35
r 1.81 0.74 0.35 0.48
t 0.91 0.56 0.91 0.49
o 4.31 0.68 - -
p x r 1.17 0.76 1.17 0.76
p x t 8.54 1.39 8.54 1.39
r x t 0.29 0.41 0.29 0.41
r x o 1.96 0.78 1.91 0.62
r x t x o 0.58 0.54 0.54 0.54
p x r x t 0.88 0.85 0.88 0.85
Fixed Rubric use - - -3.63* 0.35
Experience - -
0.17* 0.03
(*) Significant at α = .01
Figure 3 shows estimated random effects and their confidence intervals for each
question and rater in Model 3. Question 4 seems to have a smaller random effect on
average than the other questions. Although random effects for most raters were
similar, there were a few raters (i.e., raters 2, 4, and 9) whose estimated random
effects were relatively higher than the rest. This suggests that the scoring of some of
the raters differed significantly even after all sources of potential variation were
taken into account.
The last model (Model 4) estimated two fixed effects in addition to the variance
components in Model 3. However, this model did not include occasion as a variance
component because a fixed effect for rubric use was estimated instead of a variance
component for four scoring occasions. As expected, the estimated variance
components in Model 4 were very similar to the ones from Model 3, except the rater
effect, which became smaller in Model 4. The results indicate that both rubric use and
teachers’ work experience are significant predictors of the variation in the scores. The
estimated fixed effect for rubric use was -3.63, meaning that teachers scored 3.63
points less across four items when they used a rubric for scoring the items. This
finding is also supported by the higher inter-rater reliability coefficients obtained
from the second and fourth occasions where the teachers used a scoring rubric. It
implies that teachers tend to score more severely and consistently when a scoring
guide is provided.

Eurasian Journal of Educational Research 17
Figure 3. Random effects and confidence interval for questions and raters in Model 3.
Teachers’ work experience was positively related to the way the teachers scored
the performance tasks. Results indicated that the teachers with more experience
assigned higher scores to the items than the teachers with less experience. The reason
for this finding might be that the more experienced teachers might not be following
the rubric in the same way that the teachers who have recently begun their careers
do. Because new teachers are supposed to be more familiar with the nature of
performance assessments, they may tend to score more strictly and consistently
when grading performance assessments with or without a scoring rubric. It should
be noted that although the difference in scores assigned by the experienced teachers
and teachers with less experience is obvious, this difference seems to diminish when
all of the teachers used a rubric for scoring the items on the performance assessment.
Discussion and Conclusion
This study utilized a random-effects modeling approach to examine whether
rubric use and teachers’ work experience influence teachers’ scoring behaviors in a
performance assessment, with particular attention paid to inter-rater and intra-rater
reliabilities and changes in raters’ scoring due to rubric use and teaching experience
between the occasions. A mathematics assessment that consisted of four questions
about graphical comprehension was administered to fifty eighth-grade students.
Seventeen mathematics teachers scored the students’ responses on four occasions.
During the first and third occasions, teachers graded the items without a scoring
guide, whereas on the second and last occasions, they scored the responses using a
scoring rubric.
The results of this empirical study support the necessity of using a scoring rubric
for grading performance assessments. During the first and third occasions, the lack of
a scoring guide caused the teachers to establish their own scoring criteria to assess
students’ performances. Therefore, as an indicator of inconsistency among the

18 Adnan Kan & Okan Bulut
teachers, the inter-rater reliability coefficient was fairly low. However, when the
teachers were given a scoring rubric on the second and last occasions, the consistency
among the scores given by the teachers increased. Although the percentage of rater
effects seemed to increase on the second and last occasions, the actual amount of
variation components for raters became smaller.
The consistency of the scores assigned by the teachers differed across the
questions. In the assessment, questions 1 and 3 were less complex compared to
questions 2 and 4. Although the same evaluation criteria were applied to the
questions, questions 1 and 3 could have been scored more consistently because these
graphical questions asked about the relationship between two variables based on a
single fact. Therefore, students’ responses to them were not expected to vary much.
Unlike these questions, questions 2 and 4 focused on the same type of relationship
based on two facts, and they were more difficult to interpret. However, intra-rater
reliability coefficients indicated that the teachers scored question 4 very consistently
but they assigned very different scores for question 1 across the four occasions. The
teachers took a lot of points off when they used the rubric to score question 1; they
scored the same question more leniently without the rubric. This suggests that the
complexity levels of tasks may also influence the way teachers interact with the
rubric.
Unlike Myford and Mislevy’s (1994) and Meyer’s (2000) findings, which
suggested that teaching experience only has a negligible effect on raters’ scoring
behaviors, this study indicated that teaching experience may have a considerable
effect on the way teachers approach performance assessments. Based upon the
results of this study, it appears that teachers who have more teaching experience
tend to score performance tasks more leniently than teachers who do not have long
years of teaching experience. Because this was an empirical study, it was not possible
to identify whether teaching experience had a positive or negative impact on
teachers’ scoring behaviors. The differences in the teachers’ scoring due to their
teaching experience became negligible when all teachers used a scoring rubric.
Providing training about the use of scoring rubrics to teachers may also help to
reduce the effect of teaching experience on teachers’ interaction with scoring rubrics.
As Schafer et al. (2001) noted, teachers’ understanding of rubrics may change based
on additional factors, such as the subject and item types in an assessment. Therefore,
in addition to teaching experience, the potential effects of other external factors
should also be considered to make the use of rubrics more effective in performance
assessments.
This study illustrated an alternative methodology to estimate variance
components and the effects of fixed factors within the same analysis. As with
generalizability theory models, crossed random-effects models can compute variance
components from crossed facets. At the same time, crossed random-effects models
are able to estimate fixed effects related to the facets or other components. A big
advantage of this modeling approach over generalizability theory is that it allows for
the separation of random and fixed effects from each other. In this study, the effects
of rubric use and teaching experience were estimated as fixed effects after all sources

Eurasian Journal of Educational Research 19
of variation were taken into account. This enabled the researchers to draw additional
conclusions about the direct effects of rubric use and teaching experience.
Although the findings of this study enrich the limited knowledge about the
effects of rubric use and teaching experience on teachers’ scoring behaviors, further
research is needed to understand the reasons why these factors are influential. Future
research that examines what factors influence teachers’ opinions about assigning
scores to performance tasks can provide more information about differences in the
scoring behaviors of teachers. Researchers should also explore the effects of different
types of rubrics, because this study only focused on the use of analytic rubrics for
scoring performance tasks. The interaction between teachers and scoring rubrics may
also differ based on the type of scoring rubrics.
References
Ang-Aw, H.T. & Goh, C.C. (2011). Understanding discrepancies in rater judgment on
national-level oral examination tasks. RELC Journal, 42(1), 31-51.
Baird, J., & Mac, Q. (1999). How should examiner adjustments be calculated? - A discussion
paper. AEB Research Report, RC13.
Bates, D. M. (2005). Fitting linear mixed models in R. R News, 5, 27–30.
Bates, D., Maechler, M., & Bolker, B. (2011). lme4: Linear mixed-effects models using S4
classes. R package version 0.999375-42. http://CRAN.R-
project.org/package=lme4.
Brennan, R. L. (2003). CASMA research report: Coefficients and indices in generalizability
theory (Research Report No. 1). Iowa City: The University of Iowa Center for
Advanced Studies in Measurement and Assessment.
Brennan, R. L. (2001). Generalizability theory. New York: Springer-Verlag.
Brennan, R. L. (2000). Performance assessments from the perspective of
generalizability theory. Applied Psychological Measurement, 24(4), 339-353.
Brualdi, A. (1998). Implementing Performance Assessment in the classroom. Practical
Assessment, Research & Evaluation, 6(2). Retrieved August 29, 2012, from
http://PAREonline.net/getvn.asp?v=6&n=2
Cohen, J. (1960). A coefficient of agreement for nominal scales. Educational and
Psychological Measurement, 20, 37-46.
Crocker, L., and Algina, J. (1986). Introduction to classical and modern test theory.
Harcourt Brace Jovanovich College Publishers: Philadelphia.
Darling-Hammond, L., & Snyder, J. (2000). Authentic assessment of teaching in
context. Teaching and Teacher Education, 16, 523–545.

20 Adnan Kan & Okan Bulut
Dochy, F., Gijbels, D., & Segers, M. (2006). Learning and the emerging new
assessment culture. In L. Verschaffel, F. Dochy, M. Boekaerts, & S. Vosniadou
(Eds.), Instructional psychology: Past, present, and future trends (pp. 191-206).
Oxford, Amsterdam: Elsevier.
Eckes, T. (2008). Rater types in writing performance assessments: A classification
approach to rater variability. Language Testing, 25, 155–185.
Eliasziw, M., Young, S. L., Woodbury, M.G., & Fryday-Field, K. (1994). Statistical
methodology for the concurrent assessment of interrater and intrarater
reliability: Using goniometric measurements as an example. Physical Therapy,
74, 777-788.
Farr, R., & Tone, B. (1998). Le portfolio, au service de l’apprentissage et de l’évaluation.
Montréal/Toronto: Chenelière/McGraw-Hill.
Fox, J. (2002). An R and S-PLUS companion to applied regression. Thousand Oaks, CA:
Sage.
Friel, S. N., Curcio, F., & Bright, G. W., (2001). Making sense of graphs: critical factors
influencing comprehension and instructional implications. Journal for Research
in mathematics Education, 32(2), 124-158.
Hadden, B. L. (1991). Teacher and nonteacher perceptions of second-language
communication. Language Learning 41(1): 1-20.
Hafner, J., & Hafner, P., (2003). Quantitative analysis of the rubric as an assessment
tool: An empirical study of student peer-group rating. International Journal of
Science Education, 25(12), 1509-1528.
Hamp-Lyons, L. (1991). Scoring procedures for ESL contexts. In L. Hamp-Lyons
(Ed.), Assessing second language writing in academic contexts (pp. 241-278).
Norwood, NJ: Ablex.
Jolliffe, F. R. (1991). Assessment of the understanding of statistical concepts. In D.
Vere-Jones (Ed.), Proceedings of the third international conference on teaching
statistics (Vol. 1, pp. 461–466). Voorburg, The Netherlands: International
Statistical Institute.
Kulm, G., & Malcolm, S. (1991). Science assessment in the service of reform. Washington,
D. C.: American Association for the Advancement of Science.
Lumley, T (1998). Perceptions of language-trained raters and occupational experts in
a test of occupational English language proficiency. English for Specific
Purposes,17(4), 347-67.
Messick, S. (1996). Validity of performance assessments. In G. Phillips (Ed.), Technical
issues in large-scale performance assessment (pp. 1–18). Washington, DC: National
Center for Education Statistics.
Meyer, L. (2000). Lingering doubt examiners: Results of pilot modeling analyses, summer
2000: AEB Research Report.

Eurasian Journal of Educational Research 21
Myford, C.M., & Mislevy, R. J. (1994) Monitoring and improving a portfolio assessment
system. Princeton, NJ: Educational Testing Service.
O'Neil, J. (1992). Putting performance assessment to the test. Educational Leadership,
49, 14-19.
Palm, T. (2008). Performance assessment and authentic assessment: A conceptual
analysis of the literature. Practical Assessment, Research & Evaluation, 13(4), 1-11.
Retrieved on September 29, 2012, from http://pareonline.net/pdf/v13n4.pdf
Pinheiro, J. C., & Bates, D. M. (2000). Mixed-effects models in S and S-PLUS. New York:
Springer.
Pinot de Moira, A. (2003). Examiner background and the effect on marking reliability.
AQA Research Report, RC218.
R Development Core Team (2012). R: A language and environment for statistical
computing. Vienna: R Foundation for Statistical Computing, http://www.R-
project.org.
Raudenbush, S. W., & Bryk, A. S. (2002). Hierarchical linear models: Applications and
data analysis methods. Newbury Park, CA: Sage Publications.
Royal-Dawson, L., & Baird, J. (2009). Is teaching experience necessary for reliable
scoring of extended English questions? Educational Measurement: Issues and
Practice, 28(2), 2-8.
Routman, R. (1991). Invitations. Portsmouth, NH: Heinemann.
Schafer, W., Swanson, G., Bene, N., & Newberry, G. (2001). Effects of teacher
knowledge of rubrics on student achievement in four content areas. Applied
Measurement in Education, 14(2), 151-170.
Shavelson, R. J., & Webb, N. M. (2005). Generalizability theory. In Green, J. L.,
Camilli, G. & Elmore, P. B. (Eds.), Complementary Methods for Research in
Education. (3rd ed.) Washington, DC: AERA.
Shavelson, R. J., & Webb, N. M. (1991). Generalizability theory: A primer. Newbury
Park, CA: Sage.
Shohamy, E., Gordon, C., & Kramer, R. (1992). The effect of raters’ background and
training on the reliability of direct writing tests. Modern Language Journal, 76, 1,
27-33.
Slater, T. F., & Ryan, J. M. (1993). Laboratory performance assessment. The Physics
Teacher, 31(5): 306-309.
Stemler, S. E. (2004). A comparison of consensus, consistency, and measurement
approaches to estimating interrater reliability. Practical Assessment, Research &
Evaluation, 9(4). Retrieved on September 11, 2012, from
http://PAREonline.net/getvn.asp?v=9&n=4

22 Adnan Kan & Okan Bulut
Stuhlmann, J., Daniel, C., Dellinger, A., Denny, R. K., & Powers, T. (1999). A
generalizability study of the effects of training on teachers’ abilities to rate
children’s writing using a rubric. Journal of Reading Psychology, 20, 107–127.
Wainer, H. (1992). Understanding graphs and tables. Educational Researcher, 21(1), 14–
23.
Ward, D. G. (1986). Factor indeterminacy in generalizability theory. Applied
Psychological Measurement, 10, 159-165.
Weigle, S. (1999). Investigating rater/prompt interactions in writing assessment:
Quantitative & qualitative approaches. Assessing Writing, 6(2), 145-178.
West, B. T., Welch, K. B., & Gallechki, A. T. (2007). Linear mixed models. A practical
guide using statistical software. Boca Raton: Chapman & Hall/CRC.
Wiener, R. B., & Cohen, J. H. (1997). Literacy portfolios: Using assessment to guide
instruction. New Jersey: Prentice Hall.
Wigglesworth, G. (1994). Patterns of rater behaviour in the assessment of an oral
interaction test. Australian Review of Applied Linguistics, 17(2), 77-103.
Wood, R. (1968). Objectives in the teaching of mathematics. Educational Research, 10,
83–98.
Çapraz Random Etki Modelleme: Rubrik kullanımı ve Öğretmen deneyiminin
Performans Değerleme üzerindeki Etkisinin İncelenmesi
Özet
Atıf:
Kan, A., & Bulut, O. (2014). Crossed random-effect modeling: examining the effects
of teacher experience and rubric use in performance assessments. Eurasian
Journal of Educational Research, 57, 1-28. doi: dx.doi.org/10.14689/ejer.2014.57.4
Problem Durumu
Performans değerleme öğrencinin belli bir konuda ne bildiğini ve ne yapabileceğini
belirlemek için alternative bir metot olarak görülmektedir. Performans değerlemenin
en önemli yetersizliklerinden biri puanlayıcıların puanlamaları arasındaki
tutarsızlıklar ve subjektifliktir. Performans değerlemelerin en çok kritik edildiği
noktaların başında subjektif puanlama prosedürleri gelmektedir. Performans
değerlemelerin etkililiği büyük oranda öğretmenlerin ve rubric puanlama
yönergelerinin kalitesi ve koordinasyonuna (etkileşimine) bağlıdır. Öğretmenler ve

Eurasian Journal of Educational Research 23
rubric puanlama yönergeleri arasındaki etkileşimi daha iyi anlayabilmek için
puanlama prosedürlerini etkileyebilecek potansiyel faktörler dikkatlice belirlenmeli
ve incelenmelidir. Bu faktörlerden birisi belki de en önemlisi öğretmenlerin mesleki
kıdem ve tecrübeleridir. Bu aşamada deneyimli öğretmenlerin öğretim ve
değerlemedeki deneyimlerinden dolayı öğrencilerin performansını daha objektif
değerlemeleri beklenebilir. Tabii ki bu az tecrübeye sahip öğretmenlerin tutarsız
puanlama yaptıkları anlamına gelmez. Öğretmen (özellikleri) performans
değerlemenin etkileşimini daha iyi anlayabilmek için tecrübe vb gibi öğretmenle
ilgili faktörleri ve performans değerleme yaparken öğretmen-rubrik puanlama
yönergesi etkileşiminin nasıl olduğunu incelemek hayati öneme sahiptir.
Araştırmanın Amacı
Bu araştırmanın biri pratik diğeri metodolojik olmak üzere iki amacı vardır. Bu
çalışma ile (1) performans değerlemede rubrik puanlama yönergesi kullanımı ve
öğretmen deneyiminin puanlama üzerindeki etkisini belirlemek ve (2) varyans
bileşenlerini kestirmek ve sabit (fixed) faktörlerin etkisini aynı analiz içinde
görebilmek için alternatif bir metodu (crossed random effect ve mixed modeler)
örnekleyerek tanıtmak amaçlanmıştır.
Metot
Araştırma Deseni
Bu çalışmanın amacı farklı durum ve koşullarda öğretmen deneyiminin ve rubric
kullanımının öğretmenlerin öğrenci performans değerlemeleri üzerindeki etkisini
incelemektir. Bu amaç doğrultusunda 8. Sınıf öğrencilerine bir performans görevi
verilmiş ve onların performansları 17 öğretmen tarafından rubric kullanarak ve
kullanmadan farklı zamanlarda puanlanmıştır. Toplanan veriler üzerinde öğrenci
görev ve öğretmenin ve faktörlerin etkileşimlerinin öğrenci puanlarındaki değişime
katkısının ne olduğunu belirlemek üzere Çapraz random etki modelleme yaklaşımı
kullanılmıştır. Buna ek olarak rubric kullanımı, deneyim ve değerlemeler arasındaki
zaman model içerisinde sabit etki olarak tanımlanmıştır.
Çalışma Grubu ve Verilerin Toplanması
Bu çalışma 50 adet 8. Sınıf öğrencisi ve sekizinci sınıfta derse giren 17 matematik
öğretmeni üzerinde yürütülmüştür. Öğretmenlere ait örneklem 1 ile 26 yıl arasında
değişen tecrübeye sahip öğretmenlerden oluşmaktadır. Öğretmen, öğrenci ve
performans görevi çapraz yüzeyler olarak tanımlanmıştır. Diğer bir deyişle
örnekleme giren tüm öğrenciler aynı sorulara cevap vermişler ve tüm öğrencilerden
elde edilen cevaplar 17 öğretmenin herbiri tarafından değerlenmiştir. Performans
değerlemenin kapsamını grafik yorumlama becerisi oluşturmaktadır. Grafik
yorumlama becerisi literature gore çevirme, yorumlama ve sonuç çıkarma (Friel,
Bright, & Curcio, 2001; Wainer, 1992) olmak üzere üç alt boyutta tanımlanarak bu
boyutlara gore öğrencilerin grafik yorumlama becerisini değerlemek üzere
matematik öğretmenleri ve ölçme ve değerlendirme uzmanı araştırmacılar
tarafından performans görevleri yapılandırılmışdır. Performans görevi sayısal
verilerin grafiksel gösterimini anlama ve ondan yorum çıkarmaya dönük olarak

24 Adnan Kan & Okan Bulut
tasarlanmış dört adet açık uçlu sorudan oluşturulmuştur. İlk iki soru bar grafiği
diğer iki soru ise çizgi grafiği üzerine kurgulanmıştır.
Öğrenciler performans görevini tamamladıktan sonra 17 öğretmenin her birinden
öğrencilerin dört soruya verdikleri cevapları birbirinden bağımsız bir biçimde
değerlemeleri istenmiştir. Soruların puan değerleri birbirine eşit ve herbir soru 25
puan değerindedir.Öğretmenler öğrenci cevaplarını 4 farklı zamanda ve durumda
değerlemişlerdir. İlk durumda öğretmenlerden öğrenci cevaplarını herhangi bir
puanlama anahtarı kullanmadan kendi kriterlerine göre puanlamaları istenmiştir. İlk
puanlamadan üç hafta sonra öğrencilerin cevapları aynı öğretmenler tarafından bu
sefer ekte sunulan rubrik puanlama yönergesi kullanılarak puananmıştır. Zamanın
puanlamalar üzerindeki etkisini görmek üzere bu işlem ilk iki okumadan 10 hafta
sonra tekrar edilmiştir. Öğretmenlerin bir önceki puanlamada herbir öğrenciye
verdiği puanı hatırlamasını önlemek için öğrenci cevapları her puanlama durumu
öncesinde karıştırılmış ve her öğrenciye her puanlamada farklı bir kod numarası
verilmiştir. Böylece öğretmenlerin tekrarlı puanlamaları üzerinde oluşabilecek olası
önceki puanlamaların etkisini ortadan kaldırmak amaçlanmıştır.
Verilerin Analizi
Bu çalışmanın deseni birey, görev ve puanlayıcı olmak üzere çapraz üç random
yüzeyden oluşmaktadır. Buna ek olarak görev ve puanlayıcılarla çaprazlanmış
durum yüzeyi de değişkenliğin diğer bir kaynağı olarak ele alınmıştır. Bu
değişkenlik kaynaklarının öğrenci puanları üzerindeki etkisi çapraz random etki
(crossed random effect) modeli ile incelenmiştir. Tüm yüzeyler ve etkileşimleri
model içerisinde random olarak ele alınmıştır. Random etkilerin yanında
öğretmenlerin rubric kullanımı ve deneyimleri gibi iki kestirici de sabit etki olarak
ele alınmıştır.
Araştırmanın Bulguları
Araştırma sonuçları, rubric puanlama yönergesinin kullanılmadığı durumlarda
öğretmenlerin kendi puanlama kriterlerini oluşturarak performans görevlerini
tutarsız bir şekilde puanladıklarını göstermiştir. Fakat öğretmenler iyi tanımlanmış
bir rubrik puanlama yönergesi kullandıklarında puanlayıcılar arası güvenirliğin
oldukça yükseldiği gözlenmiştir. Ayrıca tecrübeli öğretmenler ve tecrübesi az olan
öğretmenlerin farklı puanlama yaptıkları ve puanlamalarındaki katılık düzeylerinin
de farklı olduğu belirlenmiştir.
Araştırmanın Sonuç ve Önerileri
Bu araştırmanın sonuçlarına gore; (1) öğretmenlik tecrübesine sahip öğretmenlerin
tecrübesi az olan öğretmenlere göre performans görevlerini daha hoşgörülü
puanladıkları, (2) Öğretmenlerin deneyimlerine bağlı olarak oluşan puanlama
farklılıklarının öğretmenlerin tamamının rubric puanlama yönergesi kullanması
durumunda büyük ölçüde ortadan kalkarak önemini yitirdiği belirlenmiştir.
Bu çalışma ayrıca varyans bileşenlerini kestirmek ve sabit (fixed) faktörlerin etkisini
aynı analiz içinde görebilmek için alternative bir metodu da örnekleyerek

Eurasian Journal of Educational Research 25
tanıtmaktadır. Bu modelin Genellenebilirlik teorisine göre en büyük avantajı,
random ve sabit (fixed) etkilerin birbirinden ayrı ele alınmasına olanak vermesidir.
Öğretmen tecrübelerine ek olarak rubrik kullanımına ve performans
değerlendirmeye etki edebilecek diğer dışsal faktörlerinde gözönüne alınması ve
incelenmesi önerilebilir. Ayrıca bu çalışma öğretmen tecrübeleri ve rubric
kullanımının öğretmenlerin puanlamaları üzerindeki etkisine ilişkin olan sınırlı
bilgiyi zenginleştirmesine rağmen özellikle bu faktörlerin puanlama üzerinde neden
etkili olduğuna ilişkin yeni araştırmalara ihtiyaç vardır.

26 Adnan Kan & Okan Bulut
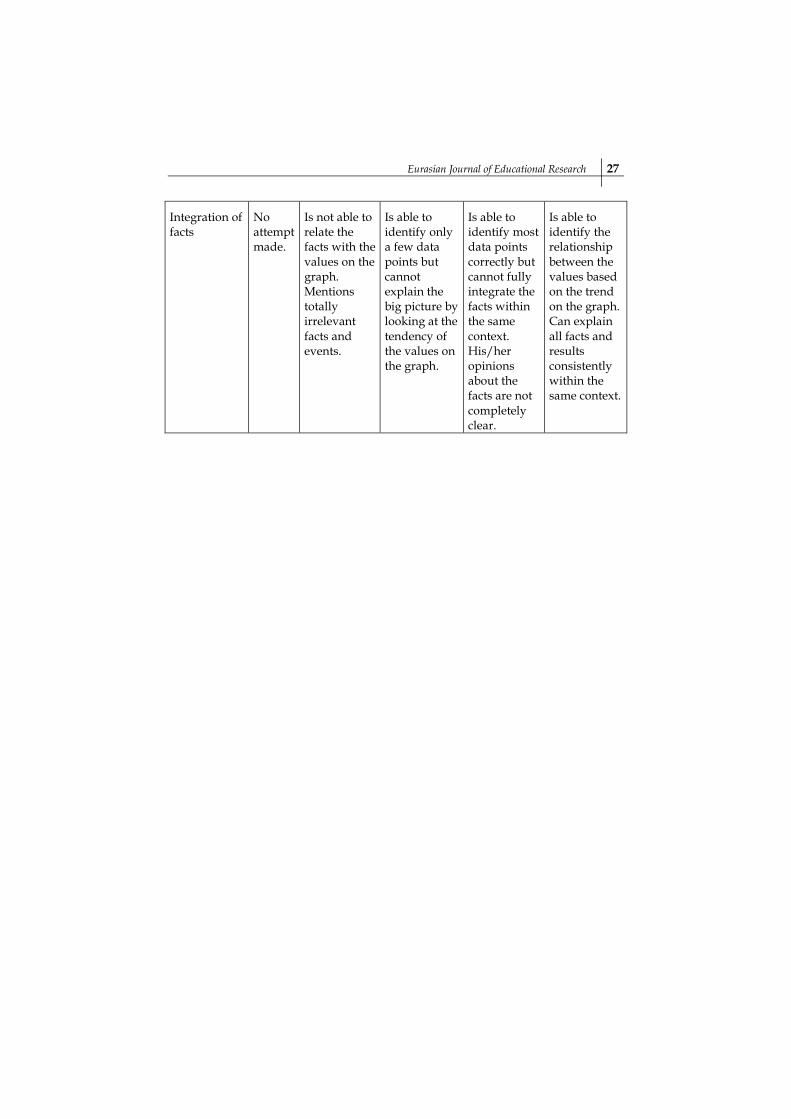
Appendix: Scoring Rubric of the Performance Assessment
Performance Levels
Performance Categories
0 1 2 3 4
Interpretation of axes
No attempt made.
Does not identify what each axis represents or mistakes the meaning of the axes.
Identifies only one of the axes. Either does not know the other axis or misinterprets it.
Identifies the meaning of each axis but sometimes confuses them.
Is able to identify what each axis represents, and interprets them without any mistake.
Interpretation of intersections
No attempt made.
Interprets the crossing point of x and y elements differently from the correct meaning of the graph.
Is able to identify only a few crossing points of x and y axes, and interprets them correctly.
Is able to identify most of the crossing points on the graph and interprets them correctly.
Is able to identify all crossing points of x and y axes, and interprets them correctly.
Comparisons No attempt made.
Does not make any comparison based on the values and intervals on the graph or makes incorrect comparisons that do not apply to the graph.
Does not make a detailed comparison of the values and intervals on the graph, and a few comparisons are made correctly.
Is able to make most of the comparisons based on the values correctly, and is aware of the relationship (e.g. increase vs. decrease, small vs. big) between two facts.
Is able to make detailed and meaningful comparisons of the values and intervals based on the graph, and can interpret the relationship between two facts (e.g. increase vs. decrease, small vs. big) correctly.
Eurasian Journal of Educational Research 27
Integration of facts
No attempt made.
Is not able to relate the facts with the values on the graph. Mentions totally irrelevant facts and events.
Is able to identify only a few data points but cannot explain the big picture by looking at the tendency of the values on the graph.
Is able to identify most data points correctly but cannot fully integrate the facts within the same context. His/her opinions about the facts are not completely clear.
Is able to identify the relationship between the values based on the trend on the graph. Can explain all facts and results consistently within the same context.