case study which investigates the role … study which investigates . the role environmental toxins...
TRANSCRIPT

1
Case Study Which Investigates the Role Environmental Toxins
Play in Flu Infection
Elizabeth A. Begy [email protected]
Geneseo High School 4050 Avon Rd
Geneseo, NY 14454
Funded by the American Association of Immunologists: John H. Wallace High School Teacher Summer Research Program
Mentored by
B. Paige Lawrence, Ph. D
Associate Professor of Environmental Medicine and Microbiology & Immunology University of Rochester School of Medicine
Jennifer Head, Ph.D Candidate
B. Paige Lawrence Lab University of Rochester School of Medicine

2
Table of Contents
Teacher Guide
I. Overview 3 II. Student Learning Objectives 4 III. State Standards 4 IV. Time Requirements 4 V. Materials and Equipment 5 VI. Science Background 5 VII. Student Prior Knowledge and Skills 7 VIII. Patient Profile Directions 7 IX. Normal Vital Statistics 7 X. Candy Cell Differential Directions 12 XI. Flow Cytometry Directions 12 XII. Environmental Brainstorm & Research Directions 13 XIII. Culminating Task Directions 13 XIV. References 14
Student Section
I. Rationale 15 II. Materials 15 III. Patient Profiles 16 IV. Candy Cell Differential Counts (Student Worksheet) 19 V. Lawrence Lab Cytospin Pictures (Patients A, B & C) 21 VI. A Guided Tour of Dioxins in the Environment (Student Worksheet) 24 VII. Lawrence Lab Flow Cytometry Data (Patients A, B & C) 30 VIII. Websites for Dioxin Research 33 IX. Culminating Task: Public Service Announcement 34

3
Teacher Guide I. Overview This is a high school unit investigating the role that environmental toxins play in flu infection. It is intended for Living Environment (General Biology) or students enrolled in a similar course. Students read scenarios involving patients in various stages of flu infection. Then, they complete candy cell differential counts in order to begin to understand the role different leukocytes play during infection. After analyzing cell differential data, students will work through a virtual example of how computers can be used to process the same data using flow cytometry. Students work in groups to brainstorm why some people get sicker with the flu than others and explore the role of TCDD, a dioxin, as an environmental toxin. Students also explore how it plays a role during flu infection in laboratory mice. Students research dioxin issues in the environment and their subsequent effects on the human population. In culmination, students write and perform a Public Service Announcement (PSA) regarding the immune response to the flu and the role that environmental toxins play in such infections. Part I: Basics of Flu Infection & Cell Differential Counts 1) Students read Patient Profiles for Patients A, B, & C. 2) Students complete Candy Cell Differential Counts and examine the differences between the patients. 3) Students analyze the cell differential data. 4) Look at real Lawrence Lab cytospin pictures to give students an idea of what scientists actually
observe when performing cell differential counts. 5) Brief class discussion of the types of leukocytes and their roles in clearing infection. 6) Prompt students to think of another way to count cells. (Hopefully, they discuss computers!) Part II: Flow Cytometry 1) Link to Oregon State University website which covers the basics of flow cytometry. 2) Students answer guiding questions for the activity. 3) Students view flow Lawrence Lab actual cytometry dot plots that roughly correspond with cytospin slides/cell differential counts. Part III: Environment & Flu Infection Research 1) Facilitated student brainstorm: Why would one person get sicker with the flu than others? 2) Tie in the mouse as a research model. 3) Introduce environmental toxins in the environment & how they play a role during flu infection in mice. Part IV: Relating to Humans *Students begin to explore what significance this research has for humans. Students use web links & other reliable internet sources for researching dioxin issues in the environment and their subsequent effects (both historical and present-day examples). Part V: Culminating Task *Students design and implement a Public Service Announcement (PSA) video regarding the immune response to infection and how pollutants in the environment affect the ability to fight flu infection.

4
II. Student Learning Objectives Students will:
• Be able to distinguish between main types of leukocytes & the role each plays during infection. • Complete cell differential counts & analyze the data. • Understand the basic idea & process behind flow cytometry. • Understand the role environmental toxins play in flu infection. • Research historical and present-day examples of dioxin pollution in the environment and the
resulting impact on humans. • Perform a Public Service Announcement to present their findings to the rest of the class.
III. State Standards The following New York State Curriculum Standards are addressed in this unit: PERFORMANCE INDICATOR 1.2 Hone ideas through reasoning, library research, and discussion with others. PERFORMANCE INDICATOR 5.2 Explain disease as a failure of homeostasis. STANDARD 5.2a Homeostasis in an organism is constantly threatened. Failure to respond effectively can result in disease or death. STANDARD 5.2c The immune system protects against antigens associated with pathogenic organisms or foreign substances and some cancer cells. STANDARD 5.2d Some white blood cells engulf invaders. Others produce antibodies that attack them or mark them for killing. Some specialized white blood cells will remain, able to fight off subsequent invaders of the same kind. STANDARD 5.2h Disease may also be caused by inheritance, toxic substances, poor nutrition, organ malfunction, and some personal behavior. Some effects show up right away; others may not show up for many years. STANDARD 5.2j Biological research generates knowledge used to design ways of diagnosing, preventing, treating, controlling, or curing diseases of plants and animals. IV. Time Requirements Total time for the unit is approximately 5 class periods that are each 45 minutes in length, not including time students would need outside of class to complete the Public Service Announcement (PSA). Reviewing the Patient Profiles and completing the Candy Cell Differential Counts would take 45 minutes. Completing the flow cytometry website walk-through and analyzing actual data would take an additional 45 minutes. A facilitated brainstorm and brief lecture about the impact that environmental dioxin pollutants have on the immune system would take 45 minutes. Student research about historical and present-day dioxin pollutants in the environment and the subsequent human impact would take 45 minutes. Student presentations of their PSA would take approximately 45 minutes, depending on the number of total students in the class and the number of groups participating.

5
V. Materials and Equipment
• Manipulative with 3 different variants (e.g. candy in 3 different colors; 3 bags of jellybeans would suffice for a class of 20 students)
• Internet access VI. Science Background Students will often want to know, “Why are we studying this? How does it relate to my real life?” Why are we looking at pollutants & influenza? As published in a paper by Teske, Bohn, Regal, Neumiller, and Lawrence, morbidity (the proportion of sickness or of a specific disease in a geographical locality) and mortality
(the relative frequency of deaths in a specific population) from respiratory pathogens have not declined in the past 20 years, while the incidence of chronic inflammatory lung diseases has increased, despite advances in health care.
According to the World Health Organization, respiratory diseases are among the top 10 leading causes of illness & death. Although it is not clear why certain individuals are more susceptible to chronic inflammatory diseases of the lung, one causal factor is infectious disease. Defects in the ability to fight respiratory infections correlate with enhanced incidence and severity of chronic inflammatory disorders of the lower respiratory tract. Among lower respiratory tract infections, the influenza virus constitutes one of the major factors in this morbidity and mortality. Increasing evidence is showing that exposure to pollutants increases inflammatory responses in the lung. How do the pollutants gain access to the lungs? The Aryl hydrocarbon receptor (AhR) is an “orphan” receptor and transcription factor that is widely expressed in mammalian tissue, including the lung and cells of the immune system. There is no known endogenous ligand for AhR, though human exposure to a variety of AhR ligands occurs daily through ingestion and inhalation of environmental contaminants such as cigarette smoke, diesel exhaust, some plant-derived natural compounds, and tryptophan metabolites. One AhR ligand of particular interest is the dioxin pollutant TCDD. What are dioxins? 2,3,7,8-tetrachlorodibenzo-p-dioxin is a dioxin pollutant which has high affinity and specificity to the AhR. Most human exposure to TCDD comes through the food chain, specifically through the consumption of fish, meat, and dairy products since dioxins are fat-soluble and readily climb the food chain (biomagnification/bioaccumulation as you move up the food chain). Today, concentrations of dioxins are found in all humans, with higher levels commonly found in persons living in more industrialized countries.

6
TCDD became well known as a contaminant of Agent Orange, an herbicide used in the Vietnam War; and later, dioxins were found in the Love Canal, New York. Dioxins are produced in small concentrations when organic material is burned in the presence of chlorine, whether the chlorine is present as chloride ions or as organochlorine compounds, so they are widely produced in many contexts. According to the most recent US EPA data, the major sources of dioxins are: * Coal fired utilities * Municipal and medical waste incinerators * Metal smelting * Diesel trucks *These sources together account * Land application of sewage sludge for nearly 80% of dioxin emissions * Burning treated wood * Trash burn barrels Exposure to high levels of dioxins in humans causes a severe form of persistent acne, known as chloracne. High levels of exposures to dioxins have been shown by epidemiological studies to lead to an increased risk of tumors at all sites. Other effects in humans may include: developmental abnormalities in the enamel of children's teeth, central and peripheral nervous system pathology, thyroid disorders, damage to the immune systems, endometriosis, and diabetes. Most importantly for our purposes, exposure to TCDD enhances inflammatory responses, and is consistently characterized by an increase in the number of neutrophils at the site of antigen challenge. Exposure to TCDD alters the immunoregulatory balance in the lung so that upon infection, adaptive response are suppressed and inflammatory responses are enhanced. Which leukocytes are the main players in this saga? Neutrophils aid in the resolution of infection, yet excessive neutrophil recruitment generally has adverse effects. This is affectionately and informally referred to as the Goldilocks Principle, where “too much of a good thing is a bad thing.” The immune system needs the number of neutrophils to be “just right.” Neutrophils are made by hematopoietic cells in the bone marrow and are then recruited in “waves” to the lung during the innate immune response to flu infection in order to fight the infection. When the 1st wave of neutrophils reaches the lungs, they release their cytotoxic molecules and then turn on a cell-death pathway and begin apoptosis because their job is done. As soon as the 1st wave begins apoptosis, the 2nd wave of neutrophils is recruited from the bone marrow and begins to arrive in the lungs. It is well-documented how neutrophils combat bacterial infection, but it is not well known exactly how neutrophils play a role in viral infection. Scientists know that neutrophil recruitment increases during viral infection, but do not know exactly why. What are some of the ways scientists study neutrophil recruitment? Scientists use a variety of methods to figure out the number of immune cells, including cytospin slides paired with cell differential counts, and flow cytometry.

7
Cytospin slides consist of actual stained cells from the tissue of an organism. (In the case of flu infection, the cells come from the lungs, which would not be possible to obtain when working with human patients; however, nasal swabs or sputum samples provide a window to view what is happening in human lungs.) The cell differential counts involve using a microscope to visually count by hand the number of each immune cell of interest. Flow cytometry utilizes computer software and staining techniques to label and count a specific population of cells. Cell differential counts and flow cytometry are used in conjunction with one another for the most accurate data. Again, how does this relate to “real” life? Discovering how AhR-activation by dioxin affects cells regarding neutrophil recruitment will reveal critical targets that control the balance point between too much and not enough inflammation during viral infection. Identification of molecular targets of environmental toxins, such as TCDD, has already revealed novel pathways for potential new drugs and therapeutic strategies to modify host responses to antigen challenge. Since many of the same immunoregulatory pathways are activated in response to other types of antigens, it is quite likely that figuring out the mechanisms of AhR-mediated immune modulation in the context of responses to viruses will stimulate new therapies to aid in the treatment of disease. VII. Student Prior Knowledge and Skills Students should already be familiar with the immune system and understand the basic idea behind innate vs. adaptive immunity. They should know that there are different white blood cells (leukocytes) involved in the immune response. VIII. Patient Profile Directions Students should broken into groups of 2-3 students and then given copies of the profiles for Patients A, B, and C. Students should go in to the activity without knowing exactly what is going on and what is expected of them so that they can play the role of investigator. After looking at the Patient Profiles and comparing with the normal vital statistics, as well as reading the information about Chediak-Higashi syndrome, ask students to come up with an initial diagnosis for each patient. IX. Normal Vital Statistics
• Arterial Blood Gases • Pulse • Blood Pressure • Chediak-Higashi syndrome information

8
Arterial Blood Gases(adapted from www.webmd.com)
Results An arterial blood gas (ABG) test measures the acidity (pH) and levels of oxygen and carbon dioxide in the blood.
Normal Normal values may vary from lab to lab and depend upon the elevation above sea level. Results are usually available right away.
Arterial blood gases (at sea level and breathing room air)
Partial pressure of oxygen (PaO2): 75–100 mm Hg
Partial pressure of carbon dioxide (PaCO2):
(9.9–13.2 kPa)
35–45 mm Hg (4.6–5.9 kPa)
pH: 7.35–7.45
Bicarbonate (HCO3): 20–29 mEq/L (20–29 mmol/L)
Oxygen content (O2CT): 15–22 mL per 100 mL of blood (6.6–9.7 mmol/L)
Oxygen saturation (O2Sat): 95%–100% (0.95–1.00)

9
Pulse(adapted from www.webmd.com)
Results Your pulse is the rate at which your heart beats. Your pulse is usually called your heart rate, which is the number of times your heart beats each minute (bpm).
Normal resting heart rate The chart below shows the normal range of a resting heart rate (pulse rate after resting 10 minutes) in beats per minute, according to age. Many things can cause changes in your normal heart rate, including your age, activity level, and the time of day.
Resting heart rate Age or fitness level Beats per minute (bpm)
Babies to age 1: 100–160
Children ages 1 to 10: 60–140
Children ages 11 to 17: 60–100
Adults: 60–100
Well-conditioned athletes: 40–60

10
Blood Pressure (adapted from www.webmd.com)
What Is "Normal" Blood Pressure? There are several categories of blood pressure, including:
1. Normal: Less than 120/80 2. Prehypertension: 120-139/80-89 3. Stage 1 high blood pressure: 140-159/90-99 4. Stage 2 high blood pressure: 160 and above/100 and above
What Causes High Blood Pressure? The exact causes of high blood pressure are not known. Several factors and conditions may play a role in its development, including:
• Smoking • Being overweight or obese • Lack of physical activity • Too much salt in the diet • Too much alcohol consumption (more than 1 to 2 drinks per day) • Stress • Older age • Genetics • Family history of high blood pressure • Chronic kidney disease • Adrenal and thyroid disorders
Essential Hypertension In as many as 95% of reported high blood pressure cases in the United States, the underlying cause cannot be determined. This type of high blood pressure is called essential hypertension.
Though essential hypertension remains somewhat mysterious, it has been linked to certain risk factors. High blood pressure tends to run in families and is more likely to affect men than women. Age and race also play a role. In the United States, blacks are twice as likely as whites to have high blood pressure, although the gap begins to narrow around age 44. After age 65, black women have the highest incidence of high blood pressure.
Essential hypertension is also greatly influenced by diet and lifestyle. The link between salt and high blood pressure is especially compelling. People living on the northern islands of Japan eat more salt per capita than anyone else in the world and have the highest incidence of essential hypertension. By contrast, people who add no salt to their food show virtually no traces of essential hypertension.
Other factors that have been associated with essential hypertension include obesity; diabetes; stress; insufficient intake of potassium, calcium, and magnesium; lack of physical activity; and chronic alcohol consumption.

11
Chédiak-Higashi Syndrome (adapted from www.emedicine.medscape.com)
Background Chédiak-Higashi syndrome (CHS) was described by Beguez Cesar in 1943, Steinbrinck in 1948, Chédiak in 1952, and Higashi in 1954. Chédiak-Higashi syndrome is a rare childhood autosomal recessive disorder that affects multiple systems of the body. Patients with CHS exhibit hypopigmentation of the skin, eyes, and hair; prolonged bleeding times; easy bruisability; recurrent infections; abnormal natural killer cell function; and peripheral neuropathy. Morbidity results from patients succumbing to frequent bacterial infections or to an accelerated-phase lymphoproliferation into the major organs of the body. Most patients who do not undergo bone marrow transplantation die of a lymphoproliferative syndrome, although some patients with CHS have a relatively milder clinical course of the disease.
Pathophysiology CHS is an autosomal recessive immunodeficiency disorder characterized by abnormal intracellular protein transport. The CHS gene was characterized in 1996 as the LYST or CHS1 gene and is localized to bands 1q42-43. The CHS protein is expressed in the cytoplasm of cells of a variety of tissues and may represent an abnormality of organellar protein trafficking.
The CHS gene affects the synthesis and/or maintenance of storage/secretory granules in various types of cells. Lysosomes of leukocytes and fibroblasts, dense bodies of platelets, azurophilic granules of neutrophils, and melanosomes of melanocytes are generally larger in size and irregular in morphology, indicating that a common pathway in the synthesis of organelles responsible for storage is affected in patients with CHS. In the early stages of neutrophil maturation, normal azurophil granules fuse to form megagranules, whereas, in the later stage (ie, during myelocyte stage), normal granules are formed. The mature neutrophils contain both populations. A similar phenomenon occurs in monocytes. The impaired function in the polymorphonuclear leukocytes may be related to abnormal microtubular assembly.
Most patients also undergo an accelerated phase or accelerated reaction, which is a nonmalignant lymphohistiocytic lymphomalike infiltration of multiple organs that occurs in more than 80% of patients. This lymphomalike stage is precipitated by viruses, particularly by infection by the Epstein-Barr virus. It is associated with anemia, bleeding episodes, and overwhelming infections leading to death. Infections most commonly involve the skin, the lungs, and the respiratory tract and are usually due to Staphylococcus aureus, Streptococcus pyogenes, and Pneumococcus species.
Frequency
United States Chédiak-Higashi syndrome is rare.
International Chédiak-Higashi syndrome is rare.

12
X. Candy Cell Differential Count Directions 1) Use candy! (M&Ms, Skittles, Runts with different shapes, jellybeans- the mottled ones can look like neutrophils) 2) Lymphocytes should be the darkest color. (Representative of the fact that they have almost no cytoplasm visible.) 3) Lay the candy in a small snack-size ziploc snack bag so that the candy covers the bottom of the bag completely (each bag can represent a “microscope slide”) *Relative # of pieces of candy for each type
Patient A Patient B Patient C # Macrophages 18 - 20 18 – 20 14 - 16 # Neutrophils 18 - 20 8 – 10 2 or 3
# Lymphocytes 8 – 10 8 – 10 8 – 10 4) Vary the # of macrophages & lymphocytes slightly in each bag above, just so they're not exactly the same for each patient. This way, students will see the importance of using a large sample size when analyzing data. Students can see variation and human error in the counting between groups. 5) Students can graph results on paper (Use Excel if available). 6) Once students have completed the cell differential counts, analyzed the class averages, and answered the questions, show the real Lawrence Lab cytospin pictures to students so they have an idea of what scientists look at when actually performing cell differential counts.
7) Have a brief discussion to review the types of leukocytes and their roles in clearing infection. -Analogy can come in and take care of the situation
: neutrophils (“light infantry”) keep the viral load low until lymphocytes (“tanks”)
8) Prompt students to think of another way to count cells. Get them to think about the fact that they would have to use microscopes to count cell differentials by hand for many samples. (Hopefully, they discuss computers!) This moves them towards… Flow Cytometry
!
XI. Flow Cytometry Directions 1) Link to Oregon State University website that walks through basics of flow cytometry. http://www.unsolvedmysteries.oregonstate.edu/flow_01 2) Students answer guiding questions
for the activity.
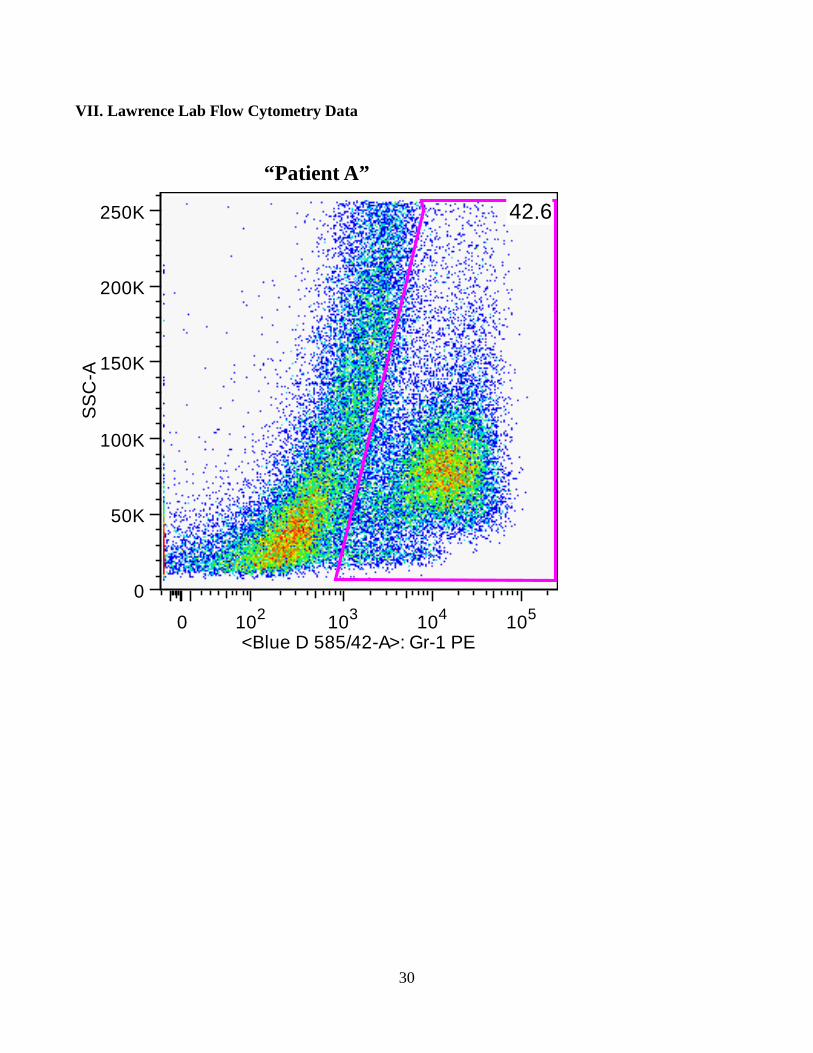
3) Students view flow Lawrence Lab actual cytometry dot plots that roughly correspond with cytospin/cell differential slides.

13
XII. Flu Infection & Environment Research Directions 1) Facilitated student brainstorm: Why would one person get sicker with the flu than others? *Hopefully someone comes up with the environment
; if not, may need to lead them in that direction.
2) Tie in the mouse as a research model. Although we can't get lung tissues from live humans in order to study how cells are affected during flu infection, mice have relatively close immune system to humans, they are cost-effective to maintain, etc. (If time: www.toxicology.org “Importance of Animals in Toxicology”) 3) Now can introduce TCDD (dioxins and environmental toxins in the environment) & how TCDD plays a role during flu infection in mice. *Talk about the Goldilocks Principle; need to have amount of neutrophils that is “just right”, or you will have problems! 4) Relate this knowledge back to the Patient Profiles: Patient A
: smoker, greater exposure to dioxins = increased neutrophil recruitment to the lung = more severe presentation of flu symptoms
Patient B
: relatively healthy, less exposure to dioxins = “just right” number of neutrophils during flu infection = less severe flu symptoms
Patient C
: Chediak-Higashi syndrome already impacts number of immune cells = too few neutrophils in the lung during flu infection = more severe presentation of flu symptoms, which are comparable to Patient A
*Students begin to explore what significance this research has for humans 5) Students use web links & other reliable sources for researching dioxin issues in the environment & their subsequent effects
• Historical•
: the Love Canal incident, Agent Orange used in Vietnam, 1918 flu pandemic, etc. Present
: “e-waste”; waste incineration/burn barrels in yards; industry/smoke stacks; pesticide production & degradation; PCBs
XIII. Culminating Task 1) Direct students within their groups to design and implement a Public Service Announcement (PSA) video regarding the immune response to infection and how pollutants in the environment affect the ability to fight infection.
2) Students can use Windows Movie Maker or any similar program in order to put the PSA together. Alternatively, students could use Picasa or a Glog format to present their information.

14
XIV. References Campbell, Neil A. and Jane B. Reece (2008). Biology AP Edition. 8th Ed. Pearson.
Gibbs, Lois M. (1995) Dying From Dioxin. South End Press.
Institute of Medicine of the National Academies. (2003) Dioxins and Dioxin-like Compounds in the Food Supply: Strategies to Decrease Exposure. The National Academies Press. Murphy, K.M., Travers, P., and M. Walport. (2007) Janeway’s Immunology. 7th Ed.
Teske, S. et al., Activation of the aryl hydrocarbon receptor increases pulmonary neutrophilia and diminishes host resistance to influenza A virus. Am J Phusiol Lung cell Mol Physiol. 2005. 289: p. 111-124.
http://www.unsolvedmysteries.oregonstate.edu/flow_01
www.toxicology.org
www.niehs.nih.gov
www.cdc.gov
www.mayoclinic.com www.webmd.com
www.emedicine.medscape.com

15
Student Guide
I. Rationale Today you will pretend that you are a doctor examining Patients A, B, and C. Your task will be to come up with an initial diagnosis for your patients, and then use further data about each patient in order to narrow your diagnosis. You will learn different techniques for counting numbers of certain cell types, and eventually you will be asked to complete research and develop a public service announcement (PSA) about a particular topic.
You should already be familiar with your body’s immune system. If a virus, bacteria, fungi or protist makes it past the broad barrier system of your skin or mucus membranes, then the internal innate portion of the immune system takes over. This general defense of “patrolling soldiers” ensures a rapid response of cells and proteins that attack invaders that penetrate the body’s outer barriers. Major players in the internal innate immune system include the inflammatory response, antimicrobial proteins, natural killer cells, and phagocytic cells.
Introduction
Phagocytic white blood cells recognize pathogens by using Toll-like receptors (TLR), which recognize fragments of molecules that are characteristic of a set of pathogens. Recognition by a TLR triggers a series of internal defenses, beginning with phagocytosis. A white blood cell recognizes and engulfs invading microbes, trapping them in a vacuole. The vacuole then fuses with a lysosome, leading to the destruction of the microbe in two different ways. First, nitric oxide and other gases produced in the lysosome poison the engulfed microbes. Second, lysosozyme and other enzymes degrade microbial components.
Neutrophils, a type of leukocyte, are the most abundant type of phagocytic cells in the mammalian body. Infected tissues send off signals, which attract the neutrophils to come in to engulf and destroy microbes. Macrophages, another type of phagocytic leukocyte, either migrate throughout the body or reside permanently in various organs and tissues. Other types of leukocytes include lymphocytes, basophils, and eosinophils.
II. Materials -Computer with Internet access
-Patient A, B & C Profiles
-Normal Vital Statistics
-Candy Cell Differential “slides”
-Candy Cell Differential (student worksheet)
-A Guided Tour of Dioxins in the Environment (student worksheet)
-Public Service Announcement directions

16
III. Patient Profiles
Patient A
Patient HistoryMitchell D. is a 25 year old African-American male. He works full time for a marketing firm in Birmingham, Alabama. He exercises at the gym 2-3 times per week, and plays in a slow-pitch softball league during the summer. He has been a smoker since age 15, and currently smokes approximately a pack of cigarettes per day. He had his gall bladder removed in 2005.
:
Current Vitals
:
Body Temperature: 1040 F Blood Pressure: 80/60 O2 Saturation: 86% Pulse: 106 beats per minute SymptomsMitchell presents with a sore throat, headache, myalgia (non-specific muscle aches in his arms, legs, and back), a nonproductive cough, and rhinorrhea. Additionally, he has a feeling of pressure behind his eyes and sensitivity to light, as well as a burning sensation in his chest. He has not had much of an appetite, but when he has eaten it resulted in indigestion.
:

17
Patient B
Patient HistoryPaige L. is a 27 year old Caucasian female. She is a high school Spanish teacher in Austin, Texas.
:
She runs regularly, having completed two marathons in the past three years. She has adhered to a vegan diet for the past five years. Her only regular medication is an oral contraceptive. Paige traveled to Argentina 2 months ago. Current Vitals
:
Body Temperature: 1000 F Blood Pressure: 118/76 O2 Saturation: 98% Pulse: 70 beats per minute SymptomsPaige presents with a headache, a nonproductive cough, and slight muscle aches in her arms and legs. (Note: She completed a 16 mile training run less than 48 hours ago.) She has a slight sore throat, as well as rhinorrhea.
:

18
Patient C
Patient HistoryJen H. is an 18 year old female of Latino descent. She is a Biology major at the University of Rochester. She rides her bike to school every day, weather-permitting. She has Chediak-Higashi syndrome. She currently takes Colchicine as an anti-inflammatory agent to decrease leukocyte motility and phagocytosis in inflammatory responses that result from her syndrome.
:
Current Vitals
:
Body Temperature: 1020 F Blood Pressure: 125/82 O2 Saturation: 92% Pulse: 95 beats per minute SymptomsJen presents with a headache, a nonproductive cough, and slight muscle aches in her arms, legs, neck and lower back. She has a slight sore throat, as well as rhinorrhea. She has been complaining of an uncomfortable pressure behind both eyes.
:

19
IV. Candy Cell Differential Counts Objective: Students will learn how to perform a differential count and use the results to help diagnose patients' illnesses. Background: A nasal wash was performed on Patients A, B and C. Cells from each patient's nasal wash were put on a microscope slide and sent to the lab for analysis. Cells were stained with a dye called hematoxylin and eosins. Note
: Each group in class will have a different “slide” that is representative of one field-of-view from that particular patient's blood smear slide.
White blood cells (leukocytes) can be divided into granulocytes and agranulocytes, and then further divided into 5 subgroups. For our purposes, we will focus on the types of leukocytes below:
Visible cytoplasm; highly variable shapes. Macrophages
“Macrophage” Color: _____________________
Small, round cells. Almost no cytoplasm visible. Lymphocytes
“Lymphocyte” Color: ____________________
Polymorphonuclear (Nucleus has crazy, multilobular shape.) Neutrophils
“Neutrophil” Color: ____________________ Procedure:
• Obtain the “slides” for Patients A, B, & C from your instructor. • Fill in the corresponding color for each “leukocyte” on the proper line above. • Count the number of each “leukocyte” type for Patients A, B, & C, and record your results
below in Table 1. • Use your data from Table 1 in order to calculate the percentage of each type of leukocyte for
Patients A, B, & C in Table 2. • Compile data from Table 2 for the entire class and record the results in Table 3.
Table 1: Number of Leukocytes
Patient A Patient B Patient C # Macrophages # Neutrophils
# Lymphocytes # Total Cells

20
Table 2: Percentage of Each Leukocyte Type Patient A Patient B Patient C
% Macrophages % Neutrophils
% Lymphocytes Table 3: Percentage of Each Leukocyte Type (Class averages)
Patient A Patient B Patient C % Macrophages % Neutrophils
% Lymphocytes Cell Differential Initial Conclusions:
5. Which do you think is a more accurate way to analyze the data: by looking at the number of each type of leukocyte or by looking at the percentage of each type of leukocyte? Why?
6. Why is it important to find the class averages for the data?
7. Overall, what did you notice about the percentage of each type of leukocyte (macrophages vs. nuetrophils vs. lymphocytes) on the slides?
8. Were there any noticeable differences in the percentages of the types of leukocytes? If yes, what do you think this might indicate about the patient's health?

21
V. Lawrence Lab Data (Actual Cytospin picture for “Patient A”)

22
Lawrence Lab Data (Actual Cytospin picture for “Patient B”)

23
Lawrence Lab Data (Actual Cytospin picture for “Patient C”)

24
VI. A Guided Tour of Dioxins in the Environment and an Overview of Flow Cytometry
Adapted from Oregon State University's
Unsolved Mysteries of Human Health: How Scientists Study Toxic Chemicals and Health
Dioxins & Flow Cytometry
Directions: -Go to the site: http://www.unsolvedmysteries.oregonstate.edu/flow_01 (Courtesy of Nancy Kerkvliet & the Environmental Health Sciences Center at Oregon State University) -Begin on the page entitled Going With the Flow. Read through each page, answering questions about that particular section as you read. -When you are finished with a page, click the “Next” button at the bottom of the page. Each new page and section are indicated in bold. -Use the following guiding questions to navigate through this exercise. Going With the Flow What does the game warden tell Joe about how the dioxins contaminated the river and the fish? What is Dioxin?
• What 4 elements make up dioxin molecules?
• What determines the toxicity of different dioxins?
• Write out the full name of TCDD and draw its structure below: What are the major sources of dioxin?
9. What is a natural source of dioxin in the environment?
10. The primary sources of dioxin in the environment are man-made. List examples here:

25
11. Are there still major sources of dioxins in the United States? Why or why not?
12. What are examples of activities that continue to contribute to the release of low levels of dioxins into the environment?
How would I most likely be exposed to dioxin?
• How would YOU most likely be exposed to dioxin? The Immune System and Foreign Invaders
10) What are the main functions of red blood cell (erythrocytes), platelets, and white blood cells (leukocytes)?
11) What are the three main groups of leukocytes, and what are their functions?
12) How does your immune system know which cells to attack and which cells are part of your own body?
Not an invincible defense...
13) What is an example of one virus and one genetic disease that can each “outwit” your immune system?
14) What is an immunotoxicant, and how can it affect your immune system?

26
What can you use to study damage to the immune system?
15) What is flow cytometry?
16) What do scientists “measure” about each type of immune system cell?
17) What advantage does using a flow cytometer have over counting cells on a microscope? But what exactly does the flow cytometer do?
18) Summarize the three components of what the flow cytometer can do. In the Lab As you learned, one of the jobs of the immune system is to destroy any mutated cells which can develop into tumor cells. To understand how dioxin affects this part of the immune system, mice were injected with mouse tumor cells, and some mice were exposed to dioxin just before they were injected with tumor cells. In this experiment, you will be investigating the effect of one specific dioxin, TCDD , which will be referred to as “dioxin.”
19) In this experiment you will be using the flow cytometer to determine the number of CTLs that are present in the mouse tissue. What are CTLs? How do they react when tumor cells are injected into the body?
20) What are the three groups of mice involved in the experiment? (Detail each group).

27
Sample Preparation 21) What is the purpose of the fluorescent markers? (Note: Each marker is a specific antibody to a
protein that you want to measure that has a fluorochrome attached to it)
22) What is the purpose of the fluorochromes?
23) For this experiment, you will use two types of fluorochromes to bind to two different proteins on the CTLs in order to differentiate them from other cells. One fluorochrome will emit green light and the other yellow light. We will call the two different proteins to which these fluorochromes attach Protein Y and Protein G (for the yellow and green fluorochromes).
*According to this information, how will you distinguish the CTLs? Flow Cytometry- How Does It Work?
24) The tissue sample is broken up into single cells and held in a test tube, which is placed into the flow cytometer. The liquid containing the cells is drawn up from the test tube and pumped into the flow chamber. Summarize the following 6 steps below (move your mouse over the components to learn more!):
1.
Flow Chamber
2.
Laser
3.
Light Detector
4.
Filters
5.
Color Detectors
6.
Computer

28
Data Analysis: What does a histogram tell me?
25) What does the x-axis represent, and what does this mean?
26) What does the y-axis represent, and what does this mean?
27) What will be shown in each of the 4 quadrants?
Quadrant 1
Quadrant 2
Quadrant 3
Quadrant 4
28) Draw and label a picture of the x-axis, y-axis, and Quadrants 1 – 4
29) Using the information above, where will the CTLs appear on the histogram? Data from the Dioxin Experiment
30) What does the histogram of the nonimmune mouse tell us?
31) What does the histogram of the vehicle control mouse tell us?
32) What does the histogram of the dioxin treatment mouse tell us?

29
Solve It!
33) Why did the mouse that was exposed to dioxin have low CTL counts? (Click on the correct answer choice & write the answer here.)
Why is this research important to me?
34) Using the yellow box on the page, explain why animal models are important in toxicology research.
35) What are some limitations of animal models?
36) What have animal model studies of exposure to dioxins shown with regard to the immune system?
30
VII. Lawrence Lab Flow Cytometry Data
“Patient A”
0 102 103 104 105
<Blue D 585/42-A>: Gr-1 PE
0
50K
100K
150K
200K
250K
SS
C-A
42.6

31
“Patient B”
0 102 103 104 105
<Blue D 585/42-A>: Gr-1 PE
0
50K
100K
150K
200K
250K
SS
C-A
25.9

32
“Patient C”
0 102 103 104 105
<Blue D 585/42-A>: Gr-1 PE
0
50K
100K
150K
200K
250K
SS
C-A
14.3

33
VIII. Websites for Dioxin Research World Health Organization (WHO) http://www.who.int/en/
-Search “dioxins & their effects on human health”
U.S. Food & Drug Administration http://www.fda.gov/
-Search “Questions & Answers about Dioxins”
United States Environmental Protection Agency http://www.epa.gov/
-Search “Dioxin Exposure Initiative”
-Search “Electronic Waste and eCycling”
-Search “PCBs”
-Search “Love Canal”
-Search “Times Beach”
United States Department of Veteran’s Affairs http://www.publichealth.va.gov
-Search “Agent Orange”

34
IX. Culminating Task: Public Service Announcement Task You and your group members must sketch and complete a 60 second Public Service Announcement (PSA) which will summarize the following key points:
I. Explanation of how pollutants in the environment affect the immune system’s ability to fight flu infection.
-Focus on the innate immune system
II. One historical example of dioxin pollution in the environment
-What caused this type of dioxin pollution?
-What was the resulting effect on people and the environment?
III. One current example of dioxin pollution in the environment
-What is the resulting effect on people and the environment?
-What can your audience do to prevent this pollution from happening?
Tips for developing a PSA *These guidelines are drawn from the Ad Council PSA kit.
Make sure your campaign idea deals with a significant public problem for which a solution can be offered. Do not develop a campaign which arouses public concern but offers no solution. Media messages are fleeting. One compelling central message, clearly presented with a simple call for action, is the most effective.
Make sure your PSA can answer the following questions:
Target Audience:
• Who is the intended audience?
• Are there any barriers to understanding the message? (Adjust your level of “science speak” to fit your target audience).
Message:
• What is the proposed message?
• What do I want the person who is watching this to understand? (Look to the Task above).
Action Step:
• What is the call to action? What do I want the person to do?
• What can an individual do in the home or community?
• How will the action solve the problem?

35
Significance of Issue to the Public:
• What is the proposed issue? Describe the problem and why it is important to the public.
• Are there any statistics involved which might be useful?
Required components of the project:
1) Turn in a written description of the PSA, answering the questions above, plus any other information and research about the issue.
2) Create a shotlist and story board
• A
which you can turn in.
shotlist
• A
simply lists the shots you think you want for the PSA (locations, actions, objects, scenes, interiors, etc.)
storyboard
3) Write your narration out and time it by reading it aloud with a stopwatch. Remember that your PSA needs to be at least 60 seconds in length. Turn in this writing with your story board.
is a visualization in drawing of the different shots in the order they will appear in the finished work, and includes compositional information (close up, pan, wide shot, etc.), as well as audio (where the narration comes in, or if there is music over the shot). Your drawings can be very simple; stick figures are acceptable!
4) After receiving approval for the PSA description, shotlist, storyboard, and narration, record your PSA (using Windows MovieMaker or a similar program) and edit it so it can be displayed to the rest of your class.