critical velocity/ nodal stability gas well...
TRANSCRIPT
Originally Presented at:Originally Presented at:
Gas Well De-Liquification Workshop
Adams Mark Hotel, Denver, Colorado
March 5 - 7, 2007
Critical Velocity/ Nodal Stability Critical Velocity/ Nodal Stability Gas Well PredictionsGas Well Predictions
By
J F Lea, PLTech LLC
Lynn Rowlan, Echometer
Charlie Reed, Devon
European Conference Gas Well European Conference Gas Well DeliquificationDeliquification2525--26 September 200726 September 2007

Originally Presented at:Originally Presented at:
Gas Well De-Liquification Workshop
Adams Mark Hotel, Denver, Colorado
March 5 - 7, 2007
Liquid Loading

Mar. 5 - 7, 20072007 European Gas Well Deliquification
Conference, Groningen, The Netherlands
3
GAS WELL GRADIENT COMPOSED OF GAS WELL GRADIENT COMPOSED OF GAS WELL GRADIENT COMPOSED OF GAS WELL GRADIENT COMPOSED OF
FRICTION AND GRAVITYFRICTION AND GRAVITYFRICTION AND GRAVITYFRICTION AND GRAVITY
(dp/dl) = (dp/dl)el + (dp/dl)f + (dp/dl)acc
HOLDUP (LIQUID) BUILDS WITH TIME AND LOWER PRODUCTION

Mar. 5 - 7, 20072007 European Gas Well Deliquification
Conference, Groningen, The Netherlands
4

Mar. 5 - 7, 20072007 European Gas Well Deliquification
Conference, Groningen, The Netherlands
5
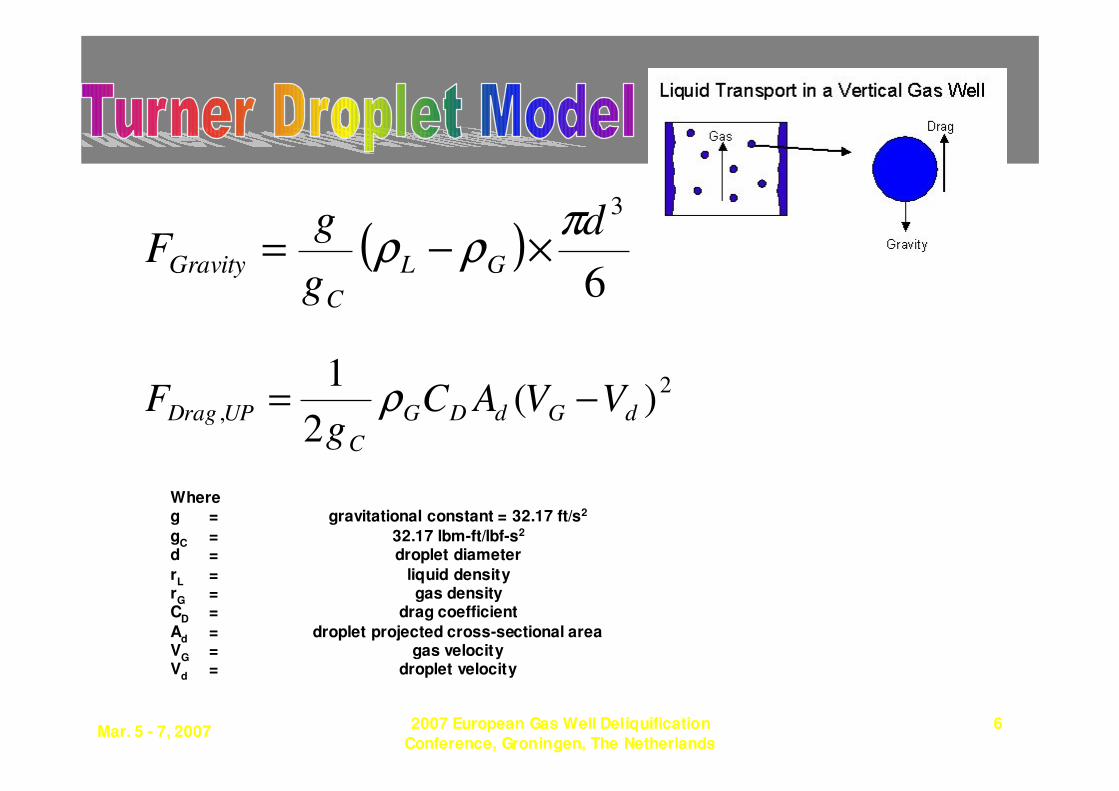
Determine Liquid Loading
from “Critical Velocity”
Droplet in
flowing gas
Buoyant
weight of
droplet in gas
Drag from
flowing gas
tending to lift
the droplet
Mar. 5 - 7, 20072007 European Gas Well Deliquification
Conference, Groningen, The Netherlands
6
( )6
3d
g
gF GL
C
Gravity
πρρ ×−=
2
, )(2
1dGdDG
C
UPDrag VVACg
F −= ρ
Whereg = gravitational constant = 32.17 ft/s2
gC
= 32.17 lbm-ft/lbf-s2
d = droplet diameter
rL
= liquid densityr
G= gas density
CD
= drag coefficient
Ad
= droplet projected cross-sectional areaV
G= gas velocity
Vd
= droplet velocity
Mar. 5 - 7, 20072007 European Gas Well Deliquification
Conference, Groningen, The Netherlands
7
( )( )
( )sft
P
P
P
PV waterC /
0031.
0031.67434.460
0031.
0031.67593.1
2/1
4/14/1
2,
−=
−=
( )( )
( )sft
P
P
P
PV
condC/
0031.
0031.45369.320
0031.
0031.45593.1
2/1
4/14/1
2,
−=
−=
( )( )
sftP
PV waterC /
0031.
0031.67321.5
2/1
4/1
,
−=
( )( )
sftP
PV
condC/
0031.
0031.45043.4
2/1
4/1
,
−=
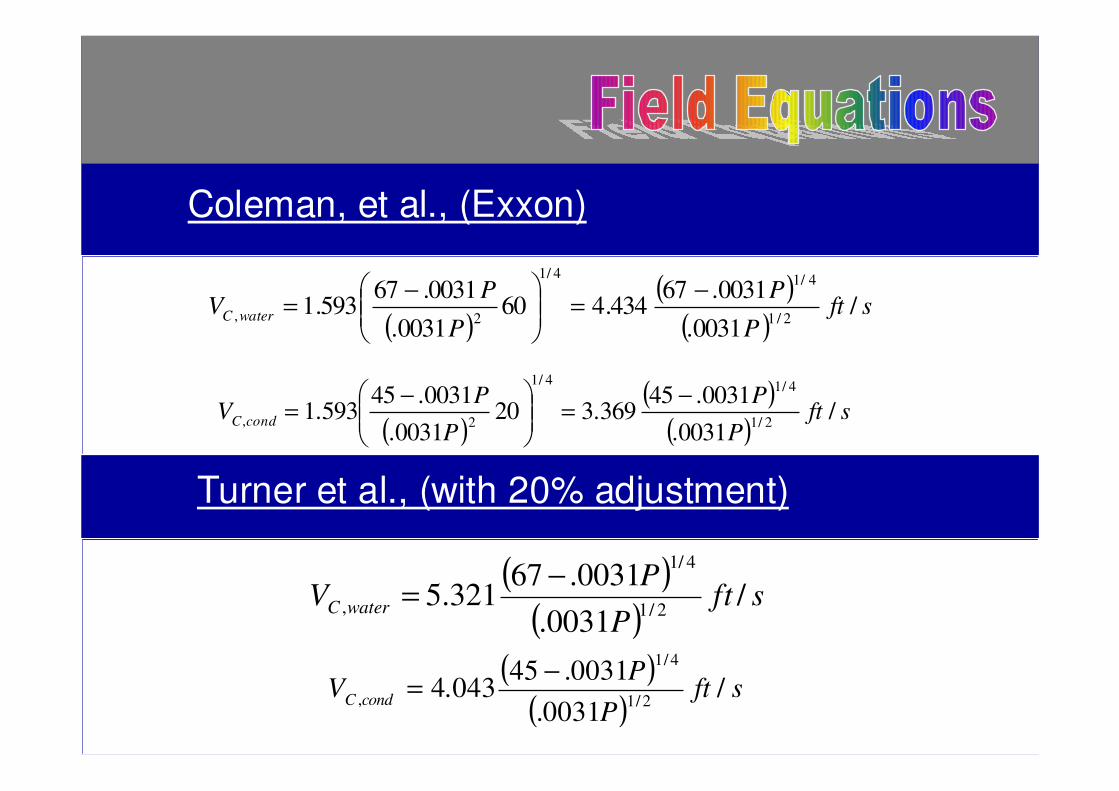
Coleman, et al., (Exxon)
Turner et al., (with 20% adjustment)
Mar. 5 - 7, 20072007 European Gas Well Deliquification
Conference, Groningen, The Netherlands
8
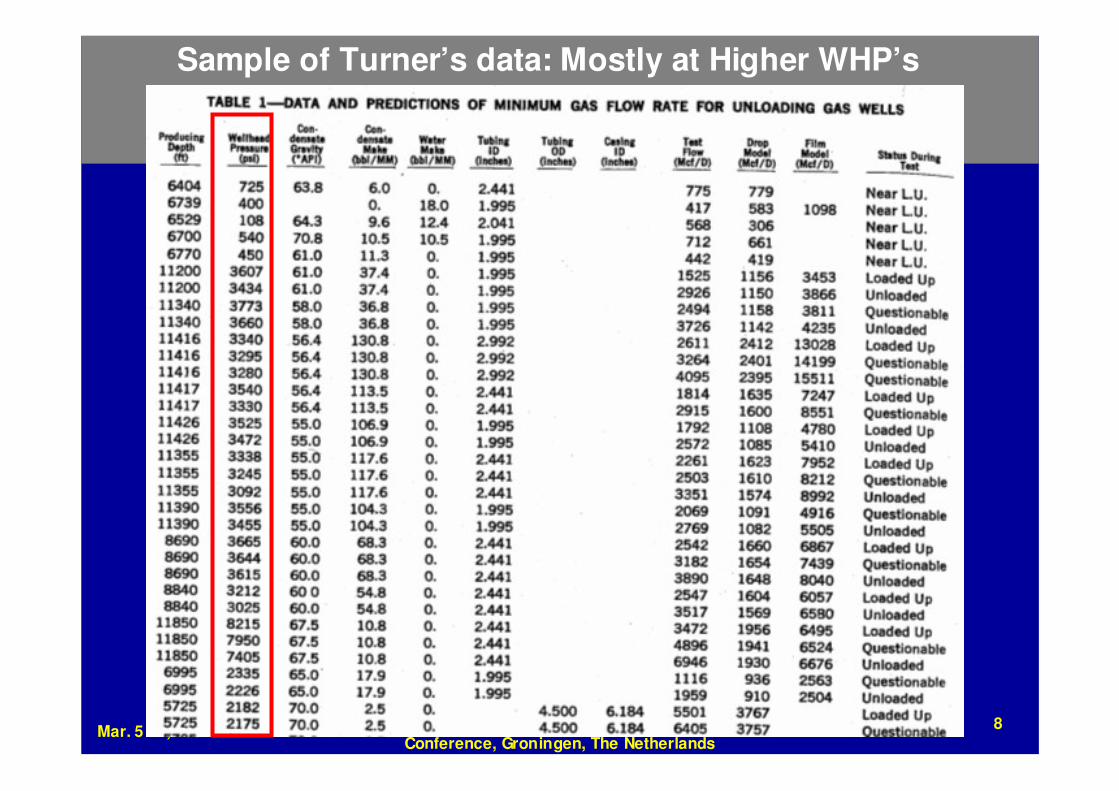
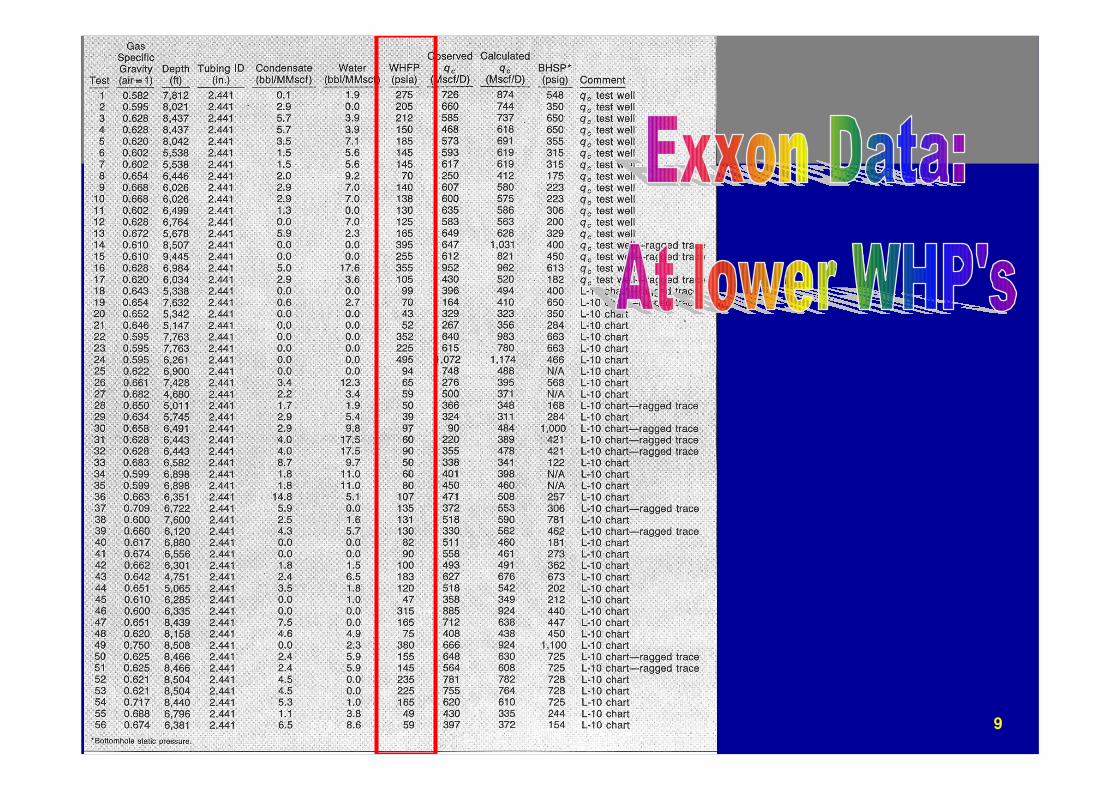
Sample of Turner’s data: Mostly at Higher WHP’s
Mar. 5 - 7, 20072007 European Gas Well Deliquification
Conference, Groningen, The Netherlands
9
Mar. 5 - 7, 20072007 European Gas Well Deliquification
Conference, Groningen, The Netherlands
10
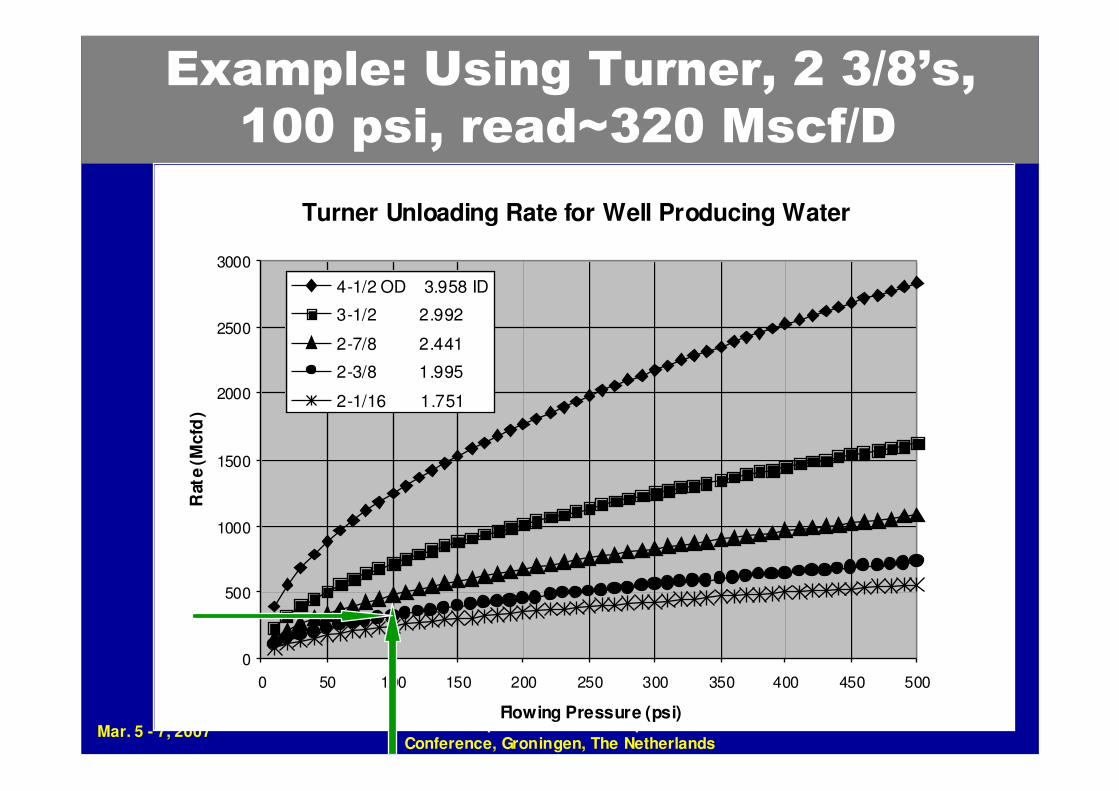
Example: Using Turner, 2 3/8’s,
100 psi, read~320 Mscf/D
Turner Unloading Rate for Well Producing Water
0
500
1000
1500
2000
2500
3000
0 50 100 150 200 250 300 350 400 450 500
Flowing Pressure (psi)
Rat
e (M
cfd
)
4-1/2 OD 3.958 ID
3-1/2 2.992
2-7/8 2.441
2-3/8 1.995
2-1/16 1.751

Mar. 5 - 7, 20072007 European Gas Well Deliquification
Conference, Groningen, The Netherlands
11
Other References Related to Critical Velocity or Rate
• Lea, J.F., Nickens, H.V., and Wells, M.: Gas Well De-Liquification, first edition, Elsevier Press, Cambridge, MA (2003).
• Turner, R.G., Hubbard, M.G., and Dukler, A.E.: “Analysis and Prediction of Minimum Flow Rate for the Continuous Removal of Liquids from Gas Wells,” J. Pet. Tech. (Nov.1969) 1475-1482.
• Coleman, S.B., Clay, H.B., McCurdy, D.G., and Lee Norris, H. III: “A New Look at Predicting Gas-Well Load Up,” J. Pet. Tech. (March 1991) 329-333.
• Veeken, K., Bakker, E., and Verbeek, P.: “Evaluating Liquid Loading Field Data and Remedial Measures,” presented at the 2003 Gas Well De-Watering Forum, Denver, CO, March 3-4.
• Li, M., Li, S.L., and Sun, L.T.: “New View on Continuous-Removal Liquids from Gas Wells,” paper SPE 75455 presented at the 2001 SPE Permian Basin Oil and Gas Recovery Conference, Midland, TX, May 15-16.
• Nosseir, M.A., Darwich, T.A., Sayyouh, M.H., and El Sallaly, M.: “A New Approach for Accurate Prediction of Loading in Gas Wells Under Different Flowing Conditions,” paper SPE 37408 presented at the 1997 SPE Production Operations Symposium, Oklahoma City, OK, March 9-11.
• Duggan, J.O.: “Estimating Flow Rates Required to Keep Gas Wells Unloaded,” J. Pet. Tech.(December 1961) 1173-1176.
• Yamamoto, H. and Christiansen, R.L.: “Enhancing Liquid Lift from Low Pressure Gas Reservoirs,”paper SPE 55625 prepared for presentation at the 1999 SPE Rocky Mountain Regional Meeting, Gillette, WY, May 15-18.
• Bizanti, M.S. and Moonesan, A.: “How to Determine Minimum Flowrate for Liquids Removal,” World Oil, (Sept. 1989) 71-73.
• Ilobi, M.I. and Ikoku, C.U.: “Minimum Gas Flow Rate for Continuous Liquid Removal in Gas Wells,”paper SPE 10170 presented at the 1981 SPE of AIME Annual Fall Technical Conference and Exhibition, San Antonio, TX, Oct. 5-7.

Mar. 5 - 7, 20072007 European Gas Well Deliquification
Conference, Groningen, The Netherlands
12
Critical Rate: SummaryCritical Rate: Summary
•• Turner, Coleman and other models do not Turner, Coleman and other models do not
agreeagree
•• Critical gas rate independent of liquid rateCritical gas rate independent of liquid rate
•• Theoretically better to use at pressure Theoretically better to use at pressure
downhole but seldom attempteddownhole but seldom attempted
•• Simple modelSimple model
•• Must be considered approximate but Must be considered approximate but
widely widely used with successused with success

Originally Presented at:Originally Presented at:
Gas Well De-Liquification Workshop
Adams Mark Hotel, Denver, Colorado
March 5 - 7, 2007
Nodal Analysis
Mar. 5 - 7, 20072007 European Gas Well Deliquification
Conference, Groningen, The Netherlands
14
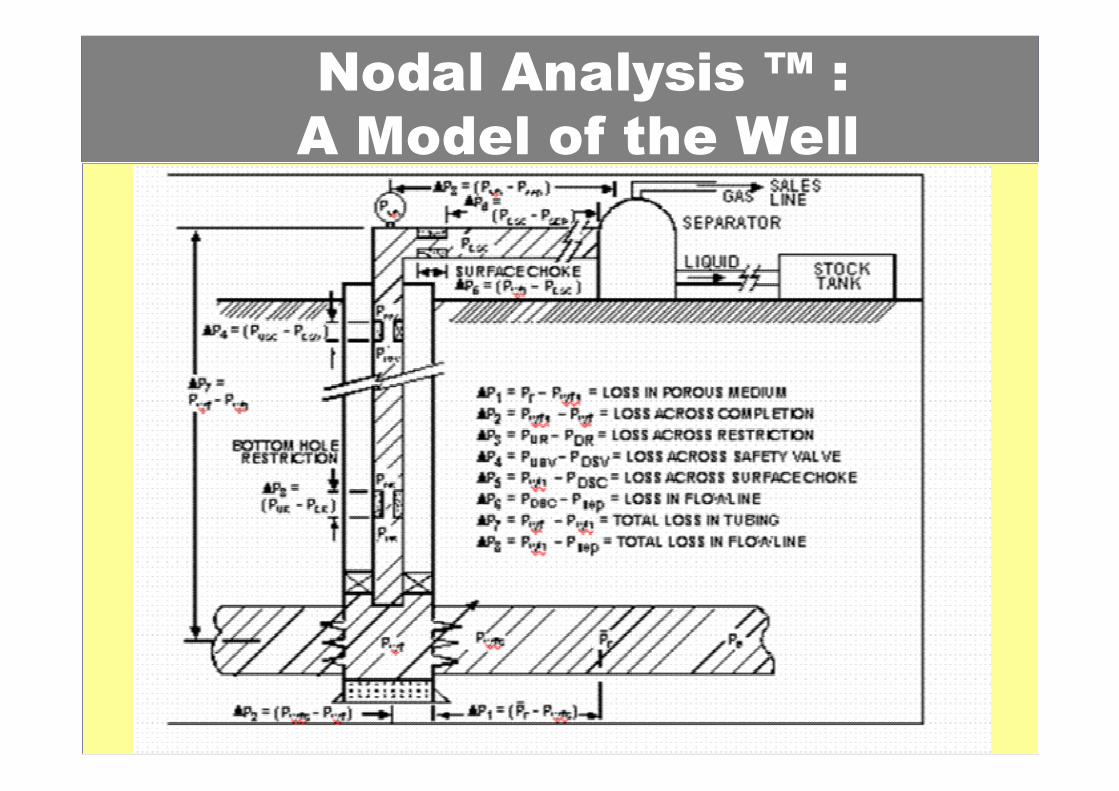
Nodal Analysis ™ :
A Model of the Well
Mar. 5 - 7, 20072007 European Gas Well Deliquification
Conference, Groningen, The Netherlands
15
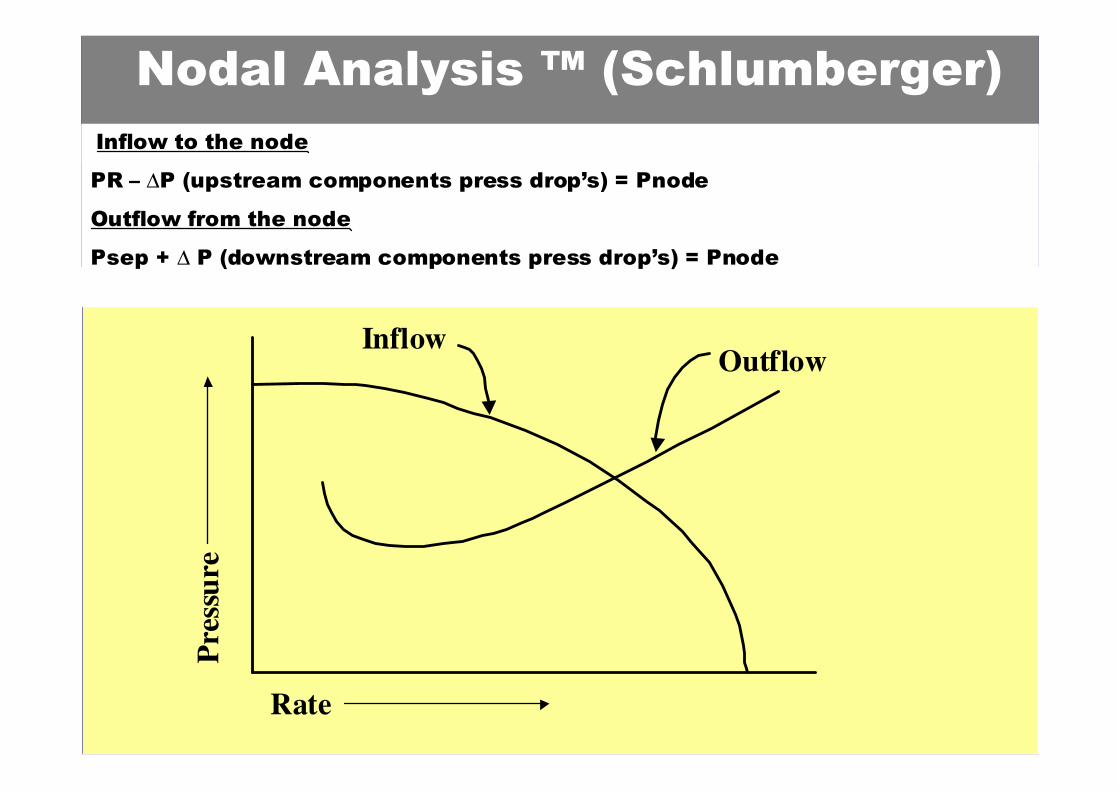
Nodal Analysis ™ (Schlumberger)
Rate
Pre
ssu
re
InflowOutflow
Inflow to the node
PR – ∆P (upstream components press drop’s) = Pnode
Outflow from the node
Psep + ∆ P (downstream components press drop’s) = Pnode
Originally Presented at:Originally Presented at:
Gas Well De-Liquification Workshop
Adams Mark Hotel, Denver, Colorado
March 5 - 7, 2007
Inflow Curves
Mar. 5 - 7, 20072007 European Gas Well Deliquification
Conference, Groningen, The Netherlands
17
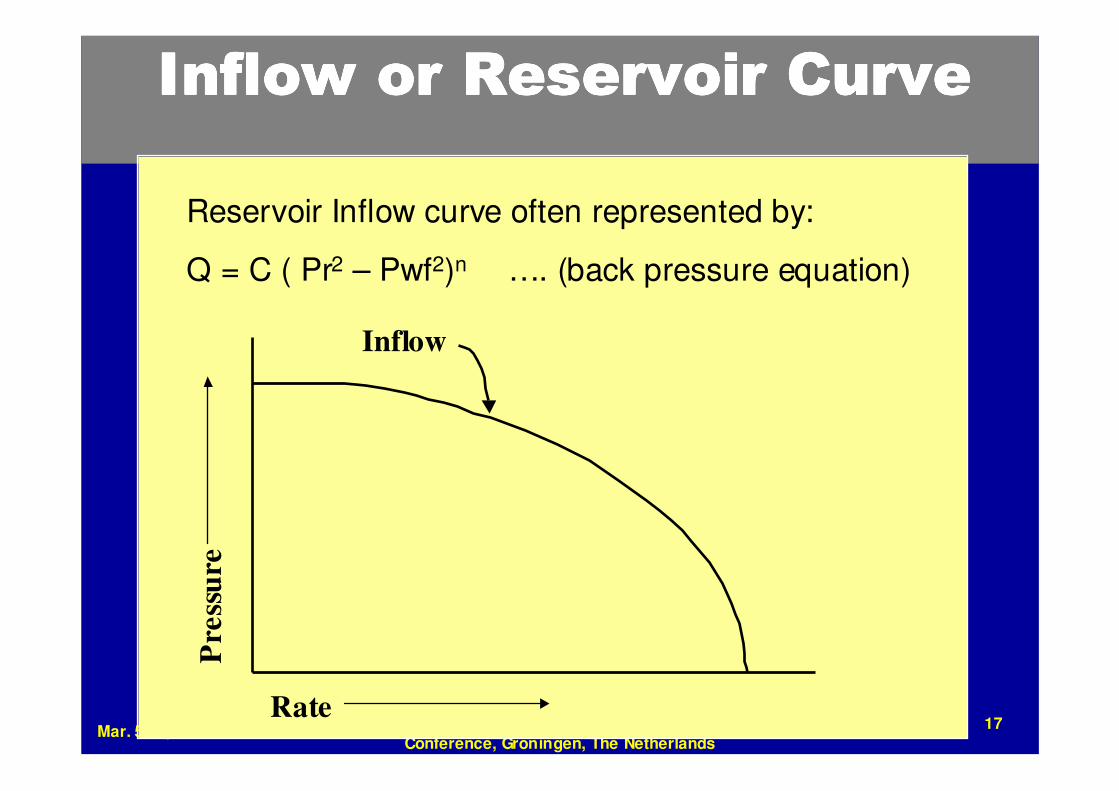
Inflow or Reservoir CurveInflow or Reservoir CurveInflow or Reservoir CurveInflow or Reservoir Curve
Rate
Pre
ssu
re
Inflow
Reservoir Inflow curve often represented by:
Q = C ( Pr2 – Pwf2)n …. (back pressure equation)

Originally Presented at:Originally Presented at:
Gas Well De-Liquification Workshop
Adams Mark Hotel, Denver, Colorado
March 5 - 7, 2007
Outflow Curves
Mar. 5 - 7, 20072007 European Gas Well Deliquification
Conference, Groningen, The Netherlands
19
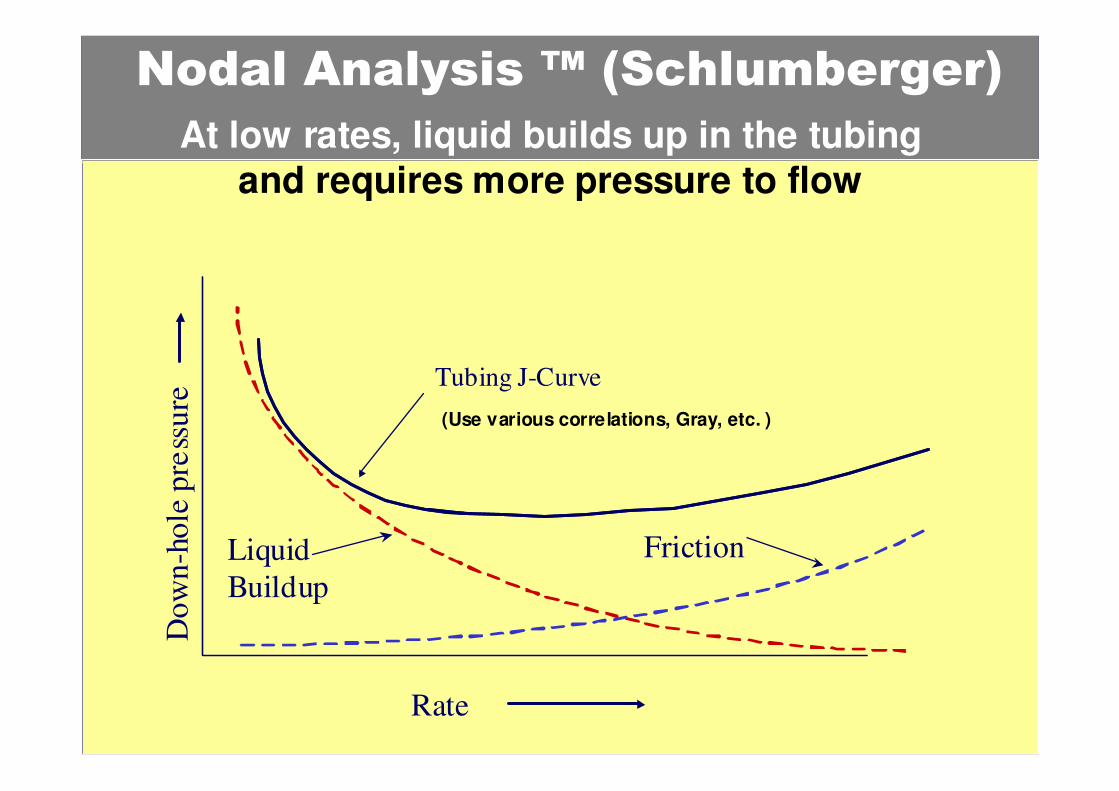
Nodal Analysis ™ (Schlumberger)
FrictionLiquid
Buildup
Rate
Do
wn
-ho
le p
ress
ure
Tubing J-Curve
At low rates, liquid builds up in the tubing
and requires more pressure to flow
(Use various correlations, Gray, etc. )

Mar. 5 - 7, 20072007 European Gas Well Deliquification
Conference, Groningen, The Netherlands
20
Liquid LoadingLiquid Loading
•• Liquid loading Liquid loading
occurs when occurs when gas gas
rate is too lowrate is too low to to
efficiently remove efficiently remove
the produced the produced
liquidsliquids
•• Liquid Loading Liquid Loading
symptoms symptoms of of
unstable flow unstable flow
behaviorbehavior and and
potential potential logging logging
off of the welloff of the well
0 800 1600 2400 3200 4000 4800 5600 6400 7200 80000
80
160
240
320
400
480
560
640
720
800
880PSIAPSIAPSIA
Gas Rate (mscf/d)Gas Rate (mscf/d)Gas Rate (mscf/d)
Tubing CurvesTubing CurvesTubing Curves
ISABEL A1ISABEL A1ISABEL A1
S1 - Tubing Flow - Ptbg = 250 psig
S2 - Tubing Flow - Ptbg = 250 psig
S3 - Tubing Flow - Ptbg = 250 psig
Cond .0 bbl/MMscf
Water 29.6 bbl/MMscf
S1 - 2.875" at 3220 ft
S2 - 3.5" at 3220 ft
S3 - 4.5" at 3220 ft
Gray Correlation
S1
S2
S3
S1 S2 S3

Mar. 5 - 7, 20072007 European Gas Well Deliquification
Conference, Groningen, The Netherlands
21
Nodal Analysis : Effects such as Size of the
Tubing Diameter vs. Flow Rate can be studied

Mar. 5 - 7, 20072007 European Gas Well Deliquification
Conference, Groningen, The Netherlands
22
BIGGEST ERROR in Multiphase Flow Predictions
Nodal “TurnNodal “Turn--Up” PointsUp” Points

Mar. 5 - 7, 20072007 European Gas Well Deliquification
Conference, Groningen, The Netherlands
23
0 200 400 600 800 1000 1200 1400 1600 1800 2000340
380
420
460
500
540
580
620
660
700
740
780
820
860
900
Flowing BHP (psig)Flowing BHP (psig)Flowing BHP (psig)
Gas Rate (mscf/d)Gas Rate (mscf/d)Gas Rate (mscf/d)
Liquid Loading J-Curve with GrayLiquid Loading J-Curve with GrayLiquid Loading J-Curve with Gray
Tbg - Critical Rate (Min BHP) = 547 mscf/d
Pfwh 125psig
Cond .0 bbl/MMscf
Water 15.0bbl/MMscf
2.375" at 10000 ft
Stable flowHigh frictionMay have some liquid buildup
Unstable flowHigh liquid buildup
LIQUID LEVEL PRESENT IN WELL
Liquid loading occurs when gas rate is too low to efficiently remove the produced liquids
This results in unstable flow behavior and potential logging off of the well
Optimal Operation
Liquid LoadingJ-Curve with Tubing to Perfs

Originally Presented at:Originally Presented at:
Gas Well De-Liquification Workshop
Adams Mark Hotel, Denver, Colorado
March 5 - 7, 2007
Nodal Stability
Mar. 5 - 7, 20072007 European Gas Well Deliquification
Conference, Groningen, The Netherlands
25
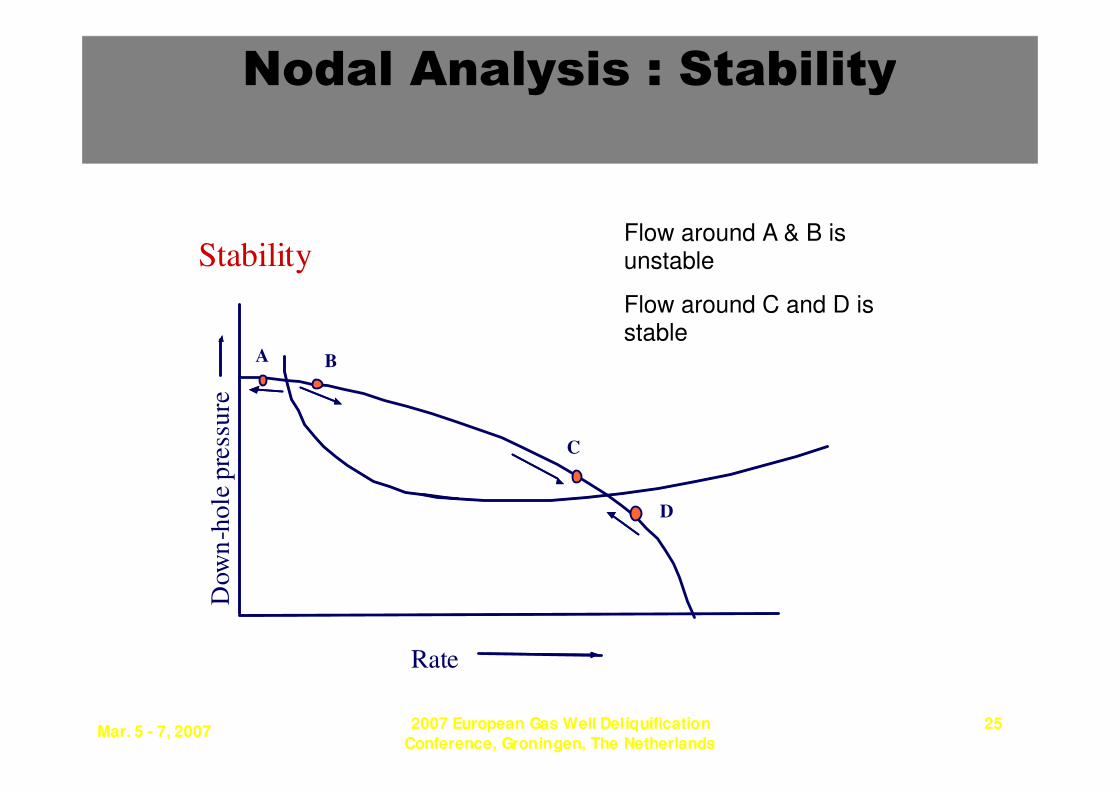
Nodal Analysis : Stability
Stability
Rate
Dow
n-h
ole
pre
ssu
re
B
D
C
A
Flow around A & B is unstable
Flow around C and D is stable
Mar. 5 - 7, 20072007 European Gas Well Deliquification
Conference, Groningen, The Netherlands
26
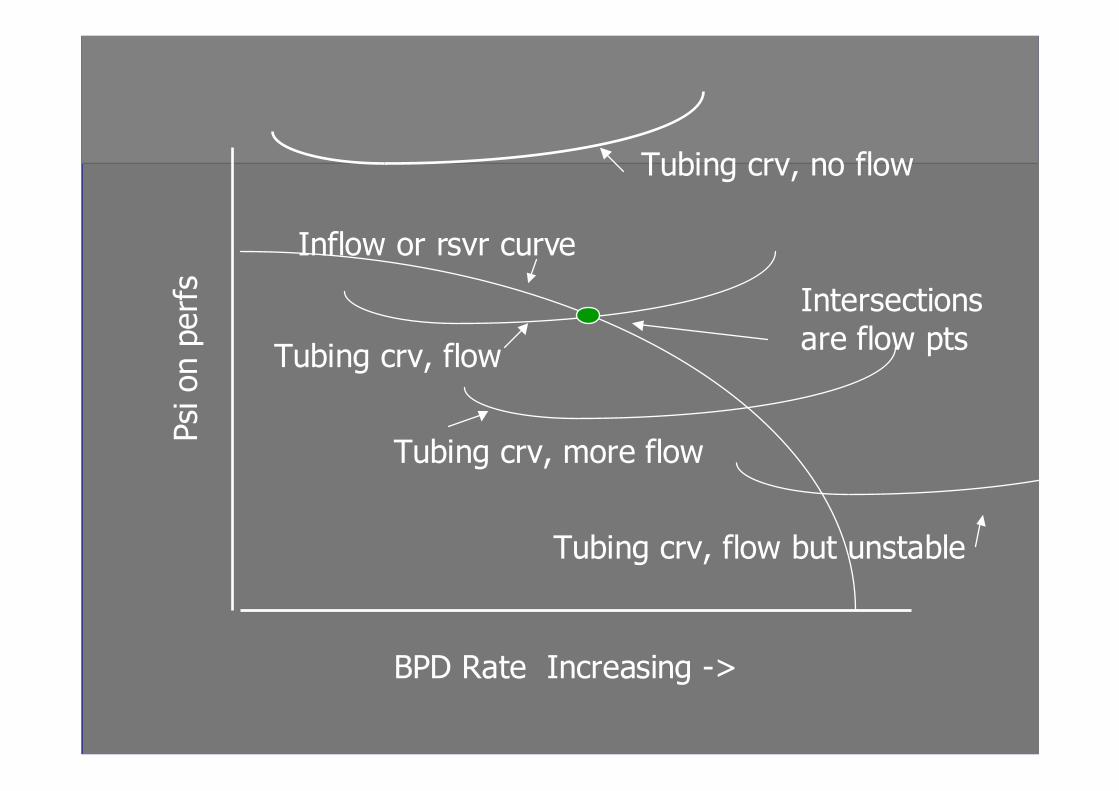
BPD Rate Increasing ->
Psi on perfs
Inflow or rsvr curve
Tubing crv, no flow
Tubing crv, more flow
Tubing crv, flow
Tubing crv, flow but unstable
Intersections are flow pts

Originally Presented at:Originally Presented at:
Gas Well De-Liquification Workshop
Adams Mark Hotel, Denver, Colorado
March 5 - 7, 2007
Model Gas Well
Mar. 5 - 7, 20072007 European Gas Well Deliquification
Conference, Groningen, The Netherlands
28
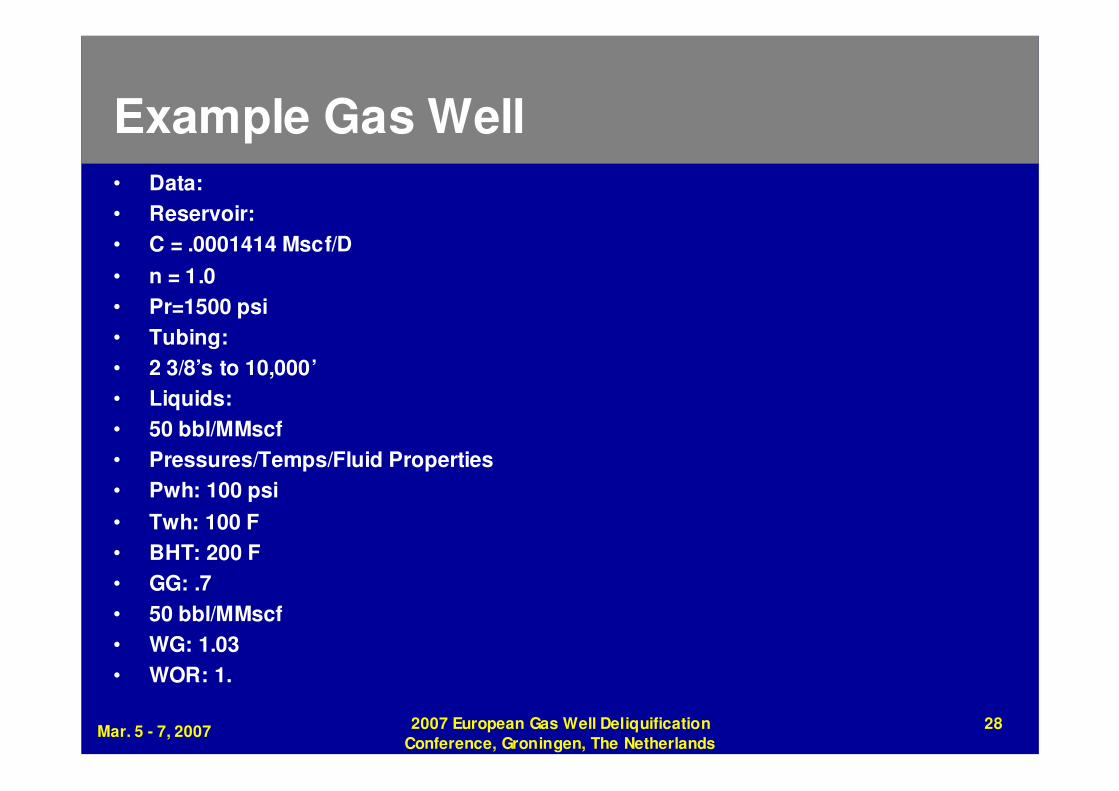
Example Gas Well • Data:
• Reservoir:
• C = .0001414 Mscf/D
• n = 1.0
• Pr=1500 psi
• Tubing:
• 2 3/8’s to 10,000’
• Liquids:
• 50 bbl/MMscf
• Pressures/Temps/Fluid Properties
• Pwh: 100 psi
• Twh: 100 F
• BHT: 200 F
• GG: .7
• 50 bbl/MMscf
• WG: 1.03
• WOR: 1.
Originally Presented at:Originally Presented at:
Gas Well De-Liquification Workshop
Adams Mark Hotel, Denver, Colorado
March 5 - 7, 2007
Example Output

Mar. 5 - 7, 20072007 European Gas Well Deliquification
Conference, Groningen, The Netherlands
30
Well flow unstable
according to shape of
outflow curve at point of
intersection with IPR
Originally Presented at:Originally Presented at:
Gas Well De-Liquification Workshop
Adams Mark Hotel, Denver, Colorado
March 5 - 7, 2007
Effects of Tubing Size

Mar. 5 - 7, 20072007 European Gas Well Deliquification
Conference, Groningen, The Netherlands
32
Smaller tubing such as 1.61 or 1.38 (or smaller) ID stabilizes flow.
Critical rate for 1.61 is 245 mscfd
Critical rate for 1.38 is 152 mscfd
So 1.61” or smaller stabilizes and flows above critical rate
Originally Presented at:Originally Presented at:
Gas Well De-Liquification Workshop
Adams Mark Hotel, Denver, Colorado
March 5 - 7, 2007
Effects of Surface Pressure
Mar. 5 - 7, 20072007 European Gas Well Deliquification
Conference, Groningen, The Netherlands
34
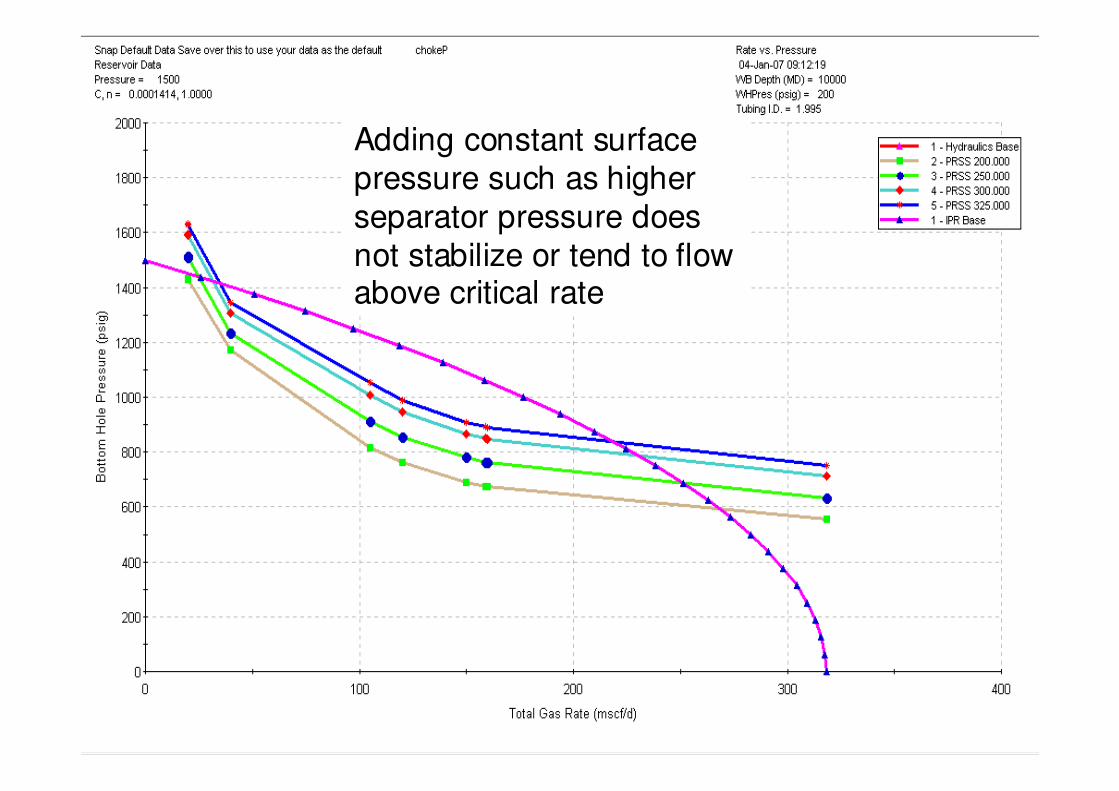
Adding constant surface
pressure such as higher
separator pressure does
not stabilize or tend to flow above critical rate

Originally Presented at:Originally Presented at:
Gas Well De-Liquification Workshop
Adams Mark Hotel, Denver, Colorado
March 5 - 7, 2007
Effects of Restrictions at Bottom of Tubing
Mar. 5 - 7, 20072007 European Gas Well Deliquification
Conference, Groningen, The Netherlands
36
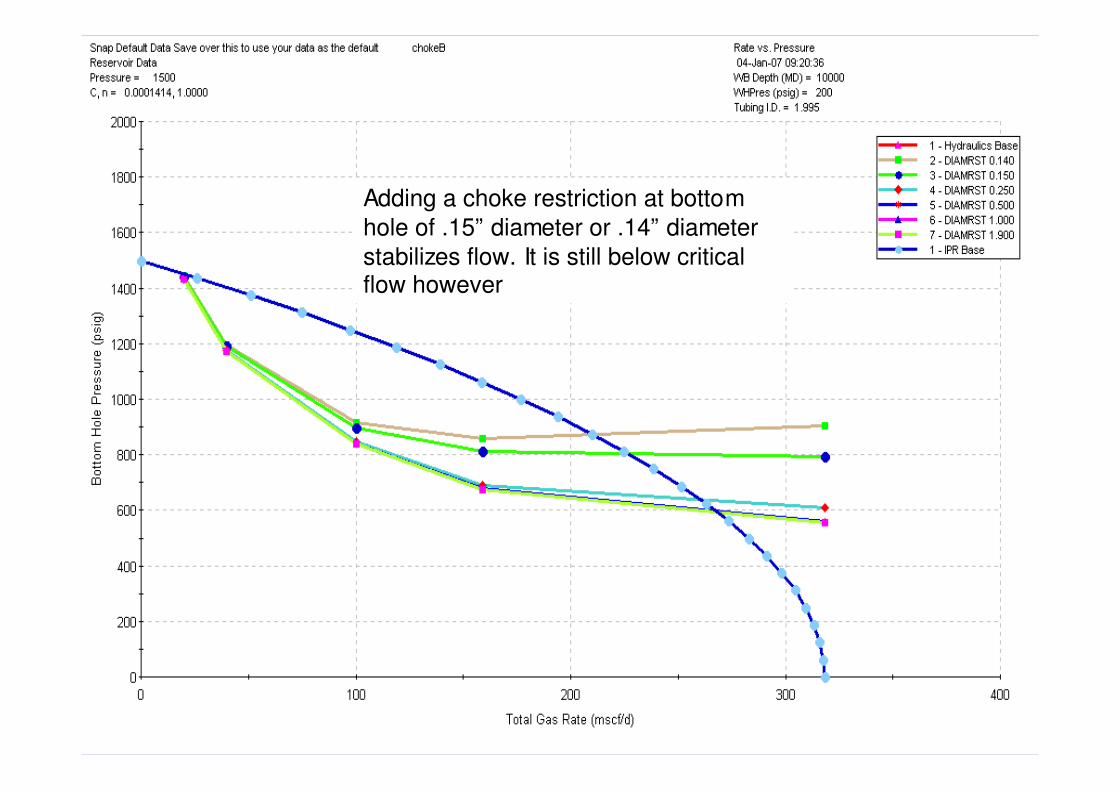
Adding a choke restriction at bottom
hole of .15” diameter or .14” diameter
stabilizes flow. It is still below critical flow however
Originally Presented at:Originally Presented at:
Gas Well De-Liquification Workshop
Adams Mark Hotel, Denver, Colorado
March 5 - 7, 2007
Effects of Restrictions at Surface
Mar. 5 - 7, 20072007 European Gas Well Deliquification
Conference, Groningen, The Netherlands
38
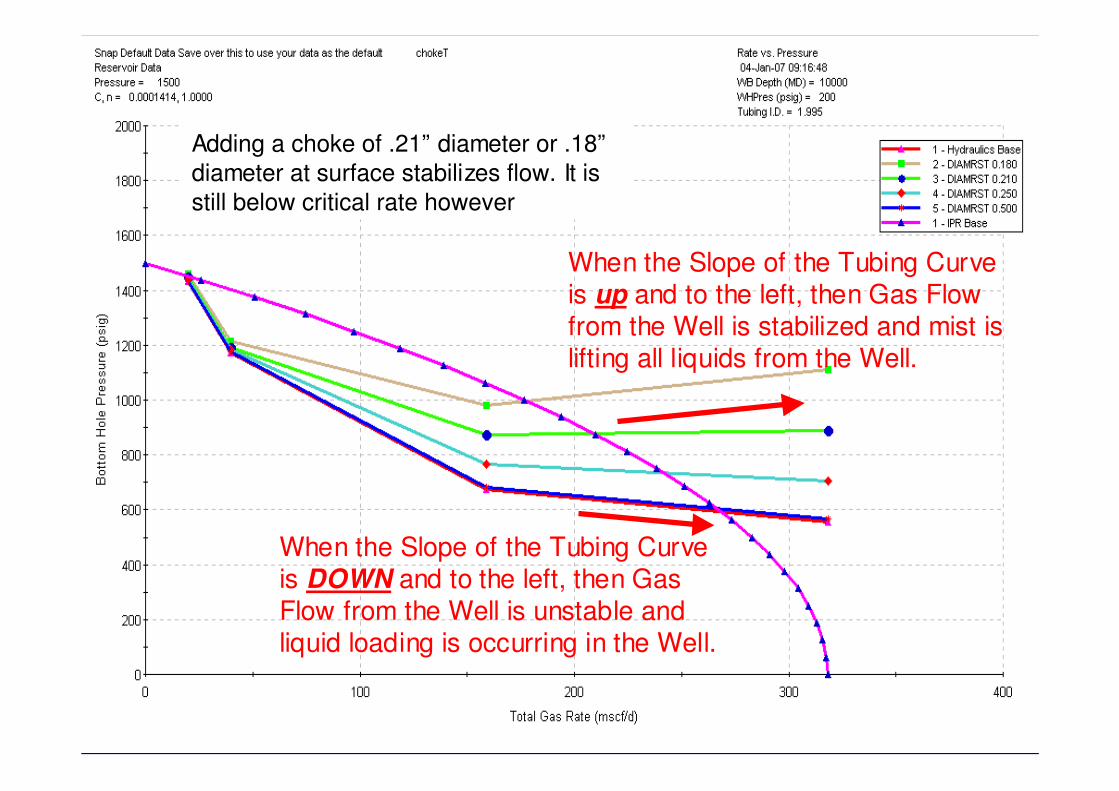
Adding a choke of .21” diameter or .18”
diameter at surface stabilizes flow. It is
still below critical rate however
When the Slope of the Tubing Curve
is up and to the left, then Gas Flow
from the Well is stabilized and mist is
lifting all liquids from the Well.
When the Slope of the Tubing Curve
is DOWN and to the left, then Gas
Flow from the Well is unstable and
liquid loading is occurring in the Well.
Originally Presented at:Originally Presented at:
Gas Well De-Liquification Workshop
Adams Mark Hotel, Denver, Colorado
March 5 - 7, 2007
Effects of Flowline

Mar. 5 - 7, 20072007 European Gas Well Deliquification
Conference, Groningen, The Netherlands
40
A flowline of more
and more pressure
drop has a stabilizing
effect but flow is still below critical rate
Mar. 5 - 7, 20072007 European Gas Well Deliquification
Conference, Groningen, The Netherlands
41
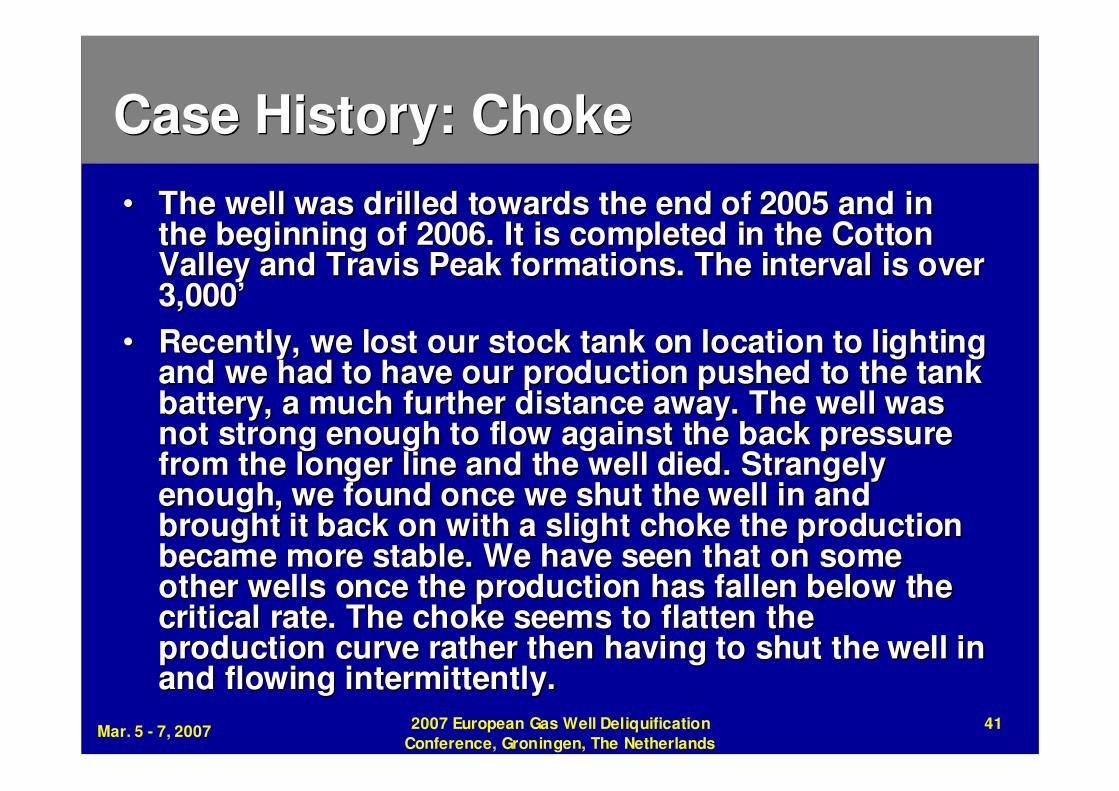
Case History: ChokeCase History: Choke
•• The well was drilled towards the end of 2005 and in The well was drilled towards the end of 2005 and in the beginning of 2006. It is completed in the Cotton the beginning of 2006. It is completed in the Cotton Valley and Travis Peak formations. The interval is over Valley and Travis Peak formations. The interval is over 3,000’3,000’
•• Recently, we lost our stock tank on location to lighting Recently, we lost our stock tank on location to lighting and we had to have our production pushed to the tank and we had to have our production pushed to the tank battery, a much further distance away. The well was battery, a much further distance away. The well was not strong enough to flow against the back pressure not strong enough to flow against the back pressure from the longer line and the well died. Strangely from the longer line and the well died. Strangely enough, we found once we shut the well in and enough, we found once we shut the well in and brought it back on with a slight choke the production brought it back on with a slight choke the production became more stable. We have seen that on some became more stable. We have seen that on some other wells once the production has fallen below the other wells once the production has fallen below the critical rate. The choke seems to flatten the critical rate. The choke seems to flatten the production curve rather then having to shut the well in production curve rather then having to shut the well in and flowing intermittently.and flowing intermittently.
Mar. 5 - 7, 20072007 European Gas Well Deliquification
Conference, Groningen, The Netherlands
42
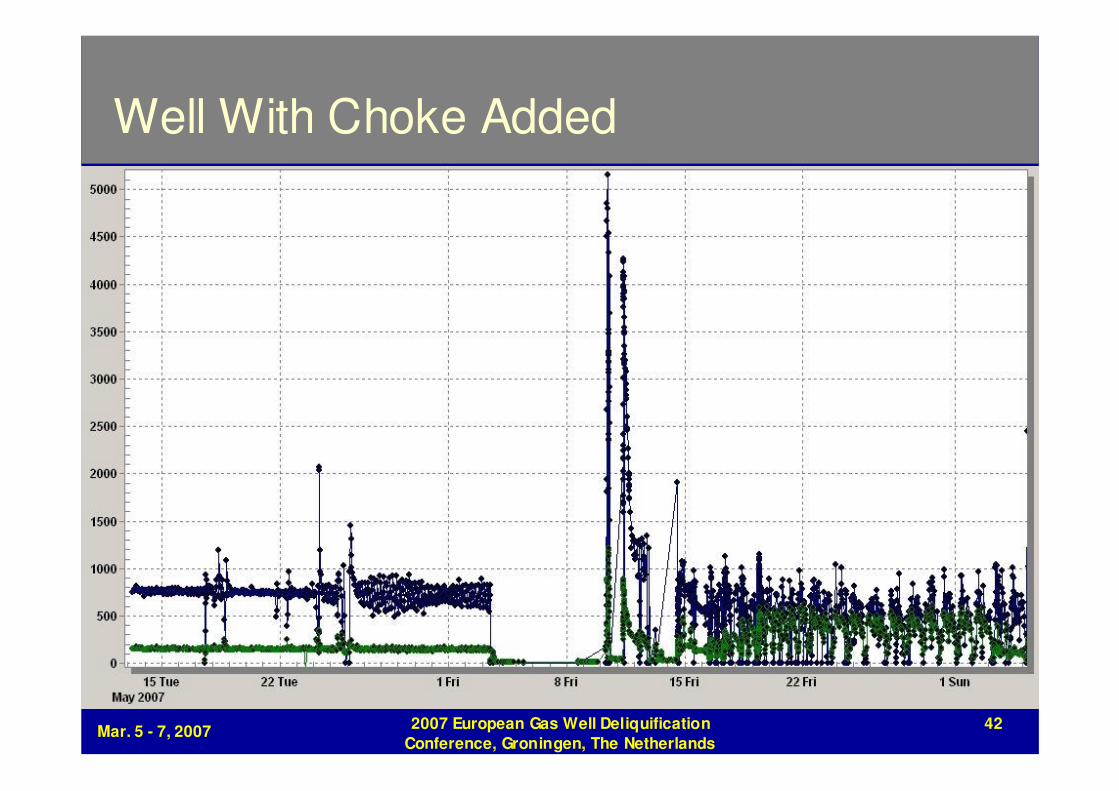
Well With Choke Added
Mar. 5 - 7, 20072007 European Gas Well Deliquification
Conference, Groningen, The Netherlands
43
Choke: Summary:Choke: Summary:
•• Choke on well above critical just reduces rateChoke on well above critical just reduces rate
•• Choke on artificially lifted well adds HP or Choke on artificially lifted well adds HP or
reduces rate… except for special casesreduces rate… except for special cases
•• “May” be window on wells that are loaded “May” be window on wells that are loaded
(and maybe best on wells intermitting) that (and maybe best on wells intermitting) that
seems to allow wells to once again flow seems to allow wells to once again flow
continuously instead of having to intermit.continuously instead of having to intermit.

Originally Presented at:Originally Presented at:
Gas Well De-Liquification Workshop
Adams Mark Hotel, Denver, Colorado
March 5 - 7, 2007
Summary & Conclusions
Mar. 5 - 7, 20072007 European Gas Well Deliquification
Conference, Groningen, The Netherlands
45
Summary & Conclusions
• Smaller tubing has stabilizing effect but if too small will add too much friction (well known)
•• Adding constant pressureAdding constant pressure to the surface of the well reduces ratereduces rate and does not stabilize the well or tend to flow below critical
• Adding lower constant pressurelower constant pressure to the surface of the well stabilizes the well and tends to flow above critical rate (compressioncompression)
Mar. 5 - 7, 20072007 European Gas Well Deliquification
Conference, Groningen, The Netherlands
46
Summary & Conclusions Continued
• The effects of a flowlineflowline (rate dependent pressure drop) has a stabilizing effectstabilizing effect on the
flow but flow continues below critical if below to start with as FL pressure drop is added.
• Adding too muchtoo much of a rate dependent pressure drop will (choke) can reduce flowrate to zerochoke) can reduce flowrate to zero
•• AddingAdding a rate dependent pressure drop
(chokechoke) to a loaded well has a stabilizing effectstabilizing effectbut well remains flowing below critical rate

Mar. 5 - 7, 20072007 European Gas Well Deliquification
Conference, Groningen, The Netherlands
47
Possible Uses of AnalysisPossible Uses of Analysis
• If a well is loaded and it must be intermitted to continue production, consider using a choke to get the well to flow continuously once again. The cost is low to try this. DO NOT add DO NOT add chokes across the field indiscriminately or you chokes across the field indiscriminately or you will have problems. will have problems.
• Thanks to Mohan Kelkar, Tulsa University, for pointing out the stabilizing effects of adding chokes to loaded gas wells. At least stabilizing as far as Nodal Analysis predictions are concerned.