credit supply and the rise in college tuition: evidence ... supply and the rise in college tuition:...
TRANSCRIPT

Credit Supply and the Rise in College Tuition:Evidence from the Expansion in Federal Student Aid
Programs
David Lucca† Taylor Nadauld ‡ Karen Shen?
†Federal Reserve Bank of New York
‡Brigham Young University
?Harvard University
The Julis-Rabinowitz Center for Public Policy and FinanceFebruary 2016
The views in this presentation are those of the author and not necessarily those of
others at the Federal Reserve Bank of New York or the Federal Reserve System.

Introduction
Long-standing debate on the role of credit in pricing assets,goods and services
Emphasis on the 2002-06 mortgage and housing boom/bustcycle
From a funding perspective housing and postsecondaryeducation shared many features in the past decade
Expansion in loan balances and distress; prevalence of federalaid programs
Against backdrop of increasing loan balances, rapid growth inthe price of college education

Non-mortgage related household debt balances
200
400
600
800
1000
1200
Dolla
rs, b
illion
s
2003 2004 2005 2006 2007 2008 2009 2010 2011 2012 2013 2014
Student loans Credit cardsAuto loans HELOCs
At $1.2 trillion, student debt outstanding now the largest formof non-mortgage household liability (FRBNY CCP/Equifax)

Aggregate student loan originations
050
100
150
Dol
lars
, billi
ons
2001 2002 2003 2004 2005 2006 2007 2008 2009 2010 2011 2012
Federal undergrad subsidized Federal undergrad unsubsidizedFederal undergrad PLUS Federal graduate (all)Non-federal
Student loan originations rose from $53 to $120 billionbetween 2001-12; >90% under federal loan programs (CollegeBoard)

Introduction
Long-standing debate on the role of credit in pricing assets,goods and services
Emphasis on the 2002-06 mortgage and housing boom/bustcycle
From a funding perspective housing and postsecondaryeducation shared many features in the past decade
Expansion in loan balances and distress; prevalence of federalaid programs
Against backdrop of increasing loan balances, rapid growth inthe price of college education

Undergraduate sticker tuition and federalper-student originations
020
0040
0060
0080
0010
000
Dolla
rs
2001 2002 2003 2004 2005 2006 2007 2008 2009 2010 2011 2012
Sticker Price Tuition Subsidized LoanUnsubsidized Loan Other Federal Loans
Sticker tuition grew 46% in real terms from $6,950 to $10,200in 2012 dollars (IPEDS/Title IV)

What’s causing the rise in college cost?
Policy debate on twin loan-cost increase well before the 2000s
William Bennett (NYT, 1987): “[...]increases in financial aidin recent years have enabled colleges and universities blithelyto raise their tuitions, confident that Federal loan subsidieswould help cushion the increase[...]”
A 2014 CRS report surveys importance of increasing operatingcosts and declining state appropriation & endowments; alsoreviews literature of federal aid on tuition:
Mostly grants (Singell-Stone 07, Turner 12) or grants & loans(Cellini and Goldin 12)

This paper
Does more borrowing lead to higher tuition?
Simultaneity issue: Higher tuition ⇒ greater loan demand,but does loan supply ⇒ higher tuition?
Contribution: test supply channel around recent expansion infederal student aid programs (90% of 2012 loan originations)

Federal loan programs and tuition
Economic rationale for a government loan to a student:
1. Education is an intangible (and unpledgeable) human capitalinvestment → private lenders unwilling to lend
2. Government can lend w/out guarantees or enforce repayment(e.g non-dischargeability or wage garnishment)
Equilibrium effects with many (identical) students allconstrained:
1. Students pay the (borrowing) constrained amount rather thantheir “willingness to pay”
2. Greater access to credit boosts aggregate demand for edservices
3. Higher tuition and margins at colleges unless perfectcompetition and expansion in capacity

To what extent would colleges respond to increaseddemand?
Access to some university may already be rationed (selectiveprivates); some universities are unable or unwilling to raisetuition (e.g. publics require state legislative or executiveauthorization)
For profit privates are most likely to accommodate demandwith price increases
Brian Mueller, CEO Apollo ED Group, 2007Q2 earnings call:“[...] rationale for the price increase at Axia had to do withTitle IV loan limit increases. We raised it to a level we thoughtwas acceptable in the short run [...] it definitely was doneunder the guise of what the student can afford to borrow [...]”

Changes in Federal Aid Policies
Focus on subsidized & unsubsidized federal loans (or“Staffords” pre-2010) that account for 82% of all federalstudent loans in 2012-2013
Yearly federal loan and grant maximums
Sub. and Unsub. Loans Additional Unsubsidized Loans Pell GrantsYear Y1 Y2 Y3/Y4 Grad Y1-Y4(D) Y1/Y2(I) Y3/Y4(I) Grad Y1-Y4
2001 2625 3500 5500 8500 0 4000 5000 10000 33502002 2625 3500 5500 8500 0 4000 5000 10000 37502003 2625 3500 5500 8500 0 4000 5000 10000 40002004 2625 3500 5500 8500 0 4000 5000 10000 40502005 2625 3500 5500 8500 0 4000 5000 10000 40502006 2625 3500 5500 8500 0 4000 5000 10000 40502007 2625 3500 5500 8500 0 4000 5000 10000 40502008 3500 4500 5500 8500 0 4000 5000 12000 43102009 3500 4500 5500 8500 2000 6000 7000 12000 47312010 3500 4500 5500 8500 2000 6000 7000 12000 53502011 3500 4500 5500 8500 2000 6000 7000 12000 55502012 3500 4500 5500 8500 2000 6000 7000 12000 5550

Changes in Federal Aid Policies
Focus on subsidized & unsubsidized federal loans (or“Staffords” pre-2010) that account for 82% of all federalstudent loans in 2012-2013
Higher Education Reconciliation 2006 Act increasedsubsidized loan limits from $2625 to $3500 for freshman, andfrom $3500 to $4500 for sophomores
Sub. and Unsub. Loans Additional Unsubsidized Loans Pell GrantsYear Y1 Y2 Y3/Y4 Grad Y1-Y4(D) Y1/Y2(I) Y3/Y4(I) Grad Y1-Y4
2001 2625 3500 5500 8500 0 4000 5000 10000 33502002 2625 3500 5500 8500 0 4000 5000 10000 37502003 2625 3500 5500 8500 0 4000 5000 10000 40002004 2625 3500 5500 8500 0 4000 5000 10000 40502005 2625 3500 5500 8500 0 4000 5000 10000 40502006 2625 3500 5500 8500 0 4000 5000 10000 40502007 2625 3500 5500 8500 0 4000 5000 10000 40502008 3500 4500 5500 8500 0 4000 5000 12000 43102009 3500 4500 5500 8500 2000 6000 7000 12000 47312010 3500 4500 5500 8500 2000 6000 7000 12000 53502011 3500 4500 5500 8500 2000 6000 7000 12000 55502012 3500 4500 5500 8500 2000 6000 7000 12000 5550

Changes in Federal Aid Policies
Focus on subsidized & unsubsidized federal loans (or“Staffords” pre-2010) that account for 82% of all federalstudent loans in 2012-2013
Ensuring Continued Access to Student Loans 2008 Act:increased additional unsubsidized loan limits by $2000 for allstudents
Sub. and Unsub. Loans Additional Unsubsidized Loans Pell GrantsYear Y1 Y2 Y3/Y4 Grad Y1-Y4(D) Y1/Y2(I) Y3/Y4(I) Grad Y1-Y4
2001 2625 3500 5500 8500 0 4000 5000 10000 33502002 2625 3500 5500 8500 0 4000 5000 10000 37502003 2625 3500 5500 8500 0 4000 5000 10000 40002004 2625 3500 5500 8500 0 4000 5000 10000 40502005 2625 3500 5500 8500 0 4000 5000 10000 40502006 2625 3500 5500 8500 0 4000 5000 10000 40502007 2625 3500 5500 8500 0 4000 5000 10000 40502008 3500 4500 5500 8500 0 4000 5000 12000 43102009 3500 4500 5500 8500 2000 6000 7000 12000 47312010 3500 4500 5500 8500 2000 6000 7000 12000 53502011 3500 4500 5500 8500 2000 6000 7000 12000 55502012 3500 4500 5500 8500 2000 6000 7000 12000 5550

Changes in Federal Aid Policies
Focus on subsidized & unsubsidized federal loans (or“Staffords” pre-2010) that account for 82% of all federalstudent loans in 2012-2013
Higher Education Opportunity 2008 Act and the EDappropriations: raised Pell Grant in 2002-03 and 2008-11
Sub. and Unsub. Loans Additional Unsubsidized Loans Pell GrantsYear Y1 Y2 Y3/Y4 Grad Y1-Y4(D) Y1/Y2(I) Y3/Y4(I) Grad Y1-Y4
2001 2625 3500 5500 8500 0 4000 5000 10000 33502002 2625 3500 5500 8500 0 4000 5000 10000 37502003 2625 3500 5500 8500 0 4000 5000 10000 40002004 2625 3500 5500 8500 0 4000 5000 10000 40502005 2625 3500 5500 8500 0 4000 5000 10000 40502006 2625 3500 5500 8500 0 4000 5000 10000 40502007 2625 3500 5500 8500 0 4000 5000 10000 40502008 3500 4500 5500 8500 0 4000 5000 12000 43102009 3500 4500 5500 8500 2000 6000 7000 12000 47312010 3500 4500 5500 8500 2000 6000 7000 12000 53502011 3500 4500 5500 8500 2000 6000 7000 12000 55502012 3500 4500 5500 8500 2000 6000 7000 12000 5550

Aggregate Pell Grants and Federal Loan Amounts
020
4060
80D
olla
rs, b
illion
s
2001 2002 2003 2004 2005 2006 2007 2008 2009 2010 2011 2012
Federal Student Loans (undergraduates only) Pell Grants
Sharp rise in federal loan and Pell Grants disbursementsaround changes in loan caps (Title IV)

Per-student Subsidized and Unsubsidized FederalStudent Loan Amounts
3000
3500
4000
4500
Dollars
2001 2002 2003 2004 2005 2006 2007 2008 2009 2010 2011 2012
Subsidized Unsubsidized
Subsidized and unsubsidized per-student loan amounts jumpat respective policy changes (Title IV, IPEDS)
In paper, show large shift in loan distribution amountspre/post-policies (FRBNY Equifax CCP)

Identifying effects through institution programexposures
How to achieve identification from an aggregate shock?
Student aid policy changes available to all universities buteligibility and participation differs
Use ex-ante student aid exposures to sort institutions beforechanges in maximums
Bartik-like measure of university i change in program caps:
Loans: LoanExpi︸ ︷︷ ︸% students at max for sub or unsub
×$∆LoanCapt
Pell Grants: PellExpi︸ ︷︷ ︸% students awarded any amount
×$∆PellGrantCapt

Data
NPSAS (National Postsecondary Student Aid Study):restricted-use ED dataset containing representative samples ofstudent-level aid characteristics from a sample of universities(2004, 2008 waves)
IPEDS (Integrated Postsecondary Education Data System):ED surveys of all T4 institutions (1987-), covering enrollment,aid, tuition
Title IV Administrative: Institutional-level data on amountof Title IV aid disbursed and number of aid awardees by loantype

Regression models
Two variables of interest:1. Response of tuition to interaction of institution exposure and
program caps
Caps are the policy variable of interest; coefficient measuressensitivity of tuition to relaxing borrowing constraint
2. Response of tuition to instrumented aid amounts
Economic variable of interest, but loan amounts are measuredwith error (e.g. include grad amounts)
If aid demand elasticities are high, results on tuition are similar

Baseline regression results
(1) (2) (3) (4)∆PellGrantsit ∆SubLoansit ∆UnsubLoansit ∆StickerTuitionit
PellGrantExpi ×∆PGCapt 1.152∗∗∗ -0.428∗∗∗ -0.459∗∗∗ 0.374∗∗
[0.09] [0.09] [0.12] [0.15]SubLoanExpi ×∆SLCapt 0.057 0.705∗∗∗ 0.153 0.579∗∗∗
[0.07] [0.12] [0.14] [0.17]UnsubLoanExpi ×∆USLCapt -0.039∗∗∗ 0.038 0.565∗∗∗ 0.167∗∗∗
[0.01] [0.02] [0.05] [0.04]
Inst&Year FE? Yes Yes Yes YesAdj R2 0.44 0.08 0.21 0.38N Obs 10060 9790 9750 10570
High elasticities wr/t own cap/exposure interactions (1)-(3);substitution effects with Pell Grants (2)-(3);
Large pass-through effects of caps on tuition; e.g. a $1subsidized cap increase → 60 cents tuition increase
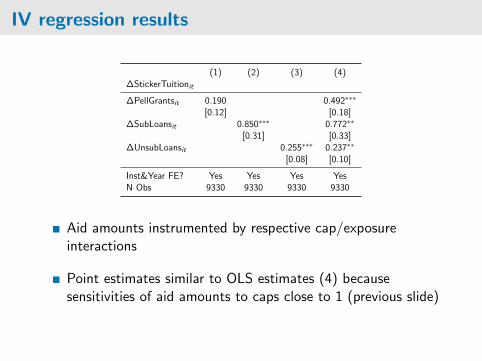
IV regression results
(1) (2) (3) (4)∆StickerTuitionit
∆PellGrantsit 0.190 0.492∗∗∗
[0.12] [0.18]∆SubLoansit 0.850∗∗∗ 0.772∗∗
[0.31] [0.33]∆UnsubLoansit 0.255∗∗∗ 0.237∗∗
[0.08] [0.10]
Inst&Year FE? Yes Yes Yes YesN Obs 9330 9330 9330 9330
Aid amounts instrumented by respective cap/exposureinteractions
Point estimates similar to OLS estimates (4) becausesensitivities of aid amounts to caps close to 1 (previous slide)

Institutional grants and enrollments
(1) (2) (3)∆InstGrantit ∆StickerTuitionit −∆InstGrantit 100×∆log(FTEit)
PellGrantExpi ×∆PGCapt -0.303∗∗ 0.411 0.016∗∗∗
[0.15] [0.26] [0.00]SubLoanExpi ×∆SLCapt -0.198∗ 0.875∗∗∗ -0.004
[0.12] [0.30] [0.00]UnsubLoanExpi ×∆USLCapt -0.038 0.153∗∗ -0.002∗∗∗
[0.04] [0.07] [0.00]
Inst&Year FE? Yes Yes YesAdj R2 0.03 0.02 0.05N Obs 5790 5580 10210
Substitution of institution student aid to Pell Grants andsubsidized loans amounts (1)
Enrollment lines up with subsidy levels: Pell Grants (↑),subsidized loans (=), unsubsidized loans (↓),

Robustness checks
Include institution characteristics interacted with the∆AidCapt and other controls
Placebo/parallel trends test: compare more-and-less-exposedinstitutions out of policy changes

Additional controls (Sticker tuition regression)
(1) (2) (3)
PellGrantExpi ×∆PGCapt 0.336∗∗ 0.176 0.002[0.16] [0.24] [0.20]
SubLoanExpi ×∆SLCapt 0.575∗∗∗ 0.459∗∗ 0.447∗∗
[0.18] [0.21] [0.20]UnsubLoanExpi ×∆USLCapt 0.164∗∗∗ 0.002 0.089∗
[0.04] [0.06] [0.05]∆2StateFundingit -0.049∗∗∗
[0.01]∆2FederalFundingit -0.002
[0.01]∆2OtherFundingit 0.002
[0.01]∆2PrivateFundingit -0.006∗∗∗
[0.00]
Inst&Year FE? Yes Yes YesForProfiti ×∆Capst Yes Yes YesFour-yeari ×∆Capst No Yes NoAdmitRate04i ×∆Capst No Yes NoEFC04i ×∆Capst No Yes NoTuition04i ×∆Capst No Yes No
Results not driven by for-profits (1), only subsidized loansrobust to caps-interactions (2) and alternative funding (3)

Robustness checks
Include institution characteristics interacted with the∆AidCapt and other controls
Placebo/parallel trends test: compare more-and-less-exposedinstitutions out of policy changes

Parallel trends assumption
For aid type a, study exposure loading over time rather thanjust interacted with the policy cap change → placebo effect
∆Yit =∑t
ξat ExpFedAidai+∑α 6=a
βαExpFedAidαi×∆CapFedAidαt+. . .+εit .

Parallel trends assumption
For aid type a, study exposure loading over time rather thanjust interacted with the policy cap change → placebo effect
∆Yit =∑t
ξat ExpFedAidai+∑α 6=a
βαExpFedAidαi×∆CapFedAidαt+. . .+εit .
Subsidized loan exposure: ∆Subsidized loans
-.50
.51
1.5
ξ
-500
050
010
0015
00M
ean
expo
sure
X A
ctua
l Δ p
olic
y ca
p (d
olla
rs)
2002 2004 2006 2008 2010 2012
Actual Δ policy cap Cross-sectional coefficient ξ

Parallel trends assumption
For aid type a, study exposure loading over time rather thanjust interacted with the policy cap change → placebo effect
∆Yit =∑t
ξat ExpFedAidai+∑α 6=a
βαExpFedAidαi×∆CapFedAidαt+. . .+εit .
Subsidized loan exposure: ∆Sticker tuition
-.50
.51
1.5
ξ
-500
050
010
0015
00M
ean
expo
sure
X A
ctua
l Δ p
olic
y ca
p (d
olla
rs)
2002 2004 2006 2008 2010 2012
Actual Δ policy cap Cross-sectional coefficient ξ

Parallel trends assumption
For aid type a, study exposure loading over time rather thanjust interacted with the policy cap change → placebo effect
∆Yit =∑t
ξat ExpFedAidai+∑α 6=a
βαExpFedAidαi×∆CapFedAidαt+. . .+εit .
Subsidized loans pass the placebo test; unclear thatunsubsidized loans pass test for tuition
Pell Grants do not pass the placebo test for tuition

Additional results
Split samples: Loan effect most pronounced at expensive (sub& unsub) as well as private & less-than-4y programs (sub)
For-profits under-represented in NPSAS:
Stock market responses of for-profits on days when aidlegislation passesUnusual tuition increase of for-profits in years of policychanges vs others
Pre-policy trends:Drop fixed effects and study 2002-07 institution changes interms of 2002 reliance on aid
More aid dependence associated with higher enrollments andfuture aid growthTuition effects for loan aid

Conclusions
Study response of college tuition to the federal student aidexpansion ⇒ Support for the Bennett hypothesis
Abnormal tuition increases for institutions where students aremost responsive to changes in aid caps:
Loans (esp. subsidized) but results not robust for Pell Grants
Benefit incidence/public policy:
In the short run, higher loan caps can be costly to studentsbecause of aggregate demand effectsIn the long run, benefits may result in the form of highercapacity and improved education quality