credit europe bank n.v. · interest paid (187,526) (195,419) income tax paid (2,854) (4,834) net...
TRANSCRIPT

Credit Europe Bank N.V.
Condensed Consolidated
Interim Financial Statements
June 30, 2017

2
TABLE OF CONTENTS
Page ------
Consolidated Financial Statements
Consolidated Statement of Financial Position 3
Consolidated Statement of Income 4
Consolidated Statement of Comprehensive Income 5
Consolidated Statement of Changes in Equity 6
Consolidated Statement of Cash Flows 8
Corporate Information 9
Basis of Preparation 10
Notes to Consolidated Financial Statements 13

CREDIT EUROPE BANK N.V.
CONSOLIDATED STATEMENT OF FINANCIAL POSITION As of June 30, 2017 In thousands of EURO unless otherwise indicated
3
BS1 Notes June 30, 2017 December 31, 2016*
Assets
Cash and balances at central banks 4 595,134 1,041,371 Financial assets at fair value through profit or loss 5 40,146 2,712 Financial investments 6 661,981 767,109 Loans and receivables - banks 7 443,059 306,666 Derivative financial instruments 8 330,530 344,393 Loans and receivables - customers 9 4,967,820 5,188,004 Current tax assets 932 8,690 Deferred tax assets 20,290 23,738 Other assets 11 130,951 156,672 Equity accounted investments 5,836 5,803 Property and equipment 291,766 252,333 Intangible assets 12,888 13,014 Total assets 7,501,333 8,110,505
Liabilities
Due to banks 12 540,422 448,317 Derivative financial instruments 8 298,123 374,706 Due to customers 13 5,122,607 5,531,531 Issued debt securities 14 118,278 262,977 Current tax liabilities 12,602 7,541 Other liabilities 15 54,781 53,468 Deferred tax liabilities 37,581 36,881 Total liabilities (excluding subordinated liabilities) 6,184,394 6,715,421
Subordinated liabilities 16 445,881 531,326 Total liabilities 6,630,275 7,246,747
Equity
Equity attributable to owners of the Company 869,129 861,892 Equity attributable to non-controlling interests 1,929 1,866 Total equity 17 871,058 863,758
Total equity and liabilities 7,501,333 8,110,505
Commitment and contingencies 29 976,422 1,193,939 *As restated. Reference is made to Note 2 ‘Basis of preparation’

CREDIT EUROPE BANK N.V.
CONSOLIDATED STATEMENT OF INCOME For the period ended June 30, 2017 In thousands of EURO unless otherwise indicated
4
IS1 Notes
January 1- June
30, 2017
January 1- June
30, 2016
Interest and similar income 245,074 267,120
Interest expense and similar charges (111,674) (114,357) Results on risk management derivatives, not designated in hedge accounting relationship 10,188 (39,173)
Net interest income 18 143,588 113,590
Fees and commissions income 59,005 51,332
Fees and commissions expense (30,769) (22,331)
Net fee and commission income 19 28,236 29,001
Net trading income 20 (12,977) 10,577
Results from financial transactions 21 2,308 9,156
Other operating income 23 21,205 17,699
Operating income 10,536 37,432
Net impairment loss on financial assets 10 (51,803) (66,510)
Net operating income 130,557 113,513
Personnel expenses 23 (53,761) (48,578)
General and administrative expenses 24 (34,047) (31,046)
Depreciation and amortization (10,308) (9,621)
Other operating expenses 25 (13,884) (3,542)
Other impairment losses 26 452 (1,822)
Total operating expenses (111,548) (94,609)
Share of profit of associate 178 253
Operating profit before tax 19,187 19,157
Income tax expense (7,688) 863
Profit for the period 11,499 20,020
Profit for the period attributable to:
Equity owners of the Company 11,450 19,954
Non-controlling interests 49 66

CREDIT EUROPE BANK N.V.
CONSOLIDATED STATEMENT OF COMPREHENSIVE INCOME For the period ended June 30, 2017 In thousands of EURO unless otherwise indicated
5
OCI 1
January 1-
June 30, 2017
January 1-
June 30, 2016
Profit for the period
11,499 20,020
Other comprehensive income that will be reclassified to the income
statement
Foreign currency translation:
Net gain on hedge of net investments
4,126 (40,011) Exchange differences on translations on foreign operations
(22,829) 28,483
Net foreign currency translation
(18,703) (11,528)
Cash flow hedges:
Net gain / loss arising during the year
1,838 (68) Less: Reclassification adjustments to the income statement
(631) (43) Income tax relating to the cash flow hedges
(241) 21
Net gain on cash flow hedges
966 (90)
Available for sale financial assets:
Net gain / loss arising during the year
19,128 591 Reclassification adjustments to the income statement
(1,998) (5,087) Income tax gain (charge)/ relating to net unrealized losses on available for sale financial assets (3,709) 723
Net change on available for sale financial assets
13,421 (3,773)
Other comprehensive income that will not be reclassified to the income
statement
Tangible assets:
Income tax relating to tangible assets revaluation
117 23
Net tangible assets revaluation reserve
117 23
Other comprehensive income for the period, net of tax
(4,199) (15,368)
Total comprehensive income for the period, net of tax
7,300 4,652
Attributable to: Equity holders of the parent
7,237 4,639 Non-controlling interest
63 13

CREDIT EUROPE BANK N.V.
CONSOLIDATED STATEMENT OF CHANGES IN EQUITY For the period ended June 30, 2017 In thousands of EURO unless otherwise indicated
6
Attributable to equity owners of the Company
EQ1 Issued
capital
Share
premium
Retained
earnings
Fair
value
reserve
Net
investment
hedge
reserve
Cash
flow
hedge
reserve
Translation
reserve Total
Non-
controlling
interest
Total
equity
At January 1, 2017* 632,464 163,748 460,461 (9,071) (118,581) (1,230) (265,899) 861,892 1,866 863,758
Total comprehensive income
Change in fair value reserve - - - 13,401 - - - 13,401 20 13,421
Change in translation reserve - - - - - - (22,823) (22,823) (6) (22,829)
Change in net investment hedge reserve - - - - 4,126 - - 4,126 - 4,126
Change in cash flow hedge reserve - - - - - 966 - 966 - 966
Change in tangible assets revaluation reserve - - 117 - - - - 117 - 117
Profit for the period - - 11,450 - - - - 11,450 49 11,499
Total comprehensive income - - 11,567 13,401 4,126 966 (22,823) 7,237 63 7,300
At June 30, 2017 632,464 163,748 472,028 4,330 (114,455) (264) (288,722) 869,129 1,929 871,058
*As restated. Reference is made to Note 2 ‘Basis of preparation’

CREDIT EUROPE BANK N.V.
CONSOLIDATED STATEMENT OF CHANGES IN EQUITY For the period ended June 30, 2017 In thousands of EURO unless otherwise indicated
7
Attributable to equity owners of the Company
EQ2 Issued
capital
Share
premium
Retained
earnings
Fair value
reserve
Net
investment
hedge
reserve
Cash flow
hedge
reserve
Translation
reserve Total
Non-
controlling
interest
Total
equity
At January 1, 2016 632,464 163,748 436,830 201 (31,994) 646 (328,852) 873,043 1,834 874,877
Total comprehensive income
Change in fair value reserve - - - (3,737) - - - (3,737) (36) (3,773)
Change in translation reserve - - - - - - 28,500 28,500 (17) 28,483
Change in net investment hedge reserve - - - - (40,011) - - (40,011) - (40,011)
Change in cash flow hedge reserve - - - - - (90) - (90) - (90)
Change in tangible assets revaluation reserve - - 23 - - - - 23 - 23
Profit for the period - - 19,954 - - - - 19,954 66 20,020
Total comprehensive income - - 19,977 (3,737) (40,011) (90) 28,500 4,639 13 4,652
At June 30, 2016 632,464 163,748 456,807 (3,536) (72,005) 556 (300,352) 877,682 1,847 879,529

CREDIT EUROPE BANK N.V.
CONSOLIDATED STATEMENT OF CASH FLOWS For the period ended June 30, 2017 In thousands of EURO unless otherwise indicated
8
CF1 Notes
January 1-
June 30, 2017
January 1- June
30, 2016
Cash flows from operating activities
Profit for the period 11,499 20,020
Adjustments for:
Net impairment loss on financial assets 10 51,803 66,510 Depreciation and amortization 10,308 9,621 Other impairment losses 26 (452) 1,822 Income tax expense 7,688 (863) Net interest income 18 (143,588) (113,590)
(62,742) (16,480)
Changes in:
Financial assets at fair value through profit or loss (1,696) 322 Financial investments 8,332 (12,938) Loans and receivables - banks (79,511) (96,328) Loans and receivables - customers 128,879 1,086 Other assets 8,249 211,130 Due to banks 92,105 194,586 Due to customers (408,924) (310,173) Other liabilities (86,624) (176,298)
(339,190) (188,613)
Interest received 335,684 315,035 Interest paid (187,526) (195,419) Income tax paid (2,854) (4,834)
Net cash used in operating activities (256,628) (90,311)
Cash flows from investing activities
Acquisition of financial investments and financial assets at fair value through profit or loss 5,6 (2,106,934) (2,152,029) Proceeds from sales of financial investments and financial assets at fair value through profit or loss 5,6 2,181,392 2,278,222 Acquisition of property and equipment (61,675) (3,649) Proceeds from sale of property and equipment 85 192
Acquisition of intangibles (2,698) (2,508)
Net cash used in investing activities 10,170 120,228
Cash flows from financing activities
Proceeds from the issue of debt securities 6,800 84,095 Repayment of long-term funding (202,012) (234,726)
Net cash from financing activities (195,212) (150,631)
Net change in cash and cash equivalents
Cash and cash equivalents at January 1 1,041,371 532,139
Effect of exchange rate fluctuations on cash and cash equivalents held (4,567) 5,190
Cash and cash equivalents at June 30 4 595,134 416,615

CREDIT EUROPE BANK N.V.
NOTES TO CONSOLIDATED FINANCIAL STATEMENTS As of and for the period ended June 30, 2017 In thousands of EURO unless otherwise indicated
9
1. Corporate information
General
Credit Europe Bank N.V., herein after ‘the Bank’, is domiciled in Amsterdam, the Netherlands. Credit Europe Bank N.V. comprises four branches in the Netherlands, Germany, Belgium and Malta. The Consolidated Financial Statements of the Bank as of June 30, 2017, comprise the figures of the Bank, its subsidiaries and other controlled entities. Together they are referred to as the ‘Bank’.
The Bank was founded as a specialized trade-finance bank, which aimed to actively participate in the wholesale financing of international trade. In later years, the Bank started retail-banking activities, including savings accounts, mortgage loans, consumer loans, credit cards and leasing activities.
The Bank’s registered office is Karspeldreef 6A, 1101 CJ Amsterdam, Netherlands.
Changes to the Group There is no significant change to the Group within 2017.

CREDIT EUROPE BANK N.V.
NOTES TO CONSOLIDATED FINANCIAL STATEMENTS As of and for the period ended June 30, 2017 In thousands of EURO unless otherwise indicated
10
2. Basis of preparation
The Bank’s condensed consolidated interim financial statements as of June 30, 2017 have been prepared in accordance with IAS 34 “Interim Financial Reporting”. The condensed consolidated interim financial statements do not include all the information and disclosures required in the annual financial statements and should be read in conjunction with the Bank’s 2016 consolidated annual financial statements which have been prepared in accordance with the International Financial Reporting Standards (IFRS) as adopted by the European Union (EU) and accounting principles in Netherlands as embodied in Part 9 of Book 2 of the Netherlands Civil Code.
The accounting policies applied by the Bank in these condensed consolidated interim financial statements are the same as those applied by the Bank in its consolidated financial statements as at and for the year ended December 31, 2016.
These interim financial statements were authorized for issue by the Bank’s Managing Board and the Supervisory Board on September 15, 2017.
Use of estimates and judgments
The preparation of interim financial statements in conformity with IFRS requires the Bank’s management to make judgments, estimates and assumptions that affect the application of policies, and the reported amounts of assets and liabilities, income and expenses. Actual results may differ from these estimates.
The significant judgments made by management in applying the Group’s accounting policies and the key sources of estimation uncertainty were the same as those that applied to the consolidated financial statements as at and for the year ended 31 December 2016.
For estimates used when measuring the fair values of financial instruments refer to Note 28.
Going concern
The Bank adopted going concern assumption in preparation of the condensed consolidated interim financial statements.
Correction of error
The Bank’s wholly owned subsidiary Maritime Enterprises B.V. holds equity shares of a company which were classified as available-for-sale assets at initial recognition. Per approval of the shareholders to sell the aforementioned equity shares classified as available for sale by the end of year 2016 and the Sales and Purchase Agreement signed in January 2017, the shares were derecognized as of 31 December 2016. The Bank recognized a receivable for the sale consideration, a payable for the cost to sell and recycled the other comprehensive income through profit and loss as of 31 December 2016.
The Bank reassessed its accounting treatment in the current period and concluded that the shares should not have been derecognized in 2016 in accordance with IAS 39. Therefore, the Bank restated its prior period comparative financial statements through reversing the impact of derecognition of the shares from the relevant financial statement line items as below. There is no impact on the opening financial statements as of 1 January 2016 and on the financial statements as of 30 June 2016 as the shares were derecognized as of 31 December 2016. The restatement will result in a decrease of net result of EUR 11,274 and an increase of fair value reserves of EUR 11,274 in respect of the second half year 2016.

CREDIT EUROPE BANK N.V.
NOTES TO CONSOLIDATED FINANCIAL STATEMENTS As of and for the period ended June 30, 2017 In thousands of EURO unless otherwise indicated
11
Effect on balance sheet as at 31 December 2016:
2016
before restatement Restatement
2016
after restatement
Financial investments 741,009 26,100 767,109 Other assets 186,672 (30,000) 156,672 Total assets 8,114,405 (3,900) 8,110,505
Other liabilities 57,368 (3,900) 53,468 Total liabilities 7,250,647 (3,900) 7,246,747
Retained earnings 471,735 (11,274) 460,461 Fair value reserve (20,345) 11,274 (9,071) Total equity 863,758 - 863,758
New standards and interpretations not yet adopted
A number of new standards and amendments to standards are effective for annual periods beginning after 1 January 2017; however, the Bank has not applied the following standards in preparing these consolidated financial statements.
IFRS 9: Financial Instruments
IFRS 9, published in July 2014, replaces the existing guidance in IAS 39 Financial Instruments Recognition and Measurement. IFRS 9 includes revised guidance on the classifications and measurement of the financial instruments, including a new expected credit loss model for calculating impairment on financial assets and the new general hedge accounting requirements. It also carries forward the guidance on recognition and derecognition of financial instruments from IAS 39.
IFRS 9 is effective for annual reporting periods beginning on or after 1 January 2018, with early adoption permitted. The group is assessing the potential impact on its consolidated financial statements resulting from the application of IFRS 9. Given the nature of Bank`s operations, this standard is expected to have a significant impact on the Bank`s financial statements, which is summarized as follows:
Classification and measurement
Classification and measurement of financial assets dependent on two criteria: how the Bank manages them, and the type of contractual cash flows in these assets. Both criteria are used to determine whether the financial assets are accounted for at amortised cost, at fair value through comprehensive income or through profit or loss. The combination of these two criteria (business model and contractual cash flow characteristics) may result in some differences in the composition of financial assets as compared to IAS 39. The Bank currently expects the majority of the balance sheet to remain in the current measurement categories.
The classification and measurement of financial liabilities under IFRS 9 remains the same as under IAS 39 with the exception of gains and losses relating to the entity’s own credit risk from financial liabilities designated at fair value, which is currently not applicable to the Bank.

CREDIT EUROPE BANK N.V.
NOTES TO CONSOLIDATED FINANCIAL STATEMENTS As of and for the period ended June 30, 2017 In thousands of EURO unless otherwise indicated
12
Hedge accounting
Although the general accounting mechanisms will largely remain unchanged, IFRS 9 introduces some differences (such as prohibition of voluntary de-designation of the hedge relationship, replacement of 80%-125% effectiveness testing with more principle-based requirements, introduction of accounting solution for cross-currency basis spread) to current IAS 39 methodology. The Bank does not expect a significant impact from the upcoming changes.
Impairments
The Bank is in transition to IFRS 9 and the group-wide implementation project combining Risk, Finance and IT departments is underway. New IFRS 9 impairment rules, driven by the expected credit losses rather than IAS 39’s incurred loss approach, are expected to lead to higher loan loss allowances as from 1 January 2018. Regarding the regulatory capital calculation, the five year transitionary arrangement (a proposal under discussion at the Council of the European Union: 2016/0360 (COD)) is expected to mitigate the impact on own funds requirements.
IFRS 15: Revenue from Contracts with Customers
IFRS 15 establishes a comprehensive framework for determining whether, how much and when revenue is recognised. It replaces existing revenue recognition guidance including IAS 18 Revenue, IAS 11 Construction Contracts and IFRIC 13 Customer Loyalty Programmes.
IFRIC 15 is effective for annual reporting periods beginning on or after 1 January 2018, with early adoption permitted. The Bank is assessing the potential impact on its consolidated financial statements resulting from the application of IFRS 15.
IFRS 16: Leases
In January 2016, the IASB issued IFRS 16 ‘Leases’ the new accounting standard for leases. The new standard is effective for annual periods beginning on or after 1 January 2019 and will replace IAS 17 ‘Leases’ and IFRC 4 ‘Determining whether an Arrangement contains a Lease’. Early adoption is permitted for companies that also apply IFRS 15 ‘Revenue from Contracts with Customers’. IFRS 16 is not yet endorsed by the EU. The new standard removes the classification of leases as either operating leases or finance leases, resulting in all leases for lessees being treated comparable to finance leases. All leases will be recognised on the balance sheet with the exception of short-term leases with a lease term of less than 12 months and leases of low-value assets (for example tablets or personal computers. The main reason for this change is to increase comparability between companies and increase the visibility of these types of assets and liabilities. Lessor accounting remains largely unchanged. The standard permits a lessee to choose either a full retrospective or a modified retrospective transition approach as well as some practical transitional relieves. The Bank is yet to assess the impact of this standard.

CREDIT EUROPE BANK N.V.
NOTES TO CONSOLIDATED FINANCIAL STATEMENTS As of and for the period ended June 30, 2017 In thousands of EURO unless otherwise indicated
13
Notes to Consolidated Financial Statements
3. Segment information Segment information is presented in respect of the Bank’s operating segments, for which the Bank assesses performance and accordingly makes resource allocations.
The Bank has seven (2016: seven) reportable segments (described below), which are the Bank’s strategic areas of operation. The strategic areas offer banking and banking related products, and are managed separately to take account of local economic environments, which require different risk management and pricing strategies. For each of the strategic areas, the CFO reviews internal management reports on at least a monthly basis. The following summary describes the operation of each of the Bank’s reportable segments:
• Western Europe retail: includes retail loans and funds entrusted by retail customers in Western Europe, including Germany, the Netherlands and Belgium.
• Western Europe wholesale: includes loans to non-retail customers and funds entrusted by non-retail customers in the Netherlands, Germany, Belgium, Malta and Switzerland.
• Russia retail: includes retail loans and funds entrusted from retail customers in Russia.
• Russia wholesale: includes loans to non-retail customers, funds entrusted from non-retail customers and vehicle operating lease services in Russia.
• Romania retail: includes retail loans and funds entrusted from retail customers in Romania.
• Romania wholesale: includes loans to non-retail customers and funds entrusted from non-retail customers in Romania.
• Other: includes Bank’s operations in Dubai, Ukraine and Turkey.
Measurement of segment assets and liabilities, and segment income and results is based on the Bank’s accounting policies. Inter-segment pricing is determined on an arm’s length basis. Segment results, assets and liabilities include items directly attributable to a segment as well as those that can be allocated on a reasonable basis.

CREDIT EUROPE BANK N.V.
NOTES TO CONSOLIDATED FINANCIAL STATEMENTS As of and for the period ended June 30, 2017 In thousands of EURO unless otherwise indicated
14
3. Segment information (continued)
June 30, 2017
SGMNT1 West Europe West Europe Russia Russia Romania Romania Column1 Column2
Retail Wholesale Retail Wholesale Retail Wholesale Other Total
Interest income – external 3,316 105,844 81,961 27,105 12,172 8,351 6,325 245,074 Interest income – other segments - 11,863 - 8,705 - 583 940 22,091 Interest revenue 3,316 117,707 81,961 35,810 12,172 8,934 7,265 267,165
Interest expenses – external - (53,369) (43,215) (8,517) (2,434) (3,278) (861) (111,674) Interest expense – other segments - (14,746) - (4,378) - (1,025) (1,942) (22,091) Interest expense - (68,115) (43,215) (12,895) (2,434) (4,303) (2,803) (133,765)
Results on risk management derivatives, not designated in hedge accounting relationship - 12,614 - 740 - 466 (3,632) 10,188 Net interest income 3,316 62,206 38,746 23,655 9,738 5,097 830 143,588
Net commission income – external 41 12,140 8,874 2,646 3,468 633 434 28,236 Net commission income – other segments - (1,597) - - 1,600 4 (7) - Trading and other income 611 (10,654) 7,986 4,135 320 4,600 3,538 10,536 Trading and other income– other segments - - - - - - - - Net impairment loss on financial assets (1,078) (7,935) (19,212) (8,599) (11,419) (2,926) (634) (51,803) Depreciation and amortization expense (134) (4,283) (2,724) (601) (866) (563) (1,137) (10,308) Other operating expenses (1,412) (35,091) (36,615) (8,056) (10,479) (6,887) (2,700) (101,240) Equity accounted earnings - - - - - - 178 178 Operating profit before taxes 1,344 14,786 (2,945) 13,180 (7,638) (42) 502 19,187
Income tax expense (497) (8,262) 734 (3,344) 3,951 (125) (145) (7,688) Profit for the period 847 6,524 (2,211) 9,836 (3,687) (167) 357 11,499
Other information at 30 June 2017 -
Financial position 0 Total assets 108,788 4,570,573 742,036 737,206 380,589 744,467 217,674 7,501,333 Total liabilities 3,002,627 1,562,774 829,797 362,836 321,848 451,483 98,910 6,630,275 Equity accounted investments - - - - - - 5,836 5,836 Other information at 30 June 2017 - Income
statement 0 Reversal of impairment allowances no longer required 138 736 2,676 3,859 - 192 504 8,105

CREDIT EUROPE BANK N.V.
NOTES TO CONSOLIDATED FINANCIAL STATEMENTS As of and for the period ended June 30, 2017 In thousands of EURO unless otherwise indicated
15
3. Segment information (continued)
June 30, 2016
SGMNT2 West Europe West Europe Russia Russia Romania Romania Column1 Column2
Retail Wholesale Retail Wholesale Retail Wholesale Other Total
Interest income – external 4,682 131,136 61,906 33,424 15,880 11,072 9,020 267,120 Interest income – other segments - 17,125 - 8,766 - 1,964 1,118 28,973 Interest revenue 4,682 148,261 61,906 42,190 15,880 13,036 10,138 296,093
Interest expenses – external 87 (57,784) (32,688) (17,965) (5,411) 424 (1,020) (114,357) Interest expense – other segments - (17,426) - (5,102) - (4,259) (2,186) (28,973) Interest expense 87 (75,210) (32,688) (23,067) (5,411) (3,835) (3,206) (143,330)
Results on risk management derivatives, not designated in hedge accounting relationship - (34,834) - (2,030) (517) (1,240) (552) (39,173) Net interest income 4,769 38,217 29,218 17,093 9,952 7,961 6,380 113,590
Net commission income – external (17) 12,268 9,131 2,423 3,741 817 638 29,001 Net commission income – other segments - (2,115) - - 2,116 (1) - - Trading and other income 464 15,279 5,970 5,200 6,054 2,611 1,854 37,432 Trading and other income– other segments - - - - - - - - Net impairment loss on financial assets (626) (11,286) (27,843) (2,446) (16,744) (3,073) (4,492) (66,510) Depreciation and amortization expense (244) (2,229) (2,652) (1,884) (865) (603) (1,144) (9,621) Other operating expenses (2,378) (26,205) (27,204) (7,054) (11,478) (7,610) (3,059) (84,988) Equity accounted earnings - - - - - - 253 253 Operating profit before taxes 1,968 23,929 (13,380) 13,332 (7,224) 102 430 19,157
Income tax expense 94 4,704 588 (1,037) (2,583) (627) (276) 863 Profit for the year 2,062 28,633 (12,792) 12,295 (9,807) (525) 154 20,020
Other information at 31 December 2016 -
Financial position
Total assets 138,977 5,071,994 836,979 669,175 410,619 742,699 240,062 8,110,505 Total liabilities 3,339,934 1,827,446 777,149 428,269 313,048 438,670 122,231 7,246,747 Equity accounted investments - - - - - - 5,803 5,803 Other information at 30 June 2016 - Income
statement
Reversal of impairment allowances no longer required - - 3,629 3,883 - 422 16 7,950

CREDIT EUROPE BANK N.V.
NOTES TO CONSOLIDATED FINANCIAL STATEMENTS As of and for the period ended June 30, 2017 In thousands of EURO unless otherwise indicated
16
4. Cash and balances at central banks
This item includes cash on hand and deposits with central banks in countries in which the Bank has a presence.
FN_CB1 June 30, 2017 December 31,
2016
Balances with central banks 538,612 978,059 Cash on hand 56,522 63,312 Total 595,134 1,041,371
Deposits at central banks include reserve deposits amounting to EUR 92,127 (2016: EUR 96,903), which represents the mandatory deposit and is not available in the Bank’s day-to-day operations.
5. Financial assets at fair value through profit or loss
xc June 30, 2017 December 31,
2016
Financial assets held for trading
Trading loans 34,778 - Bank bonds 2,479 1,630 Corporate bonds 1,537 - Equity instruments 1,168 1,082 Government bonds 184 -
Total 40,146 2,712
As of June 30, 2017, EUR 5,368 (2016: EUR 2,712) of the total is listed securities. As of June 30, 2017, there is no financial asset that has been sold or re-pledged under repurchase agreements (2016: none ).
Gains and losses on changes in fair value of trading instruments are recognized in ‘net trading income’.
FN_AFS_MOV1 June 30, 2017
December 31,
2016
Balance at the beginning of the year 2,712 7,578
Additions 964,923 638,953
Disposals (sale and redemption) (929,185) (643,695)
Net changes in fair value 1,822 (173) Exchange differences (126) 49 Balance at the end of the period 40,146 2,712

CREDIT EUROPE BANK N.V.
NOTES TO CONSOLIDATED FINANCIAL STATEMENTS As of and for the period ended June 30, 2017 In thousands of EURO unless otherwise indicated
17
6. Financial investments
FN_AFS1 June 30, 2017 December 31,
2016*
Available-for-sale financial investments 661,981 767,109 Total 661,981 767,109
*As restated. Reference is made to Note 2 ‘Basis of preparation’ As of June 30, 2017, the fair value of financial assets that have been sold or re-pledged under repurchase agreements is EUR 175,736 (2016: EUR 6,301). These transactions are conducted under terms that are normal and customary to standard lending, and securities borrowing and lending activities, as well as requirements determined by exchanges where the Bank acts as an intermediary.
FN_AFS2 June 30, 2017 December 31, 2016
Available-for-sale portfolio
Government bonds 429,279 437,249 Bank bonds 193,616 267,036 Equities 28,978 28,084 Corporate bonds 10,108 13,921 Trading loans - 20,819
Total 661,981 767,109
As of June 30, 2017, EUR 635,759 (2016: EUR 688,613) of the total is listed securities and EUR 122 (2016: EUR 52,396) is non-listed financial instruments.
The movement in available-for-sale portfolio may be summarized as follows:
FN_AFS_MOV1 June 30, 2017
December 31,
2016
Balance at the beginning of the year 767,109 1,022,454
Additions 1,142,011 3,049,325 Disposals (sale and redemption) (1,252,207) (3,323,266) Net changes in fair value 16,817 (12,331) Exchange differences (11,749) 30,927
Balance at the end of the period 661,981 767,109
7. Loans and receivables - banks
LAR1 June 30, 2017
December 31,
2016
Placements with other banks 441,016 297,463 Loans and advances 2,968 10,128 Subtotal 443,984 307,591
Allowance for impairment (925) (925) Total 443,059 306,666
Placements with other banks that are not available in the Bank’s day-to-day operations amount to EUR 99,982 (2016: EUR 184,688).

CREDIT EUROPE BANK N.V.
NOTES TO CONSOLIDATED FINANCIAL STATEMENTS As of and for the period ended June 30, 2017 In thousands of EURO unless otherwise indicated
18
8. Derivative financial instruments
In the ordinary course of business, the Bank enters into various types of transactions that involve derivative financial instruments. A derivative financial instrument is a financial contract between two parties where payments depend on movements in price in one or more underlying financial instruments, reference rates or indices. Derivative financial instruments include forwards, swaps, futures, credit default swaps and options. The table below shows the fair values of derivative financial instruments, recorded as assets and liabilities, together with their notional amounts. The notional amount, recorded gross, is the amount of a derivative’s underlying asset, reference rate or index, and is the basis on which changes in the value of derivatives are measured. The notional amounts indicate the volume of transactions outstanding at the year-end and are indicative of neither the market nor the credit risk.
FN_DER1 Column1 Column2 June 30,
2017 Column4 1 December 31,
2016
Nominal
Amounts
Fair values -
assets
Fair values -
liabilities
Nominal
Amounts
Fair values -
assets
Fair values -
liabilities
Derivatives held for trading Interest rate derivatives
Swaps 7,201 - 171 35,651 43 502 Futures 23,596 93 126 19,987 16 10 Options (purchased) 89,117 578 - 23,140 - - Options (sold) (94,117) - 582 (28,140) - - Subtotal 25,797 671 879 50,638 59 512
Currency derivatives
Swaps 5,178,384 184,127 167,322 5,231,378 154,386 178,535 Forwards 770,458 14,139 14,296 903,660 11,360 12,466 Options (purchased) 2,236,813 89,954 14 1,964,794 108,361 19 Options (sold) (2,228,517) 15 95,476 (1,955,155) 19 115,722 Subtotal 5,957,138 288,235 277,108 6,144,677 274,126 306,742
Other derivatives
Equity options (purchased) 125,386 2,565 - 118,583 4,833 - Equity options (sold) (125,386) - 2,566 (118,583) - 4,833 Commodity swaps - - - 10,389 1,157 915 Subtotal - 2,565 2,566 10,389 5,990 5,748
Total derivatives 5,982,935 291,471 280,553 6,205,704 280,175 313,002
Derivative financial instruments held or issued for trading purposes: Most of the Bank’s derivative trading activities relate to asset and liability management of the Bank and deals with customers who are normally laid off with counterparties. The Bank may also take positions with the expectation of profiting from favourable movements in prices, rates on indices. Forwards and futures: Forwards and futures contracts are contractual agreements to buy or sell a specified financial instrument at a specific price and date in the future. Forwards are customized contracts transacted in the over-the-counter market. Futures contracts are transacted in standardized amounts on regulated exchanges and are subject to daily cash margin requirements. Swaps: Swaps are contractual agreements between two parties to exchange movements in interest or foreign-currency rates, commodities or equity indices based on specified notional amounts. Options: Options are contractual agreements that convey the right, but not the obligation for the purchaser, either to buy or sell a specific amount of a financial instrument at a fixed price, either at a fixed future date or at any

CREDIT EUROPE BANK N.V.
NOTES TO CONSOLIDATED FINANCIAL STATEMENTS As of and for the period ended June 30, 2017 In thousands of EURO unless otherwise indicated
19
time within a specified period.
Fair value hedges
The Bank uses interest rate swaps to hedge its exposure to changes in fair values of its fixed income portfolio and cross-currency swaps to hedge its exposure to market interest rates on certain loans and advances.
The fair value of derivatives designated as fair value hedges are as follows:
FN_DER2 Column1 Column2 June 30,
2017 Column3 Column12 December
31, 2016
Nominal
Amounts
Fair values
-assets
Fair values
-liabilities
Nominal
Amounts
Fair values -
assets
Fair values -
liabilities
Instrument type:
Interest rate swaps 84,138 396 - - - - Currency swaps (234,118) - 1,086 (209,609) 846 68 Total (149,980) 396 1,086 (209,609) 846 68
During 2017, there is not any loss relating to the ineffective portion of fair value hedges was recognized in the income statement (2016: None).
Net investment hedges
The Bank uses a mixture of foreign exchange contracts to hedge the foreign currency translation risk on its net investment in foreign subsidiaries.
The fair value of derivatives designated as net investment hedges is as follows:
FN_DER3 Column1 Column2 June 30,
2017 Column3 Column12 December
31, 2016
Nominal
Amounts
Fair values -
assets
Fair values
-liabilities
Nominal
Amounts
Fair values -
assets
Fair values
-liabilities
Instrument type:
Currency swaps 873,028 22,494 16,042 937,504 29,188 35,045 Total 873,028 22,494 16,042 937,504 29,188 35,045
During 2017, EUR 15 loss relating to the ineffective portion of net investment hedges was recognized in the income statement (2016: EUR 8 loss).
Cash flow hedges
The Bank uses cross-currency swaps to hedge part of its foreign currency risk related with USD denominated assets. The fair value of derivatives designated as cash flow hedge is as follows:
FN_DER4 Column1 Column2 June 30,
2017 Column3 Column12 December
31, 2016
Nominal
Amounts
Fair values -
assets
Fair values
-liabilities
Nominal
Amounts
Fair values -
assets
Fair values
-liabilities
Instrument type:
Currency swaps 184,974 16,169 442 293,402 34,184 26,591 Total 184,974 16,169 442 293,402 34,184 26,591
During 2017 no losses relating to the ineffective portion of cash flow hedges was recognized in the income statement (2016: none).

CREDIT EUROPE BANK N.V.
NOTES TO CONSOLIDATED FINANCIAL STATEMENTS As of and for the period ended June 30, 2017 In thousands of EURO unless otherwise indicated
20
The table below shows the fair value of derivative financial instruments recorded as assets and liabilities.
June 30, 2017
December 31,
2016
FN_DER5 Assets Liabilities Assets Liabilities
Derivatives designated as Held for trading 291,471 280,553 280,175 313,002 Net investment hedge 22,494 16,042 29,188 35,045 Fair value hedge 396 1,086 846 68 Cash flow hedge 16,169 442 34,184 26,591 Total 330,530 298,123 344,393 374,706
9. Loans and receivables - customers
FN_LAR2 June 30,
2017
December 31,
2016
Commercial loans 3,463,665 3,575,341 Consumer loans 878,905 959,110 Public sector loans 399,903 397,964 Credit card loans 332,585 364,898 Finance lease receivables, net 50,648 47,950 Private banking loans 29,525 29,135 Subtotal 5,155,231 5,374,398
Individually assessed allowances for impairment (29,118) (23,314) Collectively assessed allowances for impairment (158,293) (163,080) Total 4,967,820 5,188,004
No individual loan or receivable has terms and conditions that materially affect the amount, timing or certainty of the consolidated cash flows of the Bank. Details of finance lease receivables are summarized below:
FN_LAR3 June 30, 2017
December 31,
2016
Not later than 1 year 29,554 28,057 Later than 1 year and not later than 5 years 30,197 28,437 Later than 5 years 450 793 Gross lease receivables 60,201 57,287
Not later than 1 year (5,014) (5,011) Later than 1 year and not later than 5 years (4,513) (4,246) Later than 5 years (26) (80) Unearned interest income (9,553) (9,337)
Finance lease receivables, net 50,648 47,950

CREDIT EUROPE BANK N.V.
NOTES TO CONSOLIDATED FINANCIAL STATEMENTS As of and for the period ended June 30, 2017 In thousands of EURO unless otherwise indicated
21
10. Loan impairment charges and allowances
FN_LAR_IMP1 June 30, 2017
December 31,
2016
Balance at the beginning of the period 187,319 197,565
New impairment allowances 59,908 138,147 Reversal of impairment allowances no longer required (8,105) (15,896) Amounts written off (43,827) (164,956) Currency translation differences (6,959) 32,459
Balance at the end of the period 188,336 187,319
Breakdown of balance at the end of the period
Consumer loans 100,140 103,384 Commercial loans 64,042 56,894 Credit card loans 16,030 18,394 Finance lease receivables 7,199 7,722 Loans to banks 925 925
Total 188,336 187,319
Net impairment loss on financial assets in income statement June 30, 2017 June 30, 2016
New impairment allowances 59,908 74,460 Reversal of impairment allowances no longer required (8,105) (7,950) Net impairment loss on financial assets 51,803 66,510
In 2017, there is no credit loss charge recognized in income statement related to financial investment held as available-for-sale. (2016: None)
Individually assessed allowances for impairment
FN_LAR_IMP3 June 30, 2017 June 30, 2016
December 31,
2016
Balance at the beginning of the year 24,239 22,859 22,859 New impairment allowances 17,416 12,768 43,260 Reversal of impairment allowances no longer required (1,029) (1,278) (1,076) Amounts written off (10,832) (2,662) (42,269) Currency translation differences 249 1,219 1,465 Balance at the end of the period 30,043 32,906 24,239

CREDIT EUROPE BANK N.V.
NOTES TO CONSOLIDATED FINANCIAL STATEMENTS As of and for the period ended June 30, 2017 In thousands of EURO unless otherwise indicated
22
Collectively assessed allowances for impairment
FN_LAR_IMP4 June 30, 2017 June 30, 2016
December 31,
2016
Balance at the beginning of the year 163,080 174,706 174,706 New impairment allowances 42,492 61,692 94,887 Reversal of impairment allowances no longer required (7,076) (6,672) (14,820) Amounts written off (32,995) (57,449) (122,687) Currency translation differences (7,208) 13,944 30,994 Balance at the end of the period 158,293 186,221 163,080
The Mortgage Payment Law (“Dare in Plata” or “DIP”), which came into force in Romania on in May 2016, entitled borrowers to request and to compel the lenders to accept a full discharge of mortgage-backed loans against the transfer of title of the mortgaged immoveable property to the lender. On the other hand, The Romanian Constitutional Court declared DIP law as a “hardship” law and reduced its scope to exceptional cases. While the Constitutional Court’s decision brought clarity to which extent DIP law is applicable for CEB; the local courts’ individual decisions in the future might have some financial impact on the Bank.
11. Other assets
FN_OTHR_A1 June 30,
2017
December 31,
2016*
Assets held for sale 53,502 60,845 Receivables from DNB 15,970 15,970 POS, plastic cards and ATM related receivables 15,471 24,696 Items in the course of settlement 8,833 17,318 Prepayments to suppliers 8,558 9,062 Accounts receivable 8,349 7,344 Amounts held as guarantee 5,873 8,443 Deferred acquisition costs 3,301 2,738 Tax related receivables 3,209 3,666 Materials and supplies 2,079 2,986 Other assets 5,806 3,604 Total 130,951 156,672
*As restated. Reference is made to Note 2 ‘Basis of preparation’ ‘Assets held for sale’ represents collaterals repossessed after clients were not able to meet their payment obligations.
12. Due to banks
FN_DtB1 June 30,
2017
December 31,
2016
Time deposits 432,398 353,453 Syndication loan 66,560 66,462 Current accounts 41,464 28,402
Total 540,422 448,317
The amount of repo transactions in time deposits is EUR 88,184 (2016: EUR 10,690).

CREDIT EUROPE BANK N.V.
NOTES TO CONSOLIDATED FINANCIAL STATEMENTS As of and for the period ended June 30, 2017 In thousands of EURO unless otherwise indicated
23
13. Due to customers
FN_DtC1 June 30,
2017
December 31,
2016
Retail time deposits 2,468,178 2,642,213 Retail saving and demand deposits 1,661,425 1,687,955 Corporate demand deposits 560,758 639,010 Corporate time deposits 432,246 562,353
Total 5,122,607 5,531,531
As of June 30, 2017, the Bank maintained customer deposit balances of EUR 35,344 (2016: EUR 66,138), which were pledged to the Bank as collateral for loans and off-balance sheet credit instruments granted by the Bank. As of June 30, 2017, EUR 2,124,431 (2016: EUR 2,259,407) of deposits from customers are expected to be settled more than 12 months after the balance sheet date.
14. Issued debt securities
Fixed rate debt securities 0
June 30,
2017
December 31,
2016
Within 1 year 2,124 13,654 More than 1 year but less than 5 years 30,157 159,308 More than 5 years 85,997 90,014 Total 118,278 262,977
15. Other liabilities
FN_OTHR_L1 June 30, 2017
December 31,
2016*
Accrued expenses 12,273 8,119 Staff related liabilities 6,031 7,472 Litigation provision ** 5,952 7,553 Payables to suppliers 5,826 3,884 Unearned premiums reserve 5,686 5,542 Items in the course of settlement 3,059 4,036 Non-current tax related payable 2,974 4,098 Credit card payables 2,491 2,529 Provisions 877 756 Deferred income 656 459 Payables regarding insurance agreements 447 513 Other liabilities 8,509 8,507
Total 54,781 53,468
*As restated. Reference is made to Note 2 ‘Basis of preparation’
** Provision set for litigations regarding abusive clauses in consumer contracts, in which the Bank’s subsidiary, Credit Europe Bank (Romania) S.A., is involved as of June 30, 2017. Further details are provided in Note 29: Commitments and Contingencies.

CREDIT EUROPE BANK N.V.
NOTES TO CONSOLIDATED FINANCIAL STATEMENTS As of and for the period ended June 30, 2017 In thousands of EURO unless otherwise indicated
24
16. Subordinated liabilities
Issued liabilities qualify as subordinated debt if claims by the holders are subordinated to all other current and future liabilities of, respectively, the Bank and other Group companies. These liabilities, except for the subordinated bonds issued by Credit Europe Bank Ltd. on November 12, 2012 for an amount of USD 250 million, qualify as capital, taking into account remaining maturities, for the purpose of determining the consolidated capital adequacy ratio for DNB.
FN_SD_1 Year of
maturity
June 30,
2017
December 31,
2016
USD 250 million subordinated notes with a fixed interest rate of 8.50 % p.a. 2019 85,115 92,799 USD 400 million Tier II loan with a fixed interest rate of 8 % p.a. 2022 360,766 390,683 USD 50 million Tier II loan with a fixed interest rate of 10 % p.a. * 2023 - 47,844 Total 445,881 531,326
* Early closed in February 2017.
17. Capital and reserves
FN_CPTL1 June 30, 2017
December 31,
2016*
Share capital 632,464 632,464 Share premium 163,748 163,748 Retained earnings 472,028 460,461 Fair value reserve 4,330 (9,071) Translation reserve (288,722) (265,899) Hedging reserve (114,719) (119,811) Equity attributable to owners of the Parent Company 869,129 861,892
Equity attributable to non-controlling interests 1,929 1,866
Total equity 871,058 863,758
*As restated. Reference is made to Note 2 ‘Basis of preparation’
As of June 30, 2017, the authorized share capital is EUR 1,000 million (2016: EUR 1,000 million) and consists of EUR 1,000 million (2016: EUR 1,000 million) ordinary shares with a face value of EUR 1. The called-up and paid-in capital consists of 632.5 million (2016: 632.5 million) ordinary shares with a face value of EUR 1.
Translation reserve The translation reserve comprises all foreign exchange differences arising from the translation of the financial statements of foreign operations.
Hedging reserve The hedging reserve comprises the effective portion of the cumulative net change in the fair value of hedging instruments used in hedges of net investment in foreign operations and in cash flow hedges.
Fair value reserves The fair value reserve includes the cumulative net change in the fair value of available-for-sale investments, excluding impairment losses, until the investment is derecognized or impaired.

CREDIT EUROPE BANK N.V.
NOTES TO CONSOLIDATED FINANCIAL STATEMENTS As of and for the period ended June 30, 2017 In thousands of EURO unless otherwise indicated
25
18. Net interest income
FN_NII1 January 1- June
30, 2017
January 1- June
30, 2016
Interest income from:
Loans and receivables – customers valued at amortized cost 220,268 238,455 Financial investments 9,207 16,599 Derivative financial instruments - hedge accounting 8,920 5,462 Loans and receivables – banks valued at amortized cost 3,164 3,682 Interest on financial lease 3,038 2,781 Financial assets at fair value through profit or loss 455 108 Cash and balances at central banks valued at amortized cost 22 33 Subtotal 245,074 267,120
Interest expense from:
Due to customers valued at amortized cost 59,816 45,836 Subordinated liabilities valued at amortized cost 19,379 22,184 Derivative financial instruments - hedge accounting 15,182 8,002 Issued debt securities valued at amortized cost 13,516 26,570 Due to banks valued at amortized cost 3,139 11,601 Cash and balances at central banks valued at amortized cost 642 164 Subtotal 111,674 114,357
Results on risk management derivatives, not designated in hedge accounting relationship 10,188 (39,173) Total 143,588 113,590

CREDIT EUROPE BANK N.V.
NOTES TO CONSOLIDATED FINANCIAL STATEMENTS As of and for the period ended June 30, 2017 In thousands of EURO unless otherwise indicated
26
19. Net fee and commission income
FN_COMM1 January 1- June
30, 2017
January 1- June
30, 2016
Fee and commission income
Credit card fees 33,496 25,651 Cash loan fees 4,849 4,842 Insurance related fees 4,046 3,661 Payment and transaction services fees 3,050 3,040 Letters of credit commissions 2,753 2,506 Portfolio and other management fees 2,094 1,753 Commission on account maintenance 1,860 2,028 Cash withdrawal fees 1,851 2,030 Letters of guarantee commissions 1,459 1,207 Foreign exchange transaction fees 846 698 Commissions on fund transfers 632 670 Commissions on fiduciary transactions 458 636 Other fees and commissions 1,611 2,610
Subtotal 59,005 51,332
Fee and commission expense
Credit card fees 21,253 15,311 Commission paid to intermediaries/retailers 2,930 1,738 Insurance related fees 2,695 1,616 Payment and transaction services expense 1,240 1,277 Collection operation fees 1,207 906 Account maintenance fees 375 350 Other fee and commission expenses 1,069 1,133
Subtotal 30,769 22,331
Total 28,236 29,001
20. Net trading income
FN_TRD1 January 1- June
30, 2017
January 1- June
30, 2016
Foreign exchange (17,107) 10,499 Trading loans 714 - Fixed income 1,144 1,162 Derivatives 2,272 (1,084)
Total (12,977) 10,577

CREDIT EUROPE BANK N.V.
NOTES TO CONSOLIDATED FINANCIAL STATEMENTS As of and for the period ended June 30, 2017 In thousands of EURO unless otherwise indicated
27
21. Results from financial transactions
FN_AFS3 January 1- June
30, 2017
January 1- June
30, 2016
Net gain from the disposal of available-for-sale investments 2,308 9,156
Total 2,308 9,156
Results from financial transactions include amounts transferred from equity to the income statement on derecognition of available-for-sale asset and gains and losses recognized from the difference between the carrying amount and the consideration received upon derecognition.
22. Other operating income
FN_OTHERINC1 January 1- June
30, 2017
January 1- June
30, 2016
Vessels charter income 6,693 478 Income from loan sales 4,003 4,888 Income from operational leasing activities 3,406 4,538 Collection from written off loans 3,256 2,543 Rent income 1,361 806 Sale of assets held for sale 638 1,904 Dividend received 180 1,726 Other income 1,668 816
Total 21,205 17,699
23. Personnel expenses
FN_STAFF1 January 1- June
30, 2017
January 1- June
30, 2016
Wages and salaries 42,707 38,916 Social security payments 4,710 4,187 Retirement benefit costs 4,221 3,583 Health insurance costs 634 436 Other employee costs 1,489 1,456 Total 53,761 48,578
Average number of employees 4,122 4,176
Banking activities – Netherlands 206 217 Banking activities - foreign countries 3,916 3,959
The retirement benefit costs of EUR 413 (2016: EUR 558) relates to a defined contribution plan. The Bank has no defined benefit program. The assets of the schemes are held separately from those of the Bank in funds under the control of insurance companies.

CREDIT EUROPE BANK N.V.
NOTES TO CONSOLIDATED FINANCIAL STATEMENTS As of and for the period ended June 30, 2017 In thousands of EURO unless otherwise indicated
28
24. General and administrative expenses
FN_GA1 January 1- June
30, 2017
January 1- June
30, 2016
Rent and maintenance expenses 11,406 11,157 Communication and information expenses 4,455 3,978 Professional fees and consultancy 3,544 2,330 Taxes other than income 3,021 3,242 Information technology expenses 2,380 1,884 Stationary, office supplies and printing expense 1,883 1,591 Membership fees 1,161 1,239 Legal services expenses 940 401 Advertising and marketing expenses 923 612 Security expenses 820 707 Travel and transport expenses 815 838 Cleaning expenses 522 417 Insurance premiums 517 341 Other expenses 1,660 2,309
Total 34,047 31,046
25. Other operating expenses
FN_OTHEROPEX1 January 1- June
30, 2017
January 1- June
30, 2016
Vessels maintenance expense 11,364 873 Provision expenses 996 541 Fines and penalties 381 463 Claims service expenses 272 544 Losses from asset held for sale 150 823 Other 721 298
Total 13,884 3,542
26. Other impairment losses
FN_OTHERIMP1 January 1- June
30, 2017
January 1- June
30, 2016
Assets held for sale (103) 77 Property and equipment - 1,791 Other (349) (46)
Total (452) 1,822

CREDIT EUROPE BANK N.V.
NOTES TO CONSOLIDATED FINANCIAL STATEMENTS As of and for the period ended June 30, 2017 In thousands of EURO unless otherwise indicated
29
27. Taxation
The Bank recognizes the current and deferred tax consequences of transactions that have been included in the interim consolidated financial statements using the provisions of the respective jurisdictions’ tax laws. Current and deferred taxes are charged or credited to equity if the tax relates to items that are charged or credited directly to equity.
Deferred tax assets and liabilities are recognized for the future tax consequences attributable to temporary differences between the financial statement carrying amounts of existing assets and liabilities and their respective tax bases, net operating loss carry-forwards and tax credits. Deferred tax assets are recognized only to the extent that it is probable that sufficient taxable profit will be available.
Deferred tax assets and liabilities are measured based on the tax rates that are expected to apply in the period that the asset is realized or the liability is settled, based on tax rates and tax laws that have been enacted or substantively enacted at the balance sheet date.
28. Fair value information
Fair value is the price that would be received to sell an asset or paid to transfer a liability in an orderly transaction between market participants at the measurement date in the principal or in its absence, the most advantageous market to which the Bank has access at that date. The fair value of a liability reflects its non-performance risk.
When available, the Bank measures the fair value of an instrument using the quoted price in an active market for that instrument. A market is regarded as active if transactions for the asset or liability take place with sufficient frequency and volume to provide pricing information on an ongoing basis. If there is no quoted market price in an active market, then the Bank uses valuation techniques that maximize the use of relevant observable inputs and minimize the use of unobservable inputs.
Classification of financial assets and liabilities
The table below provides reconciliation between line items in the statement of financial position and categories of financial instruments.
FN_FV_1 1 2 3 4 5
June 30,
2017
Trading
Designated
at fair
value
Loans and
receivables
Available
for sale
Other
amortized
costs
Total
carrying
amount
Cash and balances at central banks - - 595,134 - - 595,134 Financial assets at fair value through profit or loss - 40,146 - - - 40,146 Financial investments - - - 661,981 - 661,981 Loans and receivables - banks - - 443,059 - - 443,059 Loans and receivables - customers - - 4,967,820 - - 4,967,820 Derivative financial instruments 330,530 - - - - 330,530
Total assets 330,530 40,146 6,006,013 661,981 - 7,038,670
Due to banks - - - - 540,422 540,422 Due to customers - - - - 5,122,607 5,122,607 Derivative financial instruments 298,123 - - - - 298,123 Issued debt securities - - - - 118,278 118,278 Subordinated liabilities - - - - 445,881 445,881
Total liabilities 298,123 - - - 6,227,188 6,525,311

CREDIT EUROPE BANK N.V.
NOTES TO CONSOLIDATED FINANCIAL STATEMENTS As of and for the period ended June 30, 2017 In thousands of EURO unless otherwise indicated
30
FN_FV_2 1 2 3 4 5
December
31, 2016*
Trading
Designated
at fair
value
Loans and
receivables
Available
for sale
Other
amortized
costs
Total
carrying
amount
Cash and balances at central banks - - 1,041,371 - - 1,041,371 Financial assets at fair value through profit or loss - 2,712 - - - 2,712 Financial investments - - - 767,109 - 767,109 Loans and receivables - banks - - 306,666 - - 306,666 Loans and receivables - customers - - 5,188,004 - - 5,188,004 Derivative financial instruments 344,393 - - - - 344,393
Total assets 344,393 2,712 6,536,041 767,109 - 7,650,255
Due to banks - - - - 448,317 448,317 Due to customers - - - - 5,531,531 5,531,531 Derivative financial instruments 374,706 - - - - 374,706 Issued debt securities - - - - 262,977 262,977 Subordinated liabilities - - - - 531,326 531,326
Total liabilities 374,706 - - - 6,774,151 7,148,857
*As restated. Reference is made to Note 2 ‘Basis of preparation’
Fair value hierarchy
The fair value hierarchy consists of three levels, depending upon whether fair values are determined based on quoted prices in an active market (Level 1), valuation techniques with observable inputs (Level 2) or valuation techniques that incorporate inputs which are unobservable and which have significant impact on the fair value of the instrument (Level 3):
Valuation Models
The Bank measures fair values using the following fair value hierarchy, which reflects the significance of the inputs used in making the measurements.
• Level 1: This category includes inputs that are quoted market prices (unadjusted) in active markets for identical instruments. These are instruments where the fair value can be determined directly from prices which are quoted in active, liquid markets and where the instrument observed in the market is representative of that being priced in the Bank’s portfolio.
• Level 2: This category includes inputs other than quoted prices included within Level 1 that are observable either directly (i.e. as prices) or indirectly (i.e. derived from prices). This category includes instruments valued using: quoted market prices in active markets for similar instruments; quoted prices for identical or similar instruments in markets that are considered less than active; or other valuation techniques in which all significant inputs are directly or indirectly observable from market data.
• Level 3: This category includes all instruments where the valuation technique uses inputs based on unobservable data, which could have a significant effect on the instrument’s valuation. This category includes instruments that are valued based on quoted prices for similar instruments where significant, unobservable adjustments or assumptions are required to reflect differences between instruments. Unobservable in this context means that there is little or no current market data available from which the price at which an arm’s length transaction would be likely to occur can be derived.
The Bank uses following assumptions to estimate the fair value of financial instruments:
Equity securities: Fair values of publicly traded equity securities are based on quoted market prices where available. In the case of where no quoted market is available, fair value is determined based on quoted prices for similar securities or other valuation techniques. Valuation techniques include discounted cash flow models and transaction multiple methods.

CREDIT EUROPE BANK N.V.
NOTES TO CONSOLIDATED FINANCIAL STATEMENTS As of and for the period ended June 30, 2017 In thousands of EURO unless otherwise indicated
31
Debt securities: Fair values are based on quoted market prices, where available. Quoted market prices may be obtained from an exchange, dealer, broker, pricing service or regulatory service. If quoted prices in an active market are not available, fair value is based on an analysis of available market inputs, which may include values obtained from one or more pricing services or by a valuation technique that discounts expected future cash flows using a market interest rate curves, referenced credit spreads and maturity of the investment.
Derivative assets and liabilities: Derivatives are valued using valuation techniques. The valuation techniques and inputs depend on the type of derivative and the nature of the underlying instruments. Observable prices or model inputs are usually available in the market for exchange-traded derivatives and simple over-the-counter derivatives. Availability of observable market prices and model inputs reduces the need for management judgement and estimation and also reduces the uncertainty associated with determining fair values. The principal techniques used to value these instruments are based on discounted cash flows, Black-Scholes option models and Monte Carlo simulation. These valuation models calculate the present value of expected future cash flows. Inputs to valuation models are determined from observable market data where possible. The inputs used include prices available from exchanges, dealers, brokers or providers of consensus pricing, yield curves, credit spreads, default rates, recovery rates, volatility of underlying interest rates, equity prices and foreign currency exchange rates. These inputs are determined with reference to quoted prices, recently executed trades, independent market quotes, where available.
Fair value estimates obtained from models are adjusted for any other factors, such as liquidity risk or model uncertainties; to the extent that the Bank believes that a third party market participant would take them into account in pricing a transaction. Fair values reflect the credit risk of the instrument and include adjustments to take account of the credit risk of the Bank entity and the counterparty where appropriate. For measuring derivatives, fair values take into account both credit valuation adjustments (CVA) and debit valuation adjustments (DVA). In assessing the counterparty risk the Bank accounts for the following aspects: the default probability of the counterparty, the default probability of the Bank itself, the nature of transactions and the impact of risk mitigants such as netting and collateralisation for each counterparty individually.
Loans to customers designated as fair value through profit or loss: Fair values of loans are determined by reference to similar instruments trading in active markets and valuation models where all inputs are observable. These models calculate the present value of expected future cash flows. The inputs used include prices available from dealers, brokers or providers of consensus pricing, yield rates and currency exchange rates.
Valuation framework
The Bank has an established control framework with respect to the measurement of fair values. This framework includes a Product Control function, which is independent of front office management and reports to the Chief Financial Officer, and which has overall responsibility for independently verifying the results of trading and investment operations and all significant fair value measurements. Specific controls include:
• verification of observable pricing;
• re-performance of model valuations;
• analysis and investigation of significant daily valuation movements
When third party confirmation, such as broker quotes or pricing services, is used to measure fair value, Product Control assesses and documents the evidence obtained from the third parties to support the conclusion that such valuations meet the requirements of IFRS. This includes:
• verifying that the broker or pricing service is approved by the Bank for use in pricing the relevant type of financial instrument;
• understanding how the fair value has been arrived at and the extent to which it represents actual market transactions;
• when prices for similar instruments are used to measure fair value, how these prices have been adjusted to reflect the characteristics of the instrument subject to the measurement; and

CREDIT EUROPE BANK N.V.
NOTES TO CONSOLIDATED FINANCIAL STATEMENTS As of and for the period ended June 30, 2017 In thousands of EURO unless otherwise indicated
32
• if a number of quotes for the same financial instrument have been obtained, then how fair value has been determined using these quotes.
Significant valuation issues are reported to the Asset Liability Committee (ALCO).
Level 3 Financial assets and liabilities
Security fair value measurements using significant inputs that are unobservable in the market due to limited activity or a less liquid market are classified as Level 3 in the fair value hierarchy. Such measurements include securities valued using internal models or a combination of multiple valuation techniques, such as weighting of internal models and vendor or broker pricing, where the unobservable inputs are significant to the overall fair value measurement. As of December 31, 2016, securities classified as Level 3 include certain diversified payment rights securities.
Loans and receivable classified under Level 3 consist of trading loans valued using discounted cash flow technique that incorporate brokers’ quotes as indicative value with no attached commitment to transact at that price.
Changes in the unobservable inputs used in the valuation of Level 3 financial assets would not have a significant impact on equity and net income.

CREDIT EUROPE BANK N.V.
NOTES TO CONSOLIDATED FINANCIAL STATEMENTS As of and for the period ended June 30, 2017 In thousands of EURO unless otherwise indicated
33
Reconciliation
The following table shows a reconciliation from the beginning balances to the ending balances for fair value measurements in the Level 3 of the fair value hierarchy.
FN_FV_3 1 Column1
June 30,
2017 3 Column2
December
31, 2016
Financial
Investments
- securities
Financial
Assets
FVTPL -
Loans and
receivables Total
Financial
Investments
- securities
Financial
Investments
- Loans and
receivables Total
Balance at January 1 31,579 - 31,579 30,520 152,845 183,365
Total gains and losses - in net trading income - 714 714 1,055 1,775 2,830 - in OCI - - - 4 (230) (226) Purchases - 357,835 357,835 - 776,302 776,302 Settlements (31,456) (323,771) (355,226) - (909,875) (909,875)
Balance at the period end 123 34,778 34,901 31,579 20,817 52,395
Financial instruments measured at fair value
The table below analyses financial instruments measured at fair value, by the level in the fair value hierarchy into which the fair value measurement is categorized. The amounts are based on the values recognized in the statement of financial position.
June 30, 2017 FN_FV_4 Note Level 1 Level 2 Level 3 Total
Financial assets
Trading assets
6 5,368 - 34,778 40,146 Derivative assets held for risk management and trading
10 - 330,530 - 330,530
Financial investments 7 635,758 26,100 123 661,981 Total
641,126 356,630 34,901 1,032,657
Financial liabilities
Derivative assets held for risk management 10 - 298,123 - 298,123 Total - 298,123 - 298,123
December 31, 2016
* FN_FV_5 Note Level 1 Level 2 Level 3 Total
Financial assets
Trading assets
6 2,712 - - 2,712 Derivative assets held for risk management and trading
10 - 344,393 - 344,393
Financial investments 7 688,613 26,100 52,396 767,109 Total
691,325 370,493 52,396 1,114,214
Financial liabilities
Derivative assets held for risk management 10 - 374,706 - 374,706 Total - 374,706 - 374,706
*As restated. Reference is made to Note 2 ‘Basis of preparation’
No securities were transferred from Level 1 to Level 2 of the fair value hierarchy in 2017.

CREDIT EUROPE BANK N.V.
NOTES TO CONSOLIDATED FINANCIAL STATEMENTS As of and for the period ended June 30, 2017 In thousands of EURO unless otherwise indicated
34
Financial instruments not measured at fair value
The following table compares the carrying amount of financial assets and liabilities not measured at fair value and analyses them by the level in the fair value hierarchy.
June 30, 2017 FN_FV_6 Note Level 1 Level 2 Level 3
Total fair
Values
Total
carrying
amount
Financial assets 0 0 0 0 0 0
Cash and balances at central banks 5 - 595,134 - 595,134 595,134 Loans and receivables - banks 8 - 441,596 - 441,596 443,059 Loans and receivables - customers 9 - - 4,934,991 4,934,991 4,967,820 Total - 1,036,730 4,934,991 5,971,721 6,006,013
Financial liabilities
Due to banks 12 - 540,130 - 540,130 540,422 Due to customers 13 - 5,208,317 - 5,208,317 5,122,607 Issued debt securities 14 115,718 1,488 - 117,206 118,278 Subordinated liabilities 16 89,356 370,551 - 459,907 445,881 Total 205,074 6,120,486 - 6,325,560 6,227,188
December 31, 2016 FN_FV_7 Note Level 1 Level 2 Level 3
Total fair
Values
Total
carrying
amount
Financial assets 0 0 0 0 0 0
Cash and balances at central banks 5 - 1,041,371 - 1,041,371 1,041,371 Loans and receivables - banks 8 - 306,621 - 306,621 306,666 Loans and receivables - customers 9 - - 5,149,694 5,149,694 5,188,004 Total - 1,347,992 5,149,694 6,497,686 6,536,041
Financial liabilities
Due to banks 12 - 447,762 - 447,762 448,317 Due to customers 13 - 5,630,032 - 5,630,032 5,531,531 Issued debt securities 14 253,687 10,895 - 264,582 262,977 Subordinated liabilities 16 94,171 443,802 - 537,973 531,326 Total 347,858 6,532,491 - 6,880,349 6,774,151
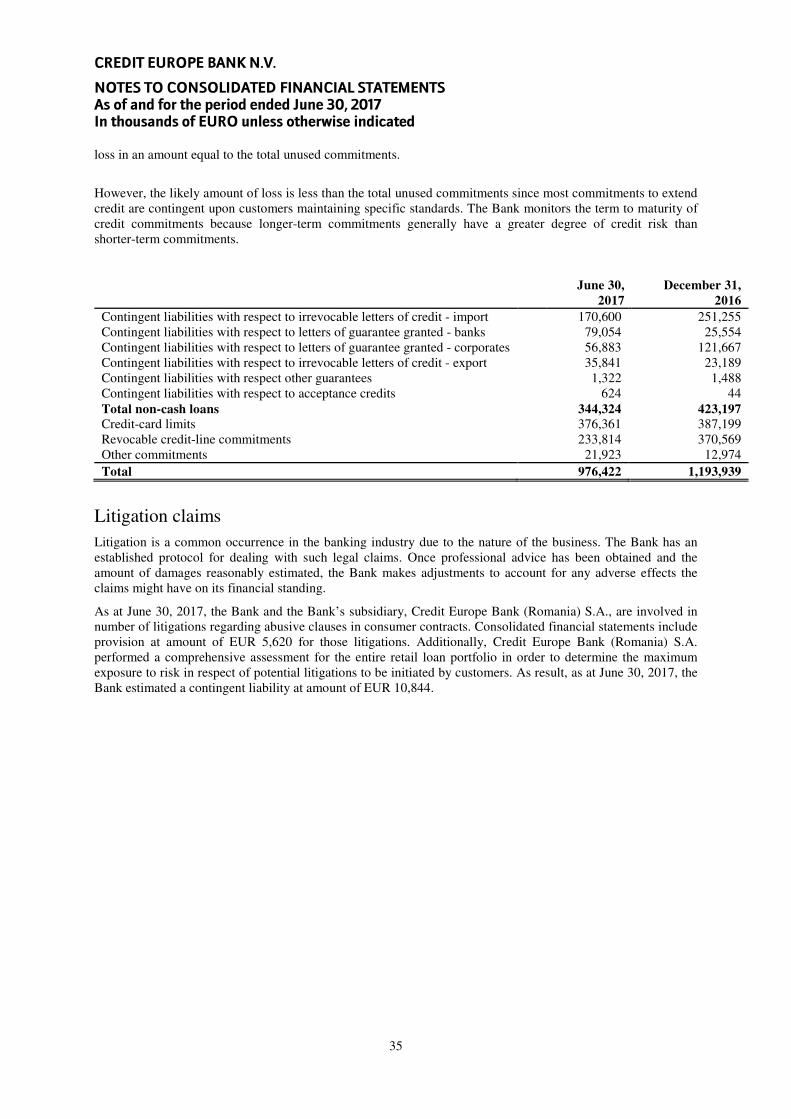
29. Commitments and contingencies To meet the financial needs of customers, the Bank issues various irrevocable commitments and contingent liabilities. Even though these obligations may not be recognized on the statement of financial position, they do contain credit risk and are, therefore, part of the overall risk of the Bank. In many instances, the amount recognized on the statement of financial position for incurred obligations does not represent the loss potential of the arrangement in full.
Letters of credit, guarantees and acceptances commit the Bank to make payments on behalf of customers, contingent on the failure of the customer to perform under the terms of the contract. Guarantees carry the same credit risk as loans. Credit guarantees can be in the form of bills of exchange, irrevocable letters of credit, advance payment guarantees, or endorsement liabilities from bills rediscounted.
Commitments to extend credit represent contractual commitments to make loans and revolving credits. Commitments generally have fixed expiration dates, or other termination clauses. Since commitments may expire without being drawn upon, the total contract amounts do not necessarily represent future cash requirements. With respect to credit risk on commitments to extend the credit, the Bank is potentially exposed to
CREDIT EUROPE BANK N.V.
NOTES TO CONSOLIDATED FINANCIAL STATEMENTS As of and for the period ended June 30, 2017 In thousands of EURO unless otherwise indicated
35
loss in an amount equal to the total unused commitments.
However, the likely amount of loss is less than the total unused commitments since most commitments to extend credit are contingent upon customers maintaining specific standards. The Bank monitors the term to maturity of credit commitments because longer-term commitments generally have a greater degree of credit risk than shorter-term commitments.
FN_COMMIT_1
June 30,
2017
December 31,
2016
Contingent liabilities with respect to irrevocable letters of credit - import 170,600 251,255 Contingent liabilities with respect to letters of guarantee granted - banks 79,054 25,554 Contingent liabilities with respect to letters of guarantee granted - corporates 56,883 121,667 Contingent liabilities with respect to irrevocable letters of credit - export 35,841 23,189 Contingent liabilities with respect other guarantees 1,322 1,488 Contingent liabilities with respect to acceptance credits 624 44 Total non-cash loans 344,324 423,197
Credit-card limits 376,361 387,199 Revocable credit-line commitments 233,814 370,569 Other commitments 21,923 12,974 Total 976,422 1,193,939
Litigation claims Litigation is a common occurrence in the banking industry due to the nature of the business. The Bank has an established protocol for dealing with such legal claims. Once professional advice has been obtained and the amount of damages reasonably estimated, the Bank makes adjustments to account for any adverse effects the claims might have on its financial standing.
As at June 30, 2017, the Bank and the Bank’s subsidiary, Credit Europe Bank (Romania) S.A., are involved in number of litigations regarding abusive clauses in consumer contracts. Consolidated financial statements include provision at amount of EUR 5,620 for those litigations. Additionally, Credit Europe Bank (Romania) S.A. performed a comprehensive assessment for the entire retail loan portfolio in order to determine the maximum exposure to risk in respect of potential litigations to be initiated by customers. As result, as at June 30, 2017, the Bank estimated a contingent liability at amount of EUR 10,844.

CREDIT EUROPE BANK N.V.
NOTES TO CONSOLIDATED FINANCIAL STATEMENTS As of and for the period ended June 30, 2017 In thousands of EURO unless otherwise indicated
36
Lease commitments The Bank leases a number of buildings and cars under operating leases. Non-cancellable operating lease rentals are payable as follows:
Operating lease commitment - bank as lessee and rent
commitments
June 30,
2017
December 31,
2016
Not later than 1 year 10,187 11,825 Later than 1 year and not later than 5 years 20,986 26,129 Total 31,173 37,954
Operating lease commitment - bank as lessor
June 30,
2017
December 31,
2016
Not later than 1 year 6,810 7,098 Later than 1 year and not later than 5 years 5,982 6,337
Total 12,792 13,435
The Bank leases a number of premises and equipment under operating lease. The leases typically run for an initial period of one to five years, with an option to renew the lease after that date. Lease payments are usually changed annually to reflect market rentals. None of the leases includes contingent rentals.
During the current year EUR 12,684 was recognized as an expense in the statement of income in respect of operating leases (2016: EUR 10,270).

CREDIT EUROPE BANK N.V.
NOTES TO CONSOLIDATED FINANCIAL STATEMENTS As of and for the period ended June 30, 2017 In thousands of EURO unless otherwise indicated
37
30. Related parties The Bank’s Parent Company is Credit Europe Group N.V., The Netherlands, and the Ultimate Parent Company is FİBA Holding A.Ş., Turkey, both ultimately controlled by a single individual, Mr. Hüsnü Özyeğin.
Parties are considered related if one party has the ability to control the other party or exercise significant influence over the other party in financial and operating decisions. The Bank enters into transactions with its Parent company, ultimate parent company and other related parties controlled by Mr. Hüsnü Özyeğin in the ordinary course of business at commercial interest and commission rates. The Bank provides general banking services to related parties including current accounts, time deposits, fx transactions, fiduciary transactions, brokerage activities and custodian services. All loans and advances to related parties are performing advances, and are free of any provision for possible credit losses.
All amounts included in the financial statements stated in the table below relate to Group companies controlled by Mr. Hüsnü Özyeğin:
FN_RP_BS_1 1 Column1 2
June 30,
2017 4 Column2 5
December
31, 2016
Parent
Company
Ultimate
Parent
Company
Associates
and joint
ventures
Other
Related
Parties
Parent
Company
Ultimate
Parent
Company
Associates
and joint
ventures
Other
Related
Parties
Assets Loans and receivables – banks - - 5,283 4,497 - - - 1,496 Loans and receivables – customers 5,171 - 218 153,153 2,586 - 213 158,038 Derivative financial instruments 1,564 11,314 - 73,412 1,774 8,877 - 80,177
Liabilities
Due to banks - - 901 345 - - 4,577 472 Due to customers 383 4,465 87 150,397 1,971 3,536 107 273,726 Derivative financial instruments 1,109 6,607 - 18,960 1,337 5,360 - 10,883 Commitment and contingencies - - - 2,114 - - - 10,623
All credit risk exposures related to derivate financial instruments are fully collateralized through pledge agreements. As of June 30, 2017, the Bank does not have any provisions regarding related party balances (2016: None)
The income and expenses in respect of related parties included in the financial statements are as follows:
FN_RP_PL_1 1 Column3 2016
January 1-
June 30, 2017 3 Column1 Column2
January 1-
June 30, 2016
Parent
Company
Ultimate
Parent
Company
Associates
and joint
ventures
Other Related
Parties
Parent
Company
Ultimate
Parent
Company
Associates
and joint
ventures
Other Related
Parties
Interest income - - 153 1,843 222 - - 1,256 Interest expense (185) - (90) (48) - (21) (115) (337) Commission income 5 34 0 1,027 2 23 - 700 Commission expense (113) - (828) (339) - - - (318) Net trading income 5 1 0 149 (1) - - 1,092 Other operating income - - 156 72 - - 9 56 Operating expenses - - (353) (692) - - - (758)

CREDIT EUROPE BANK N.V.
NOTES TO CONSOLIDATED FINANCIAL STATEMENTS As of and for the period ended June 30, 2017 In thousands of EURO unless otherwise indicated
38
Key management is defined as those persons in the Bank’s Supervisory and Managing Board. The number of key management personnel is 12 (2016: 12). Key management personnel and their immediate relatives have transactions in the ordinary course of business at commercial interest and commission rates with the Bank. Loans granted to key management are as follows:
FN_RP_BS_2 June 30, 2017
December 31,
2016
Loans and receivables - customers 142 235 As of June 30, 2017, the Bank does not have any provisions regarding the balances with key management personnel (2016: None). Key management costs, including remuneration and fees for the year ended June 30, 2017 amounted to EUR 1,896 (2016: EUR 2,267). Pension plan contribution amounted to EUR 63 (2016: EUR 58).

CREDIT EUROPE BANK N.V.
NOTES TO CONSOLIDATED FINANCIAL STATEMENTS As of and for the period ended June 30, 2017 In thousands of EURO unless otherwise indicated
39
31. Intra-Group balances Intra-group balances that are eliminated during consolidation process:
FN_RP_BS_3 June 30, 2017
December 31,
2016
Assets
Financial investments 1,923 34,376 Loans and receivables - banks 168,082 241,333 Loans and receivables – customers 303,731 258,970 Derivative financial instruments 21,134 50,157 Other assets 152 122
Liabilities
Due to banks 467,419 492,596 Due to customers 4,394 7,707 Derivative financial instruments 21,134 50,157 Issued debt securities - 33,431 Subordinated liabilities 1,923 945 Other liabilities 152 122
Commitments and contingencies 25,190 38,335
FN_RP_PL_2 January 1-
June 30, 2017
January 1- June
30, 2016
Interest income 22,091 28,973 Interest expense (22,091) (28,973) Commission income 1,600 2,116 Commission expense (1,600) (2,116)

CREDIT EUROPE BANK N.V.
NOTES TO CONSOLIDATED FINANCIAL STATEMENTS As of and for the period ended June 30, 2017 In thousands of EURO unless otherwise indicated
40
32. Risk management Credit Europe Bank has set policy-level standards in accordance with the regulations of the Dutch Central Bank (De Nederlandsche Bank – DNB) and the guidelines published by the Basel Committee and the European Banking Authority (EBA).
The core elements of the bank’s risk management and control framework are: • Adhering to the risk appetite and strategy set • Periodically assessing the risk governance structure • Maintaining capital management in line with the capital strategy • Managing financial and operational risk in line with the risk appetite and strategy
Risk Appetite and Risk Governance
The risk management philosophy requires direct reporting lines and a clear division of tasks and responsibilities. At the same time, it ensures that bank-wide criteria for acceptance, monitoring, control and management of risks are deeply rooted. We clearly separate risk ownership from business activities.
Main pillars of the risk appetite are illustrated below:
QUALITATIVE
Governance
- Standardized policies, guidelines and limits
- Risk tolerance is proposed and executed by the Managing Board upon the approval of the Supervisory Board
- Risk appetite in certain geographies and segments is determined in accordance with local presence and expertise
- Risk management is centralized and functions independently from the business lines
Reputation
- Ensure high financial reporting transparency and efficient external communications
QUANTITATIVE
Credit risk concentration
- Diversified exposure within different geographies through retail, SME and corporate clients.
- Low sovereign exposure
Liquidity
- No risk tolerance for liquidity risk, restrictions on short-term funding and credit-sensitive liabilities
- Insignificant liability concentration
Trading and ALM
- Minor sensitivity to trading risk and limited interest rate mismatches in the banking book
- No exposure to securitized/re-securitized assets or CDOs

CREDIT EUROPE BANK N.V.
NOTES TO CONSOLIDATED FINANCIAL STATEMENTS As of and for the period ended June 30, 2017 In thousands of EURO unless otherwise indicated
41
CEB exercises full control over its subsidiaries’ business performance and steers their risk appetite. In addition, we employ the following risk management governance structure:
• Effective Audit & Risk Committees at subsidiary as well as consolidated level; • Direct reporting of general managers of the banks' subsidiaries to the CEO of CEB; • Presence of a global CRO function on the Managing Board; • A uniform credit committee structure at both local and the consolidated level.
The Audit and Risk Committee (ARC) at the consolidated level plays a pivotal role in CEB’s risk governance framework. ARC meets 4 times a year and receives regular reports and updates on the Bank’s actual risk appetite with respect to the approved risk appetite statement. The Committee reviews and monitors the limits for individual types of risks and takes decisions whether principal risks have been properly identified and are being appropriately managed. ARC also makes assessments on the existing risk management capacity / know-how of the Bank and raises action items / investment plans –where necessary- to reach the desired level.
In line with the ARC recommendations we continued to invest in the Bank’s risk management systems in 2014, including but not limited to the streamlining of the credit process, particularly with regard to capital planning, and implementing integrated stress testing tools.
Capital Management
A capital level commensurate with the Bank’s risk profile is the key to financial resilience. CEB operates with an optimum level and mix of capital resources. A centralized regulatory/internal capital management model plays a major role in this process. The internal capital model incorporates detailed scenario analyses of key risk factors and their potential effects on income statement and the Bank’s capital base under different assumptions. This framework is designed to ensure CEB has sufficient capital resources to meet the capital requirements of DNB, as well as those of local regulators in our operating countries.
It further ensures that we have capital available to meet our own risk appetite and internal guidelines. We place great emphasis on the strength of our capital base as a way to maintain investor, creditor and market confidence, and to sustain future business development.
CEB allocates assets in accordance with the risk-return thresholds defined in our risk appetite statement. Business units are required to fully understand the inherent risk-reward profile of their business and to generate a specific level of return on regulatory/internal capital requirements. The CEB risk strategy has proved its value, not only by providing consistently strong financial results, but also by yielding consistently robust returns on equity.
The Bank’s capital-management objectives are to:
• Maintain sufficient capital resources to meet the DNB’s minimum regulatory capital requirements. • Ensure that locally regulated subsidiaries can meet their minimum capital requirements. • Achieve adequate capital levels to support the bank’s risk appetite and internal capital requirements. • Maintain a strong capital base to reassure investors, creditors and markets, and to sustain future business
development.
To support its capital-management objectives, the Bank takes into account:
• Possible volatility in anticipated demand for capital caused by new business opportunities, including acquisitions, or by deterioration in the credit quality of the Bank’s assets
• Possible volatility of reported profits and other capital resources compared with forecast. • Capital ratio sensitivity to foreign-exchange-rate movements.
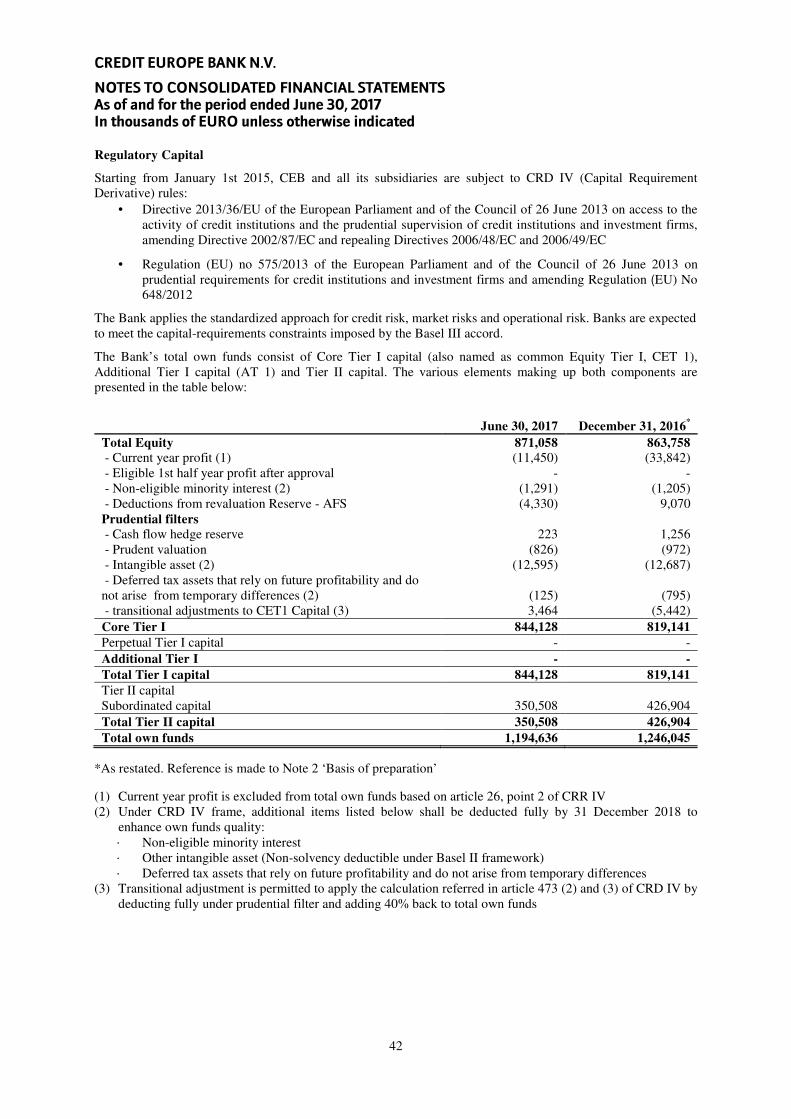
CREDIT EUROPE BANK N.V.
NOTES TO CONSOLIDATED FINANCIAL STATEMENTS As of and for the period ended June 30, 2017 In thousands of EURO unless otherwise indicated
42
Regulatory Capital
Starting from January 1st 2015, CEB and all its subsidiaries are subject to CRD IV (Capital Requirement Derivative) rules:
• Directive 2013/36/EU of the European Parliament and of the Council of 26 June 2013 on access to the activity of credit institutions and the prudential supervision of credit institutions and investment firms, amending Directive 2002/87/EC and repealing Directives 2006/48/EC and 2006/49/EC
• Regulation (EU) no 575/2013 of the European Parliament and of the Council of 26 June 2013 on prudential requirements for credit institutions and investment firms and amending Regulation (EU) No 648/2012
The Bank applies the standardized approach for credit risk, market risks and operational risk. Banks are expected to meet the capital-requirements constraints imposed by the Basel III accord.
The Bank’s total own funds consist of Core Tier I capital (also named as common Equity Tier I, CET 1), Additional Tier I capital (AT 1) and Tier II capital. The various elements making up both components are presented in the table below:
FN_LAR2 June 30, 2017 December 31, 2016
*
Total Equity 871,058 863,758
- Current year profit (1) (11,450) (33,842) - Eligible 1st half year profit after approval - - - Non-eligible minority interest (2) (1,291) (1,205) - Deductions from revaluation Reserve - AFS (4,330) 9,070 Prudential filters
- Cash flow hedge reserve 223 1,256 - Prudent valuation (826) (972) - Intangible asset (2) (12,595) (12,687) - Deferred tax assets that rely on future profitability and do not arise from temporary differences (2) (125) (795) - transitional adjustments to CET1 Capital (3) 3,464 (5,442) Core Tier I 844,128 819,141
Perpetual Tier I capital - - Additional Tier I - -
Total Tier I capital 844,128 819,141
Tier II capital Subordinated capital 350,508 426,904 Total Tier II capital 350,508 426,904
Total own funds 1,194,636 1,246,045
*As restated. Reference is made to Note 2 ‘Basis of preparation’
(1) Current year profit is excluded from total own funds based on article 26, point 2 of CRR IV (2) Under CRD IV frame, additional items listed below shall be deducted fully by 31 December 2018 to
enhance own funds quality: · Non-eligible minority interest · Other intangible asset (Non-solvency deductible under Basel II framework) · Deferred tax assets that rely on future profitability and do not arise from temporary differences
(3) Transitional adjustment is permitted to apply the calculation referred in article 473 (2) and (3) of CRD IV by deducting fully under prudential filter and adding 40% back to total own funds

CREDIT EUROPE BANK N.V.
NOTES TO CONSOLIDATED FINANCIAL STATEMENTS As of and for the period ended June 30, 2017 In thousands of EURO unless otherwise indicated
43
The Bank and its individually supervised subsidiaries have complied with all externally imposed capital requirements throughout the reporting period and maintained their capital ratios above the regulatory minimum ratios. Solvency ratio June 30, 2017 December 31, 2016
Capital ratio 19.79% 19.53% Tier I ratio 13.99% 12.84% Core Tier I 13.99% 12.84%
RWA 6,035,111 6,379,340
Credit risk
Credit risk is defined as the current or prospective threat to the bank’s earnings and capital as a result of counterparty’s failure to comply with financial or other contractual obligations. Credit risk constitutes the most significant risk of the bank and arises mainly from its trade-finance, lending, treasury, mortgage and leasing businesses.
Concentration limits
The bank has established maximum concentration limits –in terms of both nominal and capital consumption- over country, industry and single-name concentrations to manage concentration risk in its loan portfolio. Credit risk is managed by following tools and principles:
Risk mitigation
CEB actively uses collateral management as the major risk mitigation mechanism. Collaterals are managed and followed-up in processes fully supported by the bank’s banking system by means of collateral-transaction linkages, blocked accounts and system checking of collateralization. In particular, specialized lending is run through on collaterals and documentation. Valuation reports, survey report updates, insurance policies management are followed up systematically. Outsourcing is also utilized by Collateral Management Agreements and Collateral Monitoring Agreements with expert collateral management agents who have the management and reporting capabilities on the site of the collateral. CEB follows legal certainty and operational requirements as a pre-requisite for consideration risk mitigation effects of the collaterals. Legal department conducts in-depth legal review confirming the enforceability of the collateral arrangements under the law applicable to these arrangements in all relevant jurisdictions. Collateral value should not have a material positive correlation with the credit quality of the provider. The market value of the collateral should be appraised at least annually or more often whenever there is a reason to believe that a significant decrease in its market value has occurred.
Internal Rating Models and Scorecards
IN 2016, CEB is in the process of migrating from the existing 11-grade rating scale to a new 21-grade master scale -which covers both corporate and retail lending. CEB borrower rating systems require fundamental credit analysis (corporate) and behavioural inputs (retail) and supplemented by statistical models. The obligor rating framework has several building blocks to ensure that qualitative and quantitative risk drivers of corporate default are inherent in the rating process.
Since 2011, Internal Rating System model coverage has been extended with new specialized lending models, which ensure more robust estimation of initial risk parameters for transactional lending portfolios. In line with

CREDIT EUROPE BANK N.V.
NOTES TO CONSOLIDATED FINANCIAL STATEMENTS As of and for the period ended June 30, 2017 In thousands of EURO unless otherwise indicated
44
the CEB NV lending practices, seven sub-classes of specialized lending, namely structured trade finance, marine object finance, marine project (shipbuilding) finance, income producing real estate finance, real estate development finance, object finance and other project finance, are separately identified within the corporate asset class regarding the applied rating criteria. CEB has established a centre of excellence for retail risk management responsible for scoring, risk based pricing, algorithm development, stress testing, monitoring and reporting. The centre is composed of highly skilled statisticians, bankers, econometrists, database programmers and risk managers. The team has worked in projects in several countries including Russia, Romania, Germany, Turkey and Belgium. Now through their efforts, all banking entities are taking the right risk with the right interest margin.
Stress testing
The Bank puts stress-testing and capital planning at the centre of its internal capital assessment process. The factual starting point of the capital planning process is the three year business plan which reflects the baseline assumptions on the global economy. Macroeconomic assumptions are mainly based on a survey of multiple sources to ensure objectivity and consistency. Then, the Bank identifies the potential threats to its business plan and capital adequacy based on a set of adverse scenarios. Having a hypothetical stress testing framework, the Bank’s stress-testing methodology discourages both under-and over-reliance on internal data. The magnitude of the shocks varied across different portfolios based on their expected default correlation with the systematic risks which materialize under the adverse scenario. The Bank’s credit-risk stress tests shock both default- and recovery-related risk parameters. In particular, risk concentrations in the portfolio are penalized with harsher shocks. The Bank’s stress-testing methodology does not aim to make accurate forecasts of the downturns, but instead aims to capture the tail loss by simulating the unexpected and the undesirable.

CREDIT EUROPE BANK N.V.
NOTES TO CONSOLIDATED FINANCIAL STATEMENTS As of and for the period ended June 30, 2017 In thousands of EURO unless otherwise indicated
45
32. a. Credit exposure
Maximum credit-risk exposure
The Bank identifies its maximum credit exposure as the sum of all transactions that may potentially expose the Bank to credit losses, should the counterparty not fulfil its contractual obligations. The maximum credit exposure presented in the table below comprises on- and off-balance sheet items. Credit exposure is measured without taking account of any collateral held or other credit enhancements.
Maximum credit-risk exposure, net of impairment allowances
On-balance sheet items are presented at their gross carrying amount, gross of impairment allowances. Derivative financial instruments are assessed at fair value of future cash flows.
The off-balance credit risk exposure comprises:
• Letters of guarantee granted and letters of credit issued or confirmed, shown at the maximum amount that the Bank would have to pay if the guarantees or letters of credit are called upon; and,
• Undrawn credit-card limits • Revocable credit line commitments are excluded as they do not create credit risk.
FN_LAR2 June 30,
2017
December
31, 2016
Balance sheet items
Balances with central banks 538,612 978,059 Financial assets designated at fair value through profit or loss 40,146 2,712 Financial investments 661,981 767,109 Loans and receivables - banks 443,984 307,591 Loans and receivables - customers 5,155,231 5,374,398
Derivative financial instruments 330,530 344,393
Subtotal 7,170,484 7,774,262
Off- balance sheet items
Issued letters of guarantee 137,259 148,709 Issued irrevocable letters of credit 206,441 274,444 Undrawn credit-card limits 376,361 387,199
Other commitments and contingent liabilities 624 44
Total off-balance sheet* 720,685 810,396
Maximum credit risk exposure 7,891,169 8,584,658
*Excluding revocable credit line commitments The Bank considers items such as ‘other credit commitments and contingent liabilities’ as a part of its maximum credit risk exposure. However, these are not included in tables below since they are composed of credit facilities that are either revocable or can be cancelled unconditionally by the Bank, and therefore bear insignificant credit risk.
Concentration of credit exposure
Concentration risk normally arises when number of counterparties operates in the same geographical region or within the same economic sector, and thus is affected to the same extent as economic, political and other conditions.

CREDIT EUROPE BANK N.V.
NOTES TO CONSOLIDATED FINANCIAL STATEMENTS As of and for the period ended June 30, 2017 In thousands of EURO unless otherwise indicated
46
32.b. Sector concentration The Bank monitors its credit exposure within the following counterparty groups: corporate customers, banks and central governments, retail customers, SME customers, and residential mortgage loans. Exposure to corporate customers is presented, broken down by industry, according to the internal sector definitions.
FN_LAR2 Column1 Column2 Column4
June 30,
2017 Column3
December
31, 2016
On-
balance
sheet
Off-balance
sheet
Total
exposure(*)
% of total
exposure
Total
exposure(*)
% of total
exposure
Exposure to central governments and
financial institutions
Exposure to central governments and central banks 538,612 - 538,612 49.06% 978,059 73.38% Exposure to financial institutions 443,984 115,203 559,187 50.94% 354,862 26.62% Total exposure to central governments and
financial institutions 982,596 115,203 1,097,799 100.00% 1,332,921 100.00%
Corporate exposure
Construction & installation 590,294 27,615 617,909 15.13% 565,748 13.08% Leisure & tourism 528,534 4,977 533,511 13.06% 521,461 12.06% Real estate 421,790 2 421,792 10.32% 575,557 13.32% Public loans 399,903 49 399,952 9.79% 397,964 9.20% Financial services & investments 281,316 120 281,436 6.89% 206,661 4.78% Oil & derivatives 125,451 82,430 207,881 5.09% 290,727 6.72% Transportation, logistics & warehousing 203,688 2,752 206,440 5.05% 158,261 3.66% Iron & steel 136,183 48,221 184,404 4.51% 155,549 3.60% Shipping & shipyards 178,996 400 179,396 4.39% 253,126 5.85% Energy & coal 127,310 795 128,105 3.14% 151,343 3.50% Textile, clothing & leather 109,318 5,852 115,170 2.82% 147,432 3.41% Food, beverage & tobacco 114,024 238 114,262 2.80% 141,891 3.28% Petrochemical, plasticizers & derivatives 54,739 27,063 81,802 2.00% 99,888 2.31% Soft commodities & agricultural products 72,214 2,966 75,180 1.84% 55,561 1.28% Retail 69,604 2,690 72,294 1.77% 106,472 2.46% Fertilizers 43,843 - 43,843 1.07% 26,955 0.62% Telecommunications 28,440 - 28,440 0.70% 33,485 0.77% Building materials 6,826 - 6,826 0.17% 11,702 0.27% Other 365,654 20,892 386,546 9.46% 424,890 9.82% Total exposure to corporate clients and
private banking 3,858,127 227,062 4,085,189 100.00% 4,324,673 100.00%
Exposure to retail customers and SMEs
Exposure to retail customers 809,613 376,361 1,185,974 70.78% 1,284,587 70.86% Exposure secured by residential real estate 401,877 - 401,877 24.00% 426,778 23.54% Exposure to SME 85,614 2,059 87,673 5.23% 101,485 5.60% Total exposure to retail customers and
SMEs 1,297,104 378,420 1,675,524 100.00% 1,812,850 100.00%
Total credit risk exposure* 6,137,827 720,685 6,858,512 100.00% 7,470,444 100.00%
*Excluding financial assets and derivatives.
The top five industries account for 50.50% (2016: 51.02%) of the total corporate portfolio, reflecting the traditional business areas of the Bank where it possesses strong expertise and profound industry practice.

CREDIT EUROPE BANK N.V.
NOTES TO CONSOLIDATED FINANCIAL STATEMENTS As of and for the period ended June 30, 2017 In thousands of EURO unless otherwise indicated
47
32.c. Geographical concentration The following table provides the distribution of the Bank’s credit exposure by risk country as of June 30, 2017:
Column1 1 2 3 4 5 6
June 30,
2017
Russia Turkey Romania Ukraine
Other
emerging
markets
Developed
markets
Total
exposure
Balance sheet items
Demand deposits with central banks 46,913 - 159,468 1,953 - 330,278 538,612
Financial assets designated at fair value through profit or loss - 9,625 1,167 - 26,253 3,101 40,146
Financial investments 6,569 88,365 145,579 - 939 420,529 661,981
Loans and receivables - banks 29,530 15,258 23,921 67 4,215 370,993 443,984
Loans and receivables - customers 1,475,770 1,128,810 850,585 42,128 122,356 1,535,582 5,155,231
Derivative financial instruments 2,191 132,095 106 16 57 196,065 330,530
Total balance sheet 1,560,973 1,374,153 1,180,826 44,164 153,820 2,856,548 7,170,484
Off-balance sheet items 237,862 58,994 160,146 3,168 96,853 163,662 720,685
Total credit-risk exposure 1,798,835 1,433,147 1,340,972 47,332 250,673 3,020,210 7,891,169
The following table provides the distribution of the Bank’s credit exposure by risk country as of December 31, 2016:
Column1 1 2 3 4 5 6
December
31, 2016
Russia Turkey Romania Ukraine
Other
emerging
markets
Developed
markets
Total
exposure
Balance sheet items
Demand deposits with central banks 10,899 - 124,191 897 - 842,072 978,059
Financial assets designated at fair value through profit or loss - - 1,082 - - 1,630 2,712
Financial investments 12,073 170,207 188,361 9,104 12,787 374,577 767,109
Loans and receivables - banks 29,150 16,813 12,780 5,359 6,830 236,659 307,591
Loans and receivables - customers 1,577,216 1,112,904 866,983 52,830 151,384 1,613,081 5,374,398
Derivative financial instruments 90 152,898 959 - - 190,446 344,393
Total balance sheet 1,629,428 1,452,822 1,194,356 68,190 171,001 3,258,465 7,774,262
Off-balance sheet items 258,891 98,092 151,593 2,760 51,834 247,226 810,396
Total credit-risk exposure 1,888,319 1,550,914 1,345,949 70,950 222,835 3,505,691 8,584,658

CREDIT EUROPE BANK N.V.
NOTES TO CONSOLIDATED FINANCIAL STATEMENTS As of and for the period ended June 30, 2017 In thousands of EURO unless otherwise indicated
48
32.d. Collaterals and other credit enhancements obtained
The Bank’s credit policy requires that the loan extension process is conducted with strong evidence of the customer’s ability to repay the loan. Collaterals are also actively used for the purposes of credit risk mitigation. In the tables below, collaterals are aggregated into two groups:
• Financial collaterals, which includes any kind of documentary collateral, such as bills of exchange or trade-related promissory notes. Cash collaterals, credit derivatives and other guarantees are also part of this group.
• Physical collaterals comprise other collaterals not mentioned under ‘financial collaterals’. Although the Bank accepts personal and corporate guarantees as collateral, they are not included in the tables below, due to their limited credit risk mitigation ability.
Breakdown of collateralized exposure by collateral type Column1 Column2 Column3 Column4 June 30,
2017
Total
exposure, net
Fair value of
financial
collaterals
Fair value of
physical
collaterals
Total
collaterals
obtained
Collaterals
to total net
exposure
Balance sheet
Demand deposits with central banks 538,612 - - - - Financial assets designated at fair value through profit or loss 40,146 - - - - Financial investments 661,981 - - - - Loans and receivables - banks 443,984 4,099 - 4,099 1% Loans and receivables - customers 5,155,231 135,850 2,107,108 2,242,958 44% Derivative financial instruments 330,530 35,264 - 35,264 11% Total balance sheet 7,170,484 175,213 2,107,108 2,282,321 32%
Off-balance sheet 720,685 15,496 17,512 33,008 5%
Total credit risk exposure 7,891,169 190,709 2,124,620 2,315,329 29%
Breakdown of collateralized exposure by collateral type Column1 Column2 Column3 Column4 December
31, 2016
Total
exposure, net
Fair value of
financial
collaterals
Fair value of
physical
collaterals
Total
collaterals
obtained
Collaterals
to total net
exposure
Balance sheet
Demand deposits with central banks 978,059 - - - - Financial assets designated at fair value through profit or loss 2,712 - - - - Financial investments 767,109 - - - - Loans and receivables - banks 307,591 48 - 48 0% Loans and receivables - customers 5,374,398 310,177 2,084,763 2,394,940 45% Derivative financial instruments 344,393 41,604 - 41,604 12% Total balance sheet 7,774,262 351,829 2,084,763 2,436,592 31%
Off-balance sheet 810,396 51,075 15,079 66,154 8%
Total credit risk exposure 8,584,658 402,904 2,099,842 2,502,746 29%
Collaterals for derivative financial instruments consist mostly of the margins called by the Bank for its OTC derivative assets.

CREDIT EUROPE BANK N.V.
NOTES TO CONSOLIDATED FINANCIAL STATEMENTS As of and for the period ended June 30, 2017 In thousands of EURO unless otherwise indicated
49
32.e. Credit quality of financial assets The following table presents the credit quality of the Bank’s financial assets, as of June 30, 2017 and December 31, 2016. In assessing the credit quality of its financial assets, the Bank obtains ratings from eligible credit assessment institutions, namely Fitch, Standard & Poor’s (S&P) and Moody’s. In order to compare assets, the ratings below were mapped to Fitch’s rating scale.
Column2 Column3 13 12 2 3 Column1
June 30,
2017
External rating class
AAA / AA- A+ / A-
BBB+ /
BBB- BB+ / B- Below B- No rating Total
Demand deposits with central banks 329,987 292 159,467 46,913 1,953 - 538,612
Financial assets designated at fair value through profit or loss 3,100 - 8,866 27,012 - 1,168 40,146
Financial investments 81,748 118,897 313,552 116,599 - 31,185 661,981
Loans and receivables - banks 83,586 189,629 22,624 64,745 9 83,391 443,984
Loans and receivables - customers 175,952 - 57,584 38,328 182,020 4,701,347 5,155,231
Derivative financial instruments 1,626 150,377 5,144 1,950 - 171,433 330,530
Off-balance sheet 735 209 73,475 37,992 6,968 224,945 344,324
Total 676,734 459,404 640,712 333,539 190,950 5,213,469 7,514,808
Column2 Column3 13 12 2 3 Column1
December
31, 2016
External rating class
AAA / AA- A+ / A-
BBB+ /
BBB- BB+ / B- Below B- No rating Total
Demand deposits with central banks 841,809 263 124,191 10,899 897 - 978,059
Financial assets designated at fair value through profit or loss 1,631 - - - - 1,081 2,712
Financial investments 41,847 108,249 341,112 231,456 9,104 35,341 767,109
Loans and receivables - banks 38,728 180,919 37,211 22,075 1 28,657 307,591
Loans and receivables - customers 397,964 - - 42,743 6,799 4,926,892 5,374,398
Derivative financial instruments 3,366 137,492 22,152 1,300 - 180,083 344,393
Off-balance sheet - 6,366 5,604 30,842 7,442 760,142 810,396
Total 1,325,345 433,289 530,270 339,315 24,243 5,932,196 8,584,658
The assets in the tables above are allocated through the rating bucket following the principles imposed by the Basel II accord. Where multiple credit assessments are available, a ‘second worst’ is taken into account.
The total amount of impaired assets included in the tables above is EUR 392,362 (2016: EUR 378,386). The total amount of provisions allocated for these assets is EUR 129,266 (2016: EUR 125,203), while EUR 925 is allocated for loans to banks.

CREDIT EUROPE BANK N.V.
NOTES TO CONSOLIDATED FINANCIAL STATEMENTS As of and for the period ended June 30, 2017 In thousands of EURO unless otherwise indicated
50
Loans and receivables - customers The next section provides a detailed overview of the credit quality of the Bank’s loans and advances portfolio. CEB’s current Loan Assessment and Impairment Policy is aligned with the industry practices and regulatory requirements. Our loan classification approach is based on the respective recovery capabilities and debtors’ creditworthiness levels, providing the management and the external stakeholders a detailed and a transparent overview of the portfolio’s credit quality. In 2015, the Bank revised its Loan Assessment and Impairment Policy according to the EBA’s technical standards on non-performing and forbearance exposures.
CEB differentiates between the following categories of assets in the loan portfolio:
• “Performing loans” cover corporate, retail, SME loans on which payments are made according to the contractual terms, repayment problems are not expected in the future and which are totally recoverable (collectable).
• “Sub-standard” term has different implications for corporate and retail & SME clients. From corporate banking perspective it includes performing forborne loans and customers with positive ‘warning signals’. For retail & SME customers the term means loans with a delay in contractual payment of no more than 90 days.
• Non-Performing Loans (NPL) includes loans and receivables with limited (doubtful) recovery prospects. These clients: • have limited means for total recovery because their repayment capacity is inadequate to cover
payments on respective terms; they are likely to lead to losses if these problems are not solved; or,
• are in a situation where full or partial recovery prospects are fully dependent on the outcome of the liquidation of the underlying assets or recourse to the guarantor; or,
• have suffered significant credit quality deterioration; or, • have delayed the capital and/or interest payments for more than 90 days as of the day of their
payment date.
To be able to monitor delinquent corporate loans in a more structured way the Bank developed NPL & forbearance screens on solo level and strive to spread the system across subsidiaries.
Impairment allowances The Bank aims to maintain sufficient reserves to cover its incurred losses. According to its policy, the Bank differentiates between:
• Provisions for individually assessed assets
• Provisions for collectively assessed assets
Individual Assessment
All Sub-standard and NPL customers are analysed individually, regardless of size. Performing loans are subject to individual assessment only if they are deemed ‘significant’. The ‘significance criterion’ is established at global level, and amounts to EUR 1 million. In terms of individual assessment, the trigger point for impairment is formal classification of an account as exhibiting serious financial problems and where any further deterioration is likely to lead to failure. Two key inputs to the cash flow calculation are the valuation of all security and collateral and the timing of all asset realizations.
Collective Assessment
The Bank identifies loans to be evaluated for impairment on an individual basis and segments the remainder of the portfolio into groups of loans with similar credit characteristics. The Bank classifies its corporate portfolio either on an obligor or a transactional rating scale, where corresponding probability of default “PD” or expected loss “EL” figures are readily available.
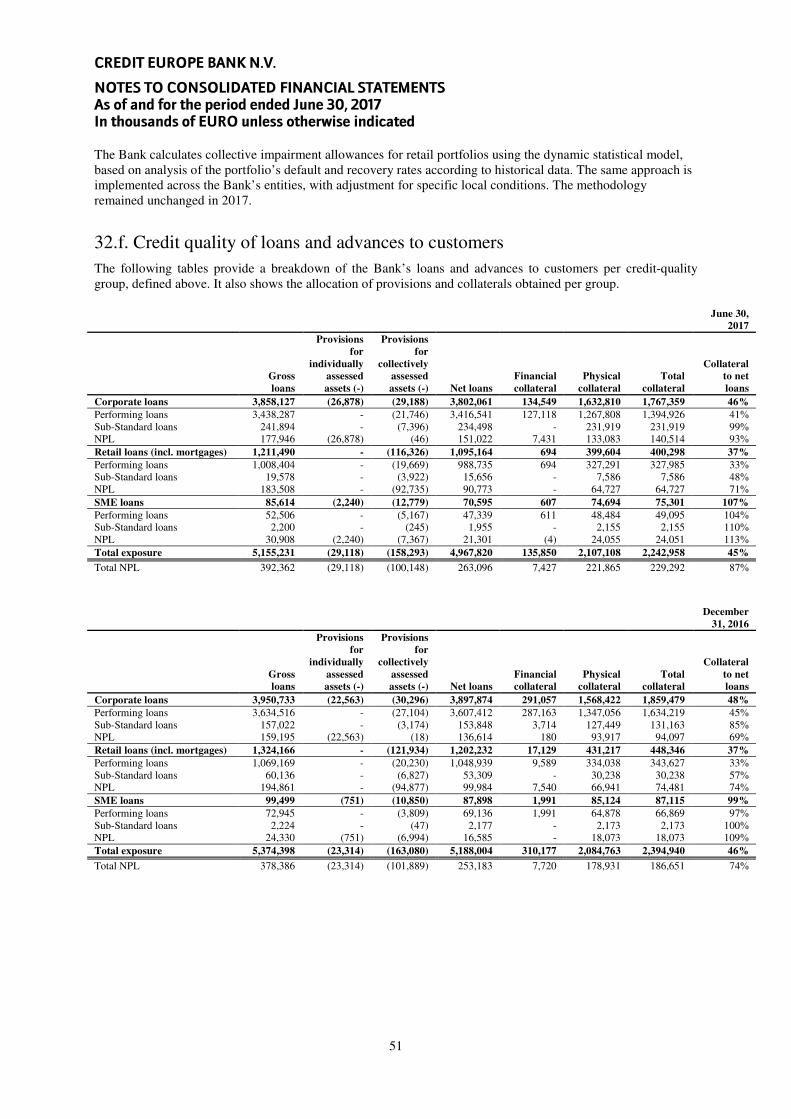
CREDIT EUROPE BANK N.V.
NOTES TO CONSOLIDATED FINANCIAL STATEMENTS As of and for the period ended June 30, 2017 In thousands of EURO unless otherwise indicated
51
The Bank calculates collective impairment allowances for retail portfolios using the dynamic statistical model, based on analysis of the portfolio’s default and recovery rates according to historical data. The same approach is implemented across the Bank’s entities, with adjustment for specific local conditions. The methodology remained unchanged in 2017.
32.f. Credit quality of loans and advances to customers The following tables provide a breakdown of the Bank’s loans and advances to customers per credit-quality group, defined above. It also shows the allocation of provisions and collaterals obtained per group.
Column2 Column3 13 12 2 3 4 Column1
June 30,
2017
Gross
loans
Provisions
for
individually
assessed
assets (-)
Provisions
for
collectively
assessed
assets (-) Net loans
Financial
collateral
Physical
collateral
Total
collateral
Collateral
to net
loans
Corporate loans 3,858,127 (26,878) (29,188) 3,802,061 134,549 1,632,810 1,767,359 46%
Performing loans 3,438,287 - (21,746) 3,416,541 127,118 1,267,808 1,394,926 41% Sub-Standard loans 241,894 - (7,396) 234,498 - 231,919 231,919 99% NPL 177,946 (26,878) (46) 151,022 7,431 133,083 140,514 93% Retail loans (incl. mortgages) 1,211,490 - (116,326) 1,095,164 694 399,604 400,298 37%
Performing loans 1,008,404 - (19,669) 988,735 694 327,291 327,985 33% Sub-Standard loans 19,578 - (3,922) 15,656 - 7,586 7,586 48% NPL 183,508 - (92,735) 90,773 - 64,727 64,727 71% SME loans 85,614 (2,240) (12,779) 70,595 607 74,694 75,301 107%
Performing loans 52,506 - (5,167) 47,339 611 48,484 49,095 104% Sub-Standard loans 2,200 - (245) 1,955 - 2,155 2,155 110% NPL 30,908 (2,240) (7,367) 21,301 (4) 24,055 24,051 113% Total exposure 5,155,231 (29,118) (158,293) 4,967,820 135,850 2,107,108 2,242,958 45%
Total NPL 392,362 (29,118) (100,148) 263,096 7,427 221,865 229,292 87%
Column2 Column3 13 12 2 3 4 Column1
December
31, 2016
Gross
loans
Provisions
for
individually
assessed
assets (-)
Provisions
for
collectively
assessed
assets (-) Net loans
Financial
collateral
Physical
collateral
Total
collateral
Collateral
to net
loans
Corporate loans 3,950,733 (22,563) (30,296) 3,897,874 291,057 1,568,422 1,859,479 48%
Performing loans 3,634,516 - (27,104) 3,607,412 287,163 1,347,056 1,634,219 45% Sub-Standard loans 157,022 - (3,174) 153,848 3,714 127,449 131,163 85% NPL 159,195 (22,563) (18) 136,614 180 93,917 94,097 69% Retail loans (incl. mortgages) 1,324,166 - (121,934) 1,202,232 17,129 431,217 448,346 37%
Performing loans 1,069,169 - (20,230) 1,048,939 9,589 334,038 343,627 33% Sub-Standard loans 60,136 - (6,827) 53,309 - 30,238 30,238 57% NPL 194,861 - (94,877) 99,984 7,540 66,941 74,481 74% SME loans 99,499 (751) (10,850) 87,898 1,991 85,124 87,115 99%
Performing loans 72,945 - (3,809) 69,136 1,991 64,878 66,869 97% Sub-Standard loans 2,224 - (47) 2,177 - 2,173 2,173 100% NPL 24,330 (751) (6,994) 16,585 - 18,073 18,073 109% Total exposure 5,374,398 (23,314) (163,080) 5,188,004 310,177 2,084,763 2,394,940 46%
Total NPL 378,386 (23,314) (101,889) 253,183 7,720 178,931 186,651 74%

CREDIT EUROPE BANK N.V.
NOTES TO CONSOLIDATED FINANCIAL STATEMENTS As of and for the period ended June 30, 2017 In thousands of EURO unless otherwise indicated
52
Further credit quality breakdown of retail loans are as below: Column2 Column3 13 12 Column1 June 30, 2017
Gross loans Provisions (-) Net loans
Total
collateral
Collateral to
net loans
Credit cards 332,585 (16,030) 316,555 - -
Performing loans 318,328 (4,959) 313,369 - -
Sub-Standard loans - - - - -
NPL 14,257 (11,071) 3,186 - -
Car loans 186,460 (13,225) 173,235 186,317 108%
Performing loans 170,130 (3,650) 166,480 170,130 102% Sub-Standard loans 850 (630) 220 850 386% NPL 15,480 (8,945) 6,535 15,337 235% Mortgage 401,877 (60,064) 341,813 213,013 62%
Performing loans 256,323 (6,480) 249,843 156,953 63% Sub-Standard loans 14,767 (461) 14,306 6,735 47% NPL 130,787 (53,123) 77,664 49,325 64% Other retail 290,568 (27,007) 263,561 968 -
Performing loans 263,624 (4,581) 259,043 903 - Sub-Standard loans 3,960 (2,830) 1,130 - - NPL 22,984 (19,596) 3,388 65 2% Total retail exposure 1,211,490 (116,326) 1,095,164 400,298 37%
Total NPL 183,508 (92,735) 90,773 64,727 71%
Column2 Column3 13 12 Column1
December 31,
2016
Gross loans Provisions (-) Net loans
Total
collateral
Collateral to
net loans
Credit cards 364,897 (18,394) 346,503 - -
Performing loans 348,800 (5,811) 342,989 - - Sub-Standard loans - - - - - NPL 16,097 (12,583) 3,514 - - Car loans 201,898 (18,017) 183,881 201,755 110%
Performing loans 177,393 (3,317) 174,076 177,393 102% Sub-Standard loans 4,290 (2,028) 2,262 4,290 165% NPL 20,215 (12,672) 7,543 20,072 254% Mortgage 426,779 (54,445) 372,334 229,124 62%
Performing loans 249,250 (5,791) 243,459 156,375 67% Sub-Standard loans 46,227 (1,555) 44,672 25,948 55% NPL 131,302 (47,099) 84,203 46,801 74%
Other retail 330,592 (31,078) 299,514 17,467 6%
Performing loans 293,726 (5,467) 288,259 9,859 5% Sub-Standard loans 9,619 (3,088) 6,531 - 39% NPL 27,247 (22,523) 4,724 7,608 80% Total retail exposure 1,324,166 (121,934) 1,202,232 448,346 37%
Total NPL 194,861 (94,877) 99,984 74,481 74%
Strong collateralization forms a major component of CEB’s risk appetite lending criteria and we believe this substantially mitigates the losses CEB might incur otherwise. The table above shows the collaterals held by the Bank against credit exposures. These valuations are renewed at least annually and conducted mostly by third party appraisers. In certain cases, particularly residential mortgage loans, CEB could employ internal appraisers but ensure that all internal valuations are benchmarked against market prices.
The total amount of NPL as of June 30, 2017 is EUR 392,362 (2016: EUR 378,386). The total NPL ratio as of June 30, 2017, is 7.61% (2016: 7.04%). The Bank ensures that it allocates sufficient reserves to maintain a high level of provisioning coverage for its non-performing loans (NPL) after taking into account the fair value of collaterals obtained. Thus the total coverage for Bank’s NPL as of June 30, 2017 is 106% (2016: 99%).

CREDIT EUROPE BANK N.V.
NOTES TO CONSOLIDATED FINANCIAL STATEMENTS As of and for the period ended June 30, 2017 In thousands of EURO unless otherwise indicated
53
The evolution of the net NPL ratio after deduction of the provisions can be seen in the below table.
FN_LAR2 June 30,
2017
December 31,
2016
Loans to customers (Gross) 5,155,231 5,374,398 NPLs (Gross) 392,362 378,386 Provisions (187,411) (186,394)
NPLs (Net) 204,951 191,992
Net NPL ratio 4.1% 3.7%
In case CEB considers a loan as uncollectible partially or in full, the associated principal and interest are written-off. Once the exposure is derecognized, both the gross carrying amount of the loan and the corresponding impairment for credit losses are reduced accordingly. In this respect, the exposure amounts disclosed above are gross of any impairment, but net of write-offs.
As of June 30, 2017, the performing forbearance measure of the total loan portfolio is EUR 261,621 (2016: 214,424).
32.g. Aging of loans and advances to customers The tables below present the Bank’s portfolio of loans and advances to customers, broken down by delinquency bucket:
Column1 1 2 3 4 6
June 30,
2017
Gross Exposure
Loans that
are not past
due
Loans less
than 30 days
past due
Loans 30 or
more but less
than 60 days
past due
Loans 60 or
more but less
than 90 days
past due
Loans 90
days or more
past due
Total loans
to customers
Corporate loans 3,623,816 45,434 13,030 1,830 174,017 3,858,127 Retail loans and residential mortgage loans 913,271 65,077 29,826 19,809 183,507 1,211,490 SME loans 50,662 1,967 666 1,411 30,908 85,614 Total loans and advances to customers 4,587,749 112,478 43,522 23,050 388,432 5,155,231
Column1 1 2 3 4 6
December
31, 2016
Gross Exposure
Loans that
are not past
due
Loans less
than 30 days
past due
Loans 30 or
more but less
than 60 days
past due
Loans 60 or
more but less
than 90 days
past due
Loans 90
days or more
past due
Total loans
to customers
Corporate loans 3,795,035 14,466 3,957 24,509 112,766 3,950,733 Retail loans and residential mortgage loans 997,949 73,321 29,090 29,492 194,314 1,324,166 SME loans 66,786 5,147 2,336 901 24,329 99,499 Total loans and advances to customers 4,859,770 92,934 35,383 54,902 331,409 5,374,398

CREDIT EUROPE BANK N.V.
NOTES TO CONSOLIDATED FINANCIAL STATEMENTS As of and for the period ended June 30, 2017 In thousands of EURO unless otherwise indicated
54
32.h. Geographical concentration of loans advanced to customers, broken down by counterparty type The following tables breaks down customers’ loans and receivables by risk country:
Column2 Column3 13 12 3 4 Column1
June 30,
2017
Gross exposure Russia Romania Turkey Ukraine
Other
emerging
markets
Developed
markets
Total
exposure
Corporate loans 745,311 350,867 1,128,810 40,465 122,356 1,470,318 3,858,127
Performing loans 595,697 269,519 1,059,657 2,972 122,356 1,388,087 3,438,288 Sub-Standard loans 96,300 31,577 45,137 14,435 - 54,444 241,893 NPL 53,314 49,771 24,016 23,058 - 27,787 177,946 Retail loans (incl. mortgages) 677,954 466,609 - 1,663 - 65,264 1,211,490
Performing loans 633,535 310,515 - 556 - 63,799 1,008,405 Sub-Standard loans 4,821 14,752 - 4 - - 19,577 NPL 39,598 141,342 - 1,103 - 1,465 183,508 SME loans 52,505 33,109 - - - - 85,614
Performing loans 32,233 20,273 - - - - 52,506 Sub-Standard loans - 2,200 - - - - 2,200 NPL 20,272 10,636 - - - - 30,908
Total exposure 1,475,770 850,585 1,128,810 42,128 122,356 1,535,582 5,155,231
Column2 Column3 13 12 3 4 Column1
December
31, 2016
Gross exposure Russia Romania Turkey Ukraine
Other
emerging
markets
Developed
markets
Total
exposure
Corporate loans 776,896 336,468 1,112,904 50,777 151,384 1,522,304 3,950,733
Performing loans 710,838 269,401 1,073,279 11,632 136,017 1,433,349 3,634,516 Sub-Standard loans 20,531 20,929 4,991 31,066 - 79,505 157,022 NPL 45,527 46,138 34,634 8,079 15,367 9,450 159,195 Retail loans (incl. mortgages) 740,649 490,687 - 2,053 - 90,777 1,324,166
Performing loans 678,990 304,470 - 712 - 84,997 1,069,169 Sub-Standard loans 10,397 45,931 - 3 - 3,805 60,136 NPL 51,262 140,286 - 1,338 - 1,975 194,861 SME loans 59,671 39,828 - - - - 99,499
Performing loans 46,850 26,095 - - - - 72,945 Sub-Standard loans - 2,224 - - - - 2,224 NPL 12,821 11,509 - - - - 24,330
Total exposure 1,577,216 866,983 1,112,904 52,830 151,384 1,613,081 5,374,398

CREDIT EUROPE BANK N.V.
NOTES TO CONSOLIDATED FINANCIAL STATEMENTS As of and for the period ended June 30, 2017 In thousands of EURO unless otherwise indicated
55
32.i. Liquidity risk The Bank defines liquidity risk as the current or prospective risk to earnings and capital arising from an institution’s inability to meet its liabilities when they come due. CEB considers funding and liquidity as a major source of risk. CEB’s minor and very limited tolerance towards liquidity risk is explicitly reflected its stress-testing and funding plan framework.
Stress-Test Scenarios
The Bank uses stress testing to verify that its liquidity buffer is adequate to withstand severe but plausible funding conditions. The outcome the stress testing shows the Bank the level of required liquidity across different time horizons. In this respect, the design and frequency of the stress test scenarios reveal the Bank’s risk appetite and preparedness to withstand a liquidity crisis. The main components of the required liquidity are as follows:
• The duration of the stress-tests. • Run-off rates on retail and wholesale funding. • Erosion in the value of liquid assets. • The liquidity-related consequences of market risks. • Additional margin calls / collaterals required. • Restrictions in respect of the availability of assets.
The Bank maintains a buffer of ‘readily available liquid assets’ to prevent mismatches between the inflow and outflow of the Bank as a consequence of both foreseen and unforeseen circumstances. The definition of this liquidity cushion and the principles regarding its size and composition are directly linked to the Bank’s ‘minor risk appetite’:
• The list of eligible liquid assets. • Liquidity value of liquid assets (i.e. haircuts) and the time-to-liquidity period. • The treatment of non-marketable assets. • The assumptions made in respect of the possibilities for rolling over the various funding lines such as
wholesale and retail funding. • The assumptions made in respect of the possibilities for rolling over the maturing assets. • The use of secured / unsecured central bank facilities.
The Bank ensures that its available liquidity is larger than the required amount implied by its stress scenarios at all times.
Funding Plan & Strategy
The Bank’s key funding principles also form an essential part of its liquidity risk appetite:
• Alignment with the asset profile and asset strategy • Alignment with the liquidity risk appetite • Minimizing any funding deficit risk by ensuring granular and stable funding • Support the Bank’s overall objective of achieving an investment grade rating • Satisfy any minimum requirements from regulatory authorities • Management of asset encumbrance

CREDIT EUROPE BANK N.V.
NOTES TO CONSOLIDATED FINANCIAL STATEMENTS As of and for the period ended June 30, 2017 In thousands of EURO unless otherwise indicated
56
Based on remaining contractual maturity 1 2 3 4 5 6
June 30,
2017
Up to 1
month 1–3 months 3–12 months 1-5 Year Over 5 years
Maturity
not
applicable Total
Assets
Cash and balances at central banks 595,134 - - - - - 595,134
Financial assets designated at FVPL 4,715 8,772 17,541 7,950 - 1,168 40,146
Financial investments 74,590 73,190 82,876 125,889 276,458 28,978 661,981
Loans and receivables – banks 417,004 10,468 12,579 3,008 - - 443,059
Loans and receivables – customers 752,627 668,913 761,197 1,646,051 875,936 263,096 4,967,820
Tangible and intangible assets - - - - - 304,654 304,654
Other assets 65,641 68,473 145,210 108,839 29,396 70,980 488,539
Total assets 1,909,711 829,816 1,019,403 1,891,737 1,181,790 668,876 7,501,333
Liabilities
Due to banks 231,917 16,885 106,433 185,187 - - 540,422
Due to customers 1,227,225 387,777 1,383,174 1,480,731 643,700 - 5,122,607
Issued debt securities 87,069 77 1,203 29,929 - - 118,278
Other liabilities 76,823 65,367 118,777 90,366 29,344 22,410 403,087
Subordinated liabilities - - - 85,115 360,766 - 445,881
Total liabilities 1,623,034 470,106 1,609,587 1,871,328 1,033,810 22,410 6,630,275
Cumulative liquidity gap 286,677 646,387 56,203 76,612 224,592 871,058 871,058
Based on remaining contractual maturity 1 2 3 4 5 6
December
31, 2016
Up to 1
month 1–3 months 3–12 months 1-5 Year Over 5 years
Maturity
not
applicable Total
Assets Cash and balances at central banks 1,041,371 - - - - - 1,041,371
Financial assets designated at FVPL 1,630 - - - - 1,082 2,712
Financial investments 39,329 20,951 82,600 281,071 315,074 28,084 767,109
Loans and receivables – banks 294,141 10,179 2,346 - - - 306,666
Loans and receivables – customers 727,207 546,926 821,577 1,912,460 926,651 253,183 5,188,004
Tangible and intangible assets - - - - - 265,347 265,347
Other assets 56,171 43,305 194,974 122,457 - 122,389 539,296
Total assets 2,159,849 621,361 1,101,497 2,315,988 1,241,725 670,085 8,110,505
Liabilities
Due to banks 151,897 25,302 92,590 178,528 - - 448,317
Due to customers 1,368,509 456,573 1,447,042 1,555,848 703,559 - 5,531,531
Issued debt securities 9,217 48,480 205,121 159 - - 262,977
Other liabilities 106,227 47,748 173,532 113,389 473 31,227 472,596
Subordinated liabilities - - - 92,798 438,528 - 531,326
Total liabilities 1,635,850 578,103 1,918,285 1,940,722 1,142,560 31,227 7,246,747
Cumulative liquidity gap 523,999 567,257 (249,531) 125,735 224,900 863,758 863,758

CREDIT EUROPE BANK N.V.
NOTES TO CONSOLIDATED FINANCIAL STATEMENTS As of and for the period ended June 30, 2017 In thousands of EURO unless otherwise indicated
57
Management expects that the cash flows from certain financial assets and liabilities will be different from their contractual terms either because management has the discretionary ability to manage the cash flows or because past experience indicates that cash flows will differ from contractual terms.
Current accounts and demand deposits from customers are distributed in accordance with the average monthly withdrawal behaviour of customers over the last 7 years on the basis of management`s belief that despite of these funds from customers being on demand, diversification of these deposits by number and type of depositors, and the past experience of the Group, indicates that these deposits provide a stable source of funding.
As at June 30, 2017 and December 31, 2016 , the contractual maturities of customer deposits are as follows:
RM_MTRT_3 June 30, 2017 December 31, 2016
Up to 1 month 2,496,466 2,611,600 1-3 months 241,433 404,541 3-12 months 1,187,029 1,307,770 1-5 years 1,052,461 1,028,512 Over 5 year 145,218 179,108 Total 5,122,607 5,531,531
32.j. Market risks
Market risk is defined as the current or prospective threat to the Bank’s earnings and capital as a result of adverse market movements in market prices (security and derivative prices, as well as interest rates and foreign exchange rates) or in parameters such as volatility and correlations. The trading portfolio includes financial instruments, such as securities, derivatives and loans to financial institutions, which are exposed to short-term price/interest-rate fluctuations. Eligible positions should be in line with the guidelines and principles set out in the market-risk policy. No eligible positions and financial instruments approved by ALCO are monitored within the scope of the banking book. In line with its business plan, the Bank has a ‘minor’ risk appetite in market risk. The Bank aims to regularly measure and monitor its market risk associated with adverse market movements affecting the trading components of its Treasury and FI portfolio. It measures its market risk using different approaches - standard and internal models. Bank risk tolerance in the form of limits is determined to manage market risk efficiently and keep it within these limits. Risk limits, such as the Value-at-Risk (VaR) limit, notional limits and sensitivity limits, are set by considering the primary risk factors. In case of a limit breach, ALCO is convened to determine strategy and take necessary actions to restore the outstanding exposure within limits in a certain period of time. The Bank measures the market risk of its trading book and the foreign-exchange risk of its banking book by using an internal historical simulation method, based on VaR methodology. VaR defines the maximum loss not exceeded with a given probability over a given period of time under normal market conditions. However, this approach fails to capture exceptional losses under extreme market conditions; that is why market risk measurement is complemented by periodic stress-testing analysis. The internal historical simulation method of VaR model is used for risk-monitoring purposes and whereas regulatory capital for market risk is calculated and reported quarterly according to the Standard Approach, as specified in the DNB’s market-risk regulations. The internal historical simulation method is used starting from January 2013. The last 250 historical daily returns of market risk factors are used to stress the current trading positions to estimate possible fluctuations caused by market movements while keeping the portfolio fixed. The internal limit for the 10-day trading portfolio, with VaR at 99% - confidence interval, is EUR 8 million (2016: EUR 8 million). This implies that diversified VaR from foreign-exchange risk and interest-rate risk in the trading book should not exceed this level. Other market risks, such as liquidity, re-pricing and interest-rate risk, on the banking book are measured and

CREDIT EUROPE BANK N.V.
NOTES TO CONSOLIDATED FINANCIAL STATEMENTS As of and for the period ended June 30, 2017 In thousands of EURO unless otherwise indicated
58
monitored through sensitivity and gap analyses, detailed in subsequent sections.
Value-at-risk figures - Trading
Book (2017) Total
Diversification
effect
Interest-rate
risk
Foreign-
exchange risk
Average 709 78% 623 204 Maximum 2,134 97% 2,188 260 Minimum 194 54% 8 59 Period-end 325 74% 223 214
Value-at-risk figures - Trading
Book (2016) Total
Diversification
effect
Interest-rate
risk
Foreign-
exchange risk
Average 461 89% 353 144 Maximum 1,831 100% 1,829 792 Minimum 12 35% - 6 Period-end 211 94% 207 17
32.k. Interest-rate risk in the banking book One of the Bank’s major risks under Pillar II is the interest-rate risk on the banking book. The Bank defines interest-rate risk as the current or prospective risk to earnings and capital arising from adverse movements in interest rates. The trading book is also subject to interest-rate risk, but this type of risk is dealt with under the Market Risk: Value-at-Risk section. The Bank has a ‘minor’ risk tolerance towards interest-rate risk in its banking book.
The Bank’s interest-rate risk is monitored for the banking book by means of static re-pricing gap and interest rate sensitivity analyses once a month at all levels and for each major currency in use. Interest-rate sensitivity in the banking book is calculated according to the economic-value approach. All future cash flows, arising solely from on- and off- balance sheet assets and liabilities are discounted back to their present values with zero-coupon yield curves to see the impact of interest-rate changes on the economic value of the Bank. The impact of the curve with the maximum net gain or loss compared to a benchmark curve is analysed.
Interest-rate sensitivity in the banking book is measured by means of PV01 method. The PV01 method is based on flat upward shifts of each currency’s yield curve in magnitudes of one basis point. The economic value impact of these shifts on the banking book is then analysed. PV01 analysis is complemented with 200 basis-points (bps) scenarios, which consist of the parallel shifts of the yield curves by shifting short-term rates and long-term rates for each individual currency. The interest rate risk on the banking book, excluding the trading book has been calculated as EUR 20.3 million for 2017 with 200 basis point upward parallel rate shock (2016: EUR 38.7 million).
The impact of the curve with the maximal net gain or loss compared to a benchmark curve is then analyzed.
Determination of economic internal capital to be set aside to cover potential interest-rate risk in the banking book is based on a Historical Simulation method. Historical economic values of the current banking book are calculated by discounting the re-pricing gaps in each of the major currencies with historical month-end zero-coupon swap curves in pre-defined maturity buckets. Once historical economic values are obtained, an economic value change distribution is created using a rolling window of one year.
The interest rate repricing gap table below is prepared to determine the Bank’s exposure to interest rate risk as a result of maturity mismatches in its balance sheet. Repricing is based on remaining days to maturity for fixed rate instruments and next repricing date for floating rate instruments.

CREDIT EUROPE BANK N.V.
NOTES TO CONSOLIDATED FINANCIAL STATEMENTS As of and for the period ended June 30, 2017 In thousands of EURO unless otherwise indicated
59
RM_REPRICE_1 1 2 3 4 5 6
June 30,
2017
Up to 1
month 1–3 months
3–12
months 1-5 Year
Over 5
years
Non-
interest-
bearing
items(*) Total
Assets Cash and balances at central banks 454,183 - - - - 140,951 595,134 Financial assets designated at FVPL 536 17,575 16,748 - - 5,287 40,146 Financial investments 48,935 205,467 82,880 94,158 181,576 48,965 661,981 Loans and receivables - banks 329,107 10,459 12,570 3,008 - 87,915 443,059 Loans and receivables - customers 1,369,952 1,199,211 1,346,200 743,671 125,220 183,566 4,967,820 Tangible and intangible assets - - - - - 304,654 304,654 Other assets - - - - - 488,539 488,539 Total assets 2,202,713 1,432,712 1,458,398 840,837 306,796 1,259,877 7,501,333
Liabilities
Due to banks 141,652 112,925 102,639 180,085 - 3,121 540,422 Due to customers 2,026,481 301,189 1,093,610 925,422 138,943 636,962 5,122,607 Issued debt securities 87,069 22,179 9,030 - - - 118,278 Other liabilities - - - - - 403,087 403,087 Subordinated liabilities - - 361,816 84,065 - - 445,881 Total liabilities 2,255,202 436,293 1,567,095 1,189,572 138,943 1,043,170 6,630,275
Off-balance interest-sensitivity gap 219,940 133,434 (90,777) (171,113) (67,758) - 23,726
Net gap 167,451 1,129,853 (199,474) (519,848) 100,095 216,707 678,077
(*) Non-interest-bearing items are not taken into account in the net gap.
RM_REPRICE_2 Column1 Column2 Column3 Column4 Column5 Column6
December
31, 2016
Up to 1
month 1–3 months
3–12
months 1-5 Year
Over 5
years
Non-
interest-
bearing
items(*) Total
Assets Cash and balances at central banks 923,629 - - - - 117,742 1,041,371 Financial assets designated at FVPL - - - - - 2,712 2,712 Financial investments 114,463 46,204 90,760 207,021 271,567 37,094 767,109 Loans and receivables - banks 167,804 19,630 2,271 - - 116,961 306,666 Loans and receivables - customers 1,438,955 1,018,539 1,149,021 1,149,029 175,809 256,651 5,188,004 Tangible and intangible assets - - - - - 265,347 265,347 Other assets - - - - - 539,296 539,296 Total assets 2,644,851 1,084,373 1,242,052 1,356,050 447,376 1,335,803 8,110,505
Liabilities
Due to banks 119,995 68,102 88,906 169,451 - 1,863 448,317 Due to customers 2,195,111 373,186 1,120,349 992,708 174,458 675,719 5,531,531 Issued debt securities 9,218 48,479 205,121 159 - - 262,977 Other liabilities - - - - - 472,596 472,596 Subordinated liabilities - 47,434 1,132 482,760 - - 531,326 Total liabilities 2,324,324 537,201 1,415,508 1,645,078 174,458 1,150,178 7,246,747
Off-balance interest-sensitivity gap 203,323 107,815 (160,745) (184,620) (18,000) - (52,227)
Net gap 523,850 654,987 (334,201) (473,648) 254,918 185,625 625,906
(*) Non-interest-bearing items are not taken into account in the net gap.

CREDIT EUROPE BANK N.V.
NOTES TO CONSOLIDATED FINANCIAL STATEMENTS As of and for the period ended June 30, 2017 In thousands of EURO unless otherwise indicated
60
32.l. Currency risk The Bank has limits and controls on its open currency positions determined by the Bank’s internal risk appetite statement as well as any regulatory restrictions. The Bank uses derivative financial instruments to hedge its on-balance sheet currency positions. The credit risk arising from these instruments is managed together with the risks resulting from market fluctuations. The Bank monitors the risks of forward transactions, options and other similar agreements, reviews open positions with the ALCO and takes appropriate action where deemed necessary. The Bank also differentiates between its trading and structural currency positions. The result of structural currency positions –which arises due to the Bank’s net investments in foreign subsidiaries and branches, together with any related net investment hedges (see note 8), is recognized in equity. Trading-related currency positions are quantified with VaR methodology and reported daily for the Bank level and monthly on a consolidated level. The VaR limits and other market risks related issues are monitored by the Risk Management Department and discussed in ALCO meetings on a regular basis. The VaR limit (see note 32.j.) is inclusive of the foreign-exchange risk.

CREDIT EUROPE BANK N.V.
NOTES TO CONSOLIDATED FINANCIAL STATEMENTS As of and for the period ended June 30, 2017 In thousands of EURO unless otherwise indicated
61
Currency analysis for the year ended June 30, 2017:
RM_CCY_1 EUR(*) USD CHF RON RUB UAH TRY Others Total
Cash and balances with central banks 322,904 5,360 52,570 128,763 83,048 2,017 - 472 595,134
Financial assets designated at FVPL 17,203 21,775 - 1,168 - - - - 40,146
Financial investments 421,143 83,645 9,825 143,517 3,851 - - - 661,981
Loans and receivables – banks 297,173 93,252 2,518 13,220 28,742 - 4,924 3,230 443,059
Loans and receivables – customers 2,169,887 1,319,362 133,279 186,873 770,965 10,519 370,853 6,082 4,967,820
Derivative financial instruments 272,107 33,344 924 431 821 16 17,707 5,180 330,530
Equity-accounted investments 5,836 - - - - - - - 5,836
Property and equipment 52,934 192,543 655 15,405 30,187 42 - - 291,766
Goodwill and other intangible assets 2,986 2,426 - 1,664 5,809 3 - - 12,888
Other assets 31,258 7,196 1,309 58,993 46,266 1,746 4,780 625 152,173
Total assets 3,593,431 1,758,903 201,080 550,034 969,689 14,343 398,264 15,589 7,501,333
Due to banks 372,570 76,486 125 68,069 6,098 693 1,521 14,860 540,422
Due to customers 3,383,339 569,606 6,074 393,837 721,349 8,911 6,167 33,324 5,122,607
Derivative financial instruments 226,558 37,299 919 223 4,735 - 23,219 5,170 298,123
Issued debt securities - 534 - - 117,744 - - - 118,278
Other liabilities 38,123 7,278 31,842 8,696 14,146 1,205 3,672 2 104,964
Subordinated liabilities - 445,881 - - - - - - 445,881
Total liabilities 4,020,590 1,137,084 38,960 470,825 864,072 10,809 34,579 53,356 6,630,275
Net on-balance sheet position - 621,819 162,120 79,209 105,617 3,534 363,685 (37,767) 1,298,217
Off-balance sheet net position - (589,651) (164,013) (85,988) (8,728) (6,251) (359,943) 36,608 (1,177,966) Net open position - 32,168 (1,893) (6,779) 96,889 (2,717) 3,742 (1,159) 120,251
(*) Euros are not included in the total net position, since it is the functional currency of the parent.
Currency analysis for the year ended December 31, 2016:
RM_CCY_2 EUR(*) USD CHF RON RUB UAH TRY Others Total
Cash and balances with central banks 794,659 7,693 56,258 127,812 53,789 914 - 246 1,041,371
Financial assets designated at FVPL - 1,630 - 1,082 - - - - 2,712
Financial investments 418,567 133,924 10,225 186,217 9,072 9,104 - - 767,109
Loans and receivables – banks 142,562 128,227 1,358 499 28,043 - 949 5,028 306,666
Loans and receivables – customers 2,210,993 1,566,629 149,449 201,984 841,061 13,428 201,370 3,090 5,188,004
Derivative financial instruments 269,162 49,271 1,289 14 490 - 12,562 11,605 344,393
Equity-accounted investments 5,803 - - - - - - - 5,803
Property and equipment 53,506 149,489 628 15,669 32,984 57 - - 252,333
Goodwill and other intangible assets 3,196 2,625 - 1,469 5,717 4 3 - 13,014
Other assets 39,764 13,830 460 66,993 65,232 1,727 639 455 189,100
Total assets 3,938,212 2,053,318 219,667 601,739 1,036,388 25,234 215,523 20,424 8,110,505
Due to banks 276,517 105,944 127 37,640 10,168 - 245 17,676 448,317
Due to customers 3,704,843 667,331 5,422 455,845 640,269 9,337 30,666 17,818 5,531,531
Derivative financial instruments 284,788 53,065 1,327 1,512 2,653 36 19,729 11,596 374,706
Issued debt securities - 9,058 - - 253,919 - - - 262,977
Other liabilities 27,692 8,520 32,145 8,592 19,214 1,344 376 7 97,890
Subordinated liabilities - 531,326 - - - - - - 531,326
Total liabilities 4,293,840 1,375,244 39,021 503,589 926,223 10,717 51,016 47,097 7,246,747
Net on-balance sheet position - 678,074 180,646 98,150 110,165 14,517 164,507 (26,673) 1,219,386
Off-balance sheet net position - (693,938) (182,480) (107,132) (7,177) (13,008) (159,380) 27,588 (1,135,527) Net open position - (15,864) (1,834) (8,982) 102,988 1,509 5,127 915 83,859
(*) Euros are not included in the total net position, since it is the functional currency of the parent.

CREDIT EUROPE BANK N.V.
NOTES TO CONSOLIDATED FINANCIAL STATEMENTS As of and for the period ended June 30, 2017 In thousands of EURO unless otherwise indicated
62
32.m Operational risk
The Bank has an Operational Risk Management (ORM) function, the goal of which is to enhance the operational risk culture of the Bank by promoting awareness of the Bank’s operational risk management framework and providing oversight of its execution in line with the three lines of defence model.
ORM act as the second line of defense, providing the business line, and other functions across the Bank, with support related to the implementation of the identification, assessment, measurement, mitigation, monitoring and reporting of operational risks, which together form a framework for managing the Bank’s exposure to operational risk losses.
Operational risk events and significant control incidents are reported and analysed through the Operational Risk Incident Management framework. The effectiveness of the Bank’s controls are assessed through the annual Internal Control Framework evaluations and the execution of Risk Control Self-Assessments. New products, or changes to existing products, are subject to the Product Approval and Review. Key Risk Indicators are established and regularly monitored.
The Bank also has an established operational risk appetite, broken down by both business- and subsidiary-specific thresholds, which is monitored in the quarterly Non-Financial Risk Committee meetings.
Regular training and awareness sessions are provided to employees to ensure that operational risk management continues to be embedded in the Bank’s day-to-day operations.
33. Subsequent events There has been no significant subsequent event between the balance sheet date and the date of approval of these accounts which would be reported by the Bank.

CREDIT EUROPE BANK N.V.
NOTES TO CONSOLIDATED FINANCIAL STATEMENTS As of and for the period ended June 30, 2017 In thousands of EURO unless otherwise indicated
63
34. List of subsidiaries There are no significant restrictions on the ability of subsidiaries to transfer funds to the Parent Company in the form of cash dividends or to repay loans or advances.
June
30, 2017
December
31, 2016
Name Place Country Interest Interest
Credit Europe Bank (Dubai) Ltd Dubai United Arab Emirates 100.00% 100.00%
Credit Europe Bank (Suisse) SA Geneva Switzerland 100.00% 100.00%
Credit Europe Leasing (Ukraine) LLC Kiev Ukraine 100.00% 100.00%
Stichting Credit Europe Custodian Services Amsterdam The Netherlands 100.00% 100.00%
Hunter Navigation Ltd Msida Malta 100.00% 100.00%
Maritime Enterprises B.V. Amsterdam The Netherlands 100.00% 100.00%
Credit Europe Bank (Russia) Ltd Moscow Russia 100.00% 100.00%
PJSC Credit Europe Bank (Ukraine) Kiev Ukraine 99.99% 99.99%
Credit Europe Leasing (Romania) Bucharest Romania 100.00% 100.00%
Credit Europe Bank (Romania) SA Bucharest Romania 98.94% 98.94%
Cirus Holding B.V. Amsterdam The Netherlands 50.00% 50.00%
Ikano Finance Holding B.V. Amsterdam The Netherlands 50.00% 50.00%
Yenikoy Enterprises B.V. Amsterdam The Netherlands 100.00% 100.00%
Nomadmed XXI S.L. Barcelona Spain 100.00% 100.00%
Mediqueen Maritime Ltd Msida Malta 100.00% 100.00%
Medipride Maritime Ltd Msida Malta 100.00% 100.00%
Lodestar Maritime Ltd Msida Malta 100.00% 100.00%
Medibeauty Maritime Ltd Msida Malta 100.00% 100.00%
Lycia Shipping Ltd Msida Malta 100.00% 100.00%
Cilicia Shipping Ltd Msida Malta 100.00% 100.00%
Phrygia Shipping Ltd Msida Malta 100.00% 100.00%
Thrace Shipping Ltd Msida Malta 100.00% 100.00%
Mysia Shipping Ltd Msida Malta 100.00% -
Hitit Shipping Ltd Msida Malta 100.00% -
Cappadocia Shipping Ltd Msida Malta 100.00% -
Ziyaret Gayrimenkul Yatirim A.S. Istanbul Turkey 100.00% -
Feniks Gayrimenkul Yatirim A.S. Istanbul Turkey 100.00% -
Seyir Gayrimenkul Yatirim A.S. Istanbul Turkey 100.00% -
Amsterdam, September 15, 2017