crash test and evaluation of restrained safety … 9-1002-15 crash test and evaluation of restrained...
TRANSCRIPT

TTI: 9-1002-15
CRASH TEST AND EVALUATION OF
RESTRAINED SAFETY-SHAPE
CONCRETE BARRIERS ON CONCRETE
BRIDGE DECK
Test Report 9-1002-15-3 Cooperative Research Program
in cooperation with the
Federal Highway Administration and the
Texas Department of Transportation
http://tti.tamu.edu/documents/9-1002-15-3.pdf
TEXAS A&M TRANSPORTATION INSTITUTE COLLEGE STATION, TEXAS
TEXAS DEPARTMENT OF TRANSPORTATION
ISO 17025 Laboratory
Testing Certificate # 2821.01
Crash testing performed at:
TTI Proving Ground
3100 SH 47, Building 7091
Bryan, TX 77807


Technical Report Documentation Page
1. Report No.
FHWA/TX-15/9-1002-15-32. Government Accession No. 3. Recipient's Catalog No.
4. Title and Subtitle
CRASH TEST AND EVALUATION OF RESTRAINED SAFETY-
SHAPE CONCRETE BARRIERS ON CONCRETE BRIDGE DECK
5. Report Date
Published: January 2018
6. Performing Organization Code
7. Author(s)
William F. Williams, Nauman M. Sheikh, Wanda L. Menges,
Darrell L. Kuhn, and Roger P. Bligh
8. Performing Organization Report No.
Report 9-1002-15-3
9. Performing Organization Name and Address
Texas A&M Transportation Institute
College Station, Texas 77843-3135
10. Work Unit No. (TRAIS)
11. Contract or Grant No.
Project 9-1002-15
12. Sponsoring Agency Name and Address
Texas Department of Transportation
Research and Technology Implementation Office
125 E. 11th Street
Austin, Texas 78701-2483
13. Type of Report and Period Covered
Technical Report:
September 2016–August 201714. Sponsoring Agency Code
15. Supplementary Notes
Project performed in cooperation with the Texas Department of Transportation and the Federal Highway
Administration.
Project Title: Roadside Safety Device Crash Testing Program
URL: http://tti.tamu.edu/documents/9-1002-15-3.pdf
16. Abstract
This research designed and tested a new portable concrete barrier that meets the performance of MASH TL-4 and
can be used in temporary and permanent applications on bridge decks. Additionally, this new barrier system will minimize
deflection, allowing placement of the barrier system as close to the edge of the deck system without compromising barrier
performance for MASH TL-4. Additional, using the barrier system on a minimum deck thickness of 7.0 inches was also
preferred. This report presents the design and testing results of the new successful barrier system developed for this project.
The purpose of the testing reported herein was to assess the performance of the restrained safety-shape concrete
barrier on concrete bridge deck according to the safety-performance evaluation guidelines included in AASHTO MASH for
Test Level 4 (TL-4). The crash test performed was in accordance with MASH test 3-11, which involves a 10000S vehicle
impacting the restrained safety-shape concrete barrier at a target impact speed and impact angle of 56 mi/h and 15 degrees,
respectively.
The safety-shape concrete barrier restrained on concrete deck contained and redirected the 10000S vehicle. The
vehicle did not penetrate, underride, or override the installation. Maximum dynamic deflection during the test was 7.1
inches. No detached elements, fragments, or other debris were present to penetrate or show potential for penetrating the
occupant compartment or show undue hazard to others in the area. Maximum occupant compartment deformation was
6.0 inches in the left side floor pan adjacent to the left front door. The 10000S vehicle remained upright during and after the
collision period. The restrained safety-shape concrete barrier on concrete deck performed acceptably for MASH Test 4-12.
The new restrained barrier section with the cross-bolt connection as described and tested herein using 1-inch
diameter dowels anchored to a 7.0-inch thick deck is recommended for implementation on new or existing retrofit projects.
This barrier system successfully met all the requirements of MASH TL-4. This barrier system as designed and tested herein
is recommended for use on the National Highway System with deck thicknesses of 7.0 inches or greater.
17. Key Words
Portable Concrete Barriers, PCB, Temporary Concrete
Barriers, TCB, Restrained Barriers, Bridge Deck, Crash
Testing, Roadside Safety.
18. Distribution Statement
No restrictions. This document is available to the public
through NTIS:
National Technical Information Service
Alexandria, Virginia
http://www.ntis.gov
19. Security Classif.(of this report)
Unclassified20. Security Classif.(of this page)
Unclassified21. No. of Pages
70 22. Price
Form DOT F 1700.7 (8-72) Reproduction of completed page authorized

CRASH TEST AND EVALUATION OF RESTRAINED SAFETY SHAPE
CONCRETE BARRIERS ON CONCRETE BRIDGE DECK
by
William F. Williams, P.E.
Associate Research Engineer
Texas A&M Transportation Institute
Nauman M. Sheikh, P.E.
Associate Research Engineer
Texas A&M Transportation Institute
Wanda L. Menges
Research Specialist
Texas A&M Transportation Institute
Darrell L. Kuhn, P.E.
Research Specialist
And
Roger P. Bligh, Ph.D., P.E.
Senior Research Engineer
Texas A&M Transportation Institute
Report 9-1002-15-3
Project 9-1002-15
Project Title: Roadside Safety Device Crash Testing Program
Performed in cooperation with the
Texas Department of Transportation
and the
Federal Highway Administration
Published: January 2018
TEXAS A&M TRANSPORTATION INSTITUTE
College Station, Texas 77843-3135


vii
DISCLAIMER
This research was performed in cooperation with the Texas Department of Transportation
(TxDOT) and the Federal Highway Administration (FHWA). The contents of this report reflect
the views of the authors, who are responsible for the facts and the accuracy of the data presented
herein. The contents do not necessarily reflect the official view or policies of the FHWA or
TxDOT. This report does not constitute a standard, specification, or regulation.
This report is not intended for construction, bidding, or permit purposes. The researcher
in charge of the project was William F. Williams, P.E., #71898.
The United States Government and the State of Texas do not endorse products or
manufacturers. Trade or manufacturers’ names appear herein solely because they are considered
essential to the object of this report.
TTI PROVING GROUND DISCLAIMER
The results of the crash testing reported herein apply only to the article being tested.
_______________________________________
Wanda L. Menges, Research Specialist
Deputy Quality Manager
_______________________________________
Darrell L. Kuhn, P.E., Research Specialist
Quality Manager
_______________________________________
Matthew N. Robinson, Research Specialist
Test Facility Manager
ISO 17025 Laboratory
Testing Certificate # 2821.01
Crash testing performed at:
TTI Proving Ground
3100 SH 47, Building 7091
Bryan, TX 77807
viii
ACKNOWLEDGMENTS
This project was conducted in cooperation with TxDOT and FHWA. The project team
would like to thank Mr. Wade Odell (TxDOT Project Manager) and Ms. Taya Retterer, P.E., and
Mr. Jon Ries with the TxDOT Bridge Division for their valuable assistance and input on this
project. Their contributions to this project made it a real success.

ix
TABLE OF CONTENTS
Page
List of Figures ............................................................................................................................ xi List of Tables ........................................................................................................................... xii Chapter 1: Introduction ............................................................................................................... 1
1.1 Background ..................................................................................................................... 1 1.2 Research Problem Statement .......................................................................................... 3 1.3 Objective/Scope of Research .......................................................................................... 4
Chapter 2: Design and Simulation Analysis ............................................................................... 5 2.1. Design Concept ............................................................................................................... 5 2.2. Finite Element Model ..................................................................................................... 5
2.3. Simulation Results .......................................................................................................... 6 2.4. Summary and Conclusions ............................................................................................. 9
Chapter 3: Test Article Design and Construction ................................................................... 11 3.1 Test Article and Installation Details ............................................................................. 11 3.2 Material Specifications ................................................................................................. 12
Chapter 4: Test Requirements and Evaluation Criteria ......................................................... 17 4.1 Crash Test Matrix ......................................................................................................... 17
4.2 Evaluation Criteria ........................................................................................................ 17
Chapter 5: Test Conditions ........................................................................................................ 19 5.1 Test Facility .................................................................................................................. 19
5.2 Vehicle Tow and Guidance System .............................................................................. 19 5.3 Data Acquisition Systems ............................................................................................. 20
5.3.1 Vehicle Instrumentation and Data Processing ...................................................... 20 5.3.2 Anthropomorphic Dummy Instrumentation ......................................................... 21 5.3.3 Photographic Instrumentation and Data Processing ............................................. 21
Chapter 6: MASH Test 4-12 (Crash Test No. 490027-2-1) ...................................................... 23 6.1 Test Designation and Actual Impact Conditions .......................................................... 23
6.2 Test Vehicle .................................................................................................................. 23
6.3 Weather Conditions ...................................................................................................... 24
6.4 Test Description ............................................................................................................ 24 6.5 Damage to Test Installation .......................................................................................... 25 6.6 Damage to Test Vehicle ................................................................................................ 26 6.7 Occupant Risk Factors .................................................................................................. 27
Chapter 7: Summary and Conclusions ..................................................................................... 31 7.1 Summary of Results ...................................................................................................... 31 7.2 Conclusions ................................................................................................................... 31
Chapter 8: Implementation statement ...................................................................................... 33 References ........................................................................................................................... 35 Appendix A. Details of the Safety Shape Concrete Barriers Pinned on Concrete
Deck .................................................................................................................. 37 Appendix B. Supporting Certification Documents .................................................................. 45

x
TABLE OF CONTENTS (CONTINUED)
Page
Appendix C. Crash Test No. 490027-2-1 (MASH Test 4-12) ................................................... 49 C.1 Vehicle Properties and Information .............................................................................. 49 C.2 Sequential Photographs ................................................................................................. 51 C.3 Vehicle Angular Displacement ..................................................................................... 54 C.4 Vehicle Accelerations ................................................................................................... 55

xi
LIST OF FIGURES
Page
Figure 2.1. Simulation Model Details (Design Selected for Testing Shown). .......................... 7
Figure 2.2. Finite Element Analysis Results (Design Selected for Testing Shown). ................ 8 Figure 2.3. Lateral Deflection of the Barrier Top due to Vehicle Impact. ................................ 9 Figure 2.4. Deflection of the Bottom of the Barrier beyond the Edge of the Deck. ................. 9 Figure 2.5. Lateral Deflection of the Barrier Top due to Vehicle Impact. .............................. 10 Figure 3.1. Overall Details of the Restrained Safety-Shape Concrete Barrier on
Concrete Bridge Deck. .......................................................................................... 13 Figure 3.2. Restrained Safety-Shape Concrete Barrier under Construction............................ 14 Figure 3.3. Installation of Restrained Safety-Shape Concrete Barrier on Concrete
Bridge Deck. ......................................................................................................... 15 Figure 3.4. Restrained Safety-Shape Concrete Barrier on Concrete Bridge Deck prior
to Testing. ............................................................................................................. 16
Figure 6.1. Restrained Barrier/Test Vehicle Geometrics for Test No. 490027-2-1. ............... 23 Figure 6.2. Test Vehicle before Test No. 490027-2-1............................................................. 24 Figure 6.3. Restrained Safety Shape Concrete Barriers on Concrete Deck after Test
No. 490027-2-1. .................................................................................................... 26
Figure 6.4. Test Vehicle after Test No. 490027-2-1. .............................................................. 27 Figure 6.5. Interior of Test Vehicle for Test No. 490027-2-1. ................................................ 27 Figure 6.6. Summary of Results for MASH Test 4-12 on the Restrained Safety-Shape
Concrete Barriers on Concrete Bridge Deck. ....................................................... 29 Figure C.1. Sequential Photographs for Test No. 490027-2-1 (Overhead and Frontal
Views). .................................................................................................................. 51 Figure C.2. Sequential Photographs for Test No. 490027-2-1 (Rear View). ........................... 53 Figure C.3. Vehicle Angular Displacements for Test No. 490027-2-1. .................................. 54
Figure C.4. Vehicle Longitudinal Accelerometer Trace for Test No. 490027-2-1
(Accelerometer Located at Center of Gravity). .................................................... 55
Figure C.5. Vehicle Lateral Accelerometer Trace for Test No. 490027-2-1
(Accelerometer Located at Center of Gravity). .................................................... 56
Figure C.6. Vehicle Vertical Accelerometer Trace for Test No. 490027-2-1
(Accelerometer Located at Center of Gravity). .................................................... 57 Figure C.7. Vehicle Longitudinal Accelerometer Trace for Test No. 490027-2-1
(Accelerometer Located Rear of Center of Gravity). ........................................... 58 Figure C.8. Vehicle Lateral Accelerometer Trace for Test No. 490027-2-1
(Accelerometer Located Rear of Center of Gravity). ........................................... 59 Figure C.9. Vehicle Vertical Accelerometer Trace for Test No. 490027-2-1
(Accelerometer Located Rear of Center of Gravity). ........................................... 60

xii
LIST OF TABLES
Page
Table 4.1. Test Conditions and Evaluation Criteria Specified for MASH Test 4-12. ............ 17
Table 4.2. Evaluation Criteria Required for MASH Test 4-12. .............................................. 18 Table 6.1. Events during Test No. 490027-2-1. ..................................................................... 25 Table 6.2. Occupant Risk Factors for Test No. 490027-2-1. ................................................. 28 Table 7.1. Performance Evaluation Summary for MASH Test 4-12 on the Restrained
Safety-Shape Concrete Barrier on Concrete Deck. ............................................... 32
Table C.1. Vehicle Properties for Test No. 490027-2-1. ........................................................ 49

1
CHAPTER 1:
INTRODUCTION
1.1 BACKGROUND
This project provides the Texas Department of Transportation (TxDOT) with a
mechanism to quickly and effectively evaluate high-priority issues related to roadside safety
devices. Roadside safety devices shield motorists from roadside hazards such as non-traversable
terrain and fixed objects. Some obstacles that cannot be moved out of the clear zone (e.g.,
mailboxes, sign supports) are designed to break away. To maintain the desired level of safety for
the motoring public, these safety devices must be designed to accommodate various site
conditions and placement locations, and a changing vehicle fleet. Periodically, there is a need to
assess the compliance of existing safety devices with current vehicle testing criteria. Under this
project, roadside safety issues are identified and prioritized for investigation. Each roadside
safety issue is addressed with a separate work plan, and the results are summarized in an
individual test report.
Historically, TxDOT standards have include several different barrier systems that can be
classified as temporary/precast barriers. The low-profile barrier has been successfully tested and
approved for Test Level 2 (TL-2) of National Cooperative Highway Research Program
(NCHRP) Report 350 (1), which permits its use on roadways with speeds up to 43.5 mi/h. This
20-inch tall barrier is intended for use in urban work zones where sight distance problems at
intersections are common (2). The single slope barrier has been approved for TL-3, which makes
it acceptable for general use on all roadways, including high-speed facilities on the national
highway system (3). The Type 3 precast concrete traffic barrier is intended for use in work zones,
primarily on bridge deck, where a temporary barrier is required to be placed less than 2 ft from
the edge of a deck or drop-off. This system, which involves securing the barrier section to the
deck using angled pins, was successfully tested to TL-3 conditions (4).
The Type 2 precast concrete traffic barrier (PCTB[1]-90) has two different joint types.
Joint type A includes a male-female design option, which uses three 1-inch diameter tiebars and
a slotted design option, which uses a prefabricated tiebar grid. During a full-scale crash test, this
joint can fail, resulting in dynamic barrier deflection in excess of 9 ft (5). A retrofit for this
barrier has been developed that limits the lateral deflection to 4 ft under design impact

2
conditions. The retrofit involves attaching a steel plate or strap on the toe of each side of the
barrier across the joint between two segments using epoxy or mechanical anchors. Joint type B
incorporates a 12-inch overlap of the two barrier sections, which are then bolted together through
the overlapping sections using a 1-inch diameter threaded rod. There are presently no plans to
evaluate this barrier with additional crash testing due to its limited use throughout the state.
Connection of the portable and precast concrete barrier rail (CB[P&P]-87) involves
bolting a 3 ft-6 inch steel angle section to the bottom of the barrier segments across each side of a
joint. The Houston District uses a modified version of the design that utilizes a channel
connector. This system has not been crash tested.
Several years ago, a new precast concrete traffic barrier was developed and successfully
crash tested under Project 0-4162 (6). The barrier incorporated an innovative cross-bolt
connection comprised of two ⅞-inch diameter high-strength threaded rods. This connection
limited the barrier deflection to only 19 inches, which is the lowest deflection of any free-
standing, portable concrete barrier approved to NCHRP Report 350. The barrier incorporated an
F-shape profile rather than the New Jersey profile used on current TxDOT barriers. The F-shape
is widely considered to provide improved impact performance over the New Jersey shape. Full-
scale crash testing indicates that vehicles experience less climb and remain more stable during
impacts with barriers having an F-shape profile compared to those with a New Jersey profile.
This successfully crash tested connection design was used for this project.
These portable work zone barriers all serve a similar purpose of shielding motorists from
hazards, and separating and protecting work crews from traffic. However, with the exception of
the low-profile barrier, which is limited to low-speed applications, all of the above mentioned
barriers use 30-ft long segments that weigh approximately 14,000 lb each. Thus, while these
barriers typically serve their intended functions well once they are in place, many consider them
to be only minimally portable because heavy equipment such as cranes are usually required to lift
and place them on and off the trailers used to deliver them to a job site. Because maintenance
sections do not typically have the heavy equipment capable of moving and setting these long,
heavy rail sections, they must contract for these services. In emergency situations, such as
damaged bridge railing, any delay between the time the need for the rail occurs and the time that
it is eventually placed can leave traffic exposed to hazards.

3
In addition to addressing emergency situations, there are many routine maintenance and
construction operations that would benefit from a truly portable rail system that TxDOT
maintenance crews could transport and place with readily available equipment such as a front-
end loader. Such a barrier system could reduce the expense and liability associated with moving
and placing the standard 30-ft barrier segments.
There is a need to have a portable concrete barrier that can be used in temporary and
permanent applications that meets the performance of American Association of State Highway
and Transportation Officials (AASHTO) Manual for Assessing Safety Hardware (MASH) TL-4
with minimal deflection (7). The barrier designed and tested for this project will address these
needs. The X-Bolt barrier designed and tested for Project 0-4162 provided excellent benefits for
minimizing barrier deflections. Many of the features designed and tested for Project 0-4162 were
incorporated into the new barrier for this project. Based on the results from the previous testing
of the X-Bolt barrier, cost effective changes were incorporated into the new barrier for this
project. Significant changes to the barrier reinforcement reducing costs and making the barrier
units easier to construct were incorporated into the new barrier for this project. In addition, all
these changes were incorporated into a barrier system meeting the requirements of MASH TL-4.
1.2 RESEARCH PROBLEM STATEMENT
TxDOT requested assistance with the development of a safety-shape concrete barrier
system restrained to a concrete deck using vertical dowels that anchor into the deck and extend
upward into the barrier system. The dowels in the barrier would extend in a longitudinal slot in
the barrier. The dowels would serve to provide lateral resistance to the barrier against the
transverse impact loading from the impacting vehicle. The intent of the dowels would be to
minimize the lateral deflection of the barrier for vehicular impacts. A minimal deck thickness of
7.0 inches was selected for this project. Placement of the barrier near the edge of the deck was
also selected. The barrier is intended to meet the evaluation criteria recommended in the
AASHTO MASH. It was desired that the barrier designed and tested for this project meet the
requirements of MASH TL-4.

4
1.3 OBJECTIVE/SCOPE OF RESEARCH
The objective of this research was to design and test a new portable concrete barrier that
meets the performance of MASH TL-4 and can be used in temporary and permanent applications
on bridge decks. Additionally, this new barrier system will minimize deflection, allowing
placement of the barrier system as close to the edge of the deck system without compromising
barrier performance for MASH TL-4. Additional, using the barrier system on a minimum deck
thickness of 7.0 inches was also preferred. This report presents the design and testing results of
the new successful barrier system developed for this project.
The purpose of the testing reported herein was to assess the performance of the restrained
safety-shape concrete barrier on concrete bridge deck according to the safety-performance
evaluation guidelines included in AASHTO MASH for Test Level 4 (TL-4). The crash test
performed was in accordance with MASH test 4-12, which involves a 10000S vehicle impacting
the restrained safety-shape concrete barrier at a target impact speed and impact angle of 56 mi/h
and 15 degrees, respectively.

TR No. 9-1002-15-3 5 2017-08-30
CHAPTER 2:
DESIGN AND SIMULATION ANALYSIS*
2.1. DESIGN CONCEPT
There were several design requirements that guided the conceptual design of the new
restrained barrier system. TxDOT required the profile of the barrier to be symmetrical single
slope that can be used for both roadside and median applications. The height of the barrier was
required to be 42 inches. Each barrier segment was required to be 30 ft long.
Adjacent barrier segments are connected using cross-bolt connections. A 13-inch long
vertical slot is cast into the bottom of the barrier segments. This slot is continuous along the
length of the barrier. To restrain the barrier, the segments are lowered onto vertical rebar that are
cast into an underlying concrete deck or pavement.
A full-scale finite element model of the barrier system was developed and vehicle impact
simulations were performed. Results of these simulations guided researchers in selecting the
appropriate size and spacing of the restraining rebar to achieve an acceptable dynamic
performance of the barrier system. Details of the simulation analyses are presented next.
2.2. FINITE ELEMENT MODEL
The objective of the simulation analysis was to determine the kinematic performance of
the restrained barrier system and the influence of various design parameters. The simulations
were performed using the finite element method. LS-DYNA, which is a commercially available
general purpose finite element analysis software, was used for all simulations.
The 42-inch tall and 30 ft long single slope barrier segments were modeled using rigid
material representation. A 13-inch vertical slot was modeled at the base of the barrier along its
centerline. The overall system model was comprised of five (5) barrier segments to achieve a
total barrier length of 150 ft. Adjacent barrier segments were connected using the cross-bolt
connections. These connections were modeled with elastic-plastic material representation
(connection details are presented in a later chapter). Vertical rebar that restrained the lateral
movement of the barrier were also modeled with elastic-plastic material representation. The
* The simulations discussed in this section are outside the scope of TTI Proving Ground’s A2LA Accreditation.

TR No. 9-1002-15-3 6 2017-08-30
barriers segments were placed at the edge of a rigid ground that simulated the edge of a bridge
deck. Bottom ends of the vertical rebar were constrained to the ground.
Figure 2.1 shows various details of the finite element model. The cross-section of the
barrier system restrained on the vertical rebar is shown. Also shown are the views of the full
system model and the impact vehicle. The simulations were performed for MASH Test 4-12
impact conditions, which involve a single unit truck impacting the barrier at 56 mi/h and
15 degrees. The vehicle model used in the simulations was originally developed by National
Crash Analysis Center and Battelle under sponsorship from the Federal Highway Administration.
However, this original model has subsequently been modified and improved for greater accuracy
and robustness by Texas A&M Transportation Institute (TTI) over the course of many research
projects involving simulation and testing with the singe unit truck.
Impact simulations of the 42-inch tall single slope barrier were performed with three
different restraint designs. These included the barrier segments restrained with #6 rebar at a 6 ft
spacing, #6 rebar at a 3 ft spacing, and #8 rebar at 6 ft spacing. The images shown in this chapter
are of the model with #8 rebar at 6 ft spacing, which was eventually selected for crash testing.
2.3. SIMULATION RESULTS
Figure 2.2 shows the results of the simulation analysis. Results are shown for the case
with single slope barrier restrained on #8 rebar with 6 ft spacing. Other than the lateral deflection
of the barrier, the results of the different cases are very similar. The restrained barrier
successfully contained and redirected the single unit truck for all three designs. Figure 2.3 shows
differences in the lateral deflection of the top of the barrier. The design with #6 rebar at 6 ft
spacing had a maximum dynamic lateral deflection of 10.4 ft. This deflection was reduced to
5.9 ft when the spacing was reduced to 3 ft between the #6 rebar. The design with #8 rebar and
6 ft spacing had a maximum dynamic deflection of 7.1 ft.
The maximum permanent lateral displacement of the barrier’s toe, beyond the edge of the
deck, is shown in Figure 2.4. The design with #6 rebar and 3 ft spacing had the lowest
displacement of 3.5 inches. However, when the rebar size was increase to #8, similar deflection
of 3.8 inches could be achieved with double the spacing (i.e., 6 ft spacing).

TR No. 9-1002-15-3 7 2017-08-30
Side View
Overall System Model*
Top View of a Connected Barrier Segment*
Side View of a Connected Barrier Segment*
System Model (Side View)*
System Model (Top View)*
*Barrier segments shown with transparency to show connections and vertical rebars.
Figure 2.1. Simulation Model Details (Design Selected for Testing Shown).

TR No. 9-1002-15-3 8 2017-08-30
Figure 2.2. Finite Element Analysis Results (Design Selected for Testing Shown).

TR No. 9-1002-15-3 9 2017-08-30
Figure 2.3. Lateral Deflection of the Barrier Top due to Vehicle Impact.
Deflection Beyond Edge of Deck
3-ft spacing (#6 rebar) 3.5 inches
6-ft spacing (#6 rebar) 7.9 inches
6-ft spacing (#8 rebar) 3.8 inches
Figure 2.4. Deflection of the Bottom of the Barrier beyond the Edge of the Deck.
For comparison purposes, an additional simulation was performed with the single slope
barrier in free-standing and unrestrained condition. The lateral deflection of the top of the
barriers is compared in Figure 2.5 for the restrained and unrestrained cases. The unrestrained
barrier resulted in a maximum lateral deflection of 56 inches.
2.4. SUMMARY AND CONCLUSIONS
The restraint design with #6 rebar at 3 ft spacing resulted in lowest lateral deflection of
the barrier (3.5 inches from the edge of the deck). However, the design with #8 rebar at 6 ft
spacing had a very comparable deflection (3.8 inches from the edge of the deck). It was
considered desirable to have larger spacing between the rebar, so the restraint design with #8
rebar at 6 ft spacing was selected for further evaluation through full scale crash testing.

TR No. 9-1002-15-3 10 2017-08-30
Figure 2.5. Lateral Deflection of the Barrier Top due to Vehicle Impact.
TR No. 9-1002-15-3 11 2017-08-30
CHAPTER 3:
TEST ARTICLE DESIGN AND CONSTRUCTION
3.1 TEST ARTICLE AND INSTALLATION DETAILS
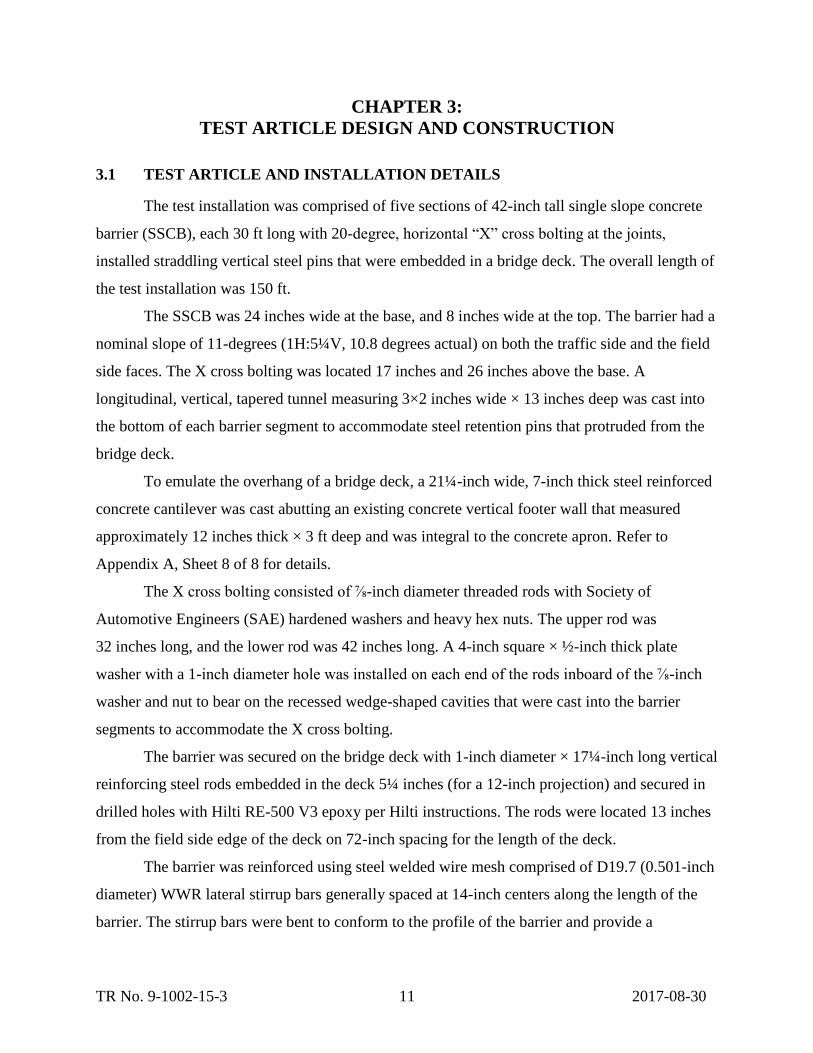
The test installation was comprised of five sections of 42-inch tall single slope concrete
barrier (SSCB), each 30 ft long with 20-degree, horizontal “X” cross bolting at the joints,
installed straddling vertical steel pins that were embedded in a bridge deck. The overall length of
the test installation was 150 ft.
The SSCB was 24 inches wide at the base, and 8 inches wide at the top. The barrier had a
nominal slope of 11-degrees (1H:5¼V, 10.8 degrees actual) on both the traffic side and the field
side faces. The X cross bolting was located 17 inches and 26 inches above the base. A
longitudinal, vertical, tapered tunnel measuring 3×2 inches wide × 13 inches deep was cast into
the bottom of each barrier segment to accommodate steel retention pins that protruded from the
bridge deck.
To emulate the overhang of a bridge deck, a 21¼-inch wide, 7-inch thick steel reinforced
concrete cantilever was cast abutting an existing concrete vertical footer wall that measured
approximately 12 inches thick × 3 ft deep and was integral to the concrete apron. Refer to
Appendix A, Sheet 8 of 8 for details.
The X cross bolting consisted of ⅞-inch diameter threaded rods with Society of
Automotive Engineers (SAE) hardened washers and heavy hex nuts. The upper rod was
32 inches long, and the lower rod was 42 inches long. A 4-inch square × ½-inch thick plate
washer with a 1-inch diameter hole was installed on each end of the rods inboard of the ⅞-inch
washer and nut to bear on the recessed wedge-shaped cavities that were cast into the barrier
segments to accommodate the X cross bolting.
The barrier was secured on the bridge deck with 1-inch diameter × 17¼-inch long vertical
reinforcing steel rods embedded in the deck 5¼ inches (for a 12-inch projection) and secured in
drilled holes with Hilti RE-500 V3 epoxy per Hilti instructions. The rods were located 13 inches
from the field side edge of the deck on 72-inch spacing for the length of the deck.
The barrier was reinforced using steel welded wire mesh comprised of D19.7 (0.501-inch
diameter) WWR lateral stirrup bars generally spaced at 14-inch centers along the length of the
barrier. The stirrup bars were bent to conform to the profile of the barrier and provide a
TR No. 9-1002-15-3 12 2017-08-30
minimum 1½-inch concrete cover. Longitudinal reinforcement of the SSCB was comprised of
12 D22.2 bars (0.532-inch diameter) positioned along the slope of each face and located inside
the lateral stirrups. Similar WWR reinforcement straddled the longitudinal tunnel. Four
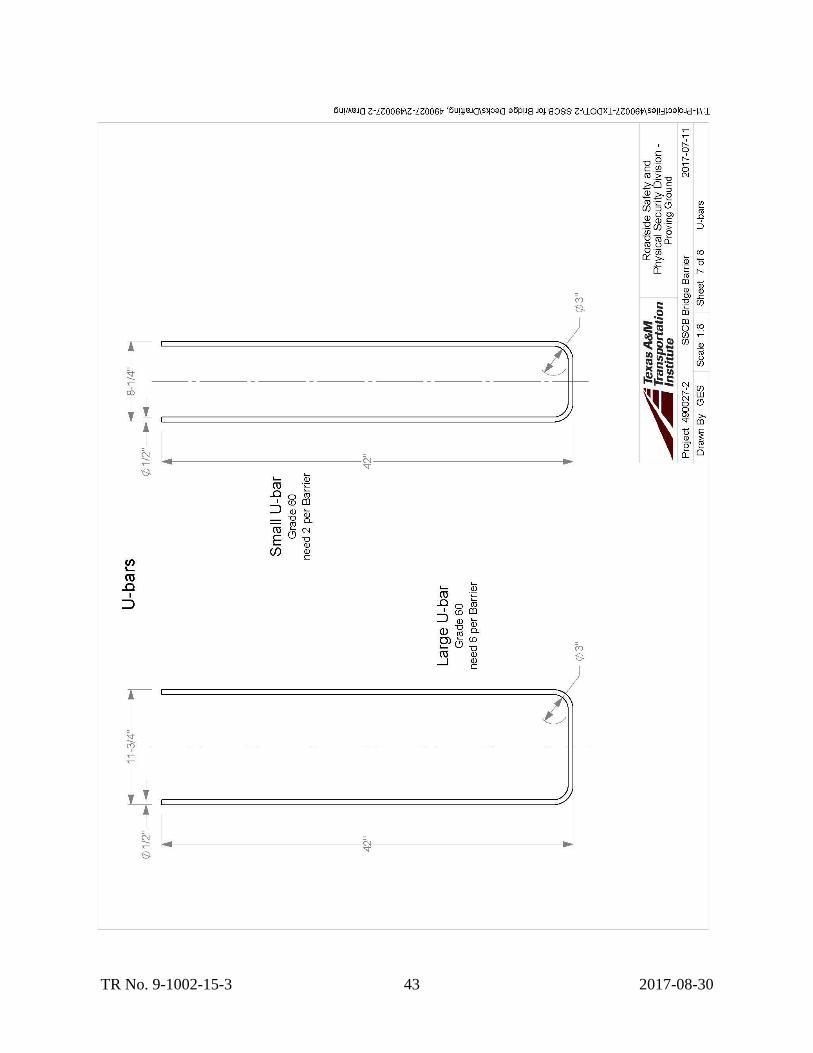
horizontal ½-inch diameter U bars reinforced the X cross bolting area at the end of each barrier.
Refer to Appendix B, Sheets 4-7 of 8 for reinforcing details.
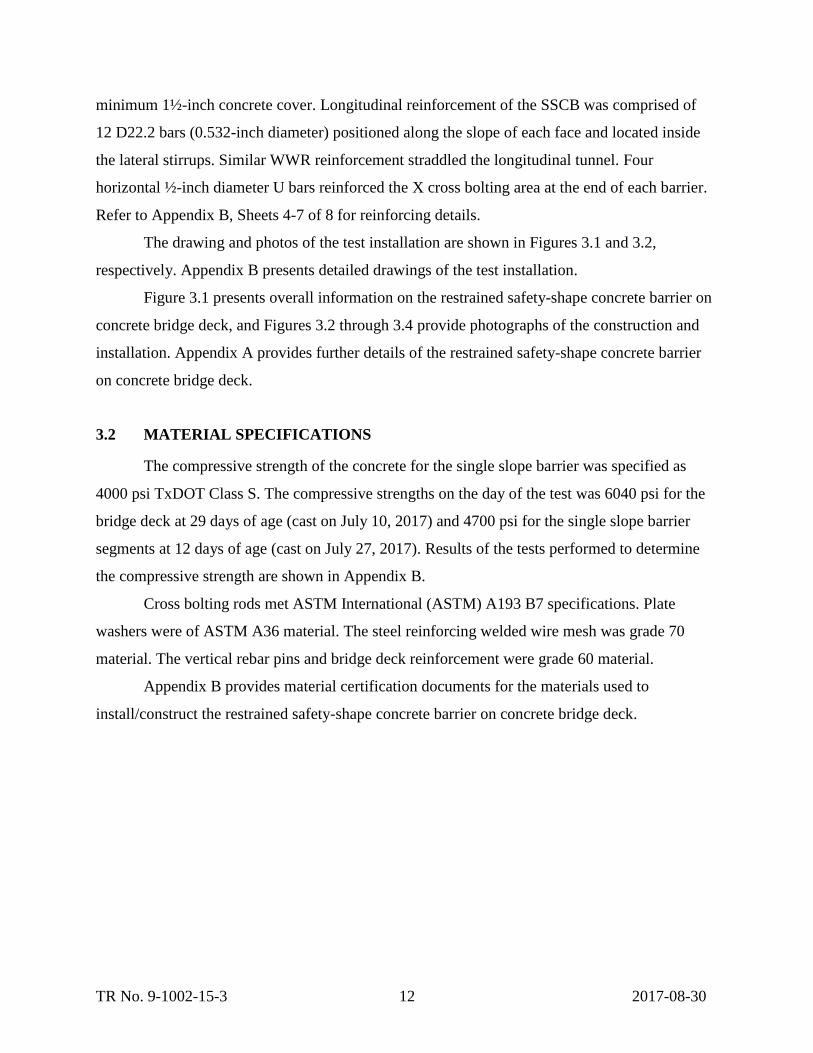
The drawing and photos of the test installation are shown in Figures 3.1 and 3.2,
respectively. Appendix B presents detailed drawings of the test installation.
Figure 3.1 presents overall information on the restrained safety-shape concrete barrier on
concrete bridge deck, and Figures 3.2 through 3.4 provide photographs of the construction and
installation. Appendix A provides further details of the restrained safety-shape concrete barrier
on concrete bridge deck.
3.2 MATERIAL SPECIFICATIONS
The compressive strength of the concrete for the single slope barrier was specified as
4000 psi TxDOT Class S. The compressive strengths on the day of the test was 6040 psi for the
bridge deck at 29 days of age (cast on July 10, 2017) and 4700 psi for the single slope barrier
segments at 12 days of age (cast on July 27, 2017). Results of the tests performed to determine
the compressive strength are shown in Appendix B.
Cross bolting rods met ASTM International (ASTM) A193 B7 specifications. Plate
washers were of ASTM A36 material. The steel reinforcing welded wire mesh was grade 70
material. The vertical rebar pins and bridge deck reinforcement were grade 60 material.
Appendix B provides material certification documents for the materials used to
install/construct the restrained safety-shape concrete barrier on concrete bridge deck.

TR No. 9-1002-15-3 13 2017-08-30
Fig
ure
3.6
. O
vera
ll D
etail
s of
the
Res
train
ed S
afe
ty-S
hap
e C
on
cret
e B
arr
ier
on
Con
cre
te B
rid
ge
Dec
k.

TR No. 9-1002-15-3 14 2017-08-30
Figure 3.7. Restrained Safety-Shape Concrete Barrier under Construction.

TR No. 9-1002-15-3 15 2017-08-30
Figure 3.8. Installation of Restrained Safety-Shape Concrete Barrier on Concrete Bridge
Deck.
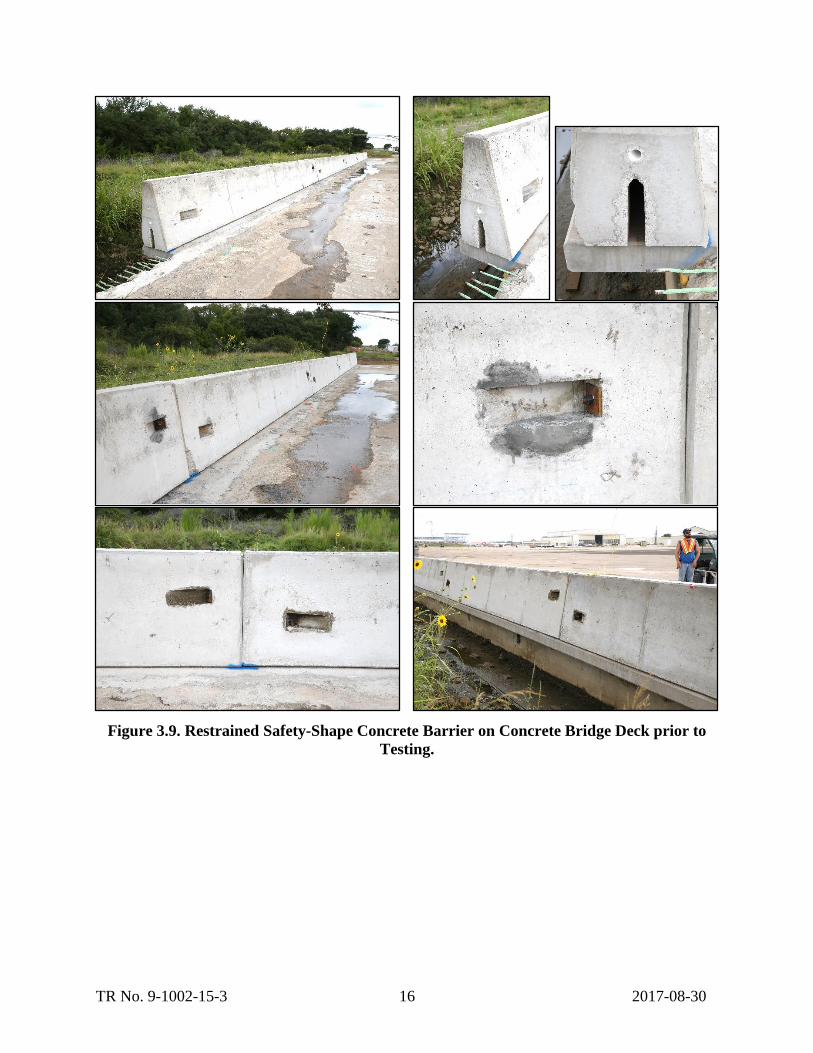
TR No. 9-1002-15-3 16 2017-08-30
Figure 3.9. Restrained Safety-Shape Concrete Barrier on Concrete Bridge Deck prior to
Testing.

TR No. 9-1002-15-3 17 2017-08-30
CHAPTER 4:
TEST REQUIREMENTS AND EVALUATION CRITERIA
4.1 CRASH TEST MATRIX
Table 4.1 shows the test conditions and evaluation criteria for MASH Test 4-12. MASH
Test 4-12 involves a 10000S vehicle weighing 22,000 lb ±660 lb and impacting the critical
impact point (CIP) of the restrained safety-shape concrete barrier on concrete bridge deck at an
impact speed of 56 mi/h ±2.5 mi/h and an angle of 15 degrees ±1.5 degrees. The target CIP
selected for the test was determined according to the information provided in MASH Sections
2.2.1 and 2.3.2.2, and Table 2-8, and was 5.0 ft upstream of the second barrier joint.
Table 4.1. Test Conditions and Evaluation Criteria Specified for MASH Test 4-12.
Test Article Test
Designation
Test
Vehicle
Impact Conditions Evaluation
Criteria Speed Angle
Longitudinal Barrier 4-12 10000S 56 mi/h 15 A, D, G
The crash test(s) and data analysis procedures were in accordance with guidelines
presented in MASH. Chapter 4 presents brief descriptions of these procedures.
4.2 EVALUATION CRITERIA
The appropriate safety evaluation criteria from Tables 2-2A and 5-1A through 5-1C of
MASH were used to evaluate the crash test reported herein. The test conditions and evaluation
criteria required for MASH Test 4-12 are listed in Table 4.1, and the substance of the evaluation
criteria in Table 4.2. An evaluation of the crash test results is presented in detail in the section
Assessment of Test Results.

TR No. 9-1002-15-3 18 2017-08-30
Table 4.2. Evaluation Criteria Required for MASH Test 4-12.
Evaluation
Factors Evaluation Criteria
Structural
Adequacy
A. Test article should contain and redirect the vehicle or bring the vehicle to a
controlled stop; the vehicle should not penetrate, underride, or override the
installation although controlled lateral deflection of the test article is acceptable.
Occupant
Risk
D. Detached elements, fragments, or other debris from the test article should not
penetrate or show potential for penetrating the occupant compartment, or present
undue hazard to other traffic, pedestrians, or personnel in a work zone.
Deformations of, or intrusions into, the occupant compartment should not exceed
limits set forth in Section 5.2.2 and Appendix E of MASH.
G. It is preferable, although not essential, that the vehicle remain upright during and
after the collision.

TR No. 9-1002-15-3 19 2017-08-30
CHAPTER 5:
TEST CONDITIONS
5.1 TEST FACILITY
The full-scale crash test reported herein was performed at TTI Proving Ground, an
International Standards Organization (ISO)/International Electrotechnical Commission (IEC)
17025-accredited laboratory with American Association for Laboratory Accreditation (A2LA)
Mechanical Testing Certificate 2821.01. The full-scale crash test was performed according to
TTI Proving Ground quality procedures, and according to the MASH guidelines and standards.
The test facilities of the TTI Proving Ground are located on the Texas A&M University
RELLIS Campus, which consists of a 2000-acre complex of research and training facilities
situated 10 miles northwest of the flagship campus of Texas A&M University. The site, formerly
a United States Army Air Corps base, has large expanses of concrete runways and parking
aprons well suited for experimental research and testing in the areas of vehicle performance and
handling, vehicle-roadway interaction, durability and efficacy of highway pavements, and
evaluation of roadside safety hardware and perimeter protective devices. The site selected for
construction and testing of the restrained safety-shape concrete barrier on concrete deck was
along the edge of an out-of-service runway. The runway consists of an unreinforced jointed-
concrete pavement in 12.5-ft × 15-ft blocks nominally 6 inches deep. The runways were built in
1942, and the joints have some displacement, but are otherwise flat and level.
5.2 VEHICLE TOW AND GUIDANCE SYSTEM
The test vehicle was towed into the test installation using a steel cable guidance and
reverse tow system. A steel cable for guiding the test vehicle was tensioned along the path,
anchored at each end, and threaded through an attachment to the front wheel of the test vehicle.
An additional steel cable was connected to the test vehicle, passed around a pulley near the
impact point, through a pulley on the tow vehicle, and then anchored to the ground such that the
tow vehicle moved away from the test site. A 2:1 speed ratio between the test and tow vehicle
existed with this system. Just prior to impact with the installation, the test vehicle was released
and ran unrestrained. The vehicle remained freewheeling (i.e., no steering or braking inputs)

TR No. 9-1002-15-3 20 2017-08-30
until it cleared the immediate area of the test site (no sooner than 2 s after impact), after which
the brakes were activated, if needed, to bring the test vehicle to a safe and controlled stop.
5.3 DATA ACQUISITION SYSTEMS
5.3.1 Vehicle Instrumentation and Data Processing
The test vehicle was instrumented with a self-contained, on-board data acquisition system.
The signal conditioning and acquisition system is a 16-channel, Tiny Data Acquisition System
(TDAS) Pro produced by Diversified Technical Systems, Inc. The accelerometers, which measure
the x, y, and z axis of vehicle acceleration, are strain gauge type with linear millivolt output
proportional to acceleration. Angular rate sensors, measuring vehicle roll, pitch, and yaw rates,
are ultra-small, solid state units designed for crash test service. The TDAS Pro hardware and
software conform to the latest SAE J211, Instrumentation for Impact Test. Each of the 16
channels is capable of providing precision amplification, scaling, and filtering based on
transducer specifications and calibrations. During the test, data are recorded from each channel at
a rate of 10,000 values per second with a resolution of one part in 65,536. Once data are recorded,
internal batteries back these up inside the unit should the primary battery cable be severed. Initial
contact of the pressure switch on the vehicle bumper provides a time zero mark and initiates the
recording process. After each test, the data are downloaded from the TDAS Pro unit into a laptop
computer at the test site. The Test Risk Assessment Program (TRAP) software then processes the
raw data to produce detailed reports of the test results.
Each of the TDAS Pro units is returned to the factory annually for complete recalibration
and all instrumentation used in the vehicle conforms to all specifications outlined by SAE J211.
All accelerometers are calibrated annually by means of an ENDEVCO 2901, precision primary
vibration standard. This standard and its support instruments are checked annually and receive a
National Institute of Standards Technology (NIST) traceable calibration. The rate transducers
used in the data acquisition system receive a calibration via a Genisco Rate-of-Turn table. The
subsystems of each data channel are also evaluated annually, using instruments with current
NIST traceability, and the results are factored into the accuracy of the total data channel, per
SAE J211. Calibrations and evaluations are also made any time data are suspect. Acceleration
data are measured with an expanded uncertainty of ±1.7 percent at a confidence factor of
95 percent (k=2).
TR No. 9-1002-15-3 21 2017-08-30
TRAP uses the data from the TDAS Pro to compute occupant/compartment impact
velocities, time of occupant/compartment impact after vehicle impact, and the highest
10˗millisecond (ms) average ridedown acceleration. TRAP calculates change in vehicle velocity
at the end of a given impulse period. In addition, maximum average accelerations over 50˗ms
intervals in each of the three directions are computed. For reporting purposes, the data from the
vehicle-mounted accelerometers are filtered with a 60-Hz low-pass digital filter, and acceleration
versus time curves for the longitudinal, lateral, and vertical directions are plotted using TRAP.
TRAP uses the data from the yaw, pitch, and roll rate transducers to compute angular
displacement in degrees at 0.0001-s intervals, then plots yaw, pitch, and roll versus time. These
displacements are in reference to the vehicle-fixed coordinate system with the initial position and
orientation of the vehicle-fixed coordinate systems being initial impact. Rate of rotation data is
measured with an expanded uncertainty of ±0.7 percent at a confidence factor of 95 percent
(k=2).
5.3.2 Anthropomorphic Dummy Instrumentation
According to MASH, use of a dummy in the 10000S vehicle is not required, and no
dummy was used in the test.
5.3.3 Photographic Instrumentation and Data Processing
Photographic coverage of the test included three high-speed cameras:
One overhead with a field of view perpendicular to the ground and directly over the
impact point.
One placed behind the installation at an angle.
One placed to have a field of view parallel to and aligned with the installation at the
downstream end.
A flashbulb on the impacting vehicle was activated by a pressure-sensitive tape switch to
indicate the instant of contact with the restrained safety-shape concrete barrier. The flashbulb
was visible from each camera. The video files from these digital high-speed cameras were
analyzed to observe phenomena occurring during the collision and to obtain time-event,

TR No. 9-1002-15-3 22 2017-08-30
displacement, and angular data. A digital camera recorded and documented conditions of each
test vehicle and the installation before and after the test.
TR No. 9-1002-15-3 23 2017-08-30
CHAPTER 6:
MASH TEST 4-12 (CRASH TEST NO. 490027-2-1)
6.1 TEST DESIGNATION AND ACTUAL IMPACT CONDITIONS
MASH Test 4-12 involves a 10000S vehicle weighing 22,000 lb ±660 lb impacting the
CIP of the restrained barrier at an impact speed of 56 mi/h ±2.5 mi/h and an angle of 15 degrees
±1.5 degrees. The CIP for MASH Test 4-12 restrained safety-shape concrete barrier was 5.0 ft
±1 ft upstream of the second joint.
The 2004 International 4300 single-unit box van truck used in the test weighed 22,370 lb,
and the actual impact speed and angle were 58.3 mi/h and 15.6 degrees, respectively. The actual
impact point was 4.7 ft upstream of the joint between barrier segments 2 and 3. Minimum target
impact severity (IS) was 142 kip-ft, and actual IS was 184 kip-ft.
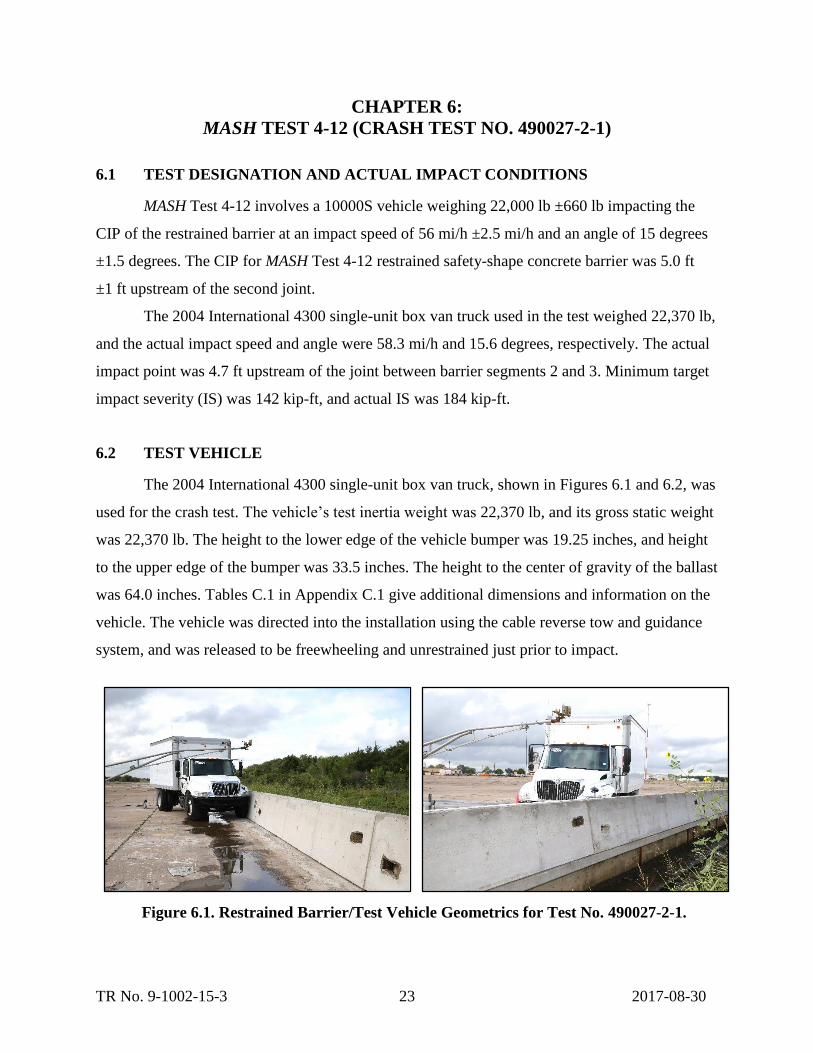
6.2 TEST VEHICLE
The 2004 International 4300 single-unit box van truck, shown in Figures 6.1 and 6.2, was
used for the crash test. The vehicle’s test inertia weight was 22,370 lb, and its gross static weight
was 22,370 lb. The height to the lower edge of the vehicle bumper was 19.25 inches, and height
to the upper edge of the bumper was 33.5 inches. The height to the center of gravity of the ballast
was 64.0 inches. Tables C.1 in Appendix C.1 give additional dimensions and information on the
vehicle. The vehicle was directed into the installation using the cable reverse tow and guidance
system, and was released to be freewheeling and unrestrained just prior to impact.
Figure 6.1. Restrained Barrier/Test Vehicle Geometrics for Test No. 490027-2-1.

TR No. 9-1002-15-3 24 2017-08-30
Figure 6.2. Test Vehicle before Test No. 490027-2-1.
6.3 WEATHER CONDITIONS
The test was performed on the morning of August 8, 2017. Weather conditions at the
time of testing were as follows: wind speed: 3 mi/h; wind direction: 26 degrees (vehicle was
traveling in a northwesterly direction); temperature: 81°F; relative humidity: 87 percent.
6.4 TEST DESCRIPTION
The test vehicle, traveling at an impact speed of 58.3 mi/h, contacted the restrained
barriers 4.7 ft upstream of the joint between barrier segments 2 and 3 at an impact angle of
15.6 degrees. Table 6.1 lists times and significant events that occurred during Test No.
490027-2-1. Figures C.1 and C.2 in Appendix C.2 present sequential photographs during the test.
For longitudinal barriers, it is desirable that the vehicle redirects and exits the barrier
within the exit box criteria (not less than 65.6 ft downstream from impact for heavy vehicle). The
10000S vehicle exited within the exit box criteria defined in MASH. After loss of contact with
the barrier, the vehicle came to rest 225 ft downstream of the impact and 10 ft toward the field
side.

TR No. 9-1002-15-3 25 2017-08-30
Table 6.1. Events during Test No. 490027-2-1.
TIME (s) EVENT
-0.002 Left Front tire impacts barrier and leaves pavement
0.020 Barrier begins to displace to field side at 2-3 joint
0.021 Vehicle begins to redirect
0.050 Cab of vehicle pitches upward
0.076 Downstream end of segment #3 begins to displace to traffic side
0.076 Upstream field side of segment #2 (at #1) begins to spall near bottom
0.084 Right Front tire leaves pavement & toes inward
0.219 Right Rear tires leave pavement
0.236 Lower left of box near axle impacts barrier; concrete chips fly off
0.258 Lower left corner of box impacts barrier
0.278 Vehicle begins to travel parallel with the barrier
0.330 Max rotation of barrier to field side. 9.7 degrees from vertical
0.330 Traffic side toe inward approximately 2 inches
0.330 Max Deflection 7.1 inches to field at top of barrier
0.377 Left Front tire lands back on pavement
0.892 Right Front tire lands back on pavement
1.271 Right Front tire slides off of pavement and into ground
1.400 Vehicle loses contact with the barrier traveling at 55.3 mi/h and 0 degrees
2.200 Brakes applied
6.5 DAMAGE TO TEST INSTALLATION
Figure 6.3 shows the damage to the restrained barriers. Tire marks and gouging were
evident along the traffic face of the barrier from the impact area to the end of the installation.
Barrier segment 1 showed no apparent movement. The downstream end of barrier segment 2 was
pushed toward the field side 1.5 inches. The upstream end of barrier segment 3 was pushed
toward the field side 1.5 inches, and the downstream end was 1.5 inches toward the traffic lanes.
Working width was 58.7 inches, and the height of maximum working width was 135.5 inches.
Maximum dynamic deflection during the test was 7.1 inches, and maximum permanent
deformation was 1.5 inches.

TR No. 9-1002-15-3 26 2017-08-30
Figure 6.3. Restrained Safety Shape Concrete Barriers on Concrete Deck after
Test No. 490027-2-1.
6.6 DAMAGE TO TEST VEHICLE
Figure 6.4 shows the damage that the vehicle had sustained. The front bumper, hood,
grill, left front tire and rim, left frame rail, left front springs and U-bolts, left fuel tank and side
steps, left lower corner of the box, and the left rear outer tire and rim were damaged. Maximum
exterior crush to the vehicle was 12.0 inches in the side plane at the left front corner just behind

TR No. 9-1002-15-3 27 2017-08-30
the left front wheel below bumper height. Maximum occupant compartment deformation was
6.0 inches in the floor pan adjacent to the left front door. Figure 6.5 shows the interior of the
vehicle.
Figure 6.4. Test Vehicle after Test No. 490027-2-1.
Before Test After Test
Figure 6.5. Interior of Test Vehicle for Test No. 490027-2-1.
6.7 OCCUPANT RISK FACTORS
Data from the accelerometer, located at the vehicle center of gravity, were digitized for
evaluation of occupant risk and are shown in Table 6.2. Figure 6.6 summarizes these data and
other pertinent information from the test. Figure C.3 in Appendix C.3 shows the vehicle angular
displacements, and Figures C.4 through C.9 in Appendix C.4 show accelerations versus time
traces.

TR No. 9-1002-15-3 28 2017-08-30
Table 6.2. Occupant Risk Factors for Test No. 490027-2-1.
Occupant Risk Factor Value Time
Impact Velocity
Longitudinal 5.9 ft/s at 0.1952 s on left side of interior
Lateral 11.5 ft/s
Ridedown Accelerations
Longitudinal 4.9 g 0.2473–0.2573 s
Lateral 10.9 g 0.2401–0.2501 s
THIV 14.7 km/h
4.1 m/s at 0.1886 s on left side of interior
PHD 11.6 g 0.2403–0.2503 s
ASI 0.64 0.3195–0.3695 s
Maximum 50-ms Moving Average
Longitudinal -1.9 g 0.2070–0.2570 s
Lateral 5.5 g 0.2930–0.3430 s
Vertical -2.6 g 1.2308–1.2808 s
Maximum Roll, Pitch, and Yaw Angles
Roll 19.4° 1.4581 s
Pitch 12.1° 1.9250 s
Yaw 21.1° 0.4751 s

TR No. 9-1002-15-3 29 2017-08-30
0.0
00 s
0.2
00 s
0.4
00 s
1.4
00 s
Gen
era
l In
form
ati
on
Te
st A
gency ..
....
....
....
....
....
.
T
est S
tandard
Test N
o. .
....
.
T
TI T
est
No. ..
....
....
....
....
....
Te
st D
ate
....
....
....
....
....
....
...
Test
Art
icle
Type ...
....
....
....
....
....
....
....
...
N
am
e ..
....
....
....
....
....
....
....
...
In
sta
llatio
n L
ength
....
....
....
..
M
ate
ria
l or
Key E
lem
ents
...
So
il T
yp
e a
nd
Co
nd
itio
n ...
..
Test
Veh
icle
Type/D
esig
natio
n ..
....
....
....
.
M
ake a
nd M
odel .
....
....
....
...
Curb
....
....
....
....
....
....
....
....
...
T
est In
ert
ial .
....
....
....
....
....
...
D
um
my ..
....
....
....
....
....
....
....
Gro
ss S
tatic ..
....
....
....
....
....
. T
exas A
&M
Tra
nsport
atio
n I
nstitu
te (
TT
I)
MA
SH
Test
Err
or!
Refe
ren
ce s
ou
rce n
ot
fou
nd
. 490027-2
-1
2017-0
8-0
8
Port
able
Concre
te B
arr
iers
(R
estr
ain
ed)
SS
CB
Restr
ain
ed
on C
oncre
te D
eck
150 f
t 42-in
ch t
all
sin
gle
slo
pe c
oncre
te b
arr
ier
30 f
t lo
ng w
ith 2
0-d
egre
e c
ross b
olted a
t jo
ints
restr
ain
ed
on c
oncre
te d
eck w
ith
1-in
ch d
iam
ete
r ×
17¼
-in
ch lo
ng v
ert
ical
rein
forc
ing s
teel ro
ds o
n 7
2-in
ch s
pacin
g
Concre
te B
rid
ge D
eck, D
am
p
10000S
2004 I
nte
rnatio
nal 4300
13,5
10 lb
22,3
70 lb
No d
um
my
22,5
70 lb
Imp
act
Co
nd
itio
ns
Speed
...
....
....
....
....
....
....
....
.
A
ngle
...
....
....
....
....
....
....
....
..
Locatio
n/O
rie
nta
tio
n ..
....
....
.
Imp
act
Severi
ty ..
....
....
....
....
..
Exit
Co
nd
itio
ns
S
peed
...
....
....
....
....
....
....
....
.
A
ngle
...
....
....
....
....
....
....
....
..
Occu
pa
nt
Ris
k V
alu
es
Longitudin
al O
IV ...
....
....
....
.
Late
ral O
IV ..
....
....
....
....
....
...
Longitudin
al R
idedow
n ..
....
.
Late
ral R
idedow
n ..
....
....
....
.
T
HIV
...
....
....
....
....
....
....
....
...
P
HD
....
....
....
....
....
....
....
....
...
A
SI .
....
....
....
....
....
....
....
....
....
M
ax.
0.0
50
-s A
vera
ge
Longitudin
al .
....
....
....
....
...
Late
ral...
....
....
....
....
....
....
..
Vert
ical ...
....
....
....
....
....
....
. 58.3
mi/h
15.6
degre
es
4.7
ft
dow
nstr
eam
of
join
t btw
2 a
nd 3
184 k
ip-f
t 55.3
mi/h
0.0
degre
e
5.9
ft/s
11.5
ft/s
4.9
g
10.9
g
14.7
km
/h
11.6
g
0.6
4
-1.9
g
5.5
g
-2.6
g
Po
st-
Imp
act
Tra
jecto
ry
S
toppin
g D
ista
nce ..
....
....
....
....
...
Veh
icle
Sta
bilit
y
Ma
xim
um
Yaw
Angle
...
....
....
....
.
Ma
xim
um
Pitch A
ngle
...
....
....
....
Ma
xim
um
Roll
Angle
....
....
....
....
.
Vehic
le S
naggin
g ..
....
....
....
....
....
Vehic
le P
ocketin
g ...
....
....
....
....
..
Test
Art
icle
Defl
ecti
on
s
D
ynam
ic ..
....
....
....
....
....
....
....
....
..
P
erm
anent .
....
....
....
....
....
....
....
...
W
ork
ing W
idth
....
....
....
....
....
....
...
H
eig
ht
of W
ork
ing W
idth
...
....
....
V
eh
icle
Dam
ag
e
V
DS
....
....
....
....
....
....
....
....
....
....
..
C
DC
....
....
....
....
....
....
....
....
....
....
..
M
ax.
Exte
rio
r D
efo
rmatio
n ..
....
...
O
CD
I...
....
....
....
....
....
....
....
....
....
..
M
ax.
Occupant
Com
part
me
nt
Defo
rmatio
n ..
....
....
....
....
....
....
.
225 f
t dow
nstr
eam
10 f
t tw
d f
ield
sid
e
21 d
egre
es
12 d
egre
es
19 d
egre
es
No
No
7.1
inches
1.5
inches
58.7
in
ches
137.5
in
ches
NA
11F
LE
W4
12.0
in
ches
LF
0010000
6.0
inches
Fig
ure
6.6
. S
um
ma
ry o
f R
esu
lts
for
MA
SH
Tes
t 4-1
2 o
n t
he
Res
train
ed S
afe
ty-S
hap
e C
on
cret
e B
arr
iers
on
Con
cret
e B
rid
ge
Dec
k.
15
.6°


TR No. 9-1002-15-3 31 2017-08-30
CHAPTER 7:
SUMMARY AND CONCLUSIONS
7.1 SUMMARY OF RESULTS
Table 6.1 provides an assessment of the test based on the applicable safety evaluation
criteria for MASH Test 4-12.
7.2 CONCLUSIONS
The safety-shape concrete barrier restrained on concrete deck contained and redirected
the 10000S vehicle. The vehicle did not penetrate, underride, or override the installation.
Maximum dynamic deflection during the test was 7.1 inches. No detached elements, fragments,
or other debris were present to penetrate or show potential for penetrating the occupant
compartment or show undue hazard to others in the area. Maximum occupant compartment
deformation was 6.0 inches in the left side floor pan adjacent to the left front door. The 10000S
vehicle remained upright during and after the collision period.
The restrained safety-shape concrete barrier on concrete deck performed acceptably for
MASH Test 4-12.

TR No. 9-1002-15-3 32 2017-08-30
Ta
ble
7.1
. P
erfo
rm
an
ce E
va
lua
tio
n S
um
ma
ry
fo
r M
AS
H T
est
4-1
2 o
n t
he R
est
ra
ined
Sa
fety
-Sh
ap
e C
on
crete
Ba
rrie
r o
n
Co
ncrete
Deck
.
Tes
t A
gen
cy:
Tex
as A
&M
Tra
nsp
ort
atio
n I
nst
itute
T
est
No.:
490027-2
-1
Tes
t D
ate:
2017-0
8-0
8
MA
SH
Tes
t 4-1
2 E
valu
ati
on
Cri
teri
a
Tes
t R
esu
lts
Ass
essm
ent
Str
uct
ura
l A
deq
uac
y
A.
Tes
t a
rtic
le s
hould
conta
in a
nd r
edir
ect
the
vehic
le o
r
bri
ng
the
vehic
le t
o a
con
troll
ed s
top;
the
vehic
le
should
not
pen
etra
te, under
ride,
or
ove
rrid
e th
e
inst
all
ati
on a
lthough c
ontr
oll
ed l
ate
ral
def
lect
ion o
f
the
test
art
icle
is
acc
epta
ble
The
rest
rain
ed s
afet
y-s
hap
e co
ncr
ete
bar
rier
on
concr
ete
dec
k c
onta
ined
and r
edir
ecte
d t
he
10000S
veh
icle
. T
he
veh
icle
did
not
pen
etra
te,
under
ride,
or
over
ride
the
inst
alla
tion.
Max
imum
dynam
ic d
efle
ctio
n d
uri
ng t
he
test
was
7.1
inch
es.
Pas
s
Occ
upan
t R
isk
D.
Det
ach
ed e
lem
ents
, fr
ag
men
ts, o
r oth
er d
ebri
s fr
om
the
test
art
icle
should
not
pen
etra
te o
r sh
ow
pote
nti
al
for
pen
etra
ting t
he
occ
up
ant
com
part
men
t, o
r pre
sent
an u
ndue
haza
rd t
o o
ther
tra
ffic
, ped
estr
ians,
or
per
sonnel
in a
work
zone.
No d
etac
hed
ele
men
ts, fr
agm
ents
, o
r oth
er d
ebri
s
wer
e p
rese
nt
to p
enet
rate
or
show
pote
nti
al f
or
pen
etra
tin
g t
he
occ
upan
t co
mpar
tmen
t or
show
undue
haz
ard t
o o
ther
s in
the
area
.
Pas
s
Def
orm
ati
ons
of,
or
intr
usi
ons
into
, th
e occ
upant
com
part
men
t sh
ould
not
exce
ed l
imit
s se
t fo
rth i
n
Sec
tion 5
.3 a
nd A
ppen
dix
E o
f M
ASH
.
Max
imum
occ
upan
t co
mpar
tmen
t def
orm
atio
n
was
6.0
inch
es i
n t
he
left
sid
e fl
oor
pan
adja
cent
to t
he
left
fro
nt
door.
G.
It i
s p
refe
rable
, alt
hough n
ot
esse
nti
al,
that
the
vehic
le
rem
ain
upri
ght
duri
ng a
nd a
fter
coll
isio
n.
The
10000S
veh
icle
rem
ained
upri
ght
duri
ng a
nd
afte
r th
e co
llis
ion p
erio
d.
Pas
s

TR No. 9-1002-15-3 33 2017-08-30
CHAPTER 8:
IMPLEMENTATION STATEMENT*
The new restrained barrier section with the cross-bolt connection as described and tested
herein using 1-inch diameter dowels anchored to a 7.0-inch thick deck is recommended for
implementation on new or existing retrofit projects. This barrier system successfully met all the
requirements of MASH Test 4-12. This barrier system as designed and tested herein is
recommended for use on the National Highway System with deck thicknesses of 7.0 inches or
greater.
* The opinions/interpretations identified/expressed in this section are outside the scope of TTI Proving Ground’s
A2LA Accreditation.


TR No. 9-1002-15-3 35 2017-08-30
REFERENCES
1. H. E. Ross, Jr., D. L. Sicking, R. A. Zimmer, and J. D. Michie. Recommended
Procedures for the Safety Performance Evaluation of Highway Features, National
Cooperative Highway Research Program Report 350, Transportation Research Board,
National Research Council, Washington, D.C., 1993.
2. T. R. Guidry and W. L. Beason. Development of a Low-Profile Portable Concrete
Barrier. Research Report 990-4F, Texas Transportation Institute, College Station,
TX, November 1991.
3. W. L. Beason, H. E. Ross, Jr., H. S. Perera, and W. L. Campise. Development of a
Single Slope Concrete Median Barrier. Research Report 9429C-1, Texas
Transportation Institute, College Station, TX, February 1989.
4. W. L. Beason and D. L. Bullard, Jr. Development of a Limited Slip Portable
Concrete Barrier Connection. Research Report No. 1959-1, Texas Transportation
Institute, College Station, TX, November 1993.
5. R. P. Bligh, D. L. Bullard, Jr., W. L. Menges, and B. G. Butler. Evaluation of Texas
Grid-Slot Portable Concrete Barrier System. Report 0-4162-1, Texas Transportation
Institute, College Station, TX, April 2002.
6. R. P. Bligh, N. M. Sheikh, W. L. Menges, and R. R. Haug. Development of Low-
Deflection Precast Concrete Barrier. Report 0-4162-3. Texas Transportation
Institute, College Station, TX, January 2005.
7. AASHTO. Manual for Assessing Roadside Safety Hardware. Second Edition, 2016,
American Association of State Highway and Transportation Officials: Washington,
D.C.


TR No. 9-1002-15-3 37 2017-08-30
APPENDIX A. DETAILS OF THE SAFETY SHAPE
CONCRETE BARRIERS PINNED ON CONCRETE DECK

TR No. 9-1002-15-3 38 2017-08-30

TR No. 9-1002-15-3 39 2017-08-30

TR No. 9-1002-15-3 40 2017-08-30

TR No. 9-1002-15-3 41 2017-08-30

TR No. 9-1002-15-3 42 2017-08-30
TR No. 9-1002-15-3 43 2017-08-30

TR No. 9-1002-15-3 44 2017-08-30

TR No. 9-1002-15-3 45 2017-08-30
APPENDIX B. SUPPORTING CERTIFICATION DOCUMENTS

TR No. 9-1002-15-3 46 2017-08-30

TR No. 9-1002-15-3 47 2017-08-30

TR No. 9-1002-15-3 48 2017-08-30

TR No. 9-1002-15-3 49 2017-08-30
APPENDIX C. CRASH TEST NO. 490027-2-1 (MASH TEST 4-12)
C.1 VEHICLE PROPERTIES AND INFORMATION
Table C.1. Vehicle Properties for Test No. 490027-2-1.
Date: 2017-08-08 Test No.: 490027-2-1 VIN No.: 1HTMMAAL34H594534
Year: 2004 Make: International Model: 4300
Odometer: NA Tire Size Front: 295/75R22.5 Tire Size Rear: 295/75R22.5
Vehicle Geometry: inches A Front Bumper
Width: 95.00 K Rear Bumper
Bottom: ----- U Cab Length: 106.00
B Overall Height: 133.00 L Rear Frame
Top: 39.50 V Trailer/Box
Length: 216.50
C Overall Length: 322.50 M Front Track
Width: 80.00 W Gap Width: 3.00
D Rear Overhang: 85.50 N Roof Width: 71.00 X Overall Front
Height: 98.50
E Wheel Base: 201.00 O Hood Height: 59.00 Y Roof-Hood
Distance: 30.00
F Front Overhang: 36.00 P Bumper
Extension: 1.00 Z Roof-Box Height
Difference: 46.00
G C.G. Height: ----- Q Front Tire
Width: 39.00
AA Rear Track Width: 73.00
H C.G. Horizontal Dist. w/Ballast: 131.00
R Front Wheel Width: 23.50
BB Ballast Center of Mass: 64.00
I Front Bumper Bottom: 19.25
S Bottom Door Height: 39.00
CC Cargo Bed Height: 40.00
J Front Bumper Top: 33.50 T Overall Width: 101.75
-----
Wheel Center Height Front 19.00
Wheel Well Clearance (Front) 13.50
Bottom Frame Height (Front) 46.00
Wheel Center Height Rear 19.00
Wheel Well Clearance (Rear) 8.00
Bottom Frame Height (Rear) 29.75

TR No. 9-1002-15-3 50 2017-08-30
Table C.1. Vehicle Properties for Test No. 490027-2-1 (Continued).
Date: 2017-08-08 Test No.: 490027-2-1 VIN No.: 1HTMMAAL34H594534
Year: 2004 Make: International Model: 4300
WEIGHTS
( lb ) CURB TEST INERTIAL
Wfront axle 6710 7790
Wrear axle 6800 14580
WTOTAL 13510 22370
Ballast: 8700 ( lb )
Mass Distribution ( lb ): LF: 3780 RF: 4010 LR: 7430 RR: 7150
Describe any damage to the vehicle prior to test: None
Other notes to include ballast type, dimensions, mass, location, center of mass, and method of attachment:
Block (Height 30 inches/Width 60 inches/Length 30 inches)
Block (Height 24 inches/Width 60 inches/Length 31 inches) on 3-inch tube
Centered in middle of bed
64 inches to center of block to ground level
Four 5/16-inch cables per block
3 Referenced to the front axle 4 Above ground
Engine Type: DT
Engine Size: 466
Transmission Type:
x Auto or Manual
FWD x RWD 4WD
Accelerometer Locations ( inches or mm )
x3 y z4
Front: -- -- --
Center: 131.00 0 50.25
Rear: 225.50 0 50.25

TR No. 9-1002-15-3 51 2017-08-30
C.2 SEQUENTIAL PHOTOGRAPHS
0.000 s
0.100 s
0.200 s
0.300 s
Figure C.1. Sequential Photographs for Test No. 490027-2-1 (Overhead and Frontal Views).

TR No. 9-1002-15-3 52 2017-08-30
0.500 s
0.700 s
Out of View
0.950 s
Out of View
1.400 s
Figure C.1. Sequential Photographs for Test No. 490027-2-1 (Overhead and Frontal Views)
(Continued).

TR No. 9-1002-15-3 53 2017-08-30
0.000 s 0.500 s
0.100 s 0.700 s
0.200 s 0.950 s
0.300 s
1.400 s
Figure C.2. Sequential Photographs for Test No. 490027-2-1 (Rear View).

TR No. 9-1002-15-3 54 2017-08-30
Ro
ll,
Pit
ch
, an
d Y
aw
An
gle
s
00.5
1.0
1.5
2.0
-20
-100
10
20
30
Tim
e (
s)
Angles (degrees)
Roll
Pitch
Yaw
Fig
ure
C.3
. V
ehic
le A
ngu
lar
Dis
pla
cem
ents
for
Tes
t N
o.
490027
-2-1
.
C.3 VEHICLE ANGULAR DISPLACEMENT
Axe
s ar
e ve
hicl
e-fix
ed.
Seq
uenc
e fo
r de
term
inin
g or
ient
atio
n:
1.
Yaw
. 2.
P
itch.
3.
Rol
l.
Te
st
Num
ber:
490027-2
-1
Te
st
Sta
nd
ard
Te
st N
um
ber:
MA
SH
Te
st
4-1
2
Te
st
Art
icle
: S
SC
B p
inne
d t
o c
oncre
te d
eck
Te
st
Ve
hic
le: 2
00
4 In
tern
ation
al 4
30
0
Inert
ial M
ass:
22,3
70 lb
G
ross M
ass:
22,3
70
lb
Imp
act
Sp
ee
d:
58.3
mi/h
Imp
act
Ang
le:
15.6
deg
rees
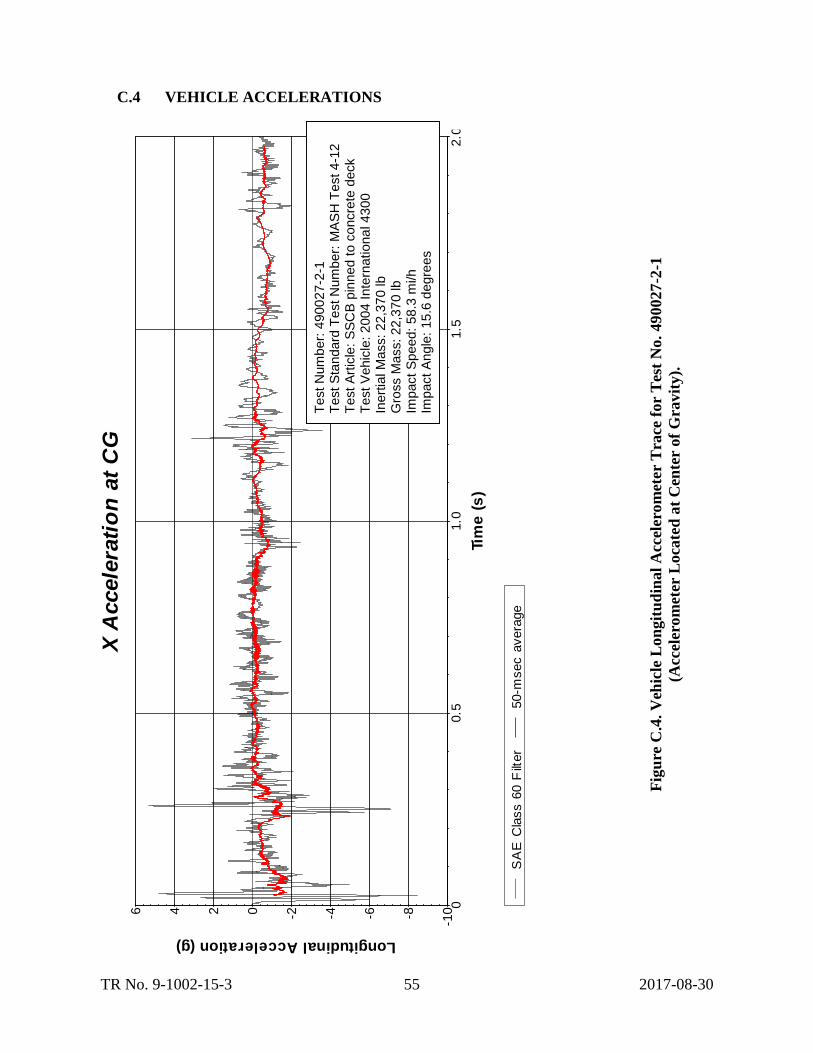
TR No. 9-1002-15-3 55 2017-08-30
X A
ccele
rati
on
at
CG
00.5
1.0
1.5
2.0
-10-8-6-4-20246
Tim
e (
s)
Longitudinal Acceleration (g)
SA
E C
lass 6
0 F
ilter
50-m
sec a
vera
ge
Fig
ure
C.4
. V
ehic
le L
on
git
ud
inal
Acc
eler
om
eter
Tra
ce f
or
Tes
t N
o.
49
0027
-2-1
(Acc
eler
om
eter
Loca
ted
at
Cen
ter
of
Gra
vit
y).
C.4 VEHICLE ACCELERATIONS
Test N
um
ber:
4900
27-2
-1
Test S
tandard
Test N
um
ber:
MA
SH
Test 4
-12
T
est A
rtic
le:
SS
CB
pin
ned
to c
oncre
te d
eck
Test V
ehic
le:
2004 I
nte
rnationa
l 43
00
In
ert
ial M
ass:
22
,37
0 lb
G
ross M
ass:
22,3
70 lb
Im
pact S
peed:
58.3
mi/h
Impact A
ngle
: 15
.6 d
egre
es

TR No. 9-1002-15-3 56 2017-08-30
Y A
ccele
rati
on
at
CG
00.5
1.0
1.5
2.0
-10-505
10
15
20
Tim
e (
s)
Lateral Acceleration (g)
SA
E C
lass 6
0 F
ilter
50-m
sec a
vera
ge
Fig
ure
C.5
. V
ehic
le L
ate
ral
Acce
lero
mete
r T
race
for
Tes
t N
o.
490027-2
-1
(Acc
eler
om
eter
Loca
ted
at
Cen
ter
of
Gra
vit
y).
Test N
um
ber:
4900
27-2
-1
Test S
tandard
Test N
um
ber:
MA
SH
Test 4-1
2
Test A
rtic
le:
SS
CB
pin
ned
to c
oncre
te d
eck
Test V
ehic
le:
2004 I
nte
rnationa
l 43
00
In
ert
ial M
ass:
22
,37
0 lb
G
ross M
ass:
22,3
70 lb
Im
pact S
peed:
58.3
mi/h
Impact A
ngle
: 15
.6 d
egre
es

TR No. 9-1002-15-3 57 2017-08-30
Z A
ccele
rati
on
at
CG
00.5
1.0
1.5
2.0
-20
-100
10
20
Tim
e (
s)
Vertical Acceleration (g)
SA
E C
lass 6
0 F
ilter
50-m
sec a
vera
ge
Fig
ure
C.6
. V
ehic
le V
erti
cal
Acc
eler
om
eter
Tra
ce f
or
Tes
t N
o.
490027-2
-1
(Acc
eler
om
eter
Loca
ted
at
Cen
ter
of
Gra
vit
y).
Test N
um
ber:
4900
27-2
-1
Test S
tandard
Test N
um
ber:
MA
SH
Test 4
-12
T
est A
rtic
le:
SS
CB
pin
ned
to c
oncre
te d
eck
Test
Vehic
le: 2
004 I
nte
rnationa
l 43
00
In
ert
ial M
ass:
22
,37
0 lb
G
ross M
ass:
22,3
70 lb
Im
pact S
peed:
58.3
mi/h
Impact A
ngle
: 15
.6 d
egre
es

TR No. 9-1002-15-3 58 2017-08-30
X A
ccele
rati
on
Rear
of
CG
00.5
1.0
1.5
2.0
-10-8-6-4-20246
Tim
e (
s)
Longitudinal Acceleration (g)
SA
E C
lass 6
0 F
ilter
50-m
sec a
vera
ge
Fig
ure
C.7
. V
ehic
le L
on
git
ud
inal
Acc
eler
om
eter
Tra
ce f
or
Tes
t N
o.
49
0027
-2-1
(Acc
eler
om
eter
Loca
ted
Rea
r of
Cen
ter
of
Gravit
y).
Test N
um
ber:
4900
27-2
-1
Test S
tandard
Test N
um
ber:
MA
SH
Test 4
-12
T
est A
rtic
le:
SS
CB
pin
ned
to c
oncre
te d
eck
Test V
ehic
le:
2004 I
nte
rnationa
l 43
00
In
ert
ial M
ass:
22
,37
0 lb
G
ross M
ass:
22,3
70 lb
Im
pact S
peed:
58.3
mi/h
Impact A
ngle
: 15
.6 d
egre
es

TR No. 9-1002-15-3 59 2017-08-30
Y A
ccele
rati
on
Rear
of
CG
00.5
1.0
1.5
2.0
-20
-100
10
20
30
40
Tim
e (
s)
Lateral Acceleration (g)
SA
E C
lass 6
0 F
ilter
50-m
sec a
vera
ge
Fig
ure
C.8
. V
ehic
le L
ate
ral
Acce
lero
mete
r T
race
for
Tes
t N
o.
490027-2
-1
(Acc
eler
om
eter
Loca
ted
Rea
r of
Cen
ter
of
Gravit
y).
Test N
um
ber:
4900
27-2
-1
Test S
tandard
Test N
um
ber:
MA
SH
Test 4
-12
T
est A
rtic
le:
SS
CB
pin
ned
to c
oncre
te d
eck
Test V
ehic
le:
2004 I
nte
rnationa
l 43
00
In
ert
ial M
ass:
22
,37
0 lb
G
ross M
ass:
22,3
70 lb
Im
pact S
peed:
58.3
mi/h
Impact A
ngle
: 15
.6 d
egre
es

TR No. 9-1002-15-3 60 2017-08-30
Z A
ccele
rati
on
Rear
of
CG
00.5
1.0
1.5
2.0
-50
-40
-30
-20
-100
10
20
Tim
e (
s)
Vertical Acceleration (g)
SA
E C
lass 6
0 F
ilter
50-m
sec a
vera
ge
Fig
ure
C.9
. V
ehic
le V
erti
cal
Acc
eler
om
eter
Tra
ce f
or
Tes
t N
o.
490027-2
-1
(Acc
eler
om
eter
Loca
ted
Rea
r of
Cen
ter
of
Gravit
y).
Test N
um
ber:
4900
27-2
-1
Test S
tandard
Test N
um
ber:
MA
SH
Test 4
-12
T
est A
rtic
le:
SS
CB
pin
ned
to c
oncre
te d
eck
Test V
ehic
le:
2004 I
nte
rnationa
l 43
00
In
ert
ial M
ass:
22
,37
0 lb
G
ross M
ass:
22,3
70 lb
Im
pact S
peed:
58.3
mi/h
Impact A
ngle
: 15
.6 d
egre
es