cpwf project report · acknowledgment. before taking any action based on the information in this...
TRANSCRIPT

Acknowledgements CPWF Project Report
Page | 1
CPWF Project Report Nile Basin Focal Project Project Number 59 David Molden, Seleshi Bekele Awulachew, Karen Conniff, Lisa-Maria Rebelo, Yasir Mohamed, Don Peden, James Kinyangi, Paulo van Breugel, Aditi Mukherji, Ana Cascão, An Notenbaert, Solomon Seyoum Demise, Mohammed Abdel Neguid, Gamal el Naggar for submission to the
December 30, 2009

Contents CPWF Project Report
Page | ii
Acknowledgements
This paper presents findings from CPWF59, Nile Basin Focal Project, a project of the CGIAR Challenge Program on Water and Food and implemented by the International Water Management Institute together with the Nile Basin Initiative (NBI), the NBI subsidiary Action Program of Eastern Nile Technical Regional Organization (ENTRO), the International Livestock Research Institute (ILRI) and the World Fish Center (WorldFish). The work was carried out and documented by a host of contributors listed in the participants section of the report. In addition, we acknowledge the help and insights received from the NBI, Nile Equatorial Lakes Subsidiary Action Project (NELSAP), Egypt Ministry of Water Resources and Irrigation, Nile Water Sector Cairo, Nile Research Institute, National Water Research Center Cairo, South Sudan Ministry of Water Resources, Makarere University Kampala, Ministry of Water Resources Department Entebbe Uganda, FAO Uganda, and many secretaries, drivers, farmers, and all who help us plan and implement our field trip and program meetings. We appreciate the leadership and direction provided by Simon Cook who developed and maintained an excellent framework for analysis allowing us to analyze the basin and compare across basins. Finally, the financial support from the Challenge Program on Water and Food and its donors is gratefully acknowledged.

Contents CPWF Project Report
Page | iii
Program Preface: The Challenge Program on Water and Food (CPWF) contributes to efforts of the international community to ensure global diversions of water to agriculture are maintained at the level of the year 2000. It is a multi-institutional research initiative that aims to increase the resilience of social and ecological systems through better water management for food production. Through its broad partnerships, it conducts research that leads to impact on the poor and to policy change. The CPWF conducts action-oriented research in nine river basins in Africa, Asia and Latin America, focusing on crop water productivity, fisheries and aquatic ecosystems, community arrangements for sharing water, integrated river basin management, and institutions and policies for successful implementation of developments in the water-food-environment nexus.
Project Preface:
Nile Basin Focal Project
The Nile basin experiences wide spread poverty, lack of food and land and water degradation. Because poverty is linked to access to water for crop, fish and livestock based livelihoods, improving access to water and increasing agricultural water productivity can potentially contribute substantially to poverty reduction. The major goal of the Nile Basin Focal project is to identify high potential investments that reduce poverty yet reverse trends in land and water degradation. This is done through the implementation of six interlinked work packages allowing us to examine water availability, access, use, productivity, institutions and their linkages to poverty. Important in the Nile BFP is knowledge management and the uptake of results for ultimate impact. CPWF Project Report series:
Each report in the CPWF Project Report series is reviewed by an independent research supervisor and the CPWF Secretariat, under the oversight of the Associate Director. The views expressed in these reports are those of the author(s) and do not necessarily reflect the official views of the CGIAR Challenge Program on Water and Food. Reports may be copied freely and cited with due acknowledgment. Before taking any action based on the information in this publication, readers are advised to seek expert professional, scientific and technical advice.
Citatation:
Molden, D., Awulachew, S.B., Conniff, K., et al. Nile Basin Focal Project. Synthesis Report, Project Number 59. Challenge Program on Water and Food and International Water Management Institute, Colombo, Sri Lanka. x+149 pp.


Contents CPWF Project Report
Page | v
CONTENTS
RESEARCH HIGHLIGHTS ............................................................................................ 11 EXECUTIVE SUMMARY................................................................................................ 15
Water and poverty alleviation in the Nile ......................................................................15 Organization of the Study and the Report.....................................................................16
INTRODUCTION......................................................................................................... 17 The Nile Basin .........................................................................................................17
1. Poverty in the Nile Basin....................................................................................... 21 1.1 Population growth...............................................................................................21 1.2 Poverty indicators and poverty map .......................................................................21 1.3 Nature and distribution of poverty in Nile Basin........................................................24 1.4 Mapping vulnerability ..........................................................................................26 1.5 Poverty and vulnerability summary ........................................................................28 1.5.1 Case Study Summary: Poverty and water access in agropastoral systems: the “cattle corridor” in Uganda, ...............................................................................................29 1.5.2 Case Study Summary: The development of aquaculture in Egypt and its impacts on livelihoods and poverty at both local and national levels - World Fish ..............................29
2. Accounting for availability and use of Nile Waters.................................................. 31 2.1 Hydrology and water resources .............................................................................32 2.2 Water availability, access and water accounting .......................................................32 2.3 Land use classifications and water use ...................................................................34 2.4 Threats in the Nile ..............................................................................................37 2.5 Water scarcity in the Basin ...................................................................................38 2.6 Conclusions .......................................................................................................39 2.5.1 Nile Case Study Summary: Egyptian Water Use Patterns, Performance and Prospective ...........................................................................................................40 2.5.2 Case Study Summary: Estimation of actual and potential production of Lake Victoria and Lake Kyoga .....................................................................................................41 2.5.3 Case Study Summary: SUDD Hydrology...........................................................42 2.5.4 Case Study Summary: Blue Nile and Lake Tana..................................................43
3. Land and water productivity in Nile Basin production systems ............................... 45 3.1 Basin production systems.....................................................................................45 3.2 Production system maps for the Nile basin ..............................................................45 3.3 Crop productivity map of the farming systems, current and potential...........................46 3.4 Land productivity................................................................................................47 3.5 Water productivity ..............................................................................................48 3.6 Livestock Water Use and Productivity in the Nile Basin ..............................................49 3.7 Fisheries production systems and water productivity in the basin ................................51 3.8 Aquaculture production in Nile Basin countries.........................................................52 3.9 Case Studies at selected sites ...............................................................................53 3.9.1 Rainfed Farming Systems ...............................................................................53 3.9.2 Irrigated Agriculture ......................................................................................53 3.9.3 Irrigated water productivity Egypt ....................................................................54 3.9.4 Sudan’s Central Belt – CPWF PN37 Working paper on Livestock production .............55 3.9.5 Fisheries Lake Victoria and Kyoga ....................................................................55 3.9.6 Aquaculture Nile Delta....................................................................................57 3.9.7 Sudd Case Studies.........................................................................................57 3.9.8 Sudd Livestock Productivity.............................................................................58 3.9.9. The Sudd Fisheries Charles Lodu.....................................................................59
4. Institutional Contexts in the Nile Basin .................................................................. 61 4.1 What are institutions and why are they important? ...................................................61 4.2 Historical treaties in the Nile .................................................................................61 4.3 The Nile Basin Initiative .......................................................................................61 4.3.1 What worked in the Shared Vision Program? ......................................................62 4.3.2 What did not work well in the Shared Vision Program, but may be enhanced?..........62
4.4 Evolution of the Cooperative Framework Agreement (CFA) negotiations .......................63 4.5 The future of the Nile cooperation..........................................................................63 4.5.1 The concept of benefit sharing.........................................................................64 4.5.2 Benefit sharing as evidenced through investment programs in the Nile basin ...........64 4.5.3 What impedes benefit sharing in the Nile? .........................................................65
4.6 Case studies ......................................................................................................65 4.6.1 Lake Victoria and cooperation on fishing - successful regional cooperation ..............65

Contents CPWF Project Report
Page | vi
4.6.2 The Gezira scheme and the impact of national policies.........................................66 4.6.3. The GTZ intervention in watershed management and the influence of policies at micro level ....................................................................................................................67 4.6.4 An analysis of growth and sources of growth in the agricultural sector, 1975-2005 ..67 4.6.5 Rainfall shocks and agricultural production .......................................................68
4.7 Conclusion and policy implications ........................................................................68 5. Intervention Analysis............................................................................................ 71
5.1 The Nile Hydronomic Zones ..................................................................................71 5.2 Small scale water interventions in the Nile Basin ......................................................74 5.2.1 The Water Management Interventions for Agriculture ..........................................74 5.2.2 Multi Criteria Analysis (MCA) for Selecting AWMIs ...............................................75 5.2.3 Water control & management in crop rainfed and SSI systems..............................76 5.2.4 Livestock productivity interventions..................................................................76 5.2.5 Impacts of interventions on productivity and poverty...........................................76
5.3 Conclusions for Small Scale Interventions ...............................................................77 5.4 Large Scale Interventions.....................................................................................77 5.5 The Nile Basin Water Control Infrastructure.............................................................78 5.5.1 Operational systems ......................................................................................78 5.5.2 Emerging developments .................................................................................78
5.6 The Nile Basin Modeling Framework ......................................................................79 5.7 Water Resources Development Scenarios & Water Demand.......................................79 5.8 Implications......................................................................................................80 5.9 Conclusions for Large Scale Interventions ..............................................................81 5.10 Conclusions of Intervention Analysis....................................................................82
6. Knowledge Management ....................................................................................... 85 6.1 Communication and knowledge Sharing..................................................................85 6.1.1 Impact Pathways...........................................................................................85
6.2 Spatial Database Development..............................................................................88 7. Outcomes and Impacts ......................................................................................... 89
7.1 Proforma...........................................................................................................89 7.2 International Public Goods....................................................................................91 7.2.1 Tools and Methodology...................................................................................92
7.3 Partnership Achievements ....................................................................................93 7.4 Recommendations ..............................................................................................93 7.5 Publications .......................................................................................................94
BIBLIOGRAPHY ......................................................................................................... 97 PROJECT PARTICIPANTS...........................................................................................109 Annex A ...................................................................................................................111 Annex B ...................................................................................................................121 Annex C ...................................................................................................................125 Annex D ...................................................................................................................136 Annex E....................................................................................................................139

Contents CPWF Project Report
Page | vii
LIST OF TABLES
Table 0-1. Nile Basin basic information on poverty levels, population, agricultural involvement, GDP, income, HIV and area. ............................................................. 17
Table 1-1. Level of water related risks .................................................................. 28
Table 2-1. The water accounting results for year 2007............................................ 36
Table 2-2. Inflow, outflow and evaporation in the Sudd averaged over different time periods. ............................................................................................................ 43
Table 5-1. The proportional areas of the hydronomic zones in the Nile Basin ............. 73
Table 6-1. Network changes brought about by the project 87
Table 6-2. Description of project achievements and vision 87

Contents CPWF Project Report
Page | viii
LIST OF FIGURES
Figure 0-1. Map of the Nile basin.......................................................................... 18
Figure 1-1. Population in Nile Basin and 2030 projected population (UNDP 2005, FAO Nile). ................................................................................................................ 21
Figure 1-2. Poverty in the Nile Basin countries and Nile Basin (%)............................ 23
Figure 1-3. Hot spots of Poverty (>50%) in pastoral and agro-pastoral systems ........ 24
Figure 1-4. Map of water related risk for the Nile Basin ........................................... 27
Figure 2-1. The Nile Basin ................................................................................... 31
Figure 2-2. Schematization of the Nile WA+ system, annual volumes in km3/year for 2007 ................................................................................................................ 34
Figure 2-3. Areas (km2), precipitation (mm/yr), evapotranspiration (mm/yr) per each land and water use class in the Nile basin for year 2007. ........................................ 34
Figure 2- 4. The Nile Basin land use and water use map.......................................... 35
Figure 2-5. Biomass production in million tons, and water productivity in kg/m3 for different land use classes for year 2007 ................................................................ 37
Figure 2-6. Water scarcity maps: ......................................................................... 39
Figure 2-7. Release of HAD and Depletion and Outflow of Egyptian Water (bcm/km) from 1984 to 2006. (Aquastat 2005, El Quosy 2006, DRI 2007, HRI 2008). .............. 41
Figure 3-1. Crop classifications ............................................................................ 46
Figure 3-2. Standardized gross value of land productivity (SGVP) in the Nile Basin and water productivity based on SGVP/ETa in the Nile Basin.......................................... 47
Figure 3-3. Maize and wheat yields in the Nile Basin ............................................... 48
Figure 3-4. Water productivity based on SGVP/Ta in the Nile basin........................... 49
Figure 3-5. Livestock water productivity values of milk, meat and animal. ................. 50
Figure 5-1. Hydronomic Zones for Nile basin.......................................................... 72
Figure 5-2. Agricultural Water Management Continuum for Control, Lifting, Conveyance and Application .................................................................................................. 75
Figure 5-3. WEAP schematization of the Nile basin for the current situation ............... 79
Figure 5-4. Aggregated incremental irrigation plans by country................................ 80
Figure 5-5. Simulated Nile River flow for the long-term development scenario .......... 81
Figure 6-1. Participatory Impact Pathway Analysis.................................................. 86
Figure 6-2. Network map .................................................................................... 86
Figure 6-3. Collection, organization and dissemination of spatial datasets ................. 88

Contents CPWF Project Report
Page | ix
Appendices
Tables
Table A-1. Descriptions and sources of data for mapping poverty in the Nile basin ... 111
Table A-2. Indicators for mapping hotspots of water-related risks .......................... 112
Table A-3. Data Sources for Indicators of biophysical shocks ................................. 113
Table A-4. Data Sources for Indicators of social risks ............................................ 114
Table A-5. Data Sources for Indicators of water related hazards............................. 114
Table A-6. Level of risk from biophysical indicators............................................... 114
Table C-1. Crop water productivity for main winter field crops in old and new lands under different irrigation methods. ..................................................................... 130
Table C-2. Crop Water Productivity for main summer field crops in old and new lands under different irrigation methods. ..................................................................... 130
Table C-3. Average daily rural drinking water availability, demand, and balance ..... 133
Table C-4. Lake Victoria species % and total landings from commercial fishing. ...... 133
Table C-5. Livestock production in the Sudd wetlands, estimated .......................... 135
Table C-6. Overview of the fisheries and levels of exploitation in 2006................... 135
Table C-7. Livestock count by county in Sudd area .............................................. 135
Table D-1. Treaties and agreements in the Nile basin .......................................... 136
Table D-2. Shared Vision Program projects and project management unit locations. 137
Table D-3. Growth rates in cereal and livestock output and overall growth .............. 137
Table D-4. Decadal growth and sources of such growth in Nile countries, 1975-2005 138
Table E-1. Agricultural Water Management Technology Suits and Scale of Applicability...................................................................................................................... 143
Table E-2. Existing water control structures in the Nile basin. ................................ 146
Table E-3. The irrigation areas (ha) for the current, medium-term & long-term scenarios. ....................................................................................................... 148
Table E-4. Mean annual flow (km3) at major nodes in the Nile basin for current, medium-term and long-term scenarios. .............................................................. 149
Figures
Figure A-1. Human development Index for Nile Basin Countries ............................. 115
Figure A-2. Hotspots of poverty incidence (>50%) in the cereals and legume systems...................................................................................................................... 115
Figure A-3. Hotspots of poverty incidence (>50%) in the tree crop and root crop systems .......................................................................................................... 116
Figure A-4. Hotspots of poverty incidence (>50%) in mixed irrigated systems ......... 117
Figure A-5. Framework linking vulnerability, water and poverty ............................. 118
Figure A-6. Mapping biophysical vulnerability, Nile basin ....................................... 119
Figure A-7. Mapping social vulnerability, Nile basin............................................... 120
Figure B-1. Seasonal variability.......................................................................... 121
Figure B-2. Mean annual rainfall......................................................................... 122
Figure B-3. Land Use cover determination. .......................................................... 123
Figure B-4. Image of the Sudd Wetland from Space showing Jonglei Canal.............. 124
Figure C-1. Water productivity assessment method flowchart ................................ 125
Figure C-2. ...................................................................................................... 126
Figure C-3 ....................................................................................................... 126
Figure C-4. Livestock water productivity framework.............................................. 127

Contents CPWF Project Report
Page | x
Figure C-5. Total annual livestock water use in a normal year. .............................. 128
Figure C-6. Classification of farming systems in Blue Nile highlands........................ 129
Figure C-7. Spatial distribution of livestock and long-term average rainfall ............. 131
Figure C-8. Population, livestock and cropland growth within the central belt.......... 131
Figure C-9. Feed balances by state across the belt. *........................................... 132
Figure D-1. Variability in rainfall shows some correlation with agricultural growth across SSA................................................................................................................ 138 Figure E-1. Climatic patterns of the Nile Basin. .................................................... 139
Figure E-2. Water sources and sinks in the Nile Basin. .......................................... 139
Figure E-3. Topographic patterns of the Nile Basin. .............................................. 140
Figure E-4. Soil properties in the Nile Basin ......................................................... 140
Figure E-5. Vegetation profiles in the Nile Basin ................................................... 141
Figure E-6. Environmentally sensitive areas......................................................... 141
Figure E-7. Poverty profiles and AWMT................................................................ 144
Figure E-8. Food poverty profiles and AWMT........................................................ 144
Figure E-9. WEAP schematization of the equatorial lakes part of the Nile basin......... 146
Figure E-10. WEAP schematization of the wetlands and Sobat-Baro parts of the Nile basin for the current situation............................................................................ 146
Figure E-11. WEAP schematization of the Blue Nile and Atbara-Tekeze parts of the Nile basin for the current situation............................................................................ 147
Figure E-12. WEAP schematization of the Main Nile part of the Nile basin ................ 147

Research Highlights CPWF Project Report
Page | 11
RESEARCH HIGHLIGHTS What and where are high potential agricultural water management interventions to sustainably reduce poverty and increase water productivity in the Nile Basin? This was the overall pertinent yet challenging research question posed for the Nile Basin Focal Project. Within the Nile, there are high degrees of poverty and food insecurity, and overall there are symptoms of water scarcity. Most people in the basin depend on agriculture for their livelihoods, and agriculture plays an important role in the economies of all Nile Basin countries. In spite of its importance for poverty alleviation, water for agriculture and its potential, is not well understood. Our aim is to shed more light on this issue to help guide policy makers, investors, and further research. To add value, we tried several different approaches when considering the Nile basin. Most reports consider the narrow strip of Nile River that traverses 6,000 km across nine countries in Africa, without enough attention to the entire landscape of the Nile and the opportunities of all water and land resources. First, we differentiate water access (the ease of obtaining water) from water availability (the water found in nature). Most studies focus primarily on the river water itself, without recognition that it is access, not availability that makes the difference to people. Second we consider rain as the main resource and then place a high importance on evapotranspiration (ET) from landscapes as the main use. Third, we consider a range of agricultural water management practices from soil water conservation to large scale irrigation, looking for options within the entire landscape that forms the Nile Basin. Within this range we consider the role of fish, livestock as well as the importance of other ecosystem services in providing livelihoods. Finally, we recognize that ultimately policies and institutions are the driving force between access and productivity, and that policies and actions outside of the river such as trade, or livestock management practices, influence the river itself. The central hypothesis of the research is that poverty is related to water access for agriculture. Second that poverty is related to the productivity of Nile waters, whether rain, groundwater, or river water is the source. And third, we contend that poverty is related to the capability of people to cope with risks inherent in water management for agriculture such as drought. Our research provided evidence that these factors are strongly at play within the Nile basin. How much water is used in the Nile basin and who uses that water? A water accounting exercise used land cover, rainfall analysis, and a satellite derived map of evaporation to understand water use patterns. It was found that the total ET for the Nile basin is 1716 km3/yr out of the 1745km3 of rain, equal 98%, i.e., the Nile is nearly a closed basin. The vast majority of this water is evaporated in natural land cover classes (1458 km3/yr=85%), followed by the managed land use (189 km3/yr=11%) and the managed water use (69 km3/yr=4%). the total rainfall in the basin in 2007 was 1745 km3.yr. A contentious and unclear number in the water accounts is the amount that flows to the sea where estimates range from 10 to 30 km3. The number is important in that it gives an important indication about how much more water could be used for irrigation. The importance of livestock water use is routinely underestimated, and little understood. Yet our analysis shows that six major livestock systems cover 60% of the basin, are home to 50% of the Nile’s people, receive 85% of the Nile’s rain and are responsible for 75% of evapotranspiration, and that 60 km3 of ET (a larger number than 50 km3) are depleted to produce the forages, pasture and crop residues needed to support livestock. Water productivity analyses were prepared for crops, livestock and aquaculture within the basin. We took advantage of the ET, production system, and crop yield maps produced for this project to develop a comprehensive crop water productivity map within the basin. In all cases, except for Egypt, water productivity and productivity

Research Highlights CPWF Project Report
Page | 12
values are low. The range for crop water productivity was between $0.01 and $0.20, showing major scope for improvement in most areas. Yields are on the order of one ton per ha for grain crops outside of Egypt. In the cases for low yields, improving yield is a major means for improving water productivity. A little more water supplied for crop ET, combined with fertilizers, seeds and good management, will result in increased water productivity. This is not the case in Egypt, where production can increase, but without additional water. Which interventions are promising? The Nile represents a hugely diverse area with different social, cultural and biophysical considerations. To help identify types of interventions a hydronomic zoning analysis was applied. At a simple level, there are 5 major zones: irrigated areas, mixed rainfed systems in semi arid areas, pastoral and mixed systems in the water source zone, wetlands and other environmentally sensitive zones, and arid areas. A major finding is that the water source zone covers only 15% of the area and generates the majority of Nile flow. Taken from a water perspective it means that interventions in the water source zone need to consider downstream impacts. In the other 85% of land area, there is ample land where only local water considerations are necessary. A second level of zoning using principle component analysis provides a more disaggregated classification based on soils, topography and climatic considerations, which will help for better targeting of interventions. How much more large scale irrigation is possible? An analysis using the WEAP model for the entire Nile basin used governmental plans for irrigation and hydropower expansion. While there is little existing irrigation upstream in the Nile, there are large and ambitious plans for more irrigation both upstream and downstream. Rwanda for example has a plan to expand its area from 2,000 ha to 150,000 ha, Ethiopia from 9,000 to 2,220,000 ha, and Sudan and Egypt both plan to expand their irrigated areas further into desert and wetland areas. These large scale irrigation plans tap Nile River water creating potential downstream impacts. Our findings showed that more large scale irrigation is possible, but not at the levels planned. It also showed that coordinated planning is absolutely necessary to expand irrigated land and manage the entire river to enhance overall economic water productivity gains. Part of this planning is clearly data sharing. In our analysis the major uncertainty was data on the existing flow pattern. In spite of the limits on the scope for irrigation expansion, there is definitely scope to improve water productivity on irrigated lands. Analysis in the Gezira scheme suggested that overall production was far below desired levels, that ET was much less than it could be, and all this was influenced by changes in polices that changed water management practices and productivity. However, increases in production in the Gezira are likely to reduce downstream flows and overall water availability in the basin. There is scope for improving economic water productivity through enhanced aquaculture and livestock practices in all areas. Aquaculture in the Nile delta is booming, and demonstrates high water productivity while using drainage water flows. Aquaculture is possible in other parts of the basin, but is largely an untapped opportunity. Given that rainfed and pastoral systems serve most of the area and a host more poor people, and that there are limits on the scope for large scale irrigation, the largest investment opportunity is to focus on rainfed areas. Here water management practices such as small scale irrigation have high potential. Livestock is particularly important in these areas. Improving water productivity for livestock will require good water productivity of feed sources, practices to enhance feed conversion, better marketing opportunities, better vegetation and soil covers, as well as strategic placement of watering sites. There is a large scope to improve fisheries. Lake Victoria and the Sudd supply significant numbers of fish, but Lake Victoria’s fisheries are threatened by land management

Research Highlights CPWF Project Report
Page | 13
practices surrounding the lake and water management practices associated with hydropower releases. The Sudd and other wetlands contain huge untapped potential for fisheries. Over 90% of aquaculture is done in Egypt, and there certainly are opportunities elsewhere. Insufficient processing and markets are at present key constraints to improved fish production. There is ample water in Nile wetlands. While there are plans to drain parts of these wetlands for downstream use, the present situation about how people use wetlands and their future potential is poorly understood. There are 14 Ramsar wetland sites across the Nile, all of these support fisheries, livestock and other forms of agriculture, and all are threatened by poor management practices. Looking to the future, wetland management could either lead to prosperity, or be a flashpoint for conflict. Our special studies in the Sudd confirmed that there is potential for more agriculture within these areas, but it also confirmed the need for a much better understanding in order to practice agriculture sustainably. Ultimately, water governance will facilitate sustainable and productive development of Nile waters. The Nile Basin Initiative was formed with the realization of the need for cooperation amongst the Nile countries. The NBI has made significant progress in this regards. An important finding of the study was that too little attention was and is given to water and agriculture within the NBI. There needs to be better consideration for fisheries and livestock practices. There are numerous other institutions involved in water and agriculture across the basin and overall, there is a dire need for improved human and institutional capacity to implement programs to the benefit of the rural poor.


Executive Summary CPWF Project Report
Page | 15
EXECUTIVE SUMMARY
The main objective of the Nile Basin Focal Project (NBFP) is to identify high potential water management interventions for increasing water productivity and poverty alleviation in different parts of the basin, to inform development activities and further research. A major premise of the project is that there are opportunities to manage water and use it better for agriculture to improve productivity, food security, and livelihoods. While there is much focus by governments on the scarce river water resource, other opportunities can be found when rainfall is considered as the main water resource in the Nile. Livestock, fisheries and aquaculture have long been important to people along the Nile but do not feature in the water discourse. Livestock are essential for both cultural and dietary use across the entire Nile, and livestock management practices have important implications for water resources management. The potential to develop fisheries along the Nile River is very promising, especially in under developed areas such as Southern Sudan.
The Challenge Program for Water and Food (CPWF) initiated Basin Focal Projects to provide strategic research that identifies the links between water, food and poverty in river basins. The CPWF carries out research across nine basins both to understand how agricultural water management in specific areas supports livelihoods, and in particular livelihoods of the poor and vulnerable. Thus the work of the Nile BFP targets issues relevant to the countries and peoples of the Nile river basin, but contributes to a better understanding of how people develop and manage water for food.
Water and poverty alleviation in the Nile
Water productivity, following water access, is a key driver in improving livelihoods either through better nutrition, or wealth generation. Water risks such as droughts and short term dry spells, and lack of capacity to deal with them, add to the vulnerability of rural poor in the region, and interventions to address these risks will build resilience. These assertions are keys to identifying interventions that will reduce poverty. Testing these assertions is particularly challenging, but we are finding evidence that supports or refutes them during the course of the project. Water productivity is essential for poverty alleviation and agricultural growth in the water scarce basin. At one level, the story of water productivity in the basin is quite simple – in Egypt’s irrigated areas, the values for water productivity in crop, livestock, and aquaculture are quite high in spite of physical water scarcity (high use compared to water availability). In the rest of the basin, except in a few areas, food, animal and water productivity are quite low across all systems. In Egypt increasing the value obtained per unit of water is important. In the rest of the basin, productivity is the key issue, and accessing water to fuel productivity the key water issue. The term “per unit water” makes sense because of limited access to supplies. There is tremendous scope for improvement in water productivity in countries south of Egypt. The irrigated areas of the northern parts of Sudan are a different story. Here water is available and accessible, but apparently productivity is quite low indicating scope for improvement. A special study has been conducted on the Gezira scheme to better understand the situation. Ethiopia is the only other Nile basin country with irrigated agriculture but it is insignificant compared to Egypt and Sudan. However, the potential to develop irrigated agriculture in Ethiopia is significant.

Executive Summary CPWF Project Report
Page | 16
Any intervention addressing the current challenges needs to be done with potential future impacts in mind. For the investments in agriculture and water to have a sustainable impact on food security and poverty, they need to happen with respect for the small-holder and the natural environment. Non-sustainable use of the natural capital reduces in the long term agricultural productivity. Degradation, erosion, unsustainable water use and equitable sharing of resources are all important issues. The links between agricultural growth and environmental outcomes depend very much on the type of farming system and their country’s economic context. For example, the environmental consequences of intensive farming in irrigated areas are quite different from those of extensive farming in low-potential rainfed areas (Hazel and Wood, 2008).
Organization of the Study and the Report
Because of the basin size, complexity and inconsistent data availability, the key is to find a balance between the level of detail and analysis required and the need to gain an overall picture of water, productivity, livelihoods, and poverty within the basin. To do so, we followed the structure of analysis of all the basin focal projects, dividing the work into 6 work packages:
- Water Poverty Analysis - Analysis of Water Availability and Access - Analysis of Agricultural Water Productivity - Institutional Analysis - Intervention Analysis - Development and Application of the Knowledge Base
As the situations across the basin are highly variable, we used five special study sites to gain more insights about water use within the basin.
Egypt, Nile Delta – Aquaculture production systems Ethiopia, Blue Nile – Farming Systems, productivity, impact Sudan, Sudd – Biodiversity, Fisheries, Livestock Uganda, Cattle Corridor – Poverty and water access Sudan, Central Belt – Livestock productivity Uganda, Kenya, Tanzania - Lake Victoria productivity
The report is organized around the work packages. Information from study sites is integrated within each of the work package chapters. A final chapter looks across all the work packages, and makes policy relevant suggestions for the Nile basin managers, for investors, and for the farming, fishing and livestock communities.

Introduction CPWF Project Report
Page | 17
INTRODUCTION
The Nile Basin
Ten countries fall within the Nile basin these include Burundi, Democratic Republic of Congo, Egypt, Eritrea, Ethiopia, Kenya, Rwanda, Sudan, Tanzania, and Uganda (Table 1). The benefits of the Nile River need to be shared among these 10 countries, but the issues are hard to encompass. The unbalanced distribution of water, wealth, and power have made the issues even more challenging for gaining information and creating appropriate interventions. Table 0-1. GDP and population data from International Monetary Fund, World Economic Outlook Database, October 2009 (GDP total and per capita based on current prices).1
Countries
Area within Basin (km2 ‘000)
Total area (km2 ‘000)
Total Population (millions)
Population growth annual (%)
GDP (billion USD)
GDP (per captia)
Population (%) involved in agriculture
Burundi* 13 25 8.1 3.9 1.4 173.8 14.8 DRCongo* 22 2,313 64.8 3.2 11.1 171.4 67.8
Egypt 327 968 74.2 1.8 188.0 2450.4 29.8
Eritrea 25 122 5.1 3.6 1.7 328.3 80.5
Ethiopia* 365 1,124 81.2 2.6 33.9 417.5 88.6
Kenya* 46 580 35.9 2.6 30.2 841.9 18.5
Rwanda* 20 24 9.8 2.5 5.0 511.7 91.7
Sudan 1979 2,492 39.1 2.2 54.3 1388.0 69.5
Tanzania* 84 891 30.4 2.5 22.2 546.6 84.2
Uganda* 231 207 33.2 3.2 15.7 471.7 89.6
*indicates countries with significant HIV affected populations Uganda, Kenya, and Tanzania, Rwanda, and Burundi form the catchment area for Lake Victoria occupied by 35 million people (Figure 1). Concentrated efforts are needed to combat soil erosion, deforestation, decreased water levels, dying fish, and pollution; these are main issues that have lead to increased eutrophication of the once clear water body. One reason of low water levels in the lake has been attributed to Uganda’s hydropower plants exceeding their allotment of water for power. This has had repercussions on the downstream wetlands and possibly on the water level of Lake Victoria. Many Nile basin countries struggle with food security. As for Ethiopia’s burgeoning population, which has surpassed Egypt’s, food production must improve; with frequent and long periods of drought, production problems are acute in the country’s ability to meet the needs of thousand of underfed and starving people. Similarly, Sudan, after years of civil war has lost its ability to provide food security to its growing population, especially those that are returning to areas 1 GDP Source: World Economic Outlook Database for April 2009; Population statistics extracted and compiled from https://www.cia.gov/library/publications/the-world-factbook/geos/su.html, 1) UNPD and LandScan 2005; Poverty levels from http://www.undp.org/;

Introduction CPWF Project Report
Page | 18
abandoned during the war. These problems are not unique to Ethiopia and Sudan, similar situations are found in other basin countries, where there is a history of tensions and instability, both between countries and internally within countries. Figure 0-1. Map of the Nile basin. (source: www.nilebasin.org)
Large wetlands are found in eight of the Nile Basin countries. The largest and most important to the hydraulics of the downstream river is the Sudd, located in Southern Sudan. Preservation of the Sudd is a topic of international importance and for transboundary politics. These issues are relevant examples of the dilemmas imposed on many countries where water for wetlands and hydropolitics collide. A good example is the Jonglei canal, initiated by Egypt and Sudan to send more water from the swamps in the Sudd north to drier areas. The first stage of the Jonglei construction was halted by civil war in Southern Sudan in 1983. The canal, due to its size, is visible from satellite images, 50m wide and at 70%
completion is roughly 245 km long. Controversy continues over the decision to finish the canal or abandon it. The new government in Southern Sudan seems inclined to leave the canal as it is – unfinished. Most of the Nile basin countries depend on subsistence rain-fed agriculture this, together with high rainfall variability is one of the main causes of food insecurity. Drought is a frequent and recurrent event throughout much of the region and the impacts of which are made worse by internal conflict, HIV-AIDS and a need for policy changes. Over 70% of the people depend on subsistence agriculture (Table 0-1). However, the resource base of land and water is not well utilized, nor appropriately managed, and is degrading very rapidly. Water related diseases are common and a major cause of the relatively low life expectancy in the region. Livestock, fisheries and aquaculture are fundamental in the daily lives of people along the Nile, but have been neglected topics in the water discourse. Livestock are essential to many groups in the Nile basin; they establish the wealth of a family, ability to marry and indicate the social standing of several groups within

Introduction CPWF Project Report
Page | 19
Nile Basin countries. Water, food and health issues for animals and humans are crucial. The potential to develop fisheries along the Nile River is very promising, especially in under developed areas of Southern Sudan where the nutritional value of fish would improve their diets. Aquaculture in Egypt’s Delta makes use of recycled water and also shows promise of providing an important source of dietary protein and income generation. Governments of the Nile Basin countries need to form policies to manage water resources and deal with competing demands from several sources. Hydropolitics are a real and at present a discouraging factor in collecting data and conducting research within the basin. This is well recognized, and a two track approach was taken to negotiate a Comprehensive Framework Agreement (CFA) through the Nile Basin Initiative Shared Vision Projects (SVP) and the Subsidiary Action Projects (SAP). Both of these provide useful platforms for dialogue, and action on the ground. The recent breakthrough of the data sharing protocol is a case in point, which will help the dialogue as well as research. It is also hoped that current statement of the CFA will be finalized and signed leading to a permanent transboundary organization for the Nile Basin. Looking to the future, there will be more demands made on Nile Basin water resources, in particular for agriculture, but also for hydropower and cities. The Nile Basin Initiative (NBI) has been trying to unite the Nile Basin countries in useful dialog. A key principle of the NBI is benefit sharing whereby countries should rely less on the amount of water to be shared, but rather more on sharing the benefits derived from water development. This will have country wide impacts giving a lift in the economies of the Nile basin countries. Issues that need to be addressed immediately such as the lowered water levels in Lake Victoria, environmental protection, efficient use of water, exchange of hydrological information and climate change strategies.


Objectives CPWF Project Report
Page | 21
1 POVERTY IN THE NILE BASIN
1.1 Population growth
Water productivity, following water access, is a key driver in improving livelihoods either through better nutrition, or wealth generation. Water risks such as droughts and short term dry spells as well as the lack of capacity to deal with them, add to the vulnerability of the rural poor within the basin. Interventions to address these risks will thus build resilience. These relations are vital to identifying interventions that will reduce poverty. Water management will be crucial as population increases over the next 25 years. Given that population pressure influences the magnitude of exposure to risk (Cobertt, 1988), projections of population change are necessary when examining the likely scenarios of future trends in vulnerability in the basin. Nile basin countries have a high demographic growth rate. It is expected that the population of the basin, which was about 160 million in 1990, will grow to 300 million by 2010 and 550 million in 2030 (Figure 1.1). With some of the countries being among the poorest in the world, the economies of the region are expected to continue to depend heavily on subsistence agriculture for the largest share of their GDP.
Figure 1-1. Population in Nile Basin and 2030 projected population (UNDP 2005, FAO Nile).
1.2 Poverty indicators and poverty map
Indicators are valuable tools for assessing policy, implementation, monitoring and evaluation (Anand & Sen, 1997). As a poverty indicator, the human development index (HDI) estimates deprivation of capabilities and opportunities essential for

Objectives CPWF Project Report
Page | 22
human development. Economic well-being including the way in which natural and human conditions are linked, is a determinant of human development. Figure A-1 (Annex) demonstrates that over the past ten years, there have been short term gains in human development for most of the Nile basin except Kenya. These trends would likely grow at a faster rate if the potential gains from better agricultural water management were to be incorporated into national priorities for development planning. Poverty line measurements equate well-being with the satisfaction individuals achieve through the consumption of various goods and services. The poverty line approach is therefore the most widely used way of establishing a threshold for the separation of poor from non-poor. Table 2 shows poverty line estimates in 4 countries across 3 agro-ecological regions in the mixed rainfed production system of the Nile basin. The range in poverty levels is large (29-70%) and the variability in the number of people living below the poverty line is a manifestation of the complex geographical as well as socioeconomic characteristics of the countries found in the basin. Table 2: Poverty levels in crop and livestock production systems in the Nile basin
Mixed rainfed system Ethiopia Uganda Kenya Rwanda (%) (%) (%) (%) Arid 56.2 42.3 62.1 60.4 Highlands 63.5 42.5 60.3 69.7 Temperate 39.2 29 50.1 64.1
Source : ILRI data base (www.ilri.cgiar.org/gis/igis.asp) Food security, poverty level and poverty inequality were used to map poverty in the rural agricultural production systems of the Nile Basin. Poverty in this case is related to household expenditure on food and non-food items (income poverty). Poverty, usually thought of in terms of deprivation, is measured against an absolute poverty line that reflects some basic minimum need or is in relation to available resources and the monetary cost of meeting certain basic requirements of life (ILRI, 2002, Cook et al., 2006; PEAP, 2004; UBOS, 2007). These include both food and non-food requirements. Households whose real expenditure per adult equivalent falls below a given level (the poverty line) are considered poor. Poverty levels within the Nile basin range from 17 % in Egypt to over 50% in 5 of the 10 Nile Basin countries.

Objectives CPWF Project Report
Page | 23
Figure 1-2. Poverty in the Nile Basin countries and Nile Basin (%)
Figure 1-2 presents spatial estimates of income poverty at sub-national level (Kinyangi et al, 2009). The poverty map on the left highlights regional variation which is hidden by data aggregated at national level. In almost all countries, these differences exist and can often be substantial. This map includes poverty data from areas outside the basin. For comparison, on the right the same data is clipped onto the Nile basin which is then disaggregated by production systems. This is the subset of the data that we use extensively in the poverty analysis. It provides better estimates of differences due to agricultural system and other indicators such as market access. For the countries presented in Figure 1.2, recent welfare and economic well-being surveys commissioned by the World Bank reveal that poverty levels are related to rural and urban inequalities and access to services (World Bank, 2002; 2003; 2005; 2006; 2007). The survey concludes that the extent to which this growth has reduced poverty is mitigated by changes in inequality and may be affected by international and rural-urban terms of trade. In urban areas growth had a greater impact on poverty reduction in areas where the proportion of households with incomes below the poverty line was lowest, indicating that poverty levels are sensitive to economic growth. Gender inequalities are widespread; women work longer hours, lack education and land resources. In addition, due to the transboundary nature of the Nile, there are formidable obstacles to water access and productivity. Equitable and effective water allocation and environmental protection depend on institutionalized cooperative agreements among regional partners.

Objectives CPWF Project Report
Page | 24
1.3 Nature and distribution of poverty in Nile Basin
In the Nile basin, as in many countries, water scarcity is one of the principal causes of poverty and malnutrition. Comparison of poverty maps with maps of agricultural system can locate “hotspots” of poverty within each agricultural system. Figure 1-3. Hot spots of Poverty (>50%) in pastoral and agro-pastoral systems
Figure 1-3 shows areas with high poverty incidence (>50%) in rangeland agricultural systems. These systems combine both pastoral and agropastoral ways of life, and crops and livestock are comparable in importance. Crops include sorghum and millet as main sources of food but are rarely marketed for income. Areas with high poverty incidence are confined to the central and southern parts of Sudan including the lake shore region of north western Tanzania; and northern Uganda. These high poverty rates may be attributed to successive droughts, occasional crop failures and sudden food shortages. In the rangeland systems of Sudan food insecurity is a widespread phenomenon. With increasing grain prices, many households suffer food deficits. In these systems, food insecurity is therefore one of the key drivers of the high prevalence of poverty. Interventions to increase income from livestock through increasing livestock water productivity and greater integration with crop farming is one way to reduce food related poverty. In brief the analysis shows cereals and legume systems have average poverty levels between 33% and 56%; the highest poverty incidence (>55%) are confined to the central belt of Sudan, the Ethiopian highlands, northern Uganda, the highlands of western Kenya as well as those of Rwanda and Burundi (Figure A-2, Annex). These rural areas high poverty tend to be intensively cultivated such as in Rwanda with poverty rates as high as 56%. They provide the highest

Objectives CPWF Project Report
Page | 25
potential for poverty reduction in the Nile basin from expansion of cropped area and crop-livestock integration, through cultivation of fodder crops as well as integrated pests and disease management and the adoption of conservation farming methods. There is significant variability in the population living below the poverty line and room for reducing the poverty level by some interventions in intensification of production, expansion of farm size, diversification of high value products and making improvements through off-farm income. In some cases, depopulation or increased off farm income maybe necessary if this involves interventions such as increased farm size. The average poverty levels are between 26% and 66% in rainfed tree and root crop systems, meaning there is significantly higher variability from among regions and countries and are high in Burundi, Rwanda, and the Southwest of Uganda highlands and a few hotspots in Northern Uganda and in Central Belt of Sudan (Figure A-3). Poverty hotspots are confined to a few areas in northern Uganda and in the central belt of Sudan. Use of fertilizers and chemicals is declining due to high costs and low returns fueled by lack of credit. The main household strategies for poverty reduction are to increase off farm income and diversification through crop processing and value addition. The need for intensification can be met by technology development for rural farmers, tree-crop soil management as well as increasing female participation in technology and strengthening farmer producer associations. In tree crop systems agriculture labor is a significant contributor to household incomes besides earnings from sales of cash crops. In the mixed irrigation systems areas of poverty are much smaller, less than 0.4 million square km in the entire Nile basin (Figure A-4). However, these comprise large scale schemes that support large agricultural populations and given the map resolution, it could be that the poverty hotspots are confined in much smaller spatial units that could not be resolved with the current approach and datasets. However, at a scale of several hundred square kilometers, these areas could form entire district or provinces in a country. Nevertheless the key determinant of income and well-being in irrigated systems is access to water. For these systems, production can further increase substantially in current production areas by yield increases from existing irrigated land – an option given that overall water productivity remains very low. In irrigated systems, usually poverty incidence is lower. Where poor people have access to irrigation water, their poverty status is determined by the lack of access to institutional infrastructure as a means to generate income. Unfortunately, irrigation performance has often been far less than expected. The areas outlined in the poverty hotspot maps are those where food insecurity due to high poverty rates and dependency on rainfed agriculture is high. The risk of rainfall variation and changes in length of growing season in pastoral and agropastoral systems, high exposure to disease and malnutrition due to low institutional capacity to cope with the negative impacts in the highlands as well as in the Lake Victoria sub-basin but widespread poverty is still unexplained by good market access. People who have good water access can use it for productive purposes, for food production, small scale cottage industries etc. When communities or households have poor access to water, their labour supply is much reduced due to the time needed to collect water for basic needs. Labour is the biggest income generating asset most people have to earn an income. A dynamic livelihood system characterizing biophysical and social vulnerability, given that a weak asset capital base indicates a lack of capacity to adapt to water

Objectives CPWF Project Report
Page | 26
stress as manifested through changing water conditions in agricultural systems. Areas with high vulnerability scores in rangeland and mixed rainfed systems are associated with low crop and livestock water productivity. Mapping water-related hazards (droughts, floods, and diseases), highlights areas of high exposure in marginal land such as floodplains, where there is a high risk of outbreaks of water-borne human and cattle diseases. 1.4 Mapping vulnerability
Vulnerability is comprised of risks that people confront in pursuit of their livelihoods, the risk response or the options that people have for managing these risks and subsequent outcomes that describe the magnitude of loss in well-being. The risk response or available options are in turn determined by access to livelihood assets, strategies and policy and institutional environments that mitigate the resulting negative impacts. Poverty and vulnerability differ. Poverty is fixed in time and measured using some form of economic well being; vulnerability can happen at any time and is usually due to a variety of circumstances (Figure A-5 Annex). We mapped several datasets that are major components of vulnerability in the three production systems. These are environmental and socio-economic resource based conditions that expose communities to vulnerability (Figure 1.3). Spatial datasets related to vulnerability or proxy indicators were used as a measure of vulnerability from earlier studies in the region (Thornton et al 2006). Risks were related to three major factors (water availability and water accessibility, bio-physical resources endowment of an area, and prevailing socio-economic conditions) were mapped, analyzed and combined to produce a vulnerability layer which we based on a probability function (Tables A-3, 4, 5 Annex). Several indicators of bio-physical and social risks which results in vulnerability are environmental, agro-ecosystem resilience, water related and socio-economic resource base conditions that expose communities to vulnerability. The outcomes of cluster data were combined as severity indices ranging from 4 to 5 levels depending on the number of variables. However the actual map (Figure 1.4) is built from the probability layers and the scale represents the sum of probabilities of the biophysical indicators. In this way, both the map (Figure 1.4) and Table 1.1 are interpreted together (the same applies to Annex A Figures A-6, A-7 and Table A.6). These risks ranged from very high risk, high risk, moderate risk, low risk and very low risk.

Objectives CPWF Project Report
Page | 27
Figure 1-4. Map of water related risk for the Nile Basin (Kinyangi et al, 2009).

Objectives CPWF Project Report
Page | 28
Table 1-1. Level of water related risks
Water related risk indicators
Level of risk CV Rain
LGP loss (negative impact)
LGP gain (positive impact) Drought Floods
Low 0 - 20 0 - 5 0 - 5 0-1 0 - 1
Medium 20 - 40 5 - 20 5 - 20 1 - 2 1 - 2.5
High 40 - 233 > 20 > 20 > 2 >2.5
Note: CV = Coefficient of Variation; LGP = Length of growing season. For all agricultural systems, the probability of biophysical shocks due to water hazards ranges between low to medium risk. Overall, mixed irrigated systems show low exposure vulnerability to water related hazards suggesting negative attributes for all four indicators of exposure to water related hazards. This indicates that the all of the areas in pastoral, agropastoral and mixed rainfed agriculture is highly exposed to vulnerability from water related hazards while mixed irrigated agricultural systems are less vulnerable to water related hazards (Figure 1-4). All the map figures and tables on biophysical and socioeconomic vulnerability are found in the Annex. 1.5 Poverty and vulnerability summary
Poverty and access to water are linked through crop and livestock based livelihoods. Increasing agricultural water productivity can potentially contribute to poverty reduction largely because widespread land degradation has reduced vegetated cover soil fertility so that relatively little rainfall is transpired by pasture and croplands and much is lost through evaporation and transpiration. Rehabilitation of vegetative cover and soil fertility is a key pathway to increase water productivity and consequently the agricultural production potential that is essential to poverty reduction. From the poverty maps the poor and their economic well being in the Nile basin is partly attributed to a high dependency on poorly managed rain-fed agriculture. Individual vulnerability to water related shocks is greatest in agropastoral systems but many vulnerable poor people are still found in rain-fed systems. There is a lower risk of rainfall variation in the highlands as well as Lake Victoria sub-basin but for these areas mapping hotspots of biophysical vulnerability shows a low potential to adapt to changing water conditions. It appears that the poor in these regions remain vulnerable in spite of natural agroecosystems’ biophysical resilience. Widespread poverty remains and this may be due to inherent social risks poor farmers face. The risks described in the Uganda case study below illustrate the complex circumstances many poor farmers face. There is increasing evidence that exposure to diseases and the level of childhood nutrition is partly due to low institutional capacity to cope with the negative impacts of low agricultural water management. For example, herders in Nakasongola District of the Cattle Corridor invested in water harvesting (valley tanks), but when drought came, local government authorities decided to allow local people to use the water for domestic purposes and to prohibit livestock watering. Herders were forced to take their animals to the Lake Koyoga for watering. But large concentration of domestic animals along the riparian shoreline led to rapid depletion of feed and high rates of animal disease. Thus, in spite of having invested in water harvesting the livestock keepers in early 2009 lost about

Objectives CPWF Project Report
Page | 29
20% to 30% of their animals due to disease and the survivors lost weight and were in poor condition. 1.5.1 Case Study Summary: Poverty and water access in agropastoral systems: the “cattle corridor” in Uganda, Most of the water related poverty indicators show that poor households are vulnerable to physiological deprivation from basic needs. These households are located far from water points, often in areas where people and livestock share the same sources of water. For poor households, part of the difficulty in providing secure water and pasture is related to exposure to multiple risks compounded by food deficits, water insecurity and disease. In the cattle corridor of Uganda, most available water sources dry up due to increased evaporation and demand from the various users (livestock and domestic) was well as decreased capacity from increased siltation of the valley tanks. For this reason households that practice rain water harvesting and storage are perceived to be less poor. In addition families with more livestock assets and with access to a water source are likely to be food secure. In contrast households with small land sizes who depend on seasonal water availability are also likely to be food insecure. Rain water harvesting as a strategy to offset water scarcity challenges is diminished due to alternative uses for containers etc for other household activities. Women are affected more by increased distances to water points during dry seasons whereas children are disrupted from attending school denying poor households opportunities to exit poverty. An interesting observation is that the poor quite often own degraded land with little or no means for rehabilitation which significantly lowers agricultural productivity, causing severe food insecurity. Why the poor own degraded land requires further research. However, evidence suggests that several factors may play a role. In general, relatively wealthy and more economically powerful people often gain tenure to the best land and other natural resources. Lack of education, access to extension services, credit, farm inputs and veterinary services may aggravate rates of land degradation and constrain efforts to reverse it. In Uganda, rainwater harvesting in the form of valley tanks requires more land than that typically owned by poor farmers. Thus for rainwater harvesting to be successful, community based water and land management is required, but this involves much more complex and and challenging institutional arrangements. We therefore conclude that a framework that links agricultural water, rural incomes, education, land use, market interventions and health management has the potential to generate more effective options for poverty reduction in such agropastoral systems.
1.5.2 Case Study Summary: The development of aquaculture in Egypt and its impacts on livelihoods and poverty at both local and national levels - World Fish
In 2006, Kafr el-Sheikh’s fish farms produced 295 thousand tonnes of cultured fish, and it is estimated that nearly 20% of annual aquaculture production is sold within the area. While aquaculture is important for the economy, its impacts on poverty are less clear. Over 330,000 people, representing some 45% of the workforce, work in agriculture and fishing in Kafr el-Sheikh, and with aquaculture representing less than 10% it is difficult to distinguish impacts from aquaculture from other agricultural employment. No reliable statistics exist on employment in aquaculture. Therefore, little can be said with much confidence about the effects of aquaculture on poverty levels and unemployment without comparing data from fish farming and non fish farming areas in the area.


Objectives CPWF Project Report
Page | 31
2 ACCOUNTING FOR AVAILABILITY AND USE OF NILE
WATERS
Figure 2-1. The Nile Basin. Source: Yoa and Georgiakakos (2003)
The Nile Basin catchment area is over 3 million km2, with a length of about 6,671 km, making it the longest river in the world (Figure 2-1). The average flow of the Nile at Dongola between 1912 and 1982 was 84 km3/year, but extreme values of 120 km3/year in 1916 and 42 km3/year in 1984 shows that there are wide fluctuations in Nile flow (Collins 1990); fluctuations which are likely to be exacerbated with climate change and variability. The Nile River begins in remote areas of Burundi and Rwanda feeding into the Kagera River. It flows into Lake Victoria where it releases part of its waters into Lake Kyoga, part swamp and part lake. Kyoga discharges into Lake Albert. Lake Albert also receives water through the Semliki River, from Lakes George and Edward. As the waters leave Lake Albert in its
northerly descent, it becomes Bahr el Jebel, the beginning of the Sudd sub-basin (Howell et al, 1988). Overflow from the Bahr el Jebel forms the Sudd; a massive area of swamps, partly seasonal and partly permanent that form along the sides of the river. At Lake No, east of Malakal it becomes the White Nile and is joined by the Bahr el Ghazal River draining the southwestern plains bordering the Congo Basin, contributing negligible flows to the Nile. The Baro-Akobo-Sobat tributary originates from the south-western part of the Ethiopian Plateau and partly from the plains east of the main river joins Bahr el Jebel at Malakal.
Due to evaporation in the Sudd swamp area, the White Nile leaves this area with only about 16 km3, out of 37 km3 on entering it. The Sobat River is discharged from Baro and Pibor Rivers providing about 13 km3 before joining the Blue Nile at Khartoum. The contribution of the Bahr el Ghazal basin is negligible, estimated at about 0.5 km3. The average annual flow of the White Nile System at Malakal is about 29.5 km3 and the daily discharge fluctuates between 50 million m3 in April to 110 million m3 in November (ratio 1:2) (Sutcliff and Parks, 1999). The Blue Nile originates from Lake Tana located on the Ethiopian Plateau at 1800 m, in a region of high summer rainfall (1500 mm/yr). The Sobat, Blue Nile and Atbara (which all originate in Ethiopia) combined contribution is about 86% of the Nile’s total discharge at the Aswan dam. The flows from the Ethiopian highlands, at their highest, provide about 95% of the flow into Egypt, while at their lowest, only about 60%. At peak flow, the velocity and quantity of the Blue Nile causes a ponding effect for the White Nile, and water is backed for more than 300 km. This

Objectives CPWF Project Report
Page | 32
natural reservoir is only released when the Blue Nile’s flow drops in late September. 2.1 Hydrology and water resources
The hydrology of the Nile has been described in detail by different hydrologists, and documented in several books Hurst (1931; 1952); Shahin (1985); Sutcliffe and Parks (1999); Mohamed (2005), in addition to extensive journal articles found in the literature. Here, we give a brief summary of the hydrology, complemented with new analysis of trends as an introduction to the water balance and water accounting calculations presented below. The relative contribution to the mean natural Nile River at Aswan of 84.1 Gm3/year (mean of 1900 to 1950) is approximately 4/7 from the Blue Nile, 2/7 from the White Nile (of which 1/7 from the Sobat), and 1/7 from the Atbara River. So the Ethiopian catchments (Sobat, Blue Nile and Atbara River) contribute to about 6/7 of the Nile water resources at Aswan. The annual and monthly natural flows at key locations are shown in Figure B-1 (Annex). Influenced by the rainfall pattern and dampening effects of lakes and wetlands, the flow the White Nile is quite steady, unlike the highly seasonal flow of the Ethiopian Plateau (Figure B-1 Annex). Storage reservoirs were built as early as the beginning of the 19th century (old Aswan dam) to soften the sharp seasonality of the Nile flows. Subsequently numerous dams and barrages were built in Egypt, Sudan, and lately in Ethiopia. The High Aswan Dam (167 km3) is currently the largest reservoir in the basin. Table E-3 (Annex) provides a list of all control devices on the river. 2.2 Water availability, access and water accounting
Water availability as measured by river flows, rainfall gauges, and groundwater studies is a relatively straightforward exercise, dependent on number and quality of measurement points and access to data. Quantification of water access, the ease of obtaining water, in a large basin such as the Nile is not straightforward. People obtain water from many different water sources: rain, river, groundwater, and the variation in size, from the small drinking water ponds in the plains of Kurdfan in Sudan, to the gigantic reservoir of the High Aswan Dam, poses real difficulties in setting up plausible indicators to assess water accessibility. However, a satellite map, now feasible for the Nile size, can also describe different water uses and may indirectly provide the information needed for access. For example, an irrigation pixel indicates better accessibility compared to a non-irrigation, or rainfed system. For this study we account for water availability and study its use in agriculture via remotely sensed evapotranspiration data to give a proxy indication of ease of access. The data and information on Nile hydroclimatology vary. Long term monitoring and documentation of the Nile hydrology and water resources exist in the lower Nile in Egypt and Northern Sudan, while clear data gaps exists for upper catchments, where utilization of Nile water is less. Water Accounting (WA) is the analysis of water resources and its use in a basin. It is based on water balance principles, and includes all water supply components (rainfall, river flows, groundwater), and the different water consumption processes that occur within the basin. The main objective of WA is to understand water availability, how water is used in a river basin, to give indications of where opportunities exist for improvement. The water accounting method tracks rain, river flows, evapotranspiration and outflows, moving well beyond traditional

Objectives CPWF Project Report
Page | 33
approaches that focus on blue water resources (rivers, lakes, reservoirs, and groundwater). For our analysis almost all input data was derived from satellite measurements, including: land use pattern, precipitation, evapotranspiration (split into evaporation E and transpiration T), and dry matter production (Figure B-3 Annex). We have used the water accounting framework (WA+) developed by Molden (1997), and extended by Bastiaanssen et al. (2009) as presented in Figure 2.2. A detailed description of the WA+ calculation for the Nile is given in Mohamed et al., 2009. We have computed the water accounting for the Nile, over 1 km*1 km pixels, aggregated to the different land use classes of Figure 2-4, and hence to the entire Nile basin. We took a one year period for the analysis, extending from January to December, and use the year 2007. The annual water balance of the Nile has been assessed first as (Qout= P-ET). The outflow to the Mediterranean Sea (Qout) has been used as a closing parameter of the balance. The literature shows different values of Qou, e.g., Molden (1997) estimates 14.1 km3/year for the 1989/90 season, Oosterbaan (1999) gives 9 to 11 km3. The outflow can also be estimated as the difference between Aswan release and water consumption downstream. Many researchers e.g., Aquastat-FAO (1997), Hefny (2005) presents wide range of outflow from High Aswan Dam (HAD), between 55.5 to 73.6 km3/yr, and water uses in Egypt between 31 to 68.3 km3/yr. The difference provides a wide range of outflows between 9 to 30 km3. For year 2007 we adopted the outflow of 25.7 km3 (including environmental flows) computed by Droogers et al. (2009), for the years 2007 and 2008. We have used rainfall interception for the different classes as a tuning parameter to compute the correct Qout (Gerrits et al., 2009). It should be noted that there remains large uncertainty around the Nile outflow to the Mediterranean, an important number as it gives an indication as to how much more irrigation expansion is possible. The gross inflow is considered equal to the rainfall on the basin as there is negligible flow to/from the Nile to the neighboring basins. We considered a committed outflow into the Mediterranean Sea of 9.8 km3/yr for leaching salt in the Nile Delta and for aquatic ecosystems in the coastal region (Molden, 1997), although this number requires further analysis. Water is depleted by evaporation and transpiration (consumptive use), flow to saline sinks, incorporation into a product, or pollution to the extent that it cannot be used again. The depletion in the Nile basin is predominantly consumptive use (ET).

Objectives CPWF Project Report
Page | 34
Figure 2-2. Schematization of the Nile WA+ system, annual volumes in km3/year for 2007
2.3 Land use classifications and water use The land use categorization reflects to which extent the Nile Basin is regulated, and also what the water management options are. The classification may aggregate further details or may exclude smaller land and water uses within the Nile Basin, e.g., grazing land is not intrinsically classified, but may exist in the savannah, shrub lands or open forests (Figure 2.3). The assumption is that grazing causes minimum changes to runoff at a land use class scale, however still included in water productivity calculation through ET and feed-biomass from vegetation. Nevertheless the classification serves the purpose of broad water accounting, inclusive of main water supply and consumption components, as well as biomass production at the Nile Basin or sub-basin scales. Figure 2-3. Areas (km2), precipitation (mm/yr), evapotranspiration (mm/yr) per each land and water use class in the Nile basin for year 2007.
-
500,000
1,000,000
1,500,000
Clo
sed
fore
st
Ope
n fo
rest
Shr
ub la
nd
Woo
dy s
avan
nah
Ope
n sa
vann
ah
Spa
rse
sava
nnah
Nat
ural
wet
land
Rai
nfed
cro
ps
Urb
an a
nd in
dust
rial
Des
ert
Irrig
ated
cro
p
Res
ervo
ir
Lake
s &
riv
ers
Man
aged
wet
land
s
Sal
ine
sink
s
land use and water use class
Are
a (
Km
2)
0
1000
2000
3000
P,
ET
(m
m/y
r)Area km2
Rainfall mm
ET mm
Natural land cover Managed land use Managed water use Natural forest P, ET Savanna P, ET Pastoral land P, ET Desert P, ET
Forest plantation P, ET Rainfed crop P, ET .. P, ET
Irrigation P, ET Managed wetlands P, ET Drinking water P, ET .. P, ET
Aquifer & reservoirs
P-ET= 81.4 P-ET=-57.4
Outflow=29.0
P-ET=5.0
Inflow=0.0 ∆S=0.0
Committed = 9.8
Available flow=76.6

Objectives CPWF Project Report
Page | 35
Therefore, aggregating the actual evapotranspiration pixels will show how the water consumption is over these classes. The dominant water consumption over the Nile is by far through evapotranspiration (>98%), i.e., the actual evapotranspiration map reflecting water consumption over the basin, informs much about water accessibility over the classes. However, at more detailed scale, e.g., at village level, domestic consumptions might be larger, and the ETa map will not be able to tell about water accessibility. An accurate analysis of water accessibility requires first to clearly define which indicators can be used, is it the distance to a water source, the economical status, technological knowhow, the institutional constraints, or a combination of these proxies. A methodology to map those indicators is needed, and a topic of further research. High resolution remote sensing data would be promising to represent water accessibility, but at scales more detailed than Nile Basin (computational constraints). It is beyond the scope of this study to map water accessibility at detailed scales. Figure 2- 4. The Nile Basin land use and water use map
Global Cover Land Cover 2008: the map is produced by European Space Agency. It has 22 land cover global classes, which are defined according to the UN Land Cover Classification System (LCCS).

Objectives CPWF Project Report
Page | 36
Table 2-1. The water accounting results for year 2007
Inflows and Outflows Km3/yr Water Depletion Km3/yr
Inflow (precipitation) 1745 Natural & Pastoral 1458
Evapotranspiration 1716 Rainfed 189
Outflow 29 Irrigation, cities, industries 69
Total 1716
Depleted Fraction 0.98
Blue Water Accounts
Total Blue Water 98
Environmental Outflow 10 (outflow plus ET by irrigation, cities, industries) first order rough estimate
Available for Depletion 88
Depleted 69
Depleted Fraction 0.78 Table 2.1 and Figure 2.2 reflect how Nile water supply is managed and used. The sole supply entering the basin is precipitation which is either evaporated, transpired, flows into rivers or groundwater. Our estimates show that 98% of total precipitation is consumed by landscape evapotranspiration, leaving 29km3 as outflow. Table 2.2 shows the pattern of ET with 1458km3 or 85% of ET from natural land cover or pastoral lands. Managed land use, or land that has been converted mainly for rainfed agriculture, is 189km3, and managed water use for irrigation, cities and industry is 69km3, or approximately 1/3 of rainfed agriculture. These figures show that river flow is only a small portion of the total rainfall amount and that ET from pastoral lands is by far the greatest water consumer, followed by rainfed agriculture, then irrigation. The total precipitation less ET provides an estimate for outflow from the basin as 29km3/yr. The outflow either flows or drains to the Mediterranean Sea or moves out of the basin as groundwater flow. Moreover, because there is inherent uncertainty in the ET and precipitation estimates, there is also uncertainty about this outflow term. However, this is a critical number for the basin as it gives an indication of how much more water could be developed and consumed through managed water use (irrigation, cities, and industries). If we assume a committed environmental outflow at the downstream end of 9.8 km3/yr, the ET from managed water uses reduces to 76.6 km3/yr, or about 4% of total precipitation. This observation is remarkable for a few reasons. First, the very small amount of water that is made available, reflects a high degree of development with an intensive diversion (diverted is 57km3 out of 77km3 available). Other reported values of outflow are smaller indicating more intensive use. Second is that there seems to be more opportunities in better use of rainfall before it reaches the river. While irrigation is often regarded as the major water user, forests and savanna use 21 times more water in the Nile basin. In addition to water balance assessment, the WA+ framework provides a quick assessment of water productivity in kg of biomass per m3 of ET over each pixel, simply by dividing biomass production to water depleted (ET). While, a detailed analysis of water productivity is given in Chapter 3, this is a useful approach. The benefits can either be economic (e.g., crops from rainfed and irrigated land, hydropower energy from reservoirs, wood from forests, or feed and firewood from savanna and shrub land) or environmental (biodiversity in a wetland, habitats for wildlife, carbon sequestration in tropical rainforests, fish in lakes and reservoirs, climate adaptation, among many others). Evaporation (E) from soil, interception, and rivers or streams is considered non-beneficial. Evaporation from wetlands

Objectives CPWF Project Report
Page | 37
and reservoirs is considered beneficial. The transpiration component T is usually considered as beneficial. A qualitative assessment of the water productivity per land use class is calculated as biomass production relative to ET consumption. Figure 2-5 shows total dry matter production in million tons, and productivity in kg/m3. The majority is produced by the open Savannah region (25% of the area). Open savannah produces feed and wood (economical benefits), as well as contributing to the natural environment. The data reflects that the food produced by rainfed crops in the Nile basin is four times more than from irrigated agriculture (23 million ha rainfed versus 5 million ha irrigated). Several land uses are not producing any dry matter, and they are therefore zeros. In reality they produce other economical benefits such as hydropower, transportation, fish, ecotourism etc, which is hard to include in this WA calculation. Water productivity in kg (biomass)/m3 is highest over closed forest (3 kg/m3) because of higher biomass production. Figure 2-5. Biomass production in million tons, and water productivity in kg/m3 for different land use classes for year 2007
0.0
0.5
1.0
1.5
Clo
sed
fore
st
Ope
n fo
rest
Shr
ub la
nd
Woo
dy s
avan
nah
Ope
n sa
vann
ah
Spa
rse
sava
nnah
Nat
ural
wet
land
Rai
nfed
cro
ps
Urb
an a
nd in
dust
rial
Des
ert
Irrig
ated
cro
p
Res
ervo
ir
Lake
s &
riv
ers
Man
aged
wet
land
s
Sal
ine
sink
sBio
mas
s pr
oduc
tion
in m
illio
n to
n
0
1
2
3
Pro
duct
ivity
in kg
/m3Biomass production in million ton
Productivity kg/m3
2.4 Threats in the Nile
It is increasingly recognized that appropriate water resources planning and management at a river basin scale such as the Nile, necessitates considering the complete water cycle in the basin, i.e. including both the land surface (hydrological) and the atmospheric processes. In many river basins, steady climatic conditions are no longer considered a valid assumption for sustainable water resources management. Hydroclimatic risk is manifested in frequent climate shocks (floods and droughts) which hit several places within the Nile basin during last few decades. Over 70% of the Nile people depend on agriculture, the majority on rainfed systems, which makes them more vulnerable to floods and droughts both exacerbated by climate change. Most of the climate change studies, agree on increased frequencies of climate extremes, though high uncertainty is still the norm regarding magnitudes of climate extremes. Although a majority of researchers agree on a steady temperature rise in the Nile Basin, they disagree on rainfall predictions (Strzepek et al., 2001; Conway 2005; IPCC, 2007). Their results show high uncertainty of future rainfall predictions by different Global Climate Model (GCM), and thus the hydrological impacts, in particular Nile runoff. This is not unexpected, because of the extremely low runoff

Objectives CPWF Project Report
Page | 38
coefficient of the Nile (<10%), and in particular the White Nile (<5%). Conway (2005) in a review of about 10 studies on climate change over the Nile from 1994 up to 2003, concluded that while temperatures are expected to increase there is uncertainty about the direction and magnitude of future changes in rainfall, particularly due to differences between GCM results, and the influence of complex water management and water governance structures. Elshamy et al. (2008), analyzed outputs (rainfall and potential evapotranspiration) from 17 Global Climate Models given in the IPCC 4th assessment report, for the period 2081-2098, to compute Blue Nile runoff at the Ethiopia-Sudan border. All the GCMs showed an increased temperature of 2 to 5 °C, and an increase of potential evapotranspiration of 2 to 14%. However the models disagreed on precipitation changes, with values between ranges -15% to 14%, with an ensemble mean showing no change. The associated Blue Nile runoff varies from 60 percent to 45 percent varying in response to the catchment. Other researchers show that the inter-annual variability of the Nile precipitation is determined by several factors, of which the El Nino-Southern Oscillations (ENSO) and the sea surface temperature over both the Indian and Atlantic Oceans are claimed to be the most dominant (Farmer, 1988; Nicholson, 1996). Camberlin (1997) suggested that monsoon activity over India is a major trigger for the July to September rainfall variability in the East African highlands. 2.5 Water scarcity in the Basin
Problems of water scarcity will be particularly urgent in water stressed areas. Using the Falkenmark (1989) criteria at a sub-basin level, an important part of the Nile basin can be considered water stressed or even water scarce. However, at a national level, available water resources are considerable for most Nile basin countries. Molden et al (2007) describe physical and economic water scarcity, where physical scarcity exists when availability is insufficient to meet demand, and economic scarcity when access is limited in spite of water availability due to financial or human or institutional capacity reasons. This analysis shows that the Nile has regions of both economic and physical water scarcity (Figure 2.6), but most countries suffer more from economic water scarcity (Davis, 2007) as infrastructure and/or financial capacities rather than absolute water availability prevent to redistribution of available water. Classifications of water scarcity like the one proposed by Falkenmark do not take into account actual land use and the suitability for alternative land uses. A universally agreed definition of water stressed areas has not been developed; whether a system is water stressed will depend on the biophysical and environmental conditions and the water use. Some consider a country to be water stressed if the population uses more than 20% of their average annual renewable resources (Arnell, 1999). Falkenmark et al. (1989) says a country is water stressed if the available water resources per capita are below 1700 m3 per year, while they are considered water scarce when below 1000 m3 per capita per year. Within the context of agriculture, water stressed areas are considered as an agricultural production system in which the major limitation is the deficiency of water (Peden et al. 2007). This can take different forms. Besides low rainfall, high run-off (often combined with irregular, concentrated rainfall events) combined with lack of capacity to store water and or large distance to major water sources (e.g., water towers, rivers, water bodies, wells) are factors that will negatively affect water availability.

Objectives CPWF Project Report
Page | 39
Figure 2-6. Water scarcity maps: Right side Falkenmark (1989); left side Molden, CA IWMI (2007).
2.6 Conclusions
The hydroclimatology of the Nile is characterized by distinct spatial and temporal variability. Rainfall and vegetation cover ranges from equatorial forest in the south, to semi arid and arid climates in the central and lower parts of the basin. A heavy, but short rainy season (June to September) provides more than 80% of the Nile water. This variability directly influences agricultural systems in the basin, practiced by more than 80% of the population. Vulnerable rainfed systems exist on the upper parts in Ethiopia and around the Equatorial Lakes, mixed rainfed and irrigated systems in the middle part in Sudan, and irrigated agriculture in the lower part in Egypt. The data and information on Nile hydroclimatology also vary. Good monitoring and documentation of the Nile hydrology and water resources exist in the lower part in Egypt and Northern Sudan, while clear data gaps exists for upper catchments, where less utilization of Nile blue water exist. Four our study we found it difficult to obtain flow data past the year 2000 because of political sensitivities. Historically, water accessibility in the Nile basin has been shaped by the need for water, level of development, and available technologies. Good access in the lower part is provided by the High Aswan dam. Limited storage capacity and institutional constraint (1959 agreement) limits access in the middle part (Sudan). Better access in the upper parts in the Equatorial Lakes and Ethiopian Plateau is bounded by economic and technological constraints. Water accounting reveals interesting results for the overall image of the Nile basin water supply, uses, and production for year 2007. The basin has been classified into 15 land use and water use classes, grouped further - as to water management opportunities, into 3 main systems: natural land use (e.g., forests, savannah, deserts), managed land use (e.g., rainfed crops), and managed water

Objectives CPWF Project Report
Page | 40
use (e.g. diversion for irrigation, hydropower). We found that, the water consumption in the Nile is dominated by natural land use (85%), a minor 11% by rainfed crops, and only 4% by irrigated agriculture. However, the majority of the consumption (75%) is considered beneficial, either economically (food, feed, and wood) or to the environment. The rainfed cropping in the Nile (7% of area) produces about 80% of the food (measured as the dry biomass), while irrigated land (1.6% of area) produces about 20%. Opportunities to address water management questions, e.g., increasing water productivity but not influencing water supply/consumption, relies within the natural land use (Savannah, shrub land, forest). Only, about 4% of the Nile water (diverted) can be completely managed, and lastly, to benefit from excess water flowing to the Sea. Further work to support basin scale water accounting, should include a continuation of the analysis to smaller spatial scales, e.g., sub-basins (Blue Nile, White Nile, etc), or at country level. Furthermore it would be beneficial to disaggregate analysis to monthly or seasonal time steps.
2.5.1 Nile Case Study Summary: Egyptian Water Use Patterns, Performance and Prospective Hussein El Atfy, Alaa Abdin and Ibrahim Gaafar (2009) Nile water is depleted mainly in the form of evaporation and transpiration from various land covers. Water eventually flows out to the Mediterranean Sea through the river (almost nil) and from drains. The release of the High Aswan Dam (HAD) is not always 55.5 BCM/year due to the high floods which could harm the dam such as the four year period starting from 1998. Figure 2.6 shows the actual release of HAD according to the records of the Hydraulics Research Institute, information helpful in determining the performance of Egypt’s Nile irrigation. Note that the numbers of outflow to the sea differ from remote sensing estimates described above. Drainage Research Institute (DRI) records show that the average drainage outflow to the Northern Lakes and Fayoum is about 13.0 BCM/year. One reason for the lack of reduction in drainage outflow, in spite of conservation efforts is illegal rice cultivation due to increased drainage outflow. As a result increase in the standard of living combined with rapid population growth results in increased domestic water demand. Currently the quantity of water provided to the domestic use is 8.8 BCM per year which is 15 % of the Egyptian quota, about 40% of which is losses due to the in-efficient distribution network. The most complicated issue is how to manage limited water resources coupled with a rapidly growing population with increased requirements for food security. This paper concentrated on the water distribution among the different sectors and the performance of the use of these shares as well as the prediction of the water balance situation according to the increased population needs for domestic and Industrial uses and agricultural requirements of the new reclaimed area.

Objectives CPWF Project Report
Page | 41
Figure 2-7. Release of HAD and Depletion and Outflow of Egyptian Water (bcm/km) from 1984 to 2006. (Aquastat 2005, El Quosy 2006, DRI 2007, HRI 2008).
Crop productivity, crop value and net returns are examples of the high performance in Egypt's irrigated agriculture. Domestic needs have increased to about 8.8 BCM per year thus decreasing the quantity of water available for agriculture. However, increased domestic withdrawals have in turn led to use of other water resources through reuse, recycling and utilization of shallow groundwater basins. Finally, a detailed study on the allowable drainage discharge to the sea has to be carried out immediately to determine the quantity of water that could be saved without environmental and health problems. 2.5.2 Case Study Summary: Estimation of actual and potential production of Lake Victoria and Lake Kyoga Most of the water entering Lake Victoria is from precipitation on the lake surface, the remainder is from rivers which drain the surrounding catchment. The Kagera River is a main contributor, roughly 7 percent of the total inflow, or one half of direct precipitation. The Kagera River’s origins are in the highlands of Burundi and Rwanda, forming the border between Rwanda and Tanzania, after which it turns east and flows for at least 150 km through Tanzania. It discharges into the lake just north of the border between Tanzania and Uganda. Some 85 percent of water leaving the lake does so through direct evaporation from its surface, and the remaining 15 percent largely by way of the Victoria Nile, which leaves the lake near Jinja in Uganda, and flows via the Owen Falls, and the Murchison Falls to join the outflow from Lake Mobutu; these outflows are the main sources of the White Nile. At the start of the Victoria Nile the British constructed a dam just below Jinja in 1954. It was expanded in 2000 during a drought that sent the water levels to their lowest point. Looking at the water balance since 2000, hydrographs show a trend of low water levels and increased outflow from the dam; this creates great concern for the future of Lake Victoria. The explanations for the drop in water level of Lake
Agricultural
Release from
Drainage
Nile

Objectives CPWF Project Report
Page | 42
Victoria are that a) reduced rainfall in the basin has decreased the inflows and b) increased outflows from excess releases due to increased power demands through the dam at Jinja. A new dam at Bujangali was commissioned below Owen Falls but the agreed release was not tenable (SRCM, 2006; Kull, 2006). Mean while increased demand for power in Uganda has lead to increased release of water and this in addition to several years of low rainfall are believed to have resulted in a significant drop, 80 year low, in the lake. Kull (2006) estimated that in the past two years, the Ugandan dams have released water at an average of almost 1250 cubic metres per second; that is 55 per cent more than the flow permitted for the relevant water levels. Diminishing water levels have acute consequences for several economic sectors dependant the lake such as fisheries and navigation. Water level variations affect shallow waters and coastal areas which are of particular importance for numerous fish species and health of the lake. The hydroclimatic state of the region around Lake Victoria appears to have shifted from prolonged drought to less than normal precipitation conditions, but unfortunately the historical record indicates that drought will likely return within the decade (Swenson and Wahr, 2009). Cooperation between all concerned authorities is necessary to search for coherent solutions to ensure the sustainability of both lakes. 2.5.3 Case Study Summary: SUDD Hydrology The Sudd area is part of Bahr el Jebel which originates from the African Lakes Plateau and is the main source of water of the Sudd wetland. About 50% of the 29x109m3 of water that flows into the Sudd and circulates within its ecosystems does not contribute to runoff, at Lake No. In words, less than half of the water flowing into the Sudd actually flows out again to continue north to Khartoum. During 1905 – 1983, for instance, average annual inflows to and outflows from the Sudd were in the order of 33332 103 m3 and 16091 103 m3, respectively, (Sutcliffe and Parks, 1999), indicating a bit greater than half of the inflow in the Sudd is evaporated. This led to the Jonglei Canal project. The Jonglei Canal, which was planned to be 360 km long, 28 to 50 meters wide and 4 to 7 meters deep (Wilson, 2009). It was conceived to run through the Sudd wetlands in Southern Sudan with the primary objective of reducing evaporation losses within the Sudd (Sutcliffe and Parks, 1999). The volume of discharge of Bahr el Jebel at its confluence with Bahr el Ghazal, at Lake No, is calculated as 14x109m3. The Jonglei Canal, would attempt to salvage this water by diverting the inflow at Bor and release it at Hillet Doleib, right before Malakal (Sutcliffe and Parks, 1999). Plans were drawn up between Governments of Sudan and Egypt to divert the waters of the White Nile around the Sudd swamps via the Jonglei canal (Figure B-4 Annex). Work on the canal began in 1978 but was stopped in 1983 for technical, financial and political reasons (Hughes and Hughes 1992). Diversion of water into the canal would prevent evaporative loss of water from the Sudd, and it would allow this water to be used for irrigation, or other purposes downstream. The Jonglei Canal project, if completed, is expected to reduce the water level of the swamp by 10% during flood season and by 20% during the dry season, greatly reducing the area of the grazing vegetation or toich. This would disrupt the wetland ecosystem and the seasonal movement of livestock and migrations of great herds of African wildlife (Collins, 2002).
Upstream of the Sudd, from Bor to Juba the torrents flowing into Bahr el Jebel are an important factor, and contributing to the river’s waters. Most notably the Aswa and Kit, these torrents are located between discharge of Lake Albert and Bahr el Jebel at Mongalla. These torrents contribute on average 4 km3, but vary from 1.3 to 11 km3. The contribution through torrents is made through flash

Objectives CPWF Project Report
Page | 43
floods during the rainy season (Howell et al, 1988). The increase in area around 1960 was due to a doubling of discharge from Lake Victoria. In general, increase of intake at the head of the Sudd does not result in a proportional increase at the tail. Also, with increased intake, the area exposed to evapotranspiration is increased. Table 2.2 shows that the greater the increase in inflow, the greater the percentage lost through evaporation (Howell et al, 1988).
Table 2-2. Inflow, outflow and evaporation in the Sudd averaged over different time periods. (Adapted from Howell et al, 1988). Period At Mongalla At tail of swamps %
evaporation 1905-60 26.8 14.2 47.0%
1961-83 49.1 16.1 57.7%
1905-83 33.3 21.0 51.2%
The main conclusions of the study found that soil recharge exceeds 350 mm/yr and evaporation about 2075 mm/yr. Also, soil in the rain fed areas does not, during normal rain events, reach saturation point due to high ET demand. The relationship between inflow and outflow presents an important point of analysis for the Sudd’s hydrology. Butcher in 1938, was among the first to derive a relationship between inflow at Mongalla and Sudd outflow. This relationship is important for assessing the impact of Jonglei Canal on the outflow.
Within the Nile basin there are 14 designated Ramsar wetland sites that support agriculture and or fisheries. All sites are now currently threatened. Sustainable management plans for the entire Sudd area and wetlands will require the involvement of a stable government, multiple stakeholders and policies that will address an all-embracing strategic plan. The strategic plan would harness the multiple efforts that span fisheries, oil industry demands, local population needs, and energy and infrastructure projects.
2.5.4 Case Study Summary: Blue Nile and Lake Tana The upper Blue Nile basin is the largest section of the Nile basin in terms of volume of discharge and second largest in terms of area in Ethiopia and is the largest tributary of the Main Nile. It comprises 17 per cent of the area of Ethiopia, where it is known as the Abay, and has a mean annual discharge of 48.5 cubic kilometers (1912-1997; 1536 m3s-1) (Hughes and Hughes 1992). The upper Blue Nile basin is highly sensitive to both precipitation and evaporation changes. This part of the sub-basin is characterized by a highly seasonal rainfall pattern with most of the rainfall falling in four months (June to September) with a peak in July or August. The mean annual total rainfall for the 1961–1990 period amounts to 1224 mm, of which more than 70% fall within those four months. PET is higher during the dry season (December to April) than in the wet season due to increased cloudiness and humidity associated with rainfall. Soil erosion is a major threat in the Blue Nile basin. A report prepared by ENTRO (Watershed project, 2006), estimates the total soil eroded within the Abay Basin alone is nearly 302.8 million tons per annum and erosion from cultivated land is estimated to be 101.8 million tons per annum (33%). Thus about 66 percent of soil being eroded is from non-cultivated land, i.e. mainly from communal grazing and settlement areas. About 45% of this reaches the stream system annually.

Objectives CPWF Project Report
Page | 44
The magnitude of resource degradation and the inability of varied fragmented approaches used to counter it remain two key challenges one reinforcing the other. This state of failure called for new approaches that ensure sustainable land management. As a way out, an integrated watershed management (IWSM) approach was introduced and has been practiced widely. Alemayehu et al (2008) reports that the watershed management approach started about a decade after the fragmented soil and water conservation program from the 1970s. The study further shows that IWSM decreased soil erosion, increased soil moisture, reduced sedimentation and run off, set the scene for a number of positive knock-on effects such as stabilization of gullies and river banks, rehabilitation of degraded lands. IWSM also resulted in increased recharge in the subsurface water (Woldeamlak, 2003).
Degradation of natural resources is a major problem along with the concomitant and co-evolving severe famine, low agricultural productivity, wide spread poverty and recurrent drought in the country. More specifically, resource degradation is a critical environmental problem in highland Ethiopia (Woldeamlak, 2003). This study reconfirms the importance of IWSM as a key to improve the land cover of watersheds, as a contribution to poverty alleviation and sustainable livelihood.

Objectives CPWF Project Report
Page | 45
3 LAND AND WATER PRODUCTIVITY IN NILE BASIN
PRODUCTION SYSTEMS
This section contains new information describing crop, livestock and fishery production systems. Land and water productivity are measured and described within these systems giving valuable insight into what likely interventions could be introduced and which areas need more attention in the future. Results are presented as a series of maps to provide a basin view of production systems. Irrigated agriculture is dominated by large scale developments in Egypt and Sudan, while only relatively small areas of irrigation have so far been developed under small scale schemes in the Upper Nile countries. Livestock production in the basin varies from subsistence crop-livestock production (mixed) to commercial production (FAO, 2000). 3.1 Basin production systems
For our purposes production systems within the Nile basin are grouped into irrigated agriculture, rainfed agriculture, livestock, fisheries, aquaculture and multiple use systems. Mixed rain fed agriculture systems (crops plus livestock) combined with agropastoral systems are the largest agricultural practices in the Nile basin. 3.2 Production system maps for the Nile basin In order for investments in agriculture to have a sustainable impact on food security and poverty, decisions have to be made with respect to the small-holder and the natural environment. Non-sustainable use of the natural capital reduces the long term agricultural productivity. Land degradation, erosion, unsustainable water use and equitable sharing of resources are all important issues within the Nile Basin. The links between agricultural growth and environmental outcomes depend very much on the type of farming system and a country’s economic context. Notwithstanding the significant heterogeneity of agricultural production systems, a farming system can be defined as a group of farms with a similar structure, such that individual farms are likely to share relatively similar production functions. A farm is usually the unit making decisions on the allocation of resources. The advantage of classifying farming systems is that, as a group of farms they are assumed to be operating in a similar environment. This provides a useful scheme for the description and analysis of crop and livestock development opportunities and constraints (Otte and Chilonda, 2002). It therefore forms a useful framework for the spatial targeting of development interventions. A farming system classification is not the only dataset required for evidence-based, well targeted and sustainable agricultural development. Agricultural performance both derives from conditions deeper within socio-economic and bio-physical realities. Factors that distinguish the various trajectories of agricultural development exhibit significant spatial variability, such as differences in farming systems and productive capacity, but also population densities and growth, evolving food demands, infrastructure and market access, as well as the capacity of countries to import food or to invest in agriculture and environmental improvement. Agricultural development strategies must recognize such heterogeneity when devising interventions and investments. For any targeting exercise, it is therefore important to take into account other datasets and add additional characteristics to the productions system

Objectives CPWF Project Report
Page | 46
classification. Random, clustered, or stratified sampling techniques can be used to come up with sampling points or survey areas. Case study sites can be selected within or across farming systems (Notenbaert, 2009). System-specific baseline information can be collected, trends monitored, models parameterized for the different farming systems of interest and impacts assessed, both ex-ante and ex-post. Areas exhibiting different combinations of these characteristics are often associated with different management practices and livelihood strategies, and thus overall agricultural performance (Omamo et al., 2006). By matching conditions favoring the successful implementation of a development strategy with a spatially referenced database, it is possible to delineate geographical areas where this specific strategy is likely to have a positive impact (Notenbaert, 2009). Figure 3-1. Crop classifications
Main Crops Most commons crops
3.3 Crop productivity map of the farming systems, current and potential
Poolad Karimi
Increasing population and growing competition for water between sectors indicate how crucial it is to use water more productively. To do this it is necessary to understand the current level of water productivity. Water productivity was estimated for the Nile basin, using secondary agricultural statistics together with remotely sensed satellite images. A water productivity indicator was calculated based on crops Standardized Gross Value Production (SGVP) and actual depleted water from cropped areas. Using SGVP as nominator helps to compare water productivity in different areas of a transboundary basin such as the Nile. All methods are detailed in Annex C.

Objectives CPWF Project Report
Page | 47
Figure 3-2. Standardized gross value of land productivity (SGVP) in the Nile Basin and water productivity based on SGVP/ETa in the Nile Basin
3.4 Land productivity
Results indicate that there is an enormous variation in water productivity across the basin (Figure 3-2). Egypt, with predominantly irrigated agriculture, has the highest values while rainfed regions in Sudan have the lowest. This variation is mainly due to variations in crop yields and the production of high value irrigated crops. Wheat yields range from less than 0.2 tons per hectare in Sudan’s rainfed areas to 6.5 in Egypt’s irrigated lands (Figure 3-3). The same trend applies to maize yields which rise to about 8 tons per hectare in Egypt. In terms of the economic value of land productivity, SGVP per hectare in the basin (Figure 3-2) varies from 20 $/ha in some Sudanese states to 1833 $/ha in Egypt. In general Sudan has the lowest land productivity except where irrigated farming is practiced, such as Gezira. This, actually, is of no surprise due to low annual rainfall in Sudan, which directly affects yield level in the rainfed systems. In addition, in Egypt farmers produce higher value crops like wheat and maize therefore their revenue per unit of land is higher in comparison to rainfed systems.

Objectives CPWF Project Report
Page | 48
Figure 3-3. Maize and wheat yields in the Nile Basin
(2005 EST.)
3.5 Water productivity
Economic water productivity in term of US$ per ha was calculated using SGVP values and annual water depletion in the cropped areas. The later was estimated through remote sensing imagery in form of actual evapotranspiration (ETa) and actual transpiration (Ta). Similar to land productivity, water productivity values in the basin show a large variation ranging from 0.01 $/m3 in Sudan to 0.2 $/m3 in Egypt. For maze and wheat the Ethiopian part of the Nile the water productivity of crops two times higher than in Sudan but in general, it has the second lowest values in the Basin because of water and soil constraints. Within this part of the Nile the water productivity in terms of SGVP/ETa ranges from 0.015 $/m3 in the south west to 0.11 $/m3 in north east, which shows an increasing trend towards the east. The main driving factor in water productivity within the basin is crop yield, which varies in different countries and regions and across irrigated and rainfed systems (Figure 3-4). Higher water productivity in Egypt is mainly due to higher yields and the higher income from land units. Similarly, low water productivity in Sudan is due to low yields in rainfed agriculture. This indicates the importance of the role of irrigation in increasing water productivity for the Nile Basin, where in almost more than two thirds of areas rainfall is not sufficient to meet crops water demand. Note that using actual transpiration (Ta) as denominator instead of ETa in the assessment did not change the magnitude of the variation in water productivity across the basin. This verifies that the differences observed are more related to yield and economic land productivity than to non-beneficial evaporation.

Objectives CPWF Project Report
Page | 49
Figure 3-4. Water productivity based on SGVP/Ta in the Nile basin
3.6 Livestock Water Use and Productivity in the Nile Basin
Paulo van Breugel In regions, like the Nile basin, with large agro-pastoral and pastoral areas it is essential to consider livestock in any work on water use as otherwise competing claims of the different agricultural and non-agricultural sectors on water cannot be fully understood. Perhaps surprisingly, not much information on livestock water use is available for the Nile basin. Most estimates of livestock water use are either available at a local scale or based on regional or even global assumptions for feed intake and water requirements. It is livestock densities on the one hand and water and feed availability on the other hand that largely determine the ratio of livestock water use vs. total water use (Figures C.2 and C.3 Annex). Thus, to make advances in the work on livestock water productivity (LWP defined in Annex), a more spatially explicit understanding of feed and water demand across the Nile basin is imperative. Based on the assessment framework (Figure C.4 Annex), there are four basic livestock keeping strategies that can help improve LWP (Peden et al. 2007). These are optimal feed sourcing, enhancing animal productivity, conserving water resources, and providing drinking water to livestock, especially cattle. These four strategies along with LWP assessment framework underpin the research undertaken basin-wide plus in the country studies in Uganda, Sudan and Ethiopia.

Objectives CPWF Project Report
Page | 50
Figure C.5 (Annex) shows the annual water use for feed as a percent of current actual annual evapotranspiration AET under normal rainfall years. Displayed in this manner, it is clear that the Central Belt of Sudan and the Northern part of the Ethiopian highlands constitute a giant hotspot whereby available rainfall will most likely impose severe constraints on feed production for animals in the Nile Basin. However there are areas where water use is lower; these areas are opportunities for developing methods for sustainable use of water resources. In 90% of the areas suitable for ruminants in the Nile basin, the amount of water required to produce sufficient livestock feed lies between 0% and 24% (median = 5%) of the annual AET (Figure C.5 -5a Annex). If we include the water used to maintain the non-consumable portion of the vegetation and water that went into the production of crop residues the total livestock water requirements increase substantially (C.5-5b Annex). Figure C.5-5c (Annex) gives the result if we assume a maximum permissible off-take. Details can be found in Peden et al. (2007, 2008, and 2009). In much of the basin water demand outstrips water availability for at least a few months of the year. This does not necessarily mean a shortage; in areas where there is a sufficient annual surplus, dried biomass carried over from previous months might be able to supply sufficient food to bridge those months. Different farm management systems have different strategies to utilize these resources. The results suggest that reported livestock densities cannot be maintained (at least not year-round) in some areas in the basin, thus pointing at the importance of adaptation strategies to cope with temporal shortages, such as seasonal livestock migration or feed import. It also underlines that strategies to improve LWP need to consider the role of livestock in the resilience and sustainability of the production system, rather than in production only. Figure 3-5. Livestock water productivity values of milk, meat and animal.
Livestock water productivity expressed as (a) ratio of milk production to depleted water, (b) ratio of meat production to depleted water, and (c) the ratio of summed monetary value of produced meat and milk and the water depleted to produce the required livestock feed. The distribution of LWP values across the basin is skewed, which is why a logarithmic scale for the legends is used. Estimating LWP requires estimates of the total value of these goods and services.

Objectives CPWF Project Report
Page | 51
We normally use monetary units for benefits and express LWP in units such as US$/km3 of water (Figure 3.5). Overall LWPmilk is low to very low in all systems, which is because of low milk production per lactating animals and a low portion of lactating animals in the different production systems. As a result a large proportion of the feed energy is used for maintenance which in turn leads to the observed high water requirements per litre of milk. Similarly, meat production per animal is very low in the Nile basin, resulting in the low LWPmeat values. Assessing LWP is challenging and leads to debatable results. However the LWP concept revealed that even though LWP in the Nile basin is much higher than reported in previous literature for developed countries, LWP varies greatly across the diverse, production systems, climates, nations, and cultures of the region. Overall livestock water productivity is very low, but highly variable across the basin, linked amongst others to low milk and meat production and (in some areas) high feed water requirements. Four major strategies emerged through which increases in livestock water productivity (LWP) and consequent human development environmental development goals can be achieved and that appear to be applicable in a wide range of production systems and at various geographic scales:
• Select feed sources that have high plant water productivity; e.g. use of crop residues in areas where crop production is the most appropriate livelihood strategy.
• Adopt livestock production technologies and management practices that increase feed conversion efficiency and reduce, mortality, morbidity, and energy stresses on animals, and promote marketing opportunities for livestock and livestock products.
• Conserve water resources through better vegetation and soil management that encourages infiltration and transpiration and discourages excessive run-off and evaporation.
• Strategic placement of watering sites to spatially balance use of feed and water resources across Nile landscapes.
Vegetative rehabilitation of the six livestock production systems is one main key. Billions of cubic meters of water are potentially available for increased agricultural production and ecosystem services by converting excessive evaporation (E) to transpiration (T) and increasing water productivity.
Increasing water productivity requires better access to livelihood assets, improved crop and livestock husbandry and health, access to markets; value added production, and land and water conservation. Capacity building, institutional development, multi-stakeholder participation is essential.
3.7 Fisheries production systems and water productivity in the basin
Harvested fisheries are an important contributor to food security and help generate income and employment in Nile basin countries. Nile basin fisheries are mainly fresh water from lakes, rivers and marsh sources and human derived aquaculture. Fresh water fisheries have a large potential to enhance income opportunities for many thousands of people and contribute towards food and nutritional security of millions in Southern Sudan, Uganda, Kenya and Tanzania. Both Egypt and Northern Sudan have well developed aquaculture and marine fisheries. Lake Victoria, shared among Tanzania (51%), Uganda (43%) and Kenya (6%), supports the biggest freshwater fishery of the world, producing up to one million tons of fish a year. The fishery generates about US $ 600 million a year in 2006 (LVFO, 2006). Lake conditions and unsustainable fishing practices have

Objectives CPWF Project Report
Page | 52
affected harvest of fresh fish which has decreased by 40%. New nets and hooks have helped but still many remove small fish and the stocks are depleted. 3.8 Aquaculture production in Nile Basin countries
Aquaculture is the farming of fish, mollusks, crustaceans and aquatic plants in fresh water, brackish water or marine environment. Farming stocking, feeding, and protection from predators/diseases; it also implies stock ownership by private, group or state. Aquaculture harvests are for consumption or other purposes/processes. Our interest in aquaculture in the Nile basin is primarily for food security and improved livelihoods from direct consumption or marketing. In 2007 aquaculture production in Nile basin countries reached 700,434 tons which is just over 1 billion US$ (FAO) (Table 3.1). Egypt is the main producer of farmed fish with Uganda a distant second of total basin aquaculture production. Rwanda, Kenya, Sudan are developing fisheries with the help of foreign aid to boost production which together with other basin countries represents 2% of the farmed fish in the basin (Table 3.1). Table 3-1. Nile basin countries aquaculture production quantity and value in 2007
Quantity Value Country ton % of total (USD 000) % of total
Burundi 200 0.03% 600 0.04%
Congo, Dem. Rep. of the 2970 0.42% 7435 0.56%
Egypt 635516 90.73% 1192614 89.41%
Kenya 4240 0.61% 6311 0.47%
Rwanda 4038 0.58% 7327 0.55%
Sudan 1950 0.28% 3840 0.29%
Tanzania, United Rep. of 410 0.06% 102 0.01%
Uganda 51110 7.30% 115662 8.67%
Total 700434 1333891
Source : (www.fao.org/figis/servlet/)
Uganda’s aquaculture export market, regional use and employment have risen dramatically over the past 10 years up to the first quarter of 2008. The Government of Uganda is promoting aquaculture to boost livelihoods and food security of farmers with plans to either capture flood waters or use ground water to expand aquaculture production in the northern and eastern areas of the country (www.thefishsite.com). Egypt is the major producer of farmed fish within the basin countries. Aquaculture expansion has contributed to increasing total fisheries production in Egypt. The relative importance of Egyptian aquaculture to total fisheries production has increased from 16% to 56% of total fisheries production between years 1997 and 2007. Aquaculture activities in Egypt are more concentrated in sub-regions of the Nile delta, where the water resources are available. Most of the aquaculture production is derived from farmers using earthen ponds production systems. Egypt has given support for the development of aquaculture to promote farmers livelihoods and provide a nutritional benefit to poor farm families. The programs instituted have been provided at minimal cost and often free of charge. Uganda has also started many fish programs with foreign aid and government support. Egypt’s advanced technical knowledge in aquaculture could be used to help train and support development of aquaculture in other basin countries.

Objectives CPWF Project Report
Page | 53
3.9 Case Studies at selected sites - rainfed, irrigated, livestock, fisheries, aquaculture, and Sudd productions systems 3.9.1 Rainfed Farming Systems The Ethiopian Highlands (Teklu Erkossa and Seleshi Bekele Awulachew) Summary The farming systems of the upper Blue Nile region are categorized as mixed farming in the highland areas and pastoral/agro-pastoralism in the low land areas (Figure C.6 Annex). Mixed farming of cereal based crops, enset root crops complex and coffee crops compose one system. The major constraints for crop production are soil erosion, shortage and unreliability of rainfall, shortage of arable land, weeds, disease and pests, which damage crops in the field and after harvest, low level of agricultural inputs (fertilizers, seed, organic matter) utilization and shortage of oxen for cultivation. The magnitude of resource degradation in Ethiopia and the inability of the fragmented approaches to counter it are two key challenges reinforcing each other. The highland mixed farming systems are characterized by varying degree of integration of the crop and livestock components. Crop residues often provide livestock feed, while oxen provide draught power, and cattle can provide manure for soil fertility improvement. With increasing population pressure, there is increasing competition for land between crops and grazing, which often goes in favor of the crops. As grazing land is converted to crop land, the importance of crop residues as livestock feed also increases. There is a need for sustainable land management. Resource degradation is the most critical environmental problem in highland Ethiopia (Woldeamlak, 2003). Potential for development and improvement of agriculture is the availability of vast areas of land suitable for mechanized farming (BCEOM, 1998; NEDECO, 1998). There are two major production potentials available for this farming system one is the long growing period which allows production of two crops per year if proper water conservation measures are used; and second is the selection of early maturing crop varieties used with adequate fertilization. This area receives reliable rainfall during the cropping season except for a few areas in the northern and north eastern part. Rainfed agriculture has huge potential to improve agriculture productivity in conjunction with strengthening the extension service, and supply of adequate agricultural inputs such as seed of improved varieties and fertilizers coupled with establishing functioning market outlets for agricultural products. Besides, a substantial part of the irrigation potential of the basin falls within this farming system. Consequently, developing small, medium and large-scale irrigation schemes with suitable crop and water management systems is believed to lead to significantly enhanced productivity of the system and improved livelihood of the communities.
3.9.2 Irrigated Agriculture The Gezira Scheme, Sudan Irrigated agriculture in Gezira contributes to 3 percent of the Sudanese national GDP, produces about two-thirds of Sudan’s cotton exports and produces considerable volumes of food crops and livestock for export and domestic consumption, thereby generating and saving significant foreign exchange. It has also contributed to national food security and towards generating a livelihood for the 2.7 million people who now live in the command area of the scheme.

Objectives CPWF Project Report
Page | 54
Yields and cropping intensities are disappointing, irrigation efficiencies are low, operation and maintenance is organized in a highly centralized way, as is cotton production and marketing. Cotton, a mandatory crop for farmers, has shown a total annual loss in production and cultivated areas. This is related to the government adopting a liberalization policy in the agriculture sector, and because cotton is a mandatory crop financed and marketed by the government, there is little incentive for farmers to improve production. The decreasing trend shows that farmers tend to concentrate on their own crops like sorghum and groundnut, which are financed and marketed by the farmer themselves. Sudan's irrigated agriculture faces water shortages with the current methods of water use and growing demand for food and population. Control of land, water and price to ensure that cotton is grown has a negative impact on overall farm income, and water conservation. Water shortages could develop if other schemes claim more water, irrigated area increases, and/or high water requiring crops are planted (Guvele and Featherstone, 2001).
Interventions that may improve productivity include rehabilitation and maintenance of irrigation networks, hydraulic structures and regulators to improve the performance level of irrigation systems leading to increase in production and crop productivity. Agricultural policies have important implications for irrigation performance. The decrease in crop productivity is not due to a lack of irrigation but more a factor of management and inefficient use of irrigation water related to policies. Improvements in the distribution of resources, the irrigation scheme and overall management could create the expected potential yields in most of the crops grown. The institutional aspects will be described in the Institutions section.
3.9.3 Irrigated water productivity Egypt Crop Water Productivity towards Future Sustainable Agriculture in Egypt by Hussein El Atfy, Alaa E. Abdin and Shaban Salem
Crop water productivity measured in Egypt compared old traditional irrigated land and new land with modern irrigation methods, crop seasons, economic and policy incentives. Data was collected using a survey questionnaire regarding the crop income in both new and old lands. This questionnaire was mainly concerned with the cost of items and returns of the main crops. A secondary data set was obtained from various research institutes.
The current study focused on the dominant rotations for winter and summer crops. To evaluate the net return of water unit, the study divided the estimated total net return of crop rotations by their estimated water requirements (el Atfy et al., in progress). The variation in the water productivity is low for maize and sugarcane while it is higher for onion crop (5.88 against 4.1 Kg/m3) and consequently the net return of water is 0.41 versus 0.29 US$/m3 for the same comparison. According to the results of crop rotations it can be concluded that wheat + maize rotation is the most profitable in both old and new lands. Wheat + rice rotation is the second most profitable, cultivated only on old land. The main reason for high wheat rotation is mainly due to the high profits for wheat during the last year. The procured price of wheat sharply increased from 218 to 454 US$/ton (Tables C-1, C-2 Annex). In water scarce situations, crop water productivity and its net return play a vital role in drawing future sustainable agricultural and water policies, especially for Egypt to maximize national water resources in different agricultural activities and make efficient utilization of the water resources. It is important to activate the

Objectives CPWF Project Report
Page | 55
role of agricultural extension as well as water users' associations to provide farmers with the necessary information about the most financially rewarding crop rotations and individual crops, and coordinate with the farmers to cultivate the more profitable crops for different seasons and areas. In the future it is likely that maize prices will increase within the Bio-fuel initiative with an increase in the international prices for maize. 3.9.4 Sudan’s Central Belt – CPWF PN37 Working paper on Livestock production; Contribution by Hamid Faki et al. Sudan’s central belt spans a wide area across the central part of Sudan, extending from the west bordering Chad, Libya and the Central African Republic to the east bordering Ethiopia and Eritrea. It encompasses 13 States, the three States of Greater Darfur (North Darfur, West Darfur and South Darfur), the two States of Greater Kordofan (North Kordofan and South Kordofan), White Nile, Sennar, Blue Nile, Gezira, Khartoum, Gedarif, Kassala and the Red Sea States (Figure C-7, Annex). The belt covers 75% of the country and accommodates some 80% of the population as of 2007. It also hosts about 73% of Sudan’s total livestock wealth (Faki et al, 2009). In addition to the critical situation of drinking water, feed availability is jeopardized by low and variable rainfall in pastoral areas, which provide about 74% of animal intake. In Sudan, availability of and access of livestock to drinking water are the overriding determinants for animal production. Livestock tend to concentrate near rivers and water points especially in the dry season leaving large areas of the Central Belt relatively unpopulated. Four states, namely North Darfur, Red Sea, Gedarif and North Kordofan reveal positive average daily balances while feed deficits are evident of all other states. However, the positive balance in the former two states is largely a result of low livestock population. Within the belt, animal demand for drinking water exceeds availability in all areas except for Khartoum and Red Sea State. During peak periods, unsatisfied demand in the belt exceeds 1 million m3/day, which is more than the amount available for drinking water and feed availability (Table C.3). A key feature of the Central Belt is very low livestock water productivity (LWP). One of the major factors causing this is the spatial imbalance of feed and drinking water resources. In brief, LWP is low where animals have access to drinking water because competition among them for sparse feed results in inadequate feed intakes and consequent low rates of production. LWP is also low where animals are far from drinking water sources because they cannot access abundant feed resources that have already utilized water whether this feed is consumed or not. Animal movement within the country, which is a traditional practice for a long time, forms the most important strategy to alleviate feed and water shortages. This is further supported by utilization of crop residues that provide about 21% of the feed needs. Livestock rearing is a major source of livelihood, almost equal in importance to that of crops. Future research must include compilation of estimated WP of important forages and animal feeds using standardized definitions and methodology that distinguishes E and T. Since farmers produce crops to feed people with or without livestock present, residues and by-products generated through crop production can serve as feed for livestock with little or no additional water cost. 3.9.5 Fisheries Lake Victoria and Kyoga Estimation of actual and potential production of Lake Kyoga and Lake Victoria and impact of land degradation and hydropower on fish production

Objectives CPWF Project Report
Page | 56
Initially, fishermen experienced very good catches of Nile perch, but the species is today over fished and the population has lessened significantly, shown in Table C.4 (Annex). This over fishing has not been a disaster for the endemic populations because several endemic species that were on the brink of extinction have increased their numbers. The haplochromines, and the mixture of other fish had virtually vanished from the commercial catch. The dynamics of fish populations resulting from anthropogenic modifications of the lake ecosystems (due mostly to the introduction of exotic species and the increased nutrient levels) have not yet reached a new equilibrium. One example from Uganda says the fishing industry employs 25,000 people and fish accounts for around 60 per cent of animal protein consumption. On the other hand, both illegal fishing and the invasion of Uganda's lakes by water hyacinth are threatening fish stocks in Uganda's lakes, and especially in Lake Victoria. Fishermen are using nets which trap mature as well as young fish in large areas of Lake Victoria. Pollution poses a problem for fishery productivity in the Nile Basin. Some areas of the rivers feeding the lake and the shoreline are particularly polluted by municipal and industrial discharges. The lake basin is used as a source of food, energy, drinking and irrigation water, shelter, transport, and as a repository for human, agricultural and industrial waste. With the populations of the riparian communities growing at rates among the highest in the world, the multiple activities in the lake basin have increasingly come into conflict. The lake ecosystem has undergone substantial, and to some observers alarming changes, which have accelerated over the last three decades. Recent pollution studies show that eutrophication has increased from human activities mentioned above (Scheren et al, 2000). Policies for sustainable development in the region, including restoration and preservation of the lake's ecosystem, should therefore be directed towards improved land-use practices and a control over land clearing and forest burning. Diminishing water levels and pollution have acute consequences for several economic sectors which depend on the basin lakes. It greatly affects the fishery by changing water levels. Water level variations affect shallow waters and coastal areas which are of particular importance for numerous fish species, at least in certain stages of their lives. Pollution poses a problem for fishery productivity in the Nile Basin. Some areas of the rivers feeding the lake and the shoreline are particularly polluted by municipal and industrial discharges. Cooperation between all concerned authorities is necessary to search for coherent solutions to ensure the sustainability of the fisheries.

Objectives CPWF Project Report
Page | 57
3.9.6 Aquaculture Nile Delta Water budgeting for Aquaculture Production World Fish Studies of water productivity conducted in the Delta during the CP Nile BFP study estimate that water use, as determined from measurements of seepage and evaporative losses from ponds, ranged from 1.12 to 3.61 m3 per kg fish production (Figure C -10 Annex). Pond water losses throughout the production season were estimated at 54.11 m3 water ha-1 day-1. If we apply this figure to estimates of fish pond area in the Delta (151,000 ha)2 we derive an annual water use figure of 2.98 billion m3 by the aquaculture sector. Water use efficiency varies according to farm management system and production level. The result of water budget estimation showed that consumptive water use per kg of fish was 3.6 and 1.13 m3 for site 1 and 2 respectively, and revenue of fish produced per each cubic meter water was 0.31 and 1.05 $ for site 1 and 2 respectively. Water productivity estimates may also be expressed in terms of water use per US$ generated (US$ 0.35 m-3 water use)3 or per kg animal protein produced (15.7 m3 kg-1 animal protein)4.The impact of water use by aquaculture on poverty, however, is difficult to estimate, as it necessitates a consideration of all elements of poverty, including resources such as natural, financial, material and social (health, information, power and social status). We estimate however, that in addition to the large amounts of affordable fish produced for domestic consumption (approximately 8 kg person-1 y-1), some 40,000 direct jobs, plus a further 80,000 jobs throughout the value chain, are created. These figures and values come with a number of health warnings. First, aquaculture currently uses only either groundwater or, more usually, agricultural drainage water, fish ponds often being located at the end of irrigated agriculture production systems, a not entirely satisfactory arrangement from a food safety point of view. There is thus limited competition with other sectors. Second, in addition to evaporative and seepage losses, aquaculture is a net source of dissolved nutrients, which if released in large quantities may impact on the provision of ecological services downstream. However, present studies indicate that ponds act both as a sink for some wastes and a minor source for others (PO4-P = 0.04 mg l-1). While the figures are negligible at present, intensification of production methods would likely increase these values in the future.
Aquaculture development in Egypt appears to have achieved its stated policy objectives of meeting the growing demand for fisheries products from domestic sources. Per capita fish consumption has increased dramatically without increasing reliance on imports or putting further stress on already highly exploited capture fisheries, and lower prices benefit consumers. There can also be no doubt that the aquaculture boom has generated employment in fish farming areas.
3.9.7 Sudd Case Studies Land, Livestock & Fish production systems and productivity
The Sudd wetland is an immense area with a huge potential for research in the disciplines of livestock husbandry and production, ecology, hydrology, economics, sociology, medicine, wildlife, agriculture and forestry. This is attributed to security
2 source: GAFRD Yearbook 2008. 3 assumes an average value of LE7 per kg fish and a US$:LE exchange rate of US$1 = LE5.5 4 assumes 23% protein content on wet weight basis

Objectives CPWF Project Report
Page | 58
instability in the area. Due to these difficulties data collection and information for this report have been obtained through literature reviews and personal experience. Crop based agriculture in the Sudd is primarily slash and burn especially in areas that receive high numbers of returnees from the war. This practice, carried out in pristine areas that still have significant biodiversity, will soon have negative impacts on the ecosystem. Agriculture is expected to remain important for Southern Sudan’s economy, culture, and the livelihoods of its people. For the most part, agriculture in Southern Sudan is not mechanized, irrigation has not been restored and little has been done to upgrade or modernize farming practices. With no government or private sector extension service in Southern Sudan, it is difficult to change existing behaviors about shifting agriculture and to introduce improved practices. Inherent problems are low rainfall, erratic rainfall, lack of access to agricultural inputs. Rapidly increasing population pressure from the return of refugees will make water, food and arable land shortages more acute. The lack of transportation and markets limit the distribution of products and limit livelihood development. Southern Sudan has vast land and water resources but little capacity to use or develop them. Improvements in rainfed and development of large scale irrigated agriculture are possible using water from the swamps. This needs considerable research and funding for development of such systems. Oil deposits and exploration could seriously damage the wetlands. Awareness of the natural biodiversity of the area is important for the revitalization and expansion of agriculture needs. The area needs to stabilize before development can occur.
3.9.8 Sudd Livestock Productivity – Samuel Atanasio Mustafa Abin. The Sudd wetland is a source of water for livestock, people and wildlife. It is essential to regulate flooding, maintains biodiversity, grazing for livestock, fisheries, supplies people with basic necessities for life in the Sudd. The Sudd wetland has a high potential for livestock, which could markedly contribute to Sudan’s economy as a whole and to Southern Sudan in particular. Improvement of Sudd livestock productivity will greatly improve the livelihoods of Sudd residents. The Sudd wetland is characterized by differing vegetation in grazing areas. (Denny1991) The most important grazing areas in the Sudd are a) river flooded grassland or Toich, which is the most productive grassland type in terms of year round grazing for livestock and wildlife because of the high protein content of dead wild grasses; b) Rain flooded grasslands, seasonally inundated grassland or rainfed wetlands (Toich) found on seasonally waterlogged clay soil which is heavily used by livestock; c) floodplain scrub forest, which is distinct from the grass plains because it is found at higher elevations. These forests occur on well drained areas around the floodplains.
Livestock production is facing major challenges such as limited water access in large parts of the basin during dry season, poverty, and a rapidly growing population. Livestock is the most important source of income in rural areas; however, it is also a potential contributor to water scarcity during the dry season. Second to livestock are the fisheries, which are a traditionally important occupation of the Shilluk and Nuer groups. The number of livestock using the floodplains of the wetland during dry season was estimated to be 700,000 (Howell et al., 1985). There are no recent counts of livestock

Objectives CPWF Project Report
Page | 59
populations since that time. Many Internally Displaced People (IDP) are returning with their cattle, meaning that these numbers have most likely increased. In 2008, Ministry of Animal Resources and Fisheries of the Government of Southern Sudan (MARF-GOSS) delegated a technical team from both the State and GOSS to assess water catchments in Junglei state and they managed to assess only five counties. They estimated livestock populations in five counties shown in Table C.5 (Annex). Initial recommendations for improvements in the Sudd include: water storage with small ponds and larger reservoirs, access to and development of bore holes, promotion of productive range ecosystems with efficient livestock management, and establishment of organized livestock markets. Finally, agricultural and livestock training centers would help educate herders, develop ranching systems, help take a comprehensive livestock census within the context of Sudd area to help in planning and management, provide veterinary services along with human health care services and build an awareness campaign for peace building activities.
3.9.9. The Sudd Fisheries Charles Lodu The potential of fisheries development in southern Sudan is substantial and vital to the livelihoods of about two thirds of the population in the Sudd area where an estimated production potential of 75,000 to 140,000 metric tons per year is possible (Table C-6 Annex). The Ministry of Animal Resources and Fisheries (MARF) of the Government of South Sudan quoting from FAO works during the war period puts the potential catch at 200,000 to 250,000 metric tons per annum. Various estimates of the potential fish production have been made in the last two decades. However speculative the numbers are it is likely that fisheries in the Sudd are underdeveloped. Fisheries fall short of their potential due to poor management, and an inadequate policy and legal framework to regulate production and trade. The sector is further constrained by poor or nonexistent roads, a dilapidated energy sector and limited access to markets. Fisheries production is equally important. It’s estimated that Southern Sudan could sell up to 300,000 tons of fish per year without depleting the resource. Post harvest losses in fish are quite high due to lack of cold storage facilities. Fresh fish landed must be sold or transported immediately or be sun dried or smoked. Inadequate transport and infrastructure is a deterrent to increased fish production but the demand for fish (particularly fresh fish) is reported to be very high. A thorough field study is needed in the Sudd to collect fishery data, determine the status of the fisheries, the environment and assess management interventions. 3.10. Conclusions
Water productivity analysis was carried out for aquaculture, livestock, and crop systems. In all cases there was a marked contrast between areas showing very high values of water productivity, mostly in Egypt, and those showing extremely low values, with not much in between. The water access and availability section showed that there is not much water remaining for further irrigation development, and yet ample rainwater is provided in livestock and crop systems. The case studies brought this out clearly, and showed that solutions would need to be crafted site by site. For instance, Egypt has the capacity to outreach and train farmers in aquaculture throughout the basin. The implication is that there is large scope and opportunities to improve water productivity across systems, except those already exhibiting high values. Improving water productivity is the means to produce enough food in the Nile, increase incomes, but would require an integrated policy, human-capacity, and technology strategy.


Objectives CPWF Project Report
Page | 61
4 INSTITUTIONAL CONTEXTS IN THE NILE BASIN
4.1 What are institutions and why are they important?
Institutions are created to reduce uncertainty in human transactions and they evolve incrementally over time, as we will see in the Nile basin. Institutions are important because they set the rules of the game by which individuals act under a set of constraints to produce optimal outcomes. In other words, institutions are often thought to be efficient solutions to problems of organization in a competitive framework (Williamson, 1975 and 1985). Institutions encompass the policies, treaties, organizations and laws at different scales that all influence the use and productivity of Nile waters. A root cause of poor performance is institutions, and the key to solving problems of inequity, poverty and low productivity lie in institutions. 4.2 Historical treaties in the Nile
Agreements and treaties over the Nile basin may be divided into those that were primarily aimed at creating and justifying British claim (and later Egyptian claims) over the Nile and those that were later created to redress some of the inequities embedded in the previous agreements. The former treaties could be called treaties of allocation and the later cooperative treaties. The Nile treaties from 1890 to 1959 that led to division of entire Nile water between Egypt and Sudan to the exclusion of all other riparian countries belong to the first category of treaties aimed at securing complete control over Nile by Egypt and to some extent by Sudan. The Treaties starting from 1977 (Kagera Basin Agreement, Hydromet, NBI and currently CFA) aim at redressing some of the inequities inherent in the previous water allocation agreements as already stated earlier. These treaties, later in the 1990s, were also focused on benefit sharing – a concept popularized by the World Bank and later taken up by the NBI. Table D.1 (Annex D) lists the evolution of Treaties and Agreements in the Nile Basin since 1890 to present and is based on Westman, 2009. A cursory review of the treaties yields interesting results. Since all the treaties until 1959 were geared towards allocation of Nile water resources and more often than not, the purpose of water allocation was irrigation. For example, the 1929 and 1959 Treaties were meant to secure irrigation water for Gezira scheme in Sudan and Egypt respectively. After 1959, and consequent upon the independence of other Nile basin states, the focus of Nile agreements shifted away from water sharing per se to more cooperative frameworks and as a consequence, irrigation water demand took a backseat in Nile negotiations. This is understandable since irrigation is a consumptive use in which no harm principle to the downstream riparian is difficult to sustain. Therefore, as the focus shifted from water sharing to benefit sharing (as we shall see later in this synthesis), the focus on irrigation got diluted and that on hydropower and other non-consumptive uses increased. 4.3 The Nile Basin Initiative
In 1999, the Nile Basin Organization (NBI) was formed. The NBI is comprised of nine permanent members and one observer, Eritrea. The NBI is spearheaded by the Council of Ministers of Water Affairs of the Nile Basin states (Nile Council of Ministers or Nile-COM). ‘The NBI seeks to develop the river in a cooperative manner, share substantial socioeconomic benefits, and promote regional peace and security’ (NBI 2001).

Objectives CPWF Project Report
Page | 62
The Nile Basin Initiative has embarked on the Shared Vision Programme (SVP). The SVP’s mission is the creation of a “coordination mechanism and an enabling environment to realize the shared vision through action on the ground” (Council of Ministers of Water Affairs of the Nile Basin States 2001). In June 2001, an ICCON (International Cooperation Consortium on the Nile) meeting took place in Geneva with possible donors for NBI. At the forum, project proposal documents were presented to solicit funding for shared vision projects. The outcome of the meeting was the establishment of the Nile Basin Trust Fund (NBTF) to finance the SVP with support from the World Bank, Global Environment Facility (GEF), European Union (EU) Water Initiative, African Development Bank (ADB) and bilateral donors. The SVP projects and host countries are shown in Table 4.2 (Annex D).
So far the NBI has been instrumental in promoting information sharing, and initiating small projects but still struggles: 1) to be a permanent river organization and 2) to obtain signatories for the ratification for a new Nile Treaty as agreed by all members, and 3) implementation of new large Nile Water projects (Cascao, 2009). Drawing lessons from the Columbia, Aral and Ganges basins, as well as from the conditions of benefit sharing aspects, the following subsections will address: 1) whether the conditions are right or not for the Nile Basin and 2) suggestions for the Nile Basin to implement successful benefit sharing projects. 4.3.1 What worked in the Shared Vision Program?
Increased and improved dialogue between riparians and stakeholders is usually considered a major achievement of the NBI and an outcome of the SVPs (the CBSI program in particular). Ten years ago, communication among decision-makers and other stakeholders from the different riparians was rare and often engendered conflict. But thanks to the concerted efforts of NBI in organising annual meetings and discussion forums, national decision-makers have met frequently in different regions and other stakeholders have become increasingly influential in the decision-making process. Increased institutional and technical capacity may also be considered major achievements of the NBI. In institutional terms, prior to the establishment of the NBI, the transboundary water folder remained mainly, or often exclusively, in the hands of national authorities such as ministries of water resources or foreign affairs. Currently, with the establishment of the Nile-SEC, ENTRO and NELSAP-CU, the Basin benefits from the presence of a high-quality team of experts, selected on merit, responsible for the design and implementation of several transboundary programs. One of the SVP’s main goals was the creation of an enabling environment for the Nile riparians to manage and develop their shared water resources, i.e. to promote a shared vision. The four sectoral projects – NTEAP, WRPM, RPT and EWUA – were considered the mechanisms essential for the promotion of this approach in four key sectors (environment, water planning, power trade and agriculture). 4.3.2 What did not work well in the Shared Vision Program, but may be enhanced? The establishment of the NBI represented the gaining currency of a new and original concept circulating in the global water community: the benefit-sharing paradigm. The goal of the Benefit-Sharing paradigm is to shift mindsets away from controversial water-sharing agreements towards a more inclusive approach,

Objectives CPWF Project Report
Page | 63
based on a comprehensive understanding of cooperation and the idea that transboundary water cooperation has the potential to generate multiple benefits (Sadoff and Grey 2002, 2005; Phillips et al. 2006; Qaddumi 2008; Turton 2008). These benefits include environmental, economic (both direct and indirect) and political benefits and may be shared by each of the several riparians. The Nile Basin became a testing-ground for the concept, and a cross-cutting SVP dealing with the issue was established. Due to several operational problems, the program was initiated very late, meaning that its outcomes were not fully realised (two of three components were cancelled). Nevertheless, the SDBS has delivered, if later than expected, two main outputs: (1) the Scoping studies on Poverty-related issues and (2) the Benefit-Sharing Framework.
4.4 Evolution of the Cooperative Framework Agreement (CFA)
negotiations
Negotiations for the CFA began in 1999 and picked up momentum in the mid 2000s. After 2006, the media in the Nile region reinforced the idea that the negotiators were about to finalise the CFA draft (IPR 2006, 2007; The Ethiopian Herald, 2007; The New Times, 2007; Walta, 2008). Such hopes were frustrated by the events of the Nile-COM meetings of 2006 (in Addis Ababa and Bujumbura) and 2007 (in Kigali) (The New Vision 2006; Addis Fortune 2007). In the meantime, and due to lack of agreement between the different parties, a proposal emerged to rephrase Article 14b to include the ambiguous term “water security” in order to accommodate and harmonise the differing claims of the upstream and downstream riparians (see Cascão 2008a for details). Ambiguity has been a feature of other water legal negotiations, globally, and usually has helped to accommodate conflicting interests and resolve enduring deadlocks (Fischhendler 2008). This could have been the case in the Nile Basin, but instead ambiguity has contributed to create a situation of political deadlock, which remains (Cascão 2008b). The situation was at a standstill until 2008 when the Nile-COM, chaired that year by the Democratic Republic of Congo, considered two intermediary options aimed at solving the problem of Article 14b. In July 2009, the Nile-COM held a meeting in Alexandria, under pressure from the donor community and the public opinion, with a main issue in the agenda: the future of the Cooperative Framework Agreement (Al-Ahram Weekly 2009; Al-Masr Al-Youm 2009; Reuters 2009; The New Vision 2009a; The East African 2009b). Finally, the riparians formed the consensus that a final decision would be postponed for another six months (The New Vision 2009b; AFP 2009). The next Nile-COM meeting takes place in February 2010 in Sharm El-Sheikh. Two options seem available. Firstly, all nine riparians might agree on a consensual document and go ahead with an all-inclusive river basin organisation. Alternatively the upstream riparians might decide to aim for the adoption and ratification of the CFA without, for the moment, Egypt and Sudan, and form a river basin commission.
4.5 The future of the Nile cooperation
Analysis by Cascão (2009) and Westman (2009) demonstrates that the future of cooperation in the Nile Basin is not ‘black or white’: the choice is not between, on the one hand, fully-fledged cooperation and non-cooperation on the other. On the contrary, there exists a large and diverse grey-scale and the different emerging scenarios involve their own complexities. Some preliminary conclusions may be drawn:

Objectives CPWF Project Report
Page | 64
• The momentum for the establishment of the NBC has been created over the last 1-2 years, but it remains unclear as to whether or not the riparians (either all of them or a few) will seize the momentum;
• The acceleration of the multilateral cooperation process is dependent on the political and hydropolitical back calculations of the individual Nile riparian states;
• Multilateral basin-wide cooperation may be at risk if riparians opt for other forms of interaction instead (e.g. bilateral or unilateral water developments);
• Last but not least, there is a general optimism, shared amongst the NBI officers and the actors of the donor community, that multilateral cooperation will soon experience a breakthrough through the adoption of the CFA and the establishment of the NBC. However, this optimism is not always shared by the high-level representatives of national authorities. They, ultimately, are the main political decision-makers in the Nile Basin cooperation process.
4.5.1 The concept of benefit sharing The concept of benefit sharing suggests the sharing of benefits rather than distributing quantity or costs of water projects from transboundary rivers. There are several factors that precipitated the evolution to benefit sharing concept. These include, 1) the disadvantages associated in implementing treaties based on water allocation principles, 2) information about the type, quantity and influence of costs that were not being considered in the past, 3) increase in cooperation and information sharing among nations sharing rivers, and 4) the dependence on funding from benefactors outside a stakeholder nation’s influence.
4.5.2 Benefit sharing as evidenced through investment programs in the Nile basin In a recent presentation given by NBI representatives during World Water Week in Stockholm (NBI 2009), an interesting differentiation between the NBI investment projects was advanced. Four types of projects were identified:
• Type 1: Nationally identified and nationally implemented, that is projects are decided by the national governments and are implemented by them within the borders of their own countries (Consultative Projects); • Type 2: Regionally identified and prepared, but nationally implemented (Cooperative Projects); • Type 3: Regionally identified, regionally implemented (Cooperative Projects); • Type 4: Beyond the river, Towards Regional Integration.
What is clear is Strategic Action Plan (SAP) investment projects already under implementation in the Basin are mainly Type 1 (e.g. ENSAP and NELSAP Irrigation and Drainage projects) or Type 2 (e.g. ENSAP Ethiopia-Sudan Transmission Interconnection or Watershed Management; NELSAP Water Resources Development Program or Lake Victoria Environmental Management) projects. Type 1 and 2 projects are mainly the nationally based projects (particularly in terms of implementation) that have benefited from the NBI to get access to international funding. They are examples of a narrow type of cooperation, which often fails even to bestow bilateral or multilateral benefits. However, several of the SAP officers interviewed considered that these pilot or prototype projects, particularly those of type 2, are essential as the building blocks for more complex and integrated forms of transboundary cooperation.

Objectives CPWF Project Report
Page | 65
By contrast, there are still no examples of type 3 (e.g. ENSAP JMP; NELSAP Rusumo Falls and Multipurpose Project) or type 4 (e.g. ENSAP and NELSAP Regional Power Trade Projects) projects on the ground (although they have been already identified). Type 3 and 4 projects are, by their nature, transformational: they have the potential to be genuine regional projects which include joint studies and consultation and, in the future, joint implementation, management, ownership and benefits. This partly shows the difficulty in investments that are of transboundary and benefit sharing nature. 4.5.3 What impedes benefit sharing in the Nile?
Cascão (2009), through interviews with regional and national experts, participating institutions and international consultants involved in the project at different stages summarizes obstacles faced in operationalizing the benefit sharing concept. Until recently, the concept was considered by several of the Nile stakeholders as (purely) theoretical, overly complex, ambiguous, difficult to visualise, and lacking in real examples;
a) Given the absence of a benefit-sharing framework (which was only finalised in 2008), it was difficult for decision-makers to understand fully the range of benefits that cooperation had the potential to generate and that could be traded among the riparian countries;
b) In the absence of joint investment projects on the ground, it is difficult to quantify the costs and benefits to be shared;
c) It is also difficult to understand how benefit- and cost-sharing could be implemented at multilateral level (i.e. the principles and mechanisms necessary) although, at the bilateral level, the approach appeared more realistic;
d) Some upstream riparian countries have raised concerns that an excessive attention given to benefit-sharing approach could replace or sideline the important issue of water allocation, which is a situation considered by many as unacceptable;
e) It has never been clearly defined how the benefit- and water-sharing paradigms might co-exist and complement each other in the context of the Nile Basin;
f) Criticisms concerning the technical performance of the program have been made: many considered that there was not enough coordination between the SBDS program and the investment projects, the projects that together might generate the benefits to be shared.
4.6 Case studies
4.6.1 Lake Victoria and cooperation on fishing - successful regional cooperation WEMA Consultants The highlight of this case study was the successful cooperative regime forged for management of the Lake Victoria Fisheries. We contend that high economic value of the fishery sector, along with lowering of transaction costs through crafting relevant institutions was the key towards the success of Lake Victoria fishery management initiative. The policies, legal and institutional framework for management of Lake Victoria Basin are broadly guided by the Treaty that established the East African Community in 2000. The Treaty came into force in July 2000 and designated Lake Victoria basin as a regional economic growth zone to be exploited jointly so as to maximize Draft Final Report on Institutional Arrangement for Management of

Objectives CPWF Project Report
Page | 66
Lake Victoria Basin 11 economic and social benefits while ensuring effective environmental management and protection (EAC 2001). There are a number of ongoing programs and projects in Lake Victoria. These are: implementation of fisheries management plan, Nile Equatorial Lake Subsidiary Action Program, Regional Trade and Agricultural Productivity Project, Nile Transboundary Environmental Action Plan (NTEAP), Kagera Transboundary Agro-Ecosystem Management Programme and Project, Mt Elgon Regional Ecosystems Conservation Programme, Maritime Safety and Security, Lake Victoria Region Water and Sanitation Initiative, Lake Victoria Region City Development Strategy and The Lake Victoria Catchment Environmental Education Programme. Of interest is the fact that while there are a plethora of agreements and policies in place within the Lake Victoria basin for management of all natural resources, the agreement that seems to work best is on fisheries and transportation. It seems that initiatives on environmental issues such as pollution control are less successful – possibly due to low immediate returns and high transaction costs. The institutional arrangement in Lake Victoria (WEMA Consultants, 2009) highlights, that regional cooperation is possible and does obtain under condition of mutual economic benefits and low transaction costs of negotiating. Transaction costs of negotiation, in this case, were reduced through the creation of special institutional arrangements for regional cooperation, such as the East Asian Community and Lake Victoria Fisheries Organization. Similar organizations with a single focus that harmonizes the interests of the Nile Basin countries could therefore succeed in bringing about cooperative outcomes. Some of the recent work on benefit sharing in the Nile does indeed talk of such mutually beneficial institutional arrangements (Iyob et al. 2009). 4.6.2 The Gezira scheme and the impact of national policies Case study Gamal (2009) One Gezira scheme case study investigated impact of national level policies on the functioning of an irrigation scheme. Here our main argument is that farmers can and do respond to policy changes and that some of these policies have unintended effects. For this, we will use the case of Gezira scheme in Sudan and see the impact of a number of policy level changes on the cropping pattern and crop productivity of the farmers. The Gezira scheme has undergone four different policy and institutional arrangements during the last four decades. These were the Joint Account System (JAS) (1970-71 to 1980-81), Individual Account System (IAS) (1981-82 to 1990-91), and Economic Liberalization System (ELS) (1991-92 to 2005-06), the Water Users Associations (WUAs) (2006- 07 to 2008-09) era adopted as per the Gezira Act of 2005.
The four policy and institutional changes had an impact on cropping pattern and crop productivity. For one the area, productivity and average net returns on cotton have declined steadily through these years, while wheat has grown over the same time. The most important stimulus here was the abolition of the compulsory quota for growing cotton which was in vogue during the JAS period. As the institutional regime moved to more individualized ones, farmers opted to cultivate more and more food crops such as wheat and sorghum. The popularity of sorghum is also due the fact that it also acts as a feed crop and livestock has emerged as the next most important sources of livelihood after crop cultivation and in some cases income from livestock has exceeded that from crop cultivation. While it is still early to assess the impact of the Gezira Act 2005, Gamal (2009) based on this livelihood surveys, found that over all socio-economic condition of

Objectives CPWF Project Report
Page | 67
the farmers has deteriorated since they were asked to manage canal irrigation on their own. Further studies are needed to understand the full impact of the 2005 Gezira Act. 4.6.3. The GTZ intervention in watershed management and the influence of policies at micro level Watershed management in Ethiopia tells the story of the impact donor policies have on programs. GTZ with the help of a local partner implemented watershed management packages in two micro-water sheds. The study by Teketel (2009) looked into the institutional factors that led to successful implementation of watershed management in one site and its failure in the other. The aim was to explore institutional aspects of watershed management by taking two contrasting micro-watersheds, Kanat and Magera, in the Blue Nile Basin. Both these were, as already mentioned, funded by the GTZ. The results of the study show that there are clear differences between the two watershed interventions in: level of participation of the community in the program; evolution and strength of local institutions to manage the resource and define the appropriation of benefits; the level of commitment of the donor and government bodies. Accordingly, a synergy of active roles of the Kebele administration, high commitment and participation of the beneficiaries, strong commitment of donor (GTZ), good leadership and coordinating skill of the watershed management committee, and active role of government bodies in creating enabling environment were the most important factors for the promising achievement of the watershed intervention in Kanat. On the other hand, weakness of Kebele Administration, lack of follow-up by the concerned government bodies, lack of by-laws, and GTZ's failure to consult the whole community before intervention were the most important reasons behind the failure of the watershed intervention in Magera. It is to be noted that Magera watershed was the pre-curser of Kanat watershed program and the GTZ officials learnt the importance of ‘local buy-in’ from the failure of the Magera watershed initiative. In response, they made sure that local stakeholders were involved in the Kanat water shed program and that too right from the beginning. 4.6.4 An analysis of growth and sources of growth in the agricultural sector, 1975-2005 In this analysis we wanted to see how the Nile basin countries have fared in terms of their agricultural growth over the last 30 years and what were the sources of such growth? Overall agricultural growth may be further broken down into growth in cereal outputs and growth in livestock outputs. Table 4.2 in Annex D shows growth rates in cereal and livestock outputs as well as over agricultural GDP growth rates for all the 10 Nile basin countries for the period 1975-2005. Three countries, Burundi, DR Congo and Eritrea have witnessed overall shrinking of their agricultural sector during this period. Both Burundi and DR Congo derive more than 40% of their GDP from agriculture, thereby showing that contraction of the size of the agricultural economy would have hit their overall GDP as well. It was also noted that with a single exception (DR Congo), growth rates in livestock production is always higher than the growth rates in cereal production. This underscores the importance of the livestock sector in the region. The livestock sector is also more resilient to rainfall shocks than the crop production sector. Egypt outperforms all other Nile riparian’s in terms of its agricultural performance. Ethiopia’s growth rate in cereal production is next only to Egypt in the region, while Sudan, with a much more extensive irrigation system in the

Objectives CPWF Project Report
Page | 68
basin as compared to all other upstream riparian’s grew at a modest rate of 2.8% per year with its livestock sector growing faster than its cereal production. Growth in cereal production may be further compressed into growth emanating from area increases, or yield increases or an interaction effect of area and yield. Table D.4 (Annex) presents the decadal scenario of growth in cereal production in the region along with the sources of such growth (and or decline). 4.6.5 Rainfall shocks and agricultural production What are the drivers of growth in the agricultural sector? Other than Egypt, which is 100% irrigated much of Nile and the rest of SSA has very low rates of irrigation. On an average, only 2.8% of the arable land in Nile countries (except Egypt) and 3.8% of the arable land in rest of SSA countries are irrigated. This is much lower than South Asia where up to 30-40% of the land area is irrigated. Use of fertilizer is also very low as is the use of improved and high yielding varieties of seeds. Labor productivity in agriculture is also low. The usual factors of production that explain growth in agriculture, such as fertilizer, seeds, population density, agricultural machines etc., do not vary significantly across time and space in the Nile basin and SSA countries and hence do not explain variation in agricultural production in the region. Variations in rainfall, or rainfall shocks, as we call them, are the only factor that seems to affect agricultural growth and also perhaps partly explain the variation of agricultural growth across the countries over time (Figure D.1 Annex). It is acknowledged that rainfall shocks affect the agricultural sector in SSA and in the Nile basin. However, what this analysis shows is that the relationship between rainfall variability and agricultural outcomes differentiate its impacts by sub sectors within the agricultural economy. Our main findings are:
1. Rainfall shock is closely related to decline in agricultural outputs, but it is most pronounced in case of cereal crops, followed by other crops and the least in case of livestock.
2. Reduction in production as a result of rainfall shock happens through reduction in yields and not reduction in cropped area.
3. Rainfall shocks are closely related to reduction in agricultural growth rates and agricultural GDP, but it affects overall GDP to only a lesser extent.
The implication of this work underscores the importance of rainfed farming and agricultural water management in the Nile basin and highlights the ongoing dialogue of cooperation in the Nile and its lack of emphasis on agriculture and water management.
4.7 Conclusion and policy implications
From a historical review of treaties and agreements in the Nile we found that treaties prior to 1959 were aimed at sharing water. Irrigation was often the prime reason for water sharing. Post 1960s, the agreements were aimed at forging cooperation among the Nile riparian and irrigation, because of its water consumptive nature, became less of an important issue. However, the Nile countries are overwhelmingly rural and agriculture is and will remain an important sector in years to come. The ongoing negotiations and action on ground by the NBI has not given enough attention to agriculture in general and water management in particular. We posit that issues like irrigation are contentious and NBI, in order to reach a consensus, has avoided such contentious issues. But there is a need for better integration of agriculture within the NBI framework if it is to remain relevant for all the stakeholders.

Objectives CPWF Project Report
Page | 69
We took a cascading view of institutions by looking at institutions at the basin scale (NBI and CFA), regional scale (Lake Victoria organizations), national scale (national policies and Gezira) and local scale (donor policy and micro-watershed management). We found that regional cooperation over management of fishery in Lake Victoria was reasonably successful and we attributed this success to the centrality of income from fisheries for these Lake Victoria countries. In case of the Gezira, we found that every national level policy had a deep impact on agricultural outcomes in the scheme and that farmers readily react to changes in incentives. The most important change was the reduction in acreage and production of cotton and a move away to cereals crops such as wheat and sorghum. Our final institutional case study was aimed at understanding the conditions under which local level watershed management activities succeeds. It is found that donor policies and local leadership structures have a profound influence on the success of any intervention. We found that though most of the Nile countries have been posting positive growth rates since mid 1970s, yet yields remain low and they are subjected to vagaries of rainfall and this underscores the importance of proper agricultural water management. However, NBI has paid relatively little attention to agricultural issues and there is no proper coordination with ASARECA (The Association for Strengthening Agricultural Research in Eastern and Central Africa). Therefore, there is a need for better integration of agricultural water management within the overall Nile basin institutions.


Objectives CPWF Project Report
Page | 71
5 INTERVENTION ANALYSIS
The purpose of intervention analysis in the Nile BFP project is to identify types of intervention, analyze options and evaluate impacts with the goal to: 1. Improve agricultural productivity, reduce poverty and improve livelihoods
through agricultural water management 2. Enhance national and trans-national (regional) economic transformations that
can be achieved by increasing the positive role of water and reducing the negative impacts of water
The specific objectives are to: • characterize existing interventions in production systems through literature
reviews and inventory • performance analysis of existing interventions and impacts • undertake tradeoff analysis, ranking, scenario analysis, modeling to select and
evaluate high impact interventions and implementation strategy • develop problem tree & impact pathways (IP) through interventions as this is
addressed separately in section 6. Interventions focus on water related interventions. In order to identify the water interventions, we can follow various approaches of interventions and see categorizations based on a) Water availability, access and management based interventions b) Agricultural and non-agricultural water use interventions c) Production system, livelihood and hydro-economic modeling based water interventions d) Small and large scale interventions. The above categorizations have their own importance and relevance for the analysis of household, community, national and transnational or watershed, sub-basin to basin level water interventions. In this analysis we will use some of the identified categorization, while others such as a) and c) are used in previous sections. 5.1 The Nile Hydronomic Zones
Water management zones are instrumental in identifying and prioritizing the water management issues and opportunities in different parts of a river basin. This allows the information, inputs and intervention requirements for addressing the water management issues and harnessing the opportunities in each zone to be fully employed in the water development and monitoring strategies. Generally, classifying the river basin into water management zones facilitates development of management strategies and informed decision making during planning and operation. The concept of hydronomic zoning (water management zones) was first developed by Molden et al. (2001). They identified hydronomic zones as a means to define, characterize, and develop management strategies for areas with similar characteristics. They stated that hydronomic zones hold potential as a tool to help in better understanding of complex water interactions within river basins, to identify similar areas within basins, and to help in developing sets of water management strategies better tailored to different conditions within basins. Basically hydronomic zones are water based recommendation domains. They came up with hydronomic zone based on the fate of water applied to irrigation field. Later, Onyango et al. (2005) applied the hydronomic concept with that of terranomics (land management) to explore the linkages between water and land management in rainfed agriculture and irrigation areas in the Nyando basin, Kenya. Similarly, improved Koppen climate classification (Peel et al., 2007), GIS-based modeling framework that combines land evaluation methods with socio-economic and multi-criteria analysis to evaluate spatial and dynamic aspects of agriculture (Fischer et al., 2006), principal components and unsupervised

Objectives CPWF Project Report
Page | 72
classification methods (Fraisse et al. 2001), Schepers et al., (2004)) are developed to undertake analysis for classification of various zones linked to water resources. An initial analysis of hydronomic zones shows six main water based considerations (Figure 5-1a). The water source zones shown are areas that generate substantially to the Nile flow and comprise about 15% of the Nile area. In this zone considerations are needed to manage rainwater to improve productivity and enable secondary productivity with supplementary irrigation with due considerations of upstream-downstream implications. In wetlands and environmentally sensitive zones, special consideration needs to be given to fisheries, biodiversity, and to natural patterns of flooding and recession. Irrigated agricultural zones can be further divided to show areas where return flows are recovered, where water stagnates and leads to salinity problems, and a final use zone. Each will have its own water productivity enhancing strategy. Figure 5-1. Hydronomic Zones for Nile basin
a. Six main zones b. Eighteen zones
To provide more detailed analysis within each one of these water based zones, a principal component analysis of the biophysical factors is carried out to understand the most influential water management factors in the Nile basin. The assessment and analysis of relevant factors is used to develop a classification framework for hydronomic zoning of the Nile. The dominant principal components of the biophysical factors and the most relevant factors are used for objective classification of hydronomic zones. The biophysical factors relevant to water management could be broadly categorized into climatic, hydrologic, topographic, soil, vegetation and environmental factors. Based on these factors and combination of them Figures E.1 to E.6 (Annex) provide the related maps in relation to climatic, water sources and sink areas, topographic patterns, soil properties, vegetation profile and environmentally sensitive areas in the Nile

Objectives CPWF Project Report
Page | 73
Basin. It is therefore, useful to notice for example from Figure E.2 c (Annex) how these can be used to identify water source, and water sink/deficit zones, which can dictated the type of AWM interventions. Following the works of Molden et al. (2001), the Environmentally Sensitive zone was formed by merging the wetland and protected areas in Figure E.6. The eighteen hydronomic zones of the Nile basin is developed by superimposing the Environmentally Sensitive (EnSe) zone over the eighteen identified zones (Figure 5-1) the hydronomic zones of the Nile basin). The developed hydronomic zones of the Nile basin have nineteen distinct zones in which similar water management interventions could be applied. The hydronomic zoning includes different aspect of water management. For example, the water source areas of the basin can easily be identified as humid and wet-humid zones (HhLs, HhMs, HhDs, WhLs, WhMs and WhDs) where the humidity index is greater than 0.65. The classes of the developed hydronomic zones could be increased to 37 by including two classes of topographic attribute as third classification factor for applications at sub-basin or watershed levels. Table 5-1. The proportional areas of the hydronomic zones in the Nile Basin
SN Zone Name Zone Code
Zone Area, 106 km2
Percentage of Basin Area
1 Hyper Arid – Light Soil HaLs 537.45 17.22
2 Hyper Arid – Medium Soil HaMs 0.00 0.00
3 Hyper Arid – Dense Soil HaDs 179.45 5.75
4 Arid – Light Soil AaLs 196.29 6.29
5 Arid – Medium Soil AaMs 188.26 6.03
6 Arid – Dense Soil AaDs 78.24 2.51
7 Semi Arid – Light Soil SaLs 276.41 8.86
8 Semi Arid – Medium Soil SaMs 265.43 8.51
9 Semi Arid – Dense Soil SaDs 280.94 9.00
10 Dry Subhumid – Light Soil DsLs 189.30 6.07
11 Dry Subhumid – Medium Soil DsMs 85.21 2.73
12 Dry Subhumid – Dense Soil DsDs 23.52 0.75
13 Humid – Light Soil HhLs 296.99 9.52
14 Humid – Medium Soil HhMs 80.76 2.59
15 Humid – Dense Soil HhDs 4.11 0.13
16 Wet Humid – Light Soil WhLs 23.56 0.75
17 Wet Humid – Medium Soil WhMs 27.87 0.89
18 Wet Humid – Dense Soil WhDs 0.09 0.003
19 Environmentally Sensitive EnSe 351.49 11.26
20 Unclassified 35.24 1.13
Total 3120.59 100.00
The proportional areas of the nineteen water management zones are listed in Table 5.1. About 10 percent of the Nile basin falls within the environmentally

Objectives CPWF Project Report
Page | 74
sensitive zone. In this zone, water development interventions should not be permitted. Rather, conservation and protection of the natural ecosystem should be promoted. The humid and wet-humid zones are the water source zones of the Nile basin and account for less than 15 percent of the basin area. Since the identified zones have unique climate and soil properties, the water management interventions required to address issues in each zone should also be unique. Therefore, potential water development and management interventions at basin and regional scale could be mapped within these hydronomic zones. The pertinent water management interventions, although can be linked to the next two sections, such analysis is postponed for future research.
5.2 Small scale water interventions in the Nile Basin
5.2.1 The Water Management Interventions for Agriculture Small scale water interventions are AWM interventions which constitute the whole continuum of water management in agriculture as shown in Molden et al (2007), but also include water not only for crop but also animal, agro-forestry and a combination with multiple uses such as drinking water, environment, and industrial use. Rainfed agriculture (supported to some extent by Small-Scale Irrigation (SSI) and water harvesting systems) is the dominant form of agriculture in the upstream countries, whereas the downstream countries (Sudan and Egypt) are dominated by irrigated agriculture in Large Scale Irrigation (LSI) schemes. In the transition areas the system is dominated by pastoralist/agro-pastoralist. Rainfall management strategies are a) on farm water management b) maximizing the transpiration and reducing soil evaporation c) collecting excess runoff from farm fields and using it during dry spells and as supplementary irrigation d) drainage of water logged farm areas e) enhancing livestock productivity and water storage are crucial to transform rainfed agriculture for higher productivity and securing production. In addition, using stream flows and ground water through technological interventions for control and use of water for supplementary and full irrigation to increase the productivity of limited smallholder land are useful interventions. Figure 5.2 provides the illustration of the major category used for small scale water management interventions, with emphasis on crops and plants. Most of the categories related to water control and management are also applicable for the livestock sector and some for fishery and aquaculture, with certain modifications on the parts of conveyance and application/use.

Objectives CPWF Project Report
Page | 75
Figure 5-2. Agricultural Water Management Continuum for Control, Lifting, Conveyance and Application
Furthermore, numerous combinations of this continuum are possible, creating what is termed - irrigation technology suits. These can be generically considered suitable for household or farm level, community or catchment/watershed level, sub-basin or regional or basin level. Table E.1 (Annex) provides the categorization of technologies. 5.2.2 Multi Criteria Analysis (MCA) for Selecting AWMIs In order to analyze alternative interventions of water management for various production systems, scale and locations in the Nile Basin and identify most suitable for agricultural production systems, MCA can serve as a tool. The purpose is to screen the most suitable water control and storage technologies as applied to the major production systems i.e. rainfed (water management of rainfed systems), irrigated, livestock and fisheries production systems. The scale evaluations of these interventions are made with respect to their suitability at various levels such as household/farm, small community/catchment or small watershed level or large community/large watershed, national/sub-basin and regional/basin/trans-boundary - all in relation to the identified detail study areas. The MCA brings together complex variables that determine the appropriateness of the interventions seen from aspects of technical; economic; social; institutional; environment and health; operation and management. These aspects can be used to identify appropriate water control/management interventions as suited to the production systems. The MCA framework can also be used to evaluate other uses such as hydropower, drinking, industrial and urban supplies.

Objectives CPWF Project Report
Page | 76
5.2.3 Water control & management in crop rainfed and SSI systems The described MCA is used to identify the most suitable water control and management technology that is applicable for a particular production system, evaluated based on comprehensive impact parameters, as assessed by experts with diverse backgrounds. Accordingly, results are analyzed based on key informants’ evaluation and summarized. The result shows that in-situ water management, soil and water conservation, spate/flood management, water harvesting ponds and wetland management are found the major interventions that can help upgrading rainfed systems. For small scale irrigation diverse technologies for water control are identified as useful with diversion, micro dams, wells (deep, shallow and hand dug), spring development are identified as priority types of interventions. The method can also used in to identify specific interventions with in specific spatial domains such as agro-ecology and production systems. In addition to the AWM interventions, integration of interventions with respect to soil fertility management, seed technology and pest and disease control are crucial and the impact of these various components discussed latter.
5.2.4 Livestock productivity interventions Similar type of analysis can be carried out to identify effective water control interventions viewed from various measures related to technical to operation and maintenance factors. More importantly, however livestock productivity improvement is obtainable by taking interventions beyond water management related to 1) feed sourcing 2) enhancing animal production 3) conserving water and 4) spatial distribution of livestock, drinking water and pasture. Use of teff crop residues for oxen feed in the Ethiopian highlands, veterinary control of Fasciolosis plus other diseases limiting livestock densities, moderate herd sizes in rangelands and spatially optimal establishment of drinking water sites in Central Sudan over large landscapes are among livestock practices identified in the Nile Basin. 5.2.5 Impacts of interventions on productivity and poverty The impacts of interventions with respect to productivity, poverty, food security can be evaluated based on various methods such as analysis of impact with and without interventions and modeling. As impact studies are difficult for getting data across the basin and demanding resources, aspects related productivity and poverty reduction are evaluated by taking the Ethiopian highland as example. Under the prevailing management systems, the average productivity of the farming systems is less than 1 ton ha-1 with a minimum of just over 0.7 tons ha-1 and a maximum of over 1.2 ton ha-1 and regardless of the farming systems and the crop types, the overall productivity is lower compared to the national average and the potential of the crops. Studies conducted in different parts of the basin demonstrated that the yield of some crops can be vastly increased by using improved seed and agronomic practices. The use of tie-ridges increases grain yield of maize, sorghum, wheat and mung beans by 50 to over 100% as compared to the traditional practice of planting on flat beds. Other studies showed that draining water logged vartisols can increase the productivity of some crops like wheat by over 100%. Similalry, improved crop management practices increased the productivity of improved variety of maize by 124% from 2.6 to 5.8 tons ha-1. Therefore, the combined use of agricultural water management techniques, improved crop varieties and fertilizers would optimize the productivity than using only one of them. For further details see Erkossa et al (2009).

Objectives CPWF Project Report
Page | 77
In the past, a lack of understanding issues that link agricultural water development to poverty reduction and agricultural productivity has been one of the reasons for underdevelopment of the subsector (Anderson & Burton, 2009). AWM technologies are expected to have significant impact on household wellbeing be it in increasing household food production or income (Namara et al., 2007; Narayanamoorthy, 2007). The findings indicated that there are significantly lower poverty levels among users compared to non-users of AWMTs and on average use of interventions reduced poverty incidence by 22%. The impact of some of the technologies is higher, for example, use of deep well reduced poverty by average of 50%. It also found that there is significantly lower inequality among users of AWMTs. The study results in Figures E-7 and E-8 (Annex) indicated that there are significant differences between technologies in terms of their poverty impact. For further details see Awulachew et al (forthcoming).
5.3 Conclusions for Small Scale Interventions
This part of the study takes a look at the existing agricultural systems and interventions to enhance productivity, poverty and food insecurity impacts with developing methods that can help preliminarily screens the most suitable technologies for a given agro-ecology and production systems. The key conclusions from these are that: - Various AWM technologies for water control, lifting, conveyance and field
applications are applicable. It is essential to identify the suites of technologies that can be used in the continuum of water management based on the local setting.
- A unique MCA based on a spreadsheet model was developed related to AWM technologies linking agricultural production systems and determinant of suitability. Variables relevant for decision making are identified and can be assigned weights based on expert’s decision and organized against interventions as analysis matrix. The MCA can help to bring together numerous variables and complex factors to screen suitable interventions.
- Based on the sample survey data access to AWM in water control and management help farmers to decrease poverty by about 22%. Some technologies such as deep well reduced poverty by 50%
- Rainfed water harvesting technologies are generally successful in areas where there are high variability and low rainfall to increase household agricultural production for food, cash crops, and livestock production
- The impact on productivity gain can be tripled if access of AWM technology can be increased and combined with access to improved soil fertility (fertilizer use) management and access to improved seeds are enhanced.
The study in this section showed that there are significant scopes for managing rain fed, small scale irrigation, livestock systems in the Nile Basin to increase productivity reduce poverty and enhance food availability.
5.4 Large Scale Interventions
The types of large interventions we are considering are those that improve access to available water and improve water management. These are interventions are mainly applicable at national and trans-national (regional) spatial domains and rarely at community or household levels. The large infrastructures can also be identified as those interventions made at river basin or sub-basin scales leading to significant temporal and spatial modifications of the natural flow or implying substantial socio-economic impacts. They also related to water management aspects of current, intermediate and long-term scenarios of water use and

Objectives CPWF Project Report
Page | 78
infrastructural developments. The study specifically considers the following large-scale interventions:
• water control and storage infrastructures (single or multi-purpose); • irrigation schemes; • hydropower plants; and • environment and wetlands.
Furthermore, water management interventions related to:
• improving productivity at production and farming system levels • reservoir management and operations • optimal sites of reservoirs • institutions (basin and sub-basin) • policy (treaties, agreements, laws) • socio-economic (regional trade, power interconnection, benefit sharing ) • mitigation of negative effect (flooding, low flow augmentations, climate
change adoption), etc These are topics dealt with elsewhere, but not reported in this section. The Water Evaluation and Planning System (WEAP) was applied to the entire basin to analyze the impact of the large-scale interventions. WEAP has the capability of integrating the demand and supply sides of water accounting with policy and management strategies (SEI, 2007).
5.5 The Nile Basin Water Control Infrastructure
5.5.1 Operational systems Large water control infrastructures have been used for long time in the Nile basin to regulate and utilize the seasonally varying river flow for irrigation, hydropower and flood control purposes. The large-scale control and storage infrastructures are located either at the outlet of natural lakes, Owen Fall dam at Lake Victoria and Chara Chara weir at Lake Tana, or along the major river courses. Among the storage infrastructures in Table E.2 (Annex), the High Aswan dam provides all year storage. The storage dams in Sudan are losing significant amount of storage volume through time due to sediment flow from Ethiopian highlands. Example Roseries capacity is reduced from about 3.4 billion in 1966 to 1.9 billion m3 in 2007 capacity (Bashar et al, 2009). 5.5.2 Emerging developments The Nile Basin countries are trying to meet their growth needs with a number of water resource developments. Some of the planned projects are already implemented or under construction. The Merowe dam in Sudan and the Tekeze dam in Ethiopia were recently constructed for hydropower generation, and these dams will become fully operational in 2010. The construction of the Bujagali hydropower plant in Uganda is in progress. Sudan will raise the height of the Roseries dam by 10m to further increase its storage capacity. Ethiopia is currently undertaking the Tana-Beles hydropower project through intra-basin diversion of 77 m3/s of water from Lake Tana to the Beles River (tributary of the Abbay River). Apart from these emerging water resource developments, the riparian countries are unilaterally planning to expand their irrigated agriculture and hydropower generation. Most countries have developed integrated master plans for parts of the Nile basin within their territories. Under the subsidiary action programs of the Nile Basin Initiative (NBI), the regional offices, NELSAP and ENTRO, are also planning joint multi-purpose projects that benefit the riparian countries.

Objectives CPWF Project Report
Page | 79
Figure 5-3. WEAP schematization of the Nile basin for the current situation
5.6 The Nile Basin Modeling Framework
The WEAP model in Figure 5.3 was set up for the Nile basin at monthly time intervals. For the purpose of clarity, the basin-wide topology (framework) of the WEAP model is independently displayed for the four major regions of the basin in Figures E.9 – E.12 (Annex). The release rules from natural lakes are defined as flow requirements downstream of the lakes. The flow rate at these nodes of the release rules is defined in terms of the water level of the lakes. The ecological water needs of wetlands are represented as flow requirement nodes that take up predefined percentage of the incoming flow into the wetland system. The contribution of wetlands to the dry season river flow is schematized in the WEAP model as streams, such as Ghazal Swamps and Machar. The details of the WEAP schematization are dependent upon availability of climatic, hydrological and infrastructures information.
5.7 Water Resources Development Scenarios & Water Demand
The large-scale water development and management interventions that are operational, emerging and planned in the entire Nile basin are categorized in three different scenarios of current, medium term and long term for the purpose of analyzing their plausible impacts on water availability and access. As the time line information is not available, about one third of the countries potential developments are assumed to be implemented during the medium-term scenario period, and the remaining near-potential developments are also assumed to be realized during long-term scenario period. The existing and planned irrigation areas of the riparian countries and regions in the Nile basin for the three development scenarios (Table E.3, Annex) and Figure 5.4 are determined from country specific feasibility studies and master plans (BECOM, 1998; NEDECO, 1998; TAMS, 1997), literatures (FAO, 2000) and project

Objectives CPWF Project Report
Page | 80
documents (ENTRO, 2007). Accordingly, the irrigation areas of the current, medium-term and long-term scenarios in the Nile basin are respectively about 5.5 million ha, 8 million ha and 11 million ha. Figure 5-4. Aggregated incremental irrigation plans by country
Increments of Irrigation in Current, Medium and Long Term Scenarios
0.00
1.00
2.00
3.00
4.00
5.00
Burundi Egypt Ethiopia Kenya Rwanda Sudan Tanzania UgandaCountries
Irri
gatio
n C
ove
rag
e in
Mill
ion
ha Long-term
Medium-term
Current
The water requirements of the irrigation scenarios are determined from the annual rate of irrigation water requirement compiled from feasibility studies, master plans, relevant literatures and project documents or rainfall and evapotranspiration data when such data does not exist, and shown in Table E.3 (Annex). The percentage of water returning from irrigation systems to the river network is assumed based on the topography of the irrigation field. In flat irrigation fields no return flow is considered. The environmental water requirements of the wetland systems are expressed in terms of the percentage of incoming flow to the wetland in the previous month. The one month lag is adopted due to model restrictions in accessing the current month incoming flow. However, the lag helped to account the routing effect of the wetlands. 5.8 Implications
The water availability in the Nile river system was found to decrease for the medium-term and long-term scenarios as compared to the current scenario. The impact of the development interventions on water availability increases along the river course following the flow direction found in Figure 5.5 for the long term scenario and for tabular details provided in Table E.4 (Annex). For more details see Demissie et al (2009). Every irrigation water demands are satisfied for the current (baseline) scenarios as expected. However, the irrigation demands for the medium-term and long-term scenarios are not fully met. Some of the unmet irrigation demands could be satisfied by improving irrigation efficiency and implementing carry over storages on seasonal tributaries and sub-basins.

Objectives CPWF Project Report
Page | 81
Figure 5-5. Simulated Nile River flow for the long-term development scenario
5.9 Conclusions for Large Scale Interventions
Taking the 84.5 Billion m3 as a benchmark for the average water availability, an integrated basin-wide simulation of the large-scale water development and management interventions in the Nile basin revealed that the Nile flow would not meet the irrigation water demands for the medium- and long-term development scenarios. The impact of the large-scale water management interventions on the water availability and irrigation schemes could be mitigated by adopting water saving and demand management interventions, however this needs further analysis. In order to meet future challenges, the following recommendations are made, all aimed at improving overall basin water productivity:
• Reservoirs developed for hydropower and irrigation with carry over storage capacity could provide more reliable water for the planned irrigation schemes. This demands integrated management of reservoirs as one unit.
• Water saving practices could be implemented to free up water for more irrigation use. Their magnitude needs further analysis especially given the reuse of return flows prevalent in the Nile system.
• Through further study, consider innovations such as deficit irrigation and target efficient irrigations scheduling
• Outside of agriculture, the water productivity should be improved by shifting water from economic sector that uses more water per unit production to that uses less (more value per unit of water). For example, the water used for cooling thermal energy plants could be used for other productive systems by importing hydropower energy from other riparian state.

Objectives CPWF Project Report
Page | 82
• Reducing non-consumptive water loses through efficient reservoir operation and irrigation water management could also improve water availability in the basin.
• Identify and decrease evaporation, and seepage that does not return to be reused in agriculture. Water storage can be managed to decrease evaporation.
• Explore alternative sources of water such as ground water and rainwater, without contributing to river flows and/or irrigation demands.
The above recommendations are amenable for further research on their implications and impact. On the other hand it was shown in the other section that upgrading the rainfed system with the scope of enhancing beneficial use of rainfall can also contribute significantly in meeting the food production and demand in the Basin. 5.10 Conclusions of Intervention Analysis
To unravel the complexity in identifying interventions, we have developed hydronomic zoning to identify different water management recommendation domains; analyzed options of small scale agricultural interventions focusing on water control in rainfed systems, and analyzed large scale interventions. Other types of interventions related to policy, institutions, benefit sharing are treated in the institutions section. The poverty analysis of the project showed that there is widespread rural poverty and vulnerability. It also showed that access to water, productivity gains, and actions to reduce vulnerability would help reduce poverty. This shows the clear role for water management interventions. The sections on water availability and access demonstrated that there is some, but limited scope for large scale irrigation development, but that there is ample water (as rainfall) in rainfed systems. Where poverty is high water productivity is low. Basically, for poverty reduction the main message is clear and simple – there is ample work that needs to be done to improve water access and water productivity to reduce poverty. In a sense, nearly all rural water actions within the basin have poverty implications (except in Egypt where other actions outside agriculture probably have more impact than agriculture). The real work is identifying where and how to make these interventions. The hydronomic zoning combined with production system zoning immediately shows that there are numerous options that have potential within the Nile, but need to be tailored to the site specific needs. For example, crop livestock considerations near wetlands would need a different set of considerations than a crop livestock system in an irrigation system. The hydronomic zones showed that in much of the rainfed systems, downstream considerations are not a key concern, but that in some of the areas especially in more humid highlands, upstream development must take into account potential downstream impacts. The implication is that a range of solutions need development, and somewhat intensive fieldwork, investigation and supporting institutions are required to realize the gains. Our key recommendation is to transform rainfed systems by focusing on water access for agriculture, and good agricultural practices. In the small scale, smallholder interventions we have developed generic and comprehensive lists of AWM interventions that are most common in the basin, which can enhance agricultural water access in rainfed, small scale irrigated and livestock production systems. The generic tabular matrix developed can help with identification of AWM interventions for water control, lifting, conveyance and applications

Objectives CPWF Project Report
Page | 83
customized per sources of water as rain fall, surface water and ground including re-use and drainage. The study developed multi criteria analysis technique to understand the suitability of various types of water control AWM technologies as related to complex factors dealing with determinant variables linked to technical, economic, policy, institutions, social factors, environment and health as well as operation and maintenance. Furthermore, combination of interventions beyond AWM creates the expected optimal impact on productivity. Supported by experimental evidence and modeling, it was shown that productivity can be gained up to 3 fold from single harvest by integration of AWM, soil fertility and improved seed. In relation to large scale interventions, the whole Nile Basin was modeled as one integrated system and current, medium term and long term scenarios were analyzed considering irrigation, hydropower, environment and wetlands. While the irrigation and environment and wetlands requirements are sensitive, the hydropower demand which is non consumptive use was taken as unimportant in affecting the water availability in the basin. Thorough study of the plans of the countries, reveal that planned irrigation in various countries is 10.6 Mha compared to the current total of 5.5Million ha. With the currently level of water application, absence of reservoir management, irrigation efficiency the total water withdrawal requirement in the long term would require 127 Billion m3, far beyond the 84.5 Billion m3 available. While there is scope for some irrigation expansion, in order to come close to future plans, mitigation measures are required that include improvements in water productivity, increase the storage capacity upstream to reduce evaporation in downstream storage, enhanced carry over storage, and implement demand management and water saving practices. All the above results are first time baseline results which point to areas of further research and analysis. For example research detailing specific interventions per hydronomic zones, further refinement of the SSI intervention analysis per agro-ecology and spatial area, more in depth and broader poverty impact of interventions, analysis of suggested options to balance future demand and water balance, all deserve further investigations. While there is ample scope for more strategic research, there is more than ample work to be done immediately that requires well crafted implementation and local adaptive research.


Objectives CPWF Project Report
Page | 85
6 KNOWLEDGE MANAGEMENT
6.1 Communication and knowledge Sharing
The implementation of the project involved the participation of three groups as detailed below. Communication, the exchange of information between these groups, and their participation in project meetings was facilitated through WP 6. i) A Core Team consisting of the project manager, work package leaders and key researchers who led activities in their respective work packages, and synthesize results into the final outputs. ii) An Advisory Panel comprising of key stakeholders including the Basin Coordinator, representatives from the NBI, basin countries, and NGOs. These helped to shape the research during the project inception phase by identifying key issues and knowledge gaps in the basin, at the mid-term phase by providing input on results and methods, and at the synthesis/final workshop, to provide feedback on the key findings of the project. At all stages they were requested to share information with their networks. iii) Special Case Study Teams to carry out detailed studies at specific sites identified during the inception phase. Members were drawn from national research centers, universities, and civil society organizations. Those carrying out special studies participated in the mid-term meeting of the project, and presented results.
Communication with other Basin Focal Projects and the CPWF was also undertaken and facilitated through WP6. This was achieved through participation in the CPWF forum in Addis Ababa in 2008 and the BFP side meetings and workshops, where the BFP teams engaged with each other to share knowledge. In addition participation in and input to CPWF led activities such as on-line discussions, the CPWF newsletter, the BFP wiki, and other CPWF projects in the basin allowed for sharing of methodologies across basins as well as the integration of results from other projects into the analysis. Reporting to CPWF has also been undertaken regularly and coordinated through this work package, through the submission of monthly reports. Sharing of information within the team was achieved through regular archival of relevant documents on the BlueDocs website. In addition a website set up for the project provides information on project activities, methodologies, results and outputs. Project presentations at various international events have ensured wider dissemination of key findings and research results.
6.1.1 Impact Pathways
The development of a Knowledge Sharing strategy during the inception phase identified relevant boundary partners, stakeholders, and potential impact pathways, through the use a number of project planning tools including problem trees, visioning and network mapping. The problem tree identified by the participants and used to focus the research during the 2 years of project implementation is shown below.

Objectives CPWF Project Report
Page | 86
Figure 6-1. Participatory Impact Pathway Analysis
During project inception basin network maps were developed in consultation with key stakeholders and boundary partners in order to identify who is working with whom within the Nile Basin, as well as who is involved within the project. The maps were used to ensure representation of key players at project meetings, and to determine how best to utilize the network to achieve project outputs and impact. The information was used during the 2 years of project implementation in order to plan activities and to monitor and ensure basin-level integration. The network map is displayed below, and the network changes brought about by the project are detailed in the following Table 5.1. Figure 6-2. Network map

Objectives CPWF Project Report
Page | 87
Table 6-1. Network changes brought about by the project Describe the most
important network
and influence changes
Has the
change
already occurred?
(yes or no)
Why is it important
to make the change?
What are the project’s
strategies for achieving
these changes?
Collaboration for research
Yes
It is necessary for successful research. Teams need to work together effectively across borders in the Nile Basin. This is also important for effective capacity building
Task teams; task sharing; exchange of data; field visits; improved communications
Improved data sharing mechanisms
No/partial
To carry out basin wide analysis and to enable researchers better access to data
Working together to produce required outputs; sharing a basin wide database; encouraging data sharing protocol; agreement between the projects on data sharing
Collaboration for dissemination of knowledge
Yes
To avoid duplication of efforts, to ensure results are easily accessible and commonly available for the Nile Basin countries
Create open access knowledge sharing platforms, open access, documents, website based databases, mapping products, published materials
Table 6-2. Description of project achievements and vision How far in the future is your Vision? When the project finishes: December 2009
Other (specify): Next 10 years What will they be doing differently in
the future?
(Next users: NBI, ENTRO, NELSAP, ASARECA, Development Organizations, Ministries) Improved collaboration to share the benefit of water; creating enabling policies for better water management; effective exchange of data and information; better coordination and cooperation
How are project outputs
disseminating (scaling out) now?
How will they disseminate in the future?
Through the project core group and consultative group; face to face discussions, field visits and sharing of information at project meetings and workshops Through web sites, databases shared with NBI and other stakeholders, presentations at key international events, workshops, meetings, dialogue, consultations, validations, publications. Through CPWF Phase 2 projects in the basin
What political support has nurtured
this spread (scaling up)?
Uptake and buy-in of major actors such as ENTRO, NBI, National governments, donors; Dissemination of key findings on websites, at workshops and through presentations at international events
What will end users be doing
differently?
Using new tools and information provided by the project to improve water management in the basin.
What benefits are the next users and
end users enjoying as a result of the project?
Improved access to information, technologies, institutional set ups and cooperation, better decision support systems on investment of technologies.

Objectives CPWF Project Report
Page | 88
An Outcomes Logic Model was developed for the project during the first 6 months of implementation in consultation with the core project team, and refined at project completion. This describes near-term expected/achieved changes resulting from the project activities, as well as longer-term contribution to developmental impacts in the Nile Basin. The project vision is detailed in Table 6-2. 6.2 Spatial Database Development
During project implementation, data needs were identified and acquired by the work package leaders. In relation to this activities of WP 6 involved:
• Coordinate the acquisition of these datasets in the relevant formats • Compile inventory of datasets. • Manage the body of data for common access. • Maintain central repository of project data (electronic and hardcopy,
documents, datasets, GIS coverage of both input data, project outputs and dissemination material and communications)
• Upload for common access • Coordinate with CP secretariat for submission of datasets to IDIS
The process for acquisition, organization and sharing of the spatial data is summarized in the Figure below. Figure 6-3. Collection, organization and dissemination of spatial datasets
The NBI, through the Nile CoM (Council of Minister’s), is currently developing a data sharing protocol which will also include protocol for sharing the difficult transboundary high resolution data. As soon as this is finalized (not yet as of Dec 2009) we will use this legal and collaborative platform to share key project datasets.

Outcomes and Impacts CPWF Project Report
Page | 89
7 OUTCOMES AND IMPACTS This portion of the study focuses on outcomes and impacts. 7.1 Proforma
Summary Description of the Project’s Main Impact Pathways
Actor or actors who have changed at least partly due to project activities
What is their change in practice? I.e., what are they now doing differently?
What are the changes in knowledge, attitude and skills that helped bring this change about?
What were the project strategies that contributed to the change? What research outputs were involved (if any)?
Please quantify the change(s) as far as possible
NBI , CG Centers, and basin institutions
Working in teams, sharing data, developing models, joint field work and visits, exchange of knowledge
Realization of the benefit of collaborations
Task teams; task sharing; exchange of data; field visits; improve communications. Co-development of outputs with key stakeholders
The BFP related developed model, example WEAP for integrated modeling of Nile is requested to serve as comparative model of the MIKE Basin model under development by NBI consultant -8 regional experts were engaged in case studies for ground water studies, institutions, poverty and spate irrigation and co-development of knowledge
NBI and other basin institutions ( Ministries of Water, Universities, CG Centers, Other CPWF projects, NBI, SAPs )
Seeing the value in sharing the data, building trust,
Change in attitude on data sharing,
Working together and produce outputs; supporting for establishing database; encouraging data sharing protocol; agreement between the projects. Hand over database developed to NBI
Realized the benefit of data sharing and new data sharing protocol signed between countries. Some data is provided to NBI and further handing over of the database is in progress. NBI projects have also provided data to the project
NBI (SVP, SAP and TAC), CG Centers
Using network relationships for dissemination of
Project impacts derived through additional
Create knowledge sharing platforms, open access,
Discussion and verbal agreements made

Outcomes and Impacts CPWF Project Report
Page | 90
results strategies beyond producing outputs
documentations, website based databases, mapping products, published materials
between NBI and IWMI on behalf of CGIAR to carry out monthly knowledge sharing seminars, starting 2010 - Outputs are shared at the Nile Basin Development forums - BFP project invited to the Nile Basin10th year anniversary show case event to present results to wider Nile Basin Community - Executive directors and TAC members of the countries attended the BFP dissemination
CPWF
Basin Development Challenges for Phase 2 based on key findings of the project
Information on key agriculture-water-poverty issues in the basin
Close discussion with CPWF during project implementation
Phase 2 projects for the Nile start in Jan 2010
Of the changes listed above, which have the greatest potential to be adopted and have impact? What might the potential be on the ultimate beneficiaries? Collaboration for dissemination of knowledge, sharing of data between basin institutions. Improved data sharing will avoid duplication of research efforts, and ensure results are easily accessible and commonly available for the Nile Basin countries. These can then be used to further understanding of key basin issues. It will also have the benefit of direct application of generated results in to practice. Furthermore, transfer of the developed model and developed results is agreed, so that NBI uses the results directly for comparison with consultants based results. What still needs to be done to achieve this potential? Are measures in place (e.g., a new project, on-going commitments) to achieve this potential? Please describe what will happen when the project ends. Changes will continue to have impact through the implementation of CPWF Phase 2 projects in the basin, starting Jan 2010. During the final workshop, the NBI, DSS lead specialist requested the BFP project team to undertake certain applied research components related to the NBI project and resource will be provided by NBI. An agreement is expected to be reached soon. Each row of the table above is an impact pathway describing how the project contributed

Outcomes and Impacts CPWF Project Report
Page | 91
to outcomes in a particular actor or actors. Which of these impact pathways were unexpected (compared to expectations at the beginning of the project?)
Effective data sharing could not be realized until towards the end of the project.
Why were they unexpected? How was the project able to take advantage of them? The project expectation was that Nile countries reach an agreement on data sharing and sign the data sharing protocol as well as signing the comprehensive framework agreement. The data sharing protocol agreement is signed in the second half of 2009, and the delay constrained easy access to data. What would you do differently next time to better achieve outcomes (i.e. changes in stakeholder knowledge, attitudes, skills and practice)? - Develop more collaborative projects and ascertain research projects are strongly linked to basin priorities and projects
- Enhance joint dissemination including the possibility of hosting one of the Nile Development Forum of the NBI.
- Streamline the research agenda of the NBI undertakings through more proactive contributions to the consultation of the emerging Institutional Strengthening Projects as well as Nile Commission.
7.2 International Public Goods
• New insights on poverty, water related risks and vulnerability including mapping of these are provided for the Nile Basin. Deep poverty concentration is linked to rain fed, agro pastoralist and pastoralist areas, while those with improved water access have lower poverty
• New analysis of incorporating rain fed in the analysis of Nile water is developed
using total basin water accounting. 85% of the water consumption is natural land use, 11% under managed land use and 4% under managed water use. Transferring some of the natural land use to managed land and water use to enhance beneficial transpiration can immensely increase food production and improve water availability
• Analysis of the production system shows, the Nile Basin has 37Million ha under
rain fed agriculture (87%), where most of the poor leave and about 5.5 Million under irrigated system. Analysis on incorporating livestock and fish in the production systems is developed and framework for livestock productivity is applied Nile wide.
• Water productivity in the Nile Basin has a large variation. In terms of SGVP/Eta,
water productivity is ranging from 0.01 $/m3 in Sudan to 0.2 $/m3 in Egypt. Results show, in general higher land and water productivities in irrigated areas in Egypt and Sudan. Rain fed crops water productivity is generally low, except in patches Ethiopia and equatorial countries where they are slightly higher. In

Outcomes and Impacts CPWF Project Report
Page | 92
almost more than two third of areas received rainfall is not enough to meet crop’s water demand, and hence management of rainfall is essential.
• There is a high scope for improvement of crop, livestock, and fish production in
upstream countries. Major causes of low productivity in the upstream countries for crops is related to poor nutrient & water storage capacity of soils due to land degradation, water logging of vertisols, shortage and uneven distribution of rainfall and lack of suitable technologies such as seed and fertilizers. Integration of interventions can increase productivity over 3 folds.
• Hydronomic zoning in the Nile Basin helped to identify various zones such as
water sources zones, environmentally sensitive zones and farming zones. New method of hydronomic zoning using Principal Component Analysis (PCA) of extensive biophysical parameters is developed. Based on this potential water management interventions could be mapped into the 19 hydronomic zones of the basin; environmentally sensitive zone defines wetlands and protected areas (about 10% of the basin) and the water source zones (humid and wet humid primary classes) account for less than 15% of the basin. The method can be used to any other basin for developing water management strategies and informed decision making
• Multi Criteria Analysis (MCA) based spreadsheet model is developed related to
Agricultural Water Management (AWM) technologies linking agricultural production systems and determinant of suitability to be evaluated by stakeholders. The MCA can help to bring together numerous variables and complex factors to screen suitable interventions. In-situ water management, soil and water conservation, spate/flood management, water harvesting ponds and wetland management are found the major interventions that can help upgrading rainfed systems. For small scale irrigation diverse technologies for water control are identified as suitable with diversion, micro dams, wells(deep, shallow and hand dug), spring development are identified as priority types of interventions. Based on sampled surveys, peoples who have access to AWM in rainfed areas are found to be less poor (22%)
• Although complex, the Nile basin is modeled as one integrated system using
WEAP model. Numerous factors including current, medium term and long term scenarios were analyzed considering irrigation, hydropower, environment and wetlands water demands. The insight is that there is not enough river water to meet all the demands. More rainwater could be used for more agriculture. Realizing future plans in using river water require coordinated efforts including water productivity gains, water savings in the existing schemes through increasing irrigation efficiency, re-use of water, promote low consumptive & high yield crops and new strategies of storage & management
7.2.1 Tools and Methodology
• Poverty, vulnerability and risk mapping indicators and linkage to water access • Total water accounting based on remote sensing and SEBAL modeling • Hydronomic zoning using PCA • Multi Criteria Analysis for screening suitable AWM interventions • Software based integrated modeling to undertake scenario and impact analysis •
Other tools such as GAME Theory, Benefit Sharing are further developing by Ph.D. students and will be available in future

Outcomes and Impacts CPWF Project Report
Page | 93
The following new maps are produced, and note that most of these are set of maps - Maps of the Nile covering production systems - Poverty maps of the basin covering identified by various production systems - Vulnerability maps covering and associated to the various production systems - Water related risk maps of the basin and associated to the various production
systems - Maps of the Nile covering current productivity and potential productivity of crop - Special map covering farming systems of Ethiopian highland - Maps of the Nile covering livestock productivity - Special high resolution map covering partial Sudd Wetland - Maps of the Nile representing various bio-physical, climatic and hydronomic
factors including climatic patterns of the basin, rainfall, evaportranspiration, topography and topographic indices, soil properties, vegetation profiles, environmentally sensitive areas covering wetlands and protected areas and derived maps of hydronomic zones
- Simulated Nile River flow maps representing various development scenarios
7.3 Partnership Achievements
Within the CPWF BFP - Increased cross referencing of tools, methods, analysis, results and adoption of
generated knowledge are made possible - Through the synthesis across CPWF projects it is possible to produce more in-
depth understanding of global water management issues With partners of the Nile BFP
- More awareness created in terms of water accounting, understanding the need of integrating the rain fed systems
- Emphsised udnerstanding on the need for more priority should be given to agriculture development in the Nile cooperation process – agriculture is a core issue in terms of socio-economic development, poverty reduction, regional trade and integration
7.4 Recommendations
• Agriculture is the mainstay of the economy of the countries and source of
livelihood for the majority of the people in the basin. It is crucial to provide sufficient attentions and investment in agriculture to reduce poverty and contribute to MDG
• Agricultural Water Management is crucial for economic growth, food security, poverty reduction – AWM needs to be better integrated in Nile Basin initiative programs
• Rainwater is Nile Water, start from rain in the analysis. Water availability for food production can be enhanced through conversion of some “non-beneficial” water to managed land and water use
• There is limited scope for further large scale irrigation, but it tends to receives the bulk of attention, gains in large scale irrigation comes through improved cooperation and integrated management of the water resources
• Water access, rainwater management, livestock improvement and productivity gains are essential for poverty reduction and the environment.
• Fisheries development and training for small scale irrigation systems are important, and need more attention though out the basin.
• Look outside the river to relieve pressure on the river: Productivity potential within landscape is high and can improve by many folds
• All inclusive sustainable cooperation such as comprehensive agreement and Nile Commission can contribute to the agriculture and socio-economic development in the Nile Basin

Outcomes and Impacts CPWF Project Report
Page | 94
• Nile basin is wide and complex and it varies in poverty, productivity, vulnerability, water access and socio-economic conditions. It is essential to make further in depth research and local analysis for further understanding of issues and systems and design appropriate measures
• Further research should also target analysis related to rain water management interventions, impacts, upstream downstream relationship, tradeoff analysis, economic modeling and new innovations
• Need to improve human and institutional capacity to make this happen, from community to national to regional scale.
7.5 Publications
Abd El Nassir Khidr M. Osman (MSc degree Civil Engineering University of Sudan for
Science and Technology) Impact of Policy Changes on the Performance and Water Productivity of Gezira Scheme – Part 1; Biophysics and water productivity (final)
Awadalla, Sirein S; September 2010. Literature Review on Sudd Wetland: Hydrology and
Water Resources. MIT, Cambridge, Massachusetts Awulachew, S.B., McCartney, M., Steenhuis, T, Ahmed, A.A. 2008. A review of
hydrology, sediment and water resource use in the Blue Nile Basin. Colombo, Sri Lanka: International Water Management Institute (IWMI) 81p. (IWMI Working Paper 131)
Cascão, A.E. (2009), Institutional analysis of Nile Basin Initiative: What worked, what did
not work and what are the emerging options? Report submitted to International Water Management Institute as a part of Nile Basin Focal Project.
Danso, George K. 2009. Economic Incentive Based Approaches for Transboundary Water
Management under Cooperative Agreements: a case study of Blue Nile River Basin. PhD Thesis, University of Oregon.(Draft only)
Demise, S.S., Awulachew, S.B. and Molden, D. (in review). Biophysical Classification for
Efficient Water Resources Management: Hydronomic Zones of the Nile Basin. Erkossa, T., Awulachew S. B. and Denekew, A. (in review). Agricultural Productivity of
the Upper Blue Nile Basin Farming systems Everisto Mapedza ,T. Tafesse, A. Haileslassie, Seleshi Bekele Aulachew. 2009. Benefit
sharing and Architecture of Transboundary Water Institutions: a Mechanism for Sustainable Water Governance in the Blue Nile. Report submitted to International Water Management Institute as a part of Nile Basin Focal Project.
Gamal, K.A.E.M. 2009. Impact of policy and institutional changes on livelihood of
farmers in Gezira scheme of Sudan, MS thesis submitted to University of Gezira, Sudan and study supported by International Water Management Institute as a part of Nile Basin Focal Project (Final)
Iyob,B., I. Fischhendler, M. Giordano and A.T. Wolf. 2009. From water sharing and cost
sharing to benefit sharing principle: Implications to the Nile basin. PhD student, Department of Geosciences, Oregon State University. (unfinished)
Kinyangi, J., Herrero, M., Ouna, T., Notenbaert, A. and Peden,D. 2009. Water and
Poverty Analysis in the Nile basin CPWF paper

Outcomes and Impacts CPWF Project Report
Page | 95
Mohamed, Y.A., D. Molden, W. Bastiaanssen. (forthcoming). Water accounting at a river basin scale: the Nile basin case, Agricultural Water Management special issue Water Accounting
Negash, Tewodros, 2009. Water Resources Allocation of the Nile River Basin - A cooperative Game Theoretic Approach; PhD Thesis Addis Ababa University and IWMI
Peden, D., M. Alemayehu, T. Amede, et al. 2009. Nile basin livestock water
productivity. CPWF Project Report Series, PN37, Colombo: CPWF. Poolad Karimi, and David J Molden. 2009. Crop water productivity mapping in the Nile
Basin. (IWMI/CPWF Paper Draft). Samuel Atanasio Mustafa Abin, 2009. Personal account on Sudd livestock: Opportunities,
Constraints and Trade-offs, University of Juba, Southern Sudan. Teketel, A. 2009. The socio-economic and institutional dynamics of watershed
management: The case of Kanat and Magera micro-watersheds. MSc thesis submitted to Addis Ababa University. Study supported by IWMI as a part of Nile BFP project.
Tesemma, Z.A., Mohamed, Y.A., Steenhuis, T.S., Master Thesis professional studies Cornell University Trend in Rainfall and Runoff in the Blue Nile Basin: 1964-2003.
Westman,M. 2009. Literature review of past agreements and indicative
recommendations of institutional arrangement in Nile. Consultancy report submitted to International Water Management Institute as part of the Nile BFP.
Posters Created for NBI meeting Dar es Salaam December 2009. 11 poster PDF files attached.


Bibliography CPWF Project Report
Page | 97
BIBLIOGRAPHY References
Anderson, I. M. and Burton, M. 2009. Best Practices and Guidelines for Water Harvesting and Community Based (Small Scale) Irrigation in the Nile Basin, Part I to III Nile Basin Initiative - EWUAP report
Alemayehu, M., D. Peden, G. Taddesse, A. Haileselassie and, W. Ayalneh. 2008.
Livestock water productivity in relation to natural resource management in mixed crop-livestock production systems of the Blue Nile River Basin, Ethiopia. In Fighting Poverty Through Sustainable Water Use: Volumes II, Proceedings of the CGIAR Challenge Program on Water and Food 2nd International Forum on Water and Food, November 10—14, in Addis Ababa, Ethiopia.
Anand, S. and, A. Sen. 1997. Concepts of Human Development and Poverty: A
multidimensional perspective. Background paper for Human development Report, 1997.
Anderson, I. M. and, M. Burton. 2009. Best Practices and Guidelines for Water
Harvesting and Community Based (Small Scale) Irrigation in the Nile Basin, Part I to III Nile Basin Initiative - EWUAP report.
Aquastat-FAO. 1997. http://www.fao.org/nr/water/aquastat/main/index.stm AQUASTAT-FAO. 2005 and 2008.
http://www.fao.org/nr/water/aquastat/main/index.stm Arnell, N.W. 1999. Global Environmental Change, Volume 9, Supplement 1,
October 1999, Pages S3-S19. Awulachew, S.B., Hagos, F., Loulseged, M. (forthcoming) Agricultural water
management in Ethiopia: An inventory of agricultural water technologies and practices, and assessment of poverty impacts of most promising technologies. IWMI Research Report.
Awulachew, S.B. and, M. McCartney, T. Steenhuis, A.A. Ahmed. 2008. A review
of hydrology, sediment and water resource use in the Blue Nile Basin. IWMI working paper 131.
Bashar, K. E. and, M. O. Mustafa. 2009. Water balance assessment of the
Roseires Reservoir. In Awulachew, Seleshi Bekele; Teklu Erkossa, Vladimir Smakhtin, Ashra Fernando, (Comps.). Improved water and land management in the Ethiopian highlands: its impact on downstream stakeholders dependent on the Blue Nile. Intermediate Results Dissemination Workshop held at the International Livestock Research Institute (ILRI), Addis Ababa, Ethiopia, 5-6 February 2009. Colombo, Sri Lanka: International Water Management Institute (IWMI). pp.38-49.
Bastiaanssen, W.G.M. 2009. Establishment of a GIS and data management
system at ENTRO: Phase 1: system design and development, draft final report to NBI – ENTRO: 103 pp
Bastiaanssen, W. and, C. Perry. 2009. Agricultural Water Use and Water
Productivity in the Large Scale Irrigation (LSI) Schemes of the Nile Basin;

Bibliography CPWF Project Report
Page | 98
Efficient Water Use for Agricultural Production (EWUAP) Project, NBI Report May 2009.
BECOM. 1998. Abbay River Basin Integrated Development Master Plan Project,
Phase 2, Section II, Volume III – Water Resources, Part 1&2 – Climatology and Hydrology. Ministry of Water Resources, Addis Ababa, Ethiopia
Camberlin, P. 1997. Rainfall anomalies in the Source Region of the Nile and their
connection with the Indian Summer Monsoon, Journal of Climate, 10, 1380-1392.
Cascão, A.E. 2009. Institutional analysis of Nile Basin Initiative: What worked,
what did not work and what are the emerging options? Report submitted to International Water Management Institute as a part of Nile Basin Focal Project.
Cascão, A.E. 2008a. Ethiopia – Challenges to Egyptian hegemony in the Nile
Basin. Water Policy, 10(S2), 13-28.
Cascão, A.E. 2008b. New Nile Treaty – A Threat to the Egyptian Hegemony on the Nile. In Chroniques égyptiennes 2007, ed. H. Aouardji and H. Legeay. Cairo: Centre d’Études et de Documentation, Économiques, Juridiques et Sociales, 2008, 139-162.
Challenge Program on Water and Food (CPWF). 2007. www.cpnile.net Chamberlin, P. 1997. Rainfall anomalies in the source region of the Nile and their
connection with the Indian summer monsoon. Journal of Climate, 10 : 1380-1392.
Choudhury, B. J., N. U. Ahmed, S. B. Idso, R.J. Reginato and C.S.T. Daughtry 1994.
Relations between evaporation coefficients and vegetation indices studied by model simulations. Remote Sensing of Environment, 50, pp. 1-17.
CIESIN (Center for International Earth Science Information Network, Columbia
University) & CIAT (Centro Internacional de Agricultura Tropical) (2005) Gridded Population of the World Version 3 (GPWv3): Population Density Grids. Palisades, NY, Socioeconomic Data and Applications Center (SEDAC), Columbia University. Available from: <http://sedac.ciesin.columbia.edu/gpw> [Accessed 9 December 2008].
Collins, Robert, O. 1990. The waters of the Nile: hydropolitics and the Jonglei
Canal. 1898-1988, Oxford: Clarendon Press. Conway, D. 2005. From headwater tributaries to international river: Observing
and adapting to climate variability and change in the Nile basin. Global Environmental Change, 15, 99–114.
Conway, D. and M. Hulme. 1996. The impacts of climate variability and future
climate change in the Nile basin on water resources in Egypt. Water Resources Development, 2: 277-296.
Cook, S. and, F. Gichuki. 2006. Analyzing water poverty: Water, agriculture and
poverty in basins. Basin Focal Project Working Paper No. 3. URL: Corbett, J. 1988. Famine and Coping Strategies. in World Development, vol. 16,
no. 9, pp 1099-1112.
Bibliography CPWF Project Report
Page | 99
Davis, C. 2007. The Multiple Dimensions of Water Scarcity. EarthTrends,
November 2007 Monthly Update. Available from: http://earthtrends.wri.org/updates/node/264.
Demissie, S.S., Awulachew, S.B., Molden, D. 2009. Intervention Analysis in the
Nile; large scale interventions. IWMI, Unpublished Report. Denny, P. 1991. Africa. Pages 115-148 in M. Finlayson and M. Moser, editors.
Wetlands. International Waterfowl and Wetlands Research Bureau. Facts on File, Oxford, UK.
Dilley, M., R.S. Chen, U. Deichmann, A.L. Lerner-Lam and, M. Arnold. 2005.
Natural disaster hotspots: A global risk analysis. The World Bank, Hazard Management Unit. Published by World Bank, Washington DC.
Drainage Research Institute (DRI), 2007. Cairo, Egypt. Droogers, P., W. Immerzeel, and C. Perry. 2009. Application of remote sensing in
national water plans: Demonstration cases for Egypt, Saudi-Arabia and Tunisia. Report FutureWater: 80.
Eastern Nile Technical Regional Office (ENTRO) 2006. Eastern Nile Watershed
Management Project, Cooperative Regional Assessment (CRA) for Watershed Management Transboundary Analysis Country Report, Ethiopia
El Atfy, H., A. Abdin, I. Gaafar. 2009. Egyptian Water Use, Patterns, Performance,
and Prospective. El Quosy D. 2006. “A Study on Matching Irrigation Supply and Demand (MISD)”
Technical Report Prepared for Eco ConServ-Environmental Solutions. Elshamy, M., I. Seierstad, and A. Sorteberg. Impacts of climate change on Blue
Nile flows using bias-corrected GCM scenarios. HESSD 2008-0050. Erkossa, T., Seleshi B. Awulachew, and A. Denekew, 2009. Farming System
Productivity Modeling: Maize and Potato in Ethiopian Blue Nile Basin. IWMI. Unpublished report
Faki, H., I. El-Dukheri, M. Mekki, and D. Peden. 2009. Sudan country paper for
PN37. CPWF working paper series #. (in progress). Faki, H., I. El-Dukheri, M. Mekki, and D. Peden. 2008. Opportunities for
increasing livestock water productivity in Sudan. In Fighting Poverty Through Sustainable Water Use: Volumes II, Proceedings of the CGIAR Challenge Program on Water and Food 2nd International Forum on Water and Food, Addis Ababa, Ethiopia, November 10—14, 2008.
Falkenmark, M., J. Lundqvist and C. Widstrand. 1989. Macro-scale water scarcity
requires micro-scale approaches. Aspects of vulnerability in semi-arid development. Natural Resources Forum, 13 (4), pp.258-67.
FAO. 2009. Fishstat database, consulted 12 January 2009 Institute of National
Planning (1995) Egypt Human Development Report 1995. Institute of National Planning, Cairo, Egypt.
FAO. 2007. www.faonile.org/nbs/nilesystem.htm

Bibliography CPWF Project Report
Page | 100
FAO. 2005. Aquaculture production, 2003. Year book of Fishery Statistics -
Vol.96/2. Food and Agriculture organization of the United Nations, Rome, Italy.
FAO. 2005. Livestock Information, Sector Analysis and Policy Branch, Technical
Report (March 2005). FAO. 2004. National Aquaculture Sector Overview, Egypt. Food and Agriculture
Organisation, Rome. FAO. 2000. Water and agriculture in the Nile basin, Nile Basin Initiative Report to
ICCON, Background Paper prepared by FAO, Land and Water Development Division, Rome.
FAO, 1997. Irrigation potential in Africa: A basin approach.
http://www.fao.org/docrep/w4347e/w4347e00.htm#Contents FAOSTAT (Food and Agriculture Organisation of the United Nations statistical
database). 2006. FAOSTAT database online. http://faostat.fao.org. Farmer, 1988. Seasonal forecasting of the Kenya coast short rains 1901-1984.
Journal of Climatology Vol. 8. Pp 489-497. Fischer, G.; van H. Velthuizen, M. Shah, and F. Nachtergaele. 2002. Global agro-
ecological zones assessment for agriculture for the 21st Century: Methodology and results. Research Report 02. Luxemburg, Austria: International Institute for Applied Systems Analysis.
Fischhendler, I. (2008a) Ambiguity in Transboundary Environmental Dispute
Resolution: The Israeli—Jordanian Water Agreement. Journal of Peace Research, 45(1), 91-109.
Fraisse, C.W., K.A. Sudduth, and N.R. Kitchen, 2001. Delineation of site-specific
management zones by unsupervised classification of topographic attributes and soil electrical conductivity. Transactions of American Society of Agricultural Engineers, 44(1): 155-166.
Gamal, K.A.E.M. 2009. Impact of policy and institutional changes on livelihood of
farmers in Gezira scheme of Sudan, MS thesis submitted to University of Gezira, Sudan and study supported by International Water Management Institute as a part of Nile Basin Focal Project.
General Authority for Fish Resources Development. 2004. The 2003 Statistics
Yearbook. Ministry of Agriculture Publications. Gerrits, A.M.J., H.H.G. Savenije, L. Hoffmann, and L. Pfister , 2007. New
technique to measure forest floor interception – an application in a beech forest in Luxembourg, Hydrology and Earth System Sciences, 11, 695–701
GRUMP. 2005. Global Urban-Rural Mapping Project (GRUMP). Dataset available at
http://beta.sedac.ciesin.columbia.edu/gpw/# Guvele, Cesar A. and, Allen M. Featherstone. 2001; Dynamics of irrigation water
use in Sudan Gezira scheme, Water Policy Journal, 2001.

Bibliography CPWF Project Report
Page | 101
Hazell P. and S. Wood 2008. Drivers of change in global agriculture. Phil. Trans. R. Soc. B (2008) 363, 495–515
Hefny, M., and Salah El-Din Amer. 2005. Egypt and the Nile Basin. Aquatic
sciences - research across boundaries, Volume 67, Number 1 / March, 2005Hickley, P. & R. G. Bailey, 1986. Fish communities in the perennial wetland of the Sudd, southern Sudan. Freshwat. Biol. 16: 695–709, Netherlands.
Howell, P., M. Lock, and S. Cobb. 1988. The Jonglei Canal. Impact and
opportunity. Cambridge Univ.Press. pp 537. Hughs, R.H. and J.S. Hughs, 1992. A Directory of African Wetlans. IUCN,
Gland/UN Environment Programme, Nairobi/WCMC, Cambridge. Hurst, H. E., and P. Phillips, 1931. General description of the Basin, meteorology,
topography of the White Nile Basin. The Nile Basin, vol. I, Government Press, Cairo.
Hurst, H.E. (1952, 1957 2nd enlarged ed.). The Nile. Constable. Lond (2nd Ed) Hurst, H. E. and R. P. Black. 1931. General description of the Basin, meteorology,
topography of the White Nile Basin. The Nile Basin, vol. I, Government Press, Cairo.
ILRI (International Livestock Research Institute). 2002. Livestock—A pathway out
of poverty: ILRI’s strategy to 2010. ILRI, Nairobi, Kenya. Intergovernmental Panel on Climate Change (IPCC); 2007. "Climate Change
2007", the IPCC Fourth Assessment Report. http://www.ipcc.ch/publications_and_data/publications_and_data.htm.
Iyob, B., I. Fischhendler, M. Giordano, and A.T. Wolf. 2009. From water sharing and cost sharing to benefit sharing principle: Implications to the Nile basin.
Jonglei Investigation Team. 1954. The equatorial Nile project and its effects in the
Anglo-Egyptian Sudan, Vols. 1–4. Sudan Government, London. Kruska, R., R. Reid, P. Thornton, N. Henninger, K. Kristjanson. 2003. Mapping
livestock-oriented agricultural production systems for the developing world. Agricultural Systems 77, 39–63.
Kinyangi, J., M. Herrero, T. Ouna, A. Notenbaert, and D. Peden. 2009-10-19.
Water and poverty analysis in the Nile basin. Kull, D. 2006. Connection between Recent water level drop in Lake Victoria Dam
Operation and Drought. 15 pp. http://www.irn.org/programs/nile/pdf/060208vic.pdf
Lake Victoria Fisheries Organization (LVFO), 2006. www.lvfo.org Mapedza, E., T. Tafesse, A. Haileslassie, and S. B. Aulachew, 2009. Benefit
sharing and architecture of transboundary water institutions: A mechanism for sustainable water governance in the Blue Nile. Report submitted to International Water Management Institute as a part of Nile Basin Focal Project.

Bibliography CPWF Project Report
Page | 102
Ministry of Agriculture and Land Reclamation. 1996. National Agriculture Development Strategy, 1997–2017.
Mohamed, Gamal K. A. E. 2009. Impact of policy and institutional changes on
livelihood of farmers in Gezira Scheme-Sudan. MS Thesis, University Gezira.
Mohamed, Y.A., D. Molden, and W. Bastiaanssen. 2009. Water accounting at a
river basin scale: the Nile basin case, Agricultural Water Management special issue Water Accounting, (in review).
Mohamed, Y.A., B.J.J.M. van den Hurk, H.H.G. Savenije, and W.G.M.
Bastiaanssen. 2005. The Nile Hydro-climatology: Results from a regional climate model, Hydrology and Earth System Sciences 9, 263–278.
Mohamed, Y.A., B.J.J. van den Hurk, M.,H.H.G. Savenije, and W.G.M.
Bastiaanssen. 2005. Impact of the Sudd wetland on the Nile hydroclimatology. Water Resources Research vol. 41, w08420.
Mohammad J., N. Asfaw, and G. Taye. 2007. Geographic distributuio of cattle and
shoats populations and their market supply sheds in Ethiopia, Discussion paper No. 2, Improving Market Opportunities, International Livestock Research Institute
Molden, D., and T.Y. Oweis. 2007. Pathways for increasing agricultural water
productivity. In Comprehensive Assessment of Water Management in Agriculture ed. Water for Food, Water for Life. A Comprehensive Assessment of Water Management in Agriculture. London, Colombo, Earthscan, International Water Management Institute, pp.279-310. Available from: <http://www.iwmi.cgiar.org/assessment/> [Accessed 26 May 2008].
Molden D., H. Murray-Rust, R. Sakthivadivel, and I. Makin. 2003. A water-
productivity framework for understanding and action. In Water Productivity in Agriculture: Limits and Opportunities for Improvements, ed. Kijne W., R. Barker, and D. Molden. CAB International. Wallingford, UK.
Molden, D. J., R. Sakthivadivel, and J. Keller. 2001. Hydronomic zones for
developing basin water conservation strategies. Colombo, Sri Lanka: IWMI. v, 30p.; (IWMI Research Report 56).
Molden, D., 1997. Accounting for water use and productivity. SWIM Paper 1,
International Water Management Institute, Colombo, Sri Lanka. Mpairwe, D., D. Mutetikka, G. Kiwuwa, S. Mugerwa, B. Owoyesigire, E. Zziwa,
and D. Peden. 2008. Options to improve livestock-water productivity (LWP) in the cattle corridor within the White Nile sub-basin in Uganda. (In progress)
Namara, R.E., I. Hussain, D. Bossio, and S. Verma. 2007. Innovative land and
water management approaches in Asia: Productivity impacts, adoption prospects and poverty outreach. Irrigation and Drainage Journal, Vol.6, pp 335-348.
Narayanamoorthy, A. 2007. Tank irrigation in India: a time series analysis. Water
Policy Vol. 9 No. 2 pp 193–216.

Bibliography CPWF Project Report
Page | 103
Nile Basin Development Forum (NBDF), 2008. http://www.nilebasin.org/NBDF2008/doc/conference_program_ver3.pdf
Nile Basin Initiative (NBI). 2001. Transboundary Environmental Action Project.
Project Implementation Plan. Nile Basin Initiative, pp182 Nile Basin Initiative (NBI). 2009. Community Watershed Management Project
Implementation Manual. Nile Basin Initiative, pp127. NEDECO. 1998. Tekeze River Basin Integrated Development Master Plan Project,
Sectorial Reports – Water Resources, Volumes VI, VII and X – Climatology, Hydrology, and Dams, Reservoirs, Hydropower and Irrigation Development. Ministry of Water Resources, Addis Ababa, Ethiopia.
Nicholson, S.E. 1996. A review of climate dynamics and climate variability in
eastern Africa, in The limnology, climatology and paleoclimatology of the East African lakes, edited by T. C. Johnson and E. Odada.
Notenbaert, A. 2009. The role of spatial analysis in livestock research for
development. GIScience & Remote Sensing 46(1), 1–11. DOI: 10.2747/1548-1603.46.1.1.
Notenbaert, A., R. Kruska, P. Thornton, and M. Herrero. 2009. A production
system map for the Nile basin. Excerpted from Notenbaert et al. 2009. Classifying livestock production systems for targeting agricultural research and development in a rapidly changing world. Targeting and Innovation Discussion paper 12 ILRI, Nairobi, Kenya.
Nyeko, J. I. 2006. Overview of fisheries and aquaculture resources: Uganda.
ICEIDA. Omamo, S.W.X., S. Diao, J. Wood, L. Chamberlin, S. You, U. Wood-Sichra, and A.
Tatwangire. 2006. Strategic Priorities for Agricultural Development in Eastern and Central Africa. Washington, D.C., United States, International Food Policy Research Institute (IFPRI).
Onyango, L., B. Swallow, and R. Meinzen-Dick. 2005. Hydronomics and terranomics in the Nyando basin of Western Kenya. Proceedings of international workshop on African water laws: Plural legislative frameworks for rural water management in Africa. Gauteng, South Africa.
Oosterbaan, R.J. 1999. Hydrological and Environmental Impacts of the Irrigation
Improvement Projects in Egypt, Nile Valley and Delta. Report of a consultancy assignment to the Egyptian-Dutch Water management Panel. ILRI, Wageningen, 51 pp.
Otte M, and P. Chilonda. 2002. Cattle and small ruminant production systems in
sub-Saharan Africa - A systematic review. Food and Agriculture Organization of the United Nations.
Poverty Eradication Action Plan (PEAP). 2004. Ministry of Finance, Planning and
Economic Development, Government of Uganda, www.finance.go.ug. Peden D., Alemayehu M., Bekele B., Amede T., Faki H., Haileslassie A., Herero
M., Mapezda E., Mpairwe D., Tibin M., Taddesse G., & van Breugel P. 2009. Nile basin livestock water, productivity. CPWF Project Report Series, PN37, Colombo: CPWF.

Bibliography CPWF Project Report
Page | 104
Peden, D., Faki, H., Alemayehu, M., Mpairwe, D., Herrero, M., Van Breugel, P., Haileslassie, A., Taddesse, G. and Bekele, S. 2008. Opportunities for increasing livestock water productivity in the Nile River Basin. In Fighting Poverty Through Sustainable Water Use: Volumes I, Proceedings of the CGIAR Challenge Program on Water and Food 2nd International Forum on Water and Food, Addis Ababa, Ethiopia, November 10—14, 2008.
Peden, D., A. Freeman, A. Astatke, and A. Notenbaert. 2007. Investment options
for integrated water-livestock-crop production in sub-Saharan Africa. Nairobi, Kenya, International Livestock Research Institute.
Peel, M.C., B.L. Finlayson, and T.A. McMahon. 2007. Updated world map of the
Köppen-Geiger climate classification. Hydrology and Earth System Sciences, 11: 1633-1644.
Phillips, D., M. Daoudy, S. McCaffrey, J. Öjendal, and A.R. Turton. 2006. Trans-
boundary water cooperation as a tool for conflict prevention and for broader benefit-sharing. Stockholm: Ministry of Foreign Affairs.
Qaddumi, H. 2008. Practical approaches to transboundary water benefit sharing. Overseas Development Institute (ODI) Working Paper 292. London: ODI.
Ramsar Convention Bureau, 1997. The Ramsar Convention Manual: A Guide to
the Convention on Wetlands (Ramsar, Iran, 1971), 2nd ed. Ramsar Convention. RCB, The Gland 170pp.
Sadoff, C.W. and D. Grey. 2002. Beyond the river: the benefits of cooperation on
international rivers. Water Policy, 4(5), 389-403.
Schepers, A.R., J.F. Shanahan, M.A. Liebig, J.S. Schepers, S.H. Johnson, and Jr. A. Luchiari. Appropriateness of management zones for characterizing spatial variability of soil properties and irrigated corn yields across years. Agronomy Journal, 96: 195-203.
Scheren, P.A., H.A. Zanting, and A.M.C. Lemmens, 2000. Estimation of water
pollution sources in Lake Victoria, East Africa: Application and elaboration of the rapid assessment methodology. Journal of Environmental Management. Vol 58, Issue 4, April 2000.
Seré C., Steinfeld H. 1996. World livestock production systems: current status,
issues and trends. Animal Production and Health Paper No. 127. FAO, Rome.
Shahin, M. 1985. Hydrology of the Nile Basin. Developments in water science; pp.
575, Elsevier, Amsterdam. Silsbe, G. M. 2004. Phytoplankton production in Lake Victoria, East Africa. A
thesis presented to the University of Waterloo, Canada. Smith, M., 1993. CLIMWAT for CROPWAT - A climatic database for irrigation
planning and management, FAO Irrigation and Drainage Paper No 49, pp. 113, FAO, Rome.
Stockholm Environment Institute (SEI), 2007. WEAP: Water Evaluation and
Planning System – User Guide. Stockholm Environment Institute, Boston, USA.

Bibliography CPWF Project Report
Page | 105
Strzepek, K., D. Yates, G. Yohe, R. Tol, and N. Mader. 2001. Constructing not implausible Climate and Economic Scenarios for Egypt, Integrated Assessment, 2, 139–157, 1409.
Sutcliffe,J. V. and Y. P. Parks, 1999. The Hydrology of the Nile, IAHS Special
Publication no. 5, IAHS Press, Institute of Hydrology, Wallingford, Oxfordshire OX10 8BB, UK
Swenson, S. and J. Wahr. 2009. Monitoring the water balance of Lake Victoria,
East Africa, from space. Journal of Hydrology 370, 163–176. Tafesse, T. 2009. Benefit-sharing framework in transboundary river basins: the
case of the Eastern Nile Sub Basin. In Awulachew, Seleshi Bekele; Teklu Erkossa, Vladimir Smakhtin, Ashra Fernando (Comps.). Improved water and land management in the Ethiopian highlands: its impact on downstream stakeholders dependent on the Blue Nile. Intermediate Results Dissemination Workshop held at the International Livestock Research Institute (ILRI), Addis Ababa, Ethiopia, 5-6 February 2009.
TAMS, 1997. Baro-Akobo River Basin Integrated Development Master Plan Study,
Volume V – Pre-feasibility Studies, Annex 1 – Water Resources, Part 1&2 – Climatology and Hydrology. Ministry of Water Resources, Addis Ababa, Ethiopia.
Teketel, A. 2009. The socio-economic and institutional dynamics of watershed
management: The case of Kanat and Magera micro-watersheds. MSc thesis submitted to Addis Ababa University. Study supported by IWMI as a part of Nile BFP project.
Tesfaye, T. 2001. The Nile Question: Hydropolitics, legal wrangling, modus
vivendi and perspective. London, Transaction.
Tessera, A. 2006. The Eastern Nile Basin: Some problems demanding international cooperation. Nile Basin Development Forum, Addis Ababa, Ethiopia, Addis Ababa, Ethiopia, 30 November to 2 December 2006.
Thornton, P.K., P.G. Jones, T. Owiyo, R.L. Kruska, M. Herrero, P. Kristjanson, A.
Notenbaert, Bekele, N. and A. Omolo. 2006. Mapping climate vulnerability and poverty in Africa. Report to the Department for International Development. Nairobi, Kenya, International Livestock Research Institute.
Turton, A.R. 2008. Reflections from South Africa on a possible benefit-sharing
approach for transboundary waters. Water Alternatives 1(2), 180-200. Twongo, T. 2001. The Fisheries and environment of Kyoga Lakes. Fisheries
Resources Research Institute (FIRRI), Jinja, Uganda. UNDP. 2008. Egypt Human Development Report: Egypt’s Social Contract: The
Role of Civil Society. United Nations Development Programme and Institute of National Planning, Cairo, Egypt.
Uganda Bureau of Statistic (UBOS). 2007. www.ubos.org. UNEP. 2007. Sudan Post-Conflict Environmental Assessment report. United
Nations Environment Programme (UNEP). Available from: <http://www.unep.org/sudan/> [Accessed 11 September 2008].

Bibliography CPWF Project Report
Page | 106
van Breugel P., M. Herrero, J.A. van de Steeg, and D. Peden. 2009. Spatial variation and management of livestock water productivity in the Nile Basin. PDF file download.
WaterWatch. 2008. Land and water conditions for assessing the agricultural potential in the Tana–Beles Growth Corridor. Wageningen, The Netherlands.
Walta, 2008. www.waltainfo.com Lancha Addis Ababa Ethiopia. Weligamge, P. and A. Mukherji (2009), Agricultural development in Sub Saharan
Africa and Nile Basin countries. Report written as a part of the Nile BFP project.
Westman, M. 2009. Review of past agreements and indicative recommendations
of institutional arrangement in Nile. Consultancy report submitted to International Water Management Institute as part of the Nile BFP.
WEMA Consult. 2009). Study on institutional arrangement for the management of
Lake Victoria. Consultancy report submitted to International Water Management Institute as a part of Nile BFP.
Williamson, Oliver E. 1975. Markeh and hierarchies: Analysis and implications.
New York: Free Press, 1975.
Williamson, Oliver E. 1985. The Economic Institutions of Capitalism. New York: Free Press, 1985.
Woldeamlak, Bewket, and L. Stroosnijder. 2003. Effects of agroecological land
use succession on soil properties in Chemoga Watershed, Blue Nile basin, Ethiopia. Geoderma 111: 85-9.
Woldeamlak, Bewket. 2003. Towards Integrated Watershed Management in
Highlands of Ethiopia: The Chemoga Watershed Case Study. Tropical Resource Management Papers No. 44. Wageningen Agricultural University. The Netherlands.
World Bank. 2008. World Development Report 2008: Agriculture for
Development, Washington DC, USA. World Bank. 2008. Institutional Strengthening Project (NBI-ISP) - Project Appraisal Document. Unpublished document. World Bank. 2006. Africa Development Indicators 2006. International Bank. World Bank. 2005. Regional Power Trade Project – Project Appraisal Document.
Washington DC: World Bank.
World Bank/Netherlands Water Partnership Program; 2006; (http://www-esd.worldbank.org/bnwpp/index.cfm?display=display_activity&AID=463&Item=7).
World Development Poverty Indicators. 2002, 2003, 2005, 2006, 2007. World
Bank. web.worldbank.org/WBSITE/EXTERNAL/COUNTRIES World Development Indicators (WDI) 2006. Washington, D.C., World Bank.
Available from: <http://devdata.worldbank.org/wdi2006/contents/home.htm> [Accessed

Bibliography CPWF Project Report
Page | 107
23 October 2008]. World Development Report (2008), World Bank. Yao, H, and Georgakakos, A., 2003. Nile Decision Support Tool (Nile DST): River
Simulation and Management. Georgia Water Resources institute, Atlanta, USA.


Participants CPWF Project Report
Page | 109
PROJECT PARTICIPANTS Abuto, Teketel - Student
Atanasio Mustafa Abin, Samuel - Student
Awadalla, Sirein- Student
Awulachew, Seleshi Bekele IWMI Addis
Babiker, Abdella – ENTRO
Bastiaanssen, Wim - Contributor
Cascão, Ana – Contributor
Conniff, Karen –IWMI
Cook, Simon - CPWF
Danso, George – Student
Demise, Seyoum Solomon IWMI Addis
El Atfy, Hussein - Contributor
El-Moghraby, Asim - Contributor
El-Naggar, Gamal Othman – World Fish
Erkossa, Teklu – IWMI, Addis
Herrero, Mario - ILRI
Iyob, Biniam - Student
Karimi, Poolad - IWMI
Kinyangi, James - ILRI
Liabwel, Isaac –Ministry of Water Resources South Sudan
Lodu Lokulu Loron, Charles - Student
Magzoub, Gamal Khalid - Contributor
Mapedza, Everisto – IWMI Addis
Moghraby, Asim I. – Contributor
Mohamed, Yasir - HRS/UNESCO-IHE
Molden, David - IWMI
Mpairwe, Denis – Makarere Mukherji, Aditi - IWMI
Negash, Tewodros - Student
Neguid, Mohamed Abdel –CPWF Basin Coordinator
Notenbaert, An - ILRI
Osman, Abd El Nassir
Peden, Don - ILRI
Rebelo, Lisa-Maria - IWMI Addis
Sendama, Antoine - NELSAP
Tesemma, Zelalem K - Student
van Breugel, Paulo - ILRI
Westman, Moa - Contributor
WIMA Consultants - Contributors
Wondimu, Hamere - NBI Deputy Director: Uganda Yilma, Aster Denekew – IWMI, Addis


Appendices CPWF Project Report
Page | 111
Annex A - Poverty
Poverty Methods, Tables and Figures
Table A-1. Descriptions and sources of data for mapping poverty in the Nile basin
Country Variable Data description and
source
Notes
Burundi Poverty Provinces - 1997 : World Bank Poverty Assessment -1999
Data from “Prospects for Social Protection in a Crisis Economy
Egypt Poverty/household survey
Governorates: World Bank 2002 Lower Admin data available in PDF format (to be entered)
Social and Economic Development Group. Ministry of Planning, Middle East and North Africa Region, Government of the Arab Republic of Egypt
Ethiopia Household Survey Provinces – 1999/2000: MOFED, 2001 in World - Mariam and Mohamed, 2003. Accessible
Contents of Ethiopia Rural Household Survey (ERHS)
Kenya Poverty maps, 1999,2003
Poverty at Locations level: 1999 Source: Kenya Bureau of Statistics
Kenya welfare monitoring survey
Uganda (District and count level)
Poverty, 2002 Poverty at Region, Districts, County, Sub-county levels – 2002 Uganda Bureau of Statistics
Uganda Bureau of Statistics
Rwanda Poverty Poverty at Province level- 1997 National Institute of statistics of Rwanda, 2007
Sudan HPI Vulnerability at Provincial level
Calculated from food insecure households
Tanzania (REPOA)
Poverty, 2005 Poverty at Districts level – 2001 REPOA,2001 in R & AWG,2005
Tanzania Population and Housing Census Report
Data for DRC Congo are not available and have not been included in the present poverty mapping exercises

Appendices CPWF Project Report
Page | 112
Table A-2. Indicators for mapping hotspots of water-related risks
Water-related risk
Data Source Resolution Description Some potential effects
Drought (dryness)
Thornton et al. 2006
1km Number of days per year with water availability to support crop growth
Loss of crops and livestock, changing terms of trade, less access to water, spreading disease
Floods Center for Hazards and Risk Research (Dilley et al. 2005)
1º Counts of extreme flood events
Loss of crops and livestock , destroying physical assets, isolating communities, spreading disease
High CV in the rainfall
Thornton et al, 2006
18.4 km Inter-annual coefficient of variation of rainfall
Variability in food production, changing water availability
Water stress FAO Sub-basin Internally renewable water sources plus the natural inflow (in mm)
Conflict, reduced productivity, hygiene and disease
Population GRUMP 1 km Population distribution, current conditions 2000 (%)
Increased pressure on the water resources resulting in water scarcity and soil degradation
Conflicts Variety of country reports
District Conflict data comprised of water and land disputes,
Governance, interruption of agricultural production and services, lack of functioning institutions
Source: Adapted from Thornton et al., 2006; Notenbaert et al., unpublished data

Appendices CPWF Project Report
Page | 113
Vulnerability methods
Each of the three vulnerability layers was strictly composed of variables related to water, social and bio-physical risks. Because each of these variables were measured on a different scale, it was first necessary to convert each of them into an index that ranged from 0 to 1. The indices were summed together and depending on the number of variables used, the higher the index, the higher the vulnerability of a place. We adopted the calculation of the indices using the formula: Vi = (Xi – Xi, min) / (Xi, max – Xi, min) With Vi = standardized indicator i Xi = the indicator before it is transformed Xi, min = the minimum score of the indicator i before it is transformed Xi, max = the maximum score of the indicator i before it is transformed All data were transformed into a relative score ranging from 0 to 1 which represented lowest to highest probabilities of risk respectively. However, the inverse applied to a number of variables mentioned below, where least values meant higher risk e.g. dryness indicator, where lower number of growing days means higher stress. Therefore, such indicators were further transformed using the formula 1―Xi. The indices were then grouped together depending on the number of quality datasets available and used in each the three outputs (5, 5 and 5 for social, water and bio-physical risks respectively). The indicators in Table A-3 were combined in several GIS layers, using overlay tool in an ArcGIS 9.3. The layers are first standardized before they are combined since they are not of the same units and a risk index for each of the layers established. We then mapped hotspots of vulnerability and water related risks in the three production systems. Table A-3. Data Sources for Indicators of biophysical shocks Bio-Physical Data Source Description
Human population density
CIESEIN/GRUMP Rural and urban population density ( 2000) at different admin levels
Market access JRC’s (2006) Global population, accessibility to places with a population of 50,000
TLU ILRI global dataset (Russ Kruska)
Crop suitability FAO http://www.fao.org/ Suitability of different areas for crop production as determined by soil suitability
IRWR FAO http://www.fao.org/ Internal water resources by sub-basin. FAO's information System on Water and Agriculture
As shown on Table A-4, illnesses and injuries in a family simultaneously reduce income due to lost time working and increased curative health treatment expenditures (Alderman, 2007). Human diseases undermine the capacity of those who are ill as well as their caretakers to pursue livelihoods. It significantly reduces labor productivity and often results in the sale of productive assets in order to pay for treatment. In the short and medium term, the epidemic impoverishes households through: • loss of labor in agriculture and other livelihood activities;

Appendices CPWF Project Report
Page | 114
• increased cost of health care • diminished capacity to care for children and other vulnerable individuals; and • erosion of the asset base. Table A-4. Data Sources for Indicators of social risks Social risks Data Source Resolution Description Malaria MARA/ARMA 1 km Suitability for Malaria transmission
(0 to 1)
HIV/AIDS WRI,2005 Country level
Incidence (%) in sub-Saharan & N.africa.xls
Stunted growth http://ddp-ext.worldbank.org/ext/DDPQQ/report.do?method=showReport.
Sub- Saharan Africa Malnutrition prevalence, height for age (% of children under 5). N. Africa Malnutrition prevalence, height for age (% of children under 5 years)
Under-weight CIESIN, 2005
http://www.ciesin.columbia.edu/povmap.
Table A-5. Data Sources for Indicators of water related hazards Water- related risks
Data Source Resolution Description
Drought (dryness) Thornton et al. 2006 1km Number of days per year with water availability to support crop growth
Floods Center for Hazards and Risk Research – Dilley et al. (2005)
1º Counts of extreme flood events
High CV in the Rainfall
Thornton et al, 2006 18.4 km Inter-annual coefficient of variation of rainfall
LGP Change 2000 - 2030
Thornton et al, 2006
18.4 km Percentage change of length of growing period (in days) between 2000 and 2030
Note: We use four indicators (CV Rain, LGP (-ve only), Drought and flood layers. Each of the indicator variables has a risk probability between 0 and 1. Meaning the lowest value of risk will be 0 and the highest 4. My scale was 0 -0.8 = very low; 0.8 -1.8 = low; 1.6- 2.4 = medium; 2.4 -3.2 = high; 3.2 – 4= very high Table A-6. Level of risk from biophysical indicators
Bio-physical Indicators
Level of risk
Renewable water resources (mm3/year)
Market access (hours)
TLU (number/km2)
Population density(number/km2)
High 10,000 <1 >40 <20
Medium 1041 - 8668 1 to 4 20 - 40 20 to 100
Low 0 - 1041 >4 0 to 9 100 to 1000

Appendices CPWF Project Report
Page | 115
Figure A-1. Human development Index for Nile Basin Countries
0.15
0.28
0.40
0.53
0.65
0.78
0.90
1972 1978 1984 1990 1996 2002 2008
Year
Hum
an d
evel
opm
ent
inde
xEgyptSudanKenyaUgandaEthiopiaTanzaniaRwandaaverage, all countries
Figure A-2. Hotspots of poverty incidence (>50%) in the cereals and legume systems

Appendices CPWF Project Report
Page | 116
Figure A-3. Hotspots of poverty incidence (>50%) in the tree crop and root crop systems

Appendices CPWF Project Report
Page | 117
Figure A-4. Hotspots of poverty incidence (>50%) in mixed irrigated systems

Appendices CPWF Project Report
Page | 118
Figure A-5. Framework linking vulnerability, water and poverty
PovertyExposure f (physical,
economic water scarcity).
Goal: satisfy consumption,and economic
well-being
VulnerabilityExposure f (natural, physicalhuman, social andfinancial capital).Goal: secure assets to cope withvariable water resourcesand water-relatedrisks
1b. Water: Naturalendowment indicatorse.g-ground water-rainfall, evapotransp.-surface inflow-return flow-reservoir
2. Poverty: Socioeconomic Indicators/proxy e.g-household incomeand consumption
-child mortalitymalnutrition-market access, input useLand holding-Human poverty index
3b. Vulnerability:Biophysical/socialindicators/proxy e.g-agric. (rain-fed/irrigated)-livestock productivity-crop productivity/suitability-livelihood capital assets-population attributes
WaterExposure f (water access, availability,productivity). Goal: adaptto new and emerging basin water conditions
SVi
WVi
WPi
Water poor, 1, 2
Socialvulnerability 2, 3
Watervulnerable 1, 3
Vulnerability to Water-Poverty Mapping indicators Basin hotspots
Spatial analysesBasin extrapolationusing models
Sub-basin analysesusing statistical
tools
CR
OP
-LIV
ES
TO
CK
PR
OD
UC
TIO
N S
YS
TE
MS
3a. Vulnerability: water-related risksindicators/proxy e.g
-drought index-flood severityHunger and malnutrition
1a. Water: Accessscarcity indicatorse.g-physical distances-infrastructure.-rights of use

Appendices CPWF Project Report
Page | 119
Figure A-6. Mapping biophysical vulnerability, Nile basin

Appendices CPWF Project Report
Page | 120
Figure A-7. Mapping social vulnerability, Nile basin

Appendices CPWF Project Report
Page | 121
Annex B - Water Accounting Figure B-1. Seasonal variability
- mean annual (in circles) in km3/year, and monthly flows in Mm3/month at key stations along the Nile, for the period ~ 1910-1995; (data source Sutcliffe and Parks 1999).

Appendices CPWF Project Report
Page | 122
Precipitation map of the Nile Basin Figure B-2. Mean annual rainfall
In mm/yr. Mean monthly rainfall P (▬ Blue color), and potential evapotranspiration ET05
(▬ Red color) in mm/day at key stations in the Nile basin (source: Smith, 1993; Mohamed et al., 2006).
5 ET0 is the evapotranspiration from a hypothetical grass crop 12 cm high with no moisture constraints, surface resistance of 70 s/m and an albedo of 0.23.
>1600
1400 - 1600
1200 -1400
1000 - 1200
200-400
400 - 600
600 - 800
800 - 1000
< 25
25 - 50
50 - 100
100 - 200

Appendices CPWF Project Report
Page | 123
Land use Land cover map
Figure B-3. Land Use cover determination.

Appendices CPWF Project Report
Page | 124
Case Study - Sudd Wetland
Figure B-4. Image of the Sudd Wetland from Space showing Jonglei Canal
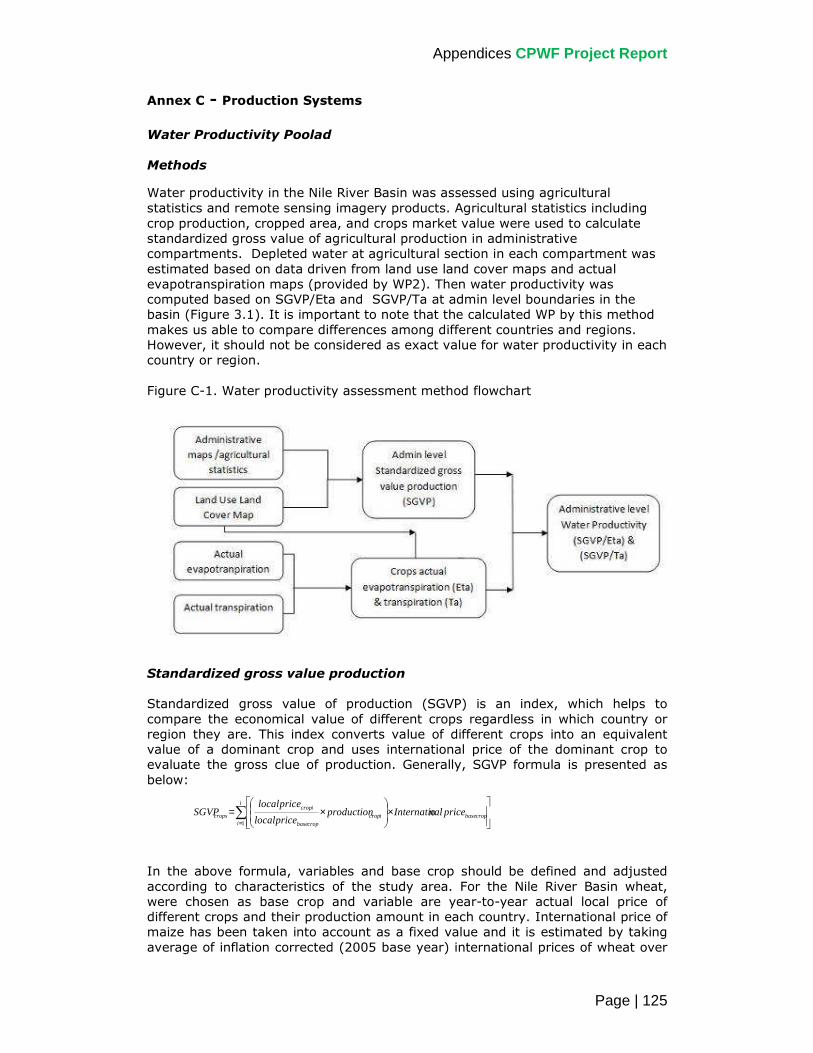
Appendices CPWF Project Report
Page | 125
Annex C - Production Systems
Water Productivity Poolad
Methods
Water productivity in the Nile River Basin was assessed using agricultural statistics and remote sensing imagery products. Agricultural statistics including crop production, cropped area, and crops market value were used to calculate standardized gross value of agricultural production in administrative compartments. Depleted water at agricultural section in each compartment was estimated based on data driven from land use land cover maps and actual evapotranspiration maps (provided by WP2). Then water productivity was computed based on SGVP/Eta and SGVP/Ta at admin level boundaries in the basin (Figure 3.1). It is important to note that the calculated WP by this method makes us able to compare differences among different countries and regions. However, it should not be considered as exact value for water productivity in each country or region. Figure C-1. Water productivity assessment method flowchart
Standardized gross value production
Standardized gross value of production (SGVP) is an index, which helps to compare the economical value of different crops regardless in which country or region they are. This index converts value of different crops into an equivalent value of a dominant crop and uses international price of the dominant crop to evaluate the gross clue of production. Generally, SGVP formula is presented as below:
In the above formula, variables and base crop should be defined and adjusted according to characteristics of the study area. For the Nile River Basin wheat, were chosen as base crop and variable are year-to-year actual local price of different crops and their production amount in each country. International price of maize has been taken into account as a fixed value and it is estimated by taking average of inflation corrected (2005 base year) international prices of wheat over
∑=
×
×=
i
icropbaseicrop
cropbase
icropcrops pricenalInternatioproduction
pricelocal
pricelocalSGVP
1

Appendices CPWF Project Report
Page | 126
the period of 1990 to 2005 (estimated value is 212.5 US$/ ton). Therefore, the formula is defined as follows:
Livestock Water Use and Productivity Tables and Figures
It is livestock densities on the one hand and water and feed availability on the other hand that largely determine the ratio of livestock water use vs. total water use (given in Figures C-2 & C-3). Figure C-2. Figure C-3
Figure C-2 and Figure C-3. The number of months the AET is higher than the water required to produce livestock feed. The water requirements estimates exclude non-consumable biomass but including water for residues, small map in C-3 shows density of cattle in the basin. Areas unsuitable for ruminants and the non-classified livestock production systems were masked out (white areas).
∑=
×
×=
i
iicrop
wheat
icrop
crops productionpricelocal
pricelocalSGVP
1
5.212

Appendices CPWF Project Report
Page | 127
LWP is defined as the ratio of net benefits derived from livestock to the amount of water depleted in producing them. Four basic strategies can help increase LWP. They are:
• Strategic sourcing of animals feeds whereby livestock keepers select feed sources production of which requires relatively little water.
• Enhancing animal productivity and value through application of already available animals sciences and marketing options
• Conserving water resources through better land and water management associated with animal keeping.
• Strategic spatial allocation of animal, land and water resources across landscapes to avoid overgrazing near watering points and underutilization of feed far from watering points.
These four strategies often need to be applied simultaneously. Doing so, can easily increase LWP by more than 100% throughout most of the Nile basin, but detailed approaches will vary from one place to another. Methods
Sustainable water management requires long-term inflow and depletion to be in balance preferably with sufficient storage to offset short-term scarcity due to droughts. Once depleted, water is no longer available and has no further value within the system. Water contamination is a depletion process that makes water less valuable to future users even though it may remain within the system. Estimating livestock-related water inflow, depletion, and storage is a primary requirement of assessing LWP (Figure C-4). Figure C-4. Livestock water productivity framework.

Appendices CPWF Project Report
Page | 128
Figure C-5. Total annual livestock water use in a normal year.
Total annual livestock water use in a normal year (Figure C-5); (a) Total annual livestock water use (cattle, goats and sheep) expressed as fraction of the total annual evapotranspiration. This excludes water for residues and crop by-products; (b) The same but accounting for water for non-consumable biomass and including water for residues; (c) Like b, but assuming a maximum permissible off take whereby total available AET is decreased with the same fraction as the fraction of non-permissible off take. Case Study – Rainfed Agriculture – Blue Nile farming systems
The largest proportion of cropping area (over 80%) is cereal based cultivation, sub divided into single cropping, double cropping and shifting cultivation systems. A relatively smaller proportion of the area (about 6%) is double crop cereal cultivation, which consists of two rainfed cropping seasons per annum if possible. Barley based production dominates the double cropping system and maize, barley, tef and sorghum are used in the single crop cereal cultivation system. Maize based and sorghum based shifting cultivation systems, now declining some, are practiced in large areas (over 18%), especially in the western and southern lowlands of the basin. Moisture availability determined by rainfall and the soil storage capacity is an important factor for crop and livestock productivity in the basin, altitude with variable temperatures also determines the type of crops grown and livestock to be kept. Thus the highland with a temperate to cool climate regime allows for the growth of the bulk of the temperate zone crops, such as wheat and barley. Sorghum and maize become more prevalent in the lowlands.

Appendices CPWF Project Report
Page | 129
Figure C-6. Classification of farming systems in Blue Nile highlands

Appendices CPWF Project Report
Page | 130
Irrigated Cropping Systems
Crop Water Productivity towards Future Sustainable Agriculture in Egypt Table C-1. Crop water productivity for main winter field crops in old and new lands under different irrigation methods.
Wheat Long Clover Faba bean Sugar beat
Crop Old
Land New Land
Old Land
New Land
Old Land
New Land
Old Land
New Land
Irrigation Method Flood Sprinkler Flood Sprinkler Flood Drip Flood Drip Water Requirement (CM/Feddan) 1677 1751 2773 2608 1371 1008 2007 1415 Total Production (Ton/Feddan) 3.41 2.48 30 26 1.4 1.55 25 19 Net Return (L.E/Feddan) 5,850 3,054 1,056 950 1000 1,732 779 779 Water Productivity Indicators: water Unit Productivity (Kg/CM) 1.97 1.37 10.82 9.97 1.02 1.54 12.46 13.43 Water Unit Net Return (L.E/CM) 3.49 1.74 0.38 0.36 0.73 1.72 0.39 0.55
Source: - Calculated from the survey data of agricultural year 2007/2008. Central agency for Public Mobilization and Statistics, Bulletin of irrigation and water requirement, 2004.
Table C-2. Crop Water Productivity for main summer field crops in old and new lands under different irrigation methods.
Maize Rice Cotton Sugarcane Onion
Crop Old
Land New Land
Old Land
New Land
Old Land
New Land
Old Land
New Land
Old Land
New Land
Irrigation Method Flood Drip Flood 0 Flood 0 Flood Drip Flood Drip Water Requirement (CM/Feddan) 3914 2171 5821 0 3102 0 8854 0 3658 0 Total Production (Ton/Feddan) 4.37 2.85 4 0 1.26 0 51 46 15 10 Net Return (L.E/Feddan) 734 500 1,783 0 2,523 0 3998 2700 5898 3,796 Water Productivity Indicators: water Unit Productivity (Kg/CM) 1.58 1.31 0.69 0 0.41 0 5.8 5.11 4.10 5.88 Water Unit Net Return (L.E/CM) 0.25 0.23 0.31 0 0.81 0 0.45 0.3 1.61 2.23
Source: - Calculated from the survey data of agricultural year 2007/2008. - CAPMAS, Central agency for Public Mobilization and Statistics, Water Resources and Irrigation Bulletin, 2004.

Appendices CPWF Project Report
Page | 131
Sudan Central Belt – Livestock productivity tables & figures
Figure C-7. Spatial distribution of livestock and long-term average rainfall
#
#
#
#
#
#
#
##
#
#
#
#
#
#
#
#
#
#
#
#
##
#
#
#
# #
#
#
#
##
#
##
#
##
#
#
#
#
#
##
#
#
#
#
#
##
#
#
#
#
#
#
##
#
# #
#
# #
#
#
#
#
#
#
#
#
#
#
#
#
#
#
#
#
#
#
#
#
#
#
#
#
#
#
#
#
#
#
#
##
#
#
#
#
#
#
#
#
#
#
##
#
##
#
###
#
#
##
##
#
##
#
#
#
#
#
##
#
#
#
#
#
#
### #
##
#
##
#
#
##
#
###
##
#
#
##
#
#
###
#
#
#
#
#
#
#
#
## ##
#
#
#
#
#
#
#
#
#
#
#
#
#
# #
#
#
###
#
#
#
#
##
#
#
#
#
##
##
#
#
# #
#
#
#
#
## #
###
## #
#
#
#
#
#
#
#
#
##
#
#
#
#
#
##
##
#
#
#
#
#
##
#
#
####
#
#
##
#
##
#
#
#
#
#
#
#
#
#
#
#
#
#
#
#
# #
#
#
#
#
#
#
#
#
#
#
#
#
#
##
#
#
#
#
#
#
###
#
#
#
#
#
#
#
##
#
#
#
#
#
#
#
#
#
#
#
#
#
## #
#
##
#
#
##
#
##
#
#
#
#
#
##
#
#
##
#
#
#
#
#
#
#
#
#
#
#
#
#
#
#
##
#
#
#
#
#
# #
#
#
#
#
#
Figure C-7. Spatial distribution of livestock (TLU*), rivers and streams, and long-term average rainfall** in states’ capitals across the belt. * One dot represents 250,000 TLU of 250 kg. ** Thirty-years average, 1978-2007 (Source: Meteorological Authority – Sudan) Figure C-7 demonstrates that the Central Belt of Sudan is a major livestock-water hot spot of in the Nile Basin. Detailed analyses undertaken in the country shed further light on this important region in the Nile Basin. Figure C-8. Population, livestock and cropland growth within the central belt
1973-2007. * Cropland: 1973-1976 average versus 2003-2007 avg in million
ha.
Red Sea (82 mm)
Kassala (244 mm)
Gedarif (617 mm)
Blue Nile (696 mm)
Sennar
Khartoum (120 mm)
S. Kordofan (686 mm)
N. Kordofan (342 mm)
N. Darfur (220 mm)
W. Darfur
S. Darfur (396 mm)
Gezira (320 mm) White Nile (341 mm)

Appendices CPWF Project Report
Page | 132
The Central Belt of Sudan contains the majority of Sudan’s livestock population and is undergoing rapid human and agricultural expansions. Livestock populations are growing faster than the human population but croplands are expanding less quickly. Figure C-9. Feed balances by state across the belt. *
* Feed balances are calculated according to daily feed requirements of 6.25 kg DM/LU/day (2.5% DM of animal weight per day based on (Ahmed El-Wakil, personal contacts). Data on pasture availability are from the Range department of the Ministry of Agriculture, provided by Mr. Mohamed Shulkawi).
Inadequate management practices related to water use were evident, including congested fence areas, insufficient and inflexible shading cover according to season that affected water intake, use of immobile cement troughs in many farms inducing water losses and inflexible use, and lack of testing of water quality. On the feeding side, feed legume production was limited, most probably affecting feed quality as well as rotational aspects of farm production.

Appendices CPWF Project Report
Page | 133
Table C-3. Average daily rural drinking water availability, demand, and balance
Average daily rural drinking water availability, demand, and balance (m3/day) in different states within Sudan’s central belt, 2007.
State/Region Available
Water
Average
drinking demand
Peak
drinking demand
Balance at
average demand
Balance at
peak demand
Red Sea 126410 20075 31677 106335 94733
Khartoum 83210 24979 28083 58231 55127
Gedarif 55096 66417 85896 -11321 -30800
Kassala 43972 61441 86709 -17469 -42737
Sennar 32839 71622 92136 -38783 -59297
North Darfur 52448 87478 115947 -35030 -63499
White Nile 48184 118823 156805 -70639 -108621
Gezira 61507 140928 170469 -79421 -108963
Blue Nile 19133 151871 203441 -132738 -184309
South Darfur 51088 187184 235637 -136096 -184549
West Darfur 29495 172336 229290 -142842 -199795
Greater Kordofan 244488 335245 464446 -90757 -219959
Total 847870 1438399 1900536 -590530 -1052669
* Requirements are calculated according to Payne (1990): average demand 25, 30, 4, 4 l/day for cattle, camels, sheep, and goats; at peak summer months, respective values: 35, 65, 4.5, and 4.5 l/day. Human rural requirements are 20 l/day/person according to the Ministry of Irrigation. Source: Available water computed from data of the Ministry of Irrigation; Livestock in 2007 estimated from data of MoARF (2006).
Fisheries Lake Victoria and Kyoga
Initially, fishermen experienced very good catches of Nile perch, but the species is today over fished and the population has lessened significantly, shown in Table C-4. This over fishing has not been a disaster for the endemic populations because several endemic species that were on the brink of extinction have increased their numbers. The haplochromines, and the mixture of other fish had virtually vanished from the commercial catch. The dynamics of fish populations resulting from anthropogenic modifications of the lake ecosystems (due mostly to the introduction of exotic species and the increased nutrient levels) have not yet reached a new equilibrium. Table C-4. Lake Victoria species % and total landings from commercial fishing.
Fish Species 2000 2005 2006 Nile Perch % 42 29 24 Dagaa % 40 48 54 Haplocromines % - 13 13 Tilapia % 17 9 7 Other species % 1 <1 <1 Total Landings (tons)
620,000 804,000 1,061,107.6
Reference: LVFO, 2006.

Appendices CPWF Project Report
Page | 134
Aquaculture Egypt
The methods used to estimate net water use in pond aquaculture throughout production season at two sites in the Nile Delta (WorldFish Center pond farm, Abbassa (site 1), and at a commercial fish farm, Kafr El-Sheikh (site 2)) was to estimate water losses through different routes (seepage, evaporation, drainage etc…), then determine the amount of fish produced, and finally to estimate water consumption rates (m3) per kg fish production. Nile water is used as the source of inflow water in site 1, where water gets into ponds through channels network by gravity, for compensation of evaporation and seepage loss. In site 2, agricultural drainage water is used for pond felling using water pumps and farmer exchange 40 % of pond water once a week to support the high production system applied in the farm. In addition to tilapia, mullet and silver carp were introduced for increasing revenue and maintaining ponds water quality in site 1, while tilapia mono culture production system was applied in site 2. Figure C.10. Shows fluctuation of evaporation water loss against water temperature.

Appendices CPWF Project Report
Page | 135
Sudd Case Studies – Figures and Tables
Table C-5. Livestock production in the Sudd wetlands, estimated
COUNTY BREED NUMBER BREED NUMBER BREED NUMBER Bor Cattle 2.5million Sheep ---- Goat ---- Duk Cattle 80,000 Sheep ---- Goat ---- Nyiror Cattle 1,056,000 Sheep 750,000 Goat 1,023,000 Twic East Cattle 120,000 Sheep 25,000 Goat 35,000 Uror Cattle 300,000-400,000Sheep ---- Goat ---- Source: MARF-GOSS, 2008. Fisheries in Sudan showing Sudd region.
Table C-6. Overview of the fisheries and levels of exploitation in 2006.
Current production (t/yr) Water body Area (Km2) Current Potential %
exploitation Sudd region 30,000 32,000 75,000 –
140,000 42
Gebel Aulia 1500 1300 15,000 90 Roseires 270 1600 1700 94 Sennar 160 1100 1100 100 Khashm El Girba 125 800 800 100 Lake Nubia 1144 2000 5100 40 Red Sea 91,600 5500 10,000 56 Total 44,300 108,700
Source FAO, 2008: Fishery Country Profile
Sudd Livestock
In 2008, MARF-GOSS delegated a technical team from both the State and GOSS to assess water catchments in Jonglei state and they managed to assess only five counties. Table C-7. Livestock count by county in Sudd area
COUNTY BREED NUMBER BREED NUMBER BREED NUMBER Bor Cattle 2.5million Sheep ---- Goat ---- Duk Cattle 80,000 Sheep ---- Goat ---- Nyiror Cattle 1,056,000 Sheep 750,000 Goat 1,023,000 Twic East Cattle 120,000 Sheep 25,000 Goat 35,000 Uror Cattle 300,000-400,000Sheep ---- Goat ---- MARF-GOSS, 2008

Appendices CPWF Project Report
Page | 136
Annex D - Institutions
Table D-1. Treaties and agreements in the Nile basin
Year Name of the treaty Signatories Purpose 1890 Anglo German Treaty Great Britain and Germany To legalize that Nile
Basin was in the sphere of British influence
1891 British protocol with Italy Great Britain and Italy Italy pledged not to undertake any irrigation work which might significantly affect the flows of the Atbara into the Nile
1894 Anglo-Congolese agreement
Great Britain and Belgium
1906 Anglo-Congolese agreement
Great Britain and Belgium
1906 Anglo-Ethiopian agreement Great Britain and King Menelik of Ethiopia
1906 Tripartite agreement Great Britain, Italy and France
1919 & 1925 Anglo Italian agreement Great Britain and Italy To gain influence over Lake Tana
1929 Nile Water Agreement Egypt and Great Britain Concession to produce cotton in Sudan, Egypt to get 48 km3, Sudan 4 km and rest 32 km3 was unallocated.
1934 London agreement on Nile Great Britain and Belgium on behalf of Rwanda and Burundi
No work was permitted on Kagera basin
1938 The New Anglo-Italian Agreement of 1938
Great Britain and Italy British interest in Lake Tana, but later annulled in 1949 along with 1902 treaty
1949 Owen Falls agreement Egypt and Britain, on behalf of Uganda
To construct Owen falls in Uganda and Egypt to monitor flows downstream
1952 Egyptian Sudanese Agreement of 1952
Egypt and Sudan Sudan got concession to raise water level in Sennar Dam by 1 m
1959 Nile water apportionment agreement
Egypt and Sudan To divide water of the Nile between Sudan and Egypt. Construction of Aswan High Dam and Rosaries dam and Jonglei canal.
1967-1992 HYDROMET and UNDUGU Egypt, Sudan, Kenya, Uganda, Tanzania
1977 Kagera Basin Agreement Tanzania, Rwanda and Burundi and Uganda
1993 Framework Agreement for General Cooperation
Egypt and Ethiopia
1993 TECCONILE All countries 1999 Nile Basin Initiative All countries except Eritrea
which has a observer status
2009 Comprehensive Framework of Agreement
In process

Appendices CPWF Project Report
Page | 137
Table D-2. Shared Vision Program projects and project management unit locations.
Project Name
Location
Confidence Building and Stakeholder Involvement Uganda (NBI Secretariat)
Nile Basin Regional Power Trade Tanzania
Efficient Water Use for Agricultural Production Kenya
Nile Transboundary Environmental Action Sudan
Water Resources Planning and Management Ethiopia
Applied Training Egypt
Socioeconomic Development and Benefit Sharing Uganda
Source: Council of Ministers of Water Affairs of the Nile Basin States, 2001 The SVP is a multi-country, multi-sectoral, grant-funded program of collaborative action, exchange of experience, and analytical work that is intended to build a strong foundation for regional cooperation (World Bank 2005).
Agricultural Growth Rates
Table D-3. Growth rates in cereal and livestock output and overall growth
in agricultural GDP, 1975-2005
Country
Growth in cereal output (%)
Growth in livestock output (%)
Growth in agricultural GDP (%)
Burundi 2.2 -0.5 -0.8 DR Congo 3.7 0.6 -2.6 Egypt 5.8 6.1 4.7 Eritrea -1.6 1.3 -1.7 Ethiopia 4.2 4.7 0.1 Kenya 0.7 5.1 0.2 Rwanda 1.7 3.6 0.5 Sudan 2.8 5.5 1.4 Tanzania 2.4 3.2 1.1 Uganda 2.8 4.4 3.3 Source: Weligamage and Mukherji, 2009

Appendices CPWF Project Report
Page | 138
Table D-4. Decadal growth and sources of such growth in Nile countries, 1975-2005
Country/Period 1975-1985 1985-95 1995-2005 Burundi Positive (↑A, ↓Y) Positive (↓A, ↑Y) Positive (↑A, ↓Y) DR Congo Positive (↑A, ↓Y) Positive (↑A, ↓Y) Negative (↓A, ↓Y) Egypt Positive (↑A, ↑Y) Positive (↑A, ↑Y) Positive (↑A, ↑Y) Eritrea …… Positive (↑A, ↑Y) Negative (↓Y) Ethiopia Positive (↑A, ↑Y) Positive (↑A, ↑Y) Positive (↑A, ↑Y) Kenya Negative (↓A) Positive (↑A, ↓Y) Positive (↑A, ↑Y) Rwanda Positive (↑A, ↑Y) Negative (↓A, ↓Y) Positive (↑A, ↓Y) Sudan Negative (↓Y) Positive (↑A, ↑Y) Positive (↓A, ↑Y) Tanzania Positive (↑A, ↑Y) Positive (↑A, ↑Y) Positive (↑A, ↑Y) Uganda Negative (↓A) Positive (↑A, ↑Y) Positive (↑A, ↑Y) Positive = Positive cereal production growth rate, Negative = Negative cereal production growth rate, A = Area, Y= Yield, ↓= decline, ↑ = increase
Figure D-1. Variability in rainfall shows some correlation with agricultural growth across SSA

Appendices CPWF Project Report
Page | 139
Annex E - Interventions
Figure E-1. Climatic patterns of the Nile Basin.
From (a) Koppen-Geiger climate classification, and (b) humidity zones derived from IWMI climate atlas.
(a)
(b)
Figure E-2. Water sources and sinks in the Nile Basin.
(a)
(b)
(c)
(a) rainfall distribution, (b) potential evapotranspiration, and (c) runoff production potentials derived from IWMI climate atlas.

Appendices CPWF Project Report
Page | 140
Figure E-3. Topographic patterns of the Nile Basin.
(a)
(b)
(a) slope in %, and (b) compound topographic index. Figure E-4. Soil properties in the Nile Basin
(a)
(b)
(c)
(a) soil texture class, (b) bulk density in kg/dm3, and (c) available water capacity in cm/m derived from ISRIC-WISE data.

Appendices CPWF Project Report
Page | 141
Figure E-5. Vegetation profiles in the Nile Basin
(a)
(b)
(a) USGS land use land cover, and (b) average SPOT NDVI (mean annual from 1999 to 2006).
Figure E-6. Environmentally sensitive areas
(a)
(b)
(a) wetlands, and (b) protected areas compiled from IWMI’s IDIS Basin Kits.

Appendices CPWF Project Report
Page | 142
The biophysical factors described in the figures above are obviously related to each other. The climate and vegetation factors have similar spatial patterns in the basin. In order to use these biophysical factors for classification of water management zones, the interdependency between the factors should be removed.

Appendices CPWF Project Report
Page | 143
Table E-1. Agricultural Water Management Technology Suits and Scale of Applicability
Scale Water
source
Water Control Water Lifting Conveyance Application Drainage & Reuse
Rain water
• Inst water • Farm ponds • Cistern and
underground ponds • Roof water harvesting • Recession agriculture
• Treadle pumps • Water cans
• Drum • Channels • Pipes
• Flooding • Direct application • Drip
• Drainage of water logging • Surface drainage channels • Recharge wells
Surface
water
• Spate and flooding • Diversion • Pumping
• Micro pumps (petrol, diesel)
• Motorized pumps
• Channels • Canals • Pipes (rigid, flexible)
• Flood & Furrow • Drip • Sprinkler
• Surface drainage channels • Drainage of water logging
Small-holder farm-level
Ground
water
• Spring protection • Hand dug wells • Shallow wells
• Gravity • Treadle pumps • Micro pumps
(petrol, diesel) • Hand pumps
• Channels • Canals • Pipes (rigid, flexible)
• Flood & Furrow • Drip • Sprinkler
• Surface drainage channels • Drainage of water logging • Recharge wells
Rain
water
• SWC • Communal ponds • Recession agriculture • Sub-surface dams
• Treadle pumps • Water cans
• Drum • Channels • Pipes
• Flooding • Direct application • Drip
• Drainage of water logging • Surface drainage channels
Surface
water
• Spate and flooding • Wetland • Diversion • Pumping • Micro dams
• Micro pumps (petrol, diesel)
• Motorized pumps • Gravity
• Channels • Canals • Pipes (rigid, flexible)
• Flood & Furrow • Drip • Sprinkler
• Surface drainage channels
Community or catchment
Ground
water
• Spring protection • Hand dug wells • Shallow wells • Deep wells
• Gravity • Treadle pumps • Micro pumps
(petrol, diesel) • Hand pumps • Motorized pumps
• Channels • Canals • Pipes (rigid, flexible)
• Flood & Furrow • Drip • Sprinkler
• Surface drainage channels • Recharge wells and galleries
Sub-basin,
Basin
Surface
water
• Large dams • Gravity • Large scale
motorized pumps
• Channels • Canals • Pipes (rigid, flexible)
• Flood & Furrow • Drip • Sprinkler
• Surface drainage channels • Drainage re-use
A broad options of water control in RWH and SSI as practiced in Nile Basin countries and inventory of them are provided in Anderson, I. and Burton, M. (2009).

Appendices CPWF Project Report
Page | 144
Food poverty
00.05
0.10.15
0.20.25
0.30.35
Pond Shallowwells
Deepwells
Riverdiversion
Microdams
Types of AWM technologies
Pro
por
tion Incidence
Depth
Severity
Figure E-7. Poverty profiles and AWMT
a) Poverty profiles of users and non users;
Food poverty
0
0.1
0.2
0.3
0.4
Incidence Depth Severity
Indices
Pro
port
ion
Users
Non-users
b) Poverty profiles and AWM technologies.
Similarly, the food insecurity reduction is provided in Figure E-7b. The difference between the poverty and food security measures is on the cut off values for the two measures. Figure E-8. Food poverty profiles and AWMT
a) Food poverty profiles of users and non users b) Food poverty profiles and AWM technologies. The most important determinants of poverty include asset holdings, educational attainment, family labor and access to services and markets. To enhance the
Poverty profiles
0
50
100
Incidence Povertygap
Severity
Poverty indices
Per
cen
t
User
non-user
Poverty profiles
010
2030
4050
60
Pond Shallowwell
Deep well microdams
Riverdiversions
AWM technologies
Per
cen
t Incidence
Poverty gap
Severity

Appendices CPWF Project Report
Page | 145
contribution of AWM technologies to poverty reduction, there is, hence, a need to: 1) build assets; 2) develop human resources; and 3) improve the functioning of labor markets and access to markets (input or output markets). The characteristics of the control and storage infrastructures were also compiled from literatures (Yao and Georgakakos, 2003), national master plan documents (BECOM, 1998; NEDECO, 1998; TAMS, 1997), and from personal communication with experts from the basin.

Appendices CPWF Project Report
Page | 146
Table E-2. Existing water control structures in the Nile basin.
Dam Country
Live
Storage, 106
m3
Built Purpose
Abobo Ethiopia 57 1992 Irrigation; not yet used
Fincha Ethiopia 1,050 1971 Irrigation, Hydropower
High Aswan Egypt 105,900 1970 Irrigation, Hydropower
Jebel El Aulia Sudan 3,350 1937 Irrigation, Hydropower
Khashm El Gibra Sudan 835 1964 Irrigation, Hydropower
Koga Ethiopia 80 2008 Irrigation
Chara Chara Ethiopia 9,126 2000 Hydropower
Owen Falls Uganda 215,586 1954 Irrigation, Hydropower
Roseries Sudan 2,322 1966 Irrigation, Hydropower
Sennar Sudan 753 1925 Irrigation, Hydropower
The Nile Basin WEAP Modeling Framework
Figure E-9. WEAP schematization of the equatorial lakes part of the Nile basin
Figure E-10. WEAP schematization of the wetlands and Sobat-Baro parts of the Nile basin for the current situation

Appendices CPWF Project Report
Page | 147
Figure E-11. WEAP schematization of the Blue Nile and Atbara-Tekeze parts of the Nile basin for the current situation
Figure E-12. WEAP schematization of the Main Nile part of the Nile basin
The tributaries in the equatorial lakes region are aggregated into a number of streams since the datasets obtained for that region are very minimal. However, the WEAP modeling schematics is well detailed for the Ethiopian and, to some extent, for the Sudanese parts of the Nile basin as the required datasets are obtained from master plans and project reports.

Appendices CPWF Project Report
Page | 148
Table E-3. The irrigation areas (ha) for the current, medium-term & long-term scenarios.
Country / Sub-basin Current Medium-term Long-term
Burundi 0 18,160 80,000
Egypt
- Nile valley 3,324,300 3,521,133 3,717,966
- El-Salam 0 130,200 260,400
- Toshka 0 113,400 226,800
Sub Total 3,324,300 3,764,733 4,205,166
Ethiopia
- Blue Nile 15,900 217,023 489,726
- Baro-Akobo-Sobat 0 71,954 536,904
- Tekeze-Atbara 0 54,526 189,500
Sub Total 15,900 343,503 1,216,130
Kenya 5,600 70,000 200,000
Rwanda 5,000 50,000 155,000
Sudan
- Tekeze-Atbara 391,440 412,440 731,640
- Blue Nile 1,304,940 2,125,620 2,194,080
- Main Nile 130,620 449,820 781,200
- White Nile 348,600 586,740 796,320
Sub Total 2,175,600 3,574,620 4,503,240
Tanzania 475 10,000 30,000
Uganda 9,120 80,000 247,000
Total 5,535,995 7,911,016 10,636,536
The total irrigation water demand for the current scenario is lower than the Nile mean annual flow. However, the total irrigation water demand for the medium-term exceeds marginally and long-term scenarios are considerably greater than the mean annual flow of the Nile basin. This shows that the river water would not be sufficient for future irrigation water demands unless the irrigation efficiency is improved and other sources of water and economic options are explored.

Appendices CPWF Project Report
Page | 149
Table E-4. Mean annual flow (km3) at major nodes in the Nile basin for current, medium-term and long-term scenarios.
SN River Junction Current Medium-term Long-term
1 Main Nile after Egypt irrigation 28.56 11.83 2.42
2 Main Nile at HAD outlet 69.61 53.95 51.70
3 Main Nile at Aswan 80.62 64.93 54.04
4 Main Nile after Atbara 82.44 71.35 65.29
5 Main Nile after Blue Nile 74.46 63.22 58.37
6 Atbarah at Kilo3 8.57 8.94 8.22
7 Atbarah after Tekeze inflow 9.21 8.66 8.25
8 Tekeze at Sudan border 6.56 6.13 5.81
9 Blue Nile at Khartoum 40.49 31.54 30.82
10 Blue Nile at Sudan Border 48.20 46.11 46.27
11 White Nile at Khartoum 33.97 31.68 27.55
12 White Nile at Malakal 38.76 37.64 35.03
13 Sobat at outlet 13.66 13.36 11.14
14 Baro at outlet 9.42 8.98 7.49
15 Baro before Machar 12.73 12.00 9.61
16 Bahr El Ghazal at oulet 0.30 0.60 0.31
17 Bahr El Ghazal before swamp 11.33 11.33 11.33
18 Bahr El Jebel after Sudd 24.80 23.68 23.58
19 Bahr El Jebel before Sudd 47.61 44.33 46.95
20 Kyoga Nile at lake outlet 41.02 39.05 41.35
21 Victoria Nile at lake outlet 40.23 38.84 41.26
22 Inflow to Lake Victoria 22.87 21.97 19.89