cover sheet...on november 15, 2010, a petition for the issuance of a writ of kalikasan was filed...
TRANSCRIPT


COVER SHEET
SEC Registration Number
1 9 0 7 3
Company Name
F I R S T P H I L I P P I N E H O L D I N G S C O R P
O R A T I O N
Principal Office (No./Street/Barangay/City/Town/Province)
6 t h F l o o r , R o c k w e l l B u s i n e s s
C e n t e r T o w e r 3 , O r t i g a s A v e n u e ,
P a s i g C i t y
Form Type Department requiring the report Secondary License Type, If Applicable
1 7 - Q
COMPANY INFORMATION
Company’s Email Address Company’s Telephone Number/s Mobile Number
[email protected] (02) 8631-8024
No. of Stockholders Annual Meeting
Month/Day Fiscal Year Month/Day
12,006 May 25
(Note: for 2019 ASM was scheduled on May 10)
December 31
CONTACT PERSON INFORMATION The designated contact person MUST be an Officer of the Corporation
Name of Contact Person Email Address Telephone Number/s Mobile Number
Carmina Z. Ubaña [email protected] 3449-6253 09173279054
Contact Person’s Address
6th
Floor, Rockwell Business Center Tower 3, Ortigas Avenue, Pasig City, 1604 Philippines
Note: In case of death, resignation or cessation of office of the officer designated as contact person, such incident shall be reported to the Commission within thirty (30) calendar days from the occurrence thereof with information and complete contact details of the new contact person designated.

SECURITIES AND EXCHANGE COMMISSION
SEC FORM 17-Q
QUARTERLY REPORT PURSUANT TO SECTION 17 OF THE SECURITIES REGULATION CODE AND SRC RULE 17(2)(b) THEREUNDER
1. For the quarterly period ended: September 30, 2019
2. Commission identification number: 19073
3. BIR Tax Identification No.: 000-288-698-000
4. Exact name of issuer as specified in its charter:
FIRST PHILIPPINE HOLDINGS CORPORATION
5. Province, country or other jurisdiction of incorporation or organization: Metro Manila, Philippines
6. Industry Classification Code: (SEC Use Only)
7. Address of issuer's principal office: Postal Code: 6 th Floor, Rockwell Business Center Tower 3, 1604 Ortigas Avenue, Pasig City
8. Issuer's telephone number, including area code: ( 632) 8631-8024
9. Former name, former address and former fiscal year, if changed since last report:N/A
10. Securities registered pursuant to Sections 8 and 12 of the Code, or Sections 4 and 8 of the RSA
Title of each Class Number of shares of common stocks outstanding and amount of debt outstanding
Common Shares 508,962,804 Preferred Shares 3,600,000
11. Are any or all of the securities listed on a Stock Exchange?
Yes [ X ] No [ ]
If yes, state the name of such Stock Exchange and the class/es of securities listed therein:
The registrant's common and preferred shares are being traded at the Philippine Stock Exchange.

12. Indicate by check mark whether the registrant:
(a) has filed all reports required to be filed by Section 17 of the Code and SRC Rule 17thereunder or Sections 11 of the RSA and RSA Rule 11(a)-1 thereunder, and Sections 26 and141 of the Corporation Code of the Philippines, during the preceding twelve (12) months (or forsuch shorter period the registrant was required to file such reports)
Yes [ X ] No [ ]
(b) has been subject to such filing requirements for the past ninety (90) days.
Yes [ X ] No [ ]
BUSINESS DISCUSSION
TABLE OF CONTENTS
PART I - FINANCIAL INFORMATION
Item 1 Financial Information………………...…………………………........ 1
Item 2 Management’s Discussion and Analysis or Plan of Operation…......... 8
Item 3 Key Performance Indicators…………………………………………. 21
Item 4 Other Financial Information...……………………………………...... 26
Item 5 Corporate Structure…………………………………………………... 27
PART II - OTHER INFORMATION………………………………………………...….. 31
SIGNATURES………………………………………………………………………...……. 31
EXHIBIT “A”
UNAUDITED INTERIM CONDENSED CONSOLIDATED FINANCIAL
STATEMENTS AS OF AND FOR THE PERIODS ENDED
SEPTEMBER 30, 2019 AND 2018
(WITH COMPARATIVE AUDITED FIGURES AS AT DECEMBER 31, 2018)

PART I--FINANCIAL INFORMATION
Financial Statements
The unaudited interim condensed consolidated financial statements of the registrant are incorporated herein by reference to the enclosed document. They are prepared in compliance with the Philippine Financial Reporting Standards (PFRS) specific to Philippine Accounting Standard (PAS) 34, Interim Financial Reporting , as issued by the Financial Reporting Standards Council and adopted by the Philippine SEC and hence do not include all of the information required in the December 31, 2018 annual audited consolidated financial statements. See Exhibit A .
References to PFRS standards include the application of PAS, Philippine Financial Reporting Standards (PFRS), and Philippine Interpretations of the International Financial Reporting Interpretations Committee (IFRIC).
Earnings per share is presented on the face of unaudited interim consolidated statements of income for the periods ended September 30, 2019 and 2018. The accompanying notes to financial statements describe the basis of computation thereof.
The unaudited interim condensed consolidated financial statements followed the same accounting policies and methods of computations as used in the December 31, 2018 annual consolidated financial statements, except for the adoption of the PFRS 16 effective beginning January 1, 2019 as discussed under the Summary of Significant Accounting Policies in the Financial Statements.
The nature and amount of items affecting assets, liabilities, equity, net income, or cash flows that are unusual because of their nature, size or incidents are described in Item 2, Management’s Discussion and Analysis or Plan of Operation.
Issuances, repurchases, and repayments of debt and equity securities, if any, are described in Item 2, Other Financial Information.
Cases relating to the recovery of certain PCIB Shares
FPH was allowed by the Supreme Court (SC) in FPH vs. Sandiganbayan, G.R. No. 88345 to intervene and litigate its claim of ownership over 6,299,177 sequestered PCIBank shares of stock in the case of the Republic of the Philippines (“Republic”) vs. Benjamin Romualdez, et al., Civil Case No. 0035, which is pending before the Sandiganbayan. FPH anchors its claim on, among other facts, the nullity or voidability of the contract transferring the shares from itself to Romualdez, et al. The Sandiganbayan, however, dismissed FPH’s Second Complaint-in-Intervention, as well as FPH’s subsequent motions for reconsideration/petitions. FPH filed a Petition for Review in the SC as to said dismissal, which is currently pending before the SC.
In a related case, the Presidential Commission on Good Government and FPH separately filed petitions for review before the SC for the dismissal of the Republic’s Third Amended Complaint as to TMEE. The petitions and FPH’s subsequent Motion for Reconsideration were denied. Meanwhile, FPH continues to pursue its interest in the Sandiganbayan against the other defendants.
1

In the Sandiganbayan case, the Republic filed a Partial Compliance with Motion for Production and Inspection dated April 30, 2014, which was denied. The Republic’s Motion for Reconsideration thereon was denied. FPH filed a Petition for Certiorari dated January 20, 2016 with the SC assailing the Sandiganbayan’s denial. The Petition likewise remains pending as of the filing of this report.
Tax Cases
Several companies within the Group (excluding the First Gen group’s tax cases discussed below) received Final Assessment Notices (FAN) from the BIR Large Taxpayers Service (LTS) for the taxable year 2009 for alleged deficiency taxes. Alleged interest and penalties indicated in the FANs amounted to ₱1.86 billion. The companies duly protested on factual, due process and legal grounds, including prescription of some assessments and have filed Petitions for Review with the Court of Tax Appeals (CTA) questioning the validity of the assessment on the same foregoing grounds following the inaction by the BIR on their protest. The management of the companies, based on consultation with their legal counsels, believes that the final resolution of the cases, if any, would not adversely affect the companies’ financial position or results of operations.
Other legal proceedings
West Tower Condominium Corporation, et al. vs. First Philippine Industrial Corporation, et al. G.R. No. 194239, Supreme Court of the Philippines
On November 15, 2010, a Petition for the Issuance of a Writ of Kalikasan was filed before the SC by the West Tower Condominium Corporation, et al., against respondents First Philippine Industrial Corporation (FPIC), First Gen, their respective boards of directors and officers, and John Does and Richard Roes. The petition was filed in connection with the accidental oil leak from a segment of FPIC’s white oil pipeline located in Bangkal, Makati City and which seeped into the basement of the West Tower Condominium building.
The petition was brought by the West Tower Condominium Corporation purportedly on behalf of its unit owners and in representation of the inhabitants of Barangay Bangkal, Makati City. The petitioners sought the issuance of a Writ of Kalikasan to protect the constitutional rights of the Filipino people to a balanced and healthful ecology, and prayed that the respondents permanently cease and desist from committing acts of negligence in the performance of their functions as a common carrier; continue to check the structural integrity of the entire 117-km white oil pipeline and replace the same; make periodic reports on findings with regard to the said pipeline and their replacement of the same; be prohibited from opening the white oil pipeline and allowing its use until the same has been thoroughly checked and replaced; rehabilitate and restore the environment, especially Barangay Bangkal and West Tower Condominium, at least to what it was before the signs of the leak became manifest; open a special trust fund to answer for similar contingencies in the future; and be temporarily restrained from operating the said pipeline until final resolution of the case.
On November 19, 2010, the SC issued a Writ of Kalikasan with Temporary Environmental Protection Order (TEPO) directing the respondents to: (i) make a verified return of the Writ within a non-extendible period of ten days from receipt thereof; (ii) cease and desist from operating the pipeline until further orders from the court; (iii) check the structural integrity of the whole span of the pipeline, and in the process apply and implement sufficient measures to prevent and avert any untoward incident that may result from any leak in the pipeline; and (iv) make a report thereon within
2
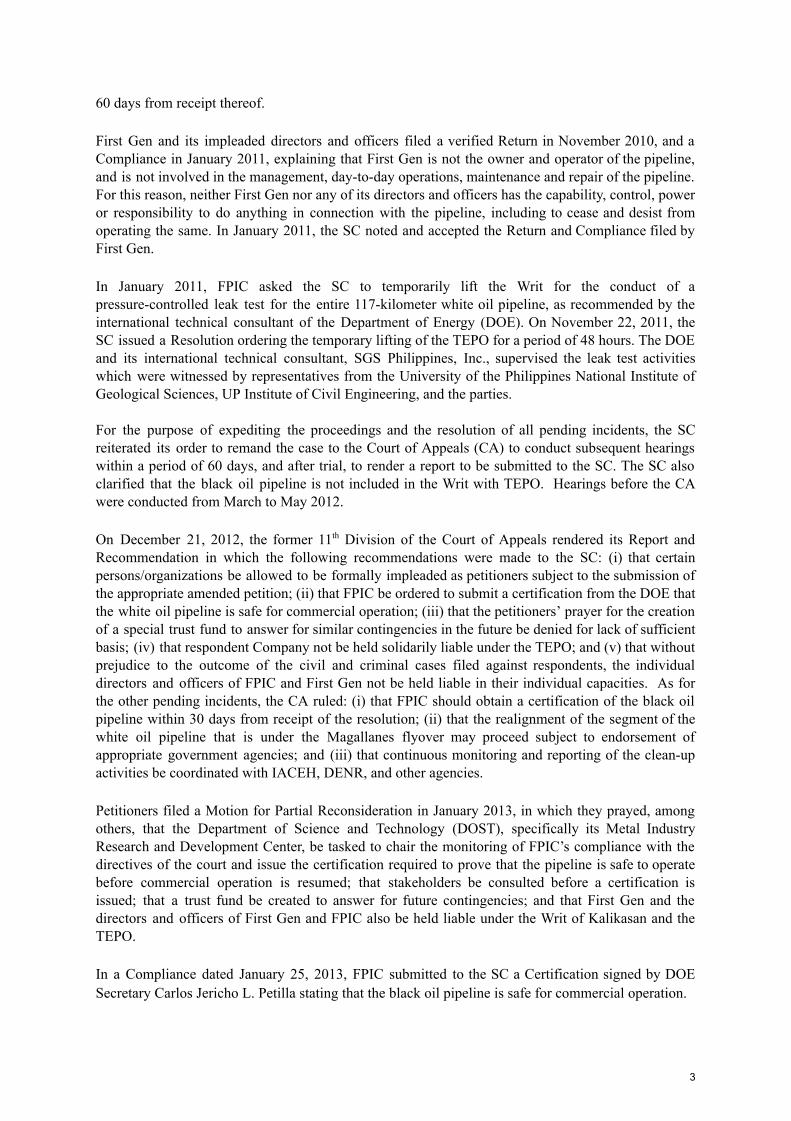
60 days from receipt thereof.
First Gen and its impleaded directors and officers filed a verified Return in November 2010, and a Compliance in January 2011, explaining that First Gen is not the owner and operator of the pipeline, and is not involved in the management, day-to-day operations, maintenance and repair of the pipeline. For this reason, neither First Gen nor any of its directors and officers has the capability, control, power or responsibility to do anything in connection with the pipeline, including to cease and desist from operating the same. In January 2011, the SC noted and accepted the Return and Compliance filed by First Gen.
In January 2011, FPIC asked the SC to temporarily lift the Writ for the conduct of a pressure-controlled leak test for the entire 117-kilometer white oil pipeline, as recommended by the international technical consultant of the Department of Energy (DOE). On November 22, 2011, the SC issued a Resolution ordering the temporary lifting of the TEPO for a period of 48 hours. The DOE and its international technical consultant, SGS Philippines, Inc., supervised the leak test activities which were witnessed by representatives from the University of the Philippines National Institute of Geological Sciences, UP Institute of Civil Engineering, and the parties.
For the purpose of expediting the proceedings and the resolution of all pending incidents, the SC reiterated its order to remand the case to the Court of Appeals (CA) to conduct subsequent hearings within a period of 60 days, and after trial, to render a report to be submitted to the SC. The SC also clarified that the black oil pipeline is not included in the Writ with TEPO. Hearings before the CA were conducted from March to May 2012.
On December 21, 2012, the former 11 th Division of the Court of Appeals rendered its Report and Recommendation in which the following recommendations were made to the SC: (i) that certain persons/organizations be allowed to be formally impleaded as petitioners subject to the submission of the appropriate amended petition; (ii) that FPIC be ordered to submit a certification from the DOE that the white oil pipeline is safe for commercial operation; (iii) that the petitioners’ prayer for the creation of a special trust fund to answer for similar contingencies in the future be denied for lack of sufficient basis; (iv) that respondent Company not be held solidarily liable under the TEPO; and (v) that without prejudice to the outcome of the civil and criminal cases filed against respondents, the individual directors and officers of FPIC and First Gen not be held liable in their individual capacities. As for the other pending incidents, the CA ruled: (i) that FPIC should obtain a certification of the black oil pipeline within 30 days from receipt of the resolution; (ii) that the realignment of the segment of the white oil pipeline that is under the Magallanes flyover may proceed subject to endorsement of appropriate government agencies; and (iii) that continuous monitoring and reporting of the clean-up activities be coordinated with IACEH, DENR, and other agencies.
Petitioners filed a Motion for Partial Reconsideration in January 2013, in which they prayed, among others, that the Department of Science and Technology (DOST), specifically its Metal Industry Research and Development Center, be tasked to chair the monitoring of FPIC’s compliance with the directives of the court and issue the certification required to prove that the pipeline is safe to operate before commercial operation is resumed; that stakeholders be consulted before a certification is issued; that a trust fund be created to answer for future contingencies; and that First Gen and the directors and officers of First Gen and FPIC also be held liable under the Writ of Kalikasan and the TEPO.
In a Compliance dated January 25, 2013, FPIC submitted to the SC a Certification signed by DOE Secretary Carlos Jericho L. Petilla stating that the black oil pipeline is safe for commercial operation.
3

In a Resolution dated July 30, 2013, the SC adopted the CA’s recommendation that FPIC secure a DOE certification stating that the pipeline is already safe for commercial operation before the white oil pipeline may resume its operations.
FPIC filed an application for DOE’s issuance of the required certification, and on October 25, 2013 the DOE issued a certification that the white oil pipeline is safe to return to commercial operations. FPIC submitted the DOE certification to the SC on October 29, 2013.
On June 16, 2015, the SC issued another resolution recognizing the powers of the DOE to oversee the operation of the pipelines. The resolution also stated that the DOE is fully authorized by law to issue an order for the return to commercial operations of the pipeline following the conduct of integrity tests. Petitioners have filed several motions urging the SC to reconsider this resolution. The final resolution of the Writ remains pending with the SC. In the meantime, FPIC has been coordinating with the DOE for the issuance of an order for the reopening of the white oil pipeline and continues to submit interim compliance reports to the court and relevant government agencies. West Tower Condominium Corporation, et al. vs. First Philippine Industrial Corporation, et al. Civil Case No. 11-256, Regional Trial Court, Makati Branch 58 On March 24, 2011, a civil case for damages was filed by the West Tower Condominium Corporation and some residents of the West Tower Condominium against FPIC, the FPIC directors and officers, First Gen, Pilipinas Shell Petroleum Corporation, and Chevron Philippines, Inc. before the Makati City RTC. In their complaint, the Plaintiffs alleged that FPIC, its directors and officers, and First Gen violated Republic Act No. 6969 (Toxic Substances and Hazardous and Nuclear Wastes Control Act of 1990), RA 8749 (Philippine Clean Air Act of 1999) and Its Implementing Rules and Regulations, and RA 9275 (Philippine Clean Water Act of 2004). The complaint sought payment by the Defendants of actual damages comprising incurred rentals for alternative dwellings, incurred additional transportation and gasoline expenses and deprived rental income; recompense for diminished or lost property values to enable the buying of new homes; incurred expenses in dealing with the emergency; moral damages; exemplary damages; a medical fund; and attorney’s fees. First Gen filed its Answer in May 2011, in which it was argued that the case is not an environmental case under the Rules of Procedure for Environmental Cases, but an ordinary civil case for damages under the Rules of Court for which the appropriate filing fees should be paid before the court can acquire jurisdiction thereof. In an Order dated August 22, 2011, Makati City RTC (Branch 158) Judge Eugene Paras ruled that the complaint is an ordinary civil action for damages and that the Plaintiff should pay the appropriate filing fees in accordance with the Rules of Court within 10 days from receipt of the Order. The other individual plaintiffs were ordered dropped as parties in the case. The Plaintiffs filed a Motion to Inhibit Judge Paras as well as a Motion for Reconsideration of the Order. In an Order dated October 17, 2011, the court reiterated that it has no jurisdiction over the case and ordered the referral of the case to the Executive Judge for re-raffle. In an Order dated December 1, 2011, Judge Elpidio Calis of the Makati City RTC (Branch 133) declared that the records of the case have been transferred to his court. In an Order dated March 29, 2012, Judge Calis denied the plaintiffs’ Motion for Reconsideration for lack of merit, and ordered the plaintiffs to pay the appropriate filing fees within ten (10) days from receipt of the Order, with a warning that non-compliance will constrain the court to dismiss the case for lack of jurisdiction. Instead of paying the filing fees, the plaintiffs filed a Petition for Certiorari with the CA to nullify the order of Branch 133.
4

In a resolution dated June 30, 2014, the CA denied the petition of West Tower and affirmed the trial court’s recognition of the case as being an ordinary action for damages. The CA, however, also ruled that the individual residents who joined West Tower in the civil case need not file separate cases, but instead can be joined as parties in the present case. West Tower and FPIC each filed a motion for partial reconsideration, with West Tower arguing that the case is an ordinary action for damages, and FPIC assailing the ruling that the individual residents can be joined as parties in the present case. Both motions were denied in a CA resolution dated December 11, 2014. On February 20, 2015, FPIC filed before the SC a Petition for Review of the CA’s denial of its Motion for Partial Reconsideration. As of the date of filing of this report, the resolution of the Petition for Review remains pending.
Bayan Muna Representatives, et al. vs. ERC and Meralco (G.R. No. 210245) NASECORE, et al. vs. Meralco, ERC and DOE (G.R. No. 210255) Meralco vs. Philippine Electricity Market Corporation (PEMC), et al (G.R. No. 210502) Supreme Court Manila
In these cases the Supreme Court (SC) issued separate Temporary Restraining Orders (TROs) restraining Meralco from increasing the generation charge rate it charges to its consumers during the November 2013 billing period, and similarly restraining PEMC and other generation companies, including certain subsidiaries of First Gen, namely, FGPC, FGP, FG Hydro, BGI, and BEDC, from demanding and collecting from Meralco the deferred amounts representing the costs raised by the latter. The TROs will remain effective until April 22, 2014, unless renewed or lifted ahead of such date.
On February 26, 2014, FGPC, FGP, FG Hydro, BGI and BEDC filed with the SC a Memorandum with Motion to Lift TRO. It is First Gen’s position that its right to the payment of the generation charges owed by Meralco is neither dependent nor conditional upon Meralco’s right to collect the same from its consumers. In the case of FGPC and FGP, Meralco’s obligation to pay is contractual and thus governed by the terms and conditions of their respective PPAs. Ultimately, Meralco is bound to comply with its contractual obligations to FGPC and FGP, whether via the pass-through mechanism or some other means. On April 22, 2014, the subject TRO was extended indefinitely and until further orders from the SC.
In the meantime, the SC ordered the parties to comment on the March 2014 Order of ERC declaring void the Wholesale Electricity Spot Market (WESM) prices for November and December 2013, and imposing regulated prices for the said months to be calculated by the PEMC. First Gen Group filed its Comment in May 2014, where it noted that the ERC has not made any adverse finding against the group or any ruling that the group committed an abuse of market power or anti-competitive behavior.
There has been no further substantial movement in the case since then.
Arbitration Proceedings
First PV and First Philec Nexolon Corporation (FPNC)
The Parent Company’s (or “FPH”) subsidiaries, First PV and FPNC initiated arbitration proceedings against Nexolon with the ICC in 2012 on the basis of Nexolon’s breaches of the Supply Agreement. The arbitral tribunal rendered the final award in October 2014 which required Nexolon to pay
5

damages and pre-award interest to FPNC in the amount of US$24.8 million and a put option price to First PV in the amount of ₱2.09 billion (FPNC and First PV are referred to as the “Companies”). To date, no payments have been received on the award from Nexolon which is reported to be in rehabilitation proceedings. The companies have filed their appropriate claims in Korean rehabilitation courts. At the same time, to mitigate its losses, FPNC has been searching for ways to realize value from its remaining assets. Significant Transactions of the Parent In 2018, FPH acquired additional 4,600,000 common stocks of First Gen from the open market amounting to ₱74.0 million at an average cost per share of ₱16.09. Also in 2018, First Gen purchased from the open market 17,981,000 of its own common stocks (buyback) for a total amount of ₱270.3 million. Further, from January to September 30, 2019, First Gen purchased 23,824,597 of its own common stocks from the open market amounting to ₱588.3 million. The acquisitions made by FPH and First Gen’s buyback raised FPH’s ownership in First Gen to 66.98% as at December 31, 2018 and 67.42% as at September 30, 2019. On July 12, 2018, the Board of Directors (BOD) approved the extension of the FPH common shares buy-back program from July 2018 to July 2020 for up to ₱6.0 Billion. On March 20, 2019, the BOD approved the Audited Financial Statements for the calendar year ended December 31, 2018. Also on this date, the BOD authorized the application for delisting of the company’s 43,000,000 Series “B” Preferred Shares (the “Shares”) in view of the redemption of the Shares as approved by the BOD last February 7, 2013. On July 4, 2019, the BOD ratified the June 27, 2019 FPH Executive Committee approval for an interim additional budget of ₱ 750 million for its common shares buy-back program and approved an additional allotment of ₱ 5.0 billion for the common shares buy-back program up to July 2020. On October 3, 2019, the BOD approved the appropriation of ₱28.7 billion retained earnings as follows:
Appropriation Details Amount
Benpres Building and Eugenio Lopez Center Redevelopment Projects
Php 12.0B
Investment in other subsidiaries Php 5.3B
Debt Service Php 6.4B
Share buyback (unused) Php 5.0B
Total Php 28.7B For the period January 1 to September 30, 2019, FPH acquired a total of 30,135,570 of its own shares at an average cost of ₱ 80.79 per share. These acquisitions increased Treasury Shares to 100,686,835 as at September 30, 2019.
6

FPH’s most recent dividend payments (as of September 30, 2019) are presented below:
Declaration Date Record Date Payment date Amount
Common Shares May 10, 2019 May 28, 2019 June 18, 2019 ₱ 1.00 per share
Preferred Shares May 10, 2019 May 28, 2019 June 3, 2019 ₱ 13.75 per share
Common Shares November 8, 2018 November 23, 2018 December 17, 2018 ₱ 1.00 per share
Preferred Shares November 8, 2018 November 23, 2018 December 23, 2018 ₱ 13.75 per share
Certain subsidiaries and associates have contingent liabilities with respect to claims, lawsuits and tax assessments. The respective management of the subsidiaries and associates, after consultations with external counsels, believes that the final resolution of these issues will not materially affect their respective financial position and results of operations. Except for First Gen’s subsidiaries, particularly FG Hydro’s and FG Bukidnon’s sale of electricity coming from hydroelectric power/operations, as well as First Gen’s merchant plants, seasonality or cyclicality of interim operations is not applicable to the Group’s type of business. The Group’s other operating segments are also not subject to seasonality or cyclicality. There are no material changes in contingent liabilities or contingent assets since the last annual balance sheet date.
7

Item 2. Management’s Discussion and Analysis or Plan of Operation
The following management’s discussion and analysis of the FPH Group’s (the Group) financial condition and results of operations should be read in conjunction with the accompanying unaudited interim condensed consolidated financial statements and the related notes as of and for the periods ended September 30, 2019 and 2018 and the audited consolidated financial statements as at December 31, 2018. This discussion includes forward-looking statements, which may include statements regarding future results of operations, financial condition or business prospects, which are subject to significant risks, uncertainties and other factors and are based on the Group’s current expectations, some of which are beyond the Group’s control and are difficult to predict. These statements involve risks and uncertainties and our actual results may differ materially from those anticipated in these forward-looking statements. FINANCIAL HIGHLIGHTS ……………………………………………………………… … …iiii The financial highlights and analysis of account movements for the comparative periods are in Philippine pesos (unless specifically indicated), which is the Group’s functional currency. The financial statements of the consolidated subsidiaries and associates with functional currency other than the Philippine peso such as the First Gen group are translated to Philippine peso as follows:
● Assets and liabilities using the spot rate of exchange prevailing at financial reporting date; ● Components of equity using historical exchange rates; and ● Income and expenses using the monthly weighted average exchange rate.
The table below summarizes the relevant exchange rates used throughout the comparative periods:
Translation Basis Sept. 30, 2019 Dec. 31, 2018 Sept. 30, 2018 Dec. 31, 2017
End of period spot rate 1 US$ to Php 51.83 52.58 54.02 49.93 Average exchange rate to 1 US$ to Php 52.13 52.47 52.11 50.36
Whenever necessary, the impact of exchange rate movements are separately discussed in order to properly explain the movement in account balances in conjunction with business results and transactions. Consolidated Statements of Income (Unaudited) For the nine months ended September 30, 2019 vs. September 30, 2018 Revenues
The Group’s consolidated revenues for the period ended September 30, 2019 increased by ₱8.6 billion or 9%, from last year’s ₱91.2 billion to ₱99.8 billion, on account of the following: ● Sale of electricity was up by ₱8.0 billion or 10% (from ₱76.3 billion to ₱84.3 billion) driven by
stronger electricity sales from (1) EDC following the return to service of all its Leyte power plants, (2) FG Hydro’s higher energy generation of the Pantabangan-Masiway hydro plants from higher water levels supplemented by an increase in spot market volume and prices, particularly during the first half of 2019, (3) PMPC’s stronger revenues of the Avion plant driven by favorable spot market prices and dispatch due to the forced outages of certain baseload coal plants also during the first six months of 2019, (4) FNPC following the full nine-month revenues from the PSA of the San Gabriel plant with Meralco versus its spot market sales during the first half of 2018 and (5) Santa Rita and San Lorenzo gas plants due to higher fuel charges.
8

● Sale of real estate decreased by ₱1.3 billion or 15% (from ₱9.0 billion to ₱7.7 billion) mainly due to Rockwell’s lower value completion of the Proscenium and Edades Suites residential development projects as well as lower sales bookings of the Proscenium project.
● Revenues from contracts and services increased by ₱2.0 billion or 49% (from ₱4.1 billion to
₱6.1 billion) primarily due to the increased contribution of First Balfour and Thermaprime from on-going projects coupled with higher recurring lease earnings from Rockwell’s commercial spaces and FPIP’s Ready-built Factories (RBF).
● Revenues from sale of merchandise dipped ₱43 million or 2% (from ₱1.8 billion to ₱1.7 billion) mainly due to First Philec’s lower volume of electrical transformer sales during the period.
Net Income
Consolidated net income increased by ₱4.5 billion or 32% (from ₱13.6 billion to ₱18.1 billion) primarily due to increased electricity sales, higher leasing income, and the turnaround of last year’s foreign exchange losses to this year’s foreign exchange gains. On a recurring net income (RNI) basis, the Group reported earnings of ₱17.9 billion, higher by ₱2.6 billion or 17% compared to last year’s ₱15.3 billion driven by stronger operating profits and lower Parent expenses. Net Income Attributable to Equity Holders of the Parent
Net income attributable to equity holders of the Parent increased by ₱2.5 billion or 35% (from ₱7.1 billion to ₱9.6 billion) mainly reflecting the increase in operating income coupled with favorable foreign exchange rates and deferred income tax movements, as well as the decline in non-recurring expenses incurred by EDC for the return to service of its Leyte plants. Excluding non-recurring items, RNI attributable to equity holders of the Parent increased ₱1.6 billion or 21%, from ₱8.0 billion to ₱9.6 billion (see Notes to Unaudited Interim Condensed Consolidated Financial Statements) . Detailed discussions of the changes in the Consolidated Statements of Income are presented in the succeeding sections of this report. Consolidated Statements of Financial Position September 30, 2019 (Unaudited) vs. December 31, 2018 (Audited) Assets
Total assets of the Group remained flat at ₱370 billion reflecting the following major movements: ● Cash and cash equivalents increased by ₱4.9 billion or 14% (from ₱36.1 billion to ₱41.0 billion)
mainly representing the higher cash generated from the Group’s operating activities during the first three quarters (see Consolidated Statements of Cash Flows). These were partly offset by disbursements for the Parent and First Gen group’s share buyback programs, scheduled principal and interest payments for outstanding loans, and payment of dividends during the period.
● Inventories went up by ₱2.1 billion or 11% (from ₱19.5 billion to ₱21.6 billion) mostly on
account of First Gen group’s higher fuel inventories following the liquid fuel importation and purchases made during the period.
9

● Other noncurrent assets increased by ₱1.7 billion or 9% (from ₱18.5 billion to ₱20.2 billion) mainly resulting from the recognition of the Group’s right-of-use assets for long-term leases as well as First Gen’s higher prepaid major spare parts to cover the estimated cost of turbine blades replacement.
The above increases were offset by (1) the decrease in contract assets (current and noncurrent portion) of ₱836 million or 5% (from ₱17.3 billion to ₱16.4 billion) mainly resulting from lower level of Rockwell’s noncurrent contract assets, and (2) the decline in other current financial assets following First Gen’s lower levels of debt service reserve and money market securities.
Liabilities and Equity
Total liabilities and equity of the Group remained at ₱370 billion primarily due to the following movements: ● Loans payable increased by ₱1.0 billion or 254% (from ₱403 million to ₱1.4 billion) primarily
due to the short-term loan availment of First Gen group during the period. ● Other noncurrent liabilities increased by ₱2.4 billion or 78% (from ₱3.0 billion to ₱5.4 billion)
mainly due to the recognition of lease liability as a result of the adoption of the new accounting standard for leases coupled with higher balances of Rockwell’s non-current deposits and other liabilities.
● Total equity increased by ₱11.3 billion or 7% (from ₱166.3 billion to ₱177.6 billion) primarily
due to the Group’s total comprehensive income, partly reduced by common share buybacks and dividends declared during the period.
The above increases were tempered by the reduction in total Long-term debts (including current portion) of ₱14.4 billion or 10% (from ₱150.3 billion to ₱135.9 billion) primarily due to loan payments made by the Parent, First Gen group, Rockwel Land First Balfour during the period.
Detailed discussions of the significant account movements in the Consolidated Statements of Financial Position are presented in the succeeding sections of this report.
10

DETAILED ANALYSIS OF MATERIAL CHANGES Consolidated Statements of Income (Results of Operations) Horizontal and Vertical Analyses of Material Changes for the nine months ended September 30, 2019 vs. 2018
11

Revenues
The Group’s consolidated revenues for the nine months ended September 30, 2019 totaled ₱99.8 billion, higher by ₱8.6 billion or 9% compared to the previous period. The significant movements in the Group’s revenues consist of: Sale of electricity – increased by ₱8.0 billion or 10% (from ₱76.3 billion to ₱84.3 billion) and accounted for 84% of total revenues for both periods. The increase was driven by the jump in revenues from the EDC mainly due to higher electricity sales of the Unified Leyte and Tongonan plants in 2019 following the full restoration from the damage brought by Typhoon Urduja that affected Leyte site in December 2017. This was supplemented by FNPC’s higher electricity sales to Meralco under its six-year PSA with Meralco for the San Gabriel plant which commenced on June 26, 2018 and further complemented by PMPC’s and FG Hydro’s higher WESM sales volume and prices for the Avion and Pantabangan-Masiway power plants, respectively. Sale of real estate – decreased by ₱1.3 billion or 15% (from ₱9.0 billion to ₱7.7 billion) and accounted for 8% and 10% of total revenues for 2019 and 2018, respectively. This was largely attributable to Rockwell’s lower sales booking and construction completion recognized for the Proscenium projects, which were significantly completed at the end of last year, as well as lower completion recognized for the Edades project. Contracts and services – increased by ₱2.0 billion or 49% (from ₱4.1 billion to ₱6.1 billion) and accounted for 6% and 4% of total revenues for 2019 and 2018, respectively. The increase was driven by the (a) increased contribution of First Balfour’s flagship projects which include the Cebu-Cordova Link Expressway Project and the Novaliches-Balara Aqueduct 4 Project, (b) Thermaprime’s contract with Philippine Geothermal Production Company, (c) stronger revenues from Rockwell’s commercial leasing spaces reflecting the rise of occupancy of RBC Sheridan and Santolan Town Plaza and (d) FPIP’s improved occupancy, rates, and leasable area on its RBF leasing. Sale of merchandise – declined by ₱43 million or 2% (from ₱1.8 billion to ₱1.7 billion) and accounted for 2% of total revenues for both periods. This was on account of First Philec’s lower sales volume of electrical distribution transformers. Costs and expenses Consolidated costs and expenses increased by ₱5.8 billion or 8% (from ₱69.9 billion to ₱75.7 billion) and accounted for 76% and 77% of total revenues for 2019 and 2018, respectively. Details of costs and expenses line items as well as significant changes for the comparative periods are discussed as follows: Cost of sale of electricity – increased by ₱4.4 billion or 9% (from ₱49.8 billion to ₱54.2 billion) and accounted for 54% and 55% of total revenues for 2019 and 2018, respectively. The movement mainly reflects fuel and other variable costs attributable to the increased dispatch of the San Gabriel and Avion plants for the period. Fuel costs for Santa Rita and San Lorenzo plants also increased because of higher average gas prices (an average of $9.0/MMBtu in the first nine months of 2019 compared to an average of $8.4/MMBtu in the same period last year). These were partly reduced by lower costs of FG Hydro primarily driven by lower replacement power cost as a result of higher energy generation and lower contracted demand in 2019. Cost of real estate sold – decreased by ₱2.3 billion or 32% (from ₱7.1 billion to ₱4.8 billion) and accounted for 5% and 8% of total revenues for 2019 and 2018, respectively. The decrease primarily
12

reflects Rockwell Land’s lower costs incurred for the Proscenium and Vantage residential development projects. Cost of contracts and services – increased by ₱1.7 billion or 116% (from ₱1.5 billion to ₱3.2 billion) and accounted for 3% and 2% of total revenues for 2019 and 2018, respectively. The increase reflects First Balfour’s and Thermaprime’s direct costs for their on-going construction projects and new drilling projects, respectively, coupled with higher direct costs pertaining to additional leasable areas of Rockwell Land and FPIP. Cost of sale of merchandise – lower by ₱68 million or 6% (from ₱1.2 billion to ₱1.1 billion) and accounted for 1% of total revenues for both periods. The decrease reflects the decline in First Philec’s transformer sales volume for the period. General and administrative expenses – increased by ₱2.0 billion or 20% (from ₱10.3 billion to ₱12.3 billion) and accounted for 12% and 11% of total revenues for 2019 and 2018, respectively. The increase was mainly attributable to Rockwell’s additional expenses from new commercial property developments as well as First Gen group’s higher personnel costs primarily due to EDC’s non-recurring staff costs related to its employee retirement/manpower reduction program in 2019. Finance costs Finance costs slightly increased by ₱202 million or 3% (from ₱6.1 billion to ₱6.3 billion) and accounted for 6% and 7% of total revenues 2019 and 2018, respectively. This was primarily due to Rockwell Land’s lower capitalized borrowing costs for residential and hotel projects and the finance costs on the amortization of the Group’s lease liabilities recognized for its operating leases. These were partly tempered by the Parent and First Gen group’s reduced finance costs following lower debt levels this year compared to last year due to scheduled loan repayments. Finance income Finance income increased by ₱127 million or 6% (from ₱2.1 billion to ₱2.3 billion) and accounted for 2% of total revenues for both periods. This was primarily due to EDC’s higher investible funds, and higher interest income from FNPC and FG Hydro. Foreign exchange gains (losses)
Foreign exchange losses of ₱1.3 billion in 2018 turned around to a ₱44 million gain this year reflecting the favorable effect of the changes in the Philippine peso to U.S. dollar exchange rates from December 2018 to September 2019 compared with last year’s movements (refer to foreign exchange table above). Equity in Net Earnings of Associates and Joint Ventures
This account increased by ₱89 million or 89% (from ₱100 million to ₱189 million) and accounted for 0.2% and 0.1% of total revenues for 2019 and 2018, respectively. This was largely due to higher income of the JV company from rental escalation and increase reimbursable charges for the leased properties.
13

Dividend income
Dividend income increased by ₱156 million or 26% (from ₱597 million to ₱753 million) and accounted for 1% of total revenues for both periods. This was largely due to higher dividends received from Meralco during the period (₱16.058 per share in 2019 vs. ₱13.376 per share in 2018). Others
Othe r income decreased by ₱266 million or 23% from last year’s ₱1.2 billion to ₱887 million and accounted for 1% of total revenues for both periods. This largely reflects the Group’s lower insurance claim proceeds and EDC’s one-time debt extinguishment cost following the partial redemption of its $211.0 million Bond last February 2019. Income before income tax As a result of the foregoing, income before income tax increased by ₱4.1 billion or 23%, from ₱17.8 billion to ₱21.9 billion during the period. Net Income
Consolidated net income increased by ₱4.5 billion or 32% (from ₱13.6 billion to ₱18.1 billion) primarily due to the increased electricity sales, higher leasing income, and lower Parent expenses during the period, complemented further by favorable foreign exchange rates and deferred income tax movements. On a recurring net income (RNI) basis, the Group posted earnings of ₱17.9 billion, higher by ₱2.6 billion or 17% compared to last year’s ₱15.3 billion driven by stronger operating profits and lower Parent expenses. Net Income Attributable to Equity Holders of the Parent
Net income attributable to equity holders of the Parent increased by ₱2.5 billion or 35% (from ₱7.1 billion to ₱9.6 billion) mainly reflecting the increase in operating income coupled with non-recurring gains during the period, which include favorable foreign exchange rates and movements in deferred income taxes coupled with the decline in EDC’s non-recurring expenses to restore its Leyte plants. Excluding non-recurring items, RNI attributable to equity holders of the Parent increased ₱1.6 billion or 21% from ₱8.0 billion to ₱9.6 billion (see Notes to Unaudited Interim Condensed Consolidated Financial Statements) . Net income attributable to non-controlling interests Net income attributable to non-controlling interest increased by ₱1.9 billion or 30% (from ₱6.5 billion to ₱8.4 billion) mainly reflecting the minority shareholders’ share in the higher income of First Gen, EDC and Rockwell Land during the period. The significant portion of this account pertains to the share of non-controlling stockholders of First Gen, EDC, Rockwell Land and FPIP on the consolidated net income. Earnings per share (EPS) Basic and diluted EPS for the period amounted to ₱18.363 versus last year’s basic and diluted EPS of ₱12.863. The increase was mainly due to higher net income attributable to equity holders of the Parent for the period and the decline in the number of outstanding shares following the Parent’s share buyback in 2019.
14

Consolidated Statements of Comprehensive Income For the nine months ended September 30, 2019 vs. September 30, 2018
Total comprehensive income for the period Total comprehensive income increased by ₱2.9 billion or 21% (from ₱14.0 billion to ₱16.9 billion). The major movements in the comprehensive income of the Group were as follows:
(1) Consolidated net income increased by ₱4.4 billion or 32% (from ₱13.6 billion to ₱18.0 billion) due to factors discussed in the preceding sections.
(2) Exchange losses on foreign currency translation decreased by ₱47 million or 25% (from ₱189
million to ₱142 million), mainly due to the translation of First Gen’s U.S. dollar-denominated financial statements into Philippine peso for consolidation purposes (refer to foreign exchange table above).
(3) Net gains (losses) on cash flow hedge deferred in equity reversed from ₱2 million gain last
year to a ₱533 million loss this year due to the unfavorable MTM valuation of the Group’s derivative instruments.
(4) Unrealized fair value gains (losses) on financial assets at FVOCI, which largely pertains to the
movements in fair value of Meralco shares held by the Group, also reversed by ₱991 million from ₱529 million gain last year to ₱462 million loss this year due to decline in Meralco share price from December 31, 2018 to September 30, 2019 compared to the same period in 2018.
15

Total comprehensive income for the period attributable to equity holders of the Parent Total comprehensive income attributable to equity holders of the Parent increased by ₱1.8 billion or 28% (from ₱6.3 billion to ₱8.1 billion) mostly due to the Parent’s share in the increased net income partly offset by its share in the unrealized fair value loss on financial assets at FVOCI and in the net losses on cash flow hedge deferred in equity. Total comprehensive income for the period attributable to non-controlling interests Total comprehensive income attributable to non-controlling interests increased by ₱1.2 billion or 15% (from ₱7.6 billion to ₱8.8 billion) primarily due to higher net income attributable to non-controlling interest for the period, partly offset losses on cash flow hedge deferred in equity. (Continued next page)
16

Consolidated Statements of Financial Position Horizontal and Vertical Analyses of Material Changes as of September 30, 2019 and December 31, 2018
17

Assets As of September 30, 2019, the Group’s consolidated assets totaled ₱369.8 billion, slightly higher by ₱1.3 billion compared to the December 31, 2018 consolidated balance of ₱368.5 billion. The material changes in asset accounts are discussed as follows: Cash and cash equivalents – increased by ₱4.9 billion or 14% (from ₱36.1 billion to ₱41.0 billion) and accounted for 11% and 10% of total assets for 2019 and 2018 respectively. The increase mainly represents the higher cash generated from the Group’s operating activities during the first three quarters (see Consolidated Statements of Cash Flows), partly offset by disbursements for the Parent and First Gen Group’s share buyback programs, scheduled principal and interest payments for outstanding loans, and payment of dividends during the period. Contract assets, including noncurrent portion – decreased by ₱836 million or 5% (from ₱17.3 billion to ₱16.4 billion) and accounted for 4% of total assets for both periods. This was mainly due to Rockwell’s lower level of noncurrent contract assets as at period-end. Inventories – up by ₱2.1 billion or 11% (from ₱19.4 billion to ₱21.5 billion) and accounted for 6% and 5% of total assets for 2019 and 2018, respectively. This was mostly due to First Gen group’s higher fuel inventories following liquid fuel importation and purchases during the period. Other current financial assets - declined by ₱1.9 billion or 41% (from ₱4.6 billion to ₱2.7 billion) and accounted for 1% of total assets for both periods. This mainly resulted from lower level of First Gen group’s DSRA account as well as the reclassification of its restricted cash to cash and cash equivalents account. Prepayments and other current assets- increased by ₱980 million or 12% (from ₱8.1 billion to ₱9.1 billion) and accounted for 3% and 2% of total assets for 2019 and 2018, respectively. This was mainly on account of rise in First Gen group’s prepaid expense coupled with increase in advances to contractors of Rockwell. Investment Properties- net- decreased by ₱1.0 billion or 5% (from ₱20.1 billion to ₱19.1 billion) and accounted for 5% and 6% of total assets for 2019 and 2018, respectively. This was mainly on account of the normal depreciation of the investment properties partly reduced by the additions made by Rockwell and FPIP group during the period. Investment in associates and joint ventures- up by ₱396 million or 10% (from ₱3.9 billion to ₱4.3 billion) and accounted for 1% of total assets for both periods. The increase was mainly on account of the higher income of the JV company from rental escalation and increase reimbursable charges for the leased properties. Deferred tax assets – net – increased by ₱200 million or 9% (from ₱2.3 billion to ₱2.5 billion) and accounted for 1% of total assets for both periods. This was mainly due to First Gen group’s higher level of deferred tax assets following favorable movements in foreign exchange rates as a result of the appreciation of the Philippine Peso against the U.S. Dollar in the period ended September 30, 2019. Other noncurrent assets and other noncurrent financial assets – increased by a total of ₱1.4 billion or 7% (from ₱19.4 billion to ₱20.8 billion) and accounted for 6% and 5% of total assets for 2019 and 2018, respectively. This mainly reflects the recognition of the right-of-use assets (net of amortization) pertaining to long term leases of the Group and First Gen’s higher prepaid major spare parts brought
18

by the capitalization of their operating and maintenance charges to cover the estimated cost of turbine blades that are projected to be replaced in the next scheduled major maintenance outage. Liabilities and equity As of September 30, 2019, the Group’s consolidated liabilities and equity totaled ₱369.8 billion, higher by ₱1.3 billion compared to the December 31, 2018 consolidated balance of ₱368.5 billion. Material movements in liabilities and equity accounts are discussed as follows: Loans payable – higher by ₱1.0 billion or 254% (from ₱403 million to ₱1.4 billion) and accounted for less than 1% of total assets for both periods. The increase was primarily driven by the loan availment of First Gen group during the period. Income tax payable – was up by ₱360 million or 68% (from ₱532 million to ₱892 million) and accounted for less than 1% of total assets for both periods. The increase is primarily due to higher taxable earnings in 2019 and higher period-end balance mostly from EDC’s and FG Hydro’s higher income tax payable. Long-term debt, including current portion – decreased by ₱14.4 billion or 10% (from ₱150.3 billion to ₱135.9 billion) and accounted for 37% and 41% of total assets for 2019 and 2018, respectively. The decrease was primarily due to various scheduled principal payments of the Group. Asset retirement and preservation obligation – went up by ₱386 million or 16% (from ₱2.4 billion to ₱2.8 billion) and accounted for 1% of total assets for both periods. The movement was largely caused by EDC’s change in estimate of the related obligations. Other noncurrent liabilities – went up by ₱2.4 billion or 78% (from ₱3.0 billion to ₱5.4 billion) and accounted for 1% of total assets for both periods. The movement was largely caused by the recognition of lease liability as a result of the adoption of the new accounting standard for leases and the increase in Rockwell’s noncurrent retention payable and customers’ deposits. Total equity attributable to equity holders of the Parent – increased by ₱5.1 billion or 5% (from ₱97.9 billion to ₱103.0 billion) and accounted for 28% and 27% of total assets for 2019 and 2018, respectively. The following major items brought about the net increase in the account:
(1) Accumulated unrealized fair value gains on financial assets at FVOCI decreased by ₱462 million or 5% largely due to the decline in market price of the Meralco shares held by the Group (share price of ₱370.0 per share at September 30, 2019 vs. ₱380.0 per share at December 31, 2018);
(2) Treasury stock (negative amount) increased by ₱2.4 billion or 54% due to the Parent’s common share buyback during the first nine months of 2019; and
(3) Unappropriated retained earnings increased by ₱8.4 billion or 12% (from ₱73.1 billion to
₱81.5 billion) reflecting the comprehensive income attributable to the Parent.
19

Non-controlling interests – increased by ₱6.2 billion or 9% (from ₱68.4 billion to ₱74.6 billion) and accounted for 20% and 19% of total assets for 2019 and 2018, respectively. Non-controlling interests represent the portion of net assets not held by the Group, particularly in First Gen and EDC, Rockwell, FPIP and AEI. The increase was mainly due to non-controlling interests’ share in the Group’s net earnings, dividend declarations, and other comprehensive income.
* * * * *
20

KEY PERFORMANCE INDICATORS
The following are the key performance indicators of the Group:
Performance Indicator YTD September 30
2019 2018 *
Return on Average Shareholders’ Equity (%) * - annualized 11.28 9.25
Interest Coverage Ratio 4.48 3.93
Diluted Earnings per Share 18.363 12.863 *As restated
Annualized return on average equity increased from 9.25% in 2018 to 11.28% this year following the upswing in annualized earnings by ₱3.0 billion or 31% (from ₱9.8 billion to ₱12.8 billion), toned down by higher average stockholders’ equity attributable to Parent by ₱7.7 billion or 7% (from ₱105.9 billion to ₱113.6 billion). Interest coverage ratio increased from 3.93:1 in 2018 to 4.48:1 this year due to higher earnings before interest and tax by ₱4.3 billion or 18% (₱23.9 billion to ₱28.2 billion), modulated by the increase in finance cost amounting to ₱202 million or 3% (from ₱6.1 billion to ₱6.3 billion). Earnings per common share (diluted) increased from ₱12.863 to ₱18.363 or 43% as the growth in consolidated net income attributable to equity holders of the Parent resulted into higher net earnings available to common shareholders for the current period. The weighted average number of issued and outstanding shares was also lower at period-end due to the treasury shares acquired by the Parent during the period ended September 30, 2019.
Performance Indicator September 30 December 31
2019 2018
Asset to Equity Ratio 2.08 2.22
Debt to Equity Ratio 0.77 0.90
Current Ratio 1.79 1.88
Quick Ratio 1.08 1.11
Book Value per Common Share * ₱228.968 ₱205.725
The ratio of total assets to total equity decreased from 2.22:1 in 2018 to 2.08:1 this year mainly due to the increase in stockholders’ equity by ₱11.3 billion or 7%, modestly subdued by the ₱1.3 billion increase in total assets (from ₱368.5 billion at December 2018 to ₱369.8 billion at September 2019). The debt to equity ratio decreased from 0.90:1 in 2018 to 0.77:1 this year traceable from the decrease in total interest-bearing debt by ₱14.4 billion or 10% (from ₱150.3 billion at December 2018 to
21

₱135.9 billion at September 2019), complemented by higher total stockholders’ equity during the period. Current ratio decreased from 1.88:1 in 2018 to 1.79:1 this year mainly due to the increase in the balance of current liabilities by ₱6.2 billion or 11% (from ₱58.0 billion in December 2018 to ₱64.2 billion in September 2019), jointly attributable to the ₱4.8 billion increase the current portion of long-term debt and the ₱1.0 billion increase in short-term loans. This was tempered by the increase in current assets by ₱6.5 billion or 6% (from ₱108.8 billion to ₱115.3 billion), particularly cash and cash equivalents and inventories. Quick ratio decreased from 1.11:1 in 2018 to 1.08:1 this year principally as a result of the increase in the Group’s current liabilities and the decrease in other current financial assets, partly offset by the combined ₱7.0 billion or 13% increase in the Group’s cash and cash equivalents and inventories. Book value per common share grew from ₱205.725 in 2018 to ₱228.968 this year. The increase was brought about by the ₱5.6 billion or 5% increase (from ₱110.9 billion in December 2018 to ₱116.5 billion in September 2019) in equity attributable to equity holders of the parent for the current period, which mostly reflects the net income generated during the period coupled with the decrease in outstanding common stock at period-end following the acquisition of treasury shares during the period.
The following are key performance indicators of First Gen group (consolidated):
Performance Indicator September 30 September 30 December 31
2019 2018 2018
Current Ratio 1.66 1.84 1.71
Asset to Equity Ratio 2.03 2.20 2.23
Debt to Equity Ratio 1.03 1.20 1.23
Quick Ratio 1.35 1.42 1.38
Return on Assets (%) - annualized 7.97 5.37 6.05
Return on Equity(%) - annualized 16.93 11.92 13.49
Interest-bearing Debt to Equity Ratio (times) 0.80 0.98 0.98
22

The following are EDC group’s (consolidated) key performance indicators:
Performance Indicator YTD September 30
2019 2018
Current Ratio 1.51 2.58
Debt to Equity Ratio 0.94 0.98
Net Debt to Equity Ratio 0.70 0.69
Return on Assets (%) 8.72 5.68
Return on Equity (%) 18.97 12.99
Solvency Ratio 0.23 0.17
Interest Coverage Ratio 3.93 3.12
Asset to Equity Ratio 2.18 2.17 The following are the key performance indicators of the Rockwell:
Performance Indicator YTD September 30
2019
2018 (As restated)
Return on Assets (%) 5.2 5.0
Return on Equity (%) 14.4 13.9
Performance Indicator September 30 December 31
2019 2018
Current Ratio 1.89 2.19
Debt to Equity Ratio 1.15 1.26
Net Debt to Equity Ratio 1.01 1.15
Asset to Equity Ratio 2.80 2.95
Interest coverage Ratio 4.93 3.85
23

Key Performance Indicator/ Description
Annualized Return on Average Shareholders’ Equity Annualized net income attributable to Parent divided by average shareholders’ equity. This ratio reflects how much the firm has earned on the funds invested by the shareholders. Interest Rate Coverage Ratio Earnings before interest and taxes for the period divided by interest expense of the same period. This ratio determines how easily a company can pay interest on outstanding debt. Earnings Per Share Net income attributable to Parent divided by weighted average shares outstanding. This measures the portion of Group’s profit allocated to each outstanding share of common stock. Asset to Equity Ratio Total assets divided by total stockholders’ equity. This ratio shows the Group’s leverage, the amount of debt used to finance the firm. Debt to Equity Ratio Total interest-bearing debts divided by stockholders’ equity. This ratio expresses the relationship between capital contributed by the creditors and the owners. Current Ratio Total current assets divided by total current liabilities. This ratio is a rough indication of a company’s ability to pay its short-term obligations. Quick Ratio Current assets (excluding inventories and others) divided by current liabilities. This is an indicator of the Group’s ability to pay short-term obligations with its most liquid assets (cash and cash equivalents, short-term investments and trade and other receivables). Book Value Per Share Equity attributable to Parent divided by number of shares outstanding at period end. Measure used by owners of common shares in a firm to determine the level of safety associated with each individual share after all debts are paid. Net Debt to Equity Ratio Total interest-bearing debts less cash & cash equivalents divided by stockholders’ equity. This ratio measures the company’s financial leverage and stability. A negative net debt-to-equity ratio means that the total of cash and cash equivalents exceeds interest-bearing liabilities. Return on Assets Annual net income divided by average total assets. This ratio indicates how profitable a company is relative to its total assets. This also gives an idea as to how efficient management is at using its assets to generate earnings.
24

Return on Equity Annual net income divided by average total stockholders’ equity. This ratio reveals how much profit a company earned in comparison to the total amount of shareholder equity found on the balance sheet. Interest Rate Coverage Ratio Earnings before interest and taxes of one period divided by interest expense of the same period. This ratio determines how easily a company can pay interest on outstanding debt. Asset-to-Equity Ratio Total assets divided by total stockholders’ equity. This ratio shows a company’s leverage, the amount of debt used to finance the firm. Solvency Ratio Net income excluding depreciation and non-cash provisions divided by total debt obligations. This ratio gauges a company’s ability to meet its long-term obligations. Interest-bearing Debt to Equity Ratio (times) Calculated by dividing total interest-bearing debt over total equity. This ratio measures the percentage of funds provided by the lenders/creditors. * - Equity pertains to equity attributable to equity holders of the parent and excludes cumulative translation adjustments, share in other comprehensive income, effect of equity transaction of subsidiaries and excess of acquisition cost over carrying value of minority interest.
* * * * *
25

Other Financial Information (i) Any known trends, demands, commitments, events or uncertainties that will have a material impact on the
issuer’s liquidity. There are no known trends, demands, commitments, events or uncertainties that will have a material impact
on liquidity except as otherwise disclosed or discussed herein. (ii) Any event that will trigger direct or contingent financial obligation that is material to the company, including
any default or acceleration of an obligation. The registrant’s current financing arrangements include standard provisions relating to events of default.
Any breach of the loan covenants or material adverse change may result in an event of default. The company is in compliance with its loan covenants during the reporting period.
(iii) All material off-balance sheet transactions, arrangements, obligations (including contingent obligations),
and other relationships of the company with unconsolidated entities or other persons created during the reporting period.
The company did not enter into any material off-balance sheet transactions, arrangements, obligations
(including contingent obligations), and other relationships with unconsolidated entities or other persons during the reporting period.
(iv) Any material commitment for capital expenditures, the general purpose of such commitments, and the
expected sources of funds for such expenditures should be described. There are no material commitments for capital expenditures except as otherwise disclosed or discussed
herein. (v) Any known trends, events or uncertainties that have had or that are reasonably expected to have a material
impact on net sales or revenues or income from continuing operations. There are no known trends, events or uncertainties that have had or that are reasonably expected to have a
material impact on net sales or revenues or income from continuing operations except as otherwise disclosed or discussed herein.
(vi) Any significant elements of income or loss that did not arise from the registrant’s continuing operations. During the period, there are no significant elements of income or loss that did not arise from the registrant’s
continuing operations. PART II--OTHER INFORMATION The Company has no other information that needs to be disclosed other than disclosures made under SEC Form 17-C or as discussed herein.
26

55.8% E
50.6% V&E
53.92% V&E
78.95% V
LOPEZ HOLDINGS CORPORATION AND SUBSIDIARIES
MAP OF RELATIONSHIP OF THE COMPANIES WITHIN THE GROUP
SEPTEMBER 30, 2019
27

FIRST PHILIPPINE HOLDINGS CORP. AND SUBSIDIARIES
CORPORATE STRUCTURE
September 30, 2019
100%
Therma One Transport
Corporation
50.60%
First Philippine Holdings
First Gen Corporation
86.58% Rockwell Land Corporation
70.00% First Philippine
Industrial Park, Inc.
100% First Philippine
Electric Corporation
89.04%
First Philec Solar Corporation
99.15%
Philippine Electric Corporation
100% First Balfour, Inc.
100.00% First Philippine
Industrial Corporation
100% Securities Transfer
Services, Inc.
67% TerraPrime, Inc.
100%
ThermaPrime Drilling Corporation
Power Generation Property
Manufacturing 30.00% Panay Electric Company
Power Distribution
Other Businesses
100%
First Philec Manufacturing Technologies Corporation
100% First Philec Inc. (formerly First Electro Dynamics Corp.
100%
First Philippine Power Systems
100% First PV Ventures Corporation
70.00% First Philec Nexolon
Corporation
100% First Philec Solar
Solutions
100% FPH Fund
100%
FPH Ventures 100% FGHC International
100% First Philippine
Utilities Corporation
100% First Philippine Realty
Corporation
98.00% FPHC Realty and
Development Corporation 100%
FPH Capital Resources Inc.
100% Rockwell Integrated Property
Services, Inc. 100%
Primaries Development Corporation
100% Stonewell Property
Development Corporation
100%
Cleantech Energy Holdings PTE, Ltd.
100% Primaries Properties Sales
Specialists Inc.
100%
First Philippine Properties Corp.
100% First
Philippine Dev’t Corp.
76.4% Rockwell Leisure Club, Inc.
100% Rockwell Hotels and Leisure
Management Corp.
100% FPH Land
Ventures Inc.
100%
FPIP Property Developers and Management Corporation
100%
FPIP Utilities Incorporated
85.00%
Grand Batangas Resort Development Incorporated
40.52% First Batangas Hotel Corp.
25% MHE-Demag (P), Inc. 100%
FWV Biofields
Corp.
60% First
Sumiden Realty, Inc.
100% First
Industrial Township
Utilities, Inc.
100% Retailscapes Inc.
60% Rockwell Primaries South
Development Corp.
3.94% Manila Electric Company
100.00% First Philec Energy
Solutions, Inc.
100%
Torreverde Corp.
100% First Industrial Science & Technology School, Inc.
68.30% Asian Eye
Institute, Inc.
100% FP Island Energy Corp.
80% Rockwell-MFA Corp.
100% PI Health Inc.
100% PI Energy Inc.
100% Legacy Homes
Inc.
100% First Industrial Township, Inc.
100% First Industrial Township Water, Inc.
28

FIRST GEN CORPORATE STRUCTURE
as of September 30, 2019
Economic = 67.05%
29

EDC Corporate Structure
as of September 30, 2019
30
31

COVER SHEET for
UNAUDITED INTERIM CONSOLIDATED FINANCIAL STATEMENTS SEC Registration Number
1 9 0 7 3
Company Name
F I R S T P H I L I P P I N E H O L D I N G S C O R P
O R A T I O N
Principal Office (No./Street/Barangay/City/Town/Province)
6 t h F l o o r , R o c k w e l l B u s i n e s s
C e n t e r T o w e r 3 , O r t i g a s A v e n u e
P a s i g C i t y
Form Type Department requiring the report Secondary License Type, If Applicable
C F S - U N A U D I T E D
COMPANY INFORMATION
Company’s Email Address Company’s Telephone Number/s Mobile Number
[email protected] (02) 8631-8024
No. of Stockholders Annual Meeting
Month/Day Fiscal Year Month/Day
12,006 May 25 (Note: Scheduled on May 10 in 2019)
December 31
CONTACT PERSON INFORMATION The designated contact person MUST be an Officer of the Corporation
Name of Contact Person Email Address Telephone Number/s Mobile Number
Carmina Z. Ubaña [email protected] 3449-6253 09173279054
Contact Person’s Address
6th
Floor, Rockwell Business Center Tower 3, Ortigas Avenue, Pasig City, 1604 Philippines
Note: In case of death, resignation or cessation of office of the officer designated as contact person, such incident shall be reported to the Commission within thirty (30) calendar days from the occurrence thereof with information and complete contact details of the new contact person designated.
32

EXHIBIT “A”
33

First Philippine Holdings Corporation and Subsidiaries
Unaudited Interim Condensed Consolidated Financial Statements
September 30, 2019 and 2018 (With Comparative Audited Figures as at December 31, 2018)
34

FIRST PHILIPPINE HOLDINGS CORPORATION AND SUBSIDIARIESUNAUDITED INTERIM CONSOLIDATED STATEMENTS OF FINANCIAL POSITION(Amounts in Millions)
(Unaudited) (Audited)September 30 December 31 Increase (Decrease)
2019 2018 Amount %ASSETSCurrent AssetsCash and cash equivalents (Note 5) ₱40,968) ₱36,072) ₱4,896) 14%Short-term investments (Note 5) ( 3,818) ( 3,847) ( (29) -1%Trade and other receivables - net (Note 6) ( 24,701) ( 24,594) ( 107) 0%Current portion of contract assets ( 12,461) ( 12,101) ( 360) 3%Inventories ( 21,555) ( 19,450) ( 2,105) 11%Other current financial assets ( 2,703) ( 4,574) ( (1,871) -41%Prepayments and other current assets ( 9,119) ( 8,139) ( 980) 12% Total Current Assets ( 115,325) ( 108,777) ( 6,548) 6%Noncurrent AssetsProperty, plant and equipment - net ( 135,988) ( 139,908) ( (3,920) -3%Goodwill and intangible assets ( 50,802) ( 51,228) ( (426) -1%Investment properties - net ( 19,079) ( 20,147) ( (1,068) -5%Financial assets at fair value through other comprehensive income (FVOCI) (Note 7) ( 16,999) ( 17,599) ( (600) -3%Investments in associates and joint ventures ( 4,331) ( 3,935) ( 396) 10%Contract assets - net of current portion ( 3,979) ( 5,175) ( (1,196) -23%Deferred tax assets - net ( 2,519) ( 2,319) ( 200) 9%Other noncurrent financial assets ( 550) ( 826) ( (276) -33%Other noncurrent assets - net ( 20,209) ( 18,542) ( 1,667) 9% Total Noncurrent Assets ( 254,456) ( 259,679) ( (5,223) -2%TOTAL ASSETS ₱369,781) ₱368,456) ₱1,325) 0%
LIABILITIES AND EQUITYCurrent LiabilitiesTrade payables and other current liabilities (Note 8) ₱38,214) ₱38,162) ₱52) 0%Current portion of long-term debts (Note 9) ( 23,717) ( 18,909) ( 4,808) 25%Loans payable ( 1,427) ( 403) ( 1,024) 254%Income tax payable ( 892) ( 532) ( 360) 68% Total Current Liabilities ( 64,250) ( 58,006) ( 6,244) 11%(Forward)
35

(Unaudited) (Audited)September 30 December 31 Increase (Decrease)
2019 2018 Amount %Noncurrent LiabilitiesLong-term debts - net of current portion (Note 9) ₱112,204 ₱131,398 (₱19,194) -15%Retirement and other long-term employee benefits liability ( 2,767) ( 2,726) ( 41) 2%Deferred tax liabilities - net ( 4,810) ( 4,652) ( 158) 3%Asset retirement and preservation obligations ( 2,764) ( 2,378) ( 386) 16%Other noncurrent liabilities ( 5,399) ( 3,037) ( 2,362) 78% Total Noncurrent Liabilities ( 127,944) ( 144,191) ( (16,247) -11% Total Liabilities ( 192,194) ( 202,197) ( (10,003) -5%
EquityCommon stock ( 6,096) ( 6,096) ( - ) 0%Preferred stock ( 360) ( 360) ( - ) 0%Capital in excess of par value ( 5,506) ( 5,506) ( - ) 0%Accumulated unrealized fair value gains on financial assets at FVOCI ( 8,461) ( 8,923) ( (462) -5%Cumulative translation adjustments ( (10,085) ( (9,524) ( (561) 6%Equity reserve ( (8,312) ( (8,459) ( 147) -2%Retained earnings Unappropriated ( 81,485) ( 73,055) ( 8,430) 12% Appropriated ( 26,432) ( 26,432) ( - ) 0%Treasury stock ( (6,926) ( (4,492) ( (2,434) 54%Equity Attributable to Equity Holders of the Parent ( 103,017) ( 97,897) ( 5,120) 5%Non-controlling Interests ( 74,570) ( 68,362) ( 6,208) 9% Total Equity ( 177,587) ( 166,259) ( 11,328) 7%
TOTAL LIABILITIES AND EQUITY ₱369,781 ₱368,456 ₱1,325) 0%
36

FIRST PHILIPPINE HOLDINGS CORPORATION AND SUBSIDIARIESUNAUDITED INTERIM CONSOLIDATED STATEMENTS OF INCOME(Amounts in Millions Except Per Share Data)
Nine Months Ended September 30 Increase (Decrease)2019 2018 Amount (%)
(As restated)
REVENUESSale of electricity ₱84,300) ₱76,339) ₱7,961) 10%Sale of real estate ( 7,692) ( 9,022) ( (1,330) -15%Contracts and services ( 6,053) ( 4,062) ( 1,991) 49%Sale of merchandise ( 1,722) ( 1,765) ( (43) -2%
( 99,767) ( 91,188) ( 8,579) 9%
COSTS AND EXPENSESCosts of sale of electricity ( 54,228) ( 49,833) ( 4,395) 9%Real estate sold ( 4,815) ( 7,106) ( (2,291) -32%Contracts and services ( 3,202) ( 1,485) ( 1,717) 116%Merchandise sold ( 1,126) ( 1,194) ( (68) -6%General and administrative expenses ( 12,344) ( 10,277) ( 2,067) 20%
( 75,715) ( 69,895) ( 5,820) 8%
OTHER INCOME (CHARGES)Finance costs ( (6,288) ( (6,086) ( (202) 3%Finance income ( 2,259) ( 2,132) ( 127) 6%Foreign exchange gains (losses) ( 44) ( (1,343) ( 1,387) 103%Equity in net earnings of associates and joint venture ( 189) ( 100) ( 89) 89%Dividend income (Note 7) ( 753) ( 597) ( 156) 26%Others - net ( 887) ( 1,153) ( (266) -23%
( (2,156) ( (3,447) ( 1,291) 37%INCOME BEFORE INCOME TAX ( 21,896) ( 17,846) ( 4,050) 23%
PROVISION FOR (BENEFIT FROM) INCOME TAX Current ( 4,174) ( 3,662) ( 512) 14%Deferred ( (345) ( 543) ( (888) -164%
( 3,829) ( 4,205) ( (376) -9%
NET INCOME ₱18,067) ₱13,641) ₱4,426) 32%
Attributable ToEquity holders of the Parent ₱9,610) ₱7,132) ₱2,478) 35%Non-controlling Interests ( 8,457) ( 6,509) ( 1,948) 30%
₱18,067) ₱13,641) ₱4,426) 32%
Earnings Per Share for Net Income Attributable to the Equity Holders of the Parent (Note 10)Basic ₱18.363 ₱12.863 ₱5.500) 43%Diluted 18.363 12.863 ( 5.500) 43%
37
FIRST PHILIPPINE HOLDINGS CORPORATION AND SUBSIDIARIESUNAUDITED INTERIM CONSOLIDATED STATEMENTS OF INCOME(Amounts in Millions)
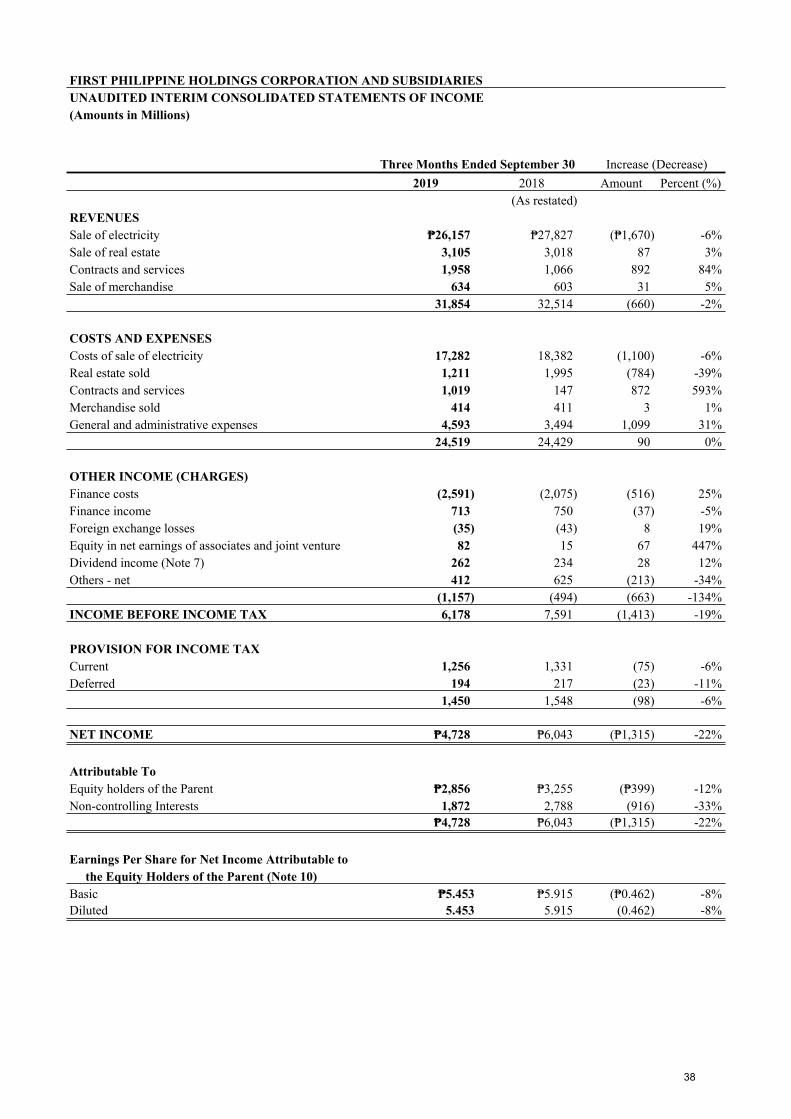
Three Months Ended September 30 Increase (Decrease)2019 2018 Amount Percent (%)
(As restated)REVENUESSale of electricity ₱26,157) ₱27,827) (₱1,670) -6%Sale of real estate ( 3,105) ( ( 3,018) ( 87) 3%Contracts and services ( 1,958) ( ( 1,066) ( 892) 84%Sale of merchandise ( 634) ( ( 603) ( 31) 5%
( 31,854) ( 32,514) ( (660) -2%
COSTS AND EXPENSESCosts of sale of electricity ( 17,282) ( ( 18,382) ( (1,100) -6%Real estate sold ( 1,211) ( ( 1,995) ( (784) -39%Contracts and services ( 1,019) ( ( 147) ( 872) 593%Merchandise sold ( 414) ( ( 411) ( 3) 1%General and administrative expenses ( 4,593) ( ( 3,494) ( 1,099) 31%
( 24,519) ( 24,429) ( 90) 0%
OTHER INCOME (CHARGES)Finance costs ( (2,591) ( ( (2,075) ( (516) 25%Finance income ( 713) ( ( 750) ( (37) -5%Foreign exchange losses ( (35) ( ( (43) ( 8) 19%Equity in net earnings of associates and joint venture ( 82) ( ( 15) ( 67) 447%Dividend income (Note 7) ( 262) ( ( 234) ( 28) 12%Others - net ( 412) ( ( 625) ( (213) -34%
( (1,157) ( (494) ( (663) -134%INCOME BEFORE INCOME TAX ( 6,178) ( 7,591) ( (1,413) -19%
PROVISION FOR INCOME TAX Current ( 1,256) ( ( 1,331) ( (75) -6%Deferred ( 194) ( ( 217) ( (23) -11%
( 1,450) ( 1,548) ( (98) -6%
NET INCOME ₱4,728) ₱6,043) (₱1,315) -22%
Attributable ToEquity holders of the Parent ₱2,856) ( ₱3,255) (₱399) -12%Non-controlling Interests ( 1,872) ( ( 2,788) ( (916) -33%
₱4,728) ₱6,043) (₱1,315) -22%
Earnings Per Share for Net Income Attributable to the Equity Holders of the Parent (Note 10)Basic ₱5.453 ₱5.915) (₱0.462) -8%Diluted 5.453 ( 5.915) ( (0.462) -8%
38

FIRST PHILIPPINE HOLDINGS CORPORATION AND SUBSIDIARIESUNAUDITED INTERIM CONSOLIDATED STATEMENTS OF COMPREHENSIVE INCOME(Amounts in Millions)
(Unaudited)Nine Months Ended September 30 Increase/(Decrease)
2019 2018 Amount Percent (%)(As restated)
NET INCOME ₱18,067) ₱13,641) ₱4,426) 32%
OTHER COMPREHENSIVE INCOME (LOSS)Other comprehensive income (loss) to be reclassified to profit or loss in subsequent periods: Net gains (losses) on cash flow hedge deferred in equity - net of tax (533) (2) (535) -100% Unrealized gains (losses) on financial assets at FVOCI (462) (529) (991) -187% Exchange losses on foreign currency translation (142) (189) (47) -25%
(1,137) (342) (1,479) -432%TOTAL COMPREHENSIVE INCOME FOR THE PERIOD ₱16,930) ₱13,983) ₱2,947) 21%
Attributable ToEquity holders of the Parent ₱8,130) ₱6,344) (1,786) 28%Non-controlling Interests (8,800) (7,639) (1,161) 15%
₱16,930) ₱13,983) ₱2,947) 21%
39

FIRST PHILIPPINE HOLDINGS CORPORATION AND SUBSIDIARIESUNAUDITED INTERIM CONSOLIDATED STATEMENTS OF CHANGES IN EQUITY(Amounts in Millions)
As of the period ended September 30, 2019 (Unaudited) Attributable to Equity Holders of the Parent
Common Stock
Preferred Stock
Capital in Excess of Par Value
Treasury Stock
Accumulated Unrealized Fair
Value Gain (Loss) on
Financial Assets at FVOCI
Cumulative Translation Adjustments
Equity Reserve
Unappropriated Retained Earnings
Appropriated Retained Earnings
Total Non- controlling Interests
Total Equity
Balance at December 31, 2018 ₱6,096) ₱360) ₱5,506) (₱4,492) ₱8,923) (₱9,524) (₱8,459) ₱73,055) ₱26,432) ₱97,897) ₱68,362) ₱166,259) Net income ( - ) ( - ) ( - ) ( - ) ( - ) ( - ) ( - ) ( 9,610) ( - ) ( 9,610) ( 8,457) ( 18,067) Other comprehensive income (loss) ( - ) ( - ) ( - ) ( - ) ( (462) ( (561) ( 147) ( (604) ( - ) ( (1,480) ( 343) ( (1,137) Total comprehensive income (loss) ( - ) ( - ) ( - ) ( - ) ( (462) ( (561) ( 147) ( 9,006) ( - ) ( 8,130) ( 8,800) ( 16,930) Buyback of treasury common stocks ( - ) ( - ) ( - ) ( (2,434) ( - ) ( - ) ( - ) ( - ) ( - ) ( (2,434) ( (167) ( (2,601) Dividends ( - ) ( - ) ( - ) ( - ) ( - ) ( - ) ( - ) ( (576) ( - ) ( (576) ( (2,425) ( (3,001) Balance at September 30, 2019 ₱6,096) ₱360) ₱5,506) (₱6,926) ₱8,461) (₱10,085) (₱8,312) ₱81,485) ₱26,432) ₱103,017) ₱74,570) ₱177,587)
As of the year ended December 31, 2018 (Audited) Attributable to Equity Holders of the Parent
Common Stock
Preferred Stock
Capital in Excess of Par Value
Treasury Stock
Accumulated Unrealized Fair
Value Gain (Loss) on
Financial Assets at FVOCI
Cumulative Translation Adjustments
Equity Reserve
Unappropriated Retained Earnings
Appropriated Retained Earnings
Total Non- controlling Interests
Total Equity
Balance at January 1, 2018 ₱6,096) ₱360) ₱5,506) (₱3,526) ₱6,598) (₱7,485) (₱8,657) ₱64,156) ₱26,432) ₱89,480) ₱77,424) ₱166,904) Adoption of PFRS 15 ( - ) ( - ) ( - ) ( - ) ( - ) ( - ) ( - ) ( (475) ( - ) ( (475) ( (74) ( (549) Adoption of PFRS 9 ( - ) ( - ) ( - ) ( - ) ( (4) ( (4) ( - ) ( (122) ( - ) ( (130) ( (60) ( (190) Balance as of January 1, 2018, as restated ( 6,096) ( 360) ( 5,506) ( (3,526) ( 6,594) ( (7,489) ( (8,657) ( 63,559) ( 26,432) ( 88,875) ( 77,290) ( 166,165) Net income ( - ) ( - ) ( - ) ( - ) ( - ) ( - ) ( - ) ( 10,281) ( - ) ( 10,281) ( 9,893) ( 20,174) Other comprehensive income (loss) ( - ) ( - ) ( - ) ( - ) ( 2,329) ( (2,035) ( - ) ( 406) ( - ) ( 700) ( (3,046) ( (2,346) Total comprehensive income (loss) ( - ) ( - ) ( - ) ( - ) ( 2,329) ( (2,035) ( - ) ( 10,687) ( - ) ( 10,981) ( 6,847) ( 17,828) Issuances of shares ( - ) ( - ) ( - ) ( - ) ( - ) ( - ) ( - ) ( - ) ( - ) ( - ) ( 1,985) ( 1,985) Buyback of treasury common stocks ( - ) ( - ) ( - ) ( (966) ( - ) ( - ) ( - ) ( - ) ( - ) ( (966) ( (2,227) ( (3,193) Cash dividends ( - ) ( - ) ( - ) ( - ) ( - ) ( - ) ( - ) ( (1,191) ( - ) ( (1,191) ( (1,201) ( (2,392) Share based payment ( - ) ( - ) ( - ) ( - ) ( - ) ( - ) ( - ) ( - ) ( - ) ( - ) ( 112) ( 112) Acquisition of non-controlling interests ( - ) ( - ) ( - ) ( - ) ( - ) ( - ) ( 198) ( - ) ( - ) ( 198) ( (14,444) ( (14,246) Balance at December 31, 2018 ₱6,096) ₱360) ₱5,506) (₱4,492) ₱8,923) (₱9,524) (₱8,459) ₱73,055) ₱26,432) ₱97,897) ₱68,362) ₱166,259)
40

FIRST PHILIPPINE HOLDINGS CORPORATION AND SUBSIDIARIESUNAUDITED INTERIM CONSOLIDATED STATEMENTS OF CHANGES IN EQUITY(Amounts in Millions)
As of the period ended September 30, 2019 (Unaudited) Attributable to Equity Holders of the Parent
Common Stock
Preferred Stock
Capital in Excess of Par Value
Treasury Stock
Accumulated Unrealized Fair
Value Gain (Loss) on Financial
Assets at FVOCI
Cumulative Translation Adjustments
Equity Reserve
Unappropriated Retained Earnings
Appropriated Retained Earnings
Total Non- controlling Interests
Total Equity
Balance at December 31, 2018 ₱6,096) ₱360) ₱5,506) (₱4,492) ₱8,923) (₱9,524) (₱8,459) ₱73,055) ₱26,432) ₱97,897) ₱68,362) ₱166,259) Net income ( - ) ( - ) ( - ) ( - ) ( - ) ( - ) ( - ) ( 9,610) ( - ) ( 9,610) ( 8,457) ( 18,067) Other comprehensive income (loss) ( - ) ( - ) ( - ) ( - ) ( (462) ( (561) ( 147) ( (604) ( - ) ( (1,480) ( 343) ( (1,137) Total comprehensive income (loss) ( - ) ( - ) ( - ) ( - ) ( (462) ( (561) ( 147) ( 9,006) ( - ) ( 8,130) ( 8,800) ( 16,930) Buyback of treasury common stocks ( - ) ( - ) ( - ) ( (2,434) ( - ) ( - ) ( - ) ( - ) ( - ) ( (2,434) ( (167) ( (2,601) Dividends ( - ) ( - ) ( - ) ( - ) ( - ) ( - ) ( - ) ( (576) ( - ) ( (576) ( (2,425) ( (3,001) Balance at September 30, 2019 ₱6,096) ₱360) ₱5,506) (₱6,926) ₱8,461) (₱10,085) (₱8,312) ₱81,485) ₱26,432) ₱103,017) ₱74,570) ₱177,587)
As of the period ended September 30, 2018 (Unaudited, As restated) Attributable to Equity Holders of the Parent
Common Stock
Preferred Stock
Capital in Excess of Par Value
Treasury Stock
Accumulated Unrealized Fair
Value Gain (Loss) on Financial Assets
at FVOCI
Cumulative Translation Adjustments
Equity Reserve
Unappropriated Retained Earnings
Appropriated Retained Earnings
Total Non- controlling Interests
Total Equity
Balance at December 31, 2017 ₱6,096) ₱360) ₱5,506) (₱3,526) ₱6,598) (₱7,485) (₱8,657) ₱64,156) ₱26,432) ₱89,480) ₱77,424) ₱166,904) Adoption of PFRS 15 ( - ) ( - ) ( - ) ( - ) ( - ) ( - ) ( - ) ( (475) ( - ) ( (475) ( (74) ( (549) Adoption of PFRS 9 ( - ) ( - ) ( - ) ( - ) ( (4) ( (4) ( - ) ( (122) ( - ) ( (130) ( (60) ( (190) Balance as of January 1, 2018, as restated ( 6,096) ( 360) ( 5,506) ( (3,526) ( 6,594) ( (7,489) ( (8,657) ( 63,559) ( 26,432) ( 88,875) ( 77,290) ( 166,165) Net income ( - ) ( - ) ( - ) ( - ) ( - ) ( - ) ( - ) ( 7,132) ( - ) ( 7,132) ( 6,509) ( 13,641) Other comprehensive income (loss) ( - ) ( - ) ( - ) ( - ) ( 517) ( (1,827) - ( 522) - ( (788) ( 1,130) ( 342) Total comprehensive income (loss) ( - ) ( - ) ( - ) ( - ) ( 517) ( (1,827) ( - ) ( 7,654) ( - ) ( 6,344) ( 7,639) ( 13,983) Cash dividends ( - ) ( - ) ( - ) ( - ) ( - ) ( - ) ( - ) ( (601) ( - ) ( (601) ( - ) ( (601) Dividends of subsidiaries ( - ) ( - ) ( - ) ( - ) ( - ) ( - ) ( - ) ( - ) ( - ) ( - ) ( (906) ( (906) Buyback of treasury common stocks ( - ) ( - ) ( - ) ( (813) ( - ) ( - ) ( - ) ( - ) ( - ) ( (813) ( (2,227) ( (3,040) Balance at September 30, 2018 ₱6,096) ₱360) ₱5,506) (₱4,339) ₱7,111) (₱9,316) (₱8,657) ₱70,612) ₱26,432) ₱93,805) ₱81,796) ₱175,601)
41

FIRST PHILIPPINE HOLDINGS CORPORATION AND SUBSIDIARIESUNAUDITED INTERIM CONSOLIDATED STATEMENTS OF CASH FLOWS(Amounts in Millions)
(Unaudited) Nine Months Ended September 30
2019 2018(As restated)
CASH FLOWS FROM OPERATING ACTIVITIESIncome before income tax ₱21,896) ₱17,846)Adjustments for:
Finance costs 6,288 ( 6,086) Depreciation and amortization 9,778 ( 9,646) Finance income (2,259) ( (2,132) Dividend income (753) ( (597) Retirement benefit expense 190 ( 166) Equity in net earnings of associates and joint venture (189) ( (100) Loss on extinguishment of long-term debts 115 ( - ) Loss on direct write-off of Input VAT claims 43 ( 74) Provision for impairment of spare parts and supplies inventory 85 ( 104) Mark-to-market loss (gain) on financial assets at FVPL (76) ( 44) Mark-to-market loss (gain) on derivatives (19) ( 38) Gain on sale of property (57) ( - ) Unrealized foreign exchange losses (gains) - net (44) ( 1,343)
Operating income before working capital changes 34,998 ( 32,518) Decrease (increase) in:
Trade and other receivables and current portion of contract assets (467) ( (9,075) Inventories (2,105) ( (1,107) Other current assets 910 ( (1,845)
Increase in trade payables and other current liabilities 2,326 ( 752) Cash generated from operations 35,662 ( 21,243) Interest received 832 792Unrealized loss (gain) on financial assets at FVOCI 462 ( (529) Income tax paid (3,661) ( (3,327) Net cash from operating activities 33,295 ( 18,179)
CASH FLOWS FROM INVESTING ACTIVITIESAdditions to:
Property, plant and equipment and investment properties (6,543) ( (5,488) Financial assets at FVPL (3,074) ( (4,559) Intangibles ( (69) ( (15)
(Forward)
42

(Unaudited) Nine Months Ended September 30
2019 2018Decrease (increase) in:
Short-term investments ₱29) ₱1,878)Investments in associate and joint venture (207) ( (30) Other noncurrent assets and non-current portion of Contract Assets 561 ( 1,083) Exploration and evaluation assets (39) ( (22) Debt service reserve account 917 ( 92)
Decrease in derivative liabilities ( - ) ( (80) Proceeds from redemption of financial assets at FVPL 2,015 ( 1,315) Dividends received 712 ( 636) Proceeds from sale and incidental income from
testing property, plant and equipment ( 18) ( - ) Contributions to plan assets ( - ) ( (62) Net cash used in investing activities (5,680) ( (5,252)
CASH FLOWS FROM FINANCING ACTIVITIESProceeds from:
Borrowings from banks and other financial institutions 3,050 ( 11,182) Payments of:
Borrowings from banks and other financial institutions (17,110) ( (11,073) Interest (6,498) ( (5,483) Dividends to non-controlling interests ( (2,274) ( (995) Cash dividends (576) ( (566) Buyback of Preferred Stock ( (5) ( (4,786) Purchase of treasury Common Stock (2,434) ( (813)
Increase in other noncurrent liabilities 2,947 ( 1,456) Net cash used in financing activities (22,900) ( (11,078)
EFFECT OF EXCHANGE RATE CHANGESON CASH AND CASH EQUIVALENTS 181 ( 488)
NET INCREASE IN CASH AND CASH EQUIVALENTS 4,896 2,337CASH AND CASH EQUIVALENTS AT BEGINNING
OF PERIOD 36,072 ( 41,501)
CASH AND CASH EQUIVALENTS AT END OF PERIOD ₱40,968) ₱43,838)
See accompanying Notes to Unaudited Interim Condensed Consolidated Financial Statements.
43

FIRST PHILIPPINE HOLDINGS CORPORATION AND SUBSIDIARIES
SELECTED NOTES TO THE UNAUDITED INTERIM CONDENSED CONSOLIDATED
FINANCIAL STATEMENTS
1. Corporate Information
First Philippine Holdings Corporation (FPH or the Parent Company) was incorporated and
registered with the Philippine Securities and Exchange Commission (SEC) on June 30, 1961. On
June 29, 2007, the Philippine SEC approved the extension of the Parent Company‟s corporate life
for another 50 years from June 30, 2011. FPH and its subsidiaries (collectively referred to as the
Group) is engaged primarily in, but not limited to, power generation, real estate development,
manufacturing, construction, healthcare and other service industries.
FPH is 50.60% and 47.77% owned by Lopez Holdings Corporation (Lopez Holdings), a publicly-
listed Philippine-based entity, as at September 30, 2019 and December 31, 2018, respectively.
Majority of Lopez Holdings is owned by Lopez, Inc., a Philippine entity and the ultimate Parent
Company.
The registered office address of FPH is at 6th Floor, Rockwell Business Center Tower 3, Ortigas
Avenue, Pasig City.
2. Summary of Significant Accounting Policies
Basis of Preparation
The unaudited interim condensed consolidated financial statements of the Group as of September
30, 2019, and for the nine-month periods ended September 30, 2019 and 2018 have been prepared
on a historical cost basis, except for derivative financial instruments, financial assets at FVPL and
FVOCI that have been measured at fair value.
Statement of Compliance
The unaudited interim condensed consolidated financial statements of the Group have been
prepared in accordance with PFRS‟ Philippine Accounting Standards (PAS) 34, Interim Financial
Reporting. Accordingly, the unaudited interim condensed consolidated financial statements do not
include all of the information and footnotes required in the annual consolidated financial
statements, and should be read in conjunction with FPH‟s annual consolidated financial
statements as at and for the year ended December 31, 2018.
Basis of Consolidation
The unaudited interim condensed consolidated financial statements comprise the financial
statements of FPH and its subsidiaries. Control is achieved when FPH is exposed, or has rights, to
variable returns from its involvement with the investee and has the ability to affect those returns
through its power over the investee.
44

Specifically, FPH controls an investee if and only if FPH has:
● Power over an investee (i.e. existing rights that give it the current ability to direct the relevant
activities of the investee)
● Exposure, or rights, to variable returns from its involvement with the investee; and
● The ability to use its power over the investee to affect its returns.
Generally, there is a presumption that a majority of voting rights result in control. To support the
presumption and when the Group has less than a majority of the voting rights of an investee, the
Group considers all relevant facts and circumstances in assessing whether it has power over the
investee, including:
● the contractual arrangements with the other vote holders of the investee
● rights arising from other contractual arrangements
● the Group‟s voting rights and potential voting rights
The Group reassesses whether or not it controls an investee if facts and circumstances indicate
that there are changes to one or more of the three elements of control. Consolidation of a
subsidiary begins when the Group obtains control over the subsidiary and ceases when the Group
loses control over the subsidiary. Assets, liabilities, income and expenses of a subsidiary acquired
or disposed of during the period are included in the unaudited interim consolidated statements of
income from the date the Group gains control until the date when the Group ceases to control the
subsidiary.
Profit or loss and each component of other comprehensive income are attributed to the owners of
FPH and to the non-controlling interests even if this results in the non-controlling interests having
a deficit balance. When necessary, adjustments are made to the financial statements of
subsidiaries to bring their accounting policies in line with the Group‟s accounting policies. All
intra-group assets, liabilities, income, expenses and cash flows relating to transactions between
members of the Group are eliminated in full on consolidation.
A change in the ownership interest of a subsidiary, without a loss of control, is accounted for as
an equity transaction. Any excess or deficit of consideration paid over the carrying amount of the
non-controlling interest is recognized as part of “Equity reserve” account in the equity attributable
to the equity holders of the Parent.
If the Group loses control over a subsidiary, it derecognizes the related assets (including
goodwill), liabilities, non-controlling interest and other components of equity while any resulting
gain or loss is recognized in profit or loss. Any movement retained is recognized at fair value.
Significant Changes in Accounting Policies and Disclosures
The accounting policies adopted in the preparation of the unaudited interim condensed
consolidated financial statements are consistent with those followed in the preparation of the
annual consolidated financial statements as at and for the year ended December 31, 2018, except
for the adoption of the following amended accounting standards that became effective beginning
January 1, 2019.
45

The nature and the effect of these changes are disclosed below:
● Amendments to PFRS 9, Prepayment Features with Negative Compensation
Under PFRS 9, a debt instrument can be measured at amortized cost or at fair value
through other comprehensive income, provided that the contractual cash flows are
„solely payments of principal and interest on the principal amount outstanding‟ (the
SPPI criterion) and the instrument is held within the appropriate business model for
that classification. The amendments to PFRS 9 clarify that a financial asset passes
the SPPI criterion regardless of the event or circumstance that causes the early
termination of the contract and irrespective of which party pays or receives
reasonable compensation for the early termination of the contract.
The amendments have no impact on the Group‟s unaudited interim condensed
consolidated financial statements.
● PFRS 16, Leases
PFRS 16 sets out the principles for the recognition, measurement, presentation and
disclosure of leases and requires lessees to account for all leases under a single on-
balance sheet model similar to the accounting for finance leases under PAS 17,
Leases. The standard includes two recognition exemptions for lessees – leases of
‟low-value‟ assets (e.g., personal computers) and short-term leases (i.e., leases with a
lease term of 12 months or less). At the commencement date of a lease, a lessee will
recognize a liability to make lease payments (i.e., the lease liability) and an asset
representing the right to use the underlying asset during the lease term (i.e., the right-
of-use asset). Lessees will be required to separately recognize the interest expense on
the lease liability and the depreciation expense on the right-of-use asset.
Lessees will be also required to remeasure the lease liability upon the occurrence of
certain events (e.g., a change in the lease term, a change in future lease payments
resulting from a change in an index or rate used to determine those payments). The
lessee will generally recognize the amount of the remeasurement of the lease liability
as an adjustment to the right-of-use asset.
Lessor accounting under PFRS 16 is substantially unchanged from today‟s
accounting under PAS 17. Lessors will continue to classify all leases using the same
classification principle as in PAS 17 and distinguish between two types of leases:
operating and finance leases.
PFRS 16 also requires lessees and lessors to make more extensive disclosures than
under PAS 17.
A lessee can choose to apply the standard using either a full retrospective or a
modified retrospective approach. The standard‟s transition provisions permit certain
reliefs.
The Group applied the modified retrospective approach upon adoption of PFRS 16 on
January 1, 2019 and applied the standard to contracts that were previously identified as
46

leases applying PAS 17 and Philippine Interpretation IFRIC 4, Determining whether an
Arrangement contains a Lease. The Group, therefore, did not apply the standard to
contracts that were not previously identified as containing a lease applying PAS 17 and
Philippine Interpretation IFRIC 4.
The Group elected to use the exemptions provided by the standard on lease contracts
for which the lease terms ends within 12 months as at the date of initial application, and
lease contracts for which the underlying asset is of low value.
The cash flows from operating activities have increased and cash flows from financing
cash flows decreased as repayment of the principal portion of the lease liabilities were
classified as cash flows from financing activities. In addition, total assets and total
liabilities have increased due to the recognition of right-of- use asset and lease liability.
The accounting for operating leases where we act as the lessee will significantly change
due to the adoption of PFRS 16.
Set out below are the amounts by which each financial statement line item is affected as
of and for the period ended September 30, 2019 as a result of the adoption of PFRS 16.
The adoption of PFRS 16 did not have a material impact on other comprehensive
income or on operating, investing and financing cash flows. The first column shows
amounts prepared under PFRS 16 and the second column shows what the amounts
would have been had PFRS 16 not been adopted.
Unaudited Consolidated Statements of Income for the Nine Months Ended
September 30, 2019
in Php Millions PFRS 16 PAS 17 Increase (Decrease)
Expenses:
Rent ₱- (₱141) (₱141)
Depreciation and amortization 193 - 193
Financing Costs 103 - 103
Net income for the period ₱296 (₱141) ₱155
Unaudited Consolidated Statements of Financial Position As of the Period Ended September 30, 2019
in Php Millions
PFRS 16
PAS 17 Increase (Decrease)
Assets:
Right-of-use assets ₱1,099 ₱- ₱1,099
Liabilities:
Lease liabilities – net of current portion 1,136 - 1,136
Current portion of lease liabilities 166 - 166
Total Liabilities ₱1,302 ₱- ₱1,302
Upon adoption of PFRS 16, the Group applied a single recognition and measurement approach for all leases, except for short-term leases and leases of „low-value‟ assets. The standard provides specific transition requirements and practical expedients, which the Group have applied.
Leases previously accounted for as operating leases The Group recognized right-of-use assets and lease liabilities for those leases previously classified as operating leases, except for short-term leases and leases of „low-value‟ assets. The right-of-use assets were recognized based on the carrying amount as if the
47
standard had always been applied, apart from the use of incremental borrowing rates at the date of initial application. Lease liabilities were recognized based on the present value of the remaining lease payments, discounted using the incremental borrowing rate at the date of initial application.
The Group also applied the available practical expedients wherein the Group:
● Applied the short-term leases exemptions to leases with lease term that
ends within 12 months at the date of initial application;
● Excluded the initial direct costs from the measurement of the right-of-
use asset at the date of initial application;
● Used hindsight in determining the lease term where the contract
contains options to extend or terminate the lease; and
● Elected not to separate non-lease components from lease components
and accounted them as single lease component.
Based on the foregoing, as at September 30, 2019:
● Right-of -use assets of ₱1.1 billion were recognized and presented separately under “Other noncurrent assets” account in the unaudited interim consolidated statement of financial position.
● Lease liabilities of ₱1.3 billion were recognized and presented separately under “Trade payables and other current liabilities” and “Other noncurrent liabilities” in the unaudited interim consolidated statement of financial position.
● Amendments to PAS 19, Employee Benefits, Plan Amendment, Curtailment or
Settlement
The amendments to PAS 19 address the accounting when a plan amendment,
curtailment or settlement occurs during a reporting period. The amendments specify
that when a plan amendment, curtailment or settlement occurs during the annual
reporting period, an entity is required to:
● Determine current service cost for the remainder of the period after the plan
amendment, curtailment or settlement, using the actuarial assumptions used
to remeasure the net defined benefit liability (asset) reflecting the benefits
offered under the plan and the plan assets after that event; and
● Determine net interest for the remainder of the period after the plan
amendment, curtailment or settlement using: the net defined benefit liability
(asset) reflecting the benefits offered under the plan and the plan assets after
that event; and the discount rate used to remeasure that net defined benefit
liability (asset).
The amendments also clarify that an entity first determines any past service cost, or a
gain or loss on settlement, without considering the effect of the asset ceiling. This
amount is recognized in profit or loss. An entity then determines the effect of the
asset ceiling after the plan amendment, curtailment or settlement. Any change in that
48

effect, excluding amounts included in the net interest, is recognized in other
comprehensive income.
The Group is currently assessing the impact of adopting the amendments to PAS 19.
● Amendments to PAS 28, Long-term Interests in Associates and Joint Ventures
The amendments clarify that an entity applies PFRS 9 to long-term interests in an
associate or joint venture to which the equity method is not applied but that, in
substance, form part of the net investment in the associate or joint venture (long-term
interests). This clarification is relevant because it implies that the expected credit loss
model in PFRS 9 applies to such long-term interests.
The amendments also clarified that, in applying PFRS 9, an entity does not take
account of any losses of the associate or joint venture, or any impairment losses on
the net investment, recognized as adjustments to the net investment in the associate or
joint venture that arise from applying PAS 28, Investments in Associates and Joint
Ventures.
The Group is currently assessing the impact of adopting the amendments to PAS 28.
● Philippine Interpretation IFRIC-23, Uncertainty over Income Tax Treatments
The interpretation addresses the accounting for income taxes when tax treatments
involve uncertainty that affects the application of PAS 12, Income Taxes and does not
apply to taxes or levies outside the scope of PAS 12, nor does it specifically include
requirements relating to interest and penalties associated with uncertain tax
treatments.
The interpretation specifically addresses the following:
● Whether an entity considers uncertain tax treatments separately
● The assumptions an entity makes about the examination of tax treatments by
taxation authorities
● How an entity determines taxable profit (tax loss), tax bases, unused tax
losses, unused tax credits and tax rates
● How an entity considers changes in facts and circumstances
An entity must determine whether to consider each uncertain tax treatment separately
or together with one or more other uncertain tax treatments. The approach that better
predicts the resolution of the uncertainty should be followed.
The Group is currently assessing the impact of adopting this interpretation.
Annual Improvements to PFRSs 2016-2018 Cycle
● Amendments to PFRS 3, Business Combinations, and PFRS 11, Joint Arrangements,
Previously Held Interest in a Joint Operation
49

The amendments clarify that, when an entity obtains control of a business that is a
joint operation, it applies the requirements for a business combination achieved in
stages, including remeasuring previously held interests in the assets and liabilities of
the joint operation at fair value. In doing so, the acquirer remeasures its entire
previously held interest in the joint operation.
A party that participates in, but does not have joint control of, a joint operation might
obtain joint control of the joint operation in which the activity of the joint operation
constitutes a business as defined in PFRS 3. The amendments clarify that the
previously held interests in that joint operation are not remeasured.
These amendments are currently not applicable to the Group but may apply to future
transactions.
● Amendments to PAS 12, Income Tax Consequences of Payments on Financial
Instruments Classified as Equity
The amendments clarify that the income tax consequences of dividends are linked
more directly to past transactions or events that generated distributable profits than to
distributions to owners. Therefore, an entity recognizes the income tax consequences
of dividends in profit or loss, other comprehensive income or equity according to
where the entity originally recognized those past transactions or events.
These amendments are not relevant to the Group because dividends declared by the
Group do not give rise to tax obligations under the current tax laws.
● Amendments to PAS 23, Borrowing Costs, Borrowing Costs Eligible for
Capitalization
The amendments clarify that an entity treats as part of general borrowings any
borrowing originally made to develop a qualifying asset when substantially all of the
activities necessary to prepare that asset for its intended use or sale are complete.
An entity applies those amendments to borrowing costs incurred on or after the
beginning of the annual reporting period in which the entity first applies those
amendments.
Since the Group‟s current practice is in line with the clarifications issued, the
interpretation has no significant impact on its unaudited interim condensed
consolidated financial statements.
50

3. Operating Segment Information
Operating segments are components of the Group (a) that engage in business activities from
which they may earn revenues and incur expenses; (b) with operating results which are regularly
reviewed by the Group‟s chief operating decision-maker (the BOD) to make decisions about how
resources are to be allocated to the segment and assess their performances; and (c) for which
discrete financial information is available.
The Group‟s operating businesses are organized and managed separately according to the nature
of the products and services, with each segment representing a strategic business unit that offers
different products and serves different markets.
The Group conducts majority of its business activities in the following areas:
● Power generation – power generation subsidiaries under First Gen Corporation (First Gen)
● Real estate development – residential and commercial real estate development and leasing of
Rockwell Land Corporation (Rockwell) and First Philippine Realty Corporation (FPRC), and
sale of industrial lots and lease of ready-built factories by First Philippine Industrial Park
(FPIP)
● Manufacturing – electrical transformers and other manufacturing subsidiaries under First
Philippine Electric Corporation (First Philec)
● Construction and other services – investment holdings, oil transporting, construction,
geothermal well drilling, healthcare, education and other services.
Segment revenue, segment expenses and segment performance include transfers between business
segments. The transfers are accounted for at competitive market prices charged to unrelated
customers for similar products. Such transfers are eliminated in consolidation.
The operations of these business segments are substantially in the Philippines. First Gen‟s
revenues are substantially generated from sale of electricity to Meralco, the sole customer of First
Gas Power Corporation (FGPC), FGP Corp. (FGP), and, beginning June 26, 2018, First NatGas
Power Corp. (FNPC); while a significant portion of Energy Development Corporation‟s (EDC)
total revenues are derived from existing long-term Power Purchase Agreement (PPAs) with
National Power Corporation (NPC).
51

Financial information about the business segments follows:
September 30, 2019
(Php in Millions) Power
Generation
Real Estate
Development Manufacturing
Construction
and Other
Services Eliminations Consolidated
Revenues:
External sales ₱ 84,222 ₱ 9,882 ₱ 1,722 ₱ 3,941 - ₱ 99,767
Inter-segment sales 1,586 (1,586) -
Total revenues 84,222 9,882 1,722 5,527 (1,586) 99,767
Costs and expenses (62,089) (7,691) (1,358) (6,099) 1,522 (75,715)
Finance income 835 1,306 16 332 (230) 2,259
Finance costs (4,912) (994) (8) (383) 9 (6,288)
Foreign exchange gain (loss) 90 - (13) (33) - 44
Equity in net earnings of
associates and joint ventures - 224 - 65 (100) 189
Other income (loss) 352 619 7 911 (249) 1,640
Income (loss) before income tax 18,498 3,346 366 320 (634) 21,896
Provision for income tax (2,672) (965) (133) (27) (32) (3,829)
Net income ₱ 15,826 ₱ 2,381 ₱ 233 ₱ 293 (₱666) ₱ 18,067
September 30, 2018 (As restated)
(Php in Millions) Power
Generation
Real Estate
Development Manufacturing
Construction
and Other
Services Eliminations Consolidated
Revenues:
External sales ₱ 76,339 ₱ 10,900 ₱ 1,765 ₱ 2,184 - ₱ 91,188
Inter-segment sales 1,283 (1,283) -
Total revenues 76,339 10,900 1,765 3,467 (1,283) 91,188
Costs and expenses (56,829) (8,939) (1,354) (3,952) 1,179 (69,895)
Finance income 694 1,362 0 76 - 2,132
Finance costs (5,359) (306) (11) (421) 11 (6,086)
Foreign exchange gain (loss) (1,515) 7 (1) 166 - (1,343) Equity in net earnings of
associates
and a joint venture - 199 - (99) - 100
Other income (loss) 1,319 (379) 24 532 254 1,750
Income (loss) before income
tax 14,649 2,844 423 (231) 161 17,846
Provision for income tax (3,409) (749) (39) (75) 67 (4,205)
Net income ₱ 11,240 ₱ 2,095 ₱ 384 (₱ 306) ₱ 228 ₱ 13,641
52

Following table shows the computation of Recurring Net Income (RNI):
(In millions)
September 30,
2019
September 30,
2018
(As restated)
Net income attributable to equity holders of the Parent ₱9,610 ₱7,132
Add (deduct) share of equity holders of the Parent in
non-recurring items:
ERP/MRP- related costs of EDC 186 -
Proceeds from insurance claims (127) (371)
Movements in deferred income tax (118) 368
Expenses on debt extinguishment 35 -
Expenses related to typhoon and earthquake
damages 1 244
Unrealized foreign exchange loss 1 588
Other non-recurring losses 40 27
RNI attributable to equity holders of the Parent ₱9,628 ₱7,988
53

4. Subsidiaries and Significant Acquisitions
The consolidated financial statements comprise the financial statements of FPH and the following subsidiaries.
September 30, 2019 (Unaudited) December 31, 2018 (Audited) Place of Incorporation Percentage of ownership held by the Group Subsidiaries and Operation Direct Indirect Direct Indirect Power Generation First Gen Corporation (First Gen) Philippines 67.42 – 66.98 – First Gen Renewables, Inc. Philippines – 100.00 – 100.00 FG Bukidnon Power Corp. (FG Bukidnon) Philippines – 100.00 – 100.00 Unified Holdings Corporation (Unified) Philippines – 100.00 – 100.00 FGP Corp. (FGP) 5 Philippines – 100.00 – 100.00 AlliedGen Power Corporation Philippines – 100.00 – 100.00 First NatGas Power Corporation (FNPC) Philippines – 100.00 – 100.00 First Gen Luzon Power Corporation. Philippines – 100.00 – 100.00 First Gen Visayas Hydro Power Corporation (FG Visayas) Philippines – 100.00 – 100.00 First Gen Mindanao Hydro Power Corporation (FG Mindanao) Philippines – 100.00 – 100.00 FGen Northern Mindanao Holdings, Inc. (FNMHI) Philippines – 100.00 – 100.00 FGen Bubunawan Hydro Corporation (FG Bubunawan) Philippines – 100.00 – 100.00 FGen Cabadbaran Hydro Corporation (FG Cabadbaran) Philippines – 100.00 – 100.00 FGen Puyo Hydro Corporation (FG Puyo) Philippines – 100.00 – 100.00 FG Mindanao Renewables Corp. (FMRC) Philippines – 100.00 – 100.00 FGen Tagoloan Hydro Corporation (FG Tagoloan) Philippines – 100.00 – 100.00 FGen Tumalaong Hydro Corporation (FG Tumalaong) Philippines – 100.00 – 100.00 First Gen Ecopower Solutions, Inc. Philippines – 100.00 – 100.00 First Gen Energy Solutions, Inc. (FGES) Philippines – 100.00 – 100.00 First Gen Premier Energy Corporation Philippines – 100.00 – 100.00 First Gen Prime Energy Corporation Philippines – 100.00 – 100.00 First Gen Visayas Energy Corporation Philippines – 100.00 – 100.00 Northern Terracotta Power Corporation (Northern Terracotta) Philippines – 100.00 – 100.00 Blue Vulcan Holdings Corporation Philippines – 100.00 – 100.00 Prime Meridian Powergen Corporation (PMPC) Philippines – 100.00 – 100.00 Goldsilk Holdings Corporation (Goldsilk) Philippines – 100.00 – 100.00 Dualcore Holdings, Inc. (Dualcore) Philippines – 100.00 – 100.00 Onecore Holdings, Inc. (Onecore) Philippines – 100.00 – 100.00 First Gas Holdings Corporation (FGHC) Philippines – 100.00 – 100.00 First Gas Power Corporation (FGPC) Philippines – 100.00 – 100.00 First Gas Pipeline Corporation Philippines – 100.00 – 100.00 FGLand Corporation (FG Land) Philippines – 100.00 – 100.00 FGEN LNG Corporation (FGEN LNG) Philippines – 100.00 – 100.00
54

First Gen LNG Holdings Corporation (LNG Holdings) Philippines – 100.00 – 100.00 First Gen Meridian Holdings, Inc. (FGEN Meridian) Philippines – 100.00 – 100.00 FGen Power Ventures, Inc. (FGEN Power Ventures) Philippines – 100.00 – 100.00 FGen Casecnan Hydro Power Corp. (FGEN Casecnan) Philippines – 100.00 – 100.00 FGen Power Holdings, Inc. (Power Holdings) Philippines – 100.00 – 100.00 FGen Prime Holdings, Inc. (Prime Holdings) Philippines – 100.00 – 100.00 FGen Eco Solutions Holdings, Inc. (FGESHI) Philippines – 100.00 – 100.00 FGen Liquefied Natural Gas Holdings, Inc. (Liquefied Holdings) Philippines – 100.00 – 100.00 FGen Reliable Energy Holdings, Inc. (FG Reliable Energy) Philippines – 100.00 – 100.00 FGen Power Solutions, Inc. (FG Power Solutions) Philippines – 100.00 – 100.00 FGen Vibrant Blue Sky Holdings, Inc. (FGVBSHI) Philippines – 100.00 – 100.00 FGen Aqua Power Holdings, Inc. (Aqua Power) Philippines – 100.00 – 100.00 First Gen Hydro Power Corporation (FG Hydro) Philippines – 100.00 – 100.00 FGen Natural Gas Supply, Inc. (FGen NatGas Supply) Philippines – 100.00 – 100.00 FGen Power Operations, Inc. (FPOI) Philippines – 100.00 – 100.00 FGen Fuel Line Systems, Inc. (FGen Fuel Line) Philippines – 100.00 – 100.00 Prime Terracota Holdings Corporation (Prime Terracota) Philippines – 100.00 – 100.00 Red Vulcan Holdings Corporation (Red Vulcan) Philippines – 100.00 – 100.00 Energy Development Corporation (EDC)
1Philippines – 60.00 – 60.00
EDC Drillco Corporation Philippines – 100.00 – 100.00 EDC Geothermal Corp. (EGC) Philippines – 100.00 – 100.00 Green Core Geothermal Inc. (GCGI) Philippines – 100.00 – 100.00 Bac-Man Geothermal Inc. (BGI) Philippines – 100.00 – 100.00 Unified Leyte Geothermal Energy Inc. (ULGEI) Philippines – 100.00 – 100.00 Southern Negros Geothermal, Inc. (SNGI) Philippines – 100.00 – 100.00 Bac-Man Energy Development Corporation (BEDC) Philippines – 100.00 – 100.00 EDC Wind Energy Holdings, Inc. (EWEHI) Philippines – 100.00 – 100.00 EDC Burgos Wind Power Corporation (EBWPC) Philippines – 100.00 – 100.00 EDC Pagudpud Wind Power Corporation (EPWPC) Philippines – 100.00 – 100.00 EDC Bayog Burgos Power Corporation (EBBPC) Philippines – 100.00 – 100.00 EDC Pagali Burgos Wind Power Corporation (EPBWPC) Philippines – 100.00 – 100.00 Matnog 1 Renewable Energy Corporation Philippines – 100.00 – 100.00 Matnog 2 Renewable Energy Corporation Philippines – 100.00 – 100.00 Matnog 3 Renewable Energy Corporation Philippines – 100.00 – 100.00 Iloilo 1 Renewable Energy Corporation Philippines – 100.00 – 100.00 Negros 1 Renewable Energy Corporation Philippines – 100.00 – 100.00 EDC Corporation Chile Limitada Santiago, Chile – 100.00 – 100.00 EDC Holdings International Limited (EHIL) EDC Hong Kong Limited (EDC HKL) British Virgin Islands – 100.00 – 100.00 EDC Chile Holdings SpA Santiago, Chile – 100.00 – 100.00
1First Gen’s economic interest in EDC is 45.7% as at September 30, 2019 and December 31, 2018.
55

EDC Geotermica Chile SpA Santiago, Chile – 100.00 – 100.00 EDC Peru Holdings S.A.C Lima, Peru – 100.00 – 100.00 EDC Geotermica Peru S.A.C Lima, Peru – 100.00 – 100.00 EDC Peru S. A. C. Lima, Peru – 100.00 – 100.00 EDC Geotermica Del Sur S.A.C. Lima, Peru – 100.00 – 100.00 EDC Energia Azul S.A.C. Lima, Peru – 100.00 – 100.00 Geothermica Crucero Peru S.A.C. Lima, Peru – 70.00 – 70.00 EDC Energía Perú S.A.C. Lima, Peru – 100.00 – 100.00 Geothermica Tutupaca Norte Peru S.A.C. Lima, Peru – 100.00 – 100.00 EDC Energía Geotérmica S.A.C. Lima, Peru – 100.00 – 100.00 EDC Progreso Geotérmico Perú S.A.C. Lima, Peru – 100.00 – 100.00 Geothermica Loriscota Peru S.A.C. Lima, Peru – 100.00 – 100.00 EDC Energía Renovable Perú S.A.C. Lima, Peru – 100.00 – 100.00 EDC Soluciones Sostenibles Ltd Philippines – 100.00 – 100.00 EDC Energia Verde Chile SpA Philippines – 100.00 – 100.00 EDC Energia de la Tierra SpA Philippines – 100.00 – 100.00 EDC Desarollo Sostenible Ltd Philippines – 100.00 – 100.00 EDC Energia Verde Peru SAC Philippines – 100.00 – 100.00 PT EDC Indonesia Jakarta Pusat, Indonesia – 95.00 – 95.00 PT EDC Panas Bumi Indonesia Jakarta Pusat, Indonesia – 95.00 – 95.00 EDC Bright Solar Energy Holdings, Inc. (EBSEHI) Philippines – 100.00 – 100.00 EDC Siklab Power Corporation (EDC Siklab) Philippines – 100.00 – 100.00 EDC Sinag Power Corporation (Sinag), formerly EDC Burgos Solar Corporation (EBSC) Philippines – 100.00 – 100.00 EDC Sinag Iloilo Power Corporation (EDC Sinag Iloilo), formerly EMGI Philippines – 100.00 – 100.00 EDC Siklab Iloilo Power Corporation (Siklab Iloilo), formerly KGI Philippines – 100.00 – 100.00 EDC Clean Solar Visayas Power Corporation (ECSVPC), MAREI Philippines – 100.00 – 100.00 Batangas Cogeneration Corporation (Batangas Cogen) Philippines 60.00 – 60.00 – Manufacturing First Philec Philippines 100.00 – 100.00 – First Philec Inc. (FPI) (formerly FEDCOR) Philippines – 100.00 – 100.00 First Philippine Power Systems, Inc. (FPPSI) Philippines – 100.00 – 100.00 First Philec Manufacturing Technologies Corporation (FPMTC) Philippines – 100.00 – 100.00 First PV Ventures Corporation (First PV) Philippines – 100.00 – 100.00 First Philec Nexolon Corporation (FPNC) Philippines – 70.00 – 70.00 First Philec Solar Solutions Corporation Philippines – 100.00 – 100.00 Philippine Electric Corporation (PHILEC) Philippines – 99.20 – 99.20 First Philec Solar Corporation Philippines – 89.04 – 89.04 Cleantech Energy Holdings PTE, Ltd. Philippines – 100.00 – 100.00 First Philec Energy Solutions, Inc. Philippines – 100.00 – 100.00 Real Estate Development First Philippine Realty Development Corporation (FPRDC) Philippines 100.00 – 100.00 – First Philippine Realty Corporation (FPRC) Philippines 100.00 – 100.00 –
56

First Philippine Properties Corporation (FPPC) Philippines 100.00 – 100.00 – FPH Land Venture, Inc. (FLVI) Philippines – 100.00 – 100.00 Terraprime, Inc. (Terraprime) Philippines – 66.67 – 66.67 First Industrial Township, Inc. (FITI) Philippines – – – – First Industrial Township Utilities, Inc. (FITUI) Philippines – 100.00 – 100.00 First Industrial Township Water, Inc. (FITWI) Philippines – – – – First Philippine Development Corp. (FPDC) Philippines – 100.00 – 100.00 FWV Biofields Corp. (FWVB) Philippines – 100.00 – 100.00 First Sumiden Realty, Inc. (FSRI) Philippines – 60.00 – 60.00 Legacy Homes Inc. Philippines – 100.00 – 100.00 FPHC Realty and Development Corporation (FPHC Realty) Philippines 98.00 – 98.00 – Rockwell Land Corporation (Rockwell Land) Philippines 86.58 – 86.58 –
Rockwell Integrated Property Services, Inc. Philippines – 100.00 – 100.00 Rockwell Primaries Development Corporation (formerly, Rockwell Homes, Inc.) Philippines – 100.00 – 100.00 ATR KimEng Land, Inc. Philippines – 60.00 – 60.00 Rockwell Hotels & Leisure Management Corporation Philippines – 100.00 – 100.00 Stonewell Property Development Corporation Philippines – 100.00 – 100.00 Primaries Properties Sales Specialist Inc. Philippines – 100.00 – 100.00 Rockwell Leisure Club, Inc. (RLCI) Philippines – 77.00 – 77.00 Rockwell Primaries South Development Corporation Philippines – 100.00 – 60.00 Rockwell MFA Corp. (Rock MFA) Philippines – 80.00 – 80.00 Retailscapes, Inc. Philippines – 100.00 – 100.00 First Philippine Industrial Park, Inc. (FPIP) Philippines 70.00 – 70.00 – FPIP Property Developers and Management Corporation Philippines – 100.00 – 100.00 FPIP Utilities, Inc. Philippines – 100.00 – 100.00 Grand Batangas Resort Development, Inc. Philippines – 85.00 – 85.00 First Industrial Township, Inc. (FITI) Philippines – 100.00 – 100.00 First Industrial Township Water, Inc. (FITWI) Philippines – 100.00 – 100.00 Construction First Balfour, Inc. (First Balfour) Philippines 100.00 – 100.00 – Therma Prime Drilling Corporation (Therma Prime) Philippines – 100.00 – 100.00 Therma One Transport Corp. Philippines – 100.00 – 100.00 Torreverde Corp. Philippines – 100.00 – 100.00 First Balfour Management Technical Services, Inc. Philippines – 100.00 – 100.00 Others First Philippine Utilities Corporation (FPUC, formerly First Philippine Union Fenosa, Inc.) Philippines 100.00 – 100.00 – Securities Transfer Services, Inc. Philippines 100.00 – 100.00 – FPH Capital Resources, Inc. (FCRI, formerly First Philippine Lending Corporation) Philippines 100.00 – 100.00 – FGHC International Cayman Islands 100.00 – 100.00 – FPH Fund Cayman Islands 100.00 – 100.00 – FPH Ventures Cayman Islands – 100.00 – 100.00 FP Island Energy Corporation (FP Island) Philippines 100.00 – 100.00 –
57
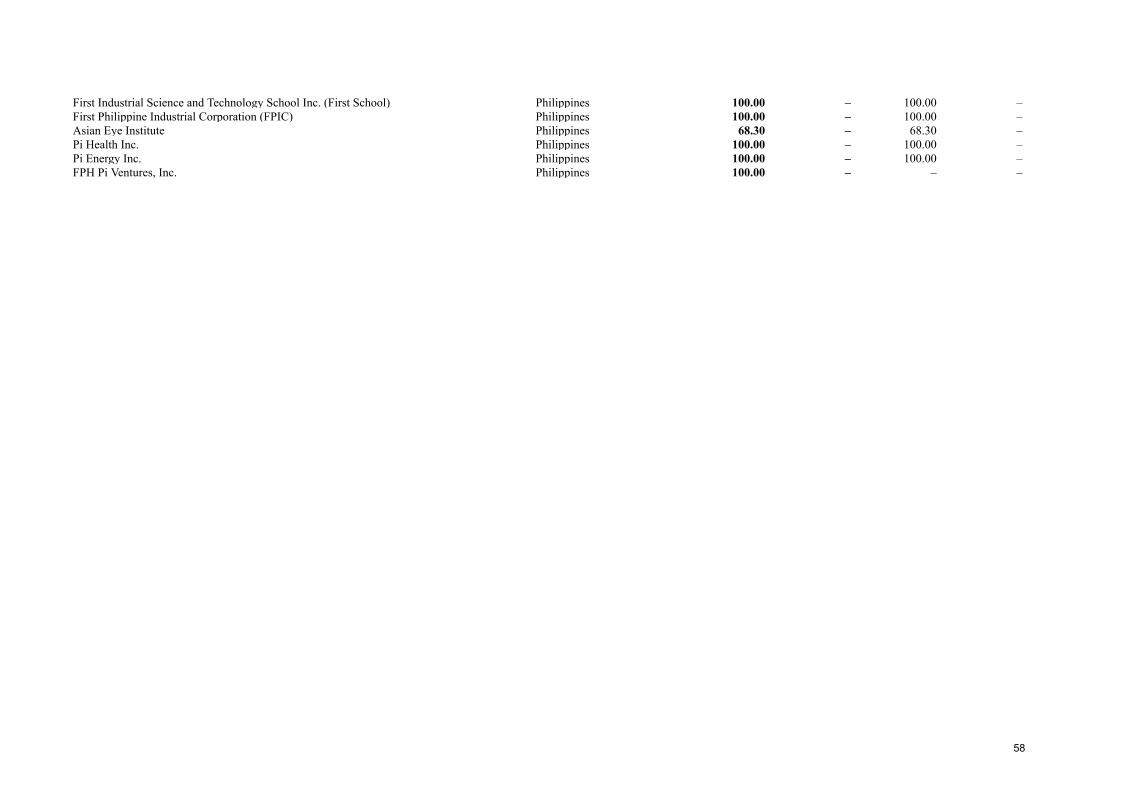
First Industrial Science and Technology School Inc. (First School) Philippines 100.00 – 100.00 – First Philippine Industrial Corporation (FPIC) Philippines 100.00 – 100.00 – Asian Eye Institute Philippines 68.30 – 68.30 – Pi Health Inc. Philippines 100.00 – 100.00 – Pi Energy Inc. Philippines 100.00 – 100.00 – FPH Pi Ventures, Inc. Philippines 100.00 – – –
58

5. Cash and cash equivalents and short-term investments
September 30,
2019
(Unaudited)
December 31,
2018
(Audited)
(In Millions)
Cash and cash equivalents ₱40,968 ₱36,072
Short-term investments 3,818 3,847
₱44,786 ₱39,919
Cash in banks earns interest at the prevailing bank deposit rates. Cash equivalents consist of
short-term placements, which are made for varying periods of up to three months depending on
the immediate cash requirements of the Group and earn interest at the prevailing short-term
placement rates. Short-term investments are cash deposits with maturities of more than three
months but less than one year.
Interest earned on cash and cash equivalents and short-term investments is recorded under
“Finance income” account in the unaudited interim consolidated statements of income.
6. Trade and other receivables
September 30,
2019
(Unaudited)
December 31,
2018
(Audited)
(In Millions)
Trade receivables from:
Sale of electricity ₱ 16,959 ₱19,779
Real estate 4,183 2,522
Contracts and services 3,016 1,239
Sale of merchandise 189 1,022
Others 94 166
Due from related parties and advances to 659 118
officers and employees
Others 454 612
25,554 25,458
Less allowance for impairment loss 853 864
₱24,701 ₱24,594
59

Aging of Trade and other receivables:
September 30, 2019 (Unaudited)
Neither Past Due Past Due but not Impaired
nor
Impaired < 30
Days 30–60
Days 61–90
Days 91–120
Days > 120
Days Total Impaired Total (In Millions)
Trade and other
receivables ₱18,934 ₱676 ₱172 ₱151 ₱4,227 ₱541 ₱5,767 ₱853 ₱25,554
December 31, 2018 (Audited)
Neither Past Due Past Due but not Impaired
nor
Impaired < 30
Days 30–60
Days 61–90
Days 91–120
Days > 120
Days Total Impaired Total (In Millions)
Trade and other
receivables ₱20,706 ₱326 ₱205 ₱2,885 ₱13 ₱459 ₱3,888 ₱864 ₱25,458
7. Financial Assets at FVOCI
The Group classified its remaining investment in Meralco shares to investment in equity securities
in accordance to PAS 39, Financial Instruments: Recognition and Measurement. Accordingly,
the remaining investment in Meralco is measured at fair value in the unaudited interim
consolidated statement of financial position and any fair value changes are recognized directly in
equity.
The Group‟s remaining interest in Meralco is 3.95% as at September 30, 2019 and December 31,
2018.
As at September 30, 2019 and December 31, 2018, the carrying amounts of the Group‟s
investment in Meralco amounted to ₱16,456 million (valued at ₱370 a share) and ₱16,901 million
(valued at ₱380 a share), respectively.
Dividend income from Meralco amounted to ₱714 million and ₱597 million for the nine months
ended September 30, 2019 and 2018, respectively.
60

8. Trade Payables and Other Current Liabilities
September 30,
2019
(Unaudited)
December 31,
2018
(Audited)
(In Millions)
First Gen and subsidiaries ₱19,688 ₱22,703
Rockwell and subsidiaries 9,432 7,936
First Balfour and subsidiaries 3,935 3,001
First Philec and subsidiaries 2,073 1,051
FPH 1,904 2,200
FPIP and subsidiaries 533 594
First Philippine Properties Corporation and
subsidiaries 182 265
First Philippine Industrial Corporation 181 185
Asian Eye Institute, Inc. 123 74
First Philippine Realty Corporation 112 100
First Philippine Capital Resources, Inc. 34 34
First Industrial Science and Technology School
Inc. 7 5
Pi Energy Inc. 5 -
FP Island Energy, Inc. 2 13
Securities Transfer Services, Inc. 2 1
FGHC International 1 -
₱38,214 ₱38,162
9. Long-term Debts
September 30, 2019
(Unaudited)
December 31, 2018
(Audited)
Current Long-term Current Long-term
(In Millions)
Power Generation ₱15,331 ₱87,804 ₱12,154 ₱104,721
Real Estate Development 6,995 17,480 5,151 19,624
FPH 1,147 6,089 1,285 6,740
Construction and Other Services 189 776 264 217
Manufacturing 55 55 55 96
₱23,717 ₱112,204 ₱18,909 ₱131,398
61

10. Earnings Per Share Computation
The following table presents information necessary to compute earnings per share for the periods
ended September 30, 2019 and 2018 :
2019
(Unaudited)
2018
(Unaudited,
As restated)
(In Millions, Except Number of Shares and Per Share Data)
Net income attributable to equity holders of the Parent ₱ 9,610 ₱7,132
Less dividends on preferred shares 74 74
(a) Net income available to common shares ₱ 9,536 ₱ 7,058
Number of shares:
Common shares outstanding at beginning of period 539,098,374 554,206,569
Effect of common share buyback during the period (19,793,022) (5,502,215)
(b) Adjusted weighted average number of common 519,305,352 548,704,354
shares outstanding - basic
Basic/Diluted Earnings Per Share (a/b) ₱18.363 ₱12.863
11. Financial Risk Management Objectives and Policies
The Group‟s principal financial liabilities consist of loans payable and long-term debts. The main
purpose of these financial liabilities is to raise funds for the Group‟s growth and operations. The
Group has other various financial instruments such as cash equivalents, short-term investments,
trade and other receivables, investments in equity securities, trade payables and other current
liabilities which arise directly from its operations. The Group also enters into derivative and
hedging transactions, primarily interest rate swaps, cross-currency swap and foreign currency
forwards, as needed, for the sole purpose of managing the relevant financial risks that are
associated with the Group‟s borrowing activities and as required by the lenders in certain cases.
The Group has an Enterprise-wide Risk Management Program which aims to identify risks based
on the likelihood of occurrence and impact to the business, formulate risk management strategies,
assess risk management capabilities and continuously monitor the risk management efforts. The
main financial risks arising from the Group‟s financial instruments are interest rate risk, foreign
currency risk, credit risk, liquidity risk, credit concentration risk, and equity price risk.
Foreign Currency Risk
Foreign currency risk is the risk that the fair value or future cash flows of a financial instrument
will fluctuate because of changes in foreign exchange rates.
Foreign Currency Risk with Respect to U.S. Dollar. The Group, except First Gen group, FSRI,
FPSC, First PV, FPNC, FGHC International and FPH Fund, is exposed to foreign currency risk
through cash and cash equivalents and short-term investments denominated in U.S. dollar. Any
62

depreciation of the Philippine peso against the U.S. dollar posts foreign exchange gains relating to
cash and cash equivalents and short-term investments.
To better manage the foreign exchange risk, stabilize cash flows, and further improve the
investment and cash flow planning, the Group may consider derivative contracts and other
hedging products as necessary. The U.S.dollar denominated monetary assets are translated to
Philippine peso using the exchange rate of ₱51.83 to US$1.00 and ₱52.58 to US$1.00 as at
September 30, 2019 and December 31, 2018, respectively.
Credit Risk Exposure. The table below shows the gross maximum exposure to credit risk of the
Group as at:
September 30,
2019
(Unaudited)
December 31,
2018
(Audited)
(In Millions)
Accounted for as cash flow hedge
Derivative assets ₱82 ₱244
Financial assets at FVPL
Designated as at FVPL 2,071 905
At amortized cost under PFRS 9
Cash and cash equivalents* 40,964 36,060
Short-term investments 3,818 3,847
Trade and other receivables:
Trade 23,588 23,864
Others 1,113 730
Current portion of contract assets 12,461 12,101
Special deposits and funds 216 173
DSRA 505 3,147
Refundable deposits 109 113
Contract assets – net of current portion 3,979 5,175
Long-term receivables 268 418
Restricted cash 15 400
Financial assets at FVOCI
Quoted equity securities 16,237 17,003
Unquoted equity securities 618 323
Quoted government debt securities - 128
Proprietary membership 144 145
Total credit exposure ₱106,188 ₱104,776 * Excluding the Group’s cash on hand amounting to ₱4 million and ₱12 million as at September 30, 2019 and
December 31, 2018, respectively. The Group’s deposit accounts in certain banks are covered by the Philippine
Deposit Insurance Corporation insurance coverage.
63

The Group holds no significant collateral as security and there are no significant credit
enhancements in respect of the above assets.
Aging Analysis of Financial Assets. The following tables show the Group‟s aging analysis of past
due but not impaired financial assets as at September 30, 2019 and December 31, 2018:
September 30, 2019 (Unaudited)
Neither Past Due but not Impaired
Past Due
nor
Impaired
< 30
Days
30–60
Days
61–90
Days
91–120
Days
> 120
Days Total Impaired Total
(In Millions)
Financial assets at
amortized cost:
Cash and cash equivalents ₱40,968 ₱– ₱– ₱– ₱– ₱– ₱– ₱– ₱40,968
Short-term investments 3,818 – – – – – – – 3,818
Trade and other
receivables
18,934
676
172
151
4,227
541
5,767 853
25,554
Current portion of contract assets 12,461 – – – – – – – 12,461
Restricted cash 15 – – – – – – – 15
Special deposits and funds 216 – – – – – – – 216
DSRA 505 – – – – – – – 505
Refundable deposits 109 – – – – – – – 109
Contract assets – net of current portion 3,979 3,979
Long-term receivables 268 – – – – – – – 268
Financial Assets at
FVOCI
Quoted equity securities 16,237 – – – – – – – 16,237
Unquoted equity securities 618 – – – – – – – 618
Proprietary membership 144 – – – – – – – 144
Financial assets at FVPL -
FVPL investments 2,071 – – – – – – – 2,071
Financial assets accounted
for as cash flow hedge -
Derivative assets 82 – – – – – – – 82
₱100,425 ₱676 ₱172 ₱151 ₱4,227 ₱541 ₱5,767 ₱853 ₱107,045
December 31, 2018 (Audited)
Neither Past Due but not Impaired
Past Due
nor
Impaired
< 30
Days
30–60
Days
61–90
Days
91–120
Days
> 120
Days Total Impaired Total
(In Millions)
Financial assets at
amortized cost:
Cash and cash equivalents ₱36,072 ₱– ₱– ₱– ₱– ₱– ₱– ₱– ₱36,072 Short-term investments 3,847 – – – – – – – 3,847
Trade and other
receivables 20,706 326 205 2,885 13 459 3,888 864 25,458 Current portion of contract
assets 12,101 – – – – – – – 12,101
Restricted cash 400 400
Special deposits and funds 173 – – – – – – – 173
DSRA 3,147 – – – – – – – 3,147
Refundable deposits 113 – – – – – – – 113 Contract assets – net of
current portion 5,175 5,175
Long-term receivables 418 – – – – – – – 418
Financial Assets at
FVOCI
Quoted equity securities 17,003 – – – – – – – 17,003 Unquoted equity securities 323 – – – – – – – 323
Quoted government debt securities
128 – – – – – – –
128
Proprietary membership 145 – – – – – – – 145
Financial assets at FVPL - FVPL investments 905 – – – – – – – 905
64

Financial assets accounted
for as cash flow hedge -
Derivative assets ₱244 ₱– ₱– ₱– ₱– ₱– ₱– ₱– ₱244
₱100,900 ₱326 ₱205 ₱2,885 ₱13 ₱459 ₱3,888 ₱864 ₱105,652
Credit Quality of Neither Past Due Nor Impaired Financial Assets. The payment history of the
counterparties and their ability to settle their obligations are considered in evaluating credit
quality. Financial assets are classified as “high grade” if the counterparties are not expected to
default in settling their obligations, thus, credit exposure is minimal. These counterparties
normally include banks, related parties and customers who pay on or before due date. Financial
assets are classified as “standard grade” if the counterparties settle their obligations to the Group
with tolerable delays. Low grade accounts are accounts which have probability of impairment
based on historical trend. These accounts show propensity of default in payment despite regular
follow-up actions and extended payment terms.
As at September 30, 2019 and December 31, 2018, the financial assets categorized as neither past
due nor impaired are viewed by management as “high grade”.
Concentration of Credit Risk
The Group, through First Gen‟s operating subsidiaries namely, FGP, FGPC and FNPC, earns a
substantial portion of its revenues from Meralco. Meralco is committed to pay for the capacity
and energy generated by the San Lorenzo and Santa Rita power plants under the existing long-
term PPAs which are due to expire in September 2027 and August 2025, respectively. While the
PPAs provide for the mechanisms by which certain costs and obligations including fuel costs,
among others, are passed-through to Meralco or are otherwise recoverable from Meralco, it is the
intention of First Gen, FGP and FGPC to ensure that the pass-through mechanisms, as provided
for in their respective PPAs, are followed. Following the grant of the Interim Relief by the Energy
Regulatory Commission (ERC) on the Power Supply Agreement (PSA) between FNPC and
Meralco in June 2018, FNPC likewise earns all of its revenues from Meralco starting June 26,
2018. The PSA will expire on February 23, 2024 and can be extended upon mutual agreement
with Meralco.
EDC‟s geothermal and power generation businesses trade with two major customers, namely
NPC and National Transmission Corporation (TransCo). Any failure on the part of NPC and
TransCo to pay its obligations to EDC would significantly affect EDC‟s business operations.
The Group‟s exposure to credit risk arises from default of the counterparties, with a maximum
exposure equal to the carrying amounts of the receivables from Meralco, in the case of FGP,
FGPC and FNPC and the receivables from NPC and TransCo, in the case of EDC.
65

The table below shows the risk exposure in respect to credit concentration of the Group as at
September 30, 2019 and December 31, 2018 (amounts in millions).
September 30,
2019
(Unaudited)
December 31,
2018
(Audited)
(In Millions)
Trade receivables from Meralco ₱8,051 ₱9,919
Trade receivables from NPC 2,467 2,772
Total credit concentration risk 10,518 12,691
Total trade and other receivables ₱24,701 ₱24,594
Credit concentration percentage 42.6% 51.6%
Liquidity Risk
The Group‟s exposure to liquidity risk refers to lack of funding needed to finance its growth and
capital expenditures, service its maturing loan obligations in a timely fashion, and meet its
working capital requirements. To manage this exposure, the Group maintains internally generated
funds and prudently manages the proceeds obtained from fundraising in the debt and equity
markets. On a regular basis, the Group‟s Treasury Department monitors the available cash
balances. The Group maintains a level of cash and cash equivalents deemed sufficient to finance
the operations.
In addition, the Group has short-term investments and has available credit lines with certain
banking institutions. Certain operating subsidiaries of First Gen maintains a DSRA to sustain the
debt service requirements for the next payment period. As part of its liquidity risk management,
the Group regularly evaluates its projected and actual cash flows. It also continuously assesses
the financial market conditions for opportunities to pursue fund raising activities.
As at September 30, 2019 and December 31, 2018, 36% and 29% of the Group‟s debts,
respectively, will mature in less than one year, based on the carrying value of borrowings
reflected in the unaudited interim condensed consolidated financial statements.
The tables summarize the maturity profile of the Group‟s financial assets used for liquidity
management and liabilities as at September 30, 2019 and December 31, 2018 based on contractual
undiscounted receipts and payments.
September 30, 2019 (Unaudited)
On
Demand
Less than
3 Months
3 to 12
Months
> 1 to
5 Years
More than
5 Years Total
(In Millions)
Financial Assets at Amortized Cost
Cash and cash equivalents ₱40,968 ₱– ₱– ₱– ₱– ₱40,968
Short-term investments – – 3,818 – – 3,818
Trade receivables 18,934 999 4,768 – – 24,701
Current portion of contract assets 12,461 – – – – 12,461
Special deposits and funds – – – 216 – 216
Contract assets – net of current portion – – – 3,979 – 3,979
Other current financial assets 2,703 – – – – 2,703
Other noncurrent financial assets – – 550 – – 550
75,066 999 9,136 4,195 – 89,396
Financial assets at FVOCI
Quoted equity securities 16,237 – – – – 16,237
Unquoted equity securities 618 – – – – 618
Proprietary membership 144 – – – – 144
66

Financial assets at FVPL
FVPL investments ₱2,071 ₱– ₱– ₱– ₱– ₱2,071
19,070 – – – – 19,070
Financial Liabilities Carried
at Amortized Cost
Loans payable ₱1,427 ₱– ₱– ₱– ₱– ₱1,427
Trade payables and other current
liabilities 22,053 14,247 1,914 – – 38,214
Long-term debts, including current portion – 3,092 20,625 69,166 43,038 135,921
₱23,480 ₱17,339 ₱22,539 ₱69,166 ₱43,038 ₱175,562
December 31, 2018 (Audited)
On
Demand Less than 3 Months
3 to 12 Months
> 1 to 5 Years
More than 5 Years Total
(In Millions)
Financial Assets at Amortized Cost
Cash and cash equivalents ₱36,072 ₱– ₱– ₱– ₱– ₱36,072 Short-term investments – – 3,847 – – 3,847
Trade receivables 20,706 3,416 472 – – 24,594
Current portion of contract assets 12,101 – – – – 12,101 Special deposits and funds – – – 173 – 173
Contract assets – net of current portion – – – 5,175 – 5,175
Other current financial assets 4,574 – – – – 4,574 Other noncurrent financial assets – – 826 – – 826
73,453 3,416 5,145 5,348 – 87,362
Financial assets at FVOCI
Quoted equity securities 17,003 – – – – 17,003 Unquoted equity securities 323 – – – – 323
Quoted government debt securities 128 – – – – 128
Proprietary membership 145 – – – – 145
Financial assets at FVPL
FVPL investments 905 – – – – 905
18,504 – – – – 18,504
Financial Liabilities Carried
at Amortized Cost Loans payable ₱403 ₱– ₱– ₱– ₱– ₱403
Trade payables and other current
liabilities 22,023 14,228 1,911 – – 38,162 Long-term debts, including current
portion – 2,465 16,445 80,997 50,400 150,307
₱22,426 ₱16,693 ₱18,356 ₱80,997 ₱50,400 ₱188,872
Equity Price Risk
The Group‟s quoted equity securities are susceptible to market price risk arising from
uncertainties about future values of the investment in equity securities. The Group manages the
equity price risk through diversification and by placing limits on individual and total equity
instruments. The Group‟s BOD reviews and approves all equity investment decisions.
67

The following table demonstrates the sensitivity to a reasonably possible change in share price,
with all other variables held constant:
Change in
Equity Price*
Effect on
Equity
Investment in equity securities
September 30, 2019 19% ₱3,127
(19%) (3,127)
December 31, 2018 19% ₱3,204
(19%) (3,204) * The sensitivity analysis includes the Company’s quoted equity securities with amounts adjusted by the specific beta
for these investments as of reporting date.
Capital Management
The primary objective of the Group‟s capital management is to ensure that it maintains a strong
credit rating and healthy capital ratios in order to support its business, comply with its financial
loan covenants and maximize shareholder value.
The Group manages its capital structure and makes adjustments to it, in light of changes in
business and economic conditions. To maintain or adjust the capital structure, the Group may
adjust the dividend payment to shareholders, return capital to shareholders or issue new shares.
No changes were made in the objectives, policies or processes during the periods ended
September 30, 2019 and December 31, 2018.
The Group monitors capital using a debt-to-equity ratio, which is total debt divided by total
equity. The Group‟s practice is to keep the debt-to-equity ratio not more than 2.50:1.
September 30,
2019
(Unaudited)
December 31,
2018
(Audited)
(In Php Millions)
Long-term debts (current and noncurrent portions) ₱135,921 ₱150,307
Equity attributable to equity holders of the Parent 103,017 97,897
Non-controlling interests 74,570 68,362
Total equity ₱177,587 ₱166,259
Debt-to-equity ratio 0.76:1 0.90:1
The Parent and certain subsidiaries are obligated to perform certain covenants with respect to
maintaining specified debt-to-equity and minimum debt-service-coverage ratios, as set forth in
their respective agreements with the creditors.
68
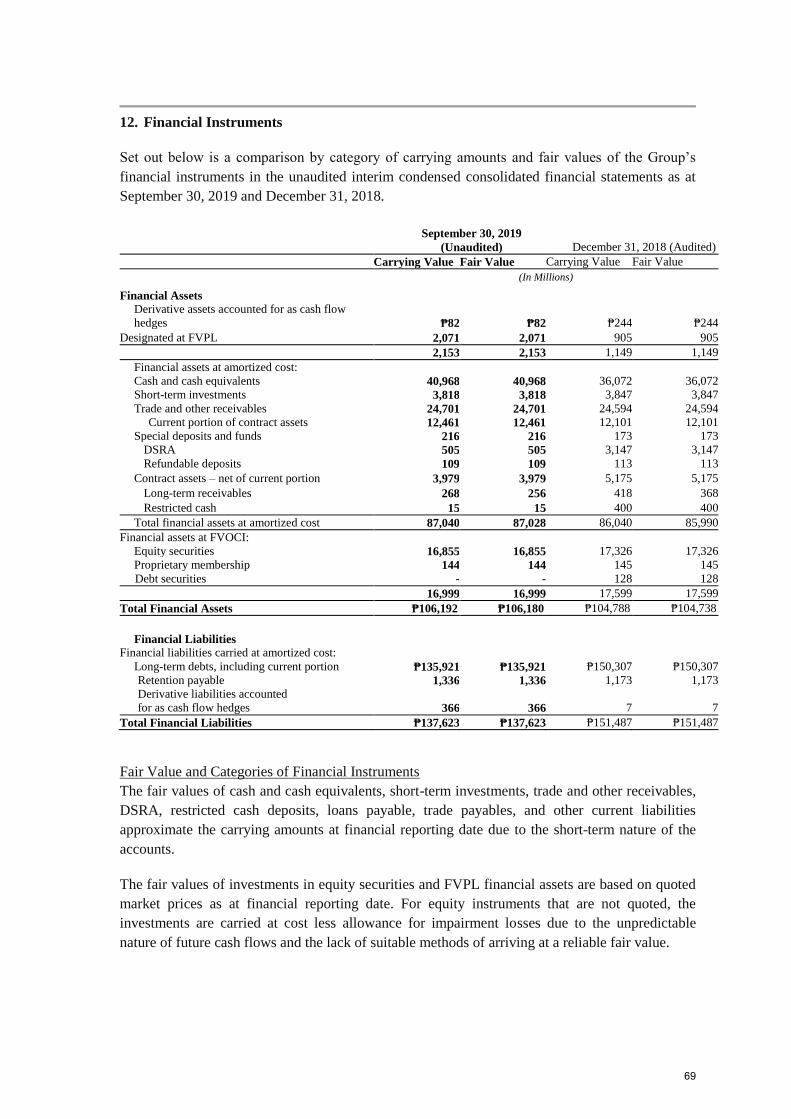
12. Financial Instruments
Set out below is a comparison by category of carrying amounts and fair values of the Group‟s
financial instruments in the unaudited interim condensed consolidated financial statements as at
September 30, 2019 and December 31, 2018.
September 30, 2019
(Unaudited) December 31, 2018 (Audited)
Carrying Value Fair Value Carrying Value Fair Value
(In Millions)
Financial Assets
Derivative assets accounted for as cash flow
hedges ₱82 ₱82 ₱244 ₱244
Designated at FVPL 2,071 2,071 905 905
2,153 2,153 1,149 1,149
Financial assets at amortized cost:
Cash and cash equivalents 40,968 40,968 36,072 36,072
Short-term investments 3,818 3,818 3,847 3,847
Trade and other receivables 24,701 24,701 24,594 24,594
Current portion of contract assets 12,461 12,461 12,101 12,101
Special deposits and funds 216 216 173 173
DSRA 505 505 3,147 3,147
Refundable deposits 109 109 113 113
Contract assets – net of current portion 3,979 3,979 5,175 5,175
Long-term receivables 268 256 418 368
Restricted cash 15 15 400 400
Total financial assets at amortized cost 87,040 87,028 86,040 85,990
Financial assets at FVOCI:
Equity securities 16,855 16,855 17,326 17,326
Proprietary membership 144 144 145 145
Debt securities - - 128 128
16,999 16,999 17,599 17,599
Total Financial Assets ₱106,192 ₱106,180 ₱104,788 ₱104,738
Financial Liabilities
Financial liabilities carried at amortized cost:
Long-term debts, including current portion ₱135,921 ₱135,921 ₱150,307 ₱150,307
Retention payable 1,336 1,336 1,173 1,173
Derivative liabilities accounted
for as cash flow hedges 366 366 7 7
Total Financial Liabilities ₱137,623 ₱137,623 ₱151,487 ₱151,487
Fair Value and Categories of Financial Instruments
The fair values of cash and cash equivalents, short-term investments, trade and other receivables,
DSRA, restricted cash deposits, loans payable, trade payables, and other current liabilities
approximate the carrying amounts at financial reporting date due to the short-term nature of the
accounts.
The fair values of investments in equity securities and FVPL financial assets are based on quoted
market prices as at financial reporting date. For equity instruments that are not quoted, the
investments are carried at cost less allowance for impairment losses due to the unpredictable
nature of future cash flows and the lack of suitable methods of arriving at a reliable fair value.
69

Long-term Receivables
The fair value of long-term receivables was computed by discounting the expected cash flow
using the applicable rates of 3.79% and 4.05% as of September 30, 2019 and December 31, 2018,
respectively.
Financial assets at FVPL/FVOCI
Fair values of quoted debt and equity securities are based on quoted market prices. For equity
instruments that are not quoted, the investments are carried at cost less allowance for impairment
losses, if any, due to the unpredictable nature of future cash flows and the lack of suitable
methods of arriving at a reliable fair value.
FGP and FGPC long-term debts
The fair values of long-term debts were computed by discounting the instruments‟ expected future
cash flows using the prevailing credit adjusted U.S. dollar interest rates ranging from 1.5742% to
2.2048% and 2.6236% to 2.8982% as of September 30, 2019 and December 31, 2018,
respectively.
First Gen’s and FNPC’s long-term debts
The fair values of First Gen‟s and FNPC‟s U.S. dollar-denominated long-term debts were
computed by discounting the instruments‟ expected future cash flows using the prevailing credit
adjusted U.S. dollar interest rates on September 30, 2019 and December 31, 2018 ranging from
1.554% to 1.909% and 2.505% to 2.698%, respectively.
Long-term debts of EDC
The fair values of EDC‟s long-term debts were estimated using the discounted cash flow
methodology with the applicable rates ranging from 1.75% to 3.41% and 1.75% to 5.59% as of
September 30, 2019 and December 31, 2018, respectively.
Trade Receivables from Sale of Condominium Units of Rockwell
The fair values of trade receivables from sale of condominium units were calculated by
discounting the expected future cash flows at prevailing credit adjusted BVAL interest rates
ranging from 3.0% to 5.0% as at September 30, 2019 and 5.4% to 7.5% as at December 31, 2018.
Interest-bearing Loans and Borrowings of Rockwell
The fair values of fixed rate loans were calculated by discounting the expected future cash flows
at prevailing credit adjusted BVAL interest rates ranging from 3.0% to 5.0% as at September 30,
2019 and 5.4% to 7.5% as at December 31, 2018.
Installment Payable of Rockwell
The fair value of installment payable was calculated by discounting the expected cash flows at
prevailing credit adjusted BVAL interest rates ranging from 3.0% to 5.0% as at September 30,
2019 and 5.4% to 7.5% as at December 31, 2018.
Retention Payable
The fair values were calculated by discounting the expected future cash flows at prevailing credit
adjusted BVAL interest rates ranging from 3.0% to 5.0% as at September 30, 2019 and 5.4% to
7.5% as at December 31, 2018.
70

Fair Value Hierarchy of Financial Assets and Liabilities
The Group uses the following hierarchy for determining and disclosing the fair value of financial
instruments by valuation technique:
● Level 1: quoted (unadjusted) prices in active markets for identical assets or liabilities;
● Level 2: valuation techniques for which the lowest level input that is significant to the fair
value measurement is directly or indirectly observable; and
● Level 3: valuation techniques for which the lowest level input that is significant to the fair
value measurement is unobservable.
September 30, 2019 (Unaudited)
Level 1 Level 2 Level 3 Fair Value
Financial assets at amortized cost:
Long-term receivables ₱– ₱– ₱268 ₱268
Financial assets at FVOCI:
Equity instruments – 18,221 – 18,221
Financial assets accounted for as cash flow
hedges - Derivative assets – – – –
Financial assets designated at FVPL 2,071 – – 2,071
Total Financial Assets ₱2,071 ₱18,221 ₱268 ₱20,560
Long-term debts ₱– ₱– ₱135,921 ₱135,921
Financial liabilities accounted for as cash flow
hedges - Derivative liabilities – 366 – 366
Total Financial Liabilities ₱– ₱366 ₱135,921 ₱ 136,287
December 31, 2018 (Audited)
Level 1 Level 2 Level 3 Fair Value
Financial assets at amortized cost:
Long-term receivables ₱– ₱– ₱418 ₱418
Financial assets at FVOCI:
Debt instruments 128 – – 128
Equity instruments – 17,471 – 17,471
Financial assets accounted for as cash flow
hedges - Derivative assets – – – – Financial assets designated at FVPL 802 103 – 905
Total Financial Assets ₱930 ₱17,574 ₱418 ₱18,922
Long-term debts ₱– ₱– ₱150,307 ₱150,307
Financial liabilities accounted for as cash flow
hedges - Derivative liabilities – 141 – 141
Total Financial Liabilities ₱– ₱141 ₱150,307 ₱150,448
As at September 30, 2019 and December 31, 2018, there were no transfers between Level 1 and
Level 2 fair value measurements and there were no transfers into and out of Level 3 fair value
measurements.
Derivative Financial Instruments
The Group, through First Gen group, enters into derivative transactions such as interest rate swaps
to hedge its interest rate risks arising from its floating rate borrowings, cross currency swap and
foreign currency forwards to hedge the foreign exchange risk arising from its loans and payables.
These derivatives (including embedded derivatives) are accounted for either as Derivatives not
designated as accounting hedges or Derivatives designated as accounting hedges.
The table below shows the fair value of the Group‟s outstanding derivative financial instruments,
reported as assets or liabilities, together with their notional amounts as at September 30, 2019 and
71

December 31, 2018 (amounts in millions). The notional amount is the basis upon which changes
in the value of derivatives are measured.
September 30, 2019 (Unaudited) December 31, 2018 (Audited)
Derivative
Assets Derivative
Liabilities Notional
Amount
Derivative
Assets Derivative
Liabilities Notional
Amount
Derivatives Designated as Accounting Hedges Freestanding derivatives:
Interest rate swaps ₱15 ₱361 $208 ₱191 ₱- $218 Call spread swaps 67 8 $40 53 7 60
82 369 ₱244 ₱7 Presented as:
Current ₱15 ₱27 ₱9 ₱- Noncurrent 67 342 235 7
Total derivatives ₱82 ₱369 ₱244 ₱7
Derivatives Designated as Accounting Hedges
The Group, through First Gen group, has entered into interest rate swaps accounted for as cash
flow hedges for its floating rate loans and cross-currency swaps accounted for as cash flow
hedges of its Philippine peso and U.S. dollar denominated borrowings, respectively. Under a cash
flow hedge, the effective portion of changes in fair value of the hedging instrument is recognized
as cumulative translation adjustments in other comprehensive income (loss) until the hedged item
affects earnings.
Interest Rate Swaps (IRS) – FGP
In April 2013, FGP entered into two IRS agreements with ING Bank and Standard Chartered
Bank to hedge its floating rate exposure on $80.0 million of its $420.0 million term loan facility.
Under the IRS agreements, FGP pays a fixed rate of 1.425% and receives a floating rate of U.S.
LIBOR, on a semi-annual basis, simultaneous with the interest payments every June and
December on the hedged loan.
In May 2013, FGP entered into another interest rate swap agreement with RCBC to hedge its
floating rate exposure on another $20.0 million of the $420.0 million term loan facility. Under
the interest rate swap agreement, FGP pays a fixed rate of 1.28% and receives a floating rate of
U.S. LIBOR, on a semi-annual basis, simultaneous with the interest payment every June and
December on the hedged loan. The notional amounts of interest rate swap is amortizing based on
the repayment schedule of the hedged loan. The interest rate swaps were designated as cash flow
hedges and will mature on June 10, 2020.
As at September 30, 2019 and December 31, 2018, the positive fair values of the interest rate
swaps that were deferred to “Cumulative translation adjustments” account in the unaudited
interim consolidated statements of financial position amounted to ₱31.1 million, net of deferred
tax income tax effect of ₱15.5 million ($0.6 million, net of related deferred income tax effect of
$0.3 million) and ₱40.3 million, net of related deferred income tax effect of ₱15.1 million ($0.8
million, net of related deferred income tax effect of $0.3 million), respectively.
There was no ineffective portion recognized in the unaudited interim consolidated statements of
income for the periods ended September 30, 2019 and 2018.
72

The outstanding aggregate notional amount and the related cumulative mark-to-market gains of
the interest rate swaps designated as cash flow hedges as of September 30, 2019 and December
31, 2018 are as follows:
September 30,
2019
(Unaudited)
December 31,
2018
(Audited)
Notional amount $55,231 $65,450
Cumulative mark-to-market gains 296 1,130
The net movements in the fair value of interest rate swaps of FGP are as follows:
September 30,
2019
(Unaudited)
December 31,
2018
(Audited)
Fair value at beginning of period ₱79 ₱46
Fair value changes taken into equity during the period (13) 29
Fair value changes realized during the period (30) (27)
Foreign exchange differences (21) 31
Fair value at end of period 15 79
Deferred tax effect on cash flow hedges (4) (24)
Fair value deferred into equity ₱11 ₱55
Fair value changes during the period, net of deferred income tax, are recorded in the unaudited
interim consolidated statements of comprehensive income and under the “Cumulative translation
adjustments” account in the unaudited interim consolidated statements of financial position. The
fair value changes realized during the period was taken into “Finance costs” account in the
unaudited interim consolidated statements of income. This pertains to the net difference between
the fixed interest paid/accrued and the floating interest received/accrued on the interest rate swap
agreements as at financial reporting date.
For the nine months ended September 30, 2019 and 2018, fair value changes taken to the
unaudited interim consolidated statements of income amounted to ₱31.3 million ($0.6 million)
and ₱5.2 million ($0.1 million), respectively.
Interest Rate Swap Contracts – EBWPC
In the last quarter of 2014, EBWPC entered into four (4) IRS with aggregate notional amount of
$150.0 million. This is to partially hedge the interest rate risks on its ECA and Commercial Debt
Facility (Foreign Facility) that is benchmarked against U.S. LIBOR and with flexible interest
reset feature that allows EBWPC to select what interest reset frequency to apply. Under the IRS
agreement, EBWPC will receive semi-annual interest of 6-month U.S. LIBOR and will pay fixed
interest. EBWPC designated the IRS as hedging instruments in cash flow hedge against the
interest rate risks arising from the Foreign Facility. In the first quarter of 2016, EBWPC entered
into three (3) additional IRS with aggregate notional amount of $30.0 million.
73
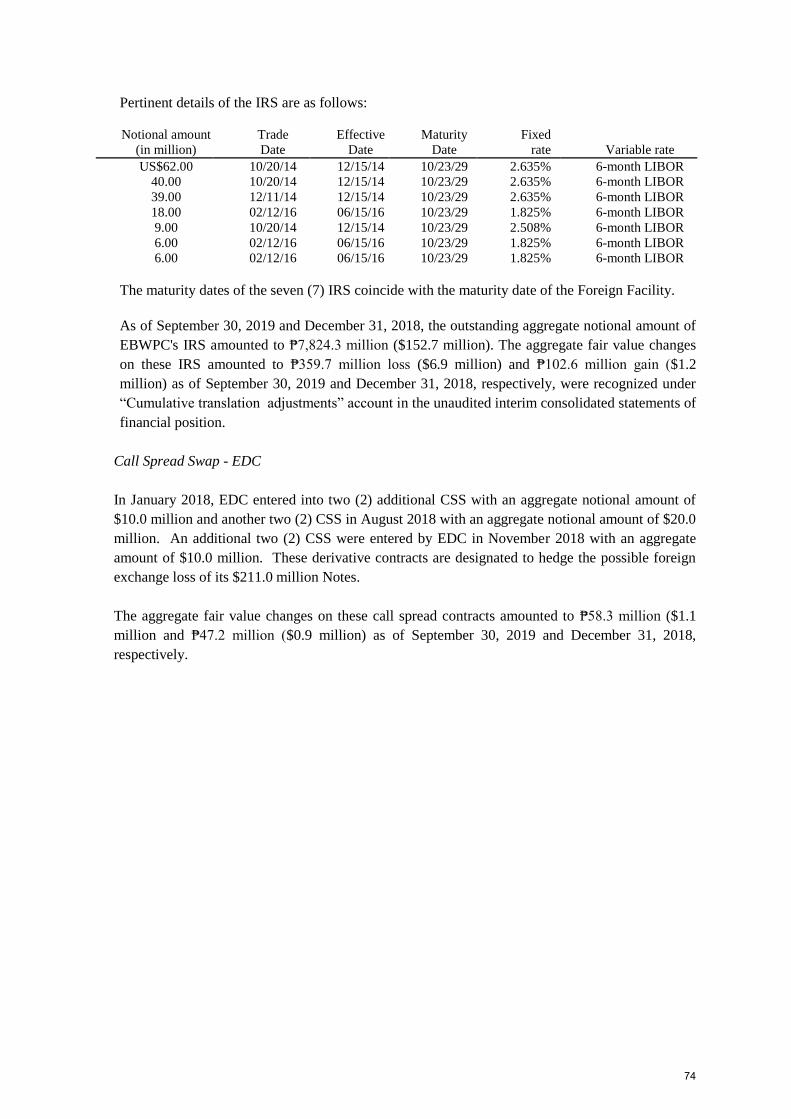
Pertinent details of the IRS are as follows:
Notional amount
(in million)
Trade
Date
Effective
Date
Maturity
Date
Fixed
rate Variable rate
US$62.00 10/20/14 12/15/14 10/23/29 2.635% 6-month LIBOR
40.00 10/20/14 12/15/14 10/23/29 2.635% 6-month LIBOR
39.00 12/11/14 12/15/14 10/23/29 2.635% 6-month LIBOR
18.00 02/12/16 06/15/16 10/23/29 1.825% 6-month LIBOR
9.00 10/20/14 12/15/14 10/23/29 2.508% 6-month LIBOR
6.00 02/12/16 06/15/16 10/23/29 1.825% 6-month LIBOR
6.00 02/12/16 06/15/16 10/23/29 1.825% 6-month LIBOR
The maturity dates of the seven (7) IRS coincide with the maturity date of the Foreign Facility.
As of September 30, 2019 and December 31, 2018, the outstanding aggregate notional amount of
EBWPC's IRS amounted to ₱7,824.3 million ($152.7 million). The aggregate fair value changes
on these IRS amounted to ₱359.7 million loss ($6.9 million) and ₱102.6 million gain ($1.2
million) as of September 30, 2019 and December 31, 2018, respectively, were recognized under
“Cumulative translation adjustments” account in the unaudited interim consolidated statements of
financial position.
Call Spread Swap - EDC
In January 2018, EDC entered into two (2) additional CSS with an aggregate notional amount of
$10.0 million and another two (2) CSS in August 2018 with an aggregate notional amount of $20.0
million. An additional two (2) CSS were entered by EDC in November 2018 with an aggregate
amount of $10.0 million. These derivative contracts are designated to hedge the possible foreign
exchange loss of its $211.0 million Notes.
The aggregate fair value changes on these call spread contracts amounted to ₱58.3 million ($1.1
million and ₱47.2 million ($0.9 million) as of September 30, 2019 and December 31, 2018,
respectively.
74

13. Events After the Financial Reporting Period
FPH
Appropriation of Retained Earnings
On October 3, 2019, the Parent Company‟s BOD approved the appropriation of retained earnings
as follows:
Appropriation Details Amount
Benpres Building and
Eugenio Lopez Center Redevelopment Projects
₱12.0 billion
Investment in various subsidiaries 5.3 billion
Debt Service 6.4 billion
Share buyback (unused) 5.0 billion
Total ₱28.7 billion
Dividend Declaration
On November 7, 2019, the Parent Company‟s BOD approved the declaration of the following
dividends:
a. ₱13.75 per share cash dividend to all Series “C” preferred shareholders of record as
of November 22, 2019, payable on or before December 2, 2019.
b. ₱1.00 per share cash dividend to all common shareholders of record as of November
22, 2019, payable on or before December 17, 2019.
First Gen
In October and November 2019, First Gen purchased an aggregate of 3,140,855 common stocks
from the open market amounting to ₱142.8 million ($2.8 million).
In October 2019, First Gen bought back from the open market 8,000,000 Series “G” redeemable
preferred stocks amounting to ₱867.1 million ($16.6 million).
75