cover page discussion paper series - cream and dronkers (2008) did not, however, study the...
TRANSCRIPT

Centre for Research and Analysis of MigrationDepartment of Economics, University College LondonDrayton House, 30 Gordon Street, London WC1H 0AX
Discussion Paper Series
CDP No 14/12
Do Migrant Girls Always Perform Better?Differences between the Reading and MathScores of 15-Year-Old Daughters and Sons ofMigrants in PISA 2009 and Variations byRegion of Origin and Country of Destination
Nils Kornder and Jaap Dronkers
Centre for Research and Analysis of Migration Department of Economics, Drayton House, 30 Gordon Street, London WC1H 0AX
Telephone Number: +44 (0)20 7679 5888 Facsimile Number: +44 (0)20 7679 1068
CReAM Discussion Paper No 14/12
Do Migrant Girls Always Perform Better? Differences between the Reading and Math Scores of 15-Year-Old
Daughters and Sons of Migrants in PISA 2009 and
Variations by Region of Origin and Country of
Destination
Nils Kornder* and Jaap Dronkers*
* University of Maastricht
Non-Technical Abstract
As a follow-up of earlier analyses of the educational performance of all pupils with a migration background with Programme for International Student Assessment (PISA) waves 2003 and 2006, we analyze the differences between the educational performance of 15-year old daughters and sons of migrants from specific regions of origin countries liv ing in different destination countries. We use the newest PISA 2009 wave. Instead of analyzing only Western countries as destination countries, we analyze the educational performance of 16,612 daughters and 16,804 sons of migrants in destination countries across Asia, Europe, Latin America, and Oceania. We distinguish 62 origin countries and 12 origin areas in 30 destination countries. We test three hypotheses: 1) The daughters of migrants from poorer, more traditional regions perform much better in reading than comparable sons of migrants from the same origin regions, while the daughters of migrants from more affluent and liberal regions perform slightly better in reading than comparable sons of migrants from the same regions. 2) Individual socioeconomic background has a stronger effect on the educational performance of daughters of migrants than on the performance of sons of migrants. 3) The performance of female native pupils has a higher influence on the performance of migrant daughters than the performance of male native pupils has on the performance of migrant sons. The first hypothesis can only partly be accepted. Female migrant pupils have both higher reading and math scores than comparable male migrant pupils, and these gender differences among migrant pupils are larger than among comparable native pupils. The additional variation in educational performance by region of origin is, however, not clearly related to the poverty or traditionalism of regions. Neither the second nor the third hypothesis can be accepted, given our results.

1
Do Migrant Girls Always Perform Better? Differences between the Reading and Math Scores of 15-Year-Old Daughters and Sons of Migrants in PISA 2009 and Variations by Region of Origin and Country of Destination Nils Kornder and Jaap Dronkers1
University of Maastricht (Netherlands) Abstract
As a follow-up of earlier analyses of the educational performance of all pupils with a migration background with Programme for International Student Assessment (PISA) waves
2003 and 2006, we analyze the differences between the educational performance of 15-year old daughters and sons of migrants from specific regions of origin countries living in different destination countries. We use the newest PISA 2009 wave. Instead of analyzing only Western
countries as destination countries, we analyze the educational performance of 16,612 daughters and 16,804 sons of migrants in destination countries across Asia, Europe, Latin
America, and Oceania. We distinguish 62 origin countries and 12 origin areas in 30 destination countries. We test three hypotheses: 1) The daughters of migrants from poorer, more traditional regions perform much better in reading than comparable sons of migrants
from the same origin regions, while the daughters of migrants from more affluent and liberal regions perform slightly better in reading than comparable sons of migrants from the same
regions. 2) Individual socioeconomic background has a stronger effect on the educational performance of daughters of migrants than on the performance of sons of migrants. 3) The performance of female native pupils has a higher influence on the performance of migrant
daughters than the performance of male native pupils has on the performance of migrant sons. The first hypothesis can only partly be accepted. Female migrant pupils have both higher
reading and math scores than comparable male migrant pupils, and these gender differences among migrant pupils are larger than among comparable native pupils. The additional variation in educational performance by region of origin is, however, not clearly related to the
poverty or traditionalism of regions. Neither the second nor the third hypothesis can be accepted, given our results.
1. Introduction
Today, most Western societies host a substantial and still growing immigrant population
(Castles and Miller, 2003). With technological developments such as the Internet and (mobile) telephone communication, migration has increased and less expensive ways of long-distance travel, as well as the emergence of the European Union, have helped facilitate it.
Consequently, the share of foreign-born pupils in primary and secondary education in many Western countries is now larger than ever before.
Overall, the educational position of immigrant children has been well documented, but there is far less systematic documentation about the educational position of sons and daughters of migrants in relation to features of their country or region of origin. Using the
2003 data of the Programme for International Student Assessment (PISA), Levels and Dronkers (2008) found that the educational performance of immigrant pupils from certain
regions was different from that of comparable pupils from other regions. Their analysis shows, for example, that second-generation migrants from Western Europe (but only those
1 The first author is a student at the School of Business and Economics of Maastricht University and wrote this
paper as his research project. The second author is the project’s supervisor and professor at Maastricht
University. All correspondence should be addressed to the second author at [email protected].
We thank Elina Kilpi-Jakonen, Olga Skriabikova, and Rolf van der Velden for their suggestions in improving
our previous analyses. This paper is also published as ROA Research Memorandum 2012/4.

2
from lower-educated classes), Southern and Central America, Northern Africa, and Western
Asia have substantially lower math scores than comparable natives in the destination countries. The authors conclude that both the origin and destination of migration have
substantial effects on scholastic achievement, and these have an important influence on differences in scholastic knowledge between native pupils and first- and second-generation migrants. Analyzing migrants’ integration into host societies without properly taking into
account these origin effects will lead to flawed results. Depending on the composition of the migrant population in a certain society, the results can be overly optimistic or pessimistic.
Western Europe, Southern and Central America, Northern Africa, and Western Asia seem to be problematic regions of origin: Migrants from these regions perform worse in mathematics than comparable migrants from other regions, regardless of their country of destination. In
addition, Levels and Dronkers (2008) also found destination effects: Some countries of destination are better equipped to deal with immigration than others. For example, their
analysis shows that migrants in Denmark are doing worse than those in Germany, despite educational selection at an older age in the former country and its selective migration policies. In general, the authors conclude that relatively new immigrant-receiving countries, such as
Denmark and Switzerland, are not yet capable of dealing with immigrants, even if they have very strict and selective migration policies. In some new immigrant-receiving societies,
immigrants reach substantially lower levels of scholastic achievement than the natives of these states, in comparison to the differences between immigrants and natives in Australia, a traditional immigrant-receiving nation.
Levels and Dronkers (2008) did not, however, study the educational performance of the male and female children of immigrants. Even though successive papers with PISA 2003 data
(Levels, Dronkers, & Kraaykamp, 2008) and PISA 2006 data (de Heus & Dronkers, 2010; Dronkers & Heus, 2012) carried out far more sophisticated analyses by including macro features of the origin and destination countries, possible gender differences in educational
performance between the daughters and sons of migrants continued to be neglected. In addition, other researchers of the educational performance of migrant children with a double
perspective (origin and destination) ignored possible differences between male and female pupils. Only recently has a group of researchers started to address these differences (Fleischmann & Kristen, forthcoming), but they could only use national data for their cross-
national analysis, thus limiting comparisons. In contrast, this paper focuses on possible differences in the educational performance
of the male and female children of migrants and uses the best available cross-national data to consider the necessary double perspective (origin and destination). We describe gender differences in the reading scores of the PISA 2009 wave and variations by origin and
destination, controlling for the educational performance of native female and male pupils in their destination countries. We also apply a robustness test to our results by using math
scores. Another drawback of this series of papers on the educational performance of migrant
children is the narrow scope of western countries as destination. In contrast, this paper
analyzes the educational performance of the daughters and sons of migrants in countries across Asia, Europe, Latin America, Africa, and Oceania. We distinguish 62 origin countries
and 12 origin areas in 30 destination countries. We also include internal migration from China to Hong Kong, Macao, and Shanghai.
This paper is organized as follows. After explaining the double perspective of origin
and destination (Section 2), formulating three hypotheses on gender differences (Section 3), and describing data, variables and methods (Sections 4 and 5), we present ordinary least
squares (OLS) regressions to test the three hypotheses in Section 6. Section 7 gives the

3
robustness test with math score as dependent variable. The last Section 8 discusses the results
and their consequences.
2. Multiple origins and destinations
Since immigration is intrinsically a transnational phenomenon, it should be studied accordingly (Portes, 1999). Immigrant parents and children from various countries of origin
move to various countries of destination. Therefore, instead of relying on observations of multiple-origin groups in a single destination or single-origin groups in multiple destinations,
our analyses compare multiple origins in multiple destinations simultaneously. Since this design disentangles the effects of the characteristics of the countries from which immigrants come from (origin effects) and the characteristics of the countries to which they migrate
(destination effects), it is extremely useful in gaining insight into the factors influencing immigrants’ outcomes, such as educational performance. This paper is the first descriptive
phase of our origin and destination analyses of the gender differences in educational performance of children of migrants. As Levels and Dronkers (2008), we start with a description of these gender differences in this paper. In a follow-up paper (Dronkers &
Kornder, forthcoming), our analyses consider the macro features of the countries of origin and destination and apply more sophisticated techniques, as in Levels, Dronkers, and Kraaykamp
(2008). 3. Hypotheses
The aim of this paper is descriptive, since the differences between the educational performance of the daughters and sons of migrants and the variations thereof by region of
origin and country of destination have not been systematically studied. As a consequence, our hypotheses are simple.
Given that we use PISA data on 15-year-old migrant pupils, probably about half of the
first generation of migrant pupils arrived before their sixth year in their destination country. Unfortunately, the age of arrival is not available in PISA 2009 to check this. Using 2006 PISA
data, however, Song and Robert (2010) reported that 21% arrive when they are zero or one year old, 28% arrive between two and five years old, 26% between six and 10 years old, and 25% between 11 and 15 years old. The majority of these 15-year-old pupils had the major part
of their formal schooling only in the destination country. Our first hypothesis assumes that most migrants move from poorer, more traditional
societies to more affluent and liberal societies. Girls in poorer, more traditional societies have fewer educational opportunities compared to their brothers. The reasons for this include religious and/or cultural traditions, as well as the fact that educational investments in boys are
more profitable for parents in these societies than the same educational investments in girls (Fuligni, Tseng, & Lam, 1999). These educational restrictions for the daughters of migrants
from poorer, more traditional societies are less severe in more affluent and liberal societies of destination because most destination societies value gender equality more than the origin societies and/or the parental migrants from poorer, more traditional societies have fewer
opportunities to enforce their pro-son investment strategy. In addition, the daughters of migrants from poorer, more traditional societies may use the educational opportunities in
more affluent and liberal societies of destination to escape from the male bias of the religious and/or cultural traditions of their poorer, more traditional origin societies (Abada & Tenkorang, 2009). However, this male bias of the religious and/or cultural traditions of their
origin societies may limit female pupils more in their educational performance due to more obligations at home and pressure for an early marriage. Moreover, the closer supervision and
stricter parental monitoring of the daughters of migrants from poorer, more traditional societies compared to their sons may strengthen the discipline of the daughters more, thus

4
impacting their educational performance (Zhou & Bankston, 2001; Feliciano & Rumbaut,
2005). Therefore our first hypothesis is as follows: The daughters of migrants from poorer,
more traditional regions perform much better in reading than comparable sons of migrants from the same regions, while the daughters of migrants from more affluent and liberal regions perform slightly better in reading than comparable sons of migrants from the same
regions, taking into account the performance of native female and male pupils in their destination countries and the higher reading scores of female native pupils and the lower
math scores of male native pupils. The second hypothesis is build upon the same assumptions as the first. Due to the
religious and/or cultural traditions of their poorer, more traditional origin societies, the
daughters of migrants are more dependent on parental permission to participate in the life of their destination countries compared to the sons of migrants (Dion & Dion, 2001). The level
of this parental permission is influenced by parental socioeconomic characteristics. Therefore our second hypothesis is as follows: Parental socioeconomic background has a stronger effect on the reading performance of the daughters of migrants than on the reading
performance of the sons of migrants. The religious and/or cultural traditions of poorer, more traditional origin societies are
not the only reference point for the educational performance of the sons and daughters of migrants. The reading and math performance of the native population can also be such a point of reference. There is a strong gender bias in the language and math performance of males
and females, and thus we have to distinguish between the reading and math performance of male and female native pupils. We assume that female migrant pupils profit more from such
an external reference point, because it goes more against the religious and/or cultural traditions of their poorer, more traditional origin societies than for boys.
Therefore our third hypothesis is as follows: The educational performance of the
daughters of migrants is more influenced by the reading performance of female native pupils than the reading performance of the sons of migrants will be influenced by the reading
performance of male native pupils.
4. Data and variables
4.1. PISA 2009 Since 2000, the OECD has conducted large-scale tri-annual tests among 15-year-olds living in
its Member States and partner states to assess pupils’ mathematical, reading, and scientific literacy. In doing so, the OECD has been aimed to determine the extent to which pupils near the end of their compulsory education have acquired some of the knowledge and skills
essential for full participation in society. Alongside information on pupils’ educational performance, PISA also provides information on their individual characteristics (e.g., parental
education and careers, resources available in the home, languages spoken at home, and the birth countries of both the parents and the pupil) through the administration of pupil and principal questionnaires. In this paper we use the latest PISA wave, 2009 (OECD, 2010).
This study focuses on reading abilities (the dependent variable), which was the focus of the PISA 2009 wave. A 390-minute pencil-and-paper test was developed. However, since it
would not be sensible to administer a test of more than six hours to an individual pupil, 13 largely comparable item clusters (seven for reading, three for mathematics, and three for science) of two hours’ duration each were derived from the core test. These test booklets were
allocated to individual pupils according to a random selection process, requiring them to answer multiple-choice as well as open questions. In some countries, an additional 40-minute
test was administered covering tasks related to reading and understanding electronic texts.

5
Since two test booklets can never have exactly the same average difficulty, item
response modeling was used to establish comparable reading results across pupils. Item response modeling involves the construction of several plausible reading values for each
pupil. So, instead of obtaining just one score to indicate each pupil’s reading ability, five possible reading score values were estimated per pupil. For each pupil, we averaged the five plausible values to calculate a composite score. The composite scores were standardized using
an average of 500 and a standard deviation of 100. Tables 6 and 7 show the reading test scores for male and female migrants, respectively, differentiated by the respondents’
immigrant and generation status, their regions of origin, whether one parent was born in the destination country, and the foreign language spoken at home.
4.2. Pupils’ country of origin and immigrant status Since specific information on the country of birth of both a pupil and the parents is necessary
to determine a pupil’s country of origin, destination countries that did not allow enough specificity in birth countries were omitted. For instance, when asking about the country of origin, the US only provided the options “United States of America” and “another country.”
Among destination countries that did provide enough variety in birth country options to be included in our analysis, the question was not consistently asked. In addition, PISA offered
participating test countries the possibility of determining a set of answers in advance, allowing countries to include in the dataset their most important groups of immigrants. For instance, in the German questionnaires, the possible countries of origin were Croatia, Greece,
Italy, Macedonia, Montenegro, Poland, Serbia, Slovenia, Turkey, and one of the former USSR republics, while New Zealand listed the options Australia, China, Republic of Korea,
South Africa, the United Kingdom, and Samoa. Therefore, only data from 30 of the 67 participating countries were useful for the analysis. However, contrary to previous studies, we did not limit ourselves to destination countries in Europe and the Pacific Rim but, instead,
included Asian and Latin American countries. A list of these destination countries and the number of migrant pupils per country is provided in Table 1.
[Table 1 about here]
To determine a pupil’s country of origin, several decision rules were used, based upon the pupil’s birth country and the birth countries of both parents.2 To capture as many respondents
as possible, we also included 12 aggregate origin areas, which were sufficiently specific for the purpose of this analysis, as countries of origin. Most destination countries allowed for the selection of at least one aggregate origin area. For example, besides Germany, also Greece,
Israel, and the Netherlands allowed for the origin selection “one of the former USSR republics.” We combined these migrants in an equivalently labeled composite category. In
addition to information on Chinese migrants in non-Chinese countries, our dataset also contains information on two internal migrant groups, from either westernized or Mainland
China. Since internal migration in China is difficult and requires governmental approval, the Chinese who originate from Mainland China and move to Shanghai, Hong Kong, or Macau
are considered internal immigrants in China. Additionally, internal migration between the major cities in and around China is labeled internal immigrants from westernized China. These migrants originate from Hong Kong, Macau, or Chinese Taipei and live in Shanghai,
Hong Kong, or Macau. In total, using decision rules to identify pupils’ countries of origin and immigrant status yields a final sample of 16,612 female and 16,804 male migrant pupils
originating from 62 different and 12 aggregate origin areas (see Appendixes A1 and A2).
2 Decision rules are available on request from the second author.

6
The OECD allows participating countries to propose their own birth country categories, and some countries allow more detail than others. As a result, the origin countries of the different destination countries are partly dependent on the quality of the available categories. To account for this possible bias, we compared, as much as possible, the origin countries in PISA with national statistics. In most cases the largest immigrant groups identified by the statistical offices are also represented in our PISA data. Since the PISA data do not oversample immigrant pupils, smaller immigrant groups (if asked for) are understandably not always present in our data. There are no
indications that this selectivity (only the largest migrant categories of destination countries) has produced a bias, because small migrant categories in destination countries hardly influence the results.
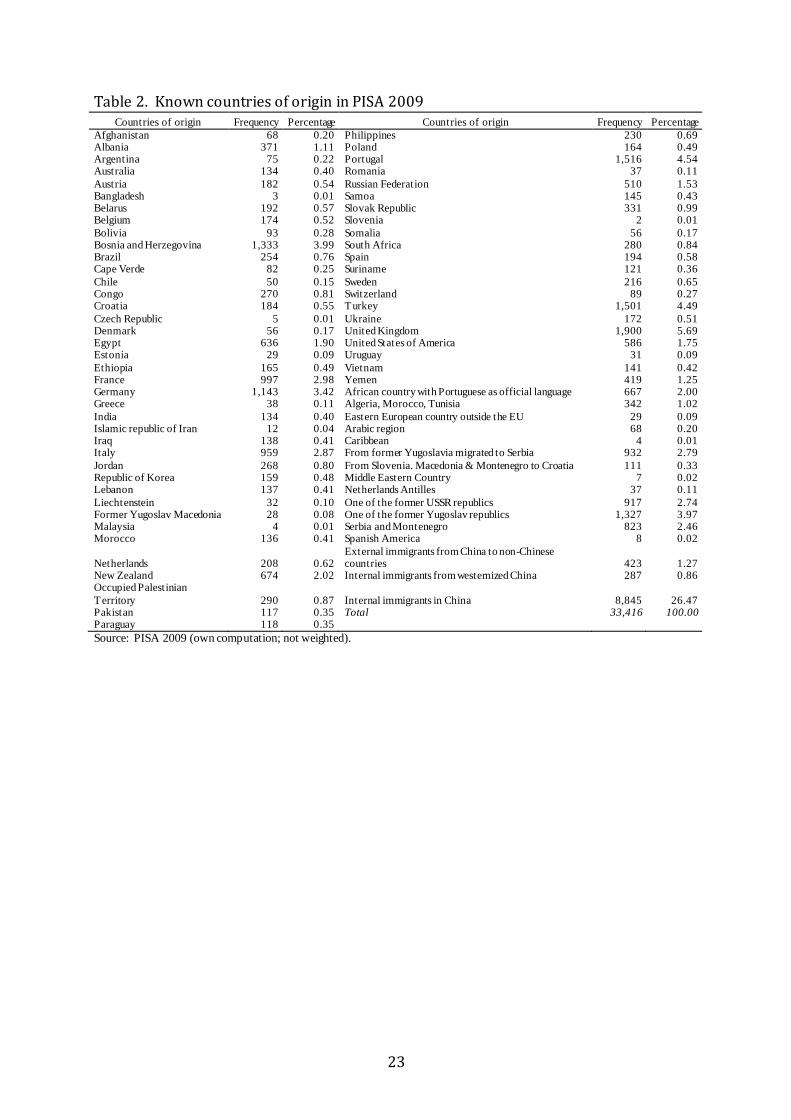
Table 2 reports the distribution of migrants in all countries and areas of origin.
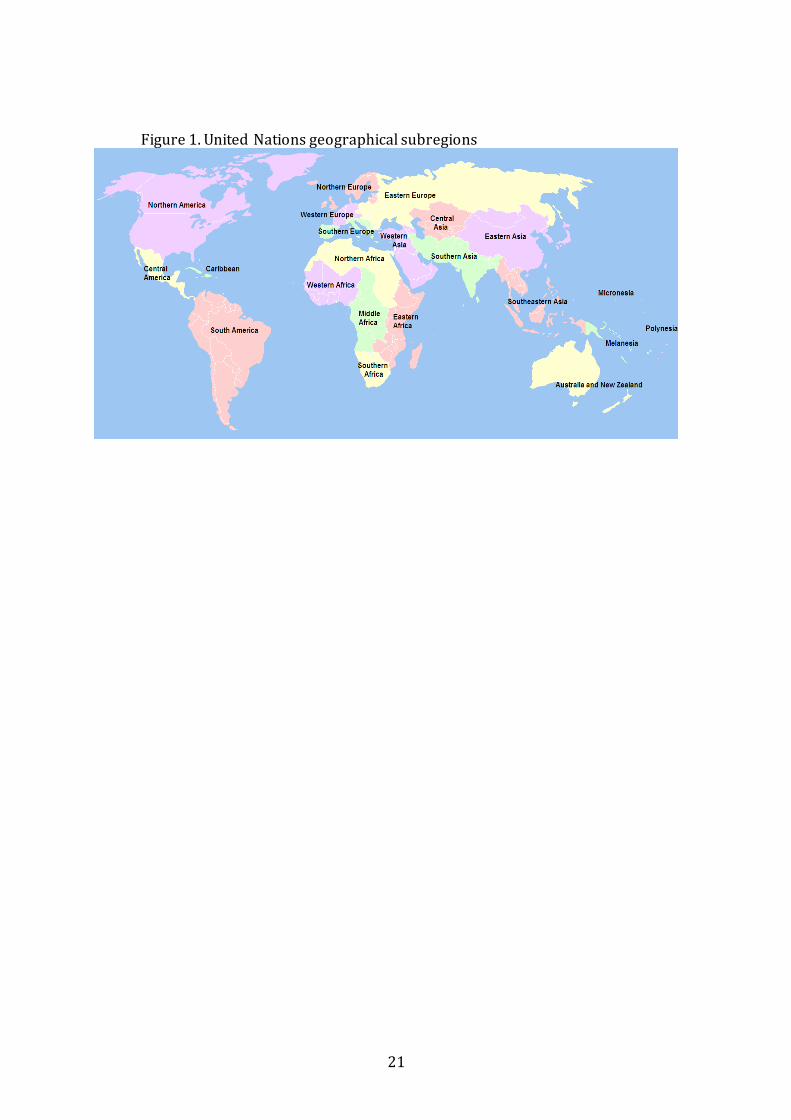
[Table 2 about here] To simplify the presentation of the analysis, we combined these countries of origin into 14
regions of origin based upon a slightly adjusted version of the United Nations Statistics Division’s composition of macro geographical regions (see Figure 1).
[Figure 1 about here]
The composition of origin regions is as follows. North America: the United States of America. Caribbean: the Caribbean and the Netherland Antilles. South America: Argentina, Bolivia,
Brazil, Chile, Paraguay, Suriname, Uruguay, and Spanish America. Northern Europe: Denmark, Estonia, United Kingdom, and Sweden. Western Europe: Austria, Belgium, France, Germany, Liechtenstein, the Netherlands, and Switzerland. Eastern Europe: Belarus, the
Czech Republic, Poland, Romania, the Russian Federation, the Slovak Republic, the Ukraine, one of the former USSR republics, and an Eastern European country outside the European Union (EU). Southern Europe: Albania, Bosnia and Herzegovina, Croatia, Greece, Italy,
Macedonia, Montenegro, Portugal, Slovenia, Spain, and Serbia. Northern Africa: Egypt, Morocco, Algeria, and Tunisia. Sub-Saharan Africa: Cape Verde, Congo, Ethiopia, Somalia,
South Africa, and an African country whose official language is Portuguese. West Asia: Iraq, Jordan, Lebanon, the Occupied Palestinian Territories, Turkey, Yemen, an Arabic region, and a Middle Eastern country. South Asia: Afghanistan, Bangladesh, India, Iran, and Pakistan.
East Asia: China (external and internal) and the Republic of Korea. Southeast Asia: Malaysia, the Philippines, and Vietnam. Oceania: Australia, New Zealand, and Samoa.
Appendixes A1 and A2 give the absolute numbers of male and female migrant pupils, migrant generation, region of origin, whether one parent was born in the destination country, and the foreign language spoken at home.
After a pupil’s country of origin, we identified his/her immigrant status. Pupils of whom at least one of the parents was born in a country different from the destination country
were identified as immigrants. Migrant pupils were classified as first generation (reference category) when they were themselves born outside the destination country, and second generation when at least one of the parents was born abroad. This distinction between first-
and second-generation migrants deviates from that of Portes and Rumbaut (2001), who classify migrant generation status based on age upon arrival in the destination country.
However, we believe that this distinction is cross-nationally clearer and is less likely to underestimate the importance of pre-school socialization.
Migrant pupils whose generation could not be determined were taken into account by
creating a missing generation dummy variable. Of the remaining respondents with sufficient

7
information to be classified as natives, those pupils who spoke a foreign language at home
that allowed for a reasonable inference about the country of origin were reclassified as third generation. For instance, migrant pupils in Germany who spoke Turkish or Kurdish at home
but were classified as native Germans were reclassified as third-generation immigrants from Turkey. Similarly, pupils in Australia who indicated they spoke Albanian, Bosnian, Croatian, or Serbian were regarded as third-generation migrants from “one of the former Yugoslav
republics,” even though the previous decision rules to identify countries of origin classified them as natives. As such, we did not capture a representative sample of third-generation
immigrants since only those pupils who continued to speak at home a language other than the official language of the destination country could be identified. This category may be regarded as non-integrated immigrants despite their long presence in the destination country.
The more sophisticated analyses of Section 6 combine these generation variables with the indicator of the language spoken at home (see Section 4.3) into seven dummy variables:
first generation and official language, first generation and foreign language, first generation and unknown language, second generation and official language, second generation and foreign language, second generation and unknown language, and third generation and foreign
language.
4.3. Individual-level variables Table 3 summarizes all relevant variables and regions of origin, including the minimum and maximum scores and the mean and standard deviation for pupils with a migration background
and a known country or area of origin.
[Table 3 about here] We use a number of additional variables to account for the status of migrant pupils. First, we
controlled for the parental environment of pupils by using the index of the economic, social, and cultural status of the parents (ESCS). This variable represents a composite index created
in the PISA dataset of the occupational status of the parents (Ganzeboom, de Graaf, Treiman, & de Leeuw, 1992), the educational level of the parents (United Nations Educational, Scientific and Cultural Organization, 2006), and the presence of any material or cultural
resources at the pupils’ homes.3 This combination of the parents’ occupational status and educational level, together with resources at home, produces the strongest indicator of the
parental environment. If one or more of these variables were missing for a respondent, we imputed the ESCS value by taking the average of the prior and next pupil after sorting all cases based on the destination country, generation, country of origin, ISCED, ISEI, and home
possessions. The ESCS score was standardized such that the OECD average was set to zero (see Appendix A3).
Second, we controlled for the effects of family structure on scholastic performance. Since a previous analysis revealed that migrant pupils from single-parent families perform worse, on average, than pupils with both parents (Dronkers & de Lange, 2011), we include a
nuclear family dummy variable that measures whether children live in two-parent households. Those pupils with other family structures were the reference group.
Third, we included a dummy variable labeled one parent born in destination country to identify pupils who had one immigrant and one native-born parent; pupils with two non-native parents represented the reference group. This is a way of controlling for the effects of
having a presumably stronger relation with the society and culture of the destination country
3 The measure consists of the presence of a desk, a private room, a quiet place to study, a computer, educational
software, Internet access, literature or poetry, art, books that may be of use when doing schoolwork, a dictionary,
a dishwasher, and the presence of more than 100 books in the house.
8
when one parent is a native. A corresponding mixed marriage missing dummy variable was
introduced to compare pupils for whom the birth country of one of the parents was missing with pupils for whom both parents are non-native.
Fourth, we controlled for the effects of speaking a foreign language at home with the dummy variable official language of destination country spoken at home. This variable distinguishes between migrant children who speak one of their destination country’s official
languages at home and children who speak a foreign language. Again, a language missing dummy variable was taken into account to differentiate pupils whose language spoken at
home is unknown with pupils who speak one of their destination country’s official languages at home. The more sophisticated analyses of Section 6 combine these two language indicators with the generation indicators (see Section 4.2.)
Fifth, we assigned a native reading score—that is, the average PISA score of the corresponding native male or female population—as an additional variable to each migrant
pupil. This variable serves to approximate the quality of the educational system in the destination country. To enable a more appropriate analysis of gender differences, the average score of native males was assigned to male immigrants. Conversely, the average score of
native females was assigned to female immigrants. Tables 4 and 5 show the average reading score and standard deviation for male and female respondents, respectively.
[Tables 4 & 5 about here]
5. Methods
We apply OLS regression at the individual level with only the migrants’ children, with their
individual characteristics (including parental background and migration history) and dummies for the origin regions and destination countries. The only macro indicator is the average educational performance of the male or female native population, which is used as a control
for the quality of the education in the destination countries. Consequently, the coefficients are not influenced by differences in the educational system quality of destination countries.
Therefore the coefficients reflect purely the effect of a variable for pupils with a migration background in a destination country with the same quality of education. We apply the regressions separately for male and female pupils and use unstandardized coefficients, which
make the results comparable because all variables are similarly coded for both sexes. We estimate equations with the dummies of the destination countries, socioeconomic
characteristics, and migration history as controls, equations that also include dummies for origin regions as controls and equations that include the native average score for the dependent variable. The combination of first generation and the official language is the
reference category for the six combinations of generation and language spoken at home. Denmark, Norway, and Finland are the combined reference categories for the destination
countries, and Northern Europe for origin regions. We use these countries and region as they have the greatest gender equality in educational performance among our sample countries and regions (see Tables 4 and 5).
To avoid the dominance of certain destination countries on the outcome of the analyses due to differences in sample size and numbers of migrant pupils, we included a
weighting factor in all OLS analyses such that all destination countries have the same number of migrant pupils. Each pupil was assigned a weighting factor equal to 500/x j, with x being the number of observed migrant pupils in their destination country j. For example, Swiss pupils
constitute 10.63% of our dataset, with 3553 respondents. In contrast, our sample of migrant pupils in Liechtenstein is limited to 210 respondents, that is, 0.63% of the total dataset (see
Table 1). Thus pupils in Switzerland are assigned a weight of 500/3553 = 0.14, whereas pupils from Liechtenstein are weighted with a factor of 500/210 = 2.38. Given the average

9
number of migrant pupils in destination countries (1114), we generally underweight the
scores, which is our preferred method since the results will be more conservative and thus reliable. However, we deleted migrants to Indonesia and Turkey from the more sophisticated
analyses of Section 6 because their numbers are too small (12/35) and they would thus be strongly overweighted. Table 6 shows the various models for male and female pupils separately, with reading
score as the dependent variable. Table 7 shows the same models as Table 6, but with math scores as the dependent variable.
[Table 6 about here]
6. Results
6.1. Socioeconomic characteristics and migration history (model 1) Model 1 in Table 6 includes destination countries, socioeconomic characteristics, and
migration history variables, separately for males and females. The constant of these models reflects the score of first-generation pupils who speak the official language of their destination country, with an ESCS score of zero,4 both parents having been born outside the destination
country, not living in a nuclear family, and living in Denmark, Finland, or Norway. The results of model 1 are without any control for the origin of pupils with a migrant history and
can therefore be misleading. Differences between the coefficients of model 1 and models 2 and 3 reflect the importance of including the origins of migrant children and the quality of education in the destination countries to predict their educational performance.
Female pupils have much higher reading scores (54 = 488 - 434) in model 1 than male pupils under the same socioeconomic conditions and with the same migrant history and
destination country. This female advantage in reading scores may be a consequence of the generally higher reading scores of female pupils, irrespective of whether they have a migrant history or are native pupils.
The parameters for first generation with a foreign language at home are more or less equal for males (-22) and females (-24). The same holds for the two combinations of second
generation and language at home, since they are also roughly the same for both genders. The improvement of zero to four points for second generation with the official language in comparison with the reference category is insignificant. Third-generation pupils are only
those who still speak a foreign language while they and their parents were both born in the destination country. The reading scores of these non-integrated third-generation males are
insignificantly lower (-12) than that of first-generation male pupils who speak the official language at home. In contrast, third-generation female counterpart score 28 points lower than first-generation female pupils who speak the official language at home. Thus there are only
gender differences in the reading scores of third-generation pupils who speak a foreign language, to the disadvantage of female pupils.
Similarly, the effect of having mixed parents is more or less the same for males and females (higher score of 6 or 5 points). This is not true for living in a nuclear family instead of another family type. The positive effect of a nuclear family is greater for males than for
females (24 points higher versus 14 points), and this difference of 10 points remains constant in models 2 and 3.
Finally, the parental social background has significant and very similar effects on the scholastic performance of both sexes. As would be expected, an increase of one unit in the ESCS indicator is associated with an increase in performance between 29 and 30 points,
regardless of the pupil’s gender.
4 The average ESCS score of pupils with a migrant background is not zero but -0.27.

10
The negative effect of missing values on these individual variables, as measured with
the dummies, is, on average, greater for females than for males. One could assume that pupils who do not or cannot provide this information have unmeasured characteristics that are
harmful to educational performance. 6.2. Origin regions (Model 2)
In model 2 we add the origin regions to the equation with socioeconomic characteristics, migration history variables, and countries of destination. The reference origin region is
Northern Europe, which, in this analysis, contains pupils originating from Sweden, Denmark, and Estonia (see the map of Figure 1 and Table 2). The inclusion is important because migration is not a random process but, instead, connects destination and origin countries by
historical, cultural, and economic ties, which increase the chance of migration between the connected countries.
Female pupils from South America perform worse than comparable female pupils from Northern Europe (-29), and the same holds for female pupils from Northern Africa (-24), Sub-Saharan Africa (-24), and South Asia (-28). Male pupils from North America perform
better than comparable male pupils from Northern Europe (49). Female pupils from Southeast Asia perform better than comparable female pupils from Northern Europe (37). Male and
female pupils from the Caribbean perform worse than comparable pupils from Northern Europe (-59 and -56, respectively), and the same holds for male and female pupils from Oceania (-37 and -23, respectively) and West Asia (-25 and -47, respectively). Male and
female pupils from East Asia perform better than comparable pupils from Northern Europe (31 and 22, respectively).
The addition of the origin regions hardly changes the strength of the generation variables or the strength of most of the coefficients of the socioeconomic characteristics and migration history variables and does not change their direction. The increase in R2 with the
addition of origin regions is small (1% for males and 2% for females) but, given the already included independent variables in model 2, a large increase is nearly impossible. So, the
origins of migrants are not trivial features that can be neglected in any serious scientific or policy analysis. However, it is important to note that the coefficients of the origin regions (but not their positive or negative sign) change slightly for both male and female pupils after
adding the native reading score in model 3. This change reflects the unequal distribution of migrants from specific regions among the different destination countries with different quality
educational systems. 6.3. Average native scores of the dependent variable (model 3)
In model 3 we add the average native scores of the dependent variable to the equation with socioeconomic characteristics, migration history variables, destination country dummies, and
origin region dummies. The equation now reflects the scores of first-generation pupils from Northern Europe who speak the official language at home relative to the average educational performance of native pupils of the same gender in their destination country.
The parameters of the native reading scores are positive in all models but remain below one. This means that the average reading score of pupils with a migration background
is higher in destination countries where the average native pupil’s score is higher (which reflects a higher-quality educational system). Thus, first-generation male pupils from Northern Europe who speak the official language at home, with a zero ESCS score, in a
destination country with an average male native pupil score5 have a reading score of 412 (= 76
5 The average native male score for all our destination countries is 461; see Table 3. 6 Constant of Model 3 in Table 6 for males.
11
+ (0.887 * 4618 = 405)), while comparable first-generation female pupils from Northern
Europe who speak the official language at home, with a zero ESCS score, in a destination country with an average female native pupil score9 have a reading score of 481 (= 25610 +
(0.4511 * 50112= 225)). These reading scores increase respectively by six and three points to 421 or 478 for second-generation, official language-speaking male and female pupils, respectively by 25 and 15 points to 430 or 490 for first-generation, official language-speaking
male and female pupils living in a nuclear family, and respectively by 5 and 1 points to 410 or 476 for male and female first-generation, official language-speaking pupils with one parent
born in the destination country. This supports the first part of our first hypothesis, because female pupils (migrant background or native) have higher reading scores, even if we consider that native female pupils also have higher reading scores (40 points = 50113 - 46114).
The effect of the average reading performance of male native pupils is stronger on the reading scores of male migrant pupils (0.88) than the analogous effect for female migrant
pupils (0.45). This contradicts our third hypothesis. The addition of the native reading score to the equations of model 3 does not change
the coefficients of the origin countries by much compared to the same parameters of model 2,
but some become insignificant (at the 1% level). Male pupils from North America perform better than comparable male pupils from Northern Europe (49). Female pupils from Southeast
Asia perform better than comparable male pupils from Northern Europe (40). Male and female pupils from the Caribbean perform worse than comparable pupils from Northern Europe (-56; -48), and the same holds for male and female pupils from Oceania (-36; -21),
and West Asia (-22; -38). Male and female pupils from East Asia perform better than comparable pupils from Northern Europe (33; 27). These results underline the importance of
taking into account origin countries if one wishes to understand the differences in the educational performance of pupils with a migrant background.
6.4 The higher performance of female pupils originating from poorer, more traditional societies (hypothesis 1).
Based on model 3 of Table 6, we compute in Section 6.3 that male first-generation pupils from Northern Europe who speak the official language at home, with a zero ESCS score, in Denmark, Norway, or Finland have a reading score of 412, while comparable first-
generation female pupils from Northern Europe in the same destination countries have a reading score of 481. This means that we can accept the first part of our first hypothesis for
migrant pupils from Northern Europe. The reading test scores of female migrant pupils are 69 points higher than for comparable male migrant pupils, while the difference for native pupils is 40.
Our first hypothesis also states that daughters of migrants coming from poorer, more traditional regions perform much better in reading than comparable sons of migrants from the
same regions, while the daughters of migrants from more affluent and liberal regions perform slightly better in reading compared to the sons of migrants from the same regions, taking into account the performance of native female and male pupils in their destination countries and
the higher reading scores of female native pupils. We use the origin region parameters of
7 Coefficient of Native Reading Score in Model 3 in Table 6 for males. 8 Average native male score for all our destination countries in Table 3. 9 The average native female score for all our destination countries is 501; see Table 3. 10 Constant of Model 3 in Table 6 for females. 11 Coefficient of Native Reading Score in Model 3 in Table 6 for females. 12 Average native female score for all our destination countries in Table 3. 13 Average native female score for all our destination countries in Table 3. 14 Average native male score for all our destination countries in Table 3.

12
model 3 of Table 6 to test this hypothesis. If our hypothesis is correct, the female–male
differences in the strength of the origin parameters should be positive for the poorer, more traditional regions and negative for richer, more liberal societies. The differences between the
female and male parameters are as follows, in descending order: Southeast Asia, +16; Oceania, +15; the Caribbean, +8; Western Europe, -2; Southern Europe, -3; East Asia, -6; Eastern Europe, -7; Sub-Saharan Africa, -9; South America, -13; South Asia, -14; West Asia,
-17; Northern Africa, -18; and North America, -36. This order of female–male differences in the strength of the origin parameters does not
support the second part of our hypothesis. Although Malaysia, the Philippines, and Vietnam (the available origin countries of the Southeast Asian region) are not the richest or most liberal societies, neither are they the poorest nor most traditional. This is even more so for
Australia, New Zealand, and Samoa (the available origin countries of the Oceania region). The United States (the only available origin country of the Northern America region) is
perhaps the richest and most liberal society, but this is not true for Northern Africa, West Asia, South Asia, or South America. Thus, this variance in the female–male differences in the strength of the origin region parameters does not reflect a general level of prosperity or
liberty. This rejection of the second part of the first hypothesis does not mean that the female migrant pupils have lower reading scores than their male counterparts, because we show in
Section 6.3 that the average female–male reading score difference is 69, which is greater than for natives (40). Our rejection means that this difference is not simply influenced by the poverty and traditionalism of origin societies.
6.5 The stronger effect of parental socioeconomic background on female performance
(hypothesis 2). Our second hypothesis states that parental socioeconomic background has a stronger effect on the educational performance of the daughters of migrants than on the performance of the sons
of migrants. The gender-related coefficients of socioeconomic background are not sufficiently different in model 3 to determine a significant variation of the impact of these variables on
both genders. Therefore we must reject our second hypothesis. 6.6 The stronger influence of native females on the performance of female migrant pupils
(hypothesis 3). Our third hypothesis says that the educational performance of the daughters of migrants is
more influenced by the performance of female native pupils than the performance of the sons of migrants will be influenced by the performance of male native pupils. Model 3 rejects this third hypothesis. The effect of a higher average score of male native pupils on the reading
score of male migrant pupils is 0.88, while the effect of a higher average score of female native pupils on the reading score of female migrant pupils is 0.45. Therefore, female migrant
pupils profit less from the higher average reading score of native females than male migrant pupils do from the average reading performance of native males.
6.7 Third generation The PISA data of 2009 make it possible to identify the third-generation children of migrants
by the language they speak at home. This is not a representative sample of third-generation immigrants since only those pupils who continue to speak a foreign language can be identified. This category may be regarded as non-integrated immigrants despite their long
presence in the destination country. Table 6 seems to suggest that these third-generation male pupils have even higher reading scores (-11) than the second and first generations who speak
a foreign language at home (-21 and -24, respectively). Interestingly, we do not observe this positive third-generation effect for female pupils. Third-generation female pupils have lower

13
reading scores (-28) than first-generation female pupils who speak the official language at
home. This lower reading score of female third-generation pupils (-28) is not very different from that of the second and first generations who speak a foreign language at home (-16 and
-26, respectively). 6.8 Destination countries
Although our hypotheses do not address the effects of destination countries, these are still interesting to discuss (see Appendix A4). After controlling for the quality of the educational
system of the destination countries by the average reading score of native pupils in model 3, only a few unique destination country parameters remain significant. Male and female migrants to Israel have higher reading scores (63 and 33 respectively) and the same holds for
the male and female migrants to Australia (43; 27), Liechtenstein (26; 23), New Zealand (54; 40), Portugal (43; 32), and Scotland (80; 49), partly neutralizing the female migrant pupil
advantage in reading scores. These systematic unique destination country effects are, in five of the six cases, substantially higher for male pupils than for female pupils. Although we can provide some ad hoc explanations of these unique destination effects, we refrain from doing
so because this is not the aim of this paper. The small number of systematic unique destination country effects shows that after controlling for the quality of educational systems,
not much variance is left for additional destination country deviances. 6.9 Non-western countries
Instead of analyzing only western countries as destination countries (as in the earlier cross-classified studies with PISA data), we analyze the educational performance of the children of
migrants in destination countries across Asia, Europe, Latin America, and Oceania. The educational performance of migrants in these non-western countries does not deviate any more from the general trend than those of western countries, after controlling for the quality
of their educational systems (compare models 2 and 3 of Appendix A4).
6.10 Internal migration inside China. In addition to regular Chinese migrants in non-Chinese countries, we also include internal migrants in China, either from westernized or Mainland China. These internal migrants
originated from the East Asian region and migrated to the destination “countries” of Hong Kong, Macao, and Shanghai. The parameters of the East Asian region are more or less the
same in models 2 and 3 of Table 6: migrant pupils from this region score higher than comparable migrant pupils from Northern Europe. The parameters of Hong Kong, Macao, and Shanghai in models 2 and 3 of Appendix A4 are also not exceptional. Before controlling
for the quality of their educational systems (as measured by the average performance of native pupils), migrant pupils in Hong Kong and Shanghai (but not Macao) score higher than
comparable migrant pupils from Northern Europe. After controlling for the quality of their educational systems, however, the parameters are insignificant. This supports the correctness of including internal migration inside China in our analysis and suggests that the Shanghai
data are not irregular.
7. Robustness test: Math scores
We use the dependent variable math score as a robustness test, and the results are given in Table 7. We want to use this indicator of educational performance instead of the reading score
to test whether our hypotheses hold up if we use a performance indicator on which female native pupils, on average, score 10 points lower than male native pupils (see Table 3). Finding
the same results for math as for reading is an indication of the robustness of our outcomes.

14
[Table 7 about here]
Our first hypothesis says that the daughters of migrants from poorer, more traditional regions
perform much better in math than comparable sons of migrants from the same origin regions, while the daughters of migrants from more affluent and liberal regions perform slightly better in math than comparable sons of migrants from the same origin regions, taking into account
the performance of native female and male pupils in their destination countries and the lower math score of male native pupils. Based on model 3 of Table 7 and the averages of Table 3,
we can compute that male first-generation pupils from Northern Europe who speak the official language at home, with a zero ESCS score, in Denmark, Norway, or Finland have a math score of 428 (= -151 + (1.18 * 491 = 579)), while comparable first-generation female
pupils from Northern Europe in the same destination countries have a math score of 447 (= 144 + (0.63 * 481 = 303)).
This means that we can accept the first part of our first hypothesis for migrant pupils from Northern Europe: Female migrant pupils have a math test score that is 19 points higher than for comparable male migrant pupils, while this difference for native pupils is -10 points
(males being better than females). This relative advantage in the math scores of female migrant increases, even if they originate from Oceania, with 17 points (-25 - (-42)); Southeast
Asia, with 14 points (38 - 24); the Caribbean region, with nine points (-38 - (-47)); and East Asia, with five points (40 - 35). This relative advantage in the math scores of female migrant pupils decreases if they originate from Southern Europe, with six points (-11 - (-5)); South
America, with 14 points (-22 - (-8); North America, with 15 points (27 - 42); South Asia, with 15 points (-22 - (-7)); West Asia, with 16 points (-32 - (-16); and Northern Africa, with 23
points (-24 - (-1)). But these decreases are in most cases not large enough to neutralize the 19-point higher math score of female migrant pupils from Northern Europe, and the variance by region is not clearly related to the poverty or traditionalism of regions. Oceania and Southeast
Asia are not the poorest or most traditional regions. One can maintain that West Asia and Northern Africa belong to the poorest and most traditional regions, but we assume that the
female–male difference in math would be larger instead of smaller. Thus we cannot accept the second part of our first hypothesis.
Our second hypothesis says that parental socioeconomic background has a stronger
effect on the educational performance of the daughters of migrants than on the performance of the sons of migrants. The coefficients of socioeconomic background in model 3 do not
differ for male and female pupils. Our third hypothesis says that the educational performance of the daughters of
migrants is more influenced by the performance of female native pupils than the performance
of sons of migrants is influenced by that of male native pupils. Model 3 does not support this hypothesis. The effect of a higher average math score for male native pupils on the math score
of male migrant pupils is 1.18, while the effect of a higher average math score for female native pupils on the math score of female migrant pupils is 0.63. Female migrant pupils thus profit less from the higher average math score of the same native gender than male migrant
pupils.
8. Conclusions
This article investigates three hypotheses related to gender-specific differences in educational performance between 16,612 daughters and 16,804 sons of migrants from 14 regions,
including 62 origin countries and 12 origin areas. Focusing on gender differences, with the help of PISA 2009, this paper fills a gap in research on the cross-national educational
performances of migrant children and forms the first part of a series of papers that contribute to a wider understanding of factors from various levels of analysis that influence these
15
differences in male and female migrant scholastic performances. We use OLS regressions
with individual- level characteristics as well as dummies for regions of origin and destination countries. We also include the average performance of the native population to control for
differences in educational system quality between destination countries. 8.1. The three hypotheses
As a possible consequence of a religiously and/or culturally motivated male bias in poorer, more traditional countries on the scholastic performance of daughters of migrants in more
affluent and liberal countries (where such a male bias is weaker), our first hypothesis assumes that the daughters of migrants from poorer, more traditional regions perform much better in reading than the comparable sons of migrants from the same regions, while the daughters of
migrants from more affluent and liberal regions perform slightly better in reading than comparable sons of migrants from the same regions, taking into account the performance of
native female and male pupils in their destination countries and the higher reading score of female native pupils. Our results in Section 6.3 support the first part of this hypothesis, since female migrant pupils of all origins outperform their comparable male counterparts in reading
by 69 points. If we subtract the average difference in reading between female and male native pupils (40), the “pure” reading performance of female migrant girls is higher by only 29
points. However, only in the destination countries Israel and Scotland, this reading advantage is partly neutralized (see Section 6.8). In addition, coming from the region North America (-36) neutralizes this superior reading performance. Thus, in general, the daughters of migrants
from the other regions perform better in reading than the comparable sons of migrants, taking into account the performance of native female and male pupils in their destination countries
and the higher reading score of female native pupils. However, the second part of the first hypothesis (this superior performance being
related to the level of poverty and traditionalism of the origin region) is not upheld by our
results in Section 6.3. The differences between the female and male parameters for each origin region are, in descending order, as follows: Southeast Asia, +16; Oceania, +15; the
Caribbean, +8; Western Europe, -2; Southern Europe, -3; East Asia, -6; Eastern Europe, -7; Sub-Saharan Africa, -9; South America, -13; South Asia, -14; West Asia, -17; Northern Africa, -18; and North America, -36. This order of female–male differences in the strength of
the origin parameters does not support the second part of our hypothesis. Although Malaysia, the Philippines, and Vietnam (the available origin countries of the
Southeast Asian region) are not the richest or most liberal societies, neither are they the poorest or most traditional. This is even more so for Australia, New Zealand, and Samoa (the available origin countries of the Oceania region). The United States (the only available origin
country of the Northern America region) is perhaps the richest and most liberal society, but this is not so for the Northern African (Algeria, Morocco, Tunisia) and West Asian (Iraq,
Jordan, Turkey, Yemen) regions. Our follow-up paper (Dronkers & Kornder, forthcoming) hopes to address this rejection of the explanation of “poverty and traditionalism of the origin” by introducing macro indicators for the position of women in the various origin countries
(instead of region), as well as macro indicators relating to the inclusiveness of the educational systems, political stability, prosperity, and others.15
Our robustness test with math scores as the dependent variable gives the same results for our first hypothesis. Our results in Section 7 support the first part of this hypothesis, since female migrant pupils from all origins outperform their comparable male counterparts in math
by 19 points. If we subtract the average difference in math between females and male native pupils (-10), the “pure” superior math performance of female migrant girls is also 29 points.
15 As done in Dronkers and Heus, 2012 without the gender distinction.

16
This relative advantage in the math scores of female migrant varies by region of origin, but
these parameters are not large enough to neutralize the higher math scores of female migrant pupils. But this variance by region is not clearly related to the region’s poverty or
traditionalism. Oceania and Southeast Asia (with a large difference between female and male migrant pupils) are not the poorest or most traditional regions, while West Asia and Northern Africa belong to the poorest and most traditional regions but their female–male difference is
smaller. Since the daughters of migrants are more dependent on parental permission to
participate in the social life of their destination countries, we assume in our second hypothesis that parental socioeconomic background has a stronger effect on the educational performance of the daughters of migrants than on the performance of the sons of migrants.
However, the coefficients of parental socioeconomic background do not vary much (neither for reading or math) and thus contradict our second hypothesis.
Since native gender performance may serve as a reference point for immigrant sons and daughters, our third hypothesis states that the educational performance of the daughters of migrants is more influenced by the performance of female native pupils than the education
performance of the sons of migrants is influenced by the performance of male native pupils. We do not find any support for this hypothesis, because the effects of the educational
performance of male native pupils on the performance of male migrant pupils are greater than the effects of the educational performance of female native pupils on the performance of female migrant pupils. In other words, male migrant pupils profit relatively more from the
quality of the educational system of their destination countries than female migrant pupils. We propose a competitive hypothesis that male migrant pupils require more structure in their
socialization in the destination countries than female migrant pupils and thus profit more from the quality of the educational systems (Dronkers & Lange, 2011).
8.2. Other results First, we find substantial variations in performance variance by origin, even after
taking into account parental socioeconomic background, migration features, and the gender variation of native pupils in the destination countries. This is true for both reading and math. Although we had to reject our poverty and traditionalism explanation of this origin variation,
these strong origin effects (especially in comparison with the weaker destination country effects) challenge the conventional wisdom of ignoring the variation of these origin effects in
many scientific analyses of migrant outcomes (education, labor market, political participation, integration, marriage) and also by policy agents such as the Organisation for Economic Co-operation and Development (2006) and the European Commission (2008).
After controlling for the educational performance of native pupils (as an indicator of the quality of their educational systems), there is not much significant effect of the destination countries is left. This suggests that destination countries are far less important in shaping
educational performance differences, as is often thought to be the case in policy debates. This also means that there are no large differences between western societies and non-western
destination societies in the PISA data regarding the educational performance of migrant pupils.
Our results underline another important point: The general focus on the language
performance of migrant pupils by educational policies in many societies ignores the relative strength of male migrant pupils in math compared to reading. Our results also show that the
quality of educational systems in destination countries promotes male educational performance in math more than in reading. This policy focus on learning language and neglecting math as an important learning goal may hamper the empowerment of male migrant
17
pupils because such a biased policy underlines their relative educational failure without
offering the alternative outperformance in math. Third-generation immigrants who continue to speak a foreign language may be
regarded as non-integrated immigrants despite their long presence in the destination country. Our results show that third-generation male pupils have higher reading scores than second- or first-generation male pupils who speak a foreign language at home. However third-generation
female pupils have a score equal to that of second- and first-generation female pupils who speak a foreign language at home. This deviating result for female pupils may be explained by
the relatively strong male-biased gender attitudes of that section of second-generation parents who continue to speak a language with their children at home other than the official language of the destination country. These strong male-biased gender attitudes may prevent third-
generation daughters (but not sons) from participating in the society of the destination countries and thus lower their language skills. For these third-generation female pupils who
speak a foreign language at home, increased educational opportunities do not seem to be a way to escape from the male bias of their parents’ religious and/or cultural traditions.
Our results also suggest that a nuclear family may have different meanings for male
and female migrant pupils. Both genders profit from living in a nuclear family instead of another family type, but the effect of a nuclear family is substantially greater for males than
for comparable females (reading 25 and 15 respectively; math 25 and17). We may assume that male migrant pupils require more structure in their socialization than female migrant pupils and thus need the more stable structure of the traditional family (see also Dronkers &
de Lange, 2011).
8.3. Caveats First, our definition of third-generation immigrants is restricted to those families that continue to speak a foreign language at home. Since the information provided by PISA is not specific
enough to identify third-generation families in general, we must rely on spoken languages at home. In addition, this language must be traceable to a single origin country or area, so that
third-generation immigrants from English-, Spanish-, or French-speaking countries, for example, cannot be identified due to the great ambiguity in their original provenance.
Second, although the dataset used in this study comprises the largest number of
migrant pupil scholastic performance observations with the greatest variety of origin and destination countries so far, it must still be mentioned that Africa is heavily underrepresented
and no suitable observations could be identified from Central Asia. Nevertheless, we provide a cross-national comparison that is much broader in scope than previous papers on this topic.
Third, we recognize that the coefficients for several missing dummy variables remain
significant in most of the models applied in this paper. Since these variables solely identify observations for which ESCS values, for instance, must be imputed, their significance casts
doubt on our imputation methodology. However, Table 3 shows that only 1% of male and 0.5% of female migrants are affected by the imputation. This percentage is somewhat higher for the variables for mixed marriage and the official language of the destination country being
spoken at home (around 7% for males and 5.6% for females). We do not believe that this shortcoming is sufficient to necessitate the alternative, which would be to dismiss these
observations. In general, with our three hypotheses we aim to describe the differences in the
performance of male and female migrant children and how they arise. The failure to confirm
these hypotheses demonstrates that a great part of these differences cannot yet be explained with the current variables. As a next step, we will investigate the effect of macro-level
characteristics of origin countries on the scholastic performance of male and female migrants. For example, different origin countries may be more or less developed in terms of economic

18
output, educational systems, or gender equality, which may, in turn, influence the beliefs and
aspirations of male migrant children differently than female migrant pupils. The same may be true for macro variables of destination countries, such as the quality of their educational
systems and their openness to migrants. Similarly, cultural and religious aspects must be recognized in the analysis to ensure a set of explanatory variables that is as complete as possible. In our follow-up paper (Dronkers & Kornder, forthcoming), we will replace the
current origin regions by these macro-level features of origin and destination countries in an attempt to better explain the variation in the educational performance of female and male
migrant pupils.
19
References
Abada, T. & Tenkorang, E.Y. (2009). “Gender differences in educational attainment among children of Canadian immigrants.” International Sociology 24, 580–608.
Castles, S. & Miller, M.J. (2003). The Age of Migration: International Population Movements in the Modern World. New York: Guilford Press.
Dion, K.K. & Dion, K.L. (2001). “Gender and cultural adaptation in immigrant families.” Journal of Social Issues 57, 511–521.
Dronkers, J. & de Heus, M. (2012). “The educational performance of children of immigrants in 16 OECD countries.” In D.J. Besharov, M.H. Lopez & M . Siegel (Eds.), A World in Motion: Trends in Migration and Migration Policy, Oxford: Oxford University Press.
Dronkers, J. & Kornder, N. (forthcoming). “Differences between the educational performance of 15-year old daughters and sons of migrants and the gender inequality in countries of origin and destination.” Unpublished manuscript.
Dronkers, J. & de Lange, M. (2011). “Increasing negative effects of single-parenthood
on educational outcomes by higher single parenthood-levels? A comparison of PISA 2000, 2003 and 2009.” Paper presented at the Ninth Conference of the European Network for the
Sociological and Demographic Study of Divorce, Bocconi University in Milano (Italy), October 27–29.
European Commission (2008). Migration & Mobility: Challenges and Opportunities
for EU Education Systems. Brussels: European Commission. Feliciano, C. & Rumbaut, R.G. (2005). “Gendered paths: Educational and
occupational expectations and outcomes among adult children of immigrants.” Ethnic and Racial Studies 28, 1087–1118.
Fleischmann, F. & Kristen, C. (forthcoming). “Gender gaps in the education of the second generation.” In A. Heath & Y. Brinbaum (Eds.), Unequal Attainments. Ethnic Educational Inequalities in Ten Western Countries. Oxford: Proceedings of the British Academy.
Fuligni, A.J., Tseng, V. & Lam, M. (1999), “Attitudes toward family obligations among American adolescents with Asian, Latin American, and European backgrounds.” Child Development 70, 1030–1044.
Ganzeboom, H. B. G., de Graaf, P., Treiman, D. J. & De Leeuw, J. (1992), “A standard international socio-economic index of occupational status.” Social Science Research 21, 1–56.
De Heus, M., & Dronkers, J. (2010). “De onderwijsprestaties van immigrantkinderen in 16 OECD-landen. De invloed van onderwijsstelsels en overige samenlevingskenmerken van zowel herkomst- als bestemmingslanden” [The educational performance of immigrant children in 16 OECD countries. The influence of educational systems and other societal features of both countries of origin and destination]. Tijdschrift voor Sociologie 31, 260–294.
Levels, M. & Dronkers, J. (2008) "Educational performance of native and immigrant children from various countries of origin." Ethnic and Racial Studies 31, 1404–1425.
Levels, M., Dronkers, J., & Kraaykamp, G. (2008). “Immigrant children’s educational achievement in Western countries: Origin, destination, and community effects on mathematical performance.” American Sociological Review 73, 835–853.
Organisation for Economic Co-operation and Development (2006). Where Immigrant Students Succeed. Pisa 2003. Paris: Organisation for Economic Co-operation and
Development.

20
Organisation for Economic Co-operation and Development (2010). PISA 2009 Results: What Students Know and Can Do Paris: Organisation for Economic Co-operation and Development.
Portes, A. (1999). “Conclusion: Towards a new world – The origins and effects of transnational activities.” Ethnic and Racial Studies 22(2), 463–477.
Portes, A. & Rumbaut, R.G. (2001). Legacies: The Story of the Immigrant Second Generation. Berkeley, CA: University of California Press.
United Nations Educational, Scientific and Cultural Organization (2006). ISCED 1997: International Standard Classification of Education . Re-Edition. Paris: United Nations Educational, Scientific and Cultural Organization.
Song, S. & Robert, P. (2010). “Immigrant student investigation in PISA 2006: A call for a more nuanced examination.” Journal for Educational Research Online 2, 32–52.
Zhou, M. & Bankston, C.L. (2001). “Family pressure and the educational experience of the daughters of Vietnamese refugees” International Migration 39, 133–151.
21
Figure 1. United Nations geographical subregions

22
Table 1. Destination countries in PISA 2009 with countries of birth Frequency Percentage
Argentina 310 0.93 Australia 3,162 9.46 Austria 1,037 3.10 Belgium 1,515 4.53
Croatia 1,111 3.32 Czech Republic 437 1.31 Denmark 956 2.86 Finland 210 0.63
Germany 824 2.47 Greece 394 1.18 Hong Kong 2,665 7.98 Indonesia 12 0.04
Israel 912 2.73 Latvia 758 2.27 Liechtenstein 210 0.63
Luxembourg 2,081 6.23 Macao 4,914 14.71 Mexico 310 0.93 Montenegro 950 2.84
Netherlands 624 1.87 New Zealand 1,061 3.18 Norway 145 0.43 Portugal 838 2.51
Qatar 1,613 4.83 Scotland 71 0.21 Serbia 932 2.79 Shanghai 1,603 4.80
Switzerland 3,553 10.63 Turkey 35 0.10 Uruguay 173 0.52
Total 33,416 100.00
Source: PISA 2009 (own computation; not weighted).
23
Table 2. Known countries of origin in PISA 2009
Countries of origin Frequency Percentage Countries of origin Frequency Percentage
Afghanistan 68 0.20 Philippines 230 0.69 Albania 371 1.11 Poland 164 0.49 Argentina 75 0.22 Portugal 1,516 4.54 Australia 134 0.40 Romania 37 0.11
Austria 182 0.54 Russian Federation 510 1.53 Bangladesh 3 0.01 Samoa 145 0.43 Belarus 192 0.57 Slovak Republic 331 0.99 Belgium 174 0.52 Slovenia 2 0.01
Bolivia 93 0.28 Somalia 56 0.17 Bosnia and Herzegovina 1,333 3.99 South Africa 280 0.84 Brazil 254 0.76 Spain 194 0.58 Cape Verde 82 0.25 Suriname 121 0.36
Chile 50 0.15 Sweden 216 0.65 Congo 270 0.81 Switzerland 89 0.27 Croatia 184 0.55 Turkey 1,501 4.49
Czech Republic 5 0.01 Ukraine 172 0.51 Denmark 56 0.17 United Kingdom 1,900 5.69 Egypt 636 1.90 United States of America 586 1.75 Estonia 29 0.09 Uruguay 31 0.09
Ethiopia 165 0.49 Vietnam 141 0.42 France 997 2.98 Yemen 419 1.25 Germany 1,143 3.42 African country with Portuguese as official language 667 2.00 Greece 38 0.11 Algeria, Morocco, Tunisia 342 1.02
India 134 0.40 Eastern European country outside the EU 29 0.09 Islamic republic of Iran 12 0.04 Arabic region 68 0.20 Iraq 138 0.41 Caribbean 4 0.01 Italy 959 2.87 From former Yugoslavia migrated to Serbia 932 2.79
Jordan 268 0.80 From Slovenia. Macedonia & Montenegro to Croatia 111 0.33 Republic of Korea 159 0.48 Middle Eastern Country 7 0.02 Lebanon 137 0.41 Netherlands Antilles 37 0.11
Liechtenstein 32 0.10 One of the former USSR republics 917 2.74 Former Yugoslav Macedonia 28 0.08 One of the former Yugoslav republics 1,327 3.97 Malaysia 4 0.01 Serbia and Montenegro 823 2.46 Morocco 136 0.41 Spanish America 8 0.02
Netherlands 208 0.62 External immigrants from China to non-Chinese countries 423 1.27
New Zealand 674 2.02 Internal immigrants from westernized China 287 0.86 Occupied Palestinian
Territory 290 0.87 Internal immigrants in China 8,845 26.47 Pakistan 117 0.35 Total 33,416 100.00 Paraguay 118 0.35
Source: PISA 2009 (own computation; not weighted).

24
Table 3. Summary of variables Males Females Minimum Maximum Mean Std. Dev. Minimum Maximum Mean Std. Dev.
Migrant 1 generation 0 1 0.29 0.45 0 1 0.26 0.44
Migrant 2 generation 0 1 0.69 0.46 0 1 0.72 0.45 Migrant 3 generation 0 1 0.02 0.13 0 1 0.02 0.13 Reading score 59.3 780.5 446.84 105.25 125.8 823.7 490.04 94.32 Math score 102.4 869.9 476.45 108.62 132.4 825.7 469.80 99.03
ESCS missing -5.7 3.0 -0.16 1.07 -5.7 3.1 -0.24 1.05 ESCS (missing values imputed) 0 1 0.01 0.10 0 1 0.01 0.07 Nuclear family 0 1 0.75 0.43 0 1 0.76 0.43
Mixed marriage 0 1 0.47 0.50 0 1 0.48 0.50 Mixed marriage missing 0 1 0.07 0.26 0 1 0.06 0.23 Official language 0 1 0.69 0.46 0 1 0.73 0.44 Language information missing 0 1 0.07 0.25 0 1 0.06 0.23
Regions of origin South America 0 1 0.08 0.27 0 1 0.08 0.27 North America 0 1 0.04 0.19 0 1 0.04 0.20 Caribbean 0 1 0.00 0.07 0 1 0.00 0.06
Northern Europe 0 1 0.09 0.29 0 1 0.09 0.28 Western Europe 0 1 0.13 0.33 0 1 0.12 0.32 Eastern Europe 0 1 0.12 0.32 0 1 0.12 0.33 Southern Europe 0 1 0.20 0.40 0 1 0.20 0.40
Northern Africa 0 1 0.03 0.16 0 1 0.03 0.17 Sub-Saharan Africa 0 1 0.04 0.20 0 1 0.05 0.22 West Asia 0 1 0.08 0.28 0 1 0.09 0.28
South Asia 0 1 0.03 0.16 0 1 0.03 0.17 East Asia 0 1 0.12 0.33 0 1 0.12 0.32 Southeast Asia 0 1 0.02 0.13 0 1 0.02 0.14 Oceania 0 1 0.03 0.16 0 1 0.02 0.13
Native reading score 311.2 536.3 461.25 49.02 365.4 574.1 500.64 46.66 Native math score 336.3 600.8 491.31 60.65 344.9 598.2 480.67 57.21
Source: PISA 2009 (own computation; not weighted).

25
Table 4. Mean scores and standard deviations of males’ reading ability, by migrant generation status and region of origin, per destination country (N = 16,804) Migrant generation status Region of origin
All 1st
generation 2nd
generation 3rd
generation NEU WEU EEU SEU NAM SAM CAR NAF SAF OCE WAS EAS SAS SEAS
One parent born in
test
country
Foreign language
spoken at
home
All 462.89 456.85 465.50 448.27 511.42 486.04 465.21 428.85 456.90 411.54 462.70 422.19 466.29 477.82 383.09 500.28 467.26 482.01 476.93 424.46
98.64 103.46 96.39 108.91 93.14 91.92 93.03 88.83 118.28 108.66 87.00 99.59 102.62 105.24 90.02 82.27 104.48 85.42 96.13 98.55
Argentina 364.34 342.13 371.67 246.30 – – – – – 364.34 – – – – – – – – 380.03 252.86 101.56 121.49 96.23 74.64 101.56 99.15 94.12 Australia 506.75 500.87 509.33 503.48 507.11 – – 380.08 531.67 – – – 504.20 485.28 467.49 540.37 528.59 496.21 504.06 499.88
96.78 102.54 94.53 94.65 91.03 53.58 96.17 96.65 100.15 102.45 107.23 93.20 82.95 91.33 110.34 Austria 412.27 394.64 417.30 446.45 – 464.34 435.12 406.30 – – – – – – 371.22 – – – 446.06 389.72 94.32 96.17 91.87 135.87 95.96 85.80 88.46 81.56 102.55 84.06
Belgium 464.09 454.43 469.46 454.89 – 481.45 – – – – – 445.21 481.56 – 398.05 – – – 495.23 434.15 103.26 99.76 105.27 72.49 94.32 103.19 111.97 95.00 102.19 103.45 Croatia 449.10 425.00 453.23 435.04 – – 475.12 449.01 – – – – – – – – – – 459.90 426.92 87.13 90.75 86.15 60.30 46.71 87.24 86.79 97.08
Czech Rep. 459.76 458.52 460.76 425.22 – – 459.94 – – – – – – – – 381.51 – 466.36 469.85 427.85 102.30 91.33 105.53 53.00 105.23 58.70 81.82 102.91 98.30 Denmark 403.13 378.52 408.84 445.11 – – – 420.16 – – – – 390.94 – 402.31 – 398.96 – 408.91 397.52 72.75 65.08 73.27 69.23 72.56 74.76 73.65 67.56 70.71 73.37
Finland 478.75 446.19 489.75 – 483.93 – 463.43 – – – – – – – – – – – 481.11 454.63 89.46 86.60 88.25 – 91.33 83.45 88.83 77.06 Germany 430.49 432.94 430.25 406.45 – – 455.40 430.27 – – – – – – 399.96 – – – 451.81 403.71 93.60 91.58 94.69 86.27 88.52 97.81 88.43 100.22 87.24
Greece 418.64 404.21 440.42 342.92 – – 426.97 414.86 – – – – – – – – – – 476.42 386.95 92.76 85.99 98.59 – 98.50 90.17 100.05 77.06 Hong Kong 519.26 498.03 530.42 – – – – – – – – – – – – 519.26 – – 519.23 479.18
79.49 77.43 78.32 – 79.49 80.64 83.30 Indonesia 301.24 275.72 377.80 – – 281.24 – – – – – – – 251.89 – – – 390.59 357.44 275.72 69.63 46.94 85.37 – 48.19 1.87 67.29 69.92 46.94 Israel 479.26 459.47 490.15 430.95 – 488.79 490.44 – 564.25 481.44 – – 390.94 – – – – – 531.67 468.38
107.05 106.33 104.49 242.48 107.45 99.17 91.57 89.54 82.41 108.96 107.06 Latvia 466.59 456.31 467.21 467.86 – – 466.59 – – – – – – – – – – – 464.57 424.77 80.52 62.21 81.95 50.62 80.52 80.71 74.44 Liechtenstein 483.51 475.00 487.37 – – 493.87 – 467.52 – – – – – – 432.69 – – – 497.68 452.16
79.97 84.14 78.28 – 77.61 73.97 86.66 75.31 73.74 Luxembourg 427.04 419.50 430.68 405.74 519.68 485.49 – 399.99 – – – – 343.07 – – – – – 456.03 409.53 104.34 121.87 95.62 95.26 106.87 92.01 94.60 107.91 93.35 98.48 Macao 471.85 474.56 471.17 – – – – 491.86 – – – – – – – 472.12 – 407.17 467.91 433.37
71.12 70.45 71.29 – 74.72 70.96 66.90 71.03 70.26 Mexico 396.59 366.10 399.70 420.06 – – – – 396.59 – – – – – – – – – 401.38 398.06 92.39 96.96 86.56 96.14 92.39 81.83 101.64 Montenegro 397.26 390.44 399.71 – – – – 397.26 – – – – – – – – – – 399.97 346.25
83.27 89.21 81.02 – 83.27 83.06 92.35

26
Netherlands 472.27 460.78 475.29 – 529.49 543.75 553.06 493.28 – 486.30 462.00 451.82 – – 441.40 518.07 437.04 – 507.23 451.88
85.16 90.38 83.67 – 89.31 79.48 105.87 78.97 94.52 86.94 67.35 73.40 55.29 87.15 90.73 80.84
New Zealand 519.95 523.93 517.28 473.65 543.74 – – – – – – – 519.93 464.51 – 532.85 – – 525.50 484.36
100.84 104.94 97.47 79.67 83.64 94.78 112.29 99.97 95.95 111.42
Norway 461.92 447.05 463.75 593.69 461.92 – – – – – – – – – – – – – 471.73 408.86
102.07 108.64 100.35 – 102.07 95.95 88.47 Portugal 477.14 421.42 490.84 – – – 437.10 – – 471.44 – – 480.80 – – 382.05 – – 492.15 416.75 81.99 71.38 78.65 – 57.50 87.12 81.20 60.20 79.30 60.98 Qatar 368.22 389.98 353.00 – – – – – – – – 401.56 – – 348.77 – – – 330.30 387.30
96.58 104.55 87.53 – 98.29 90.12 79.50 130.27 Scotland 530.68 538.15 527.39 – – – – – – – 471.39 – – – 546.29 550.29 524.95 – 508.93 512.25 103.56 108.54 103.41 – 123.41 41.89 126.47 103.62 104.09 104.57 Serbia 444.23 431.20 448.33 – – – – 444.23 – – – – – – – – – – 448.33 475.20
77.16 72.98 78.09 – 77.16 79.88 68.08 Shanghai 538.53 525.09 551.03 – – – – – – – – – – – – 538.53 – – 553.36 434.88 78.50 84.42 70.39 – 78.50 73.26 76.92
Switzerland 453.56 431.42 460.23 407.22 – 494.92 – 443.36 – – – – – – 405.23 – – – 480.74 424.97 88.63 93.21 85.98 113.94 86.95 84.43 82.80 81.70 86.27 Turkey 454.19 – 454.19 – – 454.19 – – – – – – – – – – – – 456.23 295.79 84.90 – 84.90 – 84.90 87.47 –
Uruguay 388.76 436.43 383.27 261.96 – – – – – 388.76 – – – – – – – – 392.55 333.30 96.74 68.26 96.62 58.07 96.74 88.68 81.49
Source: PISA 2009 (own computation, not weighted). NEU=Northern Europe, WEU=Western Europe, EEU=Eastern Europe, SEU=Southern Europe, NAM=North America, SAM=South America, CAR=Caribbean, NAF=Northern Africa, SAF=Southern and Central Africa, OCE=Australia, New Zealand and Polynesia, WAS=Western Asia, EAS=Eastern Asia, SAS=Southern Asia, and SEAS=Southeast Asia.

27
Table 5. Mean scores and standard deviations of females’ reading ability, by migrant generation status and region of origin, per destination country (N = 16,612)
Migrant generation status Region of origin
All
1st generation
2nd generation
3rd generation
NEU WEU EEU SEU NAM SAM CAR NAF SAF OCE WAS EAS SAS SEAS
One parent
born in test-
country
Foreign
language spoken at
home
All 499.28 495.45 501.14 474.27 548.17 528.04 505.19 468.09 498.40 443.72 499.66 450.21 499.56 522.65 422.55 533.57 493.84 528.75 512.95 458.62
92.16 97.85 89.61 104.11 81.99 85.45 84.30 82.14 105.63 102.67 76.54 86.86 95.44 88.16 87.98 76.53 99.45 79.39 88.88 96.44
Argentina 419.24 359.37 401.81 – – – – – – 395.22 – – – – – – – – 399.92 330.48 95.53 117.40 90.03 – 95.65 94.60 115.60 Australia 524.58 540.89 541.87 529.32 542.86 – – 439.21 552.63 – – – 545.74 524.19 490.14 568.90 565.44 535.73 540.61 531.88 90.23 92.14 84.99 89.21 81.23 59.22 100.94 85.14 87.59 101.15 103.27 76.24 76.02 84.93 100.44
Austria 506.26 420.93 459.07 444.54 – 509.11 481.21 453.80 – – – – – – 394.12 – – – 497.65 429.29 84.80 105.64 89.68 117.71 90.37 93.98 83.14 78.78 85.91 90.52 Belgium 536.02 492.75 493.04 368.19 – 517.50 – – – – – 470.78 499.26 – 431.65 – – – 513.00 448.43 87.23 94.97 97.74 106.74 95.17 78.69 102.69 91.03 97.25 89.22
Croatia 506.11 484.61 496.48 520.47 – – 518.09 495.13 – – – – – – – – – – 494.14 501.36 76.07 67.69 74.32 42.61 51.86 73.54 75.18 69.71 Czech Rep. 523.76 549.16 494.63 457.00 – – 493.44 – – – – – – – – 555.03 – 549.58 496.24 464.15 87.58 71.65 102.80 138.63 103.13 . 70.97 101.99 122.98
Denmark 512.88 423.61 432.02 440.61 – – – 471.79 – – – – 444.07 – 422.24 – 430.72 – 454.63 422.77 74.80 73.04 77.20 57.50 71.19 74.50 73.77 78.98 86.60 77.00 Finland 560.70 526.41 528.63 – 527.96 – 528.36 – – – – – – – – – – – 530.99 518.87
71.84 114.71 72.96 – 72.30 114.68 71.86 110.55 Germany 529.55 463.26 486.16 542.32 – – 496.46 471.09 – – – – – – 451.02 – – – 503.35 458.37 85.79 89.42 81.83 58.74 80.46 76.53 79.41 83.55 85.96 Greece 513.17 454.25 488.00 – – – 462.26 471.09 – – – – – – – – – – 484.88 441.28
79.79 78.16 80.62 – 87.92 76.53 84.22 84.98 Hong Kong 555.82 533.52 560.11 – – – – – – – – – – – – 550.79 – – 553.64 505.70 74.28 75.92 69.93 – 73.16 70.69 79.02 Indonesia 420.81 346.82 460.58 – – 460.58 – – – – – – – – – – – 346.82 403.70 –
58.79 45.39 86.06 – 86.06 45.39 86.42 – Israel 494.99 492.82 517.74 324.18 – 504.67 525.08 – 544.01 469.33 – – 422.13 – – – – – 536.16 502.67 94.53 100.00 94.23 36.74 86.94 83.96 85.15 89.61 106.45 81.90 105.65 Latvia 510.81 525.79 508.23 482.54 – – 508.42 – – – – – – – – – – – 509.59 496.87
68.77 51.87 69.21 65.93 68.56 67.87 71.73 Liechtenstein 515.10 517.40 519.37 347.05 – 533.38 – 490.79 – – – – – – 434.05 – – – 534.30 478.26 75.94 70.46 73.59 – 69.03 67.47 75.36 72.02 77.49 Luxembourg 520.46 474.56 472.75 439.85 576.53 529.15 – 447.82 – – – – 408.61 – – – – – 502.68 457.34
77.80 113.81 93.15 79.37 82.26 88.86 89.53 110.10 90.91 95.17 Macao 498.56 501.16 506.57 – – – – 483.56 – – – – – – – 505.89 – 470.82 501.54 472.29 74.52 71.45 65.34 – 66.64 66.58 71.89 67.26 59.11
Mexico 445.03 395.03 456.00 444.90 – – – – 443.24 – – – – – – – – – 463.54 436.40 70.37 105.66 80.76 94.61 90.75 70.21 106.45 Montenegro 428.56 435.13 451.78 – – – – 447.27 – – – – – – – – – – 446.84 363.76 81.95 79.20 78.02 – 78.60 79.02 95.13
Netherlands 535.49 488.12 500.44 – 500.68 552.92 579.84 515.36 – 512.71 495.90 485.53 – – 476.23 525.61 375.30 – 532.00 472.89 78.77 83.63 78.84 – 96.13 77.12 39.57 90.92 76.58 82.27 66.77 78.75 13.63 34.77 83.15 71.89

28
New Zealand 545.11 558.93 553.70 349.91 576.73 – – – – – – – 566.83 518.55 – 553.50 – – 561.89 511.52
88.99 87.55 85.12 10.22 78.63 75.15 89.87 90.35 79.41 97.70
Norway 530.76 557.22 525.58 – 529.73 – – – – – – – – – – – – – 525.15 488.58 78.53 123.93 81.76 – 87.76 87.87 104.76 Portugal 507.86 494.38 516.75 – – – 511.84 – – 506.25 – – 513.13 – – 579.26 – – 523.76 471.37
76.54 65.51 70.13 – 50.89 68.87 70.63 64.26 68.33 74.62 Qatar 365.41 433.22 401.20 – – – – – – – – 432.96 – – 400.72 – – – 366.01 381.88 91.84 93.24 89.66 – 90.08 91.83 94.31 118.14 Scotland 512.17 525.07 537.28 – – – – – – – 522.26 – – – 505.25 556.49 532.67 – 548.44 530.68
84.21 77.88 52.46 – 22.97 89.49 14.75 64.23 40.83 73.18 Serbia 459.78 457.43 481.13 – – – – 476.49 – – – – – – – – – – 479.10 450.23 71.05 72.66 71.17 – 72.00 68.42 78.23 Shanghai 574.08 568.88 589.38 – – – – – – – – – – – – 580.08 – – 591.24 516.68
70.18 73.41 60.88 – 67.58 59.90 63.07 Switzerland 528.99 462.26 498.72 417.06 – 540.19 – 473.05 – – – – – – 458.55 – – – 519.37 455.20 77.16 87.22 83.99 95.55 75.19 82.17 89.79 79.35 80.60
Turkey 487.38 479.96 532.09 – – 523.86 – – – – – – – – – – – – 532.80 362.94 71.63 117.25 53.67 – 65.64 54.36 – Uruguay 443.63 409.04 467.13 314.12 – – – – – 437.83 – – – – – – – – 458.68 374.51 87.80 110.72 87.37 63.74 102.33 90.82 91.35
Source: PISA 2009 (own computation; not weighted). NEU=Northern Europe, WEU=Western Europe, EEU=Eastern Europe, SEU=Southern Europe, NAM=North America, SAM=South America, CAR=Caribbean,
NAF=Northern Africa, SAF=Southern and Central Africa, OCE=Australia, New Zealand and Polynesia, WAS=Western Asia, EAS=Eastern Asia, SAS=Southern Asia, and SEAS=Southeast Asia.

29
Table 6. Unstandardized effects of social background and region of origin on the reading
scores of male and female migrants, controlling for destination country Males Females
Model 1 Model 2 Model 3 Model 1 Model 2 Model 3
Constant 433,67* 437,43* 6,71 488,03* 502,51* 256,21*
(4,52) (4,98) (149,48) (4,21) (4,80) (90,78) Social background with 1st generation official language as reference
Migrant 1 gen foreign language -22,03* -24,10* -23,78* -23,64* -25,37* -26,00*
(4,31) (4,43) (4,43) (4,05) (4,11) (4,12)
Migrant 1 gen missing language -60,97* -59,69* -59,19* -65,20* -62,1* -61,43*
(7,48) (7,46) (7,46) (7,68) (7,62) (7,63) Migrant 2 gen official language 4,27 5,57 5,83 0,77 2,70 2,91
(3,02) (3,02) (3,02) (2,87) (2,86) (2,86)
Migrant 2 gen foreign language -24,26* -20,88* -20,63* -21,09* -15,89* -15,69*
(4,09) (4,24) (4,24) (3,86) (3,95) (3,95)
Migrant 2 gen missing language -53,08* -49,07* -48,66* -55,65* -48,58* -48,07* (5,32) (5,40) (5,40) (5,13) (5,18) (5,18)
Migrant 3 gen foreign language -11,76 -11,71 -11,28 -28,29* -27,93* -28,25*
(8,01) (7,99) (7,99) (7,60) (7,54) (7,54)
Nuclear family 23,83* 24,49* 24,67* 14,41* 14,91* 15,07*
(2,39) (2,38) (2,38) (2,24) (2,22) (2,22) ESCS 29,01* 27,55* 27,58* 30,16* 28,01* 27,93*
(1,05) (1,06) (1,06) (0,97) (0,99) (0,99)
ESCS missing -56,05* -52,48* -52,25* -85,50* -77,26* -76,57*
(9,70) (9,69) (9,68) (12,95) (12,85) (12,84)
Mixed parents 6,00 4,90 4,65 5,32 0,99 0,61 (2,55) (2,63) (2,63) (2,33) (2,39) (2,40)
Mixed parents missing -7,11 -7,15 -6,93 -6,86 -8,74 -8,68
(4,28) (4,28) (4,28) (4,16) (4,13) (4,13)
Regions of origin with Northern Europe as reference
South America -12,19 -10,21 -29,41* -22,92 (11,33) (11,34) (10,11) (10,38)
North America 48,89* 48,96* 9,70 13,43
(15,51) (15,5) (11,62) (11,7)
Caribbean -58,87* -56,18* -56,07* -48,35*
(15,72) (15,74) (16,76) (17,00) Western Europe 7,45 9,54 0,38 7,24
(7,49) (7,52) (6,80) (7,25)
Eastern Europe 10,68 9,44 -1,13 2,02
(6,90) (6,91) (6,33) (6,43)
Southern Europe -6,08 -4,32 -13,56 -6,93 (7,15) (7,18) (6,52) (6,96)
Northern Africa -0,11 2,48 -23,64* -15,91
(9,05) (9,09) (8,14) (8,62)
Sub-Saharan Africa -11,37 -9,79 -24,21* -18,86
(8,01) (8,02) (7,35) (7,61) Oceania -36,59* -36,01* -23,26* -21,38*
(9,16) (9,16) (8,31) (8,33)
West Asia -24,83* -21,56* -47,08* -38,25*
(6,29) (6,39) (5,70) (6,56)
South Asia -9,36 -5,97 -28,35* -19,90 (9,19) (9,26) (8,45) (9,00)
East Asia 31,37* 32,77* 22,19* 26,70*
(8,58) (8,58) (8,42) (8,57)
Southeast Asia 24,57 23,89 36,92* 39,61*
(12,99) (12,99) (11,49) (11,53) Native scores
Native reading score 0,88* 0,45*
(0,30) (0,17)
Adjusted R² 0,332 0,342 0,343 0,347 0,363 0,363
Source: PISA 2009 (own computation, weighted); * indicates significance at the 1% level. Model 1 includes social background, model 2
adds origin regions, and model 3 adds native scores. The country of destination is controlled for in all models (see Appendix A4 for parameters).
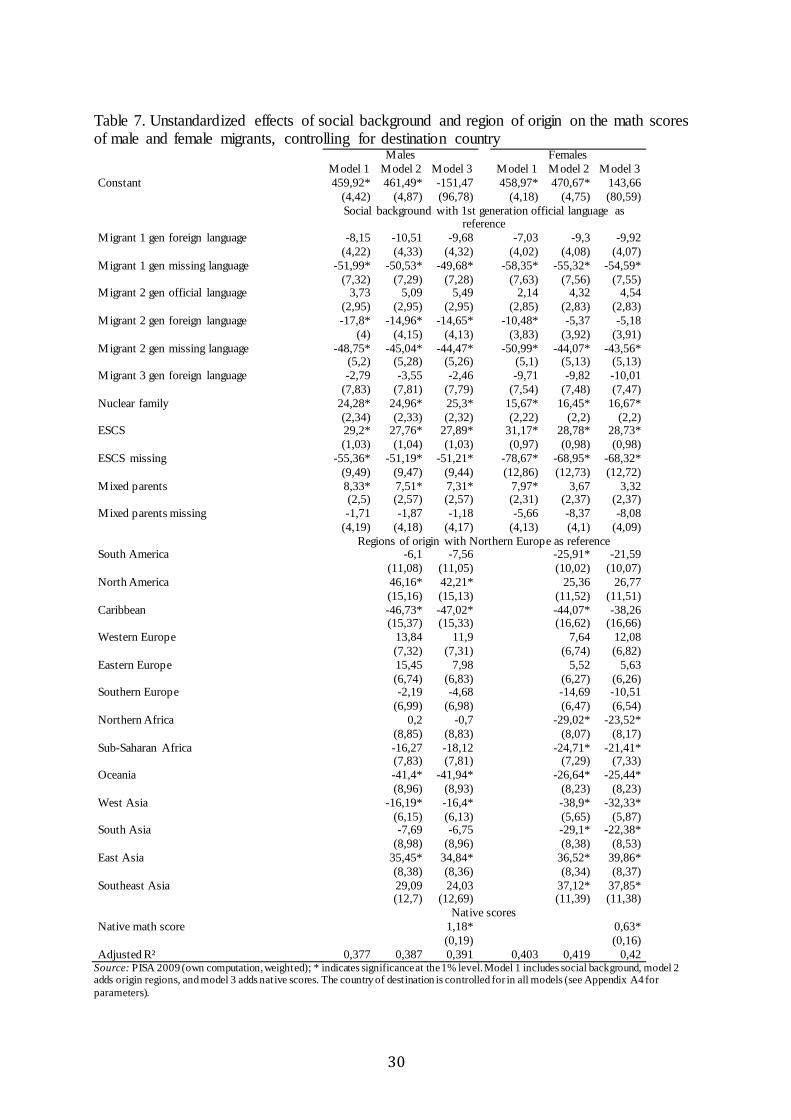
30
Table 7. Unstandardized effects of social background and region of origin on the math scores of male and female migrants, controlling for destination country Males Females
Model 1 Model 2 Model 3 Model 1 Model 2 Model 3
Constant 459,92* 461,49* -151,47 458,97* 470,67* 143,66
(4,42) (4,87) (96,78) (4,18) (4,75) (80,59)
Social background with 1st generation official language as
reference
Migrant 1 gen foreign language -8,15 -10,51 -9,68 -7,03 -9,3 -9,92
(4,22) (4,33) (4,32) (4,02) (4,08) (4,07)
Migrant 1 gen missing language -51,99* -50,53* -49,68* -58,35* -55,32* -54,59*
(7,32) (7,29) (7,28) (7,63) (7,56) (7,55) Migrant 2 gen official language 3,73 5,09 5,49 2,14 4,32 4,54
(2,95) (2,95) (2,95) (2,85) (2,83) (2,83)
Migrant 2 gen foreign language -17,8* -14,96* -14,65* -10,48* -5,37 -5,18
(4) (4,15) (4,13) (3,83) (3,92) (3,91)
Migrant 2 gen missing language -48,75* -45,04* -44,47* -50,99* -44,07* -43,56* (5,2) (5,28) (5,26) (5,1) (5,13) (5,13)
Migrant 3 gen foreign language -2,79 -3,55 -2,46 -9,71 -9,82 -10,01
(7,83) (7,81) (7,79) (7,54) (7,48) (7,47)
Nuclear family 24,28* 24,96* 25,3* 15,67* 16,45* 16,67*
(2,34) (2,33) (2,32) (2,22) (2,2) (2,2) ESCS 29,2* 27,76* 27,89* 31,17* 28,78* 28,73*
(1,03) (1,04) (1,03) (0,97) (0,98) (0,98)
ESCS missing -55,36* -51,19* -51,21* -78,67* -68,95* -68,32*
(9,49) (9,47) (9,44) (12,86) (12,73) (12,72)
Mixed parents 8,33* 7,51* 7,31* 7,97* 3,67 3,32 (2,5) (2,57) (2,57) (2,31) (2,37) (2,37)
Mixed parents missing -1,71 -1,87 -1,18 -5,66 -8,37 -8,08
(4,19) (4,18) (4,17) (4,13) (4,1) (4,09)
Regions of origin with Northern Europe as reference South America -6,1 -7,56 -25,91* -21,59
(11,08) (11,05) (10,02) (10,07)
North America 46,16* 42,21* 25,36 26,77
(15,16) (15,13) (11,52) (11,51)
Caribbean -46,73* -47,02* -44,07* -38,26 (15,37) (15,33) (16,62) (16,66)
Western Europe 13,84 11,9 7,64 12,08
(7,32) (7,31) (6,74) (6,82)
Eastern Europe 15,45 7,98 5,52 5,63
(6,74) (6,83) (6,27) (6,26) Southern Europe -2,19 -4,68 -14,69 -10,51
(6,99) (6,98) (6,47) (6,54)
Northern Africa 0,2 -0,7 -29,02* -23,52*
(8,85) (8,83) (8,07) (8,17)
Sub-Saharan Africa -16,27 -18,12 -24,71* -21,41* (7,83) (7,81) (7,29) (7,33)
Oceania -41,4* -41,94* -26,64* -25,44*
(8,96) (8,93) (8,23) (8,23)
West Asia -16,19* -16,4* -38,9* -32,33*
(6,15) (6,13) (5,65) (5,87) South Asia -7,69 -6,75 -29,1* -22,38*
(8,98) (8,96) (8,38) (8,53)
East Asia 35,45* 34,84* 36,52* 39,86*
(8,38) (8,36) (8,34) (8,37)
Southeast Asia 29,09 24,03 37,12* 37,85* (12,7) (12,69) (11,39) (11,38)
Native scores
Native math score 1,18* 0,63*
(0,19) (0,16)
Adjusted R² 0,377 0,387 0,391 0,403 0,419 0,42 Source: PISA 2009 (own computation, weighted); * indicates significance at the 1% level. Model 1 includes social background, model 2 adds origin regions, and model 3 adds native scores. The country of destination is controlled for in all models (see Appendix A4 for
parameters).
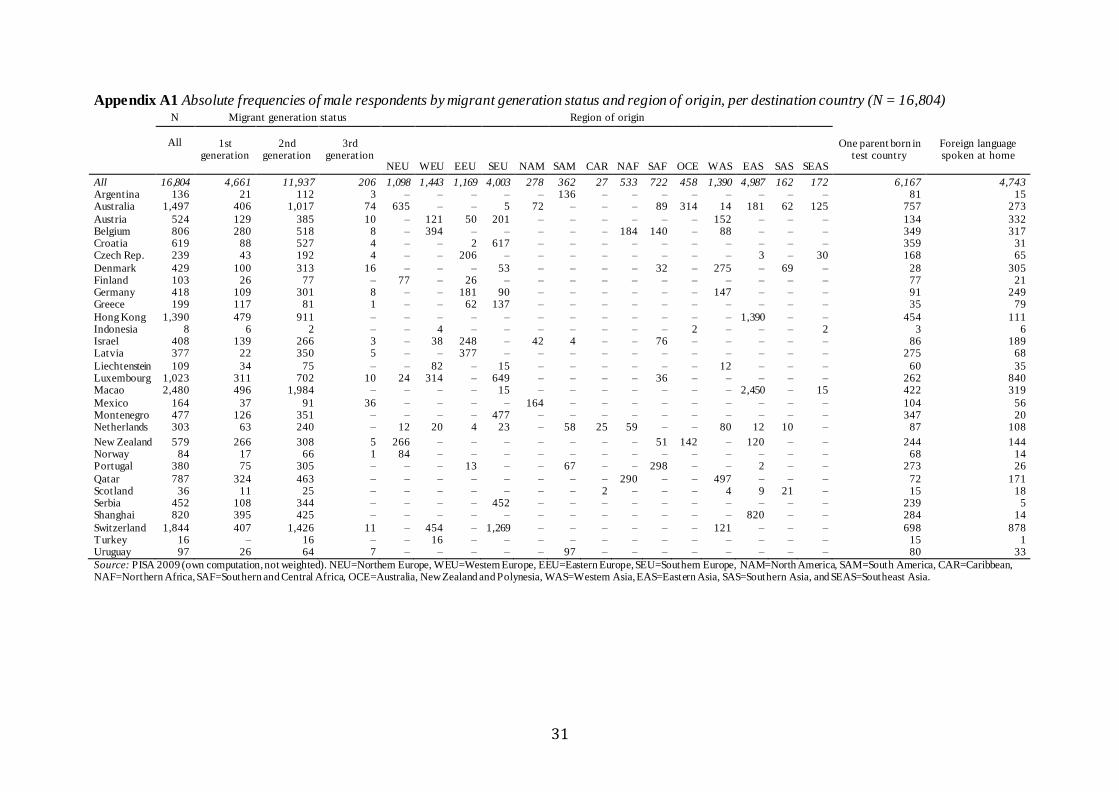
31
Appendix A1 Absolute frequencies of male respondents by migrant generation status and region of origin, per destination country (N = 16,804)
N Migrant generation status Region of origin
All
1st generation
2nd generation
3rd generation
NEU WEU EEU SEU NAM SAM CAR NAF SAF OCE WAS EAS SAS SEAS
One parent born in test country
Foreign language spoken at home
All 16,804 4,661 11,937 206 1,098 1,443 1,169 4,003 278 362 27 533 722 458 1,390 4,987 162 172 6,167 4,743 Argentina 136 21 112 3 – – – – – 136 – – – – – – – – 81 15 Australia 1,497 406 1,017 74 635 – – 5 72 – – – 89 314 14 181 62 125 757 273
Austria 524 129 385 10 – 121 50 201 – – – – – – 152 – – – 134 332 Belgium 806 280 518 8 – 394 – – – – – 184 140 – 88 – – – 349 317 Croatia 619 88 527 4 – – 2 617 – – – – – – – – – – 359 31 Czech Rep. 239 43 192 4 – – 206 – – – – – – – – 3 – 30 168 65
Denmark 429 100 313 16 – – – 53 – – – – 32 – 275 – 69 – 28 305 Finland 103 26 77 – 77 – 26 – – – – – – – – – – – 77 21 Germany 418 109 301 8 – – 181 90 – – – – – – 147 – – – 91 249 Greece 199 117 81 1 – – 62 137 – – – – – – – – – – 35 79
Hong Kong 1,390 479 911 – – – – – – – – – – – – 1,390 – – 454 111 Indonesia 8 6 2 – – 4 – – – – – – – 2 – – – 2 3 6 Israel 408 139 266 3 – 38 248 – 42 4 – – 76 – – – – – 86 189 Latvia 377 22 350 5 – – 377 – – – – – – – – – – – 275 68
Liechtenstein 109 34 75 – – 82 – 15 – – – – – – 12 – – – 60 35 Luxembourg 1,023 311 702 10 24 314 – 649 – – – – 36 – – – – – 262 840 Macao 2,480 496 1,984 – – – – 15 – – – – – – – 2,450 – 15 422 319
Mexico 164 37 91 36 – – – – 164 – – – – – – – – – 104 56 Montenegro 477 126 351 – – – – 477 – – – – – – – – – – 347 20 Netherlands 303 63 240 – 12 20 4 23 – 58 25 59 – – 80 12 10 – 87 108
New Zealand 579 266 308 5 266 – – – – – – – 51 142 – 120 – – 244 144 Norway 84 17 66 1 84 – – – – – – – – – – – – – 68 14 Portugal 380 75 305 – – – 13 – – 67 – – 298 – – 2 – – 273 26
Qatar 787 324 463 – – – – – – – – 290 – – 497 – – – 72 171 Scotland 36 11 25 – – – – – – – 2 – – – 4 9 21 – 15 18 Serbia 452 108 344 – – – – 452 – – – – – – – – – – 239 5 Shanghai 820 395 425 – – – – – – – – – – – – 820 – – 284 14
Switzerland 1,844 407 1,426 11 – 454 – 1,269 – – – – – – 121 – – – 698 878 Turkey 16 – 16 – – 16 – – – – – – – – – – – – 15 1 Uruguay 97 26 64 7 – – – – – 97 – – – – – – – – 80 33
Source: PISA 2009 (own computation, not weighted). NEU=Northern Europe, WEU=Western Europe, EEU=Eastern Europe, SEU=Southern Europe, NAM=North America, SAM=South America, CAR=Caribbean, NAF=Northern Africa, SAF=Southern and Central Africa, OCE=Australia, New Zealand and Polynesia, WAS=Western Asia, EAS=Eastern Asia, SAS=Southern Asia, and SEAS=Southeast Asia.

32
Appendix A2 Absolute frequencies of female respondents by migrant generation status and region of origin, per destination country (N=16,612) N Migrant generation status Region of origin
All
1st generation
2nd
generation
3rd generation
NEU WEU EEU SEU NAM SAM CAR NAF SAF OCE WAS EAS SAS SEAS
One parent born in test country
Foreign language spoken at home
All 16,612 4,489 11,921 202 1,103 1,382 1,188 3,815 308 388 14 581 798 495 1,438 4,727 172 203 6,072 4,631
Argentina 174 27 147 – – – – – – 174 – – – – – – – – 96 19 Australia 1665 457 1122 86 718 – – 11 77 – – – 94 360 21 169 64 151 814 281 Austria 513 107 400 6 – 120 42 196 – – – – – – 155 – – – 144 315 Belgium 709 227 478 4 – 326 – – – – – 158 130 – 95 – – – 308 266
Croatia 492 58 430 4 – – 3 489 – – – – – – – – – – 290 21 Czech Rep. 198 27 169 2 – – 169 – – – – – – – – 1 – 28 139 54 Denmark 527 105 407 15 – – – 64 – – – – 24 – 356 – 83 – 36 316 Finland 107 27 80 – 79 – 28 – – – – – – – – – – – 78 27
Germany 406 117 283 6 – – 200 82 – – – – – – 124 – – – 94 209 Greece 195 116 79 0 – – 70 125 – – – – – – – – – – 32 52 Hong Kong 1,275 447 828 – – – – – – – – – – – – 1,275 – – 385 107 Indonesia 4 2 2 – – 2 – – – – – – – – – – – 2 4 0
Israel 504 189 313 2 – 50 276 – 85 4 – – 89 – – – – – 107 227 Latvia 381 16 357 8 – – 381 – – – – – – – – – – – 280 86 Liechtenstein 101 37 63 1 – 70 – 25 – – – – – – 6 – – – 55 30
Luxembourg 1,058 303 745 10 26 308 – 678 – – – – 46 – – – – – 267 875 Macao 2,434 516 1,918 – – – – 16 – – – – – – – 2,396 – 22 409 318 Mexico 146 24 86 36 – – – – 146 – – – – – – – – – 91 57 Montenegro 473 128 345 – – – – 473 – – – – – – – – – – 342 15
Netherlands 321 41 280 – 6 36 3 18 – 63 12 77 – – 98 6 2 – 93 117 New Zealand 482 221 259 2 213 – – – – – – – 46 135 – 88 – – 205 98 Norway 61 8 53 – 61 – – – – – – – – – – – – – 52 9 Portugal 458 91 367 – – – 16 – – 71 – – 369 – – 2 – – 304 29
Qatar 826 336 490 – – – – – – – – 346 – – 480 – – – 106 267 Scotland 35 8 27 – – – – – – – 2 – – – 3 7 23 – 17 9 Serbia 480 94 386 – – – – 480 – – – – – – – – – – 256 13 Shanghai 783 355 428 – – – – – – – – – – – – 783 – – 305 16
Switzerland 1,709 390 1,309 10 – 451 – 1,158 – – – – – – 100 – – – 683 774 Turkey 19 3 16 – – 19 – – – – – – – – – – – – 18 1 Uruguay 76 12 54 10 – – – – – 76 – – – – – – – – 62 23
Source: PISA 2009 (own computation, not weighted). NEU=Northern Europe, WEU=Western Europe, EEU=Eastern Europe, SEU=Southern Europe, NAM=North America, SAM=South America, CAR=Caribbean, NAF=Northern Africa, SAF=Southern and Central Africa, OCE=Australia, New Zealand and Polynesia, WAS=Western Asia, EAS=Eastern Asia, SAS=Southern Asia, and SEAS=Southeast Asia.
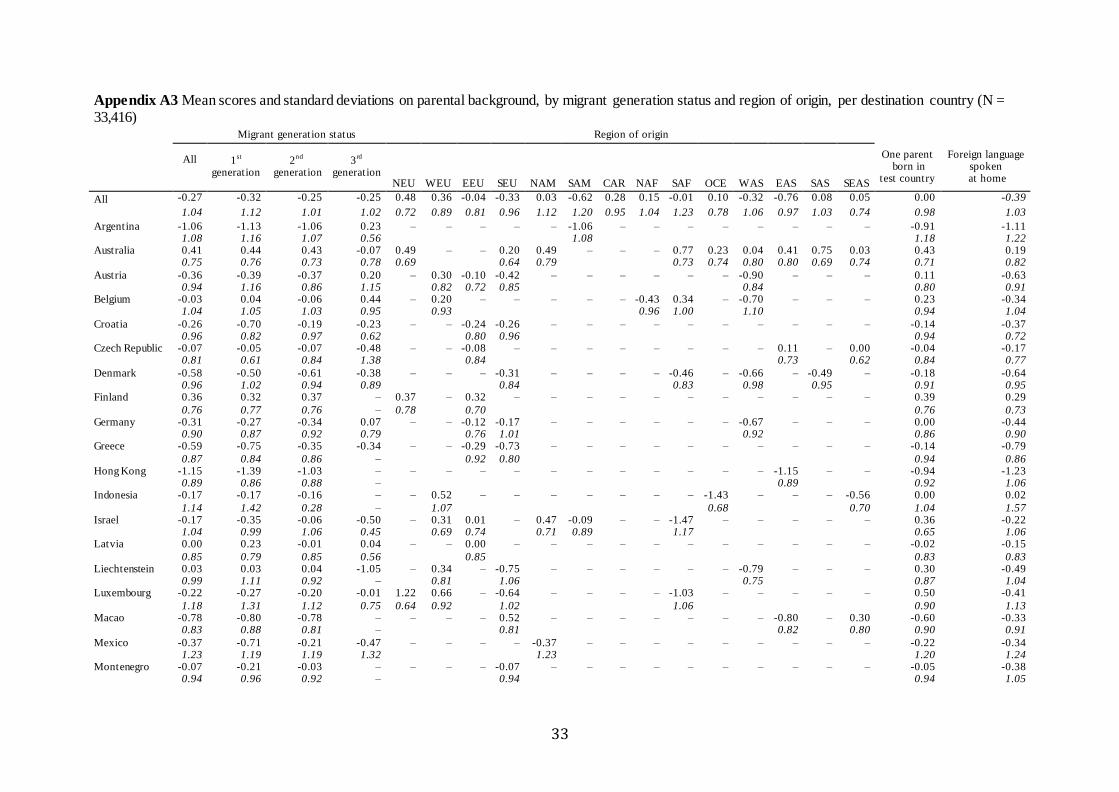
33
Appendix A3 Mean scores and standard deviations on parental background, by migrant generation status and region of origin, per destination country (N = 33,416)
Migrant generation status Region of origin
All
1st
generation 2
nd
generation 3
rd
generation NEU WEU EEU SEU NAM SAM CAR NAF SAF OCE WAS EAS SAS SEAS
One parent born in
test country
Foreign language spoken
at home
All -0.27 -0.32 -0.25 -0.25 0.48 0.36 -0.04 -0.33 0.03 -0.62 0.28 0.15 -0.01 0.10 -0.32 -0.76 0.08 0.05 0.00 -0.39
1.04 1.12 1.01 1.02 0.72 0.89 0.81 0.96 1.12 1.20 0.95 1.04 1.23 0.78 1.06 0.97 1.03 0.74 0.98 1.03
Argentina -1.06 -1.13 -1.06 0.23 – – – – – -1.06 – – – – – – – – -0.91 -1.11 1.08 1.16 1.07 0.56 1.08 1.18 1.22 Australia 0.41 0.44 0.43 -0.07 0.49 – – 0.20 0.49 – – – 0.77 0.23 0.04 0.41 0.75 0.03 0.43 0.19 0.75 0.76 0.73 0.78 0.69 0.64 0.79 0.73 0.74 0.80 0.80 0.69 0.74 0.71 0.82
Austria -0.36 -0.39 -0.37 0.20 – 0.30 -0.10 -0.42 – – – – – – -0.90 – – – 0.11 -0.63 0.94 1.16 0.86 1.15 0.82 0.72 0.85 0.84 0.80 0.91 Belgium -0.03 0.04 -0.06 0.44 – 0.20 – – – – – -0.43 0.34 – -0.70 – – – 0.23 -0.34 1.04 1.05 1.03 0.95 0.93 0.96 1.00 1.10 0.94 1.04
Croatia -0.26 -0.70 -0.19 -0.23 – – -0.24 -0.26 – – – – – – – – – – -0.14 -0.37 0.96 0.82 0.97 0.62 0.80 0.96 0.94 0.72 Czech Republic -0.07 -0.05 -0.07 -0.48 – – -0.08 – – – – – – – – 0.11 – 0.00 -0.04 -0.17 0.81 0.61 0.84 1.38 0.84 0.73 0.62 0.84 0.77
Denmark -0.58 -0.50 -0.61 -0.38 – – – -0.31 – – – – -0.46 – -0.66 – -0.49 – -0.18 -0.64 0.96 1.02 0.94 0.89 0.84 0.83 0.98 0.95 0.91 0.95 Finland 0.36 0.32 0.37 – 0.37 – 0.32 – – – – – – – – – – – 0.39 0.29
0.76 0.77 0.76 – 0.78 0.70 0.76 0.73 Germany -0.31 -0.27 -0.34 0.07 – – -0.12 -0.17 – – – – – – -0.67 – – – 0.00 -0.44 0.90 0.87 0.92 0.79 0.76 1.01 0.92 0.86 0.90 Greece -0.59 -0.75 -0.35 -0.34 – – -0.29 -0.73 – – – – – – – – – – -0.14 -0.79
0.87 0.84 0.86 – 0.92 0.80 0.94 0.86 Hong Kong -1.15 -1.39 -1.03 – – – – – – – – – – – – -1.15 – – -0.94 -1.23 0.89 0.86 0.88 – 0.89 0.92 1.06 Indonesia -0.17 -0.17 -0.16 – – 0.52 – – – – – – – -1.43 – – – -0.56 0.00 0.02
1.14 1.42 0.28 – 1.07 0.68 0.70 1.04 1.57 Israel -0.17 -0.35 -0.06 -0.50 – 0.31 0.01 – 0.47 -0.09 – – -1.47 – – – – – 0.36 -0.22 1.04 0.99 1.06 0.45 0.69 0.74 0.71 0.89 1.17 0.65 1.06 Latvia 0.00 0.23 -0.01 0.04 – – 0.00 – – – – – – – – – – – -0.02 -0.15
0.85 0.79 0.85 0.56 0.85 0.83 0.83 Liechtenstein 0.03 0.03 0.04 -1.05 – 0.34 – -0.75 – – – – – – -0.79 – – – 0.30 -0.49 0.99 1.11 0.92 – 0.81 1.06 0.75 0.87 1.04 Luxembourg -0.22 -0.27 -0.20 -0.01 1.22 0.66 – -0.64 – – – – -1.03 – – – – – 0.50 -0.41
1.18 1.31 1.12 0.75 0.64 0.92 1.02 1.06 0.90 1.13 Macao -0.78 -0.80 -0.78 – – – – 0.52 – – – – – – – -0.80 – 0.30 -0.60 -0.33 0.83 0.88 0.81 – 0.81 0.82 0.80 0.90 0.91
Mexico -0.37 -0.71 -0.21 -0.47 – – – – -0.37 – – – – – – – – – -0.22 -0.34 1.23 1.19 1.19 1.32 1.23 1.20 1.24 Montenegro -0.07 -0.21 -0.03 – – – – -0.07 – – – – – – – – – – -0.05 -0.38 0.94 0.96 0.92 – 0.94 0.94 1.05

34
Netherlands -0.26 -0.45 -0.22 – -0.01 0.57 0.49 -0.02 – 0.15 0.23 -0.74 – – -0.60 -0.60 -0.26 – 0.32 -0.62
1.06 1.23 1.02 – 0.84 0.74 1.23 0.89 0.83 0.98 1.06 1.03 1.05 1.05 0.89 1.09
New Zealand 0.22 0.31 0.14 -0.01 0.42 – – – – – – – 0.38 -0.19 – 0.23 – – 0.21 0.03
0.77 0.75 0.78 0.81 0.71 0.67 0.78 0.72 0.74 0.81
Norway 0.52 0.14 0.59 1.46 0.52 – – – – – – – – – – – – – 0.56 0.20
0.85 1.06 0.79 – 0.85 0.78 1.12 Portugal 0.06 -0.45 0.18 – – – -0.12 – – -0.08 – – 0.09 – – 0.19 – – 0.24 -0.53 1.16 0.96 1.17 – 0.85 1.10 1.18 1.42 1.13 1.10 Qatar 0.49 0.62 0.40 – – – – – – – – 0.65 – – 0.38 – – – 0.29 0.69
0.82 0.70 0.88 – 0.74 0.85 1.04 0.82 Scotland 0.23 0.31 0.20 – – – – – – – 0.81 – – – 0.91 -0.17 0.22 – 0.39 0.03 0.87 0.74 0.92 – 0.49 0.48 0.78 0.89 0.84 0.81 Serbia 0.12 -0.19 0.20 – – – – 0.12 – – – – – – – – – – 0.27 -0.20
0.94 0.85 0.95 – 0.94 0.96 0.70 Shanghai -0.40 -0.37 -0.43 – – – – – – – – – – – – -0.40 – – -0.49 -1.35 1.13 1.25 1.01 – 1.13 1.02 1.47
Switzerland -0.27 -0.55 -0.19 -0.49 – 0.30 – -0.45 – – – – – – -0.74 – – – 0.12 -0.62 0.92 1.01 0.88 0.76 0.83 0.86 0.89 0.77 0.86 Turkey -0.40 -0.70 -0.38 – – -0.40 – – – – – – – – – – – – -0.40 -2.14 1.11 1.58 1.09 – 1.11 1.03 0.45
Uruguay -0.82 -0.60 -0.70 -2.11 – – – – – -0.82 – – – – – – – – -0.76 -1.53 1.28 1.33 1.22 0.73 1.28 1.22 1.19
Source: PISA 2009 (own computation; not weighted). NEU=Northern Europe, WEU=Western Europe, EEU=Eastern Europe, SEU=Southern Europe, NAM=North America, SAM=South America, CAR=Caribbean, NAF=Northern Africa, SAF=Southern and Central Africa, OCE=Australia, New Zealand and Polynesia, WAS=Western Asia, EAS=Eastern Asia, SAS=Southern Asia, and SEAS=Southeast Asia.

35
Appendix A4 Unstandardized effects of destination country on the reading and math scores of male and female migrants in models 1–3 of Tables
8 and 9 Reading Math
Males Females Males Females
Model 1 Model 2 Model 3 Model 1 Model 2 Model 3 Model 1 Model 2 Model 3 Model 1 Model 2 Model 3 Argentina -57.1* -51.2* 38.2 -69.6* -56.7* -7.6 -67.9* -66.0* 72.9 -65.7* -54.2* 23.00 (6.6) (12.5) (33.4) (5.5) (10.8) (21.1) (6.5) (12.2) (25.1) (5.5) (10.7) (21.8)
Australia 43.3* 40.0* 43.0* 32.4* 21.5* 27.4* 36.5* 35.8* 44.5* 34.3* 24.6* 32.7* (6.3) (6.9) (6.9) (5.5) (6.1) (6.5) (6.1) (6.7) (6.8) (5.5) (6.0) (6.4) Austria -11.9 -11.5 12.6 -16.6 -15.0 -6.1 11.5 8.3 8.4 4.8 4.6 8.7
(6.2) (7.4) (11.1) (5.7) (6.6) (7.4) (6.1) (7.2) (7.2) (5.7) (6.5) (6.6) Belgium 23.3* 19.2 1.0 5.6* 6.1 1.7 22.6* 17.4 -14.3 5.4 5.3 -5.2 (6.0) (7.6) (10.0) (5.8) (7.0) (7.1) (5.9) (7.5) (9.0) (5.7) (6.9) (7.4) Croatia -3.8 -2.9 28.9 1.5 0.3 9.8 -15.5 -16.5 48.7 -21.0* -18.9 13.8
(6.0) (8.3) (13.8) (5.9) (7.7) (8.5) (5.8) (8.1) (13.1) (5.9) (7.7) (11.1) Czech Republic 14.6 -3.0 14.6 11.7 -6.9 -1.7 24.9 4.6 16.4 17.9* -4.0 -2.5 (5.9) (8.0) (10.1) (5.8) (7.5) (7.7) (5.8) (7.8) (8.0) (5.8) (7.4) (7.4) Germany 4.9 4.2 4.4 6.5 7.2 7.1 14.8 10.5 -2.9 13.3 11.0 6.7
(6.2) (7.2) (7.2) (5.7) (6.4) (6.4) (6.0) (7.0) (7.3) (5.6) (6.4) (6.5) Greece -7.9 -12.2 5.9 -7.1 -14.0 -6.3 -27.8 -34.1 12.6 -24.5* -30.6* -0.8 (6.3) (7.8) (10.0) (5.8) (7.0) (7.5) (6.1) (7.6) (10.6) (5.7) (6.9) (10.1) Hong Kong 96.7* 58.8* 32.1 86.0* 46.5* 35.5 108.2* 68.4* 10.6 105.5* 53.9* 24.2
(6.3) (10.1) (13.7) (5.9) (9.8) (10.6) (6.1) (9.9) (13.4) (5.9) (9.7) (12.2) Israel 47.1* 31.8* 62.8* 28.2* 15.8* 32.0* 13.0* -2.5* 78.2* -0.6 -17.4 27.9 (6.5) (7.9) (13.4) (5.4) (6.8) (9.3) (6.3) (7.7) (14.9) (5.4) (6.8) (13.0)
Latvia 11.9 -3.7 20.4 14.8 1.8 12.8 5.0 -13.3 26.1 9.4 -7.8 10.7 (6.2) (8.3) (11.7) (5.6) (7.4) (8.5) (6.0) (8.1) (10.2) (5.6) (7.4) (8.7) Liechtenstein 36.3* 29.4* 26.3* 26.3* 18.0* 23.3* 75.7* 64.7* 38.1* 58.2* 47.3* 41.2* (6.0) (8.1) (8.2) (5.7) (7.3) (7.6) (5.9) (7.9) (8.9) (5.7) (7.3) (7.4)
Luxembourg 3.3 -1.0 1.0 5.3 -2.8 0.3 16.0 10.0 -5.7 11.9 5.0 6.7 (6.3) (8.0) (8.0) (5.7) (7.1) (7.2) (6.2) (7.8) (8.2) (5.7) (7.1) (7.1) Macao 43.2* 5.6 29.4 31.6* -8.2 6.8 76.1* 36.5 24.3 73.0* 21.4 17.8 (6.3) (10.0) (13.0) (5.8) (9.6) (11.1) (6.2) (9.8) (10.0) (5.7) (9.6) (9.6)
Mexico -37.6* -91.4* -31.7 -35.1* -59.0* -18.7 -55.5* -104.3* -2.9 -32.1* -69.1* -9.1 (6.3) (16.4) (26.4) (6.0) (12.6) (19.5) (6.1) (16.0) (22.6) (6.0) (12.5) (19.3) Montenegro -60.6* -59.1* 40.9 -52.6* -52.5* -8.0 -62.3* -62.7* 74.2 -63.4* -59.8* 15.3 (6.2) (8.5) (35.7) (5.7) (7.6) (18.2) (6.0) (8.3) (23.1) (5.6) (7.5) (20.0)
Netherlands 36.5* 43.5* 24.4 20.1* 31.7* 26.0 35.0* 38.8* 2.1 31.8* 42.4* 25.9* (6.2) (7.4) (10.0) (5.6) (6.6) (6.8) (6.1) (7.3) (9.3) (5.5) (6.6) (7.7) New Zealand 63.2* 62.6* 53.6* 52.3* 43.7* 40.5* 54.5* 56.8* 48.4* 47.5* 39.9* 38.6* (6.0) (6.7) (7.4) (5.9) (6.6) (6.7) (5.8) (6.5) (6.7) (5.8) (6.5) (6.5)
Portugal 19.0* 25.2* 43.1* 11.5* 22.1* 32.2* 11.0* 21.7* 53.6* 8.0 20.6* 39.5* (6.4) (9.1) (11.0) (5.5) (8.0) (8.8) (6.3) (8.9) (10.2) (5.42) (7.9) (9.2) Qatar -91.6* -80.0* 74.7 -88.9* -66.4* 5.4 -112.8* -104.6* 110.4 -106.2* -83.4* 18.7
(6.3) (7.9) (54.3) (5.7) (7.0) (27.3) (6.2) (7.7) (34.8) (5.6) (6.9) (26.1) Scotland 81.9* 80.8* 79.8* 36.2* 43.6* 49.5* 61.1* 58.6* 70.7* 38.9* 45.0* 54.7* (6.3) (8.5) (8.5) (5.7) (8.1) (8.4) (6.0) (8.3) (8.5) (5.6) (8.0) (8.4)

36
Serbia -19.2* -17.7 43.8 -29.1* -29.4 1.2 -21.1* -21.5 67.4 -29.3* -26.2* 21.1
(6.3) (8.5) (22.9) (5.6) (7.5) (13.6) (6.1) (8.3) (16.3) (5.6) (7.4) (13.8) Shanghai 94.4* 57.8* 17.1 88.8* 51.6* 32.4 130.3* 91.7* -5.7 143.9* 94.7* 39.1 (6.3) (10.2) (17.4) (5.8) (9.8) (12.1) (6.1) (9.9) (18.3) (5.7) (9.7) (16.8)
Switzerland 20.1* 18.3 17.2 11.3* 7.0 5.9 42.9* 38.5 -5.3 32.0* 28.5* 9.4 (6.1) (7.9) (7.9) (5.7) (7.2) (7.2) (5.9) (7.7) (10.3) (5.7) (7.1) (8.5) Uruguay -39.3* -32.5* 43.1 -24.5* -10.5* 27.8 -42.2* -39.4* 63.7 -25.5* -12.7 44.1
(6.0) (12.2) (28.9) (6.1) (11.2) (18.0) (5.9) (12.0) (20.2) (6.1) (11.1) (17.8)
Source: PISA 2009 (own computation, weighted); * indicates significance at the 1 level. Denmark, Finland, and Norway comprise the reference category.