teaching and learning conditions in schools with a high proportion of students from single- parent...
TRANSCRIPT
1
Teaching and learning conditions in schools with a high proportion of students from single-
parent families as explanation of the negative effect of single-parent family composition of
schools.
Jaap Dronkers,1 Gert-Jan M. Veerman & Suet-Ling Pong
Maastricht University, University of Amsterdam & Pennsylvania State University
Paper presented at the Twelfth Meeting of the European Network for Sociological and
demographic Study of Divorce, October 2-4 in Paris, France.
Introduction
Prior research on the consequences of divorce for children’s educational performance is mainly
restricted to the family context. In this paper, however, we focus on the school context. More
specifically, we study how the single-parent family composition of schools affects the
educational performance of children from single-parent and two-parent families. A similar
approach was applied by Pong (1997, 1998), indeed finding a negative contextual effect of
schools with high numbers of students from disrupted families in the USA. De Lange, Dronkers
& Wolbers (2014) found that the share of single-parent families at school effects on children’s’
educational performance within 25 OECD countries, including the USA.
In the literature, two explanations can be distinguished for the effect of school’s single-parent
family composition on children’s educational performance: i.e. the decline of the community
network of the school and the lower amount of teaching and learning time at school and at home.
According to Pong (1997) and Sun (1999) parental influence on children extends beyond their
own child and reaches the communities in which they live and the schools belonging to these
communities. As previous research has shown, the type of student attending the school appears to
be one of the most important factors influencing the effectiveness of the school (Pong 1997; Pong
1998). Schools with a large concentration of children from single-parent families are usually
characterized by a lower socioeconomic status and by less social capital (i.e. indicated by
parents’ social relations and networks with other parents). Therefore, all children attending such
schools will perform less well, compared to children at schools with a smaller concentration of
single-parent families.
In addition to this community network explanation for the negative contextual effect of family
disruption on children’s educational performance, Dronkers (2010) emphasizes the more difficult
teaching and learning conditions in schools with a high proportion of students from single-parent
families. The effectiveness of education depends on the amount of time that is available for both
teaching and learning, which can be greatly diminished in schools where children have problems
inside or outside the home that interrupt the teaching and learning process. As previously
described, children of divorced parents have on average more emotional and other problems
related to their parents’ divorce. If there are more students in a class with such problems, more
learning and teaching time of the whole class might be used for non-academic goals. Garriga
(2010) found that children of single-parent families are more often too late at school. A higher
percentage of pupils from single-parent families in a school might thus lead to more pupils
arriving too late at school and thus disturbing teaching and learning of the whole class. As a
consequence insufficient learning and teaching time needed to reach a certain educational
performance by all pupils might remain. Conversely, in student populations with none or few
1 Corresponding author: [email protected]

2
children from single-parent families, there might be less loss of teaching and learning time and
thus a higher chance on sufficient time. In fact, the real learning and teaching time might differ in
these two situations, despite identical class schedules, and thus educational performance will
differ between both situations.
The two research questions that we address are the following: 1) Does the school’s
composition of students from single-parent families affects the conditions of teaching and
learning (measured as classroom disruption) in these schools? 2) Do these conditions of teaching
and learning mediate the negative effect of the school’s composition of students from single-
parent families on students’ educational performance?
If we can answer both research questions positively, the teaching and learning conditions is an
additional or the best explanation of the negative effect of the school’s composition of students
from single-parent families on students’ educational performance. If we cannot answer both
research questions positively, the community network explanation is a better explanation of the
negative effect of the school’s composition of students from single-parent families on students’
educational performance.
Data and variables
Data
The analyses have been carried out using the cross-national Program for International Student
Assessment 2009 (PISA). The cross-national PISA contains both social economic background
and lesson behavior information of 15-year-old students from OECD and other developed
countries (OECD, 2012). We focus on the Western countries. Thus, our dataset contains
information on 232701 students in 28 countries (Australia, Austria, Belgium, Canada,
Switzerland, Czech Republic, Germany, Denmark, Spain, Estonia, Finland, France, United
Kingdom, Greece, Hungary, Ireland, Iceland, Italy, Luxembourg, Netherlands, Norway, New
Zealand, Poland, Portugal, Slovak Republic, Slovenia, Sweden, and United States). We omit 1.8
percent of our students due to student with no information about their home situation.
Furthermore, we omit 13.5 percent of these students due to missing data on other independent
variables or because these students are in schools with less than 8 students per school. Surveyed
pupils reported with whom they regularly live at home, and they were offered six possible
persons (mother, father, brother, sister, grandparents, others) whom they could all tick. We only
analyzed students who lived in a two-parent family or a single-mother family. We deleted all
pupils living in other possible family forms, like single-father and grandparents-family. These
possible family forms are rare in a number of involved countries, which might bias our analysis
due to selectivity bias. Finally we also deleted all migrant pupils, both first and second
generation, because single-parent might have a different meaning for migrants (Dronkers &
Kalmijn, 2013). Consequently we use the data of 183982 students in 8001 schools in 28 OECD
countries.
Variables
Dependent Variables
The first dependent variable in this study is classroom disruption as perceived by the individual
student. Classroom disruption is measured by the categorical question whether there is noise and
disorder in the lessons. PISA 2009 contains five possible questions that could measure the
classroom disruption with the following topics: ‘students don’t listen’, ‘wait for quiet’, ‘cannot
work well’, ‘long time to start’, and ‘noise and disorder’. The questionnaire for students contains

3
four possible answers: ‘never or hardly ever’, ‘some lessons’, ‘most lessons’, or ‘all lessons’.
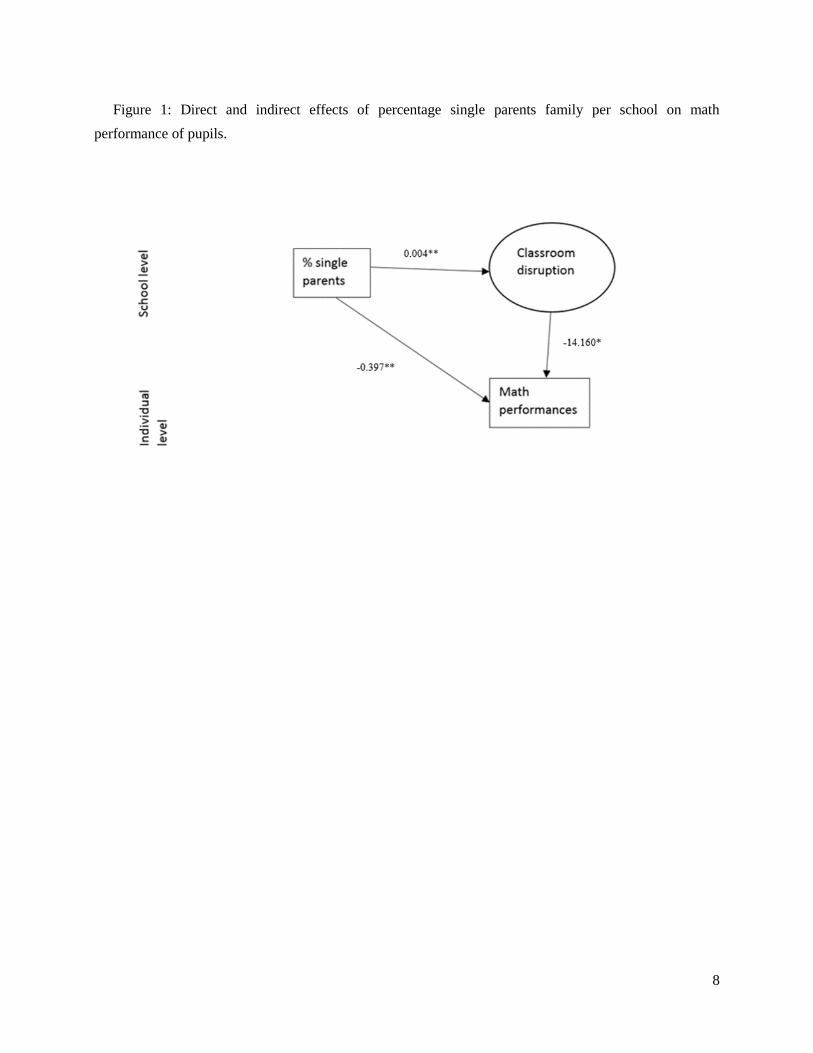
Categorical Principal Components Analysis (CATPCA) in both in cross-national data and
country data show factor loadings above 0.72 for all questions except for ‘wait for quiet’. The
factor loading of ‘wait for quiet’ is in most countries near 0.7 but in Greece even 0.4. (see
appendix 1). Consequently, we created for our cross-national analysis a latent variable for
classroom disruption that contains all possible questions from PISA except ‘wait for quiet’ for
each student.
We also computed the mean classroom disruption using the disruption score of all
students in the school as a second dependent variable. Although the answers of the students refer
to the experience of the students and the interpretation of the question, we will refer in this paper
to individual disruption and class disruption to make the text more readable.
The third dependent variable math performance is a score on the math test developed by
PISA. To measure school skills accurately would make the test too long to be feasible. Hence,
PISA created a large number of very similar but shorter tests. Because such different tests can
never offer exactly the same degree of difficulty, Item Response Modeling (IRM) was used to
achieve comparable results between students who took different tests. We computed our
regressions for every plausible value and averaged the parameter estimates in order to take into
account the variance between these five plausible values. The skills scores were standardized for
the Organization for Economic Co-operation and Development (OECD) countries using an
average of 500 and a standard deviation of 100.
Table 1 gives the descriptive statistics of the variables we use in our analyses.
Individual level
Family forms. A disadvantage of PISA is that it lacks information about the cause of single
parenthood or guardianship of one the parents. Although we assume that in most OECD countries
divorce or separation is the most common reason for single parenthood of parents of 15-year old
students, there might be other reasons for growing up in a single-parent family (with or without a
guardian), i.e., birth out of wedlock without a following marriage or cohabitation, and death of
one of the parents. However, parents of 15-year old students are generally still too young to die,
and the number of people who (intentionally or unintentionally) become a single parent already
prior to childbirth will be rather low.
An important advantage of the measurement of family form in PISA is that students were
asked with whom they regularly live at home, and they were offered a number of possible
persons, whom they could all tick. This way, the real family form in the eye of the students is
measured instead of the formal situation, as reported by interested parents or authorities. Parents
who separated after cohabitation (instead of marriage) before the child reaches the age of 15 are
measured in the same way as formally divorced parents. Since separation after cohabitation has
more or less the same effect on children as compared to divorce after marriage (Dronkers &
Härkönen 2008; Härkönen & Dronkers 2006), the PISA data provide a more accurate picture in
countries where cohabitation with children is common. Married parents, who stopped living
together before the 15-year old student participates in the PISA survey, are also treated in the
same way as formally divorced parents. This feature is especially relevant for catholic countries
like Italy, Ireland, Portugal and Spain, where a formal divorce is still difficult to obtain. A
disadvantage is that some children may live without a parent temporarily (e.g. fishermen, fathers
working in the origin country). We believe, however, that this risk is small, as some students still
2 Only Greece shows a factor loading of 0.6 for ‘long time to start’.
4
will indicate that they live with both parents usually. We created a dummy variable indicating a
single-mother family.
Parental ESCS. The ESCS index of the parents is a composite index created within the
PISA dataset of the parents’ occupational status, measured with the International Socio-economic
Index of Occupational Status (ISEI) scale (Ganzeboom et al, 1992), the educational level of the
parents, measured with the ISCED (International Standard Classification of Education)
classification (UNESCO, 2006), and the presence of any material or cultural resources at the
students’ homes.
Female. We computed a dichotomous variable to classify gender. Boys are the reference
group.
Higher track refers to the track levels 2A and 3A of the International Standard
Classification of Education (ISCED). The 2A and 3A programmes ultimately lead to tertiary
education (OECD, 1999). This control variable takes into account the possible early selection of
children of single parents into a lower educational level, as a consequence of lower earlier
performance. The result of controlling for educational level might be that the relationship
between family form and school’s percentage of singleparent families is underestimated.
However, we prefer this risk of underestimation above a
too easy confirmation of our hypotheses. We include the dummy “track missing”, representing
1.1 percent of the students. Other tracks are the reference category.
School level
All these school characteristics are computed with all deleted pupils included.
The percentage pupils from single-parent families per school (either father or mother).
The mean ESCS per school was calculated using the ESCS score of all students in the
school.
Percentage of females. We computed the percentage of females using the number of
female students in the schools.
Percentage of immigrants was calculated using the number of immigrant students in
schools.
Results
All analyses are multi-level analysis with three levels: students, school and countries.
Individual classroom disruption
Table 2 shows the analysis with individual classroom disruption as dependent variable.
The equation of model 1 contains only a few variables: living in a single mother instead
of a two-parent family, the socio-economic background of the student (ESCS) and the school
ESCS. The higher the individual ESCS and school ESCS the lower the classroom disruption
perceived by the pupil. But students who live in a single mother family perceive more often
classroom disruption.
In model 2 we add other school- and individual characteristics to the equation of model 1,
especially the school percentage single parents. This addition hardly changes the results for living
in a single mother family: they perceive more class disruption. But interestingly we also find that
the higher the school percentage single parents, the higher the level of perceived classroom
disruption. This suggests that a higher percentage of single-parent families in a school increases
the individual perception of classroom disruption, even controlled for other relevant individual
and school characteristics.

5
We test this result with model 3, in which we includes the mean school level of classroom
disruption. As we might expect, we find that the higher the mean level of classroom disruption of
a school, the higher the level of classroom disruption as perceived by the student. But the
significant effect of the school percentage single parents has become insignificant by this
inclusion of the school level of classroom disruption. Even this addition hardly changes the
results for living in a single mother family: they perceive more class disruption, irrespectively of
the school level of classroom disruption or school percentage of single parents. We draw as a
conclusion that a higher percentage single-parent family per school increases the school level of
class disruption. In an equation, not shown in table 2, we added the interaction term ‘single
mother family * level of school classroom disruption’, but the parameter of that interaction term
is not significant.
Table 3 shows the same outcome at a school level analysis. The higher the school
percentage of single parents, the higher the school level of schoolroom disruption, irrespective
the ESCS school composition and the school percentages migrants or girls.
Math score
We analyse in table 4 whether classroom disruption can explain the negative effect of school
percentage single parents on educational performance.
Model 1 of table 4 shows the well-known outcome that the school percentage single
parents has a negative effect on the educational performance of all pupils in that school,
irrespective whether they live in a single mother family or in a two-parent family. Living in a
single mother family has no significant effect on performance and the same holds for the
interaction between single mother family and school percentage single-parent families. With
other words it is more the single parent context, which influences all students, instead of the
individual situations within the separate single mother families.
We include in model 2 the individual classroom disruption as perceived by the student.
That variable has the expected negative effect on the educational performance, but the significant
effect of school percentage single-parent families or the insignificant effects of single mother
family and the interaction-term hardly change by this addition.
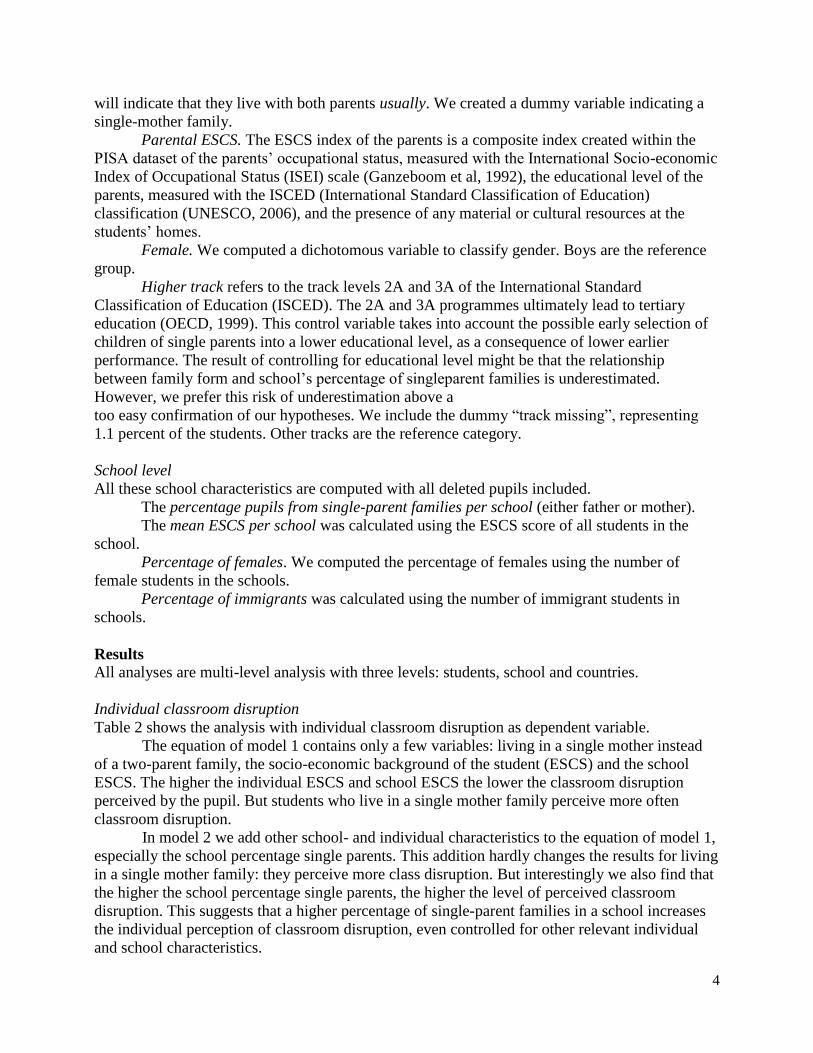
The inclusion of the school level of class disruption in model 3 lowers the effect of school
percentage single-parent family, without making it insignificant. This means that a part of the
effect of percentage single-parent family on math score is indirect, mediated by classroom
disruption. We estimated a cross-level indirect path of percentage single-parent family to math
performance through classroom disruption, using the Structural Equation Model software package Mplus
(Muthen and Muthen, 2012). We estimated a Structural Equation Model that is a combination of table 3
and model 3 of table 4 without cross-level interaction terms. Figure 1 shows parameters from this
Structural Equation Modelwhich are comparable to those in table 3 and table 4. The indirect relationship
that the proportion of single parents have with math performance through disorder have a parameter
estimate of -0.055 and is significant at p<0,05. In model 4 we add the interaction between individual perception of classroom disruption
with the school level of classroom disruption. Interestingly, the opposite parameters of individual
perception variable and the interaction term have more or less the same strength and thus
neutralize each other. We interpret the positive effect of the interaction term in the following
way: pupils in schools with high levels of classroom disruption and who also experience a high
level of disruption are better able to avoid the most negative consequences of the high level of
classroom disruption. However the school level of classroom disruption has a strong negative
effect on educational performance, overriding all other effects. This does not mean that there is a

6
change in the negative effect of school percentage single-parent families: it continues to have a
negative and significant effect on educational performance (although it is substantially smaller
than in model 1).
Conclusion
Given our results, we can answer our two research questions positively.
First, the school’s composition of students from single-parent families affects the
conditions of teaching and learning in schools, in our case indicated by classroom disruption. We
also show that this negative effect cannot be fully explained by the individual situation of the
single mother family, because the school percentage single-parent families has still a significant
effect on classroom disruption, also after controlling for living with a single mother.
Second, these lower conditions of teaching and learning (as measured by the level of
school classroom disruption) mediate the negative effect of the school’s composition of students
from single-parent families on individual educational performance of all students. This mediation
is only partly, because the school level of classroom disruption cannot explain the full effect of
school percentage single-parent families: there remains a significant negative effect of school
percentage single-parent families on individual educational performance of all students. This
remaining effect gives support to the social capital explanation: schools with a large
concentration of children from single-parent families are usually characterized by less social
capital (i.e. indicated by parents’ social relations and networks with other parents), as proposed
by Pong (1997) and Sun (1999). Another explanation of this remaining effect might be that
classroom disruption does not fully measure the quality of the conditions of teaching and learning
in schools, as influenced by the school percentage single-parent families.
Pupils living in a single mother family have not a significantly lower educational
performance if we control for the school percentage single-parent families. This means that the
different context (in this case school composition) of the single-mother pupil is a more important
explanation of low educational performance than the ling in a single mother family. However,
living in a single mother family increases the individual level of classroom disruption and also
the chance to attend a school with higher percentages of single-parent families. These factors in
their turn influence negatively educational performance of pupils, irrespectively whether they live
in a single mother family or in a two-parent family.
The analyses of these contexts of single-parenthood are also important because that will
learn us more the processes which bring about the relative strong variation in negative outcomes
of various family forms (Pong, Dronkers & Hampden-Thompson, 2003).
But this analysis is the first step to unravel this interesting and important effect of school
percentage single-parent families, which is a modern form of a negative school composition,
independent of the socio-economic school composition. It is important to analyze this effect
further, because it illustrates that single-parenthood is not only a divorce or separation decision,
taken by two individual partners; it is an decision which effect also the life chances of other
children, and thus of their society.
Literature De Lange, M.. Dronkers, J. & Wolbers, M. (2014). Single-Parent Family Forms and Children’s
Educational Performance in a Cross-Comparative Perspective: Effects of School’s Share
of Single-Parent Families. School Effectiveness and School Improvement 25 (3): 329-350.
Dronkers, J. (2010). "Features of educational Systems as Factors in the Creation of Unequal
Educational Outcomes." pp. 299-328 in Quality and Inequality of Education. Cross-

7
National Perspectives, edited by J. Dronkers. Dordrecht /Heidelberg/ London/New York:
Springer
Dronkers, J. & Harkonen, J. (2008). "The intergenerational transmission of divorce in cross-
national perspective: Results from the Fertility and Family Surveys." Population Studies-
A Journal of Demography 62:273-288.
Dronkers, J. & Kalmijn, M. (2013). Single-parenthood among migrant children: Determinants
and consequences for educational performance. CReAM Discusion Paper Series 09/13
Garriga, A. (2010). Consequences of parental divorce and family structure on children's
outcomes in European societies: individual, cohort and country explanations. PhD
dissertation, University Pompeu Fabra (Barcelona).
Härkönen, J. & Dronkers, J. (2006). "Stability and Change in the Educational Gradient of
Divorce. A Comparison of Seventeen Countries." European Sociological Review 22:501 -
517.
Muthén, L.K. and Muthén, B.O. (1998-2012). Mplus User’s Guide. Seventh Edition. Los
Angeles, CA: Muthén & Muthén
Organization for Economic Co-operation and Development. (1999). Classifying Educational
Programmes. Manuel for ISCED-97 Implementation in OECD countries. Paris: OECD
Publishing
Organization for Economic Co-operation and Development (2012). PISA 2009 Technical Report,
PISA. Paris: OECD Publishing. doi: 10.1787/9789264167872-en
Pong, S.-L. (1997). Family Structure, School Context, and Eighth-Grade Math and Reading
Achievement. Journal of Marriage and the Family, 59(3), 734-746.
Pong, S.-L. (1998). The school compositional effect of single parenthood on 10th-grade
achievement. Sociology of Education, 71(1), 24-43.
Pong, S.-L, J. Dronkers en G. Hampden-Thompson, (2003). "Family Policies and Children's
School Achievement in Single- Versus Two-Parent Families." Journal of Marriage and
Family 65:681-699.
Sun, Y. (1999). The Contextual Effects of Community Social Capital on Academic Performance.
Social Science Research, 28(4), 403–426.
8
Figure 1: Direct and indirect effects of percentage single parents family per school on math
performance of pupils.

9
Table 1: Descriptive Statistics
N Minimum Maximum Mean Std. Deviation
Individual classroom Disruption 181916 -1,12 3,26 -,01 ,99
Student ESCS 183982 -3,82 3,41 ,16 ,91
School ESCS 183982 -1,90 1,72 ,11 ,51
School % single parents* 183982 ,00 75,00 11,93 7,69
Mean school classroom disruption 183982 -1,02 1,91 -,01 ,39
Math score 183982 20,96 864,32 511,34 84,65
Single parent 183982 ,00 1,00 ,11 ,32
Female 183982 ,00 1,00 ,50 ,50
% school migrants* 183982 ,00 96,77 8,23 11,93
% school Female* 183982 ,00 100,00 50,14 18,19
Higher track 183982 ,00 1,00 ,77 ,42
Track missing 183982 ,00 1,00 ,01 ,10
*Mean centered at country-level in analysis

10
Table 2: The effects of individual characteristics and the school compositions on individual classroom disruption
Model 1 Model 2 Model 3
B S.E. B S.E. B S.E.
Constant 0.028 0.031 0.148 0.033 0.045 0.006
Single mother 0.058 0.007 0.054 0.007 0.053 0.007
Individual ESCS -0.016 0.003 -0.019 0.003 -0.020 0.003
School ESCS -0.175 0.010 -0.133 0.010 0.023 0.005
School % single parent 0.005 0.001 -0.001 0.000
Female -0.105 0.005 -0.105 0.005
Higher track -0.102 0.014 -0.008 0.005
Track missing -0.035 0.037 0.007 0.021
% migrants 0.001 0.000 0.001 0.000
% Female -0.003 0.000 0.001 0.000
Mean school classroom disruption 1.009 0.006
Variance
Country 0.025 0.007 0.026 0.007 0.000 0.000
School 0.105 0.002 0.098 0.002 0.000 0.000
Student 0.864 0.003 0.861 0.003 0.831 0.003
-2*loglikelihood 500.001.413 499.081.274 482.684.675
Source: own computation of PISA wave 2009; n-countries = 28; n-schools = 8001; n-students = 181916

11
Table 3: The effects of the school compositions on school classroom disruption (school level
analysis)
B S.E.
Constant 0.031 0.030
School percentage single parents 0.005 0.001
School ESCS -0.165 0.009
Percentage school migrants -0.000 0.000
Percentage school female -0.004 0.000
Variance
Country level 0.025 0.007
School level 0.132 0.002
-2*loglikelihood: 6.589.861
Source: own computation of PISA wave 2009; n-countries = 28; n-schools = 8001.

12
Table 4: The effects of the school composition and classroom disorder on math score.
Model 1 Model 2 Model 3 Model 4
B S.E. B S.E. B S.E. B S.E.
Constant 480.061 3.648 481.332 3.575 482.021 3.472 481.046 3.462
Single mother -0.741 0.559 -0.372 0.558 -0.363 0.558 -0.323 0.558
School percentage single parent -0.465 0.059 -0.440 0.058 -0.371 0.058 -0.365 0.058
Single mother* school % single parent -0.104 0.061 -0.096 0.061 -0.101 0.061 -0.101 0.061
Individual ESCS 18.330 0.201 18.163 0.201 18.172 0.201 18.128 0.201
Mean school ESCS 53.753 0.995 52.710 0.985 50.601 0.995 50.374 0.996
Female -17.466 0.323 -18.229 0.323 -18.200 0.323 -18.366 0.323
Higher track 36.423 1.127 35.986 1.130 35.551 1.127 35.519 1.127
Track missing 20.029 3.091 20.731 3.081 20.376 3.071 20.428 3.069
Percentage migrants -0.130 0.033 -0.121 0.033 -0.123 0.033 -0.125 0.033
Percentage Female 0.149 0.024 0.127 0.024 0.073 0.024 0.072 0.024
Individual Disruption -5.770 0.163 -5.516 0.165 -6.682 0.177
Mean school disruption -13.196 1.181 -14.052 1.182
Individual Disruption*Mean disruption 7.310 0.405
Variance
Country 341.637 93.425 326.835 89.424 306.648 83.994 304.525 82.631
School 1.268.552 23.412 1.234.229 22.866 1.211.858 22.509 1.213.275 22.521
Student 4.117.288 13.878 4.060.795 13.768 4.060.841 13.768 4.053.118 13.742
-2*loglikelihood: 2.069.659.769 2.043.907.270 2.043.783.271 2.043.457.666
Source: own computation of PISA wave 2009; n-countries = 28; n-schools = 8001; n-students = 181916

13
Appendix 1: Factor structure of classroom disruption per country
Australia:
Dimension
1 2
Lessons - Students don’t listen ,848 ,321
Lessons - Noise and disorder ,837 ,389
Lessons - Cannot work well ,860 -,349
Lessons - Long time to start ,860 -,346
Austria
Dimension
1 2
Lessons - Students don’t listen ,836 ,459
Lessons - Noise and disorder ,882 ,204
Lessons - Cannot work well ,816 -,390
Lessons - Long time to start ,819 -,299
Belgium
Dimension
1 2
Lessons - Students don’t listen ,831 -,387
Lessons - Noise and disorder ,840 -,317
Lessons - Cannot work well ,815 ,336
Lessons - Long time to start ,811 ,388
Canada
Dimension
1 2
Lessons - Students don’t listen ,831 -,374
Lessons - Noise and disorder ,834 -,348
Lessons - Cannot work well ,842 ,315
Lessons - Long time to start ,827 ,407
Switzerland
Dimension
1 2
Lessons - Students don’t listen ,831 -,374
Lessons - Noise and disorder ,834 -,348
Lessons - Cannot work well ,842 ,315
Lessons - Long time to start ,827 ,407
Czech Republic
Dimension
1 2
Lessons - Students don’t listen ,846 -,403
Lessons - Noise and disorder ,867 -,310

14
Lessons - Cannot work well ,826 ,380
Lessons - Long time to start ,830 ,357
Germany
Dimension
1 2
Lessons - Students don’t listen ,773 ,578
Lessons - Noise and disorder ,864 ,032
Lessons - Cannot work well ,824 -,135
Lessons - Long time to start ,793 -,458
Denmark
Dimension
1 2
Lessons - Students don’t listen ,800 -,429
Lessons - Noise and disorder ,812 -,391
Lessons - Cannot work well ,771 ,468
Lessons - Long time to start ,795 ,377
Spain
Dimension
1 2
Lessons - Students don’t listen ,806 ,528
Lessons - Noise and disorder ,867 ,125
Lessons - Cannot work well ,835 -,302
Lessons - Long time to start ,823 -,342
Estonia
Dimension
1 2
Lessons - Students don’t listen ,828 -,442
Lessons - Noise and disorder ,864 -,254
Lessons - Cannot work well ,831 ,279
Lessons - Long time to start ,809 ,438
Finland
Dimension
1 2
Lessons - Students don’t listen ,839 -,411
Lessons - Noise and disorder ,868 -,277
Lessons - Cannot work well ,812 ,462
Lessons - Long time to start ,846 ,248
France
Dimension
1 2
Lessons - Students don’t listen ,815 -,340
15
Lessons - Noise and disorder ,845 -,255
Lessons - Cannot work well ,841 ,034
Lessons - Long time to start ,765 ,608
United Kingdom
Dimension
1 2
Lessons - Students don’t listen ,859 ,360
Lessons - Noise and disorder ,864 ,331
Lessons - Cannot work well ,872 -,320
Lessons - Long time to start ,863 -,366
Greece
Dimension
1 2
Lessons - Students don’t listen ,809 -,300
Lessons - Noise and disorder ,799 -,265
Lessons - Cannot work well ,791 -,019
Lessons - Long time to start ,600 ,784
Ireland
Dimension
1 2
Lessons - Students don’t listen ,847 ,393
Lessons - Noise and disorder ,863 ,302
Lessons - Cannot work well ,867 -,340
Lessons - Long time to start ,868 -,344
Iceland
Dimension
1 2
Lessons - Students don’t listen ,839 ,351
Lessons - Noise and disorder ,840 ,344
Lessons - Cannot work well ,849 -,358
Lessons - Long time to start ,854 -,328
Italy
Dimension
1 2
Lessons - Students don’t listen ,775 ,595
Lessons - Noise and disorder ,849 ,033
Lessons - Cannot work well ,813 -,364
Lessons - Long time to start ,819 -,236
Luxembourg
Dimension
1 2

16
Lessons - Students don’t listen ,808 ,549
Lessons - Noise and disorder ,877 ,058
Lessons - Cannot work well ,837 -,296
Lessons - Long time to start ,829 -,298
Netherlands
Dimension
1 2
Lessons - Students don’t listen ,799 ,509
Lessons - Noise and disorder ,852 ,176
Lessons - Cannot work well ,788 -,292
Lessons - Long time to start ,784 -,417
Norway
Dimension
1 2
Lessons - Students don’t listen ,799 ,509
Lessons - Noise and disorder ,852 ,176
Lessons - Cannot work well ,788 -,292
Lessons - Long time to start ,784 -,417
New Zealand
Dimension
1 2
Lessons - Students don’t listen ,849 ,343
Lessons - Noise and disorder ,847 ,352
Lessons - Cannot work well ,852 -,343
Lessons - Long time to start ,850 -,350
Poland
Dimension
1 2
Lessons - Students don’t listen ,809 ,475
Lessons - Noise and disorder ,855 ,257
Lessons - Cannot work well ,813 -,429
Lessons - Long time to start ,836 -,306
Portugal
Dimension
1 2
Lessons - Students don’t listen ,829 -,436
Lessons - Noise and disorder ,859 -,235
Lessons - Cannot work well ,837 ,236
Lessons - Long time to start ,814 ,449
Slovak Republic
Dimension

17
1 2
Lessons - Students don’t listen ,808 -,444
Lessons - Noise and disorder ,840 -,325
Lessons - Cannot work well ,778 ,493
Lessons - Long time to start ,821 ,302
Slovenia
Dimension
1 2
Lessons - Students don’t listen ,842 -,454
Lessons - Noise and disorder ,896 -,156
Lessons - Cannot work well ,834 ,461
Lessons - Long time to start ,879 ,156
Sweden
Dimension
1 2
Lessons - Students don’t listen ,795 ,499
Lessons - Noise and disorder ,847 ,246
Lessons - Cannot work well ,817 -,355
Lessons - Long time to start ,812 -,388
USA
Dimension
1 2
Lessons - Students don’t listen ,812 ,416
Lessons - Noise and disorder ,826 ,327
Lessons - Cannot work well ,831 -,388
Lessons - Long time to start ,841 -,339