course materials for biomedical signal ...course materials for biomedical signal processing©...
TRANSCRIPT

COURSE MATERIALS FOR BIOMEDICAL
SIGNAL PROCESSING©
Section – I Introduction to the Origin and Measurement of
Biomedical Signals
Dr. Udantha R. Abeyratne
School of Electrical and Electronic Engineering
Nanyang Technological University Singapore
Office: S1-B1b-52 Phone: 790-4942
Email: [email protected]
© Copyrights: Udantha R. Abeyratne, 2002

Chapter 1
Currents and Voltages inBiology
1.1 Introduction
Electrical currents and voltages abound in the human body. A large numberof vital functions in the body either generate electricity, or are controlled byelectricity. For instance, suppose a person “thinks” of lifting his cup of coffeeto his mouth for a sip. This process of thinking is associated with groups ofneurons becoming electrically active in an area of the brain specialized forcontrolling limb movements. Then the sequence of signals required to mobi-lize the appropriate muscle groups are synthesized in the brain, again withan associated groups of neurons becoming electrically active. The generatedsignals are then transferred to the muscles via the electrochemical signallingsystem of the body, i.e. the nerve network. Signals propagate through thenerve network as an electrical signal with ions such as Na+ and K+ act-ing as current carriers. Once the signals reach the muscles, they trigger theelectrically excitable muscle cells, which contract in response to the receivedneural command. The status of the muscle is sensed by another group ofsensory neurons and the information is converted to an electrical signal tobe fed back to the brain through the nerve network.Three broad classes of electrically active cells/organs can be identified in
the body:
• [Nerve Cells] Human nervous system consists of the brain, spinal cord,and the peripheral nervous system. There are billions of active cells(neurons) in the nervous system. All higher level thinking processeshappen in the brain, with associated activation (firing) of groups ofneural cells. Examples are: motor functions such as lifting limbs, walk-
3

4 CHAPTER 1. CURRENTS AND VOLTAGES IN BIOLOGY
ing, breathing, passing urine and motion; tasks such as understand-ing/generting speech and doing mental arithmatic; sensory functionssuch as perceiving vision, touch, temperature, taste etc.
• [Sensory Receptor Cells] The receptor cells of sensory organs are alsoa part of the nervous system, but we would list them as a separatecategory here. All of our sensory organs generate electricity which arefed to the brain through the nerve network, to perceive the world weexperience. The major sensory modalities of the body are: vision,hearing, taste, touch and bodily sensations such as temperature andpain. In the eye, light rays emitted form the scene are focused ontothe retina by the optical system of the eye. The excitable cells of theretina convert light rays into electrical signals, which are carried tothe brain by the nerve network and brain cells for further processingand interpetation. Associated with the skin, there are various typesof excitable cells functioning as receptors of different sensations. Forinstance, there are cells which generate electrical signals in responseto pressure, temperature and velocity. There are similar arrangementsin all other sensory modalities, with generating electricity as a maincommonality.
• [Muscle Cells] One of the most important types of excitable cells inthe body are muscle cells. The most obvious example is the heart,which keeps life possible by pumping blood through the body day andnight withour rest. The systematic circulation of the blood to lungs, theheart and the rest of the body is achieved by contracting various cardiacmuscles groups in an orderly fashion. The periodic pattern of pumpingof the heart has its origins in the group of autonomous and periodicallyfiring cells located in the sinoatrial node. The electrical activity ofthose cells are propagated thoroughout the heart in a coordinated way,leading to a useful pattern of cardiac muscle contraction. Anotherexample is the contraction of skeletal muscles, making our movementspossible.
The human body can easily be visualized as a great machine controlledby electrical signals. There are, however, several reasons why a bioengineershould have a reasonable understanding on the nature of biopotentials, theirmeasurements and interpretation. Biopotentials find several uses in contem-porary medicine and science:
• Clinical Diagnostic Value:Biopotentials originating in the cells/organs drive electrical currents

1.1. INTRODUCTION 5
Figure 1.1: Diagnosing Cardiac Diseases
through the tissue medium of the body. A part of the current reachesthe surface of the body giving rise to potential differences that can benon invasively measured. Those measured signals carry vital informa-tion on the state of the cells/organs which produced them. In clini-cal practice, biopotential measurements are used to diagnose diseases.Some of the prime examples are: the electrical signal due to the heart,electrocardiographic signal(ECG), is used in the diagnosis of irregu-lar patterns of heart beats (cardiac arrhythmias); the electrical signalfrom the brain, Electroenceplographic signal (EEG)is used to diagnoseepileptic seizures and neurological diseases such as Parkinson’s Disease.The electrical signal due to the skeletal muscle, the electromyographicsignal (EMG) is used to diagnose problems, such as atrophy, associated

6 CHAPTER 1. CURRENTS AND VOLTAGES IN BIOLOGY
with muscles.
• Clinical Intervention Value:A vast majority of critical body functions depend on biopotential gen-eration and propagation. In cases such as spinal-cord-injuries (SCI)and neuromuscular disorders, the electrical connection from the brainto the organ under consideration can be lost, with serious consequences.For instance, in SCI, the patient can be completely paralyzed makingit impossible for him to walk, talk, or even to pass urine and motion. Ifthe function of the biopotentials in activating muscle groups are known,it is sometimes possible to intervene by applying extarnal curerents ap-propriately, thus restoring the lost function. This area of applicationis called Functional Electrical Stimulation. Furthermore, with moderntechnology and knowledge about biopotentails, daunting but appealingtasks such as restoring vision to the blind, hearing to the deaf, or build-ing artificial “noses” to sniff illegal drugs etc. are no longer consideredimpossible. In fact, this is one of the very active areas of research atpresent.
• Scientific Value:Biopotentials are used in Basic Sciences to understand the behav-ior/function of organs/tissues. One of the prime examples is the use ofEEG signals to understand how the brain processes information.

1.1. INTRODUCTION 7
Figure 1.2: Diagnosing Cardiac Diseases

8 CHAPTER 1. CURRENTS AND VOLTAGES IN BIOLOGY
In the following sections, we focus into the problem of how voltages andcurrents are generated within cells, how to measure them and to use themin medical diagnosis and intervention.
1.2 Cellular basis of biopotentials
Human body is a collection of trillions of cells. Each cell is surrounded bya Plasma membrane that separates it from the extracellular fluids. Manyimportant cellular processes occur on, in and across the plasma membrane.As we will soon discover, the origin of biopotentials too are intimately asso-ciated with the plasma membrane. In order to understand this process, letus focus our attention briefly to the constitution of the plasma membrane.
1.2.1 The structure of the plasma membrane
The major constituents of the plasma membrane are proteins and phospho-lipids. A phospholipid molecule has a polar head and a two non-polar hy-drophobic chains. When a group of phospholipid molecules are put into anaqueous solution, they form a bilayer structure, such that the hydrophobictails are “shielded” from water by the hydrophilic polar head groups. Thisbilayer serves as the foundation of the membrane. The proteins moleculesof the membranes are either embedded in the bilayer, or attached on thesurface.The bilayer structure of the membrane serves as a huge permeability
barrier to most of the molecules present in living systems. This is becausethat most biological molecules have very low solubility in nonpolar mediumfound in the interior of the bilayer.Molecules essential to the functioning of the cell are transported in and
out of the cell based on several mechanisms. The mechanisms of significanceto the biopotential generation are (1) diffusion and (2) protein mediatedtransport.
1.2.2 Diffusion through the membrane
Diffusion is the net movement of matter along a concentration gradient, dueto random thermal movements (Brownian Motion) of particles. Diffusionacross cellular membranes tend to equalize concentrations of solutes in bothsides of the membrane. The process of diffuse is captured by the Fick’s lawsof diffusion.Fick’s First law of diffusion states that:

1.2. CELLULAR BASIS OF BIOPOTENTIALS 9
Figure 1.3: MEMBRANE BILAYER STRUCTURE

10 CHAPTER 1. CURRENTS AND VOLTAGES IN BIOLOGY
J = −DAdcdx, (1.1)
where:
• J = rate of diffusion• A = area though which the diffusion occur• dc
dx= concentration gradient
• D = diffusion coefficient
The process of diffusion is rapid enough for most biological purposes,when the distances involved are small, i.e. a few tens of micro meters. Smallmolecules such as Oxygen will diffuse readily across the membrane, and largerones such as Glucose will find diffusion is not of much help.
1.2.3 Protein mediated transport
Some substances cross the plasma membrane, through special “protein gates”(transport proteins) meant for them. Only chemicals with the required struc-ture are allowed through those gates. In the Facilitated Transport mode,protein gates seem to allow molecules to diffuse through the gates. Exactmechanism is not known yet. In the Active Transport mode, protein gatesare powered by metabolic energy, making it possible for them to transportparticles against electrochemical potential gradients. A good example foran active transport system is the Na+-K+-pump, which is an indispensablecomponent in biopotential generation. The function of the pump is to trans-port Na+ out of the cell and K+ into the cell, both against their naturalconcentration gradients.
1.3 Resting Membrane Potentials and ionic
equilibria
Most cells of animal develop an electrical potential difference across theirplasma membranes, with the interior of the cell (cytoplams) as the low po-tential side. Even when an excitable cell such as a nerve or muscle is in the“steady state” or the “non-excited” state, this potential difference still exists.The steady-state potential difference developed across the plasma membraneof a resting cell is called the “resting potential”, or the “resting membranepotential”. In the following we describe the phenomenon of resting potentialgeneration.

1.3. RESTING MEMBRANE POTENTIALS AND IONIC EQUILIBRIA11
1.3.1 Ionic equilibria and resting potentials
Cytoplasm contains proteins, polyphosphates and ioninized substances forwhich the cell membrane is not permeable at all. It also contains small ionssuch as Na+, K+ and Cl− with a limited degree of membrane permeability.In order to understand how this mixture of ions lead to biopotentials acrosscell membrane, let us consider the following simplified situation.
Experiment 1
Figure 1.4: EA − EB = −59.1 mV
Suppose two aqueous solutions of KL are separated by a membrane per-meable to K+, but not permeable to L−1. On side A, the concentration ofK+ is [KL]A = 0.1M ; on side B, [KL]B = 0.01M . The temperature of thesolution in both compartments is 250C.
There are two opposing forces governing the behavior of K+:
(F1) Since [K+]A > [K+]B, diffusion force will act to move K
+ across themembrane from A to B. Let us imagine that a tiny bit ∆K of K+
diffused from A to B.
(F2) Now the membrane surface facing side B is more positive than the onefacing A. There will be a tiny electric field, ∆E, which forces K
+tomove from side B to A !!

12 CHAPTER 1. CURRENTS AND VOLTAGES IN BIOLOGY
At any given time, the total net force of K+to move is determined by theforces of diffusion and electrical fields. The total effect can be captured bythe quantity electrochemical potential µ, defined as:
µ = µ0 +RTln(C) + zFE, (1.2)
where
• µ0 = electrochemical potential of an ion at a reference state
• R = universal gas constant = 8.314 J(K mol)• T = absolute temperature• C = ionic concentration• z = charge number of the ionic species, with the sign taken into account.eg. Na+ has z = +1, Cl− has z = −1.
• F = Faraday’s Number = 9.65X10⁴ C/mol.
• E = electrical potential.Note that RTln(C) represents the diffusion process (chemical potential
energy), and zFE represents the electric field effect (electric potential en-ergy). The net tendency ofK+to move from A to B is given by δµ = µA−µB,where:
µA = µ0 +RT ln[K+]A + zFEA (1.3)
µB = µ0 +RT ln[K+]B + zFEB (1.4)
The movement of K+will stop, when the chemical forces (diffusion) andthe electrical forces (electrical field) are equal in magnitude but opposing eachother. In terms of the electrochemical potential, this translates to the state-ment δµ = µA − µB = 0.From (1.3) and (1.4) we get,
EA − EB = −RTzF
ln[K+]A[K+]B
, (1.5)
which is called the Nernst Equation. Walter Nernst of Germany won theNobel Prize for Chemistry in 1920 for this discovery and related work.Note that the Nernst Equation applies only when ions are at equilibrium.
If it is given that the ions in Experiment 1 are in equilibrium, we can calculatethe potential difference between the sides A and B to be:

1.3. RESTING MEMBRANE POTENTIALS AND IONIC EQUILIBRIA13
EA − EB =−RTzF
ln[K+]A[K+]B
, (1.6)
=−8.314× (273 + 25)
1× 96500 ln0.1
0.01, (1.7)
= −59.1 mV. (1.8)
In summary, the Nernst Equations can be used as follows:
(N1) If the equilibrium ionic concentrations are known, then we can use itto calculate the equilibrium transmembrane potentials. If there aremany different types of ions separated by the membrane, we can applythe equation to each ion species separately, provided that species hasachieved equilibrium.
(N2) At any given instant, if the potential difference measured across a mem-brane is NOT the one calculated for a particular ion species from theNernst Equation, then that particular species is NOT in equilibrium.
In order to understand what happens when there are more than onespecies of ion to which the membrane is permeable, let us consider the fol-lowing experiment.
Experiment 2
Take a container with a membrane separating it into two equal volume com-partments, A and B. At the time t = t0 compartment A is filled with anaqueous solution of 0.1M KY and side B is filled with 0.1M KCl solution.Let the membrane be permeable to K+, Cl−, and completely impermeable tothe ion Y −.Our objective at this time is to follow the changes that happen in the
compartments A and B during the time t = t0+ − ∞. We would like tocalculate the equilibrium concentration levels of various ion species, so thatwe can apply Nernst Equation to calculate the transmembrane potentials atequilibrium.In order to calculate equilibrium concentrations, we can make use of the
Principle of Electroneutrality, which states that any macroscopic region ofa solution must be electrically neutral. In other words, in a solution, if wetake a finite region, the total number of positive charges should be equal tothe total number of negative charges. This principle holds throughout theperiod t = t0+ −∞.

14 CHAPTER 1. CURRENTS AND VOLTAGES IN BIOLOGY
Figure 1.5: Initial State
At the time t = t0, we observe that [Cl−]B > [Cl−]A by definition. Thus,
diffusion forces will act on Cl− to move some of them from B to A. However,this movement of charged particles will violate the principle of electroneutral-ity. In order to satisfy it the other charged particles capable of penetratingthe membrane, K+ in this case, will have to move together with Cl−. Thesystem will reach equilibrium at the time t = ∞ satisfying the principle ofelectroneutrality.After the system achieves the equilibrium state, the equilibrium ionic
distributions can be calculated, based on the principle of electroneutrality.Let the equilibrium levels of ionic concentration be [Cl−]BE, [Cl−]AE, [K+]AEand [K+]BE. Then applying the Nernst Eq. to [K
+], we get,
EA − EB = −RTzF
ln[K+]AE[K+]BE
, (1.9)
Similarly, applying Nernst to Cl−we get,
EA − EB = RT
zFln[Cl−]AE[Cl−]BE
, (1.10)
From (1.9) and (1.10) we can derive,
[K+]AE[Cl−]AE = [K+]BE[Cl
−]BE, (1.11)
which is known as the Gibbs-Donnan Equation, or the Donnan Relation-ship. Under Donnan equilibrium, all permeable ion attain equilibrium. If the

1.3. RESTING MEMBRANE POTENTIALS AND IONIC EQUILIBRIA15
membrane is permeable to more than two ion species, then all of them willattain Nernst potential through charge redistribution, if Donnan Equilibriumis to arise. Note that we can use the Donnan relationship to calculate equi-librium ionic concentrations, after which the Nernst Equation can be appliedto find equilibrium potentials.Let us calculate equilibrium concentrations of ionic species for experiment
2.Let the amount of Cl−moved from B to A at t = ∞ be cm. Then the
equilibrium concentration of Cl−on side B, i.e., [Cl−]BE, can be expressedas:
[Cl−]BE =[Cl−]BV − cm
V, (1.12)
= 0.1− cm/V, (1.13)
= 0.1− b, (1.14)
= [K+]BE (1.15)
where V is the volume of liquid in side B and b = cm/V is the change inconcentration accompanied by the diffusion of cm of Cl
−.At t = 0 there was no Cl−on side A. At equlibrium [Cl−]AE = cm/V =
b (note that both compartments A and B have the same volume V , byassumption). At t = 0, the amount of K+on side A was [K+]B = 0.1M ; atequilibrium the new concentration becomes K+]AE = 0.1 + cm/V = 0.1 + b,based on the principle of electroneutrality.Applying (1.11) we get,
[K+]AE[Cl−]AE = [K+]BE[Cl
−]BE, (1.16)
(0.1 + b)b = (0.1− b)(0.1− b), (1.17)
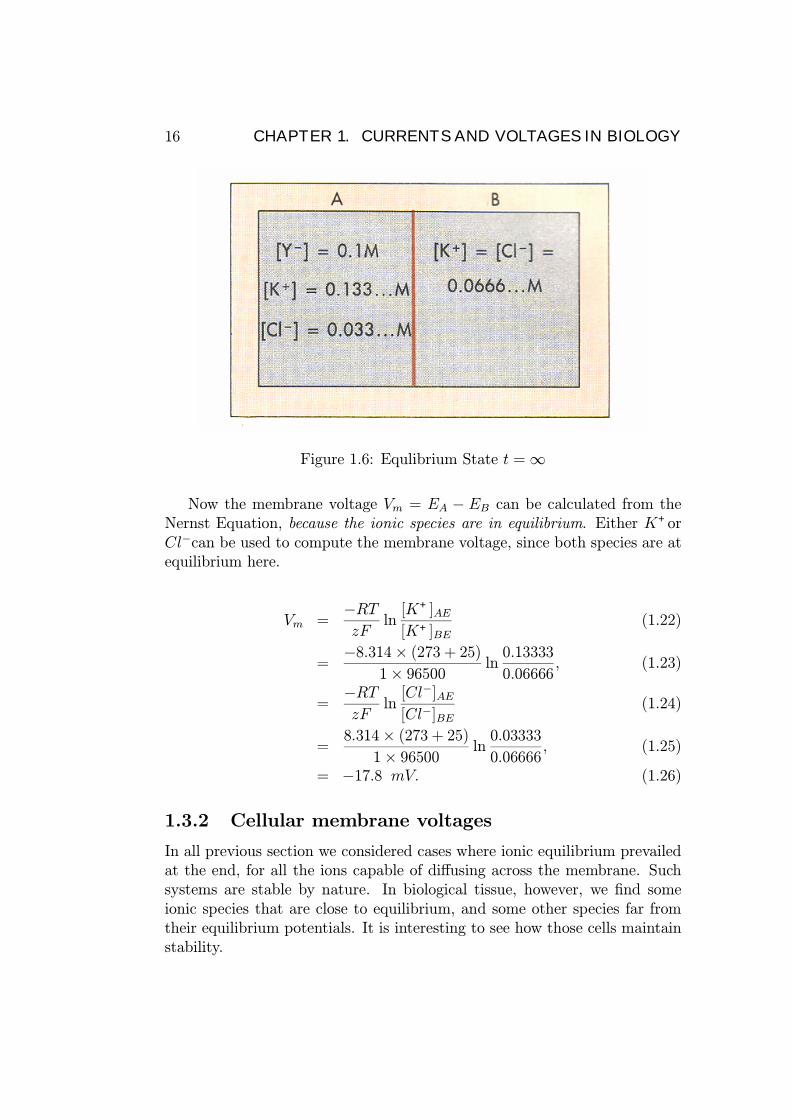
from which we can obtain b = cm/V = 0.03333 (expressed in units of M).Knowing b, we can calculate all ionic concentrations at equilibrium, as fol-lows:
[K+]AE = 0.1 + 0.03333 = 0.13333M (1.18)
[K+]BE = 0.1− 0.03333 = 0.06666M (1.19)
[Cl−]AE = b = 0.03333M (1.20)
[Cl−]BE = 0.1− 0.03333 = 0.06666M (1.21)
The component Y − can not diffuse across the membrane, and thus makesno contribution the membrane voltage.
16 CHAPTER 1. CURRENTS AND VOLTAGES IN BIOLOGY
Figure 1.6: Equlibrium State t =∞
Now the membrane voltage Vm = EA − EB can be calculated from theNernst Equation, because the ionic species are in equilibrium. Either K+orCl−can be used to compute the membrane voltage, since both species are atequilibrium here.
Vm =−RTzF
ln[K+]AE[K+]BE
(1.22)
=−8.314× (273 + 25)
1× 96500 ln0.13333
0.06666, (1.23)
=−RTzF
ln[Cl−]AE[Cl−]BE
(1.24)
=8.314× (273 + 25)
1× 96500 ln0.03333
0.06666, (1.25)
= −17.8 mV. (1.26)
1.3.2 Cellular membrane voltages
In all previous section we considered cases where ionic equilibrium prevailedat the end, for all the ions capable of diffusing across the membrane. Suchsystems are stable by nature. In biological tissue, however, we find someionic species that are close to equilibrium, and some other species far fromtheir equilibrium potentials. It is interesting to see how those cells maintainstability.
1.3. RESTING MEMBRANE POTENTIALS AND IONIC EQUILIBRIA17
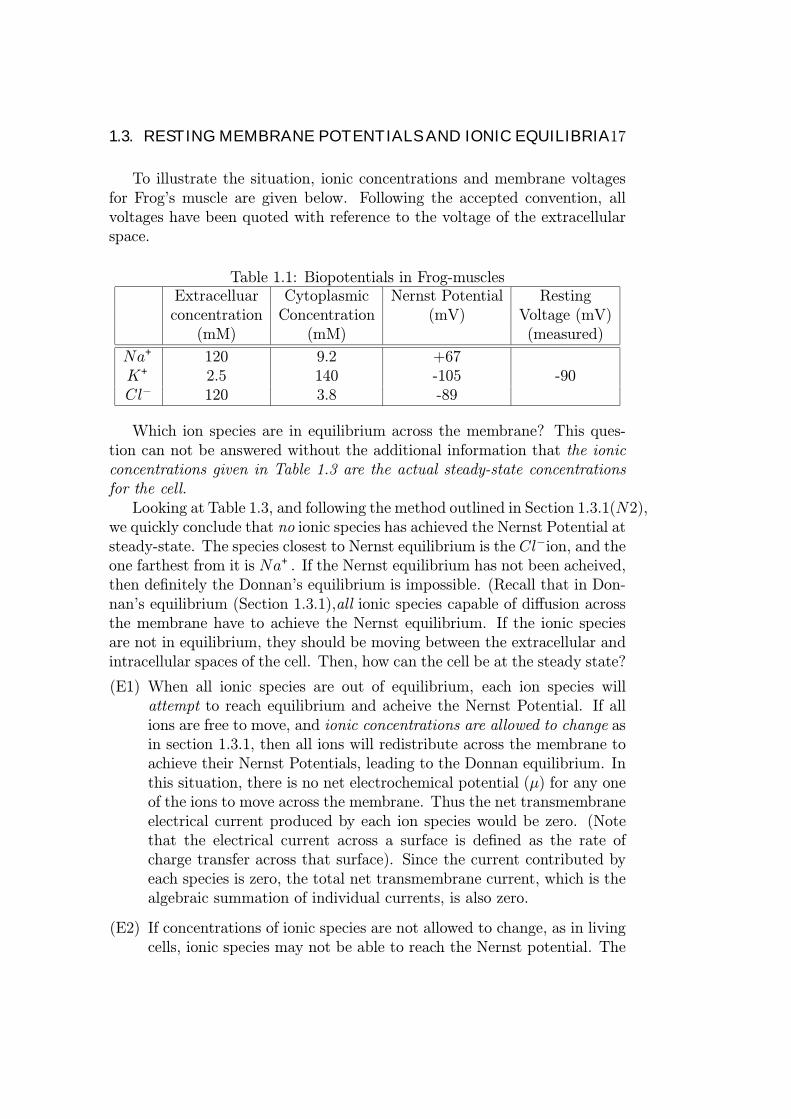
To illustrate the situation, ionic concentrations and membrane voltagesfor Frog’s muscle are given below. Following the accepted convention, allvoltages have been quoted with reference to the voltage of the extracellularspace.
Table 1.1: Biopotentials in Frog-musclesExtracelluar Cytoplasmic Nernst Potential Restingconcentration Concentration (mV) Voltage (mV)
(mM) (mM) (measured)
Na+ 120 9.2 +67K+ 2.5 140 -105 -90Cl− 120 3.8 -89
Which ion species are in equilibrium across the membrane? This ques-tion can not be answered without the additional information that the ionicconcentrations given in Table 1.3 are the actual steady-state concentrationsfor the cell.Looking at Table 1.3, and following the method outlined in Section 1.3.1(N2),
we quickly conclude that no ionic species has achieved the Nernst Potential atsteady-state. The species closest to Nernst equilibrium is the Cl−ion, and theone farthest from it is Na+. If the Nernst equilibrium has not been acheived,then definitely the Donnan’s equilibrium is impossible. (Recall that in Don-nan’s equilibrium (Section 1.3.1),all ionic species capable of diffusion acrossthe membrane have to achieve the Nernst equilibrium. If the ionic speciesare not in equilibrium, they should be moving between the extracellular andintracellular spaces of the cell. Then, how can the cell be at the steady state?
(E1) When all ionic species are out of equilibrium, each ion species willattempt to reach equilibrium and acheive the Nernst Potential. If allions are free to move, and ionic concentrations are allowed to change asin section 1.3.1, then all ions will redistribute across the membrane toachieve their Nernst Potentials, leading to the Donnan equilibrium. Inthis situation, there is no net electrochemical potential (µ) for any oneof the ions to move across the membrane. Thus the net transmembraneelectrical current produced by each ion species would be zero. (Notethat the electrical current across a surface is defined as the rate ofcharge transfer across that surface). Since the current contributed byeach species is zero, the total net transmembrane current, which is thealgebraic summation of individual currents, is also zero.
(E2) If concentrations of ionic species are not allowed to change, as in livingcells, ionic species may not be able to reach the Nernst potential. The

18 CHAPTER 1. CURRENTS AND VOLTAGES IN BIOLOGY
net electrochemical potential difference (δµ) across the membrane forsuch species is not zero, leading to charge movements across the mem-brane. Thus, species not in equilibrium will produce electrical currentsacross the membrane. For instance, across a cell membrane, we can ob-serve pottasium currents IK, Sodium currents INa and Cloride currentsICl etc. even in the steady state.
Extracellular Space (0 volts)
Intracellular Space (Vm)
(Voltage Reference)
C
ENa EKECl
gNa gKgCl
Electrical Equivalent Circuit for the PlasmaMembrane
Figure 1.7: Parallel Conductance Model
In (E1) and (E2) above, ionic currents, or strictly speaking ionic currentdensities (which are ionic current per unit area of the membrane surface) canbe expressed as:
IK = gK(Vm − EK), (1.27)
INa = gNa(Vm −ENa), (1.28)
ICl = gCl(Vm − ECl), (1.29)
where gK , gNa and gCl respectively denote the specific conductivities of themembrane to K+, Na+and Cl−ions; EK , ENa and ECl denote Nernst Poten-
1.3. RESTING MEMBRANE POTENTIALS AND IONIC EQUILIBRIA19
tials for K+, Na+and Cl−(column 4 of Table 1.3). The quantity Vm is thetransmembrane potential of the cell (last column of Table 1.3).Steady state conditions require that the total net transmembrane current
satisfy,IK + INa + ICl = 0. (1.30)
Note that in the steady state, there will be no current through the mem-brane capacitance, because such a current would continuously charge thecapacitor and increase the membrane voltage, violating the “steady-state”assumnption.From (1.30) and (1.27 - 1.29) we get,
gK(Vm − EK) + gNa(Vm − ENa) + gCl(Vm − ECl) = 0, (1.31)
from which we can calculate the membrane voltage as,
Vm =gKEK + gNaENa + gClECl
gK + gNa + gCl, (1.32)
=gKgTEK +
gNagTENa +
gClgTECl, (1.33)
where gT = gK+gNa+gCl. This is known as the Chord Conductance Equation.The chord conductance equation describes how the membrane voltage
is determined, in competition, among all ionic species that permeate themembrane.The following point is worth noting:
• According to (1.33), the ionic species with the largest conductance hasthe largest say in determining the resting potential Vm, and vice versa.In other words, the membrane voltage will be closer to the specieswith the largest conductance. If the largest conductance is much largerthan the rest, the membrane voltage will be approximately equal to theNernst potential of the species with the largest conductance.
1.3.3 The Na+ −K+ pump
In the previous section, we assumed that the ionic concentrations of extra-cellular and intracellular media for living cells were held constant(see theexample for a Frog Muscle Cell in Table 1.3). We also noted that bothK+and Na+move across the plasma membrane giving rise to IK and INacomponents of transmembrane currents, whereas the magnitude of ICl wasdeemed small in comparison. If ions keep crossing the membrane, it seems

20 CHAPTER 1. CURRENTS AND VOLTAGES IN BIOLOGY
impossible to keep ionic concentrations at fixed values. The solution to theriddle is in the action of the Na+−K+ pump, which we met in Section 3.20.
The Na+ − K+ pump, powered by metabolic energy, pumps Na+outof the cell, against the natural concentration gradient; at the same time itpumps K+into the cell, again working against the concentration gradient.It has been found that for every two K+ion pumped into the cell, threeNa+ions are pumped out of the cell. Thus pump itself contributes a “pumpcurrent” to the transmembrane current. With the pump current, Ip, takeninto account, (1.31) becomes,
gK(Vm − EK) + gNa(Vm −ENa) + gCl(Vm − ECl) + Ip = 0, (1.34)
Since the pump contributes a voltage to the resting potential of the cell,it is called an “electrogenic pump”. The voltage contributed by the pump tothe resting potential can be negligible (< 5 mV) in cases such as nerve andskeletal muscle cells; in some other cases such as vertebrate smooth musclecells, it can be very important (can be even higher than 20 mV ).
TheNa+−K+ pump is responsible for the high intracellularK+concentrationand the low intracellular Na+concentrations, which are essential features ofthe functioning of a cell.
1.3.4 Goldman’s Equations
The Goldman’s equation for transmembrane potential Vm is given by,
Vm = −kTqln(PK[K
+]i + PNa[Na+]i + PCl[Cl
−]0PK[K+]o + PNa[Na+]o + PCl[Cl−]i
), (1.35)
where,
• k = Boltzman’s constant = 1.38× 10⁻²³ J/K
• T = absolute temperature
• q = the charge on a proton = 1.602× 10⁻¹⁹
• PK , PNa, PCl = the permeabilities of K+, Na+and Cl−
Just like the chord conductance equation, Goldman’s equation can beused to estimate Vm.

1.4. SIGNAL PROPAGATION IN CELLS: ACTION POTENTIALS 21
Table 1.2: Ionic concentrations in a frog skeletal muscleExtracelluar Cytoplasmic Permeabilityconcentration Concentration (cm/s)
(mM) (mM)
Na+ 146 11 1.9× 10⁻⁸
K+ 4.35 150 2.1× 10⁻⁶
Cl− 125 5 3.9× 10⁻⁶
Example
In an experiment, the following ionic concentrations have been measuredfrom a frog skeletal muscle at 370C. Calculate the transmembrane potentialVm for the cell using the Goldman’s equation.
Solution:
Vm = −1.38× 10⁻²³(273 + 37)
1.602× 10⁻¹⁹ln(
2.1× 10−6 × 150 + 1.9× 10−8 × 11 + 3.9× 10−6 × 125
2.1× 10−6 × 4.35 + 1.9× 10−8 × 146 + 3.9× 10−6 × 5),
= −86.5mV
1.4 Signal Propagation in Cells: Action Po-
tentials
So far we have been concerned with the calculations of resting membranepotentials of cells. In Section 1.4, our focus will be on the signal generationand propagation aspects of excitable cells.
The brain has to transmit signals to far away parts of the body such asmuscles of the leg. Some nerve cells have long axons, extending several tensof centimeters, providing support to the brain. The signals have to propagatefast enough to the destination, and have to be received in proper strength tobe interpreted. In biology, this is achieved via Action Potentials, a voltage-disturbance progating down the nerve cell. The marvellous feature of theaction potential is that it is capable of propagating throughout the nervewithout suffering from attenuation effects.

22 CHAPTER 1. CURRENTS AND VOLTAGES IN BIOLOGY
1.4.1 Qualitative treatment of action potential gener-ation and propagation
Introduction to Essential Jargon
In the resting (steady state) state, the membrane is said to be “polarized”,because of the existence of the transmembrane voltage. Conventionally, thisvoltage is measured with reference to the extracellular electrode. The restingpotential assumes a negative value, indicating that the interior of the cell is ata lower potential than the exterior. Any decrease of this polarization is calleda “depolarization” of the membrane, and, an increase of the polarization iscalled a “hyperpolarization”.
The origin of action potentials
Humans have spent generations trying to understand the phenomenon of ac-tion potential generation and propagation. Even the state of the art knowl-edge is not perfect, but we do know a lot about the processes involved. Themodern theories are summarized by the pioneering works of Hodgkin andHuxley, who won a Nobel Prize for their discovery.
The origin of action potentials can be explained by considering the changesin gNaand gKof the plasma membrane. There are protein channels throughthe membrane, which selectively letK+andNa+to diffuse across. The formerchannels are called K+-channels and the latter are called Na+-channels. Inthe following we describe, in rough qualitative terms, how an action potentialis generated as a result of coordinated operation of K+and Na+-channels.
• When the membrane is in the polarized state (resting state)K+-channelsare mainly open and thus gK>>gNa. According to (1.33), the restingpotential approaches the Nernst potential of K+. The Na+-channelsare voltage sensitive, or, equivalently, voltage gated. If a patch of thecell membrane is depolarized by some means, voltage sensitive Na+-channels start opening up. This in turn makes gNalarger, because nowmore Na+can diffuse through the membrane. When gNaincreases, theNernst Potential of Na+influences the transmembrane potential Vmmore and more in accordance with (1.33), leading to more depolariza-tion. If the membrane threshold for excitation is exceeded, this processbecomes self regenerative and runs to completion, generating an actionpotential. At the peak of the action potential, gNa>> gK> gCl, thusthe membrane poptential Vm approaches the ENa, the Nernst Potentialof Na+.

1.4. SIGNAL PROPAGATION IN CELLS: ACTION POTENTIALS 23
• After staying open for a short while, Na+-channels start deactivating,making gNasmaller again. The K
+-channels start opening up a littlebit after Na+-channels open. Slightly after Na+-channels start closingup, K+-channels peak up, making gK>>gNaonce again. This acts as amembrane hyperpolarization influence, tending to return the membraneto resting levels again. The opening of Na+-channels occurs rapidly,and so is their closing. The K+-channels, however, take a relativelylonger time for both.
• The initial depolarization which started the action potential could bedue to external or internal signals. Some examples for external stimuliiare: light falling on retinal cells, touch on skin receptor cells and strechon baroreceptor cells in the cardiovascular system.
Important Note:Note that the resting membrane potential is very close to the ECl, i.e. theNernst potential of Cl− ion, because the Cl− ions are almost at equilibriumacross the membrane. At the height of the action potential, Cl− does notcontribute significantly to the transmembrane potential, due to its very lowconductance, gCl.
The propagation of action potentials
For an action potential propagating along a single nerve fiber, the region ofthe fiber undergoing a transition into the active state (the active region) atan instant of time is usually small relative to the length of the fiber. FigureP1 shows schematically the charge distribution along the fiber in the vicinityof the active region. Here we see the direction of propagation of the actionpotential (considered frozen in time), and the membrane lying ahead of theactive region is polarised, as in the resting state. A reversal of polarity isshown within the active region because of depolarisation of the membrane topositive values of potential. The membrane lying behind the active zone isrepolarised membrane.From the indicated charge distribution, solenoidal (closed-path) current
flows in the pattern shown in figure P1 In the region ahead of the active zone,the Ohmic potential drop across the membrane caused by this solenoidalcurrent flowing outward through the membrane is of such a polarity as toreduce the magnitude of the transmembrane potential, i.e., depolarise themembrane. When the membrane potential is depolarised to the threshold

24 CHAPTER 1. CURRENTS AND VOLTAGES IN BIOLOGY
Figure 1.8: Action Potential Generation

1.4. SIGNAL PROPAGATION IN CELLS: ACTION POTENTIALS 25
level (about 20mV more positive than the resting potential), this region be-comes activated as well, The same current pattern flowing behind the activeregion is ineffective in re-exciting the membrane, which is in the refractorystate, The nature of this process is therefore self?excitatory, each new incre-ment of membrane being brought to the threshold level by lines of currentfrom the active state for only a brief period of time and ultimately repolarisescompletely. In this way, the action potential propagates down the length ofthe fiber in an unattenuated fashion, the signal being built up at each pointalong the way.
Figure 1.9: Action Potential Propagation-Local currents
Most vertebrate axons are “myelinated”, as opposed to invertebrate ax-ons, which are unmyelinated. Myelination results in a much greater speedof conduction. The popagating action potential need not be regenerated ateach point along the axon with myelinated nerves; regeneration is requiredonly at the Nodes of Ranvierwhere the axonal surface is exposed to the ex-tracellular medium. Under the myelin sheath, conduction happens entirelydue to Local Currents.

26 CHAPTER 1. CURRENTS AND VOLTAGES IN BIOLOGY
Figure 1.10: A Myelinated Axon
1.5. BIOPOTENTIALS: EXAMPLES AND USES 27
1.5 BIOPOTENTIALS: Examples and uses
1.5.1 Electroencephalography
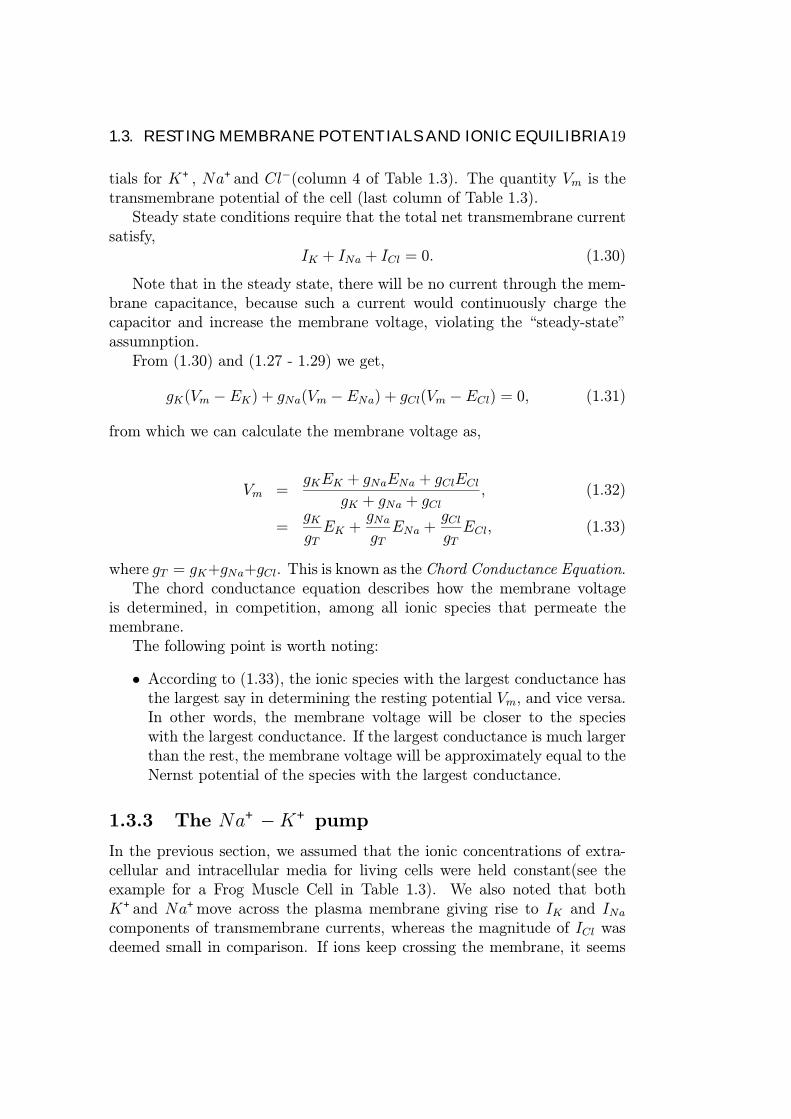
The electrical activity of the brain is recorded with three types of electrodes:scalp, cortical, and depth. With scalp electrodes the recording is called anelectroencephalogram (EEG). When electrodes are placed on the exposedsurface (cortex) of the brain, the recording is called an electrocorticogram(ECoG). Electrodes also may be advanced into the brain, in which case theterm “depth recording” designates the technique. Whether obtained fromthe scalp, cortex, or depths of the brain, the potentials recorded representthe activity of numerous neurons in which fluctuating membrane and actionpotentials are occurring.
Electrode Locations
Scalp electrodes are employed in conjunction with both“monopolar” andbiPolar recording techniques. With “monopolar” recording, one side of each
Figure 1.11: Monopolar and Bipolar Measurements
28 CHAPTER 1. CURRENTS AND VOLTAGES IN BIOLOGY
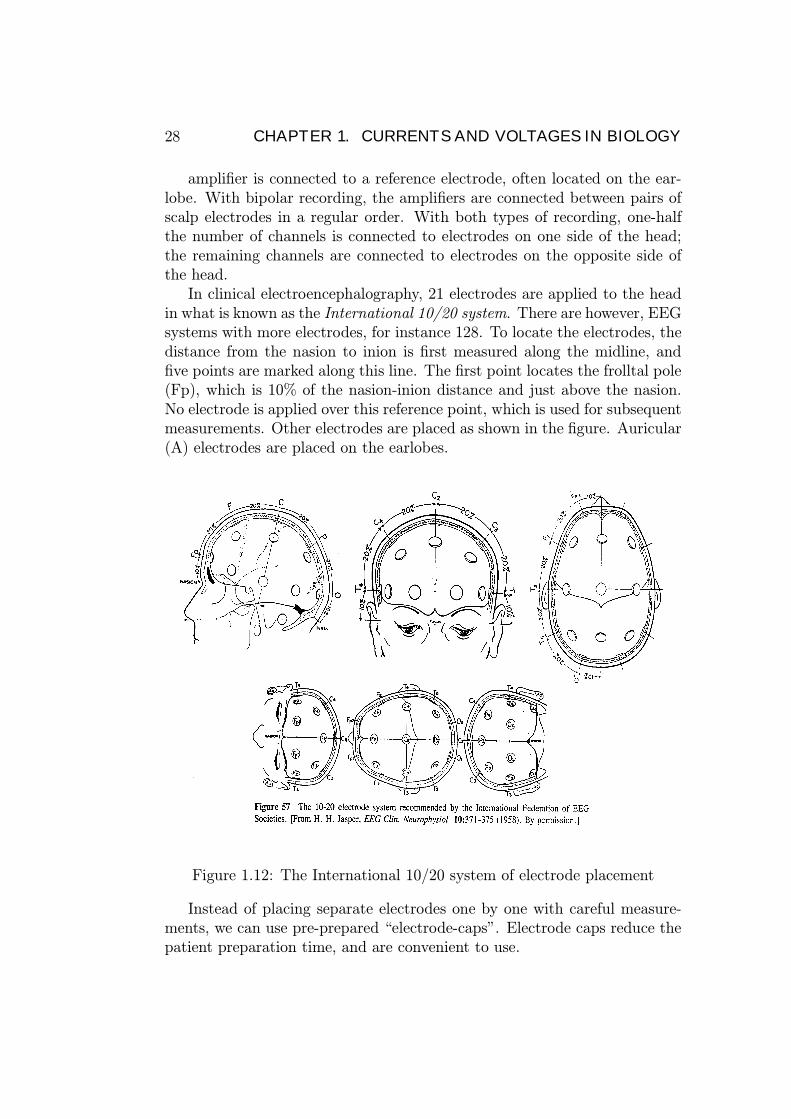
amplifier is connected to a reference electrode, often located on the ear-lobe. With bipolar recording, the amplifiers are connected between pairs ofscalp electrodes in a regular order. With both types of recording, one-halfthe number of channels is connected to electrodes on one side of the head;the remaining channels are connected to electrodes on the opposite side ofthe head.In clinical electroencephalography, 21 electrodes are applied to the head
in what is known as the International 10/20 system. There are however, EEGsystems with more electrodes, for instance 128. To locate the electrodes, thedistance from the nasion to inion is first measured along the midline, andfive points are marked along this line. The first point locates the frolltal pole(Fp), which is 10% of the nasion-inion distance and just above the nasion.No electrode is applied over this reference point, which is used for subsequentmeasurements. Other electrodes are placed as shown in the figure. Auricular(A) electrodes are placed on the earlobes.
Figure 1.12: The International 10/20 system of electrode placement
Instead of placing separate electrodes one by one with careful measure-ments, we can use pre-prepared “electrode-caps”. Electrode caps reduce thepatient preparation time, and are convenient to use.

1.5. BIOPOTENTIALS: EXAMPLES AND USES 29
Figure 1.13: E-net Electrode Placement: 10/20 system. Medelec Profile EEGsystem. First Year Lab B2, Nanyang Technological University.
The Normal EEG
With scalp electrodes applied to the normal relaxed adult human subject,there can be recorded a constantly fluctuating electrical activity having adominant frequency of about 10 Hz and an amplitude in the range of 20-200µV . This activity, which is called the alpha rhythm, ranges in frequencyfrom about 8 to 13 Hz and is most prominent in the occipital and parietalareas; it may occupy as much as half the record. The alpha rhythm increasesin frequency with age from birth and attains its adult form by about 15-20years of age. The alpha rhythm is most prominent when the eyes are closedand in the absence of concentration. Opening the eyes, engaging in patternedvision, or performing such cerebral activity as mental arithmetic diminishesor abolishes the alpha rhythm.
Although the alpha rhythm is the most prominent electrical activity, otherfrequencies are present in the normal human subject. For example, there is aconsiderable amount of low-voltage, higher-frequency (beta) activity presentranging in frequency from 18 to 30 Hz. It is most frequently found in thefrontal part of the brain. However, the normal electroencephalogram con-tains waves of various frequencies (in the range of 1-60 Hz) and amplitudes,depending on the cerebral state.
To improve communication between electroencephalographers, a termi-nology has been developed to describe waveforms and their frequencies.
The cerebral state profoundly affects the EEG. For instance, as a subject

30 CHAPTER 1. CURRENTS AND VOLTAGES IN BIOLOGY
Figure 1.14: EEG α waves in cats and humans
goes to sleep, the higher-frequency activity that is associated with alertnessor excitement, and the alpha rhythm that dominates the waking record inthe relaxed state, are replaced by a characteristic cyclic sequence of changesthat constitute the focus of a new specialty devoted to sleep physiology, inwhich the EEG is used to identify different stages of sleep.
1.5.2 Electromyography
Electromyography is the study of the electrical activity of muscle; clinicalelectromyography (or EMG) is the name applied to the investigation of theelectrical activity of skeletal muscle with extracellular electrodes.EMG provides important information on the physiological status of skele-
tal muscle and its nerve supply. For instance, in the case of muscle paralysis,it allows identification of the site of the lesion, that is, within the brain (up-per motor neuron) or spinal cord (lower motor neuron), its axon, the endplate, and muscle fiber.A normally innervated muscle shows no electrical activity at rest; when
voluntarily or reflexly contracted it produces action potentials. Followingdenervation, a muscle is paralyzed. After a while, the individual musclefibers start to contract and relax independently (i.e., to fibrillate), producinga rhythmic action potential called fibrillation waves. These random and asyn-chronous contractions produce no net muscle tension, and they continue as

1.5. BIOPOTENTIALS: EXAMPLES AND USES 31
Figure 1.15: EEG during sleep: the EEG changes that occur as a humansubject goes to sleep. The calibration marks on the right represent 50 µV .

32 CHAPTER 1. CURRENTS AND VOLTAGES IN BIOLOGY
Table 1.3: EEG Waveform TerminologyWave Frequency (Hz) Remarks
Parietal-occipital; associated withα 8-13 the awake and relaxed subject;
prominent with eyes closedβ 18-30 More evident in frontal-parietal
leads; seen best when α-wave is blockedAssociated with normal sleep and
δ 1-3.5 present in children < 1-year old;also seen in organic brain disease
θ 4-7 Parietal-temporal; prominent inchildren 2-5 years old.
Waxing and waning of a sinusoidσ (sleep spindle) 12-14 having an envelope that resembles
a spindle; seen during sleep.“Spike and wave” ≈ 3 Spike followed by rounded wave;
associated with petit mal epilepsy.visually evoked, low-amplitude, occipital wave,
λ transient resulting from recognitionof a new retinal image.
V (vertex-wave) transient spike about 150-250 ms in durationrecorded over the vertex.
V -wave followed by a spindle;K− complex transient often seen in sleep and in
response to auditory stimulus
long as there is muscle tissue present and denervation persistent. Fibrillationwaves signal that the nerve supply has been interrupted.
To comprehend various waveforms obtained in EMG, it is necessary tohave an understanding of neuromuscular physiology, which is concerned withthe manner in which muscular contraction occurs. The following accountprovides the essential details.
The contractile unit of skeletal muscle is the muscle fiber, which is asingle cylindrical cell. When stimulated, the fiber is capable of contractingand developing a force. A muscle consists of parallel bundles (fascicles) ofmuscle fibers. It is a nerve bundle or nerve trunk that conveys excitatoryimpulses from the central nervous system to a target muscle. Each nerve fiberis normally myelinated, but at its terminal end it becomes unmyelinated.Also at the end the nerve fiber branches and each branch contacts a single

1.5. BIOPOTENTIALS: EXAMPLES AND USES 33
(specific) muscle fiber within the whole muscle.
The set of muscle fibers activated by one motor neuron constitute a motorunit. The number of fibers in a motor unit may be small (say around 5) formuscles with finely graded performance, or conversely they may be large (sayaround 150) for muscles requiring less precision.
The mechanism whereby the motor neuron stimulates its target mus-cle is not electrical but depends, instead, on a chemically mediated junctioncalled the Neuromuscular Junction. When the nerve action potential reachesthe specialized neuromuscular junction, a quantum of chemical transmitter(acetylcholine, ACh) is released. These diffuse to the postjunction membrane,where it complexes with receptors, resulting in permeability changes associ-ated with the depolarization of the postjunctional membrane. This localizeddepolarization initiates an action potential that is propagated over the entiremuscle fiber. The transmitter is quickly neutralized by acetylcholinesterase.
Figure 1.16: The position of endings of motor axon on muscle fiber, showingportion (a) as a small rectangle. (c) Schematic drawing from electron micro-graphs of a longitudinal section through the muscle fiber. 1, Terminal axonmembrane; 2, ”basement membrane” partitioning the gap between nerve andmuscle fiber; 3, folded postsynaptic membrane of muscle fiber.

34 CHAPTER 1. CURRENTS AND VOLTAGES IN BIOLOGY
The EMG can be recorded in several ways: (1) via surface electrodes and(2) depth electrodes.
In the former, two disk electrodes are placed on the surface of the skinalong the axis of a contracting skeletal muscle. The voltage appearing be-tween the electrodes is the algebraic sum of all the action potentials of thecontracting and recovering muscle fibers between the electrodes. The fre-quency of the action potentials ranges from zero at rest to several hundred persecond during a maximal contraction. Although this noninvasive technique isof value in kinesiology studies, it is too imprecise to diagnose neuromusculardiseases.
Figure 1.17: EMG technique: the use of needle electrodes
In depth recordings, needle electrodes are inserted into a muscle, as shownin the figure. It is convenient to use a loudspeaker to provide aural monitoringsince the diagnostic information is contained in waveform and repetition rate.With a little experience, the ear can be trained to detect normal motor unitaction potentials, which produce a thumping sound; fibrillation potentialsgive a characteristic ticking, clicking, or crackling sound. Although it is easyto recognize these and other characteristic waveforms, considerable skill and

1.6. BIOELECTRODES 35
experience are needed to assess their significance in terms of the presence ofneuromuscular disease.
1.6 Bioelectrodes
In previous sections, we studied how biopotentials are generated, and prop-agated to achieve complex targets making life possible. We also observedthat biopotentials could be measured noninvasively, and be used in thediagnosis/treatment of diseases. In this section, our focus is the inter-face(bioelectrodes) between biopotentials and our measuring/therapeutic de-vices.The electrode actually carries out a transduction function, because cur-
rent is carried in the body by ions such as k+, K+ and Cl−, whereas it iscarried in the electrode and its lead wires by electrons. Thus the electrodemust serve as a transducer to change an ionic current into an electroniccurrent, and vice-versa.Biopotential electrodes are given careful consideration in medical instru-
mentation. Often they measure tiny and complex signals in the harsh envi-ronment of the human body. Their performance is often affected by patientmotion and tension. Noise and interference abound.Furthermore, they comein direct contact with the patient and thus raise safety issues. They oftenpose problems for users and maintenance personnel because they are oftensubject to physical wear and abuse. Accuracy and calibration become criti-cal, because the data being measured may be used to diagnose disease andprescribe treatment.
1.6.1 Electrode-Electrolyte Interface
When a piece of metal (C) is immersed in an aqueous solution, the followingchemical reaction starts immediately:
C C+ + e, (1.36)
assumming the meatal under consideration is a uni-valent one.Initially, the reaction goes predominantly either to the left or to the right,
depending on the concentration of cations in the solution and the equilibriumconditions for that particular reaction. The local concentration of cations inthe Solution at the interface changes, which affects the anion concentrationat this point as well. The net result is the electrolyte surrounding the metalis at a different electric potential from that of the electrode.

36 CHAPTER 1. CURRENTS AND VOLTAGES IN BIOLOGY
Figure 1.18: Electrode-Electrolyte Interface. “e” represents (negativelycharged) electrons.
The equivalent circuit for such an electrode in contact with an electrolyteis shown in Fig. 1.19.
1.6.2 Electrode-Skin Interface
When biopotentials are recorded from the surface of the skin, we must con-sider an additional interface (the interface between the electrode-electrolyteand the skin), in order to understand the behaviour of the electrodes. Incoupling an electrode to the skin, we generally use a transparent electrolytegel containing Cl− as the principal anion to maintain good contact. Alter-natively, we may use an electrode crearn, which contains Cl−. The interfacebetween this gel and the electrode is an electrode-electrolyte interface, asdescribed above. However the interface between the electrolyte and the skinis different and requires some explanation.

1.6. BIOELECTRODES 37
Figure 1.19: Equivalent circuit for the Electrode-Electrolyte Interface. Ehcis the half-cell potential. Cd is the electrode capacitance due to the chargebilayer. Rd is the leakage resistance. Rs is the series resistance associatedwith the resistance of the electrolyte.
Skin
Figure 1.20 shows a cross-sectional diagram of the skin. The skin consists ofthree principal layers that surround the body to protect it from its environ-ment and that also serve as appropriate interfaces. The outermost layer, orepidermis, plays the most important role in the electrode-skin interface. Thislayer, which consists of sublayers, is constantly renewing itself. Cells divideand grow in the deepest layer, the stratum germinativurn, and are displacedoutward as they grow by the newly forming cells underneath them. As theypass through the stratum granulosurn, they begin to die and lose their out-ward journey, they degenerate further into layers of flat keratinous materialthat forms the stratum corneum, or horny layer of dead material on the skinsurface. These layers are constantly being wom off and replaced at the stra-tum granulosum.by new cells. The epidermis is thus a constantly changinglayer of the skin, the outer surface of which consists of dead material thathas different electrical characteristics from live tissue.
The deeper layers of the skin contain the vascular and nervous compo-nents of the skin as well as the sweat glands, sweat ducts, and hair follicles.These layers are similar to other tissues in the body and, with the exceptionof the sweat glands, do not bestow any unique electrical characteristics onthe skin.

38 CHAPTER 1. CURRENTS AND VOLTAGES IN BIOLOGY
Figure 1.20: Cross section of the skin.
Figure 1.21: Equivalent circuit for the electrode-electrolyte-skin interface

1.6. BIOELECTRODES 39
Equivalent Circuit
To represent the electric connection between an electrode and the skin throughthe agency of electrolyte gel, our equivalent circuit of Fig. 1.19 must beexpanded, as shown in Fig. 1.21. We can consider the epidermis as a mem-brane semipermeable to ions, giving rise to the potential difference Ese Theunwanted effect of the skin on our measurements can be reduced by removingthe stratum corneum (see Fig. 1.20) under the electrode. There are manyways to do this, ranging ftom vigorous rubbing with a pad soaked in acetoneto abrading the stratum corneurn with sandpaper to puncture it.When the stratum corneum abraded, the equivalent circuit of the electrode-
electrolyte-skin interface can be represented by the circuit in Fig. 1.19 withRs now representing the series resistance of the electrolyte as well as theeffective skin resistance.
1.6.3 Body-Surface Recording Electrodes
One of the most frequently used forms of biopotential sensing electrodes isthe metal plate electrode. In its basic form, it consists of a metallic conductorin contact with the skin. An electrolyte gel is used to establish and maintainthe contact.A common variety of metal-plate electrode is the metal disk. This device
can be used as chest electrode for recording the ECG. It is also frequentlyused in cardiac monitoring for long-term recordings. In these applicationsthe electrode is often fabricated from a disk of Ag that may or may not havean electrolytically deposited layer of AgCl on its contacting surface. It iscoated with electrolyte gel and then pressed against the patient’s chest wall.This style of electrodes is also popular for surface recording of EMG andEEG. Electrodes used in monitoring EMGs or EEGs are generally smaller indiameter than those used in recording ECGs.Economics and safety necessarily plays an important part in determin-
ing what materials and apparatus are used in hospital administration andpatient care. The trend is to turn to pre-gelled, disposable electrodes withthe adhesive already in place. These devices are ready to be applied to thepatient and need not be cleaned for reuse. This minimises the amount oftime that personnel must devote to the use of these electrodes. They arealso superior in infection control.A modification of the metal-plate electrode that requires no straps or
adhesives for holding it in place is the suction electrode. Such electrodesare frequently used in electrocardiography. They consist of a hollow metalliccylindrical electrode that makes contact with the skin at its base. An ap-

40 CHAPTER 1. CURRENTS AND VOLTAGES IN BIOLOGY
Figure 1.22: Body-surface electrodes: (a) metal-plate electrode, (b) metal-disk electrode, (c) disposable foam-pad electrodes.
Figure 1.23: Metallic suction-cup electrode.

1.6. BIOELECTRODES 41
propriate terminal for the lead wire is attached to the metal cylinder, and arubber suction bulb fits over its over other base.Another form of an electrode is called a floating electrode. The actual
electrode element or metal disk is recessed in a cavity so that it does notcome in contact with the skin itself. Instead, the element is surrounded byelectrolyte gel in the cavity. This cavity does not move with respect to themetal disk, so that it stabilises the electrode-electrolyte interface, reducingartifacts.
1.6.4 Internal Electrodes
Electrodes can also be used within the body to detect biopotentials. Theycan take the form of percutaneous electrodes, in which the electrode itself orthe lead wire crosses the skin, or they may be entirely internal electrodes,in which the connection is to an implanted electronic circuit such as a ra-diotelemetry transmitter. These electrodes differ from body-surface elec-trodes differ from body-surface electrodes in that they do not have to contendwith the elcctrolyte-skin interface and its associated limitations. Further noelectrolyte gel is required to maintain this interface, because extracellularfluid is present.Figure 1.24 shows different types of percutaneous needle and wire elec-
trodes. The basic needle electrode consists of a solid needle, usually made ofstainless steel, with a sharp point. The shank of the needle is insulated witha coating such as an insulating varnish; only the tip is left exposed. A leadwire is attached -to the other end of the needle, and the joint in encapsulatedin a plastic hub to protect it. This is often used in EMG. Some variations ofneedle electrodes are shown in Fig. 1.24 (b) and (c).The needle electrodes just described are not suitable for long term mea-
surements, because their stiffness and size make them uncomfortable for long-term implementation. When chronic recordings are required, percutaneous,wire electrodes are more suitable. A fine wire, often made of stainless steel,is insulated with an insulating varnish to within a few millimeters of the tipand is introduced through the skin as shown in Fig. 1.24(d).

42 CHAPTER 1. CURRENTS AND VOLTAGES IN BIOLOGY
Figure 1.24: Needle electrodes for percutaneous use: (a) insulated needle,(b) coaxial needle, (c)bipolar coaxial (d), (e) fine wire + hypodermic needle(f) fine wire electrode

Chapter 2
Bio-sensors andInstrumentation
2.0.5 Generalized Medical Instrumentation System
Every instrumentation system has at least some of the functional compo-nents shown in Fig. 2.1. The primary flow of information is from left toright. Elements and relationships depicted by dashed lines are not essen-tial. The major difference between this system of medical instrumentationand conventional instrumentation systems is that the source of the signals isliving tissue or energy applied to living tissue.
MEASURAND
The physical quantity, property, or condition that the system measures iscalled the measurand. The accessibility of the measurand is important be-cause it may be internal (blood pressure), it may be on the body surface(electrocardiogram potential), it may emanate from the body (infrared radi-ation), or it may be derived from a tissue sample (such as blood or a biopsy)that is removed from the body. Most medically important measurands canbe grouped in the following categories: biopotential, pressure, flow, dimen-sions (imaging), displacement (velocity, acceleration, and force), impedance,temperature, and chemical concentrations. The measurand may be localizedto a specific organ or anatomical structure.
SENSOR
Generally, the term transducer is defined as a device that converts one formof energy to another. A sensor converts a physical measurand to an electricoutput. The sensor should respond only to the form of energy present in the
43

44 CHAPTER 2. BIO-SENSORS AND INSTRUMENTATION
measurand, to the exclusion of all others. The sensor should interface withthe living system in a way that minimizes the energy extracted, while beingminimally invasive. Many sensors have a primary sensing element such as adiaphragm, which converts pressure to displacement, A variable-conversionelement, such as a strain gage, then converts displacement to an electricvoltage. Sometimes the sensitivity of the sensor can be adjusted over a widerange by altering the primary sensing element. Many variable-conversionelements need external electric power to obtain a sensor output,
SIGNAL CONDITIONING
Usually the sensor output cannot be directly coupled to the display device.Simple signal conditioners may only amplify and filter the signal or merelymatch the impedance of the sensor to the display. Often sensor outputs areconverted to digital form and then processed by specialized digital circuitsor a microcomputer. For example, signal filtering may reduce undesirablesensor signals. It may also average repetitive signals to reduce noise, or itmay convert information from the time domain to the frequency domain.
OUTPUT DISPLAY
The results of the measurement process must be displayed in a form thatthe human operator can perceive. The best form for the display may benumerical or graphical, discrete or continuous.
2.0.6 Interfering and modifying inputs
Desired inputs are the measurands that the instrument is designed to isolate.Interfering inputs are quantities that indavertently affect the instrument as aconsequence of the principles used to acquire and process the desired inputs.If spatial or temporal isolation of the measurand is incomplete, the interferinginput can even be the same quantity as the desired input. Modifying inputsare undesired quantities that indirectly affect the output by altering theperformance of the instrument itself. Modifying inputs can affect processingof either desired or interfering inputs. Some undesirable quantities can actas both a modifying input and an interfering input.A typical electrocardiographic recording system, shown in Fig. 2.2, will
illustrate these concepts. The desired input is the electrocardiographic volt-age v, that appears between the two electrodes on the body surface.One interfering input is 60-Hz noise voltage induced in the shaded loop by
environmental ac magnetic fields. The desired and the interfering voltages are

45
Figure 2.1: Generalized medical instrumentation system.The sensor convertsenergy or information from the measurand to another form (usually electric).This signal is then processed and displayed so that humans can perceive theinformation. Elements and connections shown by dashed lines are optionalfor some applications.

46 CHAPTER 2. BIO-SENSORS AND INSTRUMENTATION
Figure 2.2: Desired, interfering and modifying inputs.
in series, so both components appear at the input to the differential amplifier.Also, the difference between the capacitively coupled displacement currentsflowing through each electrode and the body to ground causes an interferingvoltage to appear across Zbody, between the two electrodes and two interferingvoltages across Z1, and Z2, the electrode impedances.An example of a modifying input is the orientation of the patient cables.
If the plane of the cables is parallel to the ac magnetic field, magneticallyintroduced interference is zero. If the plane of the cables is perpendicular tothe ac magnetic field, magnetically introduced interference is maximal.The effects of most interfering and modifying inputs can be reduced or
eliminated either by altering the design of essential instrument componentsor by adding new components designed to offset the undesired inputs. Thesecan be achieved via the methods of negative feedback, signal filtering andopposing inputs. Another method, that may have limited use, is the methodof choosing components that are only sensitive to desired inputs.
2.1 Biomedical Transducers
There are numerous types of transducers currently being used in clinical use.In the following we briefly look at a few transducers, and their principle oftransduction.

2.1. BIOMEDICAL TRANSDUCERS 47
The signal tranduction can be based on one of the following (non-exhaustive)principles:
• change of resistance due to the measurand,• change of inductance due to the measurand,• change of capacitance due to the measurand,• electromagnetic measurements (eg. Radiation Thermometry, Photo-electric measurements),
• piezoelectricity (ultrasound measurements),• thermocouples.
2.1.1 Inductive Transducers
Inductive sensors are based upon the following three principles:
• Change of the self-inductance of a coil,• Change of the mutual inductance,• The production of eddy currents.
Sensors Based on Self Inductance
The self-inductance L of a coil with N -turns is given by:
L = GN2µ, (2.1)
where µ is the magnetic permeability of the material in and around the coiland G is a constant based on the geometry of the system.
Example: Detecting the pulse and respiration
An extensible inductor mounted in a neck band is shown in Fig. 2.3.A zigzag wire stitched to the neck band functions as the inductance thatdetermines the resonant frequency of a resonant circuit. Thus, respirationrelated and pulse related extensions of the circumference of the neck is sensedas changes in the resonant frequency.Biomedical Applications:(a) Detecting the pulse and respiration (b) Detecting the tremor of Parkin-
son’s Disease (c) Catheter-tip blood pressure transducer (d) Measuring Car-diac Dimensions (e) Blood Flow Meters

48 CHAPTER 2. BIO-SENSORS AND INSTRUMENTATION
Figure 2.3: Self-inductance based transducers.

2.1. BIOMEDICAL TRANSDUCERS 49
2.1.2 Capacitive Transducers
Capacitive Displacement Transducers
A differential capacitor can be used to produce an appreciable imbalance ina bridge circuit for an extremely small physical displacement of the centralplate of the differential capacitor. It consists of two variable capacitors soarranged that they undergo the same change, but in opposite directions.Consider the arrangement in Fig. 2.4
Figure 2.4: Differential capacitor tranducer
C1 =²A
d+ x(2.2)
C2 =²A
d− x (2.3)
To obtain an output voltage, we can subtract or divide V1, and V2. Wehave,
V1 = VC2
C1 + C2= V
d+ x
2d(2.4)

50 CHAPTER 2. BIO-SENSORS AND INSTRUMENTATION
V2 = VC1
C1 + C2= V
d− x2d
(2.5)
V1 − V2 =V
dx (2.6)
Biomedical Applications
• Blood pressure measument• In microphones to record cardiac sounds (phonocardiography)
ADVANTAGES
(1) Require extremely small forces to operate.(2) Extremely sensitive.(3) Excellent frequency response.(4) High input impedance.(5) High resolution (of the order of a few µm s).(6) Can be operated in the presence of stray magnetic fields.
DISADVANTAGES
(1) Edge-effects lead to nonlinear behavior.(2) High output impedance.(3) Affected by stray capacitances.
2.1.3 Radiation Thermometry
Radiation thermometry is based on the known relationship between the sur-face temperature of an object and its radiant power. Medical Thermographyis a technique of mapping the temperature distribution of the body based onthe radiant power.Every object with a temperature above 0 K radiates electromagnetic en-
ergy, the amount of which is governed by the temperature and the physicalproperties of the object. The total radiant power Wt of a body at a temper-ature of T K is given by the Stefan - Boltzmann law:
Wt = ²σT4 (W/m2), (2.7)
where s is the Stefan - Boltzmann constant and ² is the emissivity, i.e. ameasure of the extent to which a surface deviates from a black body. Notethat for a blackbody, ² = 1.

2.1. BIOMEDICAL TRANSDUCERS 51
The amount of power Wλ radiated at a wavelength λ can be obtained viathe Plank’s Radiation Law to be:
Wλ = Cλ−5(²D/λT − 1)−1, (2.8)
Where C and D are constants.In total radiation thermometry, the total radiant power Wt emanated
from a body is measured. The instrument is designed to receive the maximumamount of radiation at the widest range of wavelengths possible.In Partial Radiation Thermometry, the radiant power Wλ of the body at
a given wavelength is measured.
Biomedical Applications
:
• Infrared tympanic temperature measuring system,• Estimating the depth of tissue destruction in burn patients,• Detecting peripheral circulatory disorders,• Detecting breast cancers.

52 CHAPTER 2. BIO-SENSORS AND INSTRUMENTATION

Chapter 3
Medical Imaging: Part-I
Structural Imaging
In structural imaging, anatomical details or in other words the structureof the internal organs and tissues, are imaged. The introduction of the X-raycomputed tomography (CT-scan) in the 1970s followed by the emergence ofthe Magnetic Resonance Imaging (MRI) in the 1980s has made it possible tovisualize internal details with a resolution better than 1mm.
Functional Imaging
In functional imaging, the biochemical or electrochemical functions of theinternal organs and tissues are imaged. Some of the examples are: PositronEmission Tomography (PET), Single Photon Emission Computed Tomogra-phy (SPECT), functional magnetic resonance imaging (fMRI), and Neuro-magnetic/Neuroelectric Imaging of the brain.
Developing and analyzing techniques for Functional Imaging is an ex-tremely active research topic, especially in the areas of fMRI and neuromag-netic imaging. There is also a great deal of current interest in combiningfunctional images with structural ones to form a composite display.
3.1 Image Reconstruction from Projections
Imaging techniques such as the X-ray computed tomography (widely knownas the CATSCAN or CT-scan), ultrasound tomography, nuclear emission to-mography and the magnetic resonance imaging are based on the principleof image reconstruction from projections. The 1979 Nobel prize in medicinehas been awarded for work on medical image reconstruction based on mul-
53

54 CHAPTER 3. MEDICAL IMAGING: PART-I
tiple X-ray projections. These ideas have revolutionized the area of medicaldiagnostic imaging since then.
The image reconstruction from projections is based on the ProjectionSlice Theorem.
3.1.1 The Projection Slice Theorem
Consider a two-dimensional function f(x, y), which may be representing aproperty of a cross section of the object to be imaged. For instance, f(x, y)may be the density of material at the point (x, y) inside a rock or the atten-uation of X-rays at point (x, y) within the human head.
Let the one-dimensional projection, in the direction θ , of the object func-tion f(x, y) be pθ(t), and the two-dimensional Fourier transform of f(x, y)be F (u, v) (Fig. 3.1). The projection slice theorem states that the one-dimensional Fourier trasnform Pθ(ω) of the projection pθ(t) is given by theone dimensional slice θ of F (u, v).
NOTE: f(x, y) and its Fourier Transform F (u, v) are related by:
F (u, v) =
Z ∞
−∞
Z ∞
−∞f(x, y)e−j(ux+vy)dxdy (3.1)
f(x, y) = (1/2π)2Z ∞
−∞
Z ∞
−∞F (u, v)ej(ux+vy)dudv. (3.2)
Also, the slice pθ(t) and its 1 − D Fourier transform Pθ(ω)are related through,
Pθ(ω) =
Z ∞
−∞pθ(t)e
−jωtdt (3.3)
pθ(t) = (1/2π)
Z ∞
−∞Pθ(ω)e
jωtdω. (3.4)
According to the Projection Slice Theorem, pθ(t) and the sliceof F (u, v) at an angle θ are related by,
Pθ(ω) = F (u, v)|θ = F (u, u tan θ) (3.5)

3.1. IMAGE RECONSTRUCTION FROM PROJECTIONS 55
Figure 3.1: Projection Slice Theorem: the basis of modern medical imaging.

56 CHAPTER 3. MEDICAL IMAGING: PART-I
3.1.2 Image Reconstruction from Projections
The Fourier Transform Technique
Fourier slice theorem (or, the projection slice theorem) provides a direct wayof reconstructing the objective function f(x, y) given a sufficient numberof projections. Once we have enough projections to cover the 2D-Fouriertransform of the object, we can obtain the function f(x, y) via a 2D inverseFourier transform.
Figure 3.2: (a) Projection data , (b) Required format.
In order to apply direct Fourier Transform method, a format conversionfrom polar to rectangular of the gathered projection data is needed. Theprocess involved, i.e. some form of interpolation, adds to the computationalcomplexity and the numerical errors of reconstruction.
Back Projection Method
The essense of the back-projection method is shown in Fig. 3.3.
3.2 X-ray Imaging Systems
3.2.1 X-ray tubes
The electrical production of x-rays is only possible under very special condi-tions including a source of electrons, an appropriate target material, a high

3.2. X-RAY IMAGING SYSTEMS 57
Figure 3.3: (The method of back-projection image reconstriction.

58 CHAPTER 3. MEDICAL IMAGING: PART-I
Figure 3.4: Mathematics of the the method of back-projection.

3.2. X-RAY IMAGING SYSTEMS 59
Figure 3.5: Mathematics of the the method of back-projection Continued..

60 CHAPTER 3. MEDICAL IMAGING: PART-I
voltage and a vacuum. The x-ray tube is the device that permits these con-ditions to exist and it consists of a cathode and an anode enclosed within aglass envelope and then encased in a protective housing. Please see Fig. 3.6.
Figure 3.6: X-ray Assembly
The Cathode Assembly
The function of the cathode is to produce a thermionic cloud, conduct thehigh voltage to the gap between cathode and anode and focus the electronstream as it heads for the anode. (Fig. 3.7).
The filament is made of thin thoriated tungsten wire. It is set in thecathode assembly within the focusing cup. Tungsten is chosen because of itshigh melting point (3, 3700C) and because it is difficult to vaporize (turn intogas). The function of the filament is to provide sufficient resistance to theflow of electrons so that the heat produced will cause thermionic emissionto occur. When the high voltage is activated at exposure the entire cloudis available to be driven toward the anode target where x-ray photons willbe produced. This provides many more times the number of electrons thanwould be available from a cold cathode.

3.2. X-RAY IMAGING SYSTEMS 61
Figure 3.7: X-ray Cathod Assembly
62 CHAPTER 3. MEDICAL IMAGING: PART-I
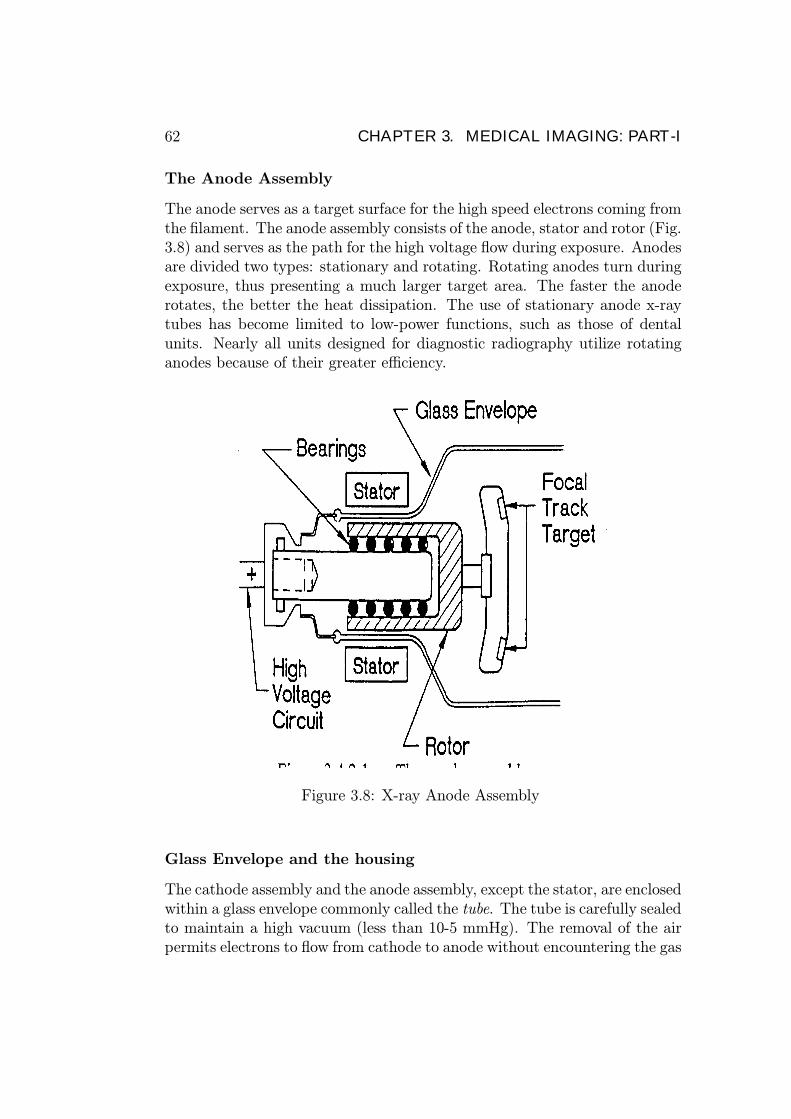
The Anode Assembly
The anode serves as a target surface for the high speed electrons coming fromthe filament. The anode assembly consists of the anode, stator and rotor (Fig.3.8) and serves as the path for the high voltage flow during exposure. Anodesare divided two types: stationary and rotating. Rotating anodes turn duringexposure, thus presenting a much larger target area. The faster the anoderotates, the better the heat dissipation. The use of stationary anode x-raytubes has become limited to low-power functions, such as those of dentalunits. Nearly all units designed for diagnostic radiography utilize rotatinganodes because of their greater efficiency.
Figure 3.8: X-ray Anode Assembly
Glass Envelope and the housing
The cathode assembly and the anode assembly, except the stator, are enclosedwithin a glass envelope commonly called the tube. The tube is carefully sealedto maintain a high vacuum (less than 10-5 mmHg). The removal of the airpermits electrons to flow from cathode to anode without encountering the gas

3.2. X-RAY IMAGING SYSTEMS 63
atoms of air and greatly increases the efficiency of the tube’s operation. Atthe point where the primary x-ray beam exits the glass envelope, a windowsegment is constructed. In some tubes this is simply a thinner section of theenvelope.
Figure 3.9: X-ray housing
Modem x-ray tubes are mounted inside a protective housing (fIG. 3.9).The housing controls leakage and scatter radiation, isolates the high voltagesand provides a means to cool the tube. It is composed of cast steel and isusually lined with lead. The housing is equipped with a window to permitunrestricted exit for the useful photons from the tube.A special dielectric oil is used to fill the space between the tube and the
housing. The functions of oil is to provides electrical insulation and also tocool the tube. The oil may be routed through a recirculation system (heatexchanger) to further cool the tube.
3.2.2 X-ray production
X-ray photons are produced when highspeed electrons from the cathode strikean anode target.There are two types of target interactions that can produce diagnostic-
range x-ray photons: bremsstrahlung interactions and characteristic interac-tions. The interaction which will occur depends on the photon energy andthe binding energy of the electron shells of the atom.

64 CHAPTER 3. MEDICAL IMAGING: PART-I
Figure 3.10: Bremssssss
Bremsstrahlung Interactions
Bremsstrahlung (or brems) interactions are named by the German word forbraking or slowing (Fig. 3.10). Brems interactions may occur only whenthe incident electron interacts with the force field of the nucleus. The in-cident electron must have enough energy to pass through the orbital shellsand approach the nucleus of the atom. Because atomic nuclei have a positivecharge and the incident electron has a negative charge, there is a mutual at-traction between them. When the incident electron gets close to the nucleus,the powerful nuclear force field is much too great for the electron to pene-trate. Instead, the force field causes the incident electron to slow down (orbrake) and divert the electron’s course. The energy lost during the brakingis emitted as an x-ray photon. These emissions are called bremsstrahlungphotons.
A single incident electron can cause numerous brems interactions in manydifferent atoms before losing enough energy to become included in the currentflow.

3.2. X-RAY IMAGING SYSTEMS 65
Figure 3.11: characteristic interactions
66 CHAPTER 3. MEDICAL IMAGING: PART-I
Characteristic Interactions
Characteristic Interactions may occur only when the incident electron inter-acts with an inner-shell electron. The incident electron must have enoughenergy to knock an inner-shell electron from orbit, thereby ionizing the atom.The incident electron will usually continue but in a slightly different direction.More important is the fact that the electron ’hole’ that has been created inthe inner shell makes the atom unstable. An electron from another shell willimmediately drop into the ’hole’. (Please figure 3.11). The energy differencebetween the two shells is emitted as an x-ray photon. These emissions arecalled characteristic photons because their energy is exactly the differencebetween the binding energy of the outer and inner shells between which theelectron dropped (thus very predictable, unlike brems photons). After anouter shell electron has dropped to fill the ’hole’, another electron will dropto fill the ’hole’ it left and so on until only the outermost shell is missing anelectron. This process is called a characteristic cascade.
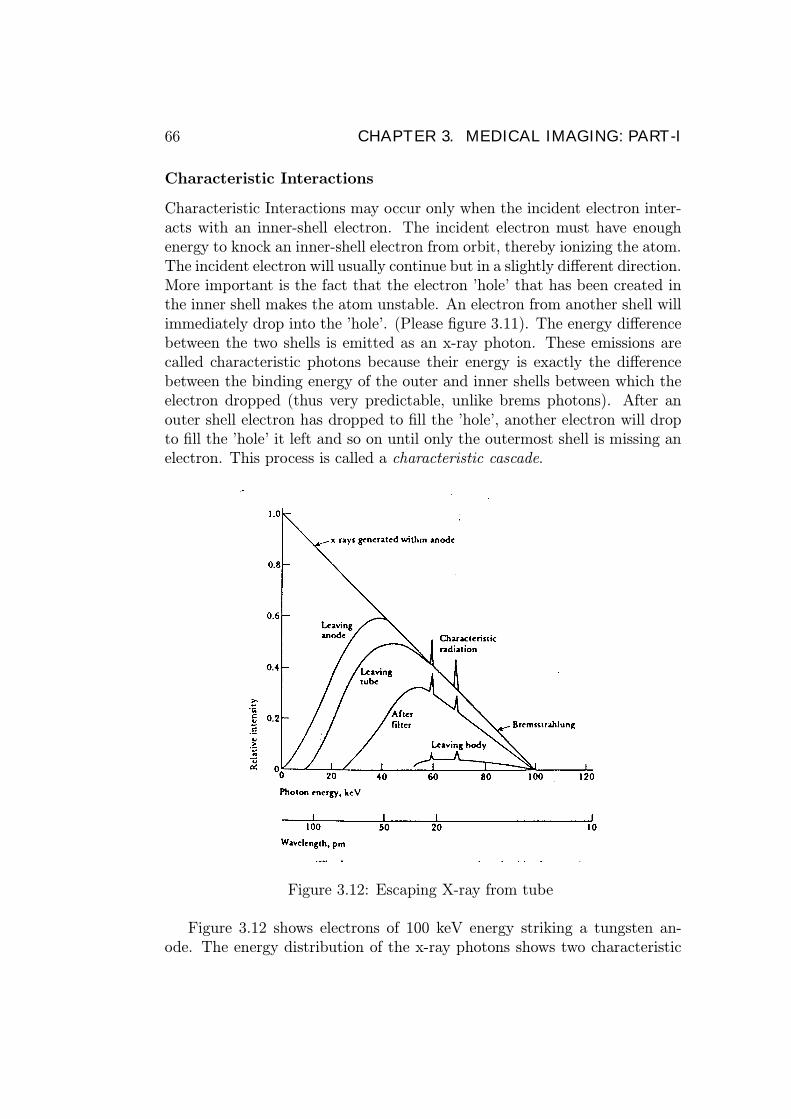
Figure 3.12: Escaping X-ray from tube
Figure 3.12 shows electrons of 100 keV energy striking a tungsten an-ode. The energy distribution of the x-ray photons shows two characteristic
3.3. MAGNETIC RESONANCE IMAGING 67
radiation peaks at 58 keV and 68 keV (K-shell and L-shell replacement elec-trons), the bremsstrahlung, and the absorption of the lower energies. Notethat the lowest energy x-rays are absorbed in the anode metal and the tube.An aluminium filter further reduces the low energy x-rays that do not passthrough the body and would just increase the patient dose. Only the higherenergy x-rays are capable of penetrating the body and contributing to thefilm darkening required for the picture.
3.3 Magnetic Resonance Imaging
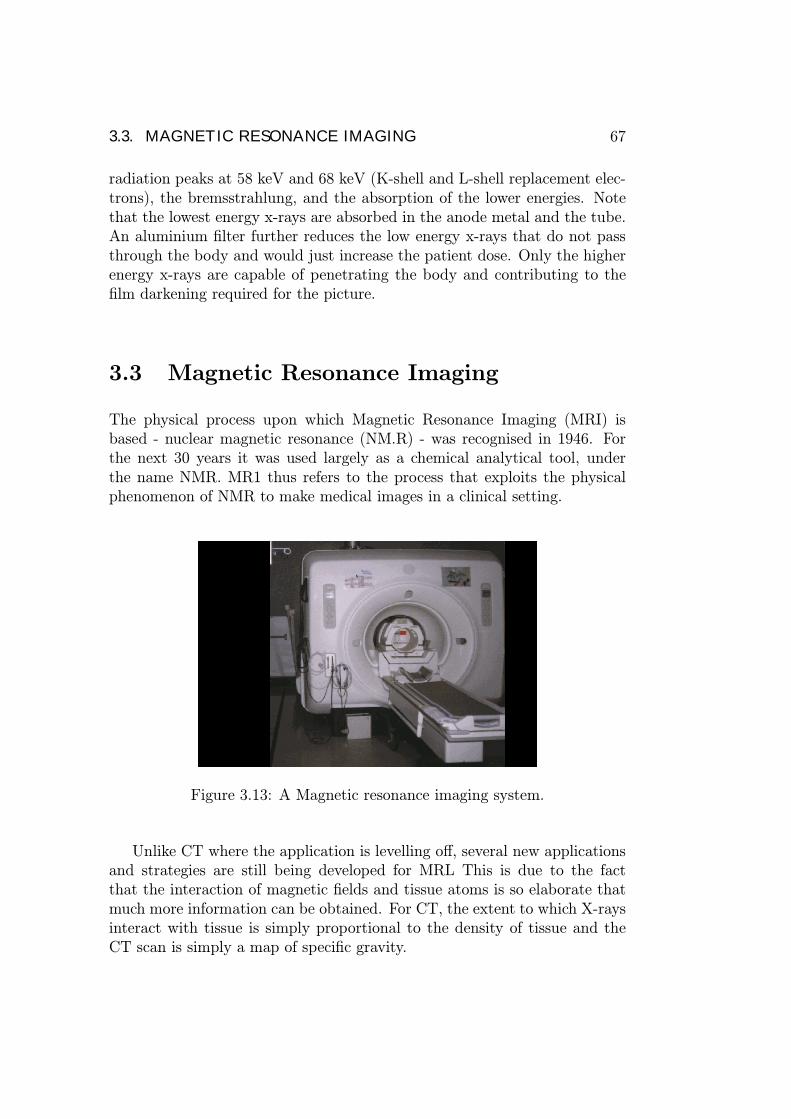
The physical process upon which Magnetic Resonance Imaging (MRI) isbased - nuclear magnetic resonance (NM.R) - was recognised in 1946. Forthe next 30 years it was used largely as a chemical analytical tool, underthe name NMR. MR1 thus refers to the process that exploits the physicalphenomenon of NMR to make medical images in a clinical setting.
Figure 3.13: A Magnetic resonance imaging system.
Unlike CT where the application is levelling off, several new applicationsand strategies are still being developed for MRL This is due to the factthat the interaction of magnetic fields and tissue atoms is so elaborate thatmuch more information can be obtained. For CT, the extent to which X-raysinteract with tissue is simply proportional to the density of tissue and theCT scan is simply a map of specific gravity.

68 CHAPTER 3. MEDICAL IMAGING: PART-I
Figure 3.14: A magnetic resonance image of the brain
3.3.1 An Example of Magnetic Resonance
If we start with a compass needle at rest, pointing north, and then tapone tip of the needle with our finger, the needle first deflects away fromnorth but is then drawn back toward its original northerly orientation. Itovershoots north, and continues in a to-and-fro oscillatory movement, untilall the energy received from the finger is lost to mechanical friction and airdrag. The frequency of this oscillatory movement is the needle’s naturalfrequency, which depends both on the characteristics of the compass needleand on the strength of the external field. The stronger the external field, thegreater the natural frequency.From this example, we have the essential elements of MRI:
• A compass needle, when placed in a magnetic field, aligns itself withthe field.
• When stimulated, the compass needle oscillates at a frequency propor-tional to the strength of the magnetic field.
• In a gradient magnetic field that varies in strength in a known manner,the location of the compass needle can be deduced from its frequencyof oscillation.
If we extend the above example by applying a series of very light taps,evenly spaced, the compass needle would again absorb energy and be de-flected from true north. We would also notice that at one particular fre-quency, the compass would absorb energy most efficiently (and be deflected

3.3. MAGNETIC RESONANCE IMAGING 69
away from north by the largest angle). This frequency occurs at the nat-ural frequency of the compass needle. This is the phenomenon of resonance.At resonance, the compass needle absorbs energy most efficiently from anexternal source.
3.3.2 Magnetic Nuclei: the “compass needle” in biol-ogy
The equivalent of the magnetic needle in biology is the magnetic nuclei ofrelevant atoms. Among the elements having magnetic nuclei, hydrogen is ofthe greatest biological interest, both because it has a highly magnetic nucleusand because it makes up two-thirds of the atoms in living tissues. In MRI,it is largely the hydrogen in tissue water that is imaged.
In the hydrogen nucleus, the positive charge is located at some distanceaway from the centre of the nucleus, but still within the volume of the nucleus.Further, the hydrogen nucleus is physically spinning about an axis, with anunknown rate of rotation, and it does not slow down due to friction. Thus asthe nucleus spins, the positive charge revolves in an approximately circularpath, much as an electron in a loop or wire. This movement of the positivecharge produces a magnetic field. (Fig. /refspin).
Figure 3.15: A: A compass noodle is an example of a permanent magnet.B: Magnetic field produced by a loop current. C: In the hydrogen nucleus,movement of electric charge also creates a magnetic field.
The most important property of the spinning nucleus is that when it issubjected to a magnetic field it may also begin to wobble. This wobbling,

70 CHAPTER 3. MEDICAL IMAGING: PART-I
like that of a spinning top when it begins to lose momentum, is actually arotation of the axis of rotation, or precession.
Figure 3.16: Precession of the Hydrogen Nucleus
When the hydrogen nucleus is placed in a strong magnetic field:
• it tends to align with the magnetic field,• has a resonant frequency that is proportional to the external fieldstrength,
• absorbs energy (provided the energy is at the resonant frequency) andsubsequently re-emits this energy.
A fundamental component of the MRI scanner is a means of producinga strong, constant magnetic field. The frequency at which the hydrogennucleus (H+) wobbles in this field is its resonant frequency, known as theLarmor Frequency. This Lamor frequency is about 42.6 MHz in a field offlux density 1 Tesla (T ).In the example of our compass needle, a simple tap of our finger stimu-
lated the needle into oscillation. In MRI, the nucleus of the hydrogen atomis stimulated from outside by radiowaves. For radio waves to be effective instimulating hydrogen nuclei, the frequency of the radio waves must be tunedto the resonant frequency of the nuclei. for a 1 T field, the frequency ofthe wave should be 42.6 MHz. After stimulation by radio waves of the ap-propriate frequency, the hydrogen nuclei (collectively) re-emits the absorbedenergy, again in the form of radio waves and can be detected by a short-waveradio antenna and receiver. In living tissues, this emitted energy falls off overa period of time lasting from perhaps a tenth of a second to a few seconds.

3.3. MAGNETIC RESONANCE IMAGING 71
Since there is a relationship between the magnetic field strength and theresonant frequency of hydrogen nuclei, the MRI scanner creates an artificialgradient field strength across the body to be scanned. In this way the locationof the hydrogen nucleus can be determined by its resonant frequency.
Figure 3.17: Without the external field, nuclear magnetic dipoles in the bodyare randomly distributed, which results in zero net magnetization.
Figure 3.18: When a strong magnetic field is applied, the patient becomes“polar” and a net magnetization develops.
3.3.3 MRI IMAGING: a closer look
The most common method of imaging uses gradients to selectively excite anindividual transverse slice. After excitation, further information is obtained

72 CHAPTER 3. MEDICAL IMAGING: PART-I
by creating new gradients within the slice itself. Finally through computeranalysis the image is created.
Isolation of a Transverse Slice of Tissue
Figure 3.19: The frequency of radiowaves differ with different field strengths.
To isolate a slice, the scanner creates a magnetic gradient longitudinallythrough the body, from head to foot. (Using x, y, and z coordinates, thisis termed the z-axis.).In the presence of this gradient, the hydrogens in thebody become spatially encoded, i.e., there is a relationship between theirresonant frequency and their position in the gradient. There is only oneplane (the x-y plane) of tissue exposed to a field strength of exactly 1 tesla,and when exposed to a radio signal of 42.6 MHz will absorb the energy andbe stimulated.
Localization within the Transverse Slice
At this point, all the nuclei in the plane have the same resonant frequencyand so emit a radio signal of the same frequency. The intensity of the signalwould simply indicate the average signal from all regions of the slice. Tofurther localise the nuclei within the excited slice, new gradients (in differentdirections) are used.

3.3. MAGNETIC RESONANCE IMAGING 73
After the transverse slice of tissue has been isolated and the hydrogens init stimulated, both the head-to-toe z-axis gradient and radiofrequency excita-tion are turned off. A second gradient is then created, this time transverselyacross the body in the x-y plane.
Figure 3.20: The isolated plane of tissue is exposed to a transverse gradientfield strength along the X-axis. Radiowaves emanating from different stripsare now of different frequencies.
The result is that the nuclei in the isolated slice of tissue, which hadall been resonating at the same frequency, now find themselves in magneticfields of varying strengths. The nuclei resonate at new frequencies, whichare higher or lower depending on their positions in the transverse gradientat that instant of time. Again the resonant frequencies of the nuclei arespatially encoded, so that nuclei at one edge of the slice, in the weaker endof the gradient field, resonate at lower frequencies than those at the otheredge, in the stronger field. Thus the excited transverse section of tissue is’sliced’ into parallel strips, the nuclei along any one strip resonating at thesame frequency.
This second magnetic gradient is applied immediately after the originalz-axis gradient is turned off, while the hydrogen nuclei are still ’ringing’ fromtheir initial stimulation. When they take up their new resonant frequenciesin the second gradient, they continue to emit radio-frequency signals withoutfurther stimulation. The frequencies of the signals emitted, however, change

74 CHAPTER 3. MEDICAL IMAGING: PART-I
to correspond to those of the new field strength of the gradient at each left-to-right location, each frequency representing one line across the slice.In MRI electronic frequency analysers are used to analyse the radio signal
radiating from the tissue. This analysis determines which frequencies arebeing radiated from the tissues, and at what intensities. The frequency tellsus the location of the line; the amplitude tells us the total number of hydrogennuclei along that line.The relationship between the Larmor frequency f and the magnetic field
B for H+ nucleus is given by,
f =γ
2πB, (3.6)
where γ is known as the gyromagnetic ratio. The quantity γ/2π for H+ isequal to 42.6 MHz/T .
Excercise: Verify the resonance frequencies shown in Fig.3.20, making useof the indicated magnetic fields. What will be the frequency at which theradio waves are emitted by a strip at the midpoint between the central stripand the far right end, where the flux density is 1.01 T?
Rotation of the Transverse Gradient
To create an image of a plane of tissue, measurements must be made of manylines criss-crossing the plane. Once the data is retrieved from one pulse andrecovered and stored in the computer, ie.- excitation and retrieval processis repeated, starting with the restoration of the z-axis gradient. The sametransverse slice of tissue is again excited by radio frequency energy. After thestimulating pulse, the z-axis gradient is again turned off, and the transversegradient is applied across the isolated slice of tissue, but this time in a slightlydifferent direction.In this way the hydrogen concentration along a new set of parallel strips,
slightly at an angle to the first set, is measured. In the course of scanningone slice of tissue, this process is repeated many times.

3.3. MAGNETIC RESONANCE IMAGING 75
Figure 3.21: During the course of an MRI scan, the transverse gradient isrotated many times, by a few degrees at a time.
Figure 3.22: During the course of an MRI scan, the transverse gradient isrotated many times, by a few degrees at a time. The Image is reconstructedfrom the thousands of intersecting lines.

76 CHAPTER 3. MEDICAL IMAGING: PART-I
Figure 3.23: One major difference between CT and MRI is the appearenceof bone in images. Skull strongly absorbs X-rays (and hence appears brighton CT scans). Skull emits almost no radio signal in MRI (skull appearscomparatively black in MRI images). .

3.3. MAGNETIC RESONANCE IMAGING 77
Example: MRI safety
In an MRI-imaging session, a patient was subjected to a static magnetic fieldof uniform flux density 2.0T. Estimate the maximum voltage gradient thatcan be induced across the walls of a blood vessel carrying flow rates of 10, 5and 2 cm/s.
Figure 3.24: Solution

E492 BIOMEDICAL INSTRUMENTATION ©
Tutorial 01, 2000/2001
1) Figure 1 shows an experimental setup in which a nerve cell stripped of its cytoplasm is filled with a 0.05M KBr solution and immersed in a bath containing 0.15M KC1 solution maintained at 27 °C. Suppose the cell membrane is completely permeable to K+ and Cl− ions, but completely impermeable to Br−. If the system subsequently attains Gibbs-Donnan equilibrium, calculate the equilibrium ionic concentrations and the equilibrium membrane potential Vm for the cell. The volume of the bath is much larger than that of the cell. The universal gas constant (R) and the Faraday’s constant (F) are given by R = 8.314 J/(K mol), and F = 9.65 × 10⁴ C/mol.
2) Suppose that the cell in question 1 is replaced with a freshly excised nerve cell, and the concentrations of the cytoplasm and the ionic bath are meticulously maintained at the values given in Table 1. Draw an equivalent circuit for the cell membrane and calculate the resting membrane potential for the case gK/gNa = 5 and gCl/gNa = 30, where gNa, gK and gCl denote the membrane conductances for Na+, K+ and Cl− respectively.
[K+] mM
[Na+] mM
[Cl-] mM
Cytoplasm (Intracellular Fluid) 405 50 42 Ionic Bath (extracellular fluid) 10 450 540
Table 1 ( b) An action potential is generated in the nerve by current pulses applied to the axon via the external electrode pair A (anode) and C (cathode). What will be the direction(s) of propagation of the generated action potential(s)?
[K+]i = 0.05M [Br−]i = 0.05M
Cell Body
A C
− +
Axon cytoplasm
[K+]o = 0.15 M [Cl−]o = 0.15 M
Ion Bath

3. (a) Intracellular concentrations of Na+, K+ and Cl- ions for a nerve cell are respectively 50, 397 and 40mM. The corresponding extracellular concentrations are 437, 20 and 556mM. Calculate Nernst Equilibrium potentials for each ion species in the nerve. The resting membrane potential of the nerve cell is -73 mV and the steady state membrane specific conductance for Na+, K+ and Cl- ions are respectively given by gK = 3.6 µS/mm2, gNa = 0.10 µS/mm2 and gCl = 5.82 µS/mm2. Estimate the component of the steady state current across the membrane due to the Na+-K+-pump. The universal gas constant is R = 8.314 J/(K mol) and the Faraday's constant is F = 9.65X10⁴ C/mol. Assume that the temperature is 37 0C. (b) In an experimental study, metabolic inhibitors are added to the nerve cell preparation to inactivate the Na+-K+-pump. Describe the effect of pump inactivation on the resting membrane potential and the action potentials initiation.
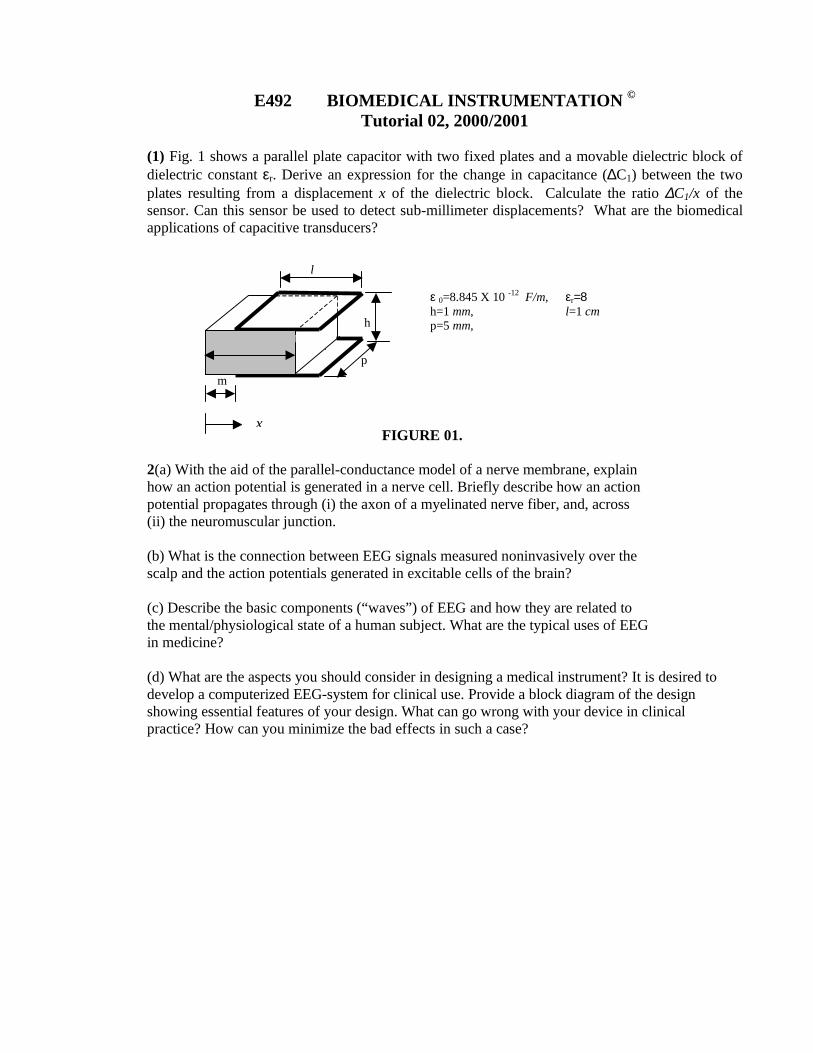
E492 BIOMEDICAL INSTRUMENTATION © Tutorial 02, 2000/2001
(1) Fig. 1 shows a parallel plate capacitor with two fixed plates and a movable dielectric block of dielectric constant εr. Derive an expression for the change in capacitance (∆C1) between the two plates resulting from a displacement x of the dielectric block. Calculate the ratio ∆C1/x of the sensor. Can this sensor be used to detect sub-millimeter displacements? What are the biomedical applications of capacitive transducers?
FIGURE 01. 2(a) With the aid of the parallel-conductance model of a nerve membrane, explain how an action potential is generated in a nerve cell. Briefly describe how an action potential propagates through (i) the axon of a myelinated nerve fiber, and, across (ii) the neuromuscular junction. (b) What is the connection between EEG signals measured noninvasively over the scalp and the action potentials generated in excitable cells of the brain? (c) Describe the basic components (“waves”) of EEG and how they are related to the mental/physiological state of a human subject. What are the typical uses of EEG in medicine? (d) What are the aspects you should consider in designing a medical instrument? It is desired to develop a computerized EEG-system for clinical use. Provide a block diagram of the design showing essential features of your design. What can go wrong with your device in clinical practice? How can you minimize the bad effects in such a case?
h
ε 0=8.845 X 10 -12 F/m, εr=8 h=1 mm, l=1 cm p=5 mm,
m
p
l
x
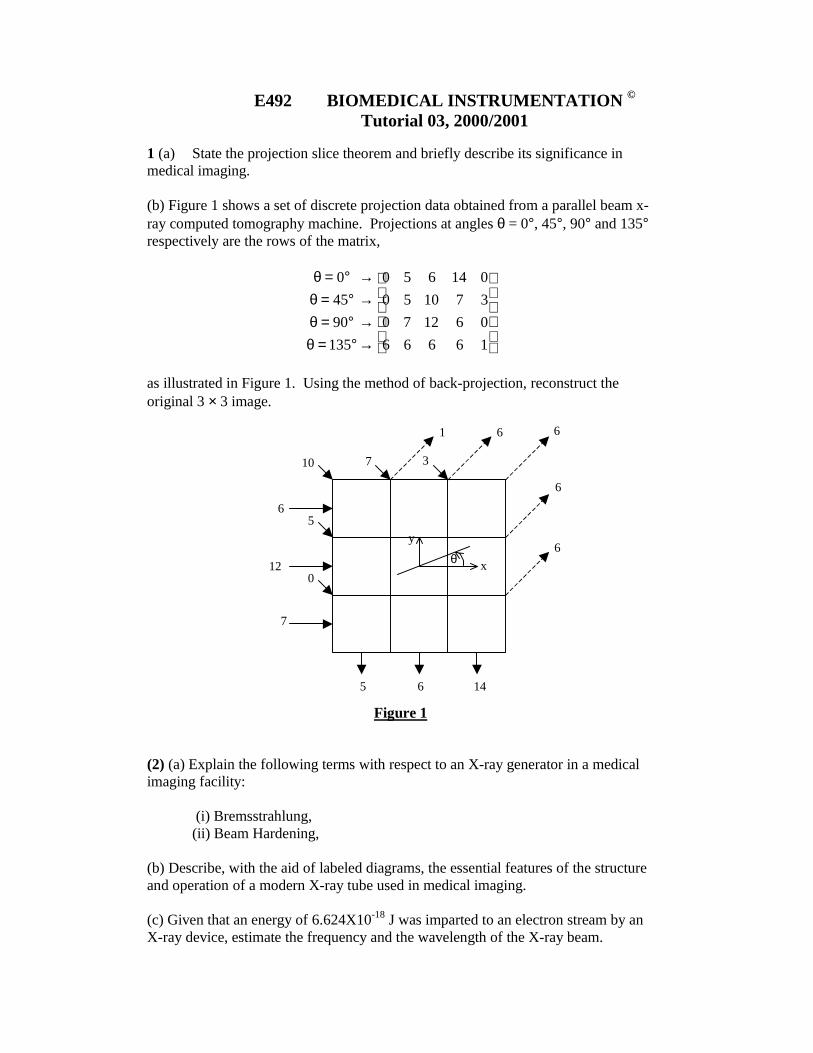
E492 BIOMEDICAL INSTRUMENTATION © Tutorial 03, 2000/2001
1 (a) State the projection slice theorem and briefly describe its significance in medical imaging. (b) Figure 1 shows a set of discrete projection data obtained from a parallel beam x-ray computed tomography machine. Projections at angles θ = 0°, 45°, 90° and 135° respectively are the rows of the matrix,
→→→→
°=θ°=θ°=θ°=θ
16666061270371050014650
13590450
as illustrated in Figure 1. Using the method of back-projection, reconstruct the original 3 × 3 image.
Figure 1 (2) (a) Explain the following terms with respect to an X-ray generator in a medical imaging facility:
(i) Bremsstrahlung, (ii) Beam Hardening,
(b) Describe, with the aid of labeled diagrams, the essential features of the structure and operation of a modern X-ray tube used in medical imaging. (c) Given that an energy of 6.624X10⁻¹⁸ J was imparted to an electron stream by an X-ray device, estimate the frequency and the wavelength of the X-ray beam.
6
6
6
6 1
7 3 10
5
0
6
12
7
5 6 14
x θ
y

E492 BIOMEDICAL INSTRUMENTATION © Tutorial 04, 2000/2001
(1) (a) Describe, giving examples, what you mean by the terms ``structural imaging'' and ``functional imaging'' in medicine. Identify suitable imaging modality/modalities for the following cases, stating your reasons: A patient suspected of having a late-stage brain tumor. A patient suffering from epileptic seizures. A pregnant woman suspected of carrying multiple fetus. A patient suspected of a broken thigh-bone.
(b) How would you compare the following imaging modalities? (i) PET Vs. CATscan (X-ray) (ii) EEG Vs. MEG (iii) fMRI Vs. EEG (2) (a) In an MRI-imaging session, a patient was subjected to a static magnetic field of flux density 2.0T. Calculate the maximum voltage gradient induced across the walls of a blood vessel carrying a flow of rate 10 cm/s. Calculate the voltage gradients for flow rates of 1,2 and 5 cm/s. (b) Describe sources of imaging artifacts that can influence the quality of an MRI image.

Chapter 4
Tutorials
4.1 Magnetoencephalography (MEG)
Magnetoencephalography is the study of the brain’s magnetic fields. Theelectric current in a group of neurons that is situated closely together can beviewed as a single source of current. The magnetic field over the surface ofthe head may be measured by an array of detectors and used to determinethe precise position and strength of the source within the brain.
Figure 4.1: MEG measures the magnetic field of the brain whereas EEGmeasures the electrical potential difference over the scalp
MEG measures intercellular current while EEG measures volume extra-cellular currents.The information that is contained with these two measures is complemen-
tary and may be combined if the measurements are made simultaneously or
79

80 CHAPTER 4. TUTORIALS
Figure 4.2: MEG measures intercellular current while EEG measures volumeextracellular currents.
with the same experimental paradigm. In combination the two modalitiesgive a more complete picture of the brain’s activity than either alone.MEG may be used for pre-surgical functional mapping, assessment of
pathological functional deficits, neuropharmacological investigations, traumaassessment, epileptic assessment, and a growing list of research investigationsin neuroscience and psychiatry.
Figure 4.3: LEFT: A complete Magnetoencephalography (MEG)installation,showing the system within a magnetically shielded room and acquisitionstation. RIGHT: Sensor Array.
MEG can be used to investigate the flow of information in the brain andhow it relates to mental functions and cognition. Visualization in 3-D enablesone to ”see” the dynamic characteristics of brain processes and the interplayof different functional areas involved and may lead to a new understandingof how the brain works. Fig. 4.6 shows the electric current distribution

4.1. MAGNETOENCEPHALOGRAPHY (MEG) 81
Figure 4.4: A comparison among imaging techniques. Note that, however,MRI systems are extremely expensive compared to X-ray CT. Similarly, anMEG system can cost as much as 50 times the cost of an EEG system.
Figure 4.5: Magnetoencephalography (MEG): a magnetic field resulting fromthe brain’s response to a visual stimulus is shown as a color contour map ona head surface reconstructed from MRI data. The disks represent sensorlocations in a full-head MEG system.

82 CHAPTER 4. TUTORIALS
in the visual, motor, and Broca’s and Wernicke’s areas involved in languageprocessing. Bright red areas are the sites of present activity. The surroundingorange areas show the variability of activity over time.
Figure 4.6: Dynamic brain visualization through MEG. Electric current dis-tribution in the visual, motor, and Broca’s and Wernicke’s areas involved inlanguage processing. Bright red areas are the sites of present activity. Thesurrounding orange areas show the variability of activity over time
MEG systems with over 250 channels are commercially available. In thecase of EEG, such large numbers are impractical at present. EEG machineswith 128 electrodes have been reported in research use.
4.2 PET Imaging Systems
In Positron Emission Tomography (PET) biochemical functions of the bodyare imaged. The ability to image biochemistry is important because, thebasis of all tissue functions are biochemical in nature. Diseases result fromerrors introduced into its chemical systems by viruses, bacteria, genetic ab-normalities, drugs, environmental factors, aging, and behavior. Detectionof chemical abnormalities provides the earliest identification of disease, evenin the presymptomatic stages, before the disease process has exhausted thechemical reserves or overridden the compensatory mechanisms of the brain.Since in most cases the location and extent of a disease is unknown,
biochemical imaging comes in extremely useful. PET provides the means forimaging the rates of biologic processes in vivo. PET images, i.e. the chimacl

4.2. PET IMAGING SYSTEMS 83
activity map, can be fused with a X-ray CT image to get better visualization.BackgroundAT present, because of its great sensitivity advantage over magnetic res-
onance imaging in tracer studies and its chemical specificity, PET is used tostudy neuroreceptors in the brain other body tissues. In contrast, MRI hasexquisite resolution for anatomic details. The capability of MRI to evaluatechemical composition of tissue but is limited to the milli-molar range ratherthan the nanomolar range that can be handled by PET.The disadvantage of PET imaging is that it is expensive to use and ra-
dioactive material is used. The spatial and temporal resolution of PET hasbeen compared against other techniques in Fig. 4.4.
Figure 4.7: Averaged data from 14 subjects who received a painful injectionof the chemical capsaicin into the upper arm. The colored part of the imagesshow increased blood flow (the PET) to the thalamus (LEFT FRAME) andprimary somatosensory cortex (RIGHT FRAME) after the injection. Thegray areas of the images (the MRI) show the brain anatomy.
PET imaging begins with the injection/inhalation of a metabolically ac-tive tracer-a biological molecule that carries with it a positron-emitting iso-tope (e.g., 11C, 13N, 150, or 18F). Over a few minutes, the isotope accumulatesin an area of the body for which the molecule has an affinity. As an example,glucose labeled with 11C accumulates in the brain or tumors, where glucoseis used as the primary source of energy. The radioactive nuclei then decayby positron emission.In positron (positive electron) emission, a nuclear proton changes into
a positive electron and a neutron. The ejected positron combines with anelectron almost instantaneously, and these two particles undergo the process

84 CHAPTER 4. TUTORIALS
Figure 4.8: The physical basis of positron-emission tomography. Positronsemitted by ”tagged” metabolically active molecules annihilate nearby elec-trons and give rise to a pair of high-energy photons. The photons fly off innearly opposite directions and thus serve to pinpoint their source.
of annihilation. The energy associated with the masses of the positron andelectron particles is 1.022 MeV in accordance with the famous relationship,
E = mc2 (4.1)
where E is energy equivalent to mass m and c is the velocity of light.This energy is divided equally between two photons that fly away from
one another at a 180-degree angle. Each photon has an energy of 511 keV.These high-energy gamma rays emerge from the body in opposite directions,to be detected by an array of detectors that surround the patient (see Fig.4.8). These high-energy γ rays emerge from the body in opposite directionsto be recorded simultaneously by a pair of detectors.
4.2.1 Tomographic Reconstruction in PET
The annihilation event that gave rise to them must have occurred somewherealong the line connecting the detectors. Of course, if one of the photons isscattered, then the line of coincidence will be incorrect. After 100,000 or moreannihilation events are detected, the distribution of the positron-emittingtracer is calculated by tomographic reconstruction procedures. PETreconstructs a two-dimensional image from the one-dimensional projections

4.3. FMRI IMAGING SYSTEMS 85
seen at different angles. Three-dimensional (3D) reconstructions also can bedone using 2D projections from multiple angles.
4.2.2 Collecting Projection Data
Efficient detection of the annihilation photons from positron emitters is usu-ally provided by the combination of a crystal, which converts the high-energyphotons to visible-light photons, and photomultiplier tube that produces anamplified electric current pulse proportional to the amount of light photonsinteracting with the photocathode.
Figure 4.9: Most modern PET cameras are multilayered with 15 to 47 levelsor transaxial layers to be reconstructed. The lead shields prevent activityfrom the patient from causing spurious counts in the tomograph ring, whilethe tungsten septa reject some of the events in which one (or both) of the511-keV photons suffer a scatter in the patient.
4.3 fMRI Imaging Systems
Functional magnetic resonance imaging (fMRI) is used to visualize brainfunction, by visualizing changes in chemical composition of brain areas or

86 CHAPTER 4. TUTORIALS
changes in the flow of fluids that occur over timespans of seconds to minutes.This method can also be used to study the physiology of other organs— forexample, studying blood flow to pathological organs, thus helping us to un-derstand the disease process.In the brain, blood perfusion is presumably related to neural activity, so
fMRI, like other imaging techniques such as PET, can be used to find outwhat the brain is doing when subjects perform specific tasks or are exposed tospecific stimuli. However, fMRI has a better temporal and spatial resolutionthan PET (see Fig. 4.4) and a worse temporal resolution than MEG or EEG.The principle of fMRI imaging is to take a series of images of the brain in
quick succession and to statistically analyze the images for differences amongthem. For example, in the blood-oxygen level dependent method (Ogawa, etal., 1990), the fact that hemoglobin and deoxyhemoglobin are magneticallydifferent is exploited. Hemoglobin shows up better on MRI images thandeoxyhemoglobin; thus, oxygenated blood shows up better. Brain areas withmore blood flow have been shown to have better visibility on MRI images.Therefore, better visibility is thought to be correlated with brain activation.This has been exploited in the following type of procedure: a series of
baseline images aretaken of the brain region of interest when the subject isat rest; the subject performs a task and a second series is taken; then thefirst set of images is subtracted from the second, and the areas that are mostvisible in the resulting image are presumed to have been activated by thetask.Other fMRI methods exploit the fact that the bulk movement of hydrogen
nuclei causes changes in the MRI signal. Such methods could image CSF flow,blood flow, or diffusion of water through tissue.
4.4 Summary
Advances imaging techniques are enabling scientists to produce remarkablydetailed computer-screen images of brain structures and to observe neuro-chemical changes that occur in the brain as it processes information or re-sponds to various stimuli such as drugs of abuse or drug abuse treatmentmedications.PET, MRI, MEG and EEG are noninvasive procedures that can measure
biological activity through the skull and reveal the living human brain atwork. Each technique has its own advantages and each provides differentinformation about brain structure and function. For this reason, scientistsincreasingly are conducting studies that integrate two or more techniques.