country report serbia · · 2016-11-23country report: serbia serbia country report december 2006...
TRANSCRIPT
ARCOTRASS- Consortium Study on the State of Agriculture in Five Applicant Countries
Country Report: Serbia
SERBIA
Country Report
December 2006
"This study, financed by the European Commission, was undertaken by Arcotrass GmbH (Germany), in association with Vakakis International SA (Greece), EuroCare GmbH
(Germany) and AKI (Hungary). The conclusions and opinions presented in this report are those of the Consultants and do not necessarily reflect the opinion of the European
Commission".

ARCOTRASS- Consortium Study on the State of Agriculture in Five Applicant Countries
Country Report: Serbia page I
Table of Contents
1 INTRODUCTION .........................................................................................................1 1.1 OVERVIEW OF THE COUNTRY ................................................................................... 1 1.2 DATA AVAILABILITY AND SOURCES ........................................................................... 3
2 ECONOMIC COUNTRY BACKGROUND .........................................................................4 2.1 MACRO- AND SOCIO-ECONOMIC SITUATION .............................................................. 4 2.2 AGRICULTURE IN THE ECONOMY .............................................................................. 6
3 LAND USE, FARM STRUCTURE AND FARM INCOME ....................................................7 3.1 LAND USE AND QUALITY .......................................................................................... 7 3.2 LAND OWNERSHIP AND PRIVATISATION.................................................................... 8 3.3 FARM STRUCTURE ................................................................................................. 10 3.4 FARM INCOME AND EMPLOYMENT........................................................................... 12
4 AGRICULTURAL PRODUCTION .................................................................................16 4.1 TOTAL AGRICULTURAL PRODUCTION (GAO, MAIN PRODUCTS) .................................. 16 4.2 CROP PRODUCTION ............................................................................................... 17 4.3 LIVESTOCK PRODUCTION ....................................................................................... 19 4.4 FOOD CONSUMPTION............................................................................................. 21 4.5 AGRICULTURAL PRICES .......................................................................................... 23
5 AGRI-FOOD INDUSTRY ............................................................................................26 5.1 OVERVIEW ............................................................................................................ 26 5.2 MAIN FOOD INDUSTRIES........................................................................................ 26
6 SUPPORT SERVICES.................................................................................................29 6.1 FINANCIAL SUPPORT SERVICES .............................................................................. 29 6.2 AGRICULTURAL EDUCATION, EXTENSION AND INFORMATION SYSTEMS..................... 31 6.3 INPUT SUPPLY ....................................................................................................... 32
7 AGRICULTURAL AND FOOD POLICY .........................................................................34 7.1 INSTITUTIONAL FRAMEWORK AND POLICY CONCEPTS.............................................. 34 7.2 BUDGETARY RESOURCES........................................................................................ 35 7.3 AGRICULTURAL AND FOOD POLICIES ...................................................................... 36 7.4 FOOD SAFETY........................................................................................................ 38
8 AGRICULTURAL TRADE AND TRADE POLICY ..................................................41 8.1 TRADE POLICY....................................................................................................... 41 8.2 AGRICULTURAL TRADE........................................................................................... 44 8.3 AGRICULTURAL TRADE WITH THE EU ...................................................................... 46
9 RURAL DEVELOPMENT AND RURAL POLICY .............................................................49 9.1 MAIN CHARACTERISTICS OF RURAL AREAS .............................................................. 49 9.2 RURAL DEVELOPMENT POLICY ................................................................................ 56 9.3 REGIONAL POLICY ................................................................................................. 59 9.4 AGRO-ENVIRONMENTAL POLICY.............................................................................. 60

ARCOTRASS- Consortium Study on the State of Agriculture in Five Applicant Countries
Country Report: Serbia page II
ANNEXES
Annex 1: EU AND OTHER DONOR SUPPORT TO AGRICULTURE AND RURAL DEVELOPMENT
Annex 2: SERBIAN PRODUCER PRICES FOR AGRICULTURAL AND FOOD PRODUCTS
Annex 3: AGRICULTURAL AND FOOD TRADE
Annex 4: RURAL DEVELOPMENT DATA BY COUNTIES (POPULATION, EMPLOYMENT INCOME)
List of Tables
Table 1: Main macroeconomic indicators in comparison with EU 25.............................................. 5
Table 2: Key agricultural indicators in comparison with EU (in %)............................................... 6
Table 3: Land use in comparison with EU (1000 ha) (2005) ........................................................ 8
Table 4: Peasant farm structure ............................................................................................. 12
Table 5: Active agricultural population in total agricultural population ........................................ 13
Table 6: Farms as per income sources and total used land area in Serbia, according to Census (2002) .................................................................................................................. 14
Table 7: Crop area, production and yield trends in crop production for Serbia, 2000-2005 ............ 17
Table 8: Livestock numbers and production (live weight) 2001 - 2005 and comparison with EU 2005..................................................................................................................... 19
Table 9: Per capita consumption of basic agricultural products (2003)........................................ 22
Table 10: Self Sufficiency of Serbia in basic agricultural products (2005) .................................... 22
Table 11: Comparison of selected agricultural producer prices in Serbia and EU .......................... 24
Table 12: Human resources in the MAFWM ............................................................................. 34
Table 13: Agricultural budget in Serbia (in Million Euro)............................................................ 35
Table 14: Market-price support in Serbian agricultural sector in 2006......................................... 37
Table 15: Tariffs in Serbia (2006)........................................................................................... 43
Table 16: Share of Agro-food trade in total trade 2005............................................................. 44
Table 17: Agricultural Trade (global) in Million Euro ................................................................. 45
Table 18: Demographic and Employment Data at NUTS I / NUTS II Level (2002) ........................ 49
Table 19: Comparison of rural areas in EU and Serbia .............................................................. 50
Table 20: Number of settlements per type .............................................................................. 51
Table 21: Farm structure, according to Censuses 1991 and 2002............................................... 54
Table 22: Employment structure in Serbia ............................................................................... 55
Table 23: Support to Rural Development in Serbia ................................................................... 58
Table 24: Extension services and veterinary services ................................................................ 59
List of Figures FIGURE 1: RELATIVE SHARE OF CROP AND LIVESTOCK PRODUCTION IN GAO (IN %)................ 16
FIGURE 2: AGRICULTURAL TRADE WITH THE EU (IN MILLION EURO, 2001 - 2005).................... 47

ARCOTRASS- Consortium Study on the State of Agriculture in Five Applicant Countries
Country Report: Serbia page III
ABBREVIATIONS
AK Agrokombinat (large state-owned farm) ALCS Association of Leasing Companies CAP Common Agricultural Policy of the EU CF Cooperative Farm c.w. Carcass Weight DCR Directorate for Commodity Reserves DFRS Development Fund of the Republic of Serbia DM Deutsche Mark EAR European Agency for Reconstruction EPS Electrical Power Supply Industry of Serbia FAO Food and Agriculture Organization of the United Nations FDI Foreign Direct Investment FRY Federal Republic of Yugoslavia FTA Foreign Trade Agreement FYR Former Yugoslav Republic GAO Gross Agricultural Output GDP Gross Domestic Product GGA Government Geodetic Authority GVA Gross Value Added ha Hectare HACPP Hazard Analysis of Critical Control Points HDI Human Development Index HL Hectolitre ICTY International Criminal Tribunal for the Former Yugoslavia ILO International Labour Organization ISAA Institute for Science Application in Agriculture JAT Yugoslav Airlines LFA Less Favoured Areas MAFWM Ministry of Agriculture, Forestry and Water Management MT Metric Tons na (Data) not available NATO North Atlantic Treaty Organization NBS National Bank of Serbia NEAP National Environmental Action Plan NIS Oil Industry of Serbia NPP National Policy Plan OSCE Organisation for Safety and Cooperation in Europe SAA Stabilisation and Association Agreement SAp Stabilization and Association process SCG Serbia and Montenegro [Srbija i Crna Gora] SEECP South Eastern Europe Cooperation Process SEE FTA South East European Free Trade Area SFRY Socialist Federal Republic of Yugoslavia SMEs Small- and Medium-sized Enterprises SOE State-owned Enterprises SPS System Sanitary and Phytosanitary System UAA Utilized Agricultural Area UN United Nations USDA United States Department of Agriculture t Tons VAT Value-added Tax WTO World Trade Organization ZTP Railway Transport Company

ARCOTRASS- Consortium Study on the State of Agriculture in Five Applicant Countries
Country Report: Serbia page 1
1 INTRODUCTION
1.1 OVERVIEW OF THE COUNTRY
The Republic of Serbia has approx. 7.5 million inhabitants. It is located in South Eastern Europe. Serbia is landlocked, with the Danube River providing shipping access to inland Europe and the Black Sea. Serbia's terrain ranges from the rich, fertile plains in the northern Vojvodina region, limestone ranges and basins in the east, and, in the southeast, ancient mountains and hills. The north is dominated by the Danube River. A tributary, the Morava River, flows through the more mountainous southern regions.
The Serbian climate varies from a continental climate in the north, with cold winters and hot summers to a more Adriatic climate in the south.

ARCOTRASS- Consortium Study on the State of Agriculture in Five Applicant Countries
Country Report: Serbia page 2
In the early 1990s the large, multi-ethnic Socialist Federal Republic of Yugoslavia (SFRY) broke up: Slovenia, Croatia, the former Yugoslav Republic of Macedonia and Bosnia and Herzegovina declared their independence and finally were recognized as independent states in 1992. The remaining republics of Serbia and Montenegro declared a new "Federal Republic of Yugoslavia" (FRY) in April 1992. At the start of the new millennium the Serbian and Montenegrin components of the FRY were seeking a looser relationship, which resulted in February 2003 in a loose state union of two republics called "Serbia and Montenegro" (SCG), which replaced the former FRY. This loose state union came to an end on May 21st, 2006, when Montenegrins voted on an independence referendum, with 55.5% supporting independence. On June 3rd, 2006 Montenegro declared its independence from that union, which was followed by Serbia's formal declaration of independence on June 5th, 20061.
The 1990s brought a significant decline to the Serbian economy. Although at the beginning of the decade the country was relatively well integrated into the world economy and had a higher standard of living than many other transition countries, the Serbian economy was devastated as a result of armed conflicts, international sanctions, and trade shocks stemming from the break up of the SFRY during the 1990s. This, coupled with economic mismanagement, resulted in hyperinflation and a virtual collapse of the economy. A stabilization program introduced in January 1994 ended the hyperinflation and laid the foundations for a constant increase in GDP and financial stability between 1994 and 1998.
In 1998-99 the war in Kosovo provoked an international response, which led in 1999 to the intervention of NATO in Serbia. The crisis led to a further slow down of economic activities, GDP continued to decrease in 1999 by another 20% compared to 1998
Following dramatic political changes in October 2000, the Government of Serbia and the Serbian part of the Federal Government embarked on a series of reforms in January 2001, the country launched an ambitious program aiming at a rapid transition to a market economy, the normalization of relations with foreign creditors, and integration with regional, EU and world markets. The Government economic program rested on three pillars: (i) prudent macroeconomic policies; (ii) market oriented structural reforms and (iii) the mobilization of significant financial and technical support from donors. In addition to establishing macroeconomic stability, progress made on this agenda included the opening up the economy, restructuring the banking sector and adopting legislation in many areas aimed at harmonization with the EU.
Macroeconomic stability, good progress on structural reforms and significant donor support (the EU allocated between 2000 and 2005 more than Euro 1 billion to Serbia) have helped to sustain positive economic growth since 2000. In 2003 recovery slowed and real GDP growth decreased due to the impact of certain structural reforms and a reduction in overall economic activity, in part caused by further political uncertainty, following the assassination of the reformist Serbian Prime Minister, Zoran Djindjic, in March 2003.
1 The Parliament of Serbia passed a Decision that defines the Republic of Serbia as the continuing State of the
State Union of Serbia and Montenegro.

ARCOTRASS- Consortium Study on the State of Agriculture in Five Applicant Countries
Country Report: Serbia page 3
Serbia’s approximation to the EU started in 1999 when the EU proposed the new Stabilisation and Association Process (SAp) for five countries of South-Eastern Europe, including Serbia (then within FRY). At the Zagreb Summit in November 2000, the EU and the Western Balkan countries officially endorsed the SAp. In September 2004, the European Union proposed a so-called ‘twin-track’ approach to integration of Serbia and Montenegro to the EU. In April 2005 Serbia and Montenegro’s Feasibility Study was approved, while talks on the Stabilization and Association Agreement started in autumn 2005. The EU suspended the talks in the spring of 2006 due to insufficient cooperation with the International Criminal Tribunal for the Former Yugoslavia (ICTY). No progress has been made in respect of the ICTY requirements and talks on the SAA remain suspended (as of October 2006).
1.2 DATA AVAILABILITY AND SOURCES
As with other countries in the region, the availability of reliable and consistent data on the agro-food sector in Serbia is still limited. The Bureau of Statistics of the Republic of Serbia has a long tradition in gathering (and publishing) data on agriculture.
However, the significant territorial changes of the recent past (i.e. the status of Kosovo, change from FRY to SCG, the independence of Montenegro), make it almost impossible to compare data over the last ten years as it is often not possible to verify whether data (e.g. on yields, growth rates, trade etc.) includes Montenegro and /or Kosovo or not2. In this report to the best of our knowledge only data for Serbia is presented.
Data on land use and farm structure suffers from another problem: the incomplete and often outdated land registration system (e.g. with respect to the recent privatisation of state-owned enterprises).
An important source of basic demographic data used in this report was the 2002 National Population Census. Prior to the publication of the results from this census, information available dated back to 1991. Unfortunately there has been no recent agricultural census. The report sources for sector data and information have been compiled from other data sources including FAO, World Bank, USAID, MAFWM, COMTRADE, COMEXT etc. where available, relevant and considered reliable.
2 Kosovo is part of Serbian territory but run under the United Nations Security Council Resolution 1244
(UNSC Resolution 1244). Kosovo’s final status is currently under discussion.
ARCOTRASS- Consortium Study on the State of Agriculture in Five Applicant Countries
Country Report: Serbia page 4
2 ECONOMIC COUNTRY BACKGROUND
2.1 MACRO- AND SOCIO-ECONOMIC SITUATION
Following the decade of the 1990s when the Serbian real GDP decreased by more than 60%, the Serbian economy has experienced modest but continuous real GDP growth between 2000-3 and robust growth in the years 2004 and 2005 (growth rates per year between 2003 and 2005 have been more than 10% p.a.).
A wide-ranging reform programme has been pursued in recent years, including the strengthening of the existing legal framework to assist economic development and pro-business growth and gradual harmonization with EU legislation in some areas. In particular, amendments to the Law on Foreign Trade in December (2000) eliminated a number of unnecessary controls upon trade and essentially reduced certain restrictive trade barriers. Other pro-business laws were also introduced such as the Enterprise Law in 2004. An important law linked to the restructuring and privatisation of state-owned companies was the Law on Bankruptcy, which was delayed in its passage through Parliament but finally adopted in 2004.
Approximately 1,500 companies were privatised up to 2001 under existing Serbian Laws. A second phase of privatisation commenced with the adoption of a new Privatisation Law in 2001, which introduced privatisation through public bids, auctions and tenders and allowed for foreign investment and ownership. Many multinational enterprises bought controlling shares in a number of large state-owned Serbian companies as a consequence. Up to June 2004, a further 1,250 companies were privatised using this new legal base, of which 814 companies were privatised in 2003 alone.
The unresolved ownership structure of a large number of companies is currently, i.e. in 2006, a barrier to further privatisation. So far major (still) state-owned enterprises will be restructured according to the regulations of the newly adopted Law on Bankruptcy. Under this law, the deadline for privatisation of state-owned companies was mid-2005, but - at the time of writing this report – this has not been achieved, as the law of denationalisation was adopted only in June 2005.
The Privatisation Law of 2001 substantially increased Foreign Direct Investment (FDIs) flows into Serbia. In 2000 FDI totalled less than 25 million Euros. In 2003 FDI flows were recorded to be in excess of 1.1 billion Euros. Thereafter the delay in the adoption of the Law on Bankruptcy and the resulting delay in the restructuring and privatisation of major state-owned enterprises, combined with doubts about the continued political stability of the country (e.g. Assassination of the Prime Minister, the unresolved status of Kosovo and Metohija, relations with Montenegro, political party turmoil) caused investment to slow dramatically. With the latest round of reforms investor confidence has gradually returned but remains limited, likely in part to be caused by the ongoing stalemate with regard to the EU SAA negotiations.
Serbia’s external debt burden was significantly reduced from 133 % of GDP in 2000 to 69 % in 2003. The stabilisation of the banking sector led to a significant increase in bank deposits

ARCOTRASS- Consortium Study on the State of Agriculture in Five Applicant Countries
Country Report: Serbia page 5
and large capital imports—mainly in the form of foreign exchange deposits. This allowed banks to increase loans to enterprises and households considerably during this period.
Between 2002 and 2005 Serbia has had a negative trade balance (€ 3.6 billion in 2005) with imports amounting to € 5.4 billion in 2005 (55.8% of GDP), three times the level of exports, which totalled € 1.8 billion (18.6% of GDP) in the same year.
A major achievement of the last few years is the decrease of the inflation rate following a decade of extreme high inflation (300,000,000 % in January 1994) and rising debt. Retail price inflation was reduced from 112 % in 2000 to 7.8 % in 2003. In 2004 and especially in 2005 inflation has been on the increase, now standing at 17% p.a. This was mainly due to: (i) a one-off hike in retail prices following the introduction of VAT3, (ii) the effects of the increase in administered prices (prices of electricity, public utility and other services), (iii) an increase in oil prices in the world market (and the corresponding rise in petroleum products' prices), (iv) Increased aggregate demand.
Table 1: Main macroeconomic indicators in comparison with EU 25
2002 2003 2004 2005
EU-25 (2005)
Population, total (1000) 7,504 7,481 7,463 7,500 459,488 Surface area (sq km) 77,474 3,975,043 Population density (No per sq km)
97 97 96 97 115.6
Agricultural Land 1000 ha 5,107 5,115 5,113 5112 162,393* GDP (current Mio. Euro) 15,013 17,133 17,959 19,246 2,697,935 GDP per capita (current Euro) 2,002 2,284 2,395 2,566 22,600 Exports of goods and services (% of GDP) 14.5 14.5 15.7 18.6 9.3* Real GDP development (%) -2.9 11 10.4 11.8 1.6 Imports of goods and services (% of GDP) no data 49.1 55.5 55.8 9.9* Inflation rate (annual %) 14.8 7.8 13.7 17.7 2.2 Registered unemployment rate 29.0 31.7 31.7 20,84 9.0* Euro-Exchange rate (Dinar/1 €) 60,8 65,0 73,0 82,3
Source: Bureau of Statistics of the Republic of Serbia (data does not include Kosovo), data for export/import from IMF Direction of Trade for Serbia and Montenegro; EU 25: Eurostat database:
Unemployment has increased further from already high levels. In 2003 and in 2004, the registered unemployment rate was the same - 31.7 %, which is well above the EU average of 9%. Although the table above indicates a dramatic fall in unemployment for 2005 this is not the case but rather, reflects a change in definition of the unemployment rate, shielding the actual level of unemployed in the economy (please refer also to footnote 3).
3 The introduction of VAT harmonized the Serbian tax system with EU countries and replaced other tax
regimes on consumption, but still the standard VAT rate of 18% caused an increase in consumer prices.
4 From 2005 the ILO definition for unemployment is used for official government statistics. If the same ILO definition is applied for 2004, the rate would have been 18,5%.

ARCOTRASS- Consortium Study on the State of Agriculture in Five Applicant Countries
Country Report: Serbia page 6
2.2 AGRICULTURE IN THE ECONOMY
The agro-food sector is the most important single sector in the Serbian economy.
Primary production from agriculture accounted for approximately 16.6% of GDP in 2005. Thus the relative importance of agriculture decreased over the period from 1995 to 2005. But despite this downswing the share of primary production in agriculture is compared to the EU-25 (1.6% in 2005) and also compared to neighbouring countries n the Western Balkans still very high. In absolute figures the GDP in agriculture increased over the same period to approximately € 3.2 billion in 2005. If the food and beverage processing activities associated with agriculture are added to primary production, agriculture, in this wider sense, is the largest single sector of the economy, with 25 % of GDP.
Over two-thirds of the total land area of Serbia is agricultural land, which is far above the EU average of approximately 40%. The share of arable land is again bigger than in the EU-25: In Serbia 73% of total agricultural land is arable land whereas in the EU-25 the share is 67%.
Table 2: Key agricultural indicators in comparison with EU (in %) Serbia
1995 2000 2005 EU-25 2005
Share of Agricultural land in total land 66.4 65.9 65.9 40.8 Share of Arable Land and Permanent Crops in total land
47.85 47.85 47.85 27.4
Share of Agricultural GDP in total GDP * 20.5 20.8 16.6 1.6 Share of Agricultural Labour in total Labour** 8.8 7.7 7.0 5.0 Share of Agricultural Export in total Export 21.1 20.6 19.9 6.0 Share of Agricultural Import in total Import 10.9 9.5 7.3 6.0
* For 1995 and 2000 GDP calculation is based on 1994 prices, for 2005 GDP calculation is based on 2002 prices and refers only to primary agricultural production. With food processing the level is approximately 25% of total GDP. **Figures on employment do not include the number of family members working on their private farms. Source: Bureau of Statistics of the Republic of Serbia; EU 25 data – Dg Agri “Agriculture in the European Union”
The combined number of people employed in agriculture (7%) and in the food processing industry (4.5%) represents approximately 11.5% of the total labour force of 2.1 million people. Around 150,000 people are employed in the agro-processing and agricultural service industries. Food-processing enterprises are the largest single employer in the industrial sector, with more than 90,000 employees (2005).
For the first time in five years Serbia had in 2005 a positive trade balance in agro-food trade. The agro-food sector accounted for some 20% of total Serbian exports, a very high share not only compared to the EU-25 (6%) but also to neighbouring countries like Croatia, Bosnia and Herzegovina or Albania (all less than 10%). Compared to the EU 25 the importance of the agro-food sector for Serbia’s exports correlates much more to the share of the sector in the country’s GDP, to which it contributed some 25 %.

ARCOTRASS- Consortium Study on the State of Agriculture in Five Applicant Countries
Country Report: Serbia page 7
3 LAND USE, FARM STRUCTURE AND FARM INCOME
3.1 LAND USE AND QUALITY
Agricultural land in Serbia covers approx. 5.1 million hectares (ha) (some 66% of total land) of which about 3.6 million ha are arable land (incl. permanent crops).
The climate is temperate continental. Average annual precipitation ranges from 600mm to 800mm in the plains and between 800mm and 1,200mm in the mountains. Land and climate conditions are favourable to agricultural production. The plains of Vojvodina, Pomoravlje, Posavina, Tamnava, Krusevac and Leskovac offer favourable conditions for mechanized field crop farming and vegetable production. Rolling hills in the South support fruit and wine production and livestock breeding. The hills and mountains of Zlatibor, Rudnik, Stara Planina, Kopaonik and Sar Planina are attractive for developing sheep and cattle production, forestry, and tourism.
There are three broad “agricultural regions” that can be distinguished in Serbia on the basis of geography and climate, land quality, farm production systems, socio-economic development, and political and administrative boundaries, namely:
Vojvodina - Vojvodina is a distinct political and administrative entity, comprising 28% of the total land area of Serbia and 26% of the total population. It is the wealthiest region, and experienced a net inward migration from 1995-1999. Fewer than 10% of municipalities are classified as underdeveloped according to the UN Human Development Index (HDI). There are fewer villages in Vojvodina than in other regions, and there is a relatively low population density (94 people/km2), but villages are linked by a reasonable transport and communications network. Agriculture is a major element of the Vojvodina economy. Crop production predominates because of the region’s fertile soils, good growing conditions, and high proportion of arable land (76% of land area). Producers in this region are more market-oriented than in the other two regions. Vojvodina farmers account for most of the marketed surplus of grains, oilseed, sugar beet, pigs, poultry and milk.
Central Serbia - Central Serbia accounts for 29% of the total land area of Serbia and 44% of the total population. It is the most diverse and densely populated of the three regions, due in part to the influence of Belgrade. The capital city is an important source of employment, and also accounts for this region's higher levels of infrastructure. GDP/capita is slightly lower than in Vojvodina, and there is a higher proportion (21%) of municipalities classified as underdeveloped according to the HDI. Rural areas are characterised by the region’s hilly topography, small farms and diverse farm production systems. Such topography limits both the area of land suitable for agriculture (66%) and the proportion of agricultural land suited for arable use (67%). The agricultural potential of this arable land is good nevertheless, with fertile soils and favourable climatic conditions. Production systems are fairly intensive as a result, and the region accounts for a large proportion of high-value fruit and vegetable crops. 90% of berry fruits, which are a major export commodity, are produced in this region.

ARCOTRASS- Consortium Study on the State of Agriculture in Five Applicant Countries
Country Report: Serbia page 8
Southern Serbia - With 44% of the total land area, Southern Serbia is the largest of the three regions, but also the poorest, least developed region. Much of the area is mountainous, with 37% of the total area classified as forest and only 55% classified as agricultural land.
Table 3: Land use in comparison with EU (1000 ha) (2005)
Serbia Serbia (as share of
total land) EU-25* Land total 7747 100% 397,504 Agricultural land 5112 66% 162,393 Arable land & permanent crops 3639 47% 109,156 Agricultural land/capita (ha) 0.68 Not applicable 0.36 Arable land & permanent crops/capita (ha) 0.49 Not applicable 0.24
* data for EU 25 is for 2004 Source: Bureau of Statistics of the Republic of Serbia; EU 25 data - Year 2003 http://epp.eurostat.cec.eu.int/portal/page. Year 2004 Dg Agri Agriculture in the European Union
3.2 LAND OWNERSHIP AND PRIVATISATION
Yugoslavia, unlike most other former socialist countries, never fully collectivised agriculture. Therefore during the 1980's, about 75 % of the arable land was farmed by private producers, who accounted for about two thirds of all agricultural output. In 1989, the private sector accounted for 83 % of total maize output, 59 % of total wheat output, 48 % of total beef output, and nearly 80 % of all pork output. However, private farmers were limited to a maximum of 10 hectares and many private holdings consisted of several fragmented plots of land. The socialized sector was dominated by large, vertically and horizontally integrated Agrokombinats (AKs).
Land reform in former SYFR began with the establishment of a land fund of 1.566.000 ha, which was made public property. 51% of the land fund was allocated to people with no land and poor farmers and 49% was retained by the public sector (Agrokombinats, Cooperative Farms etc.). Further progress was m in June 2005 when the “law on registration and record keeping of confiscated property” (also called “law on denationalization”) was passed („Public gazette RS“ No. 45/2005). The law regulates the process of registering and record keeping of the property, which was confiscated on the territory of the Republic of Serbia without paying the former owner any compensation of market value or fair damages (this applies not only to the agricultural sector but to all enterprises). However, today the majority of public property, which originates from confiscated lands it from former proprietors, fiscal and legal entities, remains in public or social ownership.
Currently, AKs and other state-owned enterprises (SOE) in the agricultural sector are in the process of being privatised. It is estimated that 70 % of all SOE in Serbia are in the agricultural and food processing sectors. The privatisation process, which started in 2001 follows standard procedures through public tenders and auctions. In 2005, the Ministry of Agriculture Forestry and Water Management (MAFWM) adopted a regulation according to which all state-owned land should be tendered for rent. As a result, the land utilized by the AKs should be rented to private farms and other users. According to latest estimates 350,000

ARCOTRASS- Consortium Study on the State of Agriculture in Five Applicant Countries
Country Report: Serbia page 9
to 380,000 ha of agricultural land are state owned. The MAFWM prepared, at the end of April 2006, a draft Law on Agricultural Land, which was adopted by Parliament at the beginning of July 2006.
Serbia does not yet have a functioning land market. Ownership rights are poorly defined and recorded. Currently, it is legal to lease and sell privately owned land, but the turnover is largely unofficial. Where turnover is legally recorded, the title registration system is incomplete and disjointed and fails to transparently document the current ownership or allocation of lease rights (or more sophisticated encumbrances, such as mortgages or state servitudes). This lack of clear ownership rights for a significant proportion of the land is a hindrance to the proper operation of the land market, although land tenure in Serbia is overwhelmingly private. According to the World Bank (2003), private farmers own approximately 83% of the 3.6 million hectares of arable land (incl. permanent crops) and 50-60 % of the 1.75 million hectares of pasture land. The remaining land (for crop and livestock) is farmed by 460 AKs and 400 co-operatives. More than 90 % of co-operatives farm less than 1.000 hectares, and more than 95 % of AKs farm less than 5,000 hectares.
The land-lease market in Serbia is currently more important than the land-sales market as Serbia lacks the proper legislative framework for the latter. But also the lease market is characterised by insecure property rights and a relatively high lease tax (20 % of the lease value) that result in many lease transactions not being officially reported. As a consequence land-lease contracts are often short-term and do not encourage medium-term investment in the land or in the development of the farm infrastructure.
Since 2005 MAFWM supports young farmers by paying “old” farmers a lease of 50 euro/ha (per year) in case they are renting their plot to a “young” farmer (up to 45 years). The measure is intended to solve the problem of the land market for the young farmers who are willing to engage in agriculture.
The institutional responsibility for land administration spans several ministries and other public institutions, namely:
• The Government Geodetic Authority (GGA) manages the land cadastre. The cadastre, covering 88,167 km2, includes nearly 55 million cadastral parcels of private, social and state property. It is out-of-date and needs to be harmonised with the systems in the municipal courts;
• The legal real property registration system, which complements the cadastre, is maintained by the municipal courts and supervised by the Ministry of Justice and Local Administration;
• Rural and forestry spatial planning and land management policy is co-ordinated by the MAFWM;
• Urban planning policy and regulation is the mandate of the Ministry of Construction and Urban Planning, which co-ordinates policies and has technical oversight of the urban planning operations in the municipalities;
• Property tax administration is the responsibility of the Ministry of Finance and

ARCOTRASS- Consortium Study on the State of Agriculture in Five Applicant Countries
Country Report: Serbia page 10
• Information technology standards which are critical for the harmonisation of land records are implemented by the Bureau of Information Technology and Internet and the Serbian Standards Office, which both work on various aspects of property and business registration.
The land registration system is not up to date and efforts to combine the information into a single register have almost been halted. Land ownership has not been registered in the past because there was no legal or economic imperative to do so. Farm size was limited by law, anyway, and registration of a transaction could possibly result in land confiscation if it exceeded the maximum allowed size. Even if the maximum farm size was not an issue, there were registration fees and processes to go through with no practical benefit as a result.
The elimination of the maximum holding size rule removed one market barrier. However, there is still no legal requirement to register ownership and, therefore, the market is partly paralysed because of the costs and in some cases also the impossibility of ascertaining ownership.
Serbia has started in 2004 to establish a farm register (not to be confused with the land registration system, as above), which would create a reliable base for the support schemes within the agricultural and rural sector. An important incentive for farms to register in the farm register is the fact that only registered farms are eligible to benefit from direct state aids. However, up to the summer 2006 only approx. 30% - 50% of all Serbian farms were registered.
3.3 FARM STRUCTURE
Serbia’s agricultural sector is dominated by private farms utilizing more than 80% of available agricultural land with state farms accounting for less than 20% of the UAA. Essentially, the farm structure is as follows:
Agrokombinats (AKs) - formed from 1953 onwards as the state confiscated or otherwise acquired land. They were constituted as “social enterprises”. Over time, some of them also purchased additional land. As part of the transition process, all of the AKs shall be privatised or restitution of confiscated land to its original owners or their heirs shall take place (see above). Most of the AKs have by now passed through a preliminary stage of privatisation, in which they have been transformed into shareholding “mixed enterprises”, with the state still remaining the majority shareholder.
Cooperative Farms (CFs) - Serbia has a long tradition in cooperative production, dating back to the second half of the 19th century. The Cooperative Farms in their current form stem from state-led collectivisation over the period 1948-54. The transition process requires CFs to return forcibly collectivised land to its original owners or their heirs. This process has largely been completed. Some CFs were dissolved, but most have continued to farm land, which belongs to their members, as well as land that they had bought over the years. There is no legal imperative for further restructuring, though the CFs and their umbrella body, the Cooperative Union, tend to be regarded as part of the old system and so there is pressure to introduce more modern cooperative legislation and update their way of operation. Although

ARCOTRASS- Consortium Study on the State of Agriculture in Five Applicant Countries
Country Report: Serbia page 11
generally not as large as the AKs, the CFs have many of the same problems of management, under-investment and over-manning, and face similar challenges along the road to profitability. And as the CFs are largely worker-owned, the problem of over-staffing will be particularly difficult to address.
“Private subsistence farms” - According to the Census (2002) there are about 700 000 private farms with less than ten hectares of land, most of which have always been in private hands. The majority of these farms own less than five hectares, usually fragmented into a number of small separate parcels. Because of their small size, most of these farms produce for their own household consumption and market only a small proportion of their output. Consequently, many farming families are heavily dependent on non-farming sources of employment and income.
“Private commercial farms” - Within the private farming sector there is an emerging group of more commercial farms, which produce primarily for the market. Among these producers are two distinct groups: the first group is composed by those farmers that own larger estates and are primarily oriented to farming, the second group is composed by those that own just a few hectares but are dedicated to the production of high quality fruit and vegetables.
Further, the analysis will concentrate on private family farms only as information is only available for them. Serbia has on average a much smaller private farm size than many other European countries. There are currently about 778.900 private farms in Serbia5 with an average size of 2.5 ha of arable land, fragmented in an average of 4 plots per farm. According to the 2002 Population Census, over 75% of private farms have less than five hectares and fewer than 6% have more than 10 hectares (see table 4).
There are two clearly recognizable regions in Serbia, as far as farm size and structure is concerned. The northern part of the country, with larger farms, is oriented mostly towards field crop farming. The central and southern parts, with smaller agricultural holdings, have a diverse composition in their production, dominated by orchards, vineyards, vegetable growing and livestock breeding.
5 According to the 2002 Population Census, agricultural household is defined as a holding with at least 0.1
hectare of cultivable land being used at the time of census, or an household with up to 0.1 hectare of
cultivable land being used at the time of census, and in minimum possession of:
a) A cow and calf or a cow and heifer, or
b) A cow and two fully grown heads of small livestock, or
c) 5 fully grown sheep, or
d) 3 fully grown pigs, or
e) 4 fully grown heads of sheep and pigs together, or
f) 50 heads of fully grown poultry, or
g) 20 beehives

ARCOTRASS- Consortium Study on the State of Agriculture in Five Applicant Countries
Country Report: Serbia page 12
Table 4: Peasant farm structure Year of census 2002
Number of holdings
Number of holdings (%)
UAA (ha)*
UAA (%)
Total 778.891,0 100% 2.869.000,0 100,0
Up to 2 ha of UAA 360.317,0 46% 347.252,0 12,1
Above 2 ha to 5 ha 244.064,0 31% 854.366,0 29,8
Above 5 ha to 10 ha 131.438,0 17% 957.719,0 33,4
Above 10 ha to 20 ha 36.772,0 5% 503.358,0 17,5
Above 20 ha UAA 6.300,0 1% 206.305,0 7,2
*refers to private ownership, private farms
Source: Bureau of Statistics of the Republic of Serbia
Corporate farms, on the other hand, are important suppliers of marketed agricultural produce, despite their minority share of the agricultural land. They are the dominant suppliers of pig meat and eggs, and they share approximately equally the market with the private sector in the major arable crops, in beef and sheep meat, and in grapes for wine. The private sector dominates the supply of fruit, vegetables and milk.
3.4 FARM INCOME AND EMPLOYMENT
3.4.1 Employment
In 2005 some 150,000 people were employed in agriculture and some 90,000 people were employed in the food processing industry. This represents (on aggregate) 11.5% of the total labour force. But the share of agriculture in the total active population, which takes in addition to the labour force also self-employed and unemployed people as well as unpaid occupations into account, is much higher6.
As table 5 shows, in 2002 there were some 450,000 active farmers in Serbia, which equals some 13.4% of the total active population of Serbia (some 3.4 mio I 2002). The total number of active farmers decreased by 55% between 1991 and 2002. Over the same period the relative importance of off-farm activities increased (from 22.5% in 1991 to 27.8% in 2002). In absolute terms, however, the number of people engaged in off-farm activities also decreased, over this period, as the decrease in total agricultural population was too severe. During the same period the number of rural households who received a personal (non-farm) income more than doubled. The most intensive “agrarian exodus” took place in Central Serbia where it dropped from 26.7% to 19.1%, while in Vojvodina it declined from 14.5% to 6 "Active population" includes all persons with an active occupation. Active occupation is defined as "activity for
earning a living". The active population is divided into active persons, persons with personal income and non-
self-supporting persons. The term "active population" takes into account all people of a minimum age of 15,
who (i) carry out professions and (ii) are unemployed and looking for a job. "Persons with personal income"
do not belong to the group of active persons but receive a regular income such as pensions, property
revenue or other personal income. "Non-self-supporting persons" are dependent on the support of others to
make their living

ARCOTRASS- Consortium Study on the State of Agriculture in Five Applicant Countries
Country Report: Serbia page 13
14.3%. This “agrarian exodus” process resulted in significant demographic changes in the structure of farms and the family farm members, which are reflected primarily in the age structure of the farming population.
Table 5 further shows that the majority of farm members are not working in agriculture, i.e. these people live on a farm but they have other (off-farm) professions (some 700,000 people in 2002), receive a pension or other form of social payment (some 530,000 people in 2002) or depend on the support of their families (some 850,000 people in 2002). When comparing the data for the two last Population Censuses (1991 – 2002) it is clear that Serbia has experienced a dramatic reduction in the total farming population in the last decade or more.7.
According to the records from the last Census, the agricultural population has a higher percentage of people older than 45 years than in total population. The proportion of young farmers (up to an age of 19), as well as those in the most productive age (20 to 49) is decreasing. The educational structure of the active agricultural population of Serbia is very unfavourable. Many farmers have not completed primary education, while the proportion of illiterate persons exceeds that of persons with secondary education and higher.
Table 5: Active agricultural population in total agricultural population
Active farmersOff -farm
active members
Members with personal income
Supported members
Total number of
farm members number % number % number % number %
1991. 3,557,867 816,200 22.9 799,926 22.5 354,484 10.0 1,289,369 36.2
2002. 2,536,378 454,732 17.9 705,070 27.8 526,232 20.7 845,238 33.3
Index
1991=100% 71.3 55.7 88.1 148.5 65.6
Note: The differences to 100% are farm-holding members working abroad for the period of maximum one year. In 1991 there were 8.4% working abroad and in 2002 only 0.3%. Source: D. Bozic, N.Bogdanov (2005) Definition of categories in the table: Individual farmers are part of the active agricultural population and perform their profession in their own agricultural holding or in the family’s agricultural holding. Active members outside their own farm are all active persons who perform a profession outside the agricultural sector. This group involves also the active persons who are farmers by profession but are employed outside their own or family farm. Members with personal income are persons who are supported independently by regular income such as : pension, property income, social welfare and other regular income. Supported members are persons without their own income, as well as persons with insufficient income and they are supported by their parents or other persons or legal entities. This includes supported persons whose supporter was abroad during the time this registration was made. Members temporarily employed abroad are Citizens of Serbia and Montenegro who are during the time of registration temporarily employed abroad by a foreign employer or independently.
7 Please compare Bureau of Statistics of the Republic of Serbia (Dec 2002): Communication 295: FINAL
RESULTS OF THE CENSUS 2002 - Population by national or ethnic groups, gender and age groups in the
Republic of Serbia, by municipalities
ARCOTRASS- Consortium Study on the State of Agriculture in Five Applicant Countries
Country Report: Serbia page 14
3.4.2 Farm Income
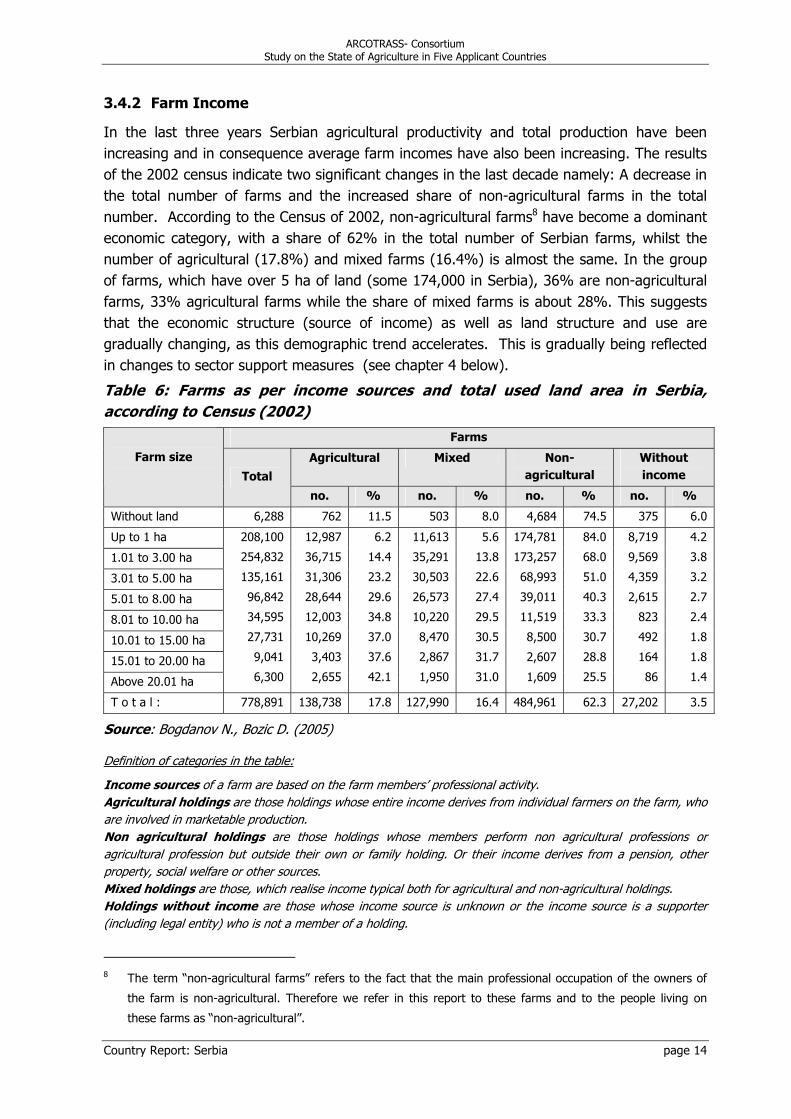
In the last three years Serbian agricultural productivity and total production have been increasing and in consequence average farm incomes have also been increasing. The results of the 2002 census indicate two significant changes in the last decade namely: A decrease in the total number of farms and the increased share of non-agricultural farms in the total number. According to the Census of 2002, non-agricultural farms8 have become a dominant economic category, with a share of 62% in the total number of Serbian farms, whilst the number of agricultural (17.8%) and mixed farms (16.4%) is almost the same. In the group of farms, which have over 5 ha of land (some 174,000 in Serbia), 36% are non-agricultural farms, 33% agricultural farms while the share of mixed farms is about 28%. This suggests that the economic structure (source of income) as well as land structure and use are gradually changing, as this demographic trend accelerates. This is gradually being reflected in changes to sector support measures (see chapter 4 below).
Table 6: Farms as per income sources and total used land area in Serbia, according to Census (2002)
Farms
Agricultural Mixed Non-agricultural
Without income
Farm size
Total
no. % no. % no. % no. %
Without land 6,288 762 11.5 503 8.0 4,684 74.5 375 6.0
Up to 1 ha
1.01 to 3.00 ha
3.01 to 5.00 ha
5.01 to 8.00 ha
8.01 to 10.00 ha
10.01 to 15.00 ha
15.01 to 20.00 ha
Above 20.01 ha
208,100
254,832
135,161
96,842
34,595
27,731
9,041
6,300
12,987
36,715
31,306
28,644
12,003
10,269
3,403
2,655
6.2
14.4
23.2
29.6
34.8
37.0
37.6
42.1
11,613
35,291
30,503
26,573
10,220
8,470
2,867
1,950
5.6
13.8
22.6
27.4
29.5
30.5
31.7
31.0
174,781
173,257
68,993
39,011
11,519
8,500
2,607
1,609
84.0
68.0
51.0
40.3
33.3
30.7
28.8
25.5
8,719
9,569
4,359
2,615
823
492
164
86
4.2
3.8
3.2
2.7
2.4
1.8
1.8
1.4
T o t a l : 778,891 138,738 17.8 127,990 16.4 484,961 62.3 27,202 3.5
Source: Bogdanov N., Bozic D. (2005)
Definition of categories in the table:
Income sources of a farm are based on the farm members’ professional activity. Agricultural holdings are those holdings whose entire income derives from individual farmers on the farm, who are involved in marketable production. Non agricultural holdings are those holdings whose members perform non agricultural professions or agricultural profession but outside their own or family holding. Or their income derives from a pension, other property, social welfare or other sources. Mixed holdings are those, which realise income typical both for agricultural and non-agricultural holdings. Holdings without income are those whose income source is unknown or the income source is a supporter (including legal entity) who is not a member of a holding.
8 The term “non-agricultural farms” refers to the fact that the main professional occupation of the owners of
the farm is non-agricultural. Therefore we refer in this report to these farms and to the people living on
these farms as “non-agricultural”.

ARCOTRASS- Consortium Study on the State of Agriculture in Five Applicant Countries
Country Report: Serbia page 15
Table 6 suggests that the majority of Serbian farmers are involved in (semi-) subsistence farming. The term “subsistence farm” is defined as the farm that provides for the basic needs of household without surpluses for marketing. It seems to be very significant in Serbia for the farms up to 1 ha, where more than 80% of all agricultural holdings don’t derive any income from agriculture.
The term “semi-subsistence farm” is defined as the farm that provides for the basic needs of household and only a small part of its agricultural production enters commercial channels. Table 6 indicates that the majority of the private farms in Serbia do not depend on the income derived from a marketable surplus of their agricultural production alone. It’s likely that they have mixed production systems. Such a private farm might provide for limited crops for food & feed, vegetables & fruits for on-farm consumption and maybe a small surplus for marketing of small livestock production (e.g. poultry and sheep). One or more family members might receive a pension or another form of income, which is the main monetary income of the farm.
With increasing farm size the emphasis is shifted to agricultural production and the share of farms, whose entire income derives from individual farmers on the farm, who are involved in marketable production increases.

ARCOTRASS- Consortium Study on the State of Agriculture in Five Applicant Countries
Country Report: Serbia page 16
4 AGRICULTURAL PRODUCTION
4.1 TOTAL AGRICULTURAL PRODUCTION (GAO, MAIN PRODUCTS)
After many years of decrease or stagnation Serbian agricultural production is increasing again. The average annual growth rate of agricultural production (3.5-4%) experienced in Former Yugoslavia by the early 1980s, put it at that time among the most dynamically growing agricultural sectors in Europe. In the late 1980s agricultural production stagnated, and in the 1990s it fell significantly for the same reasons as any other sector (see chapter 1&2).
In recent years agricultural production appears to be generally increasing with 2004 and 2005 having significantly higher outputs than previous years. With planted areas remaining relatively static these increases have been primarily due to improved productivity.
The production structure of Serbian agriculture acquired during 1990s has the characteristics of extensive production, with high share of cereals in cultivated lands, an increasing proportion of uncultivated lands and a modest range of vegetables & fruits.
There are no reliable comprehensive data on Gross Agricultural Output in Serbia currently. However, based on the data on the physical volume of the production and the producer prices the Bureau of Statistics of the Republic of Serbia has estimated that the share of crops in total GAO increased between 1995 and 2005: Whereas livestock products contributed in 1995 with approx. 42% to the GAO (in 2000 46% and in 2005 35%), the share of crops in the GAO increased from 58% in 1995 (in 2000 54%) to 65% in 2005 (Bureau of Statistics of the Republic of Serbia).
The UN FAO applied international commodity prices to estimate the value of production of key agricultural commodities. The results from this analysis indicate that in terms of the production value, maize is by far the most important commodity in Serbia, followed by pig meat, cow milk, wheat and cattle meat. The production of fruits and vegetables is also significant with grapes, potatoes, plums, chillies and peppers being the most important single commodities. In the following sub-sections these commodities are further analysed.
Figure 1: Relative share of crop and livestock production in GAO (in %)
20.0025.0030.0035.0040.0045.0050.0055.0060.0065.0070.00
1995 1996 1997 1998 1999 2000 2001 2002 2003 2004 2005
Crops
Livestock
Source Bureau of Statistics of the Republic of Serbia

ARCOTRASS- Consortium Study on the State of Agriculture in Five Applicant Countries
Country Report: Serbia page 17
4.2 CROP PRODUCTION Crop production land area has remained static over the last five years but for certain key crops, farmers have improved productivity tremendously, particularly with respect to cereals and oilseeds (with the exception of 2003 which was a very poor harvest, due primarily to droughts throughout the region).
Table 7: Crop area, production and yield trends in crop production for Serbia, 2000-2005
2000 2001 2002 2003 2004 2005
EU-25 (2005)
Crop area (1000 ha) Cereals 2,047.7 2,120.0 2,102.0 1,997.0 2,020.0 1,972.0 52,013.8Oilseeds 294.3 254.4 253.3 334.0 307.7 331.7 11,348.7Pulses 1 38.9 38.3 39.0 37.8 37.3 35.1 1,868.2Roots and tubers 147.3 143.8 149.56 158.5 154.9 154.74 2,037.3Tobacco 9.7 11.7 11.8 8.6 7.9 7.2 xFruits 245.0 243.5 245.0 246.0 244.0 5,838.1Vegetables 140.1 138.6 138.6 139.6 140.8 140.8 2,460.0Grapes 70.6 69.0 68.6 67.0 66.0 x
Production (1000 t) Cereals 5214,3 9000.7 8297.9 5453.9 9866.9 9539.1 260,561.1Oilseeds 399.1 530.5 530.3 583.6 759.9 728.7 10,020.7Pulses 37,8 60,7 63,9 45,5 61,1 62.8 4,485.5Roots and tubers 59,599.2Fruits2 293.9 220.5 171.5 370.6 300.3 296.3 63,000.8Tobacco 11.07 16.59 17.99 11.5 12.47 11.00 xVegetables3 160 175 199 164 185 160.9 66,037.1Wine (1000 HL) 1603.1 1899.2 1775.8 2144.4 1785.4 x
Yield trends (t/ha) Cereals 2.55 4.25 3.95 2.73 4.88 4.84 5.0Oilseeds 1.36 2.09 2.09 1.75 2.47 2.20 8.8
Notes: 1) only beans and peas 2) apples, pears, peaches 3) only tomatoes Source: Bureau of Statistics of the Republic of Serbia EU 25 data – FAO database
4.2.1 Main Cereals
Cereals dominate crop production in Serbia, accounting for 40% of arable land, or 60% of total cultivable land. Maize and wheat are the most important commodities in the cereals sector. Rye, barley and oats make up only 10% of the area dedicated to cereals.
Maize is Serbia’s biggest single commodity with a production of 6.3 mio t in 2005, which was produced on approx. 1,200,000 ha (FAO data). Over the last 5 years the area used for maize production remained stable with the overall maize production being erratic because of weather conditions but generally increasing. Serbia has had between 2000 and 2004 an average yield of 4.2 t/ha in the maize sector while the EU –25 has an average yield of approx. 8 t/ha).
Wheat is the second biggest commodity in the Serbian cereals sector. In 2004 Serbia produced some 2,700,000 t wheat on approx. 640,000 ha. Over the last 5 years the area

ARCOTRASS- Consortium Study on the State of Agriculture in Five Applicant Countries
Country Report: Serbia page 18
used for wheat production has been on average 650,000 ha, with some fluctuation (mostly between 600,000 ha and 700,000 ha). Production ranged in that period from 2 to 2.7 mio t with 2003 being an exception with extremely low yield (1.4 mio t). No clear trend can be observed in the wheat sector. Average yield of wheat over the last 5 years has been 3.5 t/ha while the EU 25 has had an average yield of approx. 5.5 t/ha.
Although Serbia is not competitive compared to major Central European exporters such as Hungary, Serbia’s cereal production is contributing significantly to marketable production in Western Balkan countries. The importance of the sector for foreign trade is analysed in chapter 8 below.
4.2.2 Fruits & Vegetables (incl. Grapes)
Serbia has ideal climatic conditions for growing many varieties of fruit. The country’s territory is rich in microclimates that are perfectly suited for organic fruit production making the development of this sector extremely promising. Most of the fruit is grown in perfect conditions, they are hand picked and carefully stored and packaged. Most fruit in Serbia is still grown on small family owned farms with low average yields.
Fruits & Vegetables (F&V) are grown on approx. 565,000 ha, which represents some 16% of the total arable land in Serbia (incl. permanent crops). Grapes are the most important commodity followed by potatoes, plums and raspberries. Fruits and especially berry fruits contribute significantly to Serbian agricultural exports.
Grapes are the most important commodity (in terms of value of the production) within the sub-sector with a production of some 475,000 t in 2005 (FAO). They are the sixth most important single commodity of Serbian agriculture. Most of the grapes are used for wine production (annual production 1.85 mio HL). Over the last five years the sown area increased slightly and so did the physical volume of the production.
Potatoes are the second most important commodity within the sub-sector with a production of some 1,100,000 t in 2005 (FAO). Over the last five years the sown area remained stable with some fluctuations in the physical volume of the production due to weather conditions.
Plums are used for the production of spirits. The physical volume of the production in 2005 was 580,000 t (FAO). Over the last five years the sown area remained stable with big fluctuations in the physical volume of the production due to weather conditions.
Raspberries and other berry fruits are an important export commodity. The physical volume of the production in 2005 was some 90,000 t (FAO), which makes Serbia the second biggest producer in the world (after Russia). Over the last ten years the sown area increased by 60% whereas the physical volume of the production increased over the same period by 80%.

ARCOTRASS- Consortium Study on the State of Agriculture in Five Applicant Countries
Country Report: Serbia page 19
4.2.3 Industrial Crops
The land used for the production of Sugar Beet decreased from 100 000 ha per year in the 1980s to some 62,000 ha in 1995 to around 45 000 ha in 2000. The sector has recovered slightly since then with over 65,000 ha planted in 2004. Sugar beet production has increased over the last years (with 2003 being an exception due to bad weather) and in 2005 it reached some 2,700,000 t (FAO). The preferences given to Serbia and other countries in the Western Balkans in 2000 for sugar exports to the EU (Council Regulation 2563/2000 extended the trade preference to Serbia in addition to Council Regulation 2001/2000 for the other Western Balkan countries) might, in part, explain this recovery. The impact on Serbian foreign trade is discussed in chapter 8.
Sunflower seeds are the most important commodity within the oilseeds sub-sector with a production of some 455,000 t in 2005 (FAO). In terms of value of the production sunflower seeds rank 10th in the FAO listing.
4.3 LIVESTOCK PRODUCTION The number of farm animals in Serbia has decreased significantly since the beginning of the 1990s (by more than 30%). A number of factors have contributed to this decline including the overall reduction in the number of farms, decreased demand for animal products (which are more expensive than crops), small farm size and poor animal husbandry (making livestock production less profitable than crop production). A shortage of animal feed and adequate veterinary services may also have contributed to this decline. Official data show that the numbers of almost all livestock fell during the last fifteen years. Production has fallen even more than livestock numbers, due to the additional difficulty of providing adequate feed and veterinary care. Even before 1990, productivity had always been low by western standards. In the last 5 years, though, livestock production and livestock numbers have stabilised.
Table 8: Livestock numbers and production (live weight) 2001 - 2005 and comparison with EU 2005
2001 2002 2003 2004 2005 EU-25 (2005)
Cattle 1000 heads 1,162.0 1,128.0 1,112.0 1,102.0 1,079.0 86,411
Sheep and Goats 1000 heads 1,794.0 1,669.0 1,612.0 1,685.0 1,741.0 101,301
Pigs 1000 heads 3,615.0 3,587.0 3,634.0 3,349.0 3165.0 151,143
Chicken 1000 heads 5,311,391
Beef and veal (c.w.) 1000 t 93.0 97.0 95.0 93.0 90 8,084
Milk Mio litres 1,594.0 1,596.0 1,590.0 1,593.0 1614 141,324
Pig meat (c.w.) 1000 t 564.6 616.7 573.9 538.5 590 21,194
Poultry meat 1000 t 62.0 65.0 59.0 65.0 67 10,990
Sheep/goat meat (carcase weight)
1000 t 17.0 15.0 18.0 20.0 21 1,058
Wool 1000 t 2.2 2.1 2.3 2.4 2.5 x
Source Bureau of Statistics of the Republic of Serbia, EU 25 data - Agriculture in the European Union - Statistical and economic information 2005: - for cattle and pigs tab 4.15.0.1 data for 2005 preceding; for sheep

ARCOTRASS- Consortium Study on the State of Agriculture in Five Applicant Countries
Country Report: Serbia page 20
and goats - tab 4.17.0.1, data for 2004, preceding year; for chickens tab 4.18.0.1, data for 2004, for milk production in: Gross internal production in 1000 t, 2004, tab 4.20.1.1 for meat; tab 4.14.1.1;
According to MAFWM data during 20059, as compared to 2004, the total number of cattle in Serbia increased by 1.6% (of which, the number of fattening cattle increased by 15.6%), while the number of pigs increased by 1.5% (fattening pigs by 8.2%). It is worth noting, that the greatest share of support from the agrarian budget has been directed in recent years towards the livestock husbandry sub-sector - 67% of all approved credits by the MAFWM have been placed into the animal husbandry sub-sector.
4.3.1 Cattle (Beef & Dairy)
Cattle raising is of great importance for the development of Serbian agriculture. In 2005 raw cow milk was the third most important single commodity of the Serbian agro-food sector whereas the indigenous production of beef & veal was the fifth most important
The beef & veal production amounted in 2005 to some 170,000 t – a slight increase to the average production of the period between 2001 and 2004, which was about 164,000 t. Prior to the introduction of sanctions in 1992, Serbia had been traditionally an exporter of fattened cattle and beef to many countries, especially Germany, Italy and Greece10.
Cattle numbers in Serbia are decreasing, as in most of the transition countries, but with increasing productivity per head. In 1990 2,168,000 heads were counted, of which 1,275,000 were cows and pregnant heifers; in 2004 there were 1,102,000 cattle (742,000 cows and pregnant heifers). Such a drastic decrease of numbers is the result of sanctions, as well as the transition and economical collapse of state owned farms. At the same time numbers in private ownership also decreased, partly as a result of rural depopulation.
In breed structure, Domestic Spotted cattle of the Simmental type are dominant; in Vojvodina and around large cities and on state farms Holstein-Friesian cattle are present, although there are many crossbreeds.
Dairy Sector: The production of raw cow milk in Serbia amounted in 2005 to 1,615 mio litres. The physical production of milk is stable over the last five years. About 50% of the raw milk is delivered to dairies. Production of milk per cow in Serbia is about 2,400 l, whereas in the EU the average yield is far above 5000 l / cow / year.
According to data of the Bureau of Statistics of the Republic of Serbia only 0.9 billion litres of the raw cow milk production of 1.6 billion litres are processed in dairies. This suggests that there is no change or decrease in traditionally high natural milk consumption and sales of processed dairy products through non-registered channels (farmers' market)11.
9 Data from 15/01/2006. Figures in table 8 comprise data from 15.01.2005. 10 Economic sanctions against Serbia & Montenegro were imposed by the United Nations in May 1992 as
part of the intended response to the regional conflict in the WB Region, sanctions were suspended in
accordance with the terms of the Dayton Peace Agreement in November 1995. 11 Data on 2002 Census show that from total number of farms in Serbia amounting to 780,000 around
500,000 farms are dealing with cattle husbandry (most of them are dealing with milk productions). For

ARCOTRASS- Consortium Study on the State of Agriculture in Five Applicant Countries
Country Report: Serbia page 21
4.3.2 Sheep and Goats
Sheep breeding: The general structural and policy reform of the wider economy have also affected and started to reshape the sheep industry. Total numbers have been falling, especially in the AKs due to restructuring. On the other hand the number of private sheep farms and the size of their flocks have been increasing. In addition to the increase in flock size the number of sheep of highly productive breeds has increased and these are raised in a more intensive manner. Farmers are showing interest in more productive breeds and more young people are becoming interested in sheep breeding as a profession due to the demand for sheep and lamb meat and the diversification options with regard to wool, milk and cheese bi-products. Goat keeping has no great economic importance in Serbia. However, there is no reliable data on goats or goat products currently available (mainly due to the localised and small-scale nature of production and marketing). In 2000 it was estimated that the number of goats was approximately 315,000 with a tendency to increase. Goats are mainly bred by small-scale semi-subsistence producers for their milk and cheese rather than their meat.
4.3.3 Pigs and Poultry
Pig breeding is traditionally important in Serbia. Pig meat has the greatest share in the consumption of meat for domestic consumers. Pigmeat (including pork and other products made of pigmeat, such as bacon) is also the second-largest (after maize) commodity in the Serbian agro-food sector. However, Serbia is a net importer of live pigs and pigmeat and with increased regional competition, actual animal numbers have been in modest decline over the last five years. Pigmeat production amounted, in 2005, to some 590,000 t but the general trend for domestic production has been relatively static. According to our own calculations and estimations n 2005 the GAO of pigmeat production amounted to more than € 600 mio or more than 20% of total agricultural production.
Poultry breeding is an important livestock industry providing high quality and cheap food (poultry meat and eggs). Serbia’s total poultry population declined from 23.278.000 heads in 1999, to only 16.280.000 heads in 2004. Since Serbia exports very limited quantities of poultry (only to Bosnia and Herzegovina) nearly all poultry production is consumed domestically. Poultry imports are also expected to rise, due primarily to strong marketing campaigns and competitive prices offered by companies from Hungary and Slovenia.
4.4 FOOD CONSUMPTION
Consumers spent approximately half of their income on food in 2000. After a further increase in 2001, this share in total spending has been falling since then and stood, in 2004, at around 40%. This is still a high share compared to most EU countries, where it is mostly between 10% and 15 %. This declining trend can be attributed to robust growth of the overall Serbian GDP, coupled with a substantial decrease in agricultural prices over the same
a great number of farmers, particularly the small ones, milk production is the only stable monthly
source of income.

ARCOTRASS- Consortium Study on the State of Agriculture in Five Applicant Countries
Country Report: Serbia page 22
period. Also the retail prices for the consumers have been favourably influenced by a higher degree of competition within the retail sector (i.e. more supermarkets offering greater choice).
Table 9: Per capita consumption of basic agricultural products (2003) Product Unit Serbia EU-25
Total cereals kg/head/year 120 91.9 - Wheat1 kg/head/year 68.8 68.7 Potatoes kg/head/year 38.2 76.9 Sugar2 kg/head/year 23.1 31.8 Fruits 3 kg/head/year 118.6 X Vegetables4 kg/head/year 105.6 X Meat (total) kg/head/year X - Pig meat kg/head/year 33.0 43.4 - Poultry meat kg/head/year 8.6 23.0 - Beef meat kg/head/year 12.5 17.9 - Sheep meat kg/head/year 2.1 2.9 - Other meat kg/head/year 0.2 X - Offals kg/head/year 3.6 X Milk kg/head/year 161.5 X Butter kg/head/year 0.3 4.13 Cheese kg/head/year Na 17.6 Eggs kg/head/year 7.0 13.4
Source: FAO data 1) Flour equivalent, 2) Sugar equivalent, 3) Fresh fruit equivalent (including citrus fruit), 4). Fresh vegetables equivalent (excl. beans, peas and lentils); EU 25 data - Agricultural Situation in EU 2005, from tables on supply balances for year 2003/2004; 2004/2005 and DG-Agri “Prospects for agricultural markets 2004-2011”, Tables A.9-A.17, July 2004
Although the consumer in Serbia spends a much higher share of its disposable income on food, he/she consumes less basic agricultural products than the consumer in the EU 25 (see table 9 above). Especially obvious is this misbalance in the consumption of meat, which is traditionally very important in Serbia: Still, because of the high cost of meat the consumption per capita is much less than in the EU 25. This is partly compensated by the high consumption of cereals. In comparison to the EU –25 it seems that the cereals consumption per head is high, whereas the consumption of potatoes is 50% less than in the EU. Comparing the Croatian consumption data with the data of individual EU Member States it appears that the high cereals consumption is typical for the Mediterranean countries. As such e.g. Greece, Italy and Malta have (as Croatia) similar consumption patterns (high cereals consumption and low potatoes consumption). With growing income the consumption patterns are anticipated to slowly change, with more meat being consumed and less staples.
Table 10: Self Sufficiency of Serbia in basic agricultural products (2005)
Product Unit Serbia Serbian data
for year EU-25 (for
2003) Wheat % 97.1% (2005) X Maize % 100.8% (2005) X Potatoes % 98.4% (2005) 99.7% Vegetables % 95.7% (2002) X

ARCOTRASS- Consortium Study on the State of Agriculture in Five Applicant Countries
Country Report: Serbia page 23
Fruits % 89% (2002) X - Bovine meat % 100% (2004) X - Sheep & goat meat % 100% (2004) X - Pig meat % 99.2% (2005) 107.0% - Poultry meat % 99.4% (2004) 104.9% Milk % 96.8% (2002) x
Source: MAFWM, FAO ; EU 25 data - Agricultural Situation in EU 2005, from tables on supply balances for year 2003/2004; 2004/2005 and DG-Agri “Prospects for agricultural markets 2004-2011”, Tables A.9-A.17, July 2004
Serbia is almost self-sufficient in most basic agricultural products. When compared to most of the other countries in Western Balkans Region, the market balance sheets are strong and likely to improve given current trends for certain products. In other areas where deficits do exists such as fruit and vegetables, the level of production is anticipated to increase and imports reduce in the coming years. Based on these trends, it is likely that Serbia will become a net exporter of all major primary agricultural products to the region by 2008.
4.5 AGRICULTURAL PRICES
During the 1990s, prices of agricultural and food products in Serbia were formed in the framework of a period of high inflation and volatile monetary / fiscal environment, with frequent changes in institutional measures and administered prices, under the control of the government. The same was also true on the formation of prices for agricultural input. Serbian agriculture is highly dependant on import of farm inputs (e.g. components for animal feed production, mineral fertilizers, certain kinds of seeds, Diesel fuel etc.). The international sanctions fostered during the 1990s the development of a network of “grey channels of trade”, characterized (among others) by a great number of middlemen and continuous inflation of prices. At the same time, the government budget could not bear costs of subsidizing agricultural production. The major part was previously devoted to subsidies for mineral fertilizers, seed, breeding animals and Diesel fuel. This together contributed to an enormous increase of input prices and made them inaccessible to a great number of producers, while the government kept under its control the prices of strategic agricultural products striving for maintenance of social peace and making food available to the consumers.
A long-term program for agricultural development adopted in 1996 foresaw mechanisms of price control such as in the CAP regimes. The program largely failed due to the absence of appropriate market management mechanisms. Agricultural price policy changed significantly since 2000. The use of floor prices to support 10 “strategic” commodities was abolished in 200212. Emphasis has shifted to the subsidy of a small number of commodities (milk, sugar beet, tobacco and –later- sunflower) and subsidy of livestock improvement and establishment of orchards and vineyards. Changes in 2002 included (i) the introduction of area payments for tobacco and sugar beet instead of production subsidies; (ii) incentives and production targets to increase industrial crop output and reduce wheat production and (iii) 12 The Directorate for Commodity Reserves (DCR), however, continues to purchase significant quantities of
wheat and livestock.
ARCOTRASS- Consortium Study on the State of Agriculture in Five Applicant Countries
Country Report: Serbia page 24
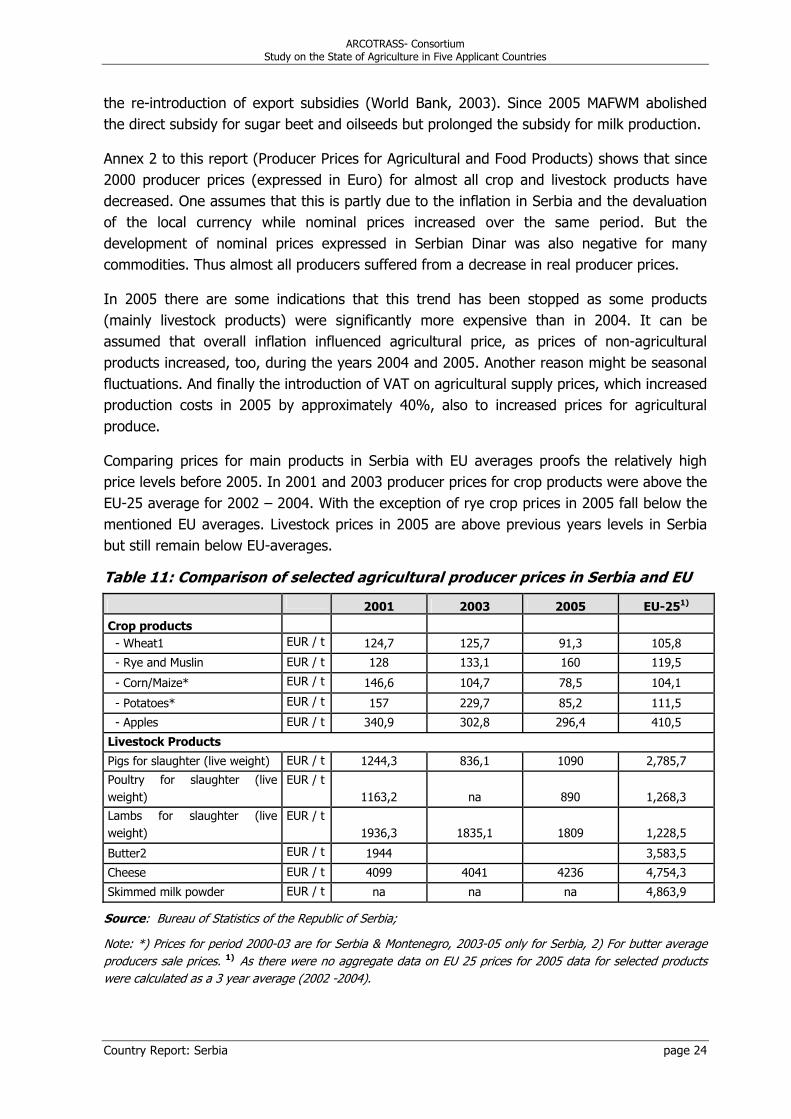
the re-introduction of export subsidies (World Bank, 2003). Since 2005 MAFWM abolished the direct subsidy for sugar beet and oilseeds but prolonged the subsidy for milk production.
Annex 2 to this report (Producer Prices for Agricultural and Food Products) shows that since 2000 producer prices (expressed in Euro) for almost all crop and livestock products have decreased. One assumes that this is partly due to the inflation in Serbia and the devaluation of the local currency while nominal prices increased over the same period. But the development of nominal prices expressed in Serbian Dinar was also negative for many commodities. Thus almost all producers suffered from a decrease in real producer prices.
In 2005 there are some indications that this trend has been stopped as some products (mainly livestock products) were significantly more expensive than in 2004. It can be assumed that overall inflation influenced agricultural price, as prices of non-agricultural products increased, too, during the years 2004 and 2005. Another reason might be seasonal fluctuations. And finally the introduction of VAT on agricultural supply prices, which increased production costs in 2005 by approximately 40%, also to increased prices for agricultural produce.
Comparing prices for main products in Serbia with EU averages proofs the relatively high price levels before 2005. In 2001 and 2003 producer prices for crop products were above the EU-25 average for 2002 – 2004. With the exception of rye crop prices in 2005 fall below the mentioned EU averages. Livestock prices in 2005 are above previous years levels in Serbia but still remain below EU-averages.
Table 11: Comparison of selected agricultural producer prices in Serbia and EU
2001 2003 2005 EU-251)
Crop products - Wheat1 EUR / t 124,7 125,7 91,3 105,8
- Rye and Muslin EUR / t 128 133,1 160 119,5
- Corn/Maize* EUR / t 146,6 104,7 78,5 104,1
- Potatoes* EUR / t 157 229,7 85,2 111,5
- Apples EUR / t 340,9 302,8 296,4 410,5
Livestock Products
Pigs for slaughter (live weight) EUR / t 1244,3 836,1 1090 2,785,7
Poultry for slaughter (live weight)
EUR / t 1163,2 na 890 1,268,3
Lambs for slaughter (live weight)
EUR / t 1936,3 1835,1 1809 1,228,5
Butter2 EUR / t 1944 3,583,5
Cheese EUR / t 4099 4041 4236 4,754,3
Skimmed milk powder EUR / t na na na 4,863,9
Source: Bureau of Statistics of the Republic of Serbia;
Note: *) Prices for period 2000-03 are for Serbia & Montenegro, 2003-05 only for Serbia, 2) For butter average producers sale prices. 1) As there were no aggregate data on EU 25 prices for 2005 data for selected products were calculated as a 3 year average (2002 -2004).

ARCOTRASS- Consortium Study on the State of Agriculture in Five Applicant Countries
Country Report: Serbia page 25
In 2005 the price level for the selected agricultural commodities was generally lower than in the EU-25 and in most of the neighbouring countries of the Western Balkan. The relatively low producer prices have increased the competitiveness of Serbian farmers and helped to increase Serbia’s market share especially in the neighbouring countries.

ARCOTRASS- Consortium Study on the State of Agriculture in Five Applicant Countries
Country Report: Serbia page 26
5 AGRI-FOOD INDUSTRY
5.1 OVERVIEW The food processing industry in Serbia has “inherited” considerable capacity from the former Socialist Federal Republic of Yugoslavia (SFRY), in which Serbia was an important factor for food security for 20 million consumers. Today a large part of this capacity is old and outdated, so that the available product range is relatively modest and does not meet the market requirements of modern consumers.
As in other sectors the privatisation process for the food industry in Serbia has been carried out in two steps (compare chapter 2). In May 2004, the Serbian government adopted an action plan for the removal of administrative barriers to foreign investments. It includes a list of specific barriers, which shall be removed until the end of 2006. A national strategy for foreign investments, as well as a provisional document for planning those investments for the three, six and nine-year period shall be developed in 2006.
The Serbian Food Industry contributed in 2005 some 5% to the overall GDP and is the most important sector within the manufacturing Industry. Food-processing enterprises are the largest single employer in the industrial sector, with more than 90 000 employees in the year 2005 (or some 4.5% of total labour force).
The share of the food industry in the overall Serbian agro-food export is bigger than its domestic importance with respect to employment and % share in GDP. More than half of all agro-food exports are food products, with processed fruits and refined sugar being the most important food commodities for export.
5.2 MAIN FOOD INDUSTRIES The different sub-sectors of the Serbian food industry show significant differences in terms of their past development, current competitiveness and future potential. The situation is briefly described below:
Mills: Flour production is currently running at over 500,000 tonnes per annum. The industry uses about 700,000 tonnes of wheat for this production, which represents only one third of the total wheat production of the country. This indicates the potential importance of the grey market in flour production. Official statistics are limited. Records about the production of bread and bakery products are also imprecise and the latest estimates say that the value of unregistered trade is about 10 billion Dinars. About 6500 companies are estimated to operate in this sector of which only 300 are registered. The Ministry of Trade has announced the possible introduction of excise stamps for flour in order to put an end to grey trade. Quality standards have been completely neglected in the supply chain of wheat, flour and bread production due to the current market conditions. This is why bread of poor quality is eaten in Serbia and the supply of special kinds of bread and other products made of flour is modest and expensive.

ARCOTRASS- Consortium Study on the State of Agriculture in Five Applicant Countries
Country Report: Serbia page 27
The fruit processing industry is well developed and has the potential to become an (small) export engine of the country. Currently, the industry exports juices, concentrates, purees, jams and frozen / dried fruits. Premium juices have always used high quality Serbian fruits as basic ingredient, and now Serbia’s own premium juice brands are one of the country’s fastest growing export commodities. The vast majority of Serbian exports go to the EU. As the EU’s health standards become stricter many companies have responded by introducing quality standards such as HACCP.
The vegetable processing industry, due to the existing capacities has a significant potential to develop. Annual vegetable production is approx. 2 million t with important potential surpluses for processing and exports. The vegetable processing industry in Serbia includes about 25 companies, which produce frozen, canned and dried vegetables. The major processed vegetable crops in Serbia are potatoes, tomatoes and pepper. The EU is the main trade partner for vegetables products - it imports more than 40% of total Serbian production.
Annual wine production in Serbia has averaged 1.85 million HL over the past five years with fluctuations due to weather conditions. The dominant share of total wine production has been produced on family farms though their share varies significantly from year to year (62% to 88%). The volume of grape processing and wine production in large state-owned agricultural enterprises has decreased by more than 40% in 1999 war due to a combination of factors including the devastation of some vineyards and wine cooperatives and loss of confidence among grape farmers because of low prices and/ or long waiting periods for payment.
Table wines constitute some 60% of overall production; quality wines another 30%, while high-quality wines amount to less than 10%. High-quality wines have a larger share of total red wine production than of white.
At present the sugar industry is uncompetitive compared to the EU-25 average, both in terms of beet yield per hectare and in sugar extraction per t of beet, while in the late 1980s Serbia still could compete in this respect with several (then) EU-12 countries. Factory capacity in Serbia is currently large in relation to the sugar beet supply. Rationalisation to 4 or 5 modern factories should reduce unit costs to more competitive levels. The main element for the sector’s future prosperity could be its degree of access to the EU market, as sugar exports account for about 12% of total Serbian agricultural exports (please refer also to chapter 8). There are 11 sugar plants in Serbia of which 7 have been privatised according to 2001 Privatisation Law and 4 remain to be privatised. With privatisation the sugar sector has seen a concentration process. Investment in already privatised sugar plants is significant at 40 million Euro.
During the 1990s, the meat-processing sector lost its export markets and suffered from underinvestment. At present, some companies are suffering from supply shortages, which, together with lower subsidies, are limiting the supply of companies to a growing demand. Partially as a consequence of this, a consolidation process can be observed. Companies are trying to improve the quality of their products and to catch up with EU standards. Some companies introduce HACPP in order to increase their export potential. Slaughterhouses

ARCOTRASS- Consortium Study on the State of Agriculture in Five Applicant Countries
Country Report: Serbia page 28
were often linked to municipalities or state-owned animal farms. At present, a number of them are in bankruptcy, others are currently being restructured.
More than 30 dairy companies operated in Serbia when the privatisation process started. Today most of them have already been privatised. The sector has attracted also a lot of foreign direct investment. A high price (at present milk prices for consumers and animal breeding are being subsidized) contributes significantly to increased production, causing an increase in the number of small dairies, which together with existing dairies increase the competition in buying raw milk. The increased demand of dairies has increased the share of raw milk that is processed in dairies and decreased the share of raw milk consumed or processed on-farm. Today there are around 250 dairy plants in Serbia, which annually purchase and process approximately 900 million litres of milk.
The production of different kinds of beverages (production of distilled alcoholic beverage, wine, beer and malt, mineral water and soft drinks) is a very important sector in Serbia. Currently no significant change in the production of distilled alcoholic products and wine can be observed while the production of beer and malt, mineral water and soft drinks is increasing. Global players are increasingly showing interest in the Serbian market and are likely to invest in the sector. The entry of these large multinationals, whether through acquisition or green-field investments is expected to lead to a concentration process and to increase competition.

ARCOTRASS- Consortium Study on the State of Agriculture in Five Applicant Countries
Country Report: Serbia page 29
6 SUPPORT SERVICES
6.1 FINANCIAL SUPPORT SERVICES Since the introduction of the restrictive credit and monetary policy in Serbia in 1994 and a change in priorities of the financial policy (agriculture lost its status as priority sector) the domestic agrarian economy was left without any permanent and safe financing source for its specific use. In 1996, an agrarian budget was established as part of the total budget of the Republic of Serbia aiming at subsidizing agriculture and total rural development in Serbia. During the last two years (2004-05) several attempts have been made by the MAFWM and the Ministry of Finance to improve the credit system in Serbia. Currently, agricultural finance is originating from the following main sources:
• MAFWM • Commercial banks • Leasing companies • Development funds
Credits of the MAFWM – The MAFWM has been crediting farmers since 2004. The funds derive from the agrarian budget. These credit lines to farmers are highly subsidized, and are provided through the banking sector (real interest rates are in the range of 3% to 5%). Commercial banks are managing the credits, which is important in order to start building-up the credit history of individual farmers. In 2004 the total amount distributed as credits to farmers was 17.5% of the agrarian budget. In 2005 the resources intended for credits amounted to 18.2% of the total agrarian budget. In 2004 and 2005 51,456 registered farmers received credits (average amount about 800 Euro). In 2006 3.5 billion Dinars (15.7% of the agrarian budget) were set aside for credit to farmers, of which 2 billion Dinars were intended for medium-term credits and the rest for short-term credits. There are two types of credits: short-term credits (up to one year) and medium-term credits (up to 5 years):
1. Short-term credits of the MAFWM – Short-term credits are intended to be used as working capital, mainly for the procurement of needed farm inputs (seeds, fertilizers, fodder etc.). The repayment deadline is 12 months with a 12-month grace period and a 5% interest rate. The maximum credit ranged during the last two years from 150-3000 Euro. According to the experience of the last two years, the structure of the approved short-term credits is as follows: (i) credits for livestock production development accounted for 67% followed by (ii) machinery purchase and (iii) construction of – smaller - greenhouses.
2. Medium-term credits of the MAFWM are approved for a 5-year period with a 1- to 3-year grace period, depending on the purpose for which the credit is granted. Credits are approved for the construction and purchase of irrigation systems and equipment, purchase of agricultural machinery, establishment of orchards, construction of – larger - greenhouses and livestock production. The lowest and highest credits approved are 5,000 and 200,000 Euro, respectively. The interest rate is 3% along with the currency

ARCOTRASS- Consortium Study on the State of Agriculture in Five Applicant Countries
Country Report: Serbia page 30
clause (with respect to the Euro). Depending on each individual commercial bank, repayment guaranty can be mortgage, collateral (current or purchased asset), bill form or other guaranties.
For an investment of more than 15,000 Euro banks demand that a business plan is enclosed when applying for medium-term credit. Both in 2004 and 2005 the agrarian budget foresaw 2 billion Dinars for medium-term credits. The largest share of medium-term credits was intended for livestock production (54.95%) and the purchase of agricultural machinery (34.23%).
Credits of commercial banks During 2005 there were 25 banks in Serbia providing agricultural credits applying different conditions for different purposes. The major provider of credits to agriculture in Serbia is the ProCredit Bank.
1. Conditions of short-term credits for the agriculture sector didn't differ much between the commercial banks. Short-term credits were intended for the purchase of input and the preparation of commodities for export and for ensuring liquidity. The grace period was 3-12 months, the credit amount was limited by guaranties and client reliability and the nominal monthly interest rate a bit less than 2.5%, i.e. 27%-29% annually.
2. Medium-term credits of business banks were primarily intended for the purchase of agricultural machinery and other equipment, followed by the purchase of basic flock. The repayment deadline was 3-5 years depending on the purpose. Credits were limited by guaranties and client reliability and ranged from 5000 to 220 000 Euro. In general, the annual interest rate ranged from 10-12%.
Leasing companies An act of the Republic of Serbia regarding financial leasing was adopted in May 2003. Since 2005 the conditions for leasing have been favourable with a 3% annual interest rate for agricultural machinery and 5% for other leasing facilities. Minimum participation was 20% and maximum 50%. The repayment period was 2-5 years (monthly instalments and, rarely, 3-monthly instalments).
Development funds – Agriculture is one of the priority target groups of the Development Fund of the Republic of Serbia (DFRS) established in 1992. DFRS finances inter alia programs in the field of economic and regional development, support of SMEs and export promotion.
1. Short-term credits of the DFRS – These credits shall promote export of domestic products. In 2005 short-term credits for export promotion were approved for 12 agro-industrial enterprises amounting to 415 million Dinars or 27% of the resources for these purposes.
2. Long-term credits of the DFRS - In 2005 the Development Fund was financing 234 projects in the field of agro-industry within its SME support program. Credits totalled 2.5 billion Dinars - more than 36% of the total funds available for SME support. In addition to that about 20% of the available credit line of DFRS for the support of self-employment and independent entrepreneurs is currently given to the agro-processing sector (total approx. 360 million Dinars).

ARCOTRASS- Consortium Study on the State of Agriculture in Five Applicant Countries
Country Report: Serbia page 31
6.2 AGRICULTURAL EDUCATION, EXTENSION AND INFORMATION SYSTEMS
Extension/ Advisory services: Agricultural extension in Serbia is provided by the semi-autonomous Institute for Science Application in Agriculture (ISAA). ISAA employs about 750 staff in 34 agricultural stations across Serbia, and is partly financed by MAFWM (107 million Dinars in 2002). Additional income derives from agricultural activities and fees for services to private farmers and AKs. ISAA works mostly with medium- to large-scale private and state-owned farms with its activities being centrally planned and primarily commercial in nature. As such, the ISAA is a potential candidate for privatisation following restructuring.
G17 Plus, a NGO, has established its own support system for farmers, Agronet, with about 40 centres throughout Serbia. Agronet is presently supporting the implementation of farmer self-improvement and business development programs that involve as many as 15,000 farmers. Several donor-funded agriculture and rural development projects also fund technical services to farmers. They could play an important role in a competitive market for supply of advice to farmers, but that market has yet to develop. Most farmers have either insufficient financial means or insufficient appreciation of the value of an extension service to be willing to pay for it at present. Private and state-owned input suppliers and agro-processing companies are another part of the technical "support mosaic": Often, in the case of the processing industry, with a view to improving product quality.
Agricultural advice is also provided by the staff of the research institutes, Universities or NGOs (depending on financing by MAFWM or others).
Services currently provided in Serbia (except in case of some crops like maize or sunflower) are not up to the latest know-how in agricultural technologies and exists little effort to acquire and adopt the technologies available in the global market to Serbian conditions in order to improve quality, productivity and competitiveness. The general capacity in agricultural economic research, policy and market research is weak and the impact on the agri-food sector and the farmers is limited.
Education: Serbia has a comprehensive agricultural education system, which is organized through a number of agricultural schools and university faculties. The whole system is under the authority of the Ministry of Education, which is responsible for the design and the implementation of the curricula.
Serbia has around 60 agricultural middle schools spread throughout the country teaching aspects of agriculture and food technologies.
At secondary level, the vocational training schools are criticised by the agro industry for not producing the type of skills that businesses need nowadays to compete in a market economy. They are isolated units within their regional sector and have failed to utilise practical resources around them. Current reforms address many of these issues through introducing training programs that can support the local economy or at least establish links to it.

ARCOTRASS- Consortium Study on the State of Agriculture in Five Applicant Countries
Country Report: Serbia page 32
The agricultural schools seem to target mainly the education and training of agricultural technicians needed for the agri-processing sector, the semi-managerial positions in AKs and the public service. However, private farmers cultivate most of the land. This needs to be addressed. More emphasis should be put on farm business management and practical farming skills. Programs (day courses) should also be made available to private farmers. As the latter is a form of extension, this should be the responsibility of ISAA rather than the Ministry of Education.
Agriculture market Information: USAID is currently supporting the Serbian Extension Service in the development of a Serbian Agriculture Marketing Information System network, known as STIPS (for more information see www.stips.minpolj.sr.gov). The aim of this support is to assess and improve price reporting from grains and feed markets from 18 locations in Serbia. The prices will be integrated in National Livestock, Grain and Feed Bulletins, which it is hoped will help Serbian farmers to make better decisions about agricultural production and marketing.
6.3 INPUT SUPPLY The decline of State-owned Enterprises (SOE) and Cooperative Farms (CF) over the 1990s has destroyed the traditional support to small private farmers in terms of input supply (in particular fertilizer) and market outlets. This has further weakened their capacity to absorb rising costs and the effects of lower incomes. The private sector has been unable to compensate for the collapse of the state sector in either upstream (agricultural inputs) or downstream (processing and marketing) activities.
Today Serbian agriculture is highly dependent on the import of fertilizers, seeds and seedlings, fuels and power, agricultural machinery and other input supplies. During the period of sanctions grey channels of trade were developed and despite significantly improved legal procedures they still exist: Mineral fertilizers with reduced active matter contents and seeds without certificates were common still in early 2006. The customs duty on import of most of the agricultural inputs is low (11% or 5%) thus the trade market is relatively liberal. VAT on basic agricultural inputs (seeds, chemical agents, forage mixtures) is 8%. Farmers use the VAT compensation scheme (see chapter 12) very little, primarily because they are not sufficiently informed about the method of operation of this facility.
Fertilizer consumption has decreased dramatically over the 1990s. The domestic production of fertilizers, in six state-owned companies, decreased over the same period, partly due to sanctions and the destruction of fertilizer plants during the NATO bombing in 1999. The plant at Pancevo had a capacity of 700,000 tons per year. During the sanctions production fell to around 200,000 tons per year and in 2000 to approx. 130,000 tons. Another major plant in Subotica (a factory with originally 20 production lines) had a capacity of approximately 200-300,000 tons. Only one production line is currently working producing about 10,000-15,000 tons. Shortages of gas and high component costs have prevented further rehabilitation. The rehabilitation of the fertilizer plants will have to be addressed in the near future by the International Financial Institutions.

ARCOTRASS- Consortium Study on the State of Agriculture in Five Applicant Countries
Country Report: Serbia page 33
Consequently, the availability of fertilizers was reduced to a minimum, and complex fertilizer was used mainly by CFs and SOE, which had preferential access and on-farm stocks. Only limited imports from neighbouring countries were available and prices were higher than usual and had to be paid in DM. Many farmers used only organic manure. Only one-third of nitrogen top dressing fertilizer needs were satisfied in Spring 2001. Imported fertilizer has tended to be of poor quality and has been delivered mostly without appropriate quality control certificates. It is very important to make sure that farmers apply pesticides in correct doses with efficient sprayers wearing protection clothing. According to existing regulations, pesticide sprayers should be controlled regularly, but it seems that these regulations are not always applied.
Agricultural machinery is important for a modern and competitive agriculture. While Serbia still seems to have enough tractors their average age is getting close to 20 years and the number and range of other more specialised machinery, e.g. for particular groups of crops, is small. Thus the demand for investment in this sector is big. SFRY had big production capacities for agricultural machinery. Then Yugoslavia exported a significant share of production, primarily to the East European market and Asian countries. Nowadays, the production capacities of the industry of agricultural machines and equipment are exploited to less than 30%. They lack investment capital and more attractive production programs, which satisfy the demand of domestic market.
Oil mills and sugar refineries supply farmers with seeds and other production materials in order to secure the supply of the raw material they need for their production. By doing so they take some risk but at the same time they can directly influence the quality of raw material they later process. Farmers benefit from this kind of input supply as they get better prices.

ARCOTRASS- Consortium Study on the State of Agriculture in Five Applicant Countries
Country Report: Serbia page 34
7 AGRICULTURAL AND FOOD POLICY
7.1 INSTITUTIONAL FRAMEWORK AND POLICY CONCEPTS
The Ministry of Agriculture Forestry and Water Management (MAFWM) is the key institution for agricultural and food policies in the Republic of Serbia. It has 5 Sectors/Departments (for agrarian policy, rural development, implementation, control and legal & finance) and 4 Directorates (veterinary, phytosanitary, water management and forestry).
In 2006 MAFWM employed slightly less than 1000 staff. The following matrix provides an overview of the human resources in the MAFWM grouped according to their tasks (policy formulation, implementation and control).
Table 12: Human resources in the MAFWM Functions Sectors Directorates TOTAL %
Policy 45 28 73 7.5 Implementation 66 77 143 14.8 Control 146 602 748 77.6 TOTAL 257 707 964
Source: MAFWM
The Institute for Science Application in Agriculture (ISAA) is besides the MAFWM another institution in the field of agricultural and food polices, which provides extension services (please refer to chapter 6.2. above). The Republic Directorate for Commodity Reserves within the Ministry of Trade, Tourism and Services is responsible for the protection of domestic production and promotion of exports while the Sector for Market Inspection in the same ministry is supervising the enforcement of laws in the field of market supply and prices. In order to meet the future challenges the MAFWM is planning the establishment of a number of additional agencies such as a Land Agency (to improve land markets), a Payment Agency (likely to be Directorate reporting to MAFWM) and a Centre for Cooperative Development.
In 2004, MAFWM drafted an Agricultural Strategy for Serbia, which was adopted after public discussion by the Serbian Government in August 2005. The Ministry’s plan is ambitious in terms of the timeframe. Most of the policy measures are intended to be implemented in 2005 and 2006, all of them at the latest either by 2010 or on the date of a possible EU membership. As a corollary of the Strategy, a new Law on Agriculture and Rural Development is being elaborated (in 2006) to constitute the legal basis for multi-annual Programmes (a) for Agriculture (b) for Rural Development, which will resemble closely the corresponding pillar I and pillar II of the EU’s CAP.
Capacity and institution building is a key issue of the Agricultural Strategy which includes also the introduction of a monitoring system. The strategy is clearly focused on further steps towards EU and WTO membership. Therefore all agricultural policy measures foreseen are in line with the general approach of the CAP. The government is looking for the “optimal” level of protection in an effort of securing increased competitiveness for agriculture coupled with sustainable development for the rural economy of the country. In this regard, direct

ARCOTRASS- Consortium Study on the State of Agriculture in Five Applicant Countries
Country Report: Serbia page 35
subsidies are gradually being reduced and more emphasis is placed on structural and rural development policy measures.
Undoubtedly, the biggest challenge for Serbia will be the institutional changes and the capacity building that will be necessary for creating a system comparable to EU countries. Moreover, Serbia has to adjust border control, create a system of laboratories and clarify and define the role of institutions avoiding overlapping of responsibilities.
7.2 BUDGETARY RESOURCES
Table 13 provides an overall view of the development of the agricultural budget in Serbia during the period 2000 – 2005. The most striking feature is the dramatic increase in public resources devoted to agriculture during the period under consideration and particularly during the last three years:
Table 13: Agricultural budget in Serbia (in Million Euro) Description 2000 2001 2002 2003 2004 2005
Total state budgetary expenditures 1 909 1 810 3 795 5 439 5 108 5 261Budgetary expenditure for agro-food sector *
95.1 90.4 141.5 162.1 292.9 230.2
of which:
Budgetary market price support measures
42.9 39.0 49.9 47.7 107.9 67.1
Share of total budget 45% 43% 35% 29% 37% 29%
premium for milk production 42.9 39.0 42.8 44.6 44.9 37.7
premium for crop production 0.0 35.7 17.3
premiums for wheat purchase 7.1 3.3 27.3 12.2
Direct payments 14.3 21.3 40.7 0.8 5.1
Share of total budget 16% 15% 25% 0% 2%
Investment support for planting new vineyards and plantations of plums
2.3 2.1 0.8 5.0
Premium for crop production 14.3 19.0 38.6 0.1
Input subsidies 3.6 2.3 3.6 4.1 21.2 9.7
Share of total budget 4% 3% 3% 3% 7% 4%
Refunding for production and supply of quality breeding animals
3.6 2.3 3.6 4.1 5.5 4.9
Refunding for fertilizers and Diesel fuel 15.7 4.9
LFA payments
premium for milk
Environment friendly production support
Farm investment support 9.7 70.5 25.6Share of total budget 6% 24% 11%
Support for upgrade milk quality 12.3 9.7
Expanding agricultural households and improving chemical quality of the land;
9.7 5.1 5.8
Support for mechanization and equipment 51.4 9.1
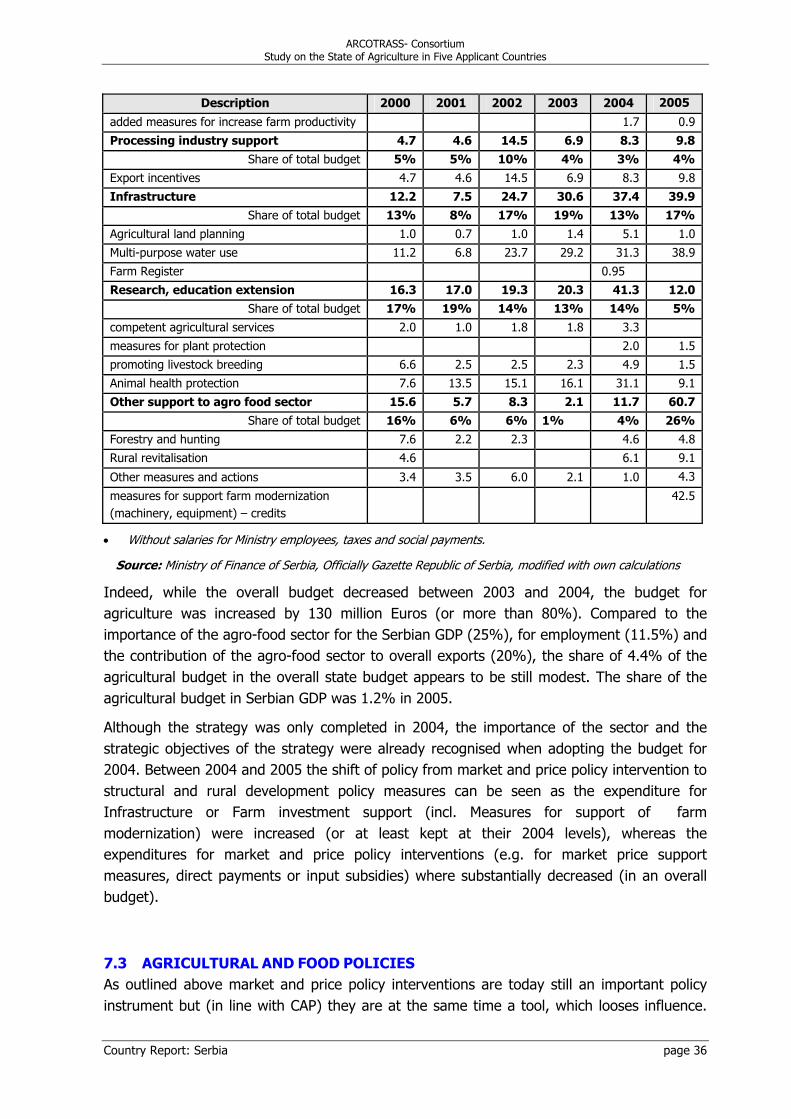
ARCOTRASS- Consortium Study on the State of Agriculture in Five Applicant Countries
Country Report: Serbia page 36
Description 2000 2001 2002 2003 2004 2005
added measures for increase farm productivity 1.7 0.9
Processing industry support 4.7 4.6 14.5 6.9 8.3 9.8Share of total budget 5% 5% 10% 4% 3% 4%
Export incentives 4.7 4.6 14.5 6.9 8.3 9.8
Infrastructure 12.2 7.5 24.7 30.6 37.4 39.9Share of total budget 13% 8% 17% 19% 13% 17%
Agricultural land planning 1.0 0.7 1.0 1.4 5.1 1.0
Multi-purpose water use 11.2 6.8 23.7 29.2 31.3 38.9
Farm Register 0.95
Research, education extension 16.3 17.0 19.3 20.3 41.3 12.0Share of total budget 17% 19% 14% 13% 14% 5%
competent agricultural services 2.0 1.0 1.8 1.8 3.3
measures for plant protection 2.0 1.5
promoting livestock breeding 6.6 2.5 2.5 2.3 4.9 1.5
Animal health protection 7.6 13.5 15.1 16.1 31.1 9.1
Other support to agro food sector 15.6 5.7 8.3 2.1 11.7 60.7Share of total budget 16% 6% 6% 1% 4% 26%
Forestry and hunting 7.6 2.2 2.3 4.6 4.8
Rural revitalisation 4.6 6.1 9.1
Other measures and actions 3.4 3.5 6.0 2.1 1.0 4.3
measures for support farm modernization (machinery, equipment) – credits
42.5
• Without salaries for Ministry employees, taxes and social payments.
Source: Ministry of Finance of Serbia, Officially Gazette Republic of Serbia, modified with own calculations
Indeed, while the overall budget decreased between 2003 and 2004, the budget for agriculture was increased by 130 million Euros (or more than 80%). Compared to the importance of the agro-food sector for the Serbian GDP (25%), for employment (11.5%) and the contribution of the agro-food sector to overall exports (20%), the share of 4.4% of the agricultural budget in the overall state budget appears to be still modest. The share of the agricultural budget in Serbian GDP was 1.2% in 2005.
Although the strategy was only completed in 2004, the importance of the sector and the strategic objectives of the strategy were already recognised when adopting the budget for 2004. Between 2004 and 2005 the shift of policy from market and price policy intervention to structural and rural development policy measures can be seen as the expenditure for Infrastructure or Farm investment support (incl. Measures for support of farm modernization) were increased (or at least kept at their 2004 levels), whereas the expenditures for market and price policy interventions (e.g. for market price support measures, direct payments or input subsidies) where substantially decreased (in an overall budget).
7.3 AGRICULTURAL AND FOOD POLICIES As outlined above market and price policy interventions are today still an important policy instrument but (in line with CAP) they are at the same time a tool, which looses influence.

ARCOTRASS- Consortium Study on the State of Agriculture in Five Applicant Countries
Country Report: Serbia page 37
The Agricultural Strategy foresees a stronger emphasis on structural and rural development measures and less intervention in the market and price policy. Nevertheless in 2005 still almost half of the overall agricultural budget was devoted to it. Table 14 summarizes the main measures of Serbian Agricultural Market and Price Policies and analyses their effect.
Table 14: Market-price support in Serbian agricultural sector in 2006 Contents of measure Policy Implementation/Effect
Market support measures
Administrative price control no
Foreign trade protection
yes
Present level of tariff protection does not deviate anymore significantly from the EU’s. Reduction will follow in SAA negotiations. Border control insufficiently synchronised.
Export incentive
yes
Incentives are benefits for the processing industry and the strengthening of the supply and production chain; which increases regional competitiveness. Their present existence is justified subject to obligatory defining of priorities; procedures are improved. According to WTO requirements, incentives have to be cancelled.
Ancillary measures for domestic market stabilisation
Intervention buying (storage costs)
no
. Only for wheat in period 2002-05
Other interventions on domestic market
no
Support to consumers (processors)
yes
Support for upgrading of standards and strengthening of productive interconnecting. The measure has positive effects: (i) sanitary safety of foodstuff for consumers (ii) better marketing potential for producers. It improves export position of the country.
Measures of budgetary support to products
Price compensations no
Direct payments
Direct payments per ha/head
Direct payments per other units
yes
Programs insufficiently diversified per types of farms, production regions, branches and lines of production (production programs).
Administration of these measures is in general very complex (reference yields and areas). Could be adjusted to existing systems (methodology of cadastral revenue accounting can serve as a basis).
Subsidising of production costs
Subsidies for breeding stock
Other subsidies
yes
The measure has a positive effect on the transfer of new technologies and technical-technological advancement of the sector.
Present procedures are complicated (e.g. VAT return)
Other direct payments
Damage compensation (for current production)
Business risk share and crop insurance stimulus envisaged from 2006. Even without institutional solution, the MAFWM

ARCOTRASS- Consortium Study on the State of Agriculture in Five Applicant Countries
Country Report: Serbia page 38
Contents of measure Policy Implementation/Effect
Damage compensation (for fixed assets)
no grants facilities and aid for regions endangered by natural disasters. Institutionalisation of measures and programs for these purposes necessary. E.g. only 50% arable areas in Serbia are protected against adverse water action.
Source: Bogdanov, N. (2005)
With the new Law on Agriculture and Rural Development, which still has to be adopted, a change in agricultural and food policies is expected. More emphasis shall be put on structural changes such as the establishment of a veterinary, phytosanitary and food control system in Serbia or the establishment of new institutions (see above). Furthermore market development measures shall have priority over price interventions or production subsidies. Such measures would include the development of the market infrastructure (e.g. warehouses, wholesale markets and market information systems), the development of a functioning land market and the increased introduction of quality standards at farm / enterprise level.
Taxation in Agriculture: In July 2004 the Law on Value-Added Tax (VAT) was adopted by the Serbian Government and became effective in January 2005. In order to compensate farmers for the VAT paid on the input for agricultural production a VAT compensation for farmers was introduced in parallel. This compensation is paid at a rate of 5% and in practice it is a separate tax, as registered VAT payers, who are purchasing agricultural produce from non-registered farmers have to pay a surcharge of 5% on the gross price.
7.4 FOOD SAFETY
Institutional Framework: MAFWM is currently one of the leading institutions in the development of food safety policy in Serbia, supported by its Veterinary and Phytosanitary Directorates, which have a regional network of offices throughout Serbia. MAFWM is also responsible for coordinating the services of some 12 veterinary laboratories and 5 phytosanitary laboratories (the number of the latter has considerably decreased recently).
Of equal importance is the Ministry of Health (MoH). The MoH has a network of approximately 36 regional public health institutes, which are also responsible for food safety issues and carry out inspections of food retail premises.
During 2002, the Serbian Government (supported by a project managed by the EAR) undertook a comprehensive analysis of the food chain safety system (veterinary, phytosanitary and sanitary control) in Serbia. With project assistance, MAFWM prepared and commenced implementation of an action plan for the reform and upgrading of the network of laboratories undertaking veterinary, phytosanitary and food-safety analyses.
In the 2002 assessment the upgrading of veterinary and phytosanitary laboratories was identified as one of the key issues for food safety in Serbia as none of the facilities for quality control were considered to be in line with EU standards and no reference laboratory was accredited by the European Food and Veterinary Office either (affecting exports opportunities). Ten years of economic embargo had hampered their modernisation.

ARCOTRASS- Consortium Study on the State of Agriculture in Five Applicant Countries
Country Report: Serbia page 39
In acknowledging the necessity of investments the EC has supported Serbia’s efforts to upgrade its system of food safety. In a first step the equipment of veterinary, phytosanitary and food-safety laboratories was upgraded and the laboratories themselves were refurbished. In addition facilities and equipment for the veterinary and phytosanitary inspection at external border crossings was supplied.
Today more than 50 % of the veterinary laboratories are now ISO-accredited and the number of phytosanitary laboratories has been reduced in an effort to focus investment and increase the standards of the remaining labs. Further investment in equipment, systems and personal are still required to raise the level and range of food testing and ultimately to allow Serbian producers greater access to lucrative export markets.
More recently EAR has supported the supply of information and communication technology to the MAFWM Directorates for Veterinary, Phytosanitary and Water Management affairs. National reference laboratories for food-safety, residues (veterinary medicines, herbicides, pesticides and the like) and phytosanitary issues at the Batajnica laboratory complex (work is still in progress) will be the heart of the reformed laboratory system (in the field of phytosanitary issues and food safety). A national reference laboratory for the most important animal diseases (including BSE) will also be reconstructed at the Veterinary Institute in Belgrade.
Veterinary and phytosanitary border inspection facilities at nominated border posts have been installed in order to ensure effective veterinary and phytosanitary control of imported food products.
A vital part of the food safety chain system is also movement control of animals and animal products. An animal identification system is currently being set up in order to improve animal health surveillance and therefore enhance livestock production. EAR has supported its establishment in the framework of the CARDS programme and is currently tendering the follow-up project (2006).
Food safety policies:
Since 2002, EAR provided in the framework of the CARDS 2003 Annual Programme, assistance to the Veterinary Directorate of MAFWM to prepare systems and procedures for the implementation of an EU compatible bovine animal identification and registration system. Through this support veterinary staff were trained, cattle have been tagged (by mid 2006 all bovine animal of Serbia were tagged and registered), animal passports printed, computers and software supplied and an awareness campaign for farmers and consumers conducted.
In addition the Serbian legislation has (partly) been aligned with the EU acquis, which included the elaboration of instruction manuals for veterinary inspectors as well as manuals for the Phytosanitary Directorate in MAFWM and the veterinary and phytosanitary inspectorates of MAFWM and the Ministry of Health’s sanitary inspectorates were trained. In 2005 the Serbian Parliament adopted the new Veterinary Law, developed with support from EU-funded technical assistance projects.
The Draft Food Safety Strategy for Serbia, which will form the basis for preparation of the priority Food Safety Law, has been developed and submitted to the Ministers of Agriculture

ARCOTRASS- Consortium Study on the State of Agriculture in Five Applicant Countries
Country Report: Serbia page 40
and Health for approval. Currently (October 2006) it appears that the adoption will be further put on hold as in December 2006 elections will be held. The Food Safety Law has to be adopted by Parliament and this will not happen before the elections, but in 2007 the earliest.
The issue of a Food Safety Strategy and a Food Safety Law is pending already for a number of years. Following the 2002 assessment it was initiated for the first time but the main obstacle remains to be defined, namely the division of responsibilities between the MAFWM and MoH. No clear position has yet been agreed upon between the institutions. The debate focuses upon the food chain. Whereas primary production of food originating from animals is within the responsibility of MAFWM, the situation is more difficult with respect to primary production of food of non-animal origin, where the Phytosanitary Directorate of MAFWM and the MoH have overlapping responsibilities under current Serbian laws. The same applies to the meat-processing industry. This situation, which has been “inherited” from former Yugoslavia (e.g. Slovenia had similar problems in re-organizing its food safety system), is further complicated by the fact that a separate authority from MAFWM is undertaking agricultural quality controls and the responsibilities for sanitary inspections are again overlapping.
Adoption of the strategy and, subsequently, the Food Safety Law is a pre-requisite to set-up a National Food Safety Agency, under whose authority the enforcement of the then adopted Food Safety Law would fall. So far no such institution is in place.
Currently by-laws for the new Veterinary Law are elaborated, which shall enable the implementation of the framework veterinary law. These secondary laws can be enacted by the Minister or the government and do not depend on the adoption in Parliament.
Currently under discussion is the Law on Health Protection of Plants, the Law on Plant Foods and Supplements as well as the Law on Plant Protection Resources are in preparation.
While in terms of the “hardware” significant progress has been made in recent years, it appears that the impact of new food safety policies with view to the health of consumers, animals and plants and the increase of Serbia’s access to export market has been somewhat hampered by the pending adoption of the Food Safety Law. A national registration system for producers and importers, as used in the EU, should be taken into account. A new Law on Quality Control of Agricultural and Food Products in Foreign Trade is not yet elaborated. A HACCP system should be legislated and institutionalised, initially certifying leading food industry companies (unless they are not already certified) and then undertaking phased certification of the entire industry on the basis of a map of industrial food capacities. It is assumed that these issued will not now be addressed until 2007 and the appointment of a new Government.

ARCOTRASS- Consortium Study on the State of Agriculture in Five Applicant Countries
Country Report: Serbia page 41
8 AGRICULTURAL TRADE AND TRADE POLICY
8.1 TRADE POLICY
Serbia’s shrinking current account deficit in agro-food foreign trade, which turned in 2005 even to a modest surplus, reflects the recent progress in the area of trade policy. The negotiations of trade agreements have provided the guiding framework for Serbian trade policy in recent years (see 8.1.2). The start of the negotiations with the EU on the Stabilization and Association Agreement (SAA) and the talks with WTO on a future WTO membership of Serbia have started to influence Serbian trade policy even they are not finished, yet.
In the first two-day talks with WTO in October 2005 Serbia submitted a Memorandum on the Foreign Trade Regime and information on domestic support and export subsidies in agriculture and a legislative plan of action. With view to agriculture in the WTO negotiations the Agreement on Agriculture (AoA) is of core importance. It requires Serbia to adjust its agricultural policies in the field of domestic support, market access and export subsidies. The commitments in the agreement require WTO member states to increase market access, and to reduce both domestic support and export subsidy expenditures. The AoA also includes references to non–trade concerns, listed as food security and environmental issues.
Import tariffs have been reduced and the institutional framework for trade policy has been strengthened. In November 2005 the Serbian parliament passed a foreign trade law consistent with WTO and EU regulations.
But not only multi-lateral agreements have influenced Serbia’s foreign trade but also bilateral trade agreements. The EU accession and the trade liberalization in the framework of Free Trade Agreements (FTAs) with neighbouring states in South East Europe must go hand in hand in order to avoid potential trade distortions.
In order to meet EU standards and make use of the unrestricted access to the EU-25 market MAFWM has established working groups to revise draft laws relating to food safety, veterinary services and phytosanitary measures.
8.1.1 Export Support
The agro-food trade balance was mostly negative since the mid 1990’s. Also due to the export support programme of the MAFWM 2005 was the first year with a positive trade balance since 2000. The Serbian government wants to further support this trend. Therefore in 2006 the agricultural budget foresees funds, which will be paid for the purpose of export development and promotion and for the purpose of identifying new markets with a low level of competitiveness (for products where Serbia has a surplus).
600 million Dinars (some 7.2 million Euro) are foreseen in 2006 to finance these export support measures. Funds are provided for short-term credits to creditworthy companies as assistance for the development of an export-oriented production portfolio based on already

ARCOTRASS- Consortium Study on the State of Agriculture in Five Applicant Countries
Country Report: Serbia page 42
concluded export contracts. But the budget includes also funds for export subsidies, which include the following products:
• Baby beef (20% subsidy) • Concentrated foodstuff (5% subsidy) • Dairy product, except ice-cream (20% subsidy) • Temporary preserved, dry vegetables, preserved fruits, dry fruits, natural juices
aside exotic frits juices, jam, fresh fruit and vegetables (7% subsidy) • Refined oil (10% subsidy) • Wine and natural brandy (rakija) (10% subsidy)
The Ministry of International Economic Relations, the Ministry of Economy, the Chamber of Commerce and the “Serbia Investment and Export Promotion Agency” (SIEPA) are the key trade support institutions in Serbia. It appears that the activities of these institutions are not fully coordinated and that with the given resources the impact could be further increased.
An example for a very targeted export support is “SerbianFruit”. Fruits are the biggest single agricultural export commodity of Serbia and thus important for the country. “SerbianFruit” is an initiative to further increase exports of fresh and processed fruits, which has been launched with the support of an USAID project.
8.1.2 Trade Agreements
Following the democratic changes in Serbia, isolation was lifted and, at the Zagreb summit in November 2000, the FRY became a full member of the Stabilization and Association process (SAp). Agreements on free trade in the South Eastern European region were signed within the South Eastern European Cooperation Process (SEECP) and based on the Memorandum of Understanding on Trade Liberalization and Facilitation (Brussels, 2001). The SCG (formerly FRY) took an active part in the process and signed six Free Trade Agreements (with Bosnia and Herzegovina, Croatia, Albania, Bulgaria, Romania and Moldova). With the former Yugoslav Republic of Macedonia and Russia, the Agreements were signed earlier, in 1996 and 2000, respectively. The FTA with the former Yugoslav Republic of Macedonia was further refined and from June 2006 trade has been fully liberalised between the two countries (in the FTA of 1996 the former Yugoslav Republic of Macedonia protected agricultural products with customs duties).
Serbia is currently in negotiations for joining the Central European Free Trade Agreement (CEFTA). CEFTA is a trade agreement between Croatia, Romania, Bulgaria and the former Yugoslav Republic of Macedonia13. Serbia did not sign the CEFTA agreement, yet.
After having started preparations for WTO accession as part of the Federal Republic of Yugoslavia (FRY) in 2001 the government of the Republic of Serbia applied in 2004 for accession to the WTO as a separate customs territory (i.e. without Montenegro). WTO established a Working Party to examine Serbia's application on 15 February 2005 and the
13 Former CEFTA members are Poland, the Czech Republic, Slovakia, Hungary and Slovenia

ARCOTRASS- Consortium Study on the State of Agriculture in Five Applicant Countries
Country Report: Serbia page 43
original application by the FRY was accordingly deemed withdrawn. Serbia's Memorandum on the Foreign Trade Regime was circulated in March 2005 and initial two-day talks were held in October 2005. An initial market access offer on goods was submitted in April 2006. In June 2006 in a second round of talks the examination of Serbia's foreign trade regime was continued.
Integration into WTO and EU opens new big markets and offers a lot of potential. In order to succeed and actually make use of the access to new markets immense improvements in productivity and quality (standards) are needed. Market liberalisation is seen as the main engine for innovation and competitiveness.
8.1.3 Border Protection
Since 2001 the maximum tariff has been reduced from 40% to 30%, and the tariff structure has been simplified to six bands (1%, 5%, 10%, 15%, 20%, 30%). Most agricultural commodities continue to benefit from the maximum rates of protection of 20% and 30% (see table further down)
Tariff rates for 170 products have been increased (in fact, they were returned to the their earlier level), and reduced for 164 products (mainly for those produced predominantly or exclusively in Montenegro and not needed anymore after founding SCG). The increased rates refer mostly to leather, furniture, electrical appliances, and the reduced ones to raw materials, such as ferrous metallurgy, wood, aluminium, and textiles. The total effect of these three changes (the increase in the number of tariff lines and the parallel reduction / increase in rates) is a drop in the nominal average tariff rate from 8.8 percent to 8.7 percent. There were no changes in the weighted rate – it is still around 6.3 percent.
Table 15: Tariffs in Serbia (2006)
Commodity Unit Tariff
Soft wheat Ad valorem tariffs 30% Specific tariffs in Euro/t Na Barley Ad valorem tariffs 20% Specific tariffs in Euro/t Na Grain maize Ad valorem tariffs 30% Specific tariffs in Euro/t Na Apples pears and peaches Ad valorem tariffs 15% Specific tariffs in Euro/t 116 Potatoes Ad valorem tariffs 30% Specific tariffs in Euro/t Na Sugar Ad valorem tariffs 20% Specific tariffs in Euro/t 140 Tomatoes Ad valorem tariffs 30% Specific tariffs in Euro/t Na Table wine Ad valorem tariffs 30% Specific tariffs in Euro/t Na Beef Ad valorem tariffs 30% Specific tariffs in Euro/t 174

ARCOTRASS- Consortium Study on the State of Agriculture in Five Applicant Countries
Country Report: Serbia page 44
Commodity Unit Tariff
Pork meat Ad valorem tariffs 30% Specific tariffs in Euro/t 488 Poultry meat Ad valorem tariffs 30% Specific tariffs in Euro/t 291 Sheep and goat meat Ad valorem tariffs 30% Specific tariffs in Euro/t 419 Butter Ad valorem tariffs 30% Specific tariffs in Euro/t 407 Cheese Ad valorem tariffs 30% Specific tariffs in Euro/t 930 Eggs Ad valorem tariffs 5% Specific tariffs in Euro/t Na
Source: European Commission, “DG-Trade Applied Tariffs Database” for the year 2006
An overview of the nominal protection for selected agricultural commodities calculating a nominal protection coefficient (for 2002) is provided in Annex 3 of this report.
8.2 AGRICULTURAL TRADE
Serbia has an overall huge trade deficit. Agricultural and food products contribute significantly to Serbian foreign trade. The agro-food trade balance was mostly negative since the mid 1990’s, too. 2005 was the first year with a positive trade balance since 2000.
Table 16: Share of Agro-food trade in total trade 2005 Serbia
Agro-food export/ total export 20%
Agro-food import/ total import 7%
Agro-food trade/ total trade 10 %
Source: Own calculation based on data from UN Comtrade and Bureau of Statistics of the Republic of Serbia
Compared to other sectors of Serbian economy the agro-food sector plays a very prominent role in overall trade. The agro-food sector accounted for some 20% of total Serbian exports (see table above), a very high share not only compared to the EU-25 (6%) but also to neighbouring countries like Croatia and Bosnia and Herzegovina (both less than 10%). The share of the agro-food sector of 7% in total Serbian imports on the other hand is rather low compared to some of the neighbouring countries (Bosnia and Herzegovina, which is the main export market of Serbia, has a share of 20%) and comparable to the EU-25 (6%).
A wide range of processed meat, fruit and vegetable products are exported to neighbouring countries in the former Yugoslavia. Demand for such products is increasing in response to economic recovery and growth. Relatively low costs of raw materials and labour, plus well-established market links will help to preserve these markets in the short-term, but increased attention to production efficiency, marketing and product development will be essential if these products are to retain their market share.

ARCOTRASS- Consortium Study on the State of Agriculture in Five Applicant Countries
Country Report: Serbia page 45
Table 17: Agricultural Trade (global) in Million Euro 2000 2001 2002 2003 2004 2005 EXPORT
World 320.1 353.6 564.9 514.5 650.2 722.5 Thereof EU-25 154.2 211.7 326.3 288.4 346.2 393.4
IMPORT World 310.4 505.9 580.2 575.8 692.3 612.8 Thereof EU-25 113.1 226.5 258.7 269.3 309.7 276.8
BALANCE World 9.7 -152.3 -15.3 -61.3 -42.1 109.7 Thereof EU 41.1 -14.8 67.6 19.1 36.5 116.6
Source: Bureau of Statistics of the Republic of Serbia.
Bosnia and Herzegovina, which was the destination of more than 25% of Serbians agro-food exports in 2005 (some 175 million Euro) and the former Yugoslav Republic of Macedonia (some 60 million Euro and approx. 8% of total exports) have been the most important (single) export markets for Serbian exports in 2005, followed by Russia and Romania. The EU –25 as a whole absorbed by far the largest share of Serbian agro-food exports totalling some 390 million Euro or almost 55% of total exports (please refer for data to Annex 3 of this report and for “Trade with EU” to chapter 8.3). It appears that the FTAs with Bosnia and Herzegovina, the former Yugoslav Republic of Macedonia, Romania and Russia have increased foreign trade with these countries and as a consequence increased the overall Serbian agro-food exports.
Much of Serbia's recent trade with Russia and Romania has involved the exchange of wheat and maize for energy and fertilizer (barter trade). A wide range of food and agricultural products is imported, with the EU as the largest origin of imports. Please refer to Annex 3 for a more detailed list of agro-food export and import according to export destinations /import origin.
It is expected that both volume and pattern of agro-food foreign trade will change significantly in 2006. In 2006 Serbia and Montenegro have become separate autonomous countries and now Serbia is a net exporter of agro-food stuffs to Montenegro – exports that didn't exist before as legally speaking Montenegro was still the member of the State Union with Serbia.
8.2.1 Serbian Agro-food trade by sub-sectors
The top three exports in 2005 in value are (million €): Prepared fruits and vegetables - with berry fruits being the top commodity (235), refined sugar (110) and maize (83). Cigarettes (79 - with raw tobacco accounting for another 19), prepared food (70), chocolate products (50), were the top three imported products in 2004 (in million of euros)14. It is remarkable that agricultural produce (or basically processed agricultural produce) is accounting for the biggest revenues in exports while imports are dominated by processed industrial crops. It seems that Serbian agriculture is meeting the domestic demand while the Serbian Food and 14 Data from Bureau of Statistics (Exports 2005) and FAO (Imports 2004)

ARCOTRASS- Consortium Study on the State of Agriculture in Five Applicant Countries
Country Report: Serbia page 46
Tobacco Industry is lacking behind. Annex 3 of this report contains tables for export/import of all 24 chapters.
Fruits and Vegetables are the most important sub-sector for Serbian exports. Exports of frozen fruit increased to 140,000 tons in 2005, with combined revenues from fruit and vegetable exports of Euro 235 mio. In 2006 in the first 9 months alone vegetables and fruit (Euro 205 mio), an increase of more than 15% compared to 2005.
The most important commodity within this sub-sector is berry fruit, with an established presence in the markets of Western Europe due to its high quality and competitive price. As most Serbian berry fruit is currently exported in bulk, there is potential to further add value to what is already a high-value commodity. The export of fruit juices (and concentrates for juice production) is increasing while apples, peaches and cherries are important agricultural produce for the export.
Cereal exports are significant, particularly maize. In 2005 Serbia's maize exports amounted to some 80 million Euro. Wheat exports totalled some 16 million Euros the same year. It appears that Serbia's cereals sector is meeting the domestic demand unless bad weather causes bad yields. While traditionally a net exporter Serbia became a net importer of wheat in 2004 (following a bad harvest in 2003) and of maize in 2001 (following a bad harvest in 2000). While not fully competitive with major Central European exporters such as Hungary, Serbian cereals are nevertheless competitive in neighbouring former Yugoslav Republic of Macedonia, Bosnia and Herzegovina, Montenegro and Kosovo – all of which have large structural cereal deficits. An increase in on-farm productivity (higher yields, lower production costs) would further improve the competitiveness of wheat and maize.
Sugar is Serbia's most interesting foreign trade commodity as it is one of the top export commodities (110 mio Euro for refined sugar in 2005) as well as one of the top import commodities (15 mio Euro in 2004 plus 20 mio Euro for sugar confectionary, 35 mio Euro for pastry and 50 mio Euro for chocolate products). As foreign trade in sugar is mainly with the EU-25, sugar trade is further analysed in the next section 8.3 “Agricultural Trade with the EU”.
As stated above tobacco products belong to Serbia’s main imported commodities. In 2004 tobacco products accounted for almost 100 million Euro (79 million Euro for cigarettes and 19 million Euro for raw tobacco). Most of the imports are coming from neighbouring countries, where in former Yugoslav times the cigarette industry was located.
Serbia is a net importer of pig meat for many years given the fact that its own production does not entirely ensure adequate supply in this commodity. In the cattle sub-sector Serbia is increasingly importing live cattle while it has become a net exporter in beef & veal. Poultry and sheep & goat are negligible for foreign trade.
8.3 AGRICULTURAL TRADE WITH THE EU
In recent years two elements have influenced the relationship between the EU and Serbia significantly and led to an accelerated increase in foreign trade: In November 2000 the EU gave preferences to Serbia and other countries in Western Balkans by abolishing all EU
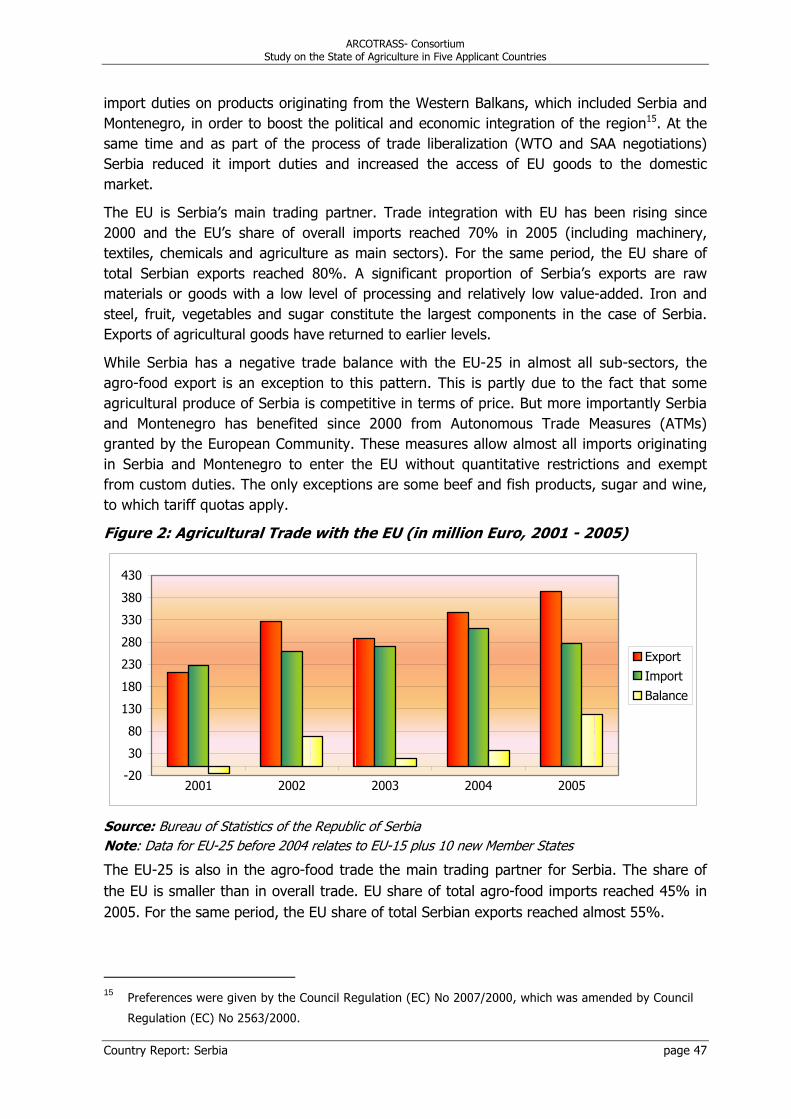
ARCOTRASS- Consortium Study on the State of Agriculture in Five Applicant Countries
Country Report: Serbia page 47
import duties on products originating from the Western Balkans, which included Serbia and Montenegro, in order to boost the political and economic integration of the region15. At the same time and as part of the process of trade liberalization (WTO and SAA negotiations) Serbia reduced it import duties and increased the access of EU goods to the domestic market.
The EU is Serbia’s main trading partner. Trade integration with EU has been rising since 2000 and the EU’s share of overall imports reached 70% in 2005 (including machinery, textiles, chemicals and agriculture as main sectors). For the same period, the EU share of total Serbian exports reached 80%. A significant proportion of Serbia’s exports are raw materials or goods with a low level of processing and relatively low value-added. Iron and steel, fruit, vegetables and sugar constitute the largest components in the case of Serbia. Exports of agricultural goods have returned to earlier levels.
While Serbia has a negative trade balance with the EU-25 in almost all sub-sectors, the agro-food export is an exception to this pattern. This is partly due to the fact that some agricultural produce of Serbia is competitive in terms of price. But more importantly Serbia and Montenegro has benefited since 2000 from Autonomous Trade Measures (ATMs) granted by the European Community. These measures allow almost all imports originating in Serbia and Montenegro to enter the EU without quantitative restrictions and exempt from custom duties. The only exceptions are some beef and fish products, sugar and wine, to which tariff quotas apply.
Figure 2: Agricultural Trade with the EU (in million Euro, 2001 - 2005)
-20
30
80
130
180
230
280
330
380
430
2001 2002 2003 2004 2005
ExportImportBalance
Source: Bureau of Statistics of the Republic of Serbia Note: Data for EU-25 before 2004 relates to EU-15 plus 10 new Member States
The EU-25 is also in the agro-food trade the main trading partner for Serbia. The share of the EU is smaller than in overall trade. EU share of total agro-food imports reached 45% in 2005. For the same period, the EU share of total Serbian exports reached almost 55%.
15 Preferences were given by the Council Regulation (EC) No 2007/2000, which was amended by Council
Regulation (EC) No 2563/2000.
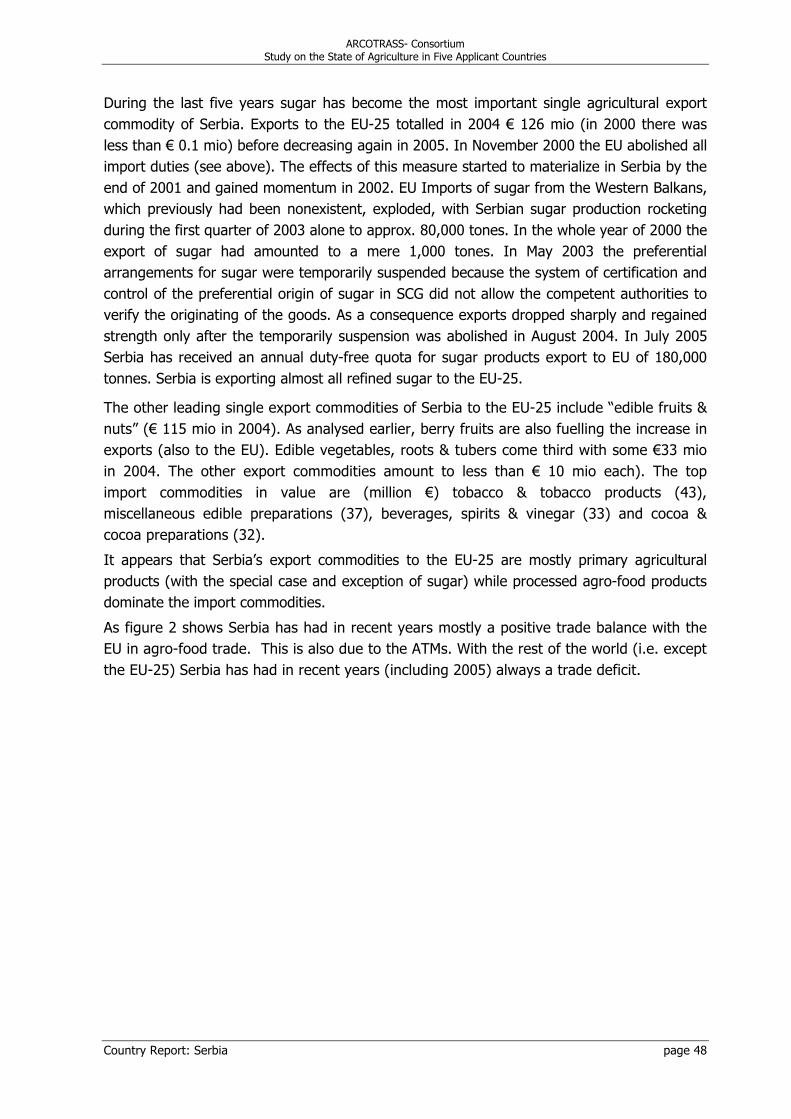
ARCOTRASS- Consortium Study on the State of Agriculture in Five Applicant Countries
Country Report: Serbia page 48
During the last five years sugar has become the most important single agricultural export commodity of Serbia. Exports to the EU-25 totalled in 2004 € 126 mio (in 2000 there was less than € 0.1 mio) before decreasing again in 2005. In November 2000 the EU abolished all import duties (see above). The effects of this measure started to materialize in Serbia by the end of 2001 and gained momentum in 2002. EU Imports of sugar from the Western Balkans, which previously had been nonexistent, exploded, with Serbian sugar production rocketing during the first quarter of 2003 alone to approx. 80,000 tones. In the whole year of 2000 the export of sugar had amounted to a mere 1,000 tones. In May 2003 the preferential arrangements for sugar were temporarily suspended because the system of certification and control of the preferential origin of sugar in SCG did not allow the competent authorities to verify the originating of the goods. As a consequence exports dropped sharply and regained strength only after the temporarily suspension was abolished in August 2004. In July 2005 Serbia has received an annual duty-free quota for sugar products export to EU of 180,000 tonnes. Serbia is exporting almost all refined sugar to the EU-25.
The other leading single export commodities of Serbia to the EU-25 include “edible fruits & nuts” (€ 115 mio in 2004). As analysed earlier, berry fruits are also fuelling the increase in exports (also to the EU). Edible vegetables, roots & tubers come third with some €33 mio in 2004. The other export commodities amount to less than € 10 mio each). The top import commodities in value are (million €) tobacco & tobacco products (43), miscellaneous edible preparations (37), beverages, spirits & vinegar (33) and cocoa & cocoa preparations (32).
It appears that Serbia’s export commodities to the EU-25 are mostly primary agricultural products (with the special case and exception of sugar) while processed agro-food products dominate the import commodities.
As figure 2 shows Serbia has had in recent years mostly a positive trade balance with the EU in agro-food trade. This is also due to the ATMs. With the rest of the world (i.e. except the EU-25) Serbia has had in recent years (including 2005) always a trade deficit.

ARCOTRASS- Consortium Study on the State of Agriculture in Five Applicant Countries
Country Report: Serbia page 49
9 RURAL DEVELOPMENT AND RURAL POLICY
9.1 MAIN CHARACTERISTICS OF RURAL AREAS
Contrary to OECD definition16 rural areas in Serbia are defined as space in which the main physical and geographical characteristic is predominantly the use of land for the production of biomass (agricultural and forestry land). According to this definition approximately 70% of Serbia can be classified as rural areas (compare also chapters 2.2 and 3, where “agricultural land” is analysed), “mixed settlements” cover about 25% and cities about 5% of Serbian territory.
Table 18: Demographic and Employment Data at NUTS I / NUTS II Level (2002)
NUTS I NUTS II
R.Srbija C.Srbija Vojvodina Total population (1000) 7,498 5,466 2,032 Area km2 77,474 55,968 21,506
Population density 96 98 94
Rural population (1000) 3,272 2,392 880
% rural of total 43.64 43.77 43.29
Importance of aged people (% people aged more than 65 years) 20.64 21.84 17.36
Demographic Labour Pressure (Ratio population aged 5-14 to population aged 55-64) 98.86 96.36 105.84
Total employed rural population 1,172,930 870,859 302,071
Employment as %of total employment
primary sector 46.46 47.93 42.23
secondary 39.25 38.36 41.83
tertiary 14.28 13.71 15.94
employment in agriculture, hunting, forestry and fisheries 527,898 401,440 126,458
Farmers younger than 35 319,593 227,536 92,057
Farmers older than 55 253,132 196,376 56,756
Ratio 35/55 1.26 1.16 1.62
female as % of total farmers population 48.57 49.15 46.94
Agricultural population older than 15:
Without formal education 982,440 765,371 217,069
Primary school 776,072 565,185 210,887
Secondary 841,647 573,402 268,245
Higher education (college and/or Faculty) 99,743 67,390 32,353
Unknown 54,681 47,694 6,987 Source: Bureau of Statistics of the Republic of Serbia Note: Rural areas in Serbian statistics is the rest of TOTAL-Urban. Urban in Serbia means - each settlement (usually the administrative centre of municipalty) with Area Utilisation plan!
16 The OECD definition of rural regions is based on population density. This definition has proven to be
useful in making international comparisons of rural conditions and trends.

ARCOTRASS- Consortium Study on the State of Agriculture in Five Applicant Countries
Country Report: Serbia page 50
According to table 18, in 2002 approximately 43% of the population lived in rural areas with hardly any difference between Vojvodina and Central Serbia. In the age structure there is a significant difference between the two regions. In Vojvodina approximately 17 % are aged more than 65 while this share of the population amounts in Central Serbia to almost 22%.
The next table provides a comparison of Serbian rural areas with the rural areas in the EU-25.
Table 19: Comparison of rural areas in EU and Serbia
EU countries Serbia 1. Basic parameters
Socio-economic structure
• 18% of total population in EU lives in predominantly rural areas
• 8% of economic active population is employed in agriculture
• 20% of active rural population working in agriculture
• Some 43% of Serbian population live in rural areas
• about 10% of economically active population working in agriculture
• 75-80% of active rural population is employed in agriculture
The state of agriculture
• High productivity
• Well equipped farms with average size of 20 ha
• High governmental support since 1960s.
• Low productivity, small farms (3,5 ha), poorly equipped
• Low and uncertain governmental support during decades
Rural infrastructure • Well developed • Neglected and undeveloped
Economy structure • Economic activities are diverse
• New rural businesses are created
• Economic activities poorly divers
• Insufficiency of rural business, low level of social services
2. Development potential
Human resources • High level of local resources • Low level of local resources – education, initiative
Education, vocational training
• Since the beginning 1970s supported from CAP
• Well developed Extension service
• Focused on farmers technical skills
• Recently new form of education (specific topics)
Cooperating association • Setting up of partnership
• Network of projects
• Without partnership, only individual projects
• Small progress in setting-up producers groups and association
Local community
• Developed profit organizations and Local Action Groups
• Innovative and effective local entrepreneurs and authorities
• Small influence and power of local community and informal groups
• Ineffective decision making process (top- down),
3. Programs and financial support
Funds, Financial sources
• Structural funds (LEADER I, II, LEADER+)
• National programs
• Donation, pilot projects
• Slight amount of money from Community (Municipality) budget (mainly for communal infrastructure)
Actors
• Governmental institutions
• Science
• Powerful non-governmental sector, Local action groups
• In MAFWM since 2005 established department for rural development
• NGO (small influence and funds)
• Local entrepreneurs and authorities

ARCOTRASS- Consortium Study on the State of Agriculture in Five Applicant Countries
Country Report: Serbia page 51
EU countries Serbia (only in communities which has innovative local authorities)
4. Priorities in development
Main rural development objectives
• Environment and countryside protection by reform of farming practices
• Multi-functionality
• Increasing productivity
• Trade, processing, SMEs
Aim on medium-term • Diversification of economic activities
• Developing of infrastructure
• Strengthening institutions and organizations of all actors
Strategies components and respectable factors
• Focus on viability of local community, by mobilization of local potentials
• Development of local sector of services, private-public partnership and network
• Focused on SMEs and rural tourism
• Poor funds and financial support
• Low level of employment and possibilities for new business opportunities
• local actors without initiative
Source: Own compilation
In terms of the socio-cultural, demographic and economic aspects Serbian rural areas are very heterogeneous. The censuses of 1991 and 2002 revealed that the total number of settlements has not changed in the time period between the two surveys. The same applies to the spread of settlements between cities and villages (see table 20).
Table 20: Number of settlements per type Total Serbia Central Serbia Vojvodina Census
years Total Urban Rural Total Urban Rural Total Urban Rural 1991 2002
4,694 4,697
168 169
4,526 4,528
4,230 4,230
116 116
4,114 4,113
464 467
52 52
412 415
Source: Lakic N, Popovic B. (2005)
Thus a further analysis is needed to reveal the heterogeneous state of rural areas in Serbia17.
The share of rural settlements in the total number of settlements is (naturally) extremely high and, according to the latest census, 96.4% of the settlements in Serbia, excluding Kosovo and Metohia, are rural. While this share in Central Serbia is 97.23%, it is only 88.86% in Vojvodina. One explanation is that according to the stipulated methodology, daily commuters are considered the inhabitants of a place in which their household is located. Thus the percentage of farming population in these settlements is reduced and the settlements wherein they live are sometimes classified as urban although they would not be classified as such according to other criteria (e.g. compare the definition of “rural area” as explained above). Generally three types of villages can be observed in Serbia:
• ”Urbanised” villages: Located near big cities as production and consumption centres (Belgrade, Novi Sad, Nis, Kragujevac etc). Agricultural production is intensive and
17 It should be noted that opposed to the censuses in 1991 and 2002 in the post-war period more criteria were
applied for defining rural settlements. Therefore in the censuses of 1953, 1961 and 1971 three categories of settlements were used: urban, rural and mixed.

ARCOTRASS- Consortium Study on the State of Agriculture in Five Applicant Countries
Country Report: Serbia page 52
market-oriented while non-agricultural activities (e.g. in SMEs) are not exclusively connected with food production. The demographic structure in these villages is more favourable than in the two other types of the villages, while infrastructure is often even better than in urban or suburb settlements. In these areas the share of mixed and non-agricultural households is bigger than the share of active agricultural households. The spread of industry as well as of other non-agricultural activities to these urbanized villages has led to a more dynamic urbanisation. The standard of living is getting close to the urban areas, thus the prospects of such settlements are quite good.
• Villages in “transitory” zones: These types of villages are prevailing in Serbia. Villages of this (second) type can be found in areas with more intensive agricultural production. In those areas usually the rural environment is better preserved than in the urbanized villages of type one. The agricultural production in these areas reflects the overall development of agriculture in the last 20 years (see chapters above). There are some bigger, economically stronger households with a relatively big area of their own farmland or of rented land. They are usually important market producers and employ additional labour force on either a part-time or a full-time basis. These households have better agricultural machinery, which they sometimes use for carrying out agricultural contracting services for other farmers (horizontal integration). Vertical integration takes place, too (trade or basic processing, e.g. feed mixing plants, mills, etc.). Most households have only a small plot. They focus on primary production, which often serves their subsistence, while the market surplus is small and sporadic. Active agricultural households are dominant compared to the mixed or non-agricultural ones, while other activities (if they exist) are usually closely linked with agriculture (transport, processing, trade).
• “Empty“ villages: These are rural settlements, which are disappearing; where migration has led to depopulation leaving behind an elderly population and devastation. These villages are typically far from rural centres or big cities, and either there is no access at all to communal infrastructure or the infrastructure is in poor shape (e.g. still destroyed). Mountainous regions and even some lowland areas are staying behind. But “empty villages can even be found in some of the most intensive agricultural regions e.g. Vojvodina (hillsides of Fruska Gora, North-eastern and Southern part of Banat). For instance only about 10% of grants for rural development were approved to those areas due to low capacity of local population to launch ideas and shape means. There is generally lack of knowledge how to produce in a competitive manner and lack of knowledge how to market products. Advisory services have been withdrawn from these areas; research is poor and not applicable and only very few project were recently launched and financed by the international community. Those, who work out there, have shown, however, that knowledge transfer can really make a difference.
Serbia’s rural areas are suffering from a diverse range of problems. One of the most significant problems is the farm structure. Farms are not only small, but also fragmented which generates high production costs and low productivity and most of the farms are

ARCOTRASS- Consortium Study on the State of Agriculture in Five Applicant Countries
Country Report: Serbia page 53
engaged in (semi-) subsistence agriculture. The market infrastructure is weak and doesn’t support the production of a bigger marketable surplus.
Alternatives to agriculture are scarce and the institutional (social welfare, education) and physical infrastructure is undeveloped. The system of vocational education in some rural areas is difficult to organize. There is visible progress in telecommunication and water supply, but still shortfalls in the sewage system and treatment. The road infrastructure is also undeveloped or neglected
9.1.1 Characteristics of Rural Population and Labour Markets
Until the Second World War, about 80% population in Serbia lived in villages. After the war, there came a massive relocation of people from village to town because of society modernization, industrialization and urbanization. This resulted in significant changes in the number of rural population in the post-war period. After the Second World War, constant decline is recorded in the share of rural population in total population of the analysed region. The share of rural population in the total population has dropped from 80% to about 43% (see table 18).
Almost all of them are involved with agriculture, and 75 % of them have no other source of income. Agriculture is fundamental for rural economy, as the welfare of rural people is dependent on the success of agriculture. However, the development of rural areas was limited for decades and in some aspects and regions where economic and social development was frozen for years because of badly defined agrarian and rural policy. In particular in remote and mountainous areas the population is declining and ageing, and the young people remaining in the countryside are frequently unemployed. Especially in those parts of Serbia where commuting is possible, members of farming households often work at least part-time in off-farm employment.
Table 21 illustrates a dramatic change in the structure of rural areas. Whereas between 1991 and 2002 the total number of farms decreased by 22%, the number of farms, which were actually used for agricultural production decreased by almost 50%. On the other hand farms without farmers, e.g. subsistence farms or families with non-agricultural activities, even increased compared to 1991. One possible explanation for the decrease in commercial farms is the age structure. The data for 1991 reveals that then the share of farms (with 1, 2 or 3 farmers) with farmers aged 60 or older was far higher than 11 years later. It appears that (ceteris paribus) after the old farmers retired their farms were mostly transformed into subsistence farms, where the main professional occupation of all household members is non-agricultural. In this respect the age structure of the remaining commercial farms (with at least one farmer) in 2002 was more favourable than in 1991. It seems, however that the share of farmers aged 60 or older remains also in 2002 quite high if compared to the age structure of the overall active population.

ARCOTRASS- Consortium Study on the State of Agriculture in Five Applicant Countries
Country Report: Serbia page 54
Table 21: Farm structure, according to Censuses 1991 and 2002 1991 2002
Farms Number of farms
% Number of farms
% Index
2002/1991
T o t a l 997,235 100.0% 778,891 100.0% 78.1% without farmers* 503,598 50.5% 522,103 67.0% 103.7% Farms with 1 farmer . total number of farms . below 60 years of age . aged 60 and more years
270,385 144,727 125,658
27.1% 53.5% 46.5%
119,216 72,678 46,538
15.3% 61.0% 39.0%
44.1% 50.2% 37.0%
Farms with 2 farmers . total number of farms . both below 60 years of age . 1 below, 1 aged 60 or more years . both aged 60 and more years
154,132 69,393 42,628 42,111
15.5% 45.0% 27.7% 27.3%
94,795 50,738 18,738 25,319
12.2% 53.5% 19.8% 26.7%
61.5% 73.1% 44.0% 60.1%
Farms with 3 farmers . total number of farms . all below 60 years of age . 2 below, 1 aged 60 or more years . 1 below, 2 aged 60 or more years . all aged 60 and more years
45,577 16,788 18,349 9,456
984
4.6%
36.8% 40.3% 20.7% 2.2%
29,030 15,360 8,196 5,154
320
3.7%
52.9% 28.2% 17.8% 1.1%
63.7% 91.5% 44.7% 54.5% 32.5%
Farms with 4 and more farmers . total number of farms . of whom all aged 60 of more years
23,543
116
2.4% 0.5%
13,747
25
1.8% 0.2%
58.4% 21.5%
* “Without farmer” means that the farms are subsistence farms, where the main professional occupation of all household members is non-agricultural (please refer also to section 3.4.2) Source: Bogdanov N, Bozic D. (2005)
Based on relevant data of the latest census, active population performing work as per activities and sex in all settlements, as well as in Serbian villages, show that the highest percentage is employed in agriculture, followed by manufacturing industry and commerce.
In rural areas more than 45% of the active population is employed in agriculture, forestry, hunting and fishing (please see table 18 above). In rural areas the active population is mostly made up of men (62% male and 38 % female). While in absolute numbers more men than women are working in agriculture the share of active women in this sector is higher: 50% of the 444,241 active women in rural areas are working in agriculture, forestry, hunting and fishing while 42% of the 728,000 active men in rural areas are working in this sector18.
The manufacturing industry provides some 159,000 men (some 22% of the male active population) and some 76,000 women with work (some 17% of the female active population). In commerce some 49,000 men (some 7% of the male active population) and some 42,000 women (some 9% of the female active population) are working.
18 Data based on “Stevanovic D, Jelic S, Jovanovic T. (2005): Socio-demographical structure of population in
Serbia”
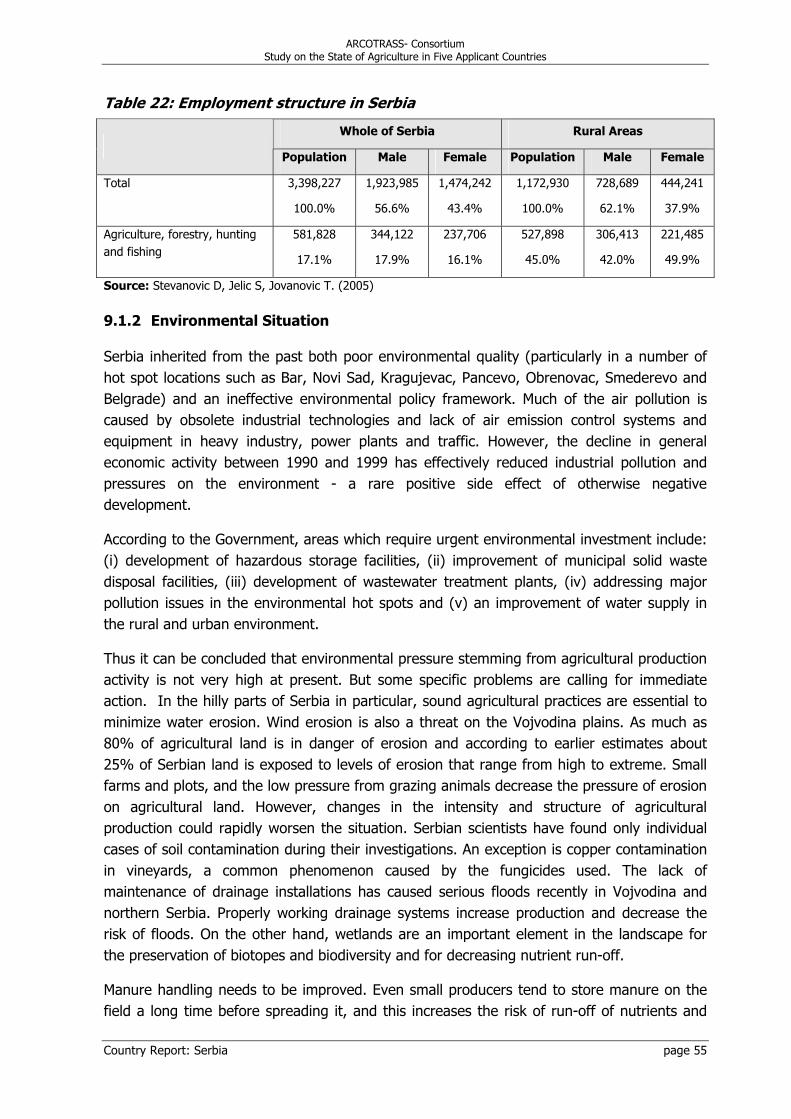
ARCOTRASS- Consortium Study on the State of Agriculture in Five Applicant Countries
Country Report: Serbia page 55
Table 22: Employment structure in Serbia
Whole of Serbia Rural Areas
Population Male Female Population Male Female
Total
3,398,227
100.0%
1,923,985
56.6%
1,474,242
43.4%
1,172,930
100.0%
728,689
62.1%
444,241
37.9%
Agriculture, forestry, hunting and fishing
581,828
17.1%
344,122
17.9%
237,706
16.1%
527,898
45.0%
306,413
42.0%
221,485
49.9%
Source: Stevanovic D, Jelic S, Jovanovic T. (2005)
9.1.2 Environmental Situation
Serbia inherited from the past both poor environmental quality (particularly in a number of hot spot locations such as Bar, Novi Sad, Kragujevac, Pancevo, Obrenovac, Smederevo and Belgrade) and an ineffective environmental policy framework. Much of the air pollution is caused by obsolete industrial technologies and lack of air emission control systems and equipment in heavy industry, power plants and traffic. However, the decline in general economic activity between 1990 and 1999 has effectively reduced industrial pollution and pressures on the environment - a rare positive side effect of otherwise negative development.
According to the Government, areas which require urgent environmental investment include: (i) development of hazardous storage facilities, (ii) improvement of municipal solid waste disposal facilities, (iii) development of wastewater treatment plants, (iv) addressing major pollution issues in the environmental hot spots and (v) an improvement of water supply in the rural and urban environment.
Thus it can be concluded that environmental pressure stemming from agricultural production activity is not very high at present. But some specific problems are calling for immediate action. In the hilly parts of Serbia in particular, sound agricultural practices are essential to minimize water erosion. Wind erosion is also a threat on the Vojvodina plains. As much as 80% of agricultural land is in danger of erosion and according to earlier estimates about 25% of Serbian land is exposed to levels of erosion that range from high to extreme. Small farms and plots, and the low pressure from grazing animals decrease the pressure of erosion on agricultural land. However, changes in the intensity and structure of agricultural production could rapidly worsen the situation. Serbian scientists have found only individual cases of soil contamination during their investigations. An exception is copper contamination in vineyards, a common phenomenon caused by the fungicides used. The lack of maintenance of drainage installations has caused serious floods recently in Vojvodina and northern Serbia. Properly working drainage systems increase production and decrease the risk of floods. On the other hand, wetlands are an important element in the landscape for the preservation of biotopes and biodiversity and for decreasing nutrient run-off.
Manure handling needs to be improved. Even small producers tend to store manure on the field a long time before spreading it, and this increases the risk of run-off of nutrients and

ARCOTRASS- Consortium Study on the State of Agriculture in Five Applicant Countries
Country Report: Serbia page 56
other substances. The most serious problems are caused by a number of very large pig farms. In these pig farms the manure ends up in large ponds with a considerable risk of water and groundwater contamination. Privatisation of these farms is under way and environmental criteria should be taken into account in this process. Currently these pig farms require a permission from the state in order to operate, but the procedure apparently is a mere formality. Furthermore pig farms are currently not subject to regular environmental inspections.
The quality of tap water in most areas of Serbia has been deteriorating since the beginning of the 1990s. The most frequent reason is the bacteriological contamination of the drinking water as a consequence of contamination of springs or the obsolete water supply infrastructure and water disinfection. The wells used for water supply are unsatisfactory. Underground wells are especially important for Serbia. According to estimates, they provide some 90% of the water supply for households and industry (and some 70% of the drinking water). In many regions water from this underground wells may not be used for drinking without prior purification. This is mainly true in some Vojvodina regions, which have a higher level of arsenic and manganese.
In rural municipalities a frequent problem is also the maintenance of the village water supply system (often due to ownership issues). The sanitary and sewage systems face similar problems. This results in an increasing risk of pollution of underground and drinking water, illegal connections to the existing network, and a lack of adequate sewage treatment.
9.2 RURAL DEVELOPMENT POLICY
Serbia has not yet established a national strategy specifically for rural development that would serve as a basis for a coordinated rural development policy, but some rural development activities exist within the wider agriculture policy19. Nevertheless, MAFWM has, during the past two years organised and regularly operates activities related to rural development support (rural development grant schemes and support to extension and advisory activities). The legal bases of rural development grant schemes and support to extension and advisory activities are based on a government decision-decree valid for one budgetary year only.
In 2004, MAFWM included a budget line for rural development support for the first time in its history. This budget line intends to support diversification of agriculture and rural economy, increasing efficiency of farming, adding value through processing, providing a favourable framework for a better, more sustainable use of available resources, providing alternative job opportunities, developing new marketing strategies and increasing the value of products.
In 2004 and 2005 MAFWM has supported the following rural development projects:
19 An EU financed and EAR managed TA project is currently being implemented in Serbia with the purpose
of (a) installing capacity within MAFWM in Rural Development Programming based on EU Best Practices, and (b) creating an accredited “Payment Agency” for disbursing subsidies to the rural population in a transparent and efficient manner, in accordance with EU Best Practices.

ARCOTRASS- Consortium Study on the State of Agriculture in Five Applicant Countries
Country Report: Serbia page 57
• The majority of the funds were allocated to the reconstruction and extension of local roads, electrification, water pipelines, as well as sewage systems. Total approved funds for these purposes amounted to 308 million Dinar (approx. 4 million Euro), which were awarded to 82 municipalities and local communities.
• Some of the funds were intended to support the diversification of rural economies through promotion of agro-eco-tourism, traditional crafts and processing. 47 cooperatives and NGOs received 127 million Dinar (approx. 1.6 million Euro) for these purposes.
• 575 million Dinar (7.4 million Euro) were approved for 513 young farmers for the implementation of investments such as irrigation systems, livestock, green houses, feed mixing facilities, mechanization, silos, packaging equipment, etc.
For 2006 it is planned to improve these forms of support in coordination with other Ministries, as e.g. Ministry for Capital Investments, Ministry of Economy and Tourism, Ministry of Social Affairs, Ministry of Local Self-Governance, Ministry of Science and Environmental Protection etc. The aim is to promote an inter-ministerial coordination through the creation of a governmental body for rural development.
Administrative capacity. MAFWM has set up a new department for rural and agricultural development in 2005. The department consists of:
• Division for rural development and advisory services
• Section for organic agriculture
• Section for genetic resources and biodiversity
Responsibilities include environmental and social issues and supervision and development of the agricultural extension network. The department has limited capacity in terms of staff. Thus the department is only partially capable of defining, planning and implementing the goals mentioned in the Agricultural Strategy for Serbia (see section 10.1).
The support for rural development in 2006 is aiming at an increase of sustainability of primary agricultural production in the rural environment, the development of rural economy and its diversification in order to increase sustainability of agricultural holdings and is finally aiming at the creation of effective mechanisms as well as infrastructure for rural development support.
Beneficiaries of the grant scheme, which currently is being implemented, are farmers, i.e. natural persons, if they are holders of registered farms (and if they have more than one year of farming experience and have status of insured farmer at the moment of application), farmers’ cooperatives registered in the farm registry, NGOs and units of local self-management. For farmers the target group is further defined: • Farmers not older than 40 in the regions with favourable conditions for development of
competitive and intensive agricultural production and
• Farmers not older than 55 in LFA for intensive agricultural production development

ARCOTRASS- Consortium Study on the State of Agriculture in Five Applicant Countries
Country Report: Serbia page 58
The objectives of the grant scheme are:
• Improvement of production / investments on farms: Purchase of machinery and livestock, reconstruction of housing facilities for livestock, purchase of agricultural equipment, protection from erosion and wind creation of protective zones;
• Improvement of the supply chain: Equipment and facilities for improvement of product storage and supply, certification of organic agriculture, promotion and protection of local products, support of processing and marketing;
• Development of rural areas: Activities related to maintaining of rural communities tradition, improvement of the living standard, diversification of activities which provide alternative incomes to farmers, management of water resources, education of farmers, establishment of producer groups, activities involved in protection of environment etc.
• Development and promoting of organic production: Building of facilities for activities aiming at development of organic production, support for establishment of organic production.
Table 23: Support to Rural Development in Serbia Contents of measure Policy Implementation/Effect
Compensations for producers
Compensations for more difficult production conditions
Price compensations
Compensations per head of cattle
Compensation per area
yes
Difference in amount of premium for milk between producers in planes and hilly-mountainous regions in favour of the latter has been a long-standing measure. Since 2006, the first diversification of incentives per regions dependent on production conditions. Heterogeneity of production and organisational-economic conditions per regions requires a broad list of products with diversified regional support.
Environmental compensations (reduced input consumption, environmental protection programs)
no Incentives for various ecological activities have been envisaged but are scarcely used. Low level of education and insufficiently informed potential users.
Support to rural development programs
Support to restructuring of agricultural estates (investments in estates, renewal of plantations, etc.)
yes
The increase of support for this purpose is a significant improvement of agrarian policy. Implementation of the policy required strengthening of institutions for transfer of know-how and technologies but also organisational (managerial) skills of farmers.
Other support to rural development (associations, infrastructure, mini plants, etc.)
yes
The measure has positive effect to diversification of economic activities and quality of living in rural regions.
Source: Bogdabov, N (2005)
Potential recipients will have to demonstrate their ability to co-finance their rural development projects / investments as the level of support ranges from 30-60% of the total investment cost. The level of support depends on whether the project is realized in less favoured areas (LFA) or in other regions. For the first time LFAs have been defined as "regions with natural limitations (high altitude, bad soil quality, arable land on steep slopes,

ARCOTRASS- Consortium Study on the State of Agriculture in Five Applicant Countries
Country Report: Serbia page 59
flooding and all kinds of erosion) as well as legal limitations for development of intensive agricultural production (protection of nature and protection of water sources)".
750 million Dinar (approx. 8.7 million Euros) – a further increase compared to 2004 and 2005 - are budgeted for rural development measures in 2006. Financial support is provided on a tender basis. A commission composed of representatives of farmers, media, research and development institutions as well as MAFWM representatives evaluates the applications. Control is provided through the inspection department, monitoring through the departments for implementation and legal affairs, and evaluation of the scheme through the section for rural and agricultural development, which are also revising the scheme on a yearly basis. Further improvements are seen in the establishment of an objective scoring system, where evaluation of each application is going to be based on a variety of pre-defined criteria.
The Agricultural Strategy for Serbia also sets out that for developing a rural development plan for Serbia a participatory approach shall be applied. This shall comprise regional rural development plans, which shall better target the needs of the specific regions. Furthermore a decentralised structure for rural development shall be built up and regional cooperation with neighbouring countries shall be introduced. Aforementioned EAR project in MAFWM provides support in implementing a participatory approach in rural development programming.
In the field of agricultural extension farmers are targeted directly. At the same time necessary infrastructure is built up. This refers to institutions, which serve public interest and cannot be fully left to private initiative (e.g. disease control).
Table 24: Extension services and veterinary services Contents of measure Policy Implementation/Effect
Agricultural extension service Direct services to producers
yes Envisaged by a pilot program for chosen farms. One of institutional priorities is extension of consultancy service activities, network rationalisation, work organisation, education of consultants.
General services to agriculture yes
Services covering laboratory analyses (quality tests, soil analysis) are partly subsidised. System of national laboratories not established.
Expert work and veterinary services Direct services to producers General services to agriculture Preventive veterinary measures
yes
Jobs transferred to the Veterinary Administration. Upgraded procedure of cattle marking. Part of preventive protection program is subsidised by government.
Research, education, infrastructure Source: Bogdanov, N. (2005)
9.3 REGIONAL POLICY
There are considerable disparities in regional development, with large rural areas lacking infrastructure and social development. The basic goals of the regional development policy are to decrease gradually regional disparities; prevent the further backsliding of underdeveloped areas such as southern Serbia; halt negative migration flows; and prevent the unplanned and irrational use of land.

ARCOTRASS- Consortium Study on the State of Agriculture in Five Applicant Countries
Country Report: Serbia page 60
Because of Serbia’s diversity not all policies and programs will favour all regions, and the response to given policies and programs will differ among regions. A participatory approach leading to a de-centralised elaboration of (regional) rural development plans is therefore essential. Many of the measures, policies and programs already designed, which aim at promoting agricultural and rural development would benefit substantially from a regional focus. Regional Policy in Serbia is thus building capacity and institutions in the regions in order to create the basis for such a participatory approach.
The Ministry of Public Administration and Local Self Government, the Ministry of Capital Investment and the Ministry of Labour, Employment and Social Policy are responsible on the central level.
9.4 AGRO-ENVIRONMENTAL POLICY
In Serbia, the Ministry of Science and Environmental Protection (which is the former Ministry for Protection of Natural Resources and Environment) was restructured according to EU recommendations in 2001. It is responsible for legislative compliance, preparing and enforcing regulations and creating conditions for implementing principles of sustainable development in the country. In addition, the Ministry continues to be responsible for protection of air, water, soil, flora and fauna. The Ministry prepared and sent a draft law on the System of Environmental Protection to the Parliament in January 2004, adopted the Methodological Approach to Preparation and Implementation of the Serbian National Policy Plan (NPP) and the National Environmental Action Plan (NEAP) in February 2004. In addition, the National Waste Management Strategy was adopted and shall be implemented now.
The Agricultural Strategy of Serbia has outlined some agro-environmental issues, too, like the soil contamination because of improper use of manure, the safety at work for farmers operating with chemical fertilizer and the erosion problem in many regions of Serbia. However, due to pressing other problems and the lack of interest (from civil as well as public side) agri-environmental policy has hardly taken place at all in Serbia up until now. Nevertheless, since new policies in the sector are being prepared, it is now a good opportunity to introduce policy elements that would contribute to a more efficient agriculture with fewer negative effects on the environment. Because even if the situation in the moment is relatively good, it might change rapidly with the increasing use of chemical inputs or other developments in agricultural production.

ARCOTRASS- Consortium Study on the State of Agriculture in Five Applicant Countries
Country Report: Serbia page 61
BIBLIOGRAPHY
Bisić, Milica: Public Finance Policies - Center for Liberal Democratic Studies, Editors Begovic B., Mijatovic B., Belgrade (2005): Four years of transition in Serbia, http://www.clds.org.yu/pdf-e/4_years_of_transition_in_Serbia.pdf
Bogdanov Natalija, Bozic Dragica (2005): Changes in the ownership and socio-economic structure of family farms in Serbia during transition, in Family farms of Serbia in changes, Faculty of Agriculture University of Belgrade, Belgarde. ISBN 86-84435-06-0
Bogdanov Catalina (2005): Economics reforms and necessary institutional reforms of Agricultural sector of Serbia, Economics policy in 2006, Faculty of Economics University of Belgrade, Belgrade
Bogdanov Catalina (2004): Rural development policy in the concept of post productivism, in Institutional reforms and transition of agro industry of Serbia, Faculty of Economics University of Belgrade, Belgrade. ISBN 86-403-0669-9
Bozic Dragica, Bogdanov Catalina, (2005): Changes in the socio-demographic structure of family farms in Serbia, in Family farms of Serbia in changes, Faculty of Agriculture University of Belgrade, Belgrade. ISBN 86-84435-06-0
Bureau of Statistics of the Republic of Serbia (Dec 2002): Communication 295: FINAL RESULTS OF THE CENSUS 2002 - Population by national or ethnic groups, gender and age groups in the Republic of Serbia, by municipalities
Centre for Liberal Democratic Studies, Editors Begovic B., Mijatovic B., Belgrade (2005): Four years of transition in Serbia, http://www.clds.org.yu/pdf-e/4_years_of_transition_in_Serbia.pdf
Csaki, Csaba (2004): Conference and Workshops on Agriculture and WTO Belgrade, Serbia, 12-14/05/2004
European Bank for Reconstruction and Development: Strategy for Serbia and Montenegro, November 2004
European Union, Centre for European Policy Studies and United States Aid International Development (2004): Monte Negro Economic Trends
Faculty of Agriculture, University of Belgrade (2005): Study on rural vitality for Serbia and Montenegro, D12-1, First 6-monthly report, Project No. 513705, CEEC AGRI POLICY
Faculty of Agriculture, University of Belgrade (2005): Monitoring of Agricultural market and Trade Development in Serbia and Montenegro. D12-1, First 6-monthly report, Project No. 513705, CEEC AGRI POLICY
The World Bank: Final report Republic of Serbia (2003): Agriculture Sector Review, January 2003.
Food and Agriculture Organisation of the United Nations (FAO) (2004): Food and Agriculture Indicators: Albania; Bosnia and Herzegovina; Croatia; The former Yugoslav Republic of Macedonia; Serbia and Monte Negro, 2004
Foreign Agricultural Service (2003): Yugoslavia Agricultural Situation, Voluntary Report - public distribution –Update 2003
Foreign Agricultural Service: Voluntary Report, public distribution – Yugoslavia Agricultural Situation FRY Ports 2002, February 2002

ARCOTRASS- Consortium Study on the State of Agriculture in Five Applicant Countries
Country Report: Serbia page 62
Foreign Agricultural Service: Voluntary Report, public distribution – Yugoslavia Agricultural Situation Update 2003, March 2003
Global Agricultural Network (2003): GAIN Report, Foreign Agricultural Service, Global Agriculture Information Network, GAIN Report YI3003, March 2003
Lakic Nada, Popovic Blazenka (2005): Observation units in rural investigation and their classification, in Family farms of Serbia in changes, Faculty of Agriculture University of Belgrade, Belgrade. ISBN 86-84435-06-0
Ministry of Agriculture Forestry and Water Management, Republic of Serbia: Country Statement – Serbia and Montenegro, November 2004
Ministry of Agriculture Forestry and Water Management, Republic of Serbia: Agricultural Strategy Republic of Serbia, Belgrade, October 2004
Ministry of Agriculture Forestry and Water Management, Republic of Serbia: Questionnaire on Subjects in Agriculture/food processing industry, 2003
Policy and Legal Advice Centre, GTZ (2005): Sector Specialization for export, http://www.plac-yu.org/pdf/01SectorSpecialisation.pdf
Privatisation Agency of Republic of Serbia (2005): Assessment of Privatisation in Serbia, http://www.pa-serbia.co.yu/publikacije/pdf/
SCGO - Stalna konferencija gradova i opstina ( 2005): The Strategy for local sustainable development
Stevanovic Djura, Jelic Sreten, Jovanovic Tatijana (2005): Socio-demographical structure of population in Serbia, in Family farms of Serbia in changes, Faculty of Agriculture University of Belgrade, Belgrade. ISBN 86-84435-06-0
Swedish International Development Cooperation (SIDA) (2004): SIDA Country Report for Serbia and Monte Negro World Bank (2004): Country assistance strategy for Serbia and Monte Negro, Report No: 30426-yu World Bank (2003): Republic of Serbia AGRICULTURE SECTOR REVIEW
UNECE (2003): The Environmental Performance Review (EPR) of Yugoslavia, Chapter Agriculture and environment, http://www.unece.org/env/epr/studies/serbia_and_montenegro/chapter12.pdf
Web site sources
Serbian Ministry of Agriculture, Forestry and Water Management: (http://www.minpolj.sr.gov.yu) Association of Leasing Companies of Serbia: http://www.alcs.org.yu AgriPolicy.net: http://www.agripolicy.net Rural Development in the European Union - Statistical and Economic Information - Report 2006”: http://ec.europa.eu/agriculture/agrista/rurdev2006/index_en.htm

ARCOTRASS- Consortium Study on the State of Agriculture in Five Applicant Countries
Country Report: Serbia page 63
Annex 1: EU Support to Agriculture
During 1998-2003 Serbian Agricultural Sector received a total of €59.7 million support through the EU CARD programme. Projects financed were:
• Introduction of an Animal Identification System
• Food safety chain system: improvements to structure, management, functions, staffing
• Drafting of new legislation, regulations & amendment
• Delivery & installation of equipment & infrastructure for 10 selected Border Inspection Posts
• Support to upgrading of laboratories for veterinary and Phytosanitary agricultural products inspections
• Establishment of national reference laboratories based on EU standards
• Imports: sugar, vegetable oil (30,000 tonnes), animal feed (42,000 tonnes), fertilisers (48,000 tonnes)
• Technical assistance to support agriculture policy reforms (pricing, quality regulation)
For 2004 an allocation of € 8 million is made for supporting the agricultural sector. Projects under implementation and foreseen are:
2004 - €8 Million
• Twinning support to the Ministry of Agriculture & Water Management: staffing, internal management procedures, financial management, legal & technical services, external communications strategy
• Support to the establishment of a strategic planning & analysis capacity
• Rural policy programming: training, rural development plans for South-Eastern Serbia, establishment of monitoring & evaluation systems
• Support to establishment of Rural Development Agency
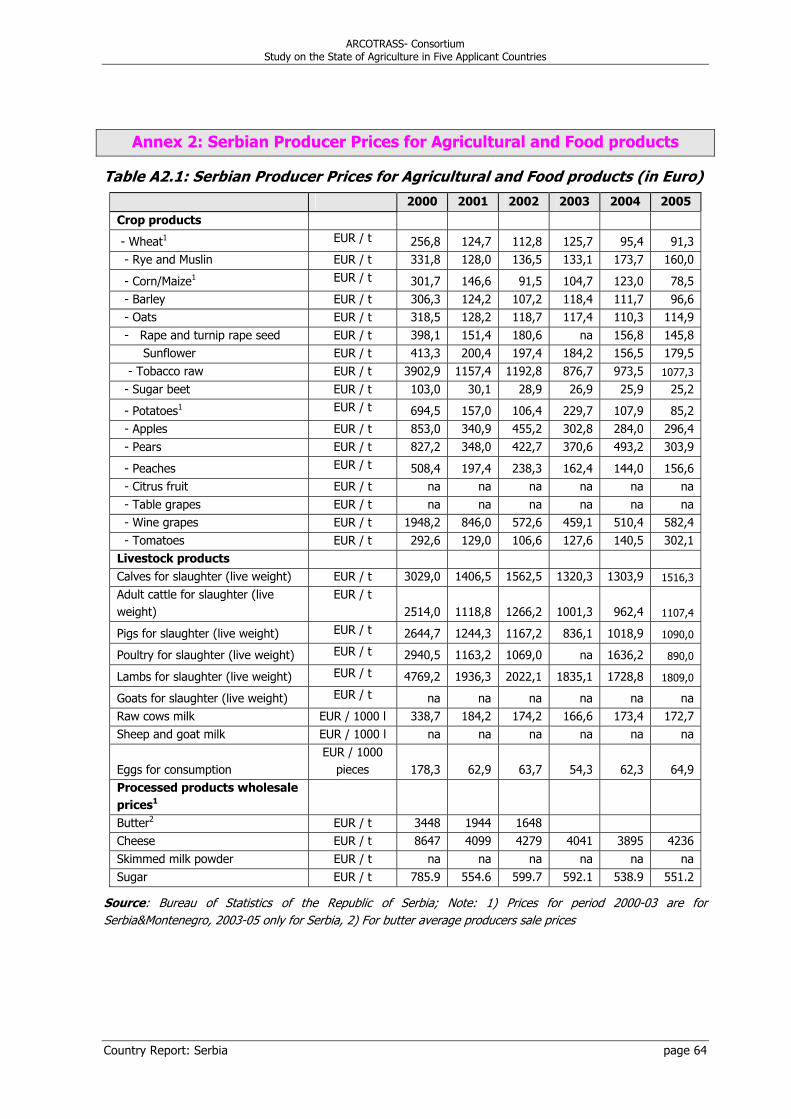
ARCOTRASS- Consortium Study on the State of Agriculture in Five Applicant Countries
Country Report: Serbia page 64
Annex 2: Serbian Producer Prices for Agricultural and Food products
Table A2.1: Serbian Producer Prices for Agricultural and Food products (in Euro) 2000 2001 2002 2003 2004 2005
Crop products
- Wheat1 EUR / t 256,8 124,7 112,8 125,7 95,4 91,3 - Rye and Muslin EUR / t 331,8 128,0 136,5 133,1 173,7 160,0
- Corn/Maize1 EUR / t 301,7 146,6 91,5 104,7 123,0 78,5 - Barley EUR / t 306,3 124,2 107,2 118,4 111,7 96,6 - Oats EUR / t 318,5 128,2 118,7 117,4 110,3 114,9 - Rape and turnip rape seed EUR / t 398,1 151,4 180,6 na 156,8 145,8 Sunflower EUR / t 413,3 200,4 197,4 184,2 156,5 179,5 - Tobacco raw EUR / t 3902,9 1157,4 1192,8 876,7 973,5 1077,3
- Sugar beet EUR / t 103,0 30,1 28,9 26,9 25,9 25,2
- Potatoes1 EUR / t 694,5 157,0 106,4 229,7 107,9 85,2 - Apples EUR / t 853,0 340,9 455,2 302,8 284,0 296,4 - Pears EUR / t 827,2 348,0 422,7 370,6 493,2 303,9
- Peaches EUR / t 508,4 197,4 238,3 162,4 144,0 156,6 - Citrus fruit EUR / t na na na na na na - Table grapes EUR / t na na na na na na - Wine grapes EUR / t 1948,2 846,0 572,6 459,1 510,4 582,4 - Tomatoes EUR / t 292,6 129,0 106,6 127,6 140,5 302,1 Livestock products Calves for slaughter (live weight) EUR / t 3029,0 1406,5 1562,5 1320,3 1303,9 1516,3
Adult cattle for slaughter (live weight)
EUR / t 2514,0 1118,8 1266,2 1001,3 962,4 1107,4
Pigs for slaughter (live weight) EUR / t 2644,7 1244,3 1167,2 836,1 1018,9 1090,0
Poultry for slaughter (live weight) EUR / t 2940,5 1163,2 1069,0 na 1636,2 890,0
Lambs for slaughter (live weight) EUR / t 4769,2 1936,3 2022,1 1835,1 1728,8 1809,0
Goats for slaughter (live weight) EUR / t na na na na na na Raw cows milk EUR / 1000 l 338,7 184,2 174,2 166,6 173,4 172,7 Sheep and goat milk EUR / 1000 l na na na na na na
Eggs for consumption EUR / 1000
pieces 178,3 62,9 63,7 54,3 62,3 64,9 Processed products wholesale prices1
Butter2 EUR / t 3448 1944 1648 Cheese EUR / t 8647 4099 4279 4041 3895 4236 Skimmed milk powder EUR / t na na na na na na Sugar EUR / t 785.9 554.6 599.7 592.1 538.9 551.2
Source: Bureau of Statistics of the Republic of Serbia; Note: 1) Prices for period 2000-03 are for Serbia&Montenegro, 2003-05 only for Serbia, 2) For butter average producers sale prices

ARCOTRASS- Consortium Study on the State of Agriculture in Five Applicant Countries
Country Report: Serbia page 65
Annex 3: Agro-food Trade
Table A3.1: Agricultural and food import, (in million Euro) Value in million euro IMPORT
2000 2001 2002 2003 2004 2005CHAPTER
Total 01 to 24 315.48 581.70 632.55 640.41 614.58 612.81
01 - Live Animals 2.63 3.03 3.77 4.10 3.08 6.64 02 - Meat and edible meat offal 3.29 5.16 8.32 5.32 6.09 5.68 03 - Fish, crustaceans, molluscs 7.46 20.17 22.30 23.94 28.61 27.97 04 - Dairy produce 6.98 6.73 8.88 6.59 8.38 8.57 05 - Products of animal origin 0.77 1.19 1.19 1.16 1.50 1.78 06 - Live trees and other plants 2.95 3.45 4.79 6.67 7.63 8.60 07 - Edible vegs, roots & tubers 11.58 18.42 18.93 26.45 29.13 26.06 08 - Edible fruits & nuts 24.32 39.66 55.98 59.03 60.57 74.04 09 - Coffee, tea, mate & spices 83.30 56.56 51.59 49.95 22.00 48.33 10 - Cereals 2.42 37.94 5.18 12.16 27.32 7.87 11 - Products of the milling industry 3.21 5.77 5.13 4.74 12.99 7.80 12 - Oil seeds & oleaginous fruits 6.55 11.25 15.84 18.08 24.89 21.98 13 - Lacs, gums, resins & other veg. 3.02 3.10 3.79 3.17 3.74 3.90 14 - Vegetable products n.e.s. 0.16 0.81 1.87 1.31 1.48 0.31 15 - Animal or vegetable fats & oils 7.28 7.83 13.84 13.36 12.51 15.50 16 - Preparations of meat 2.60 7.00 12.06 14.91 17.10 21.42 17 - Sugars & sugar confectionery 5.96 33.86 36.67 37.26 18.40 32.34 18 - Cocoa & cocoa preparations 16.95 25.56 39.65 40.15 41.07 43.50 19 - Preps. of cereals, flour, etc. 1.87 10.07 15.46 19.16 25.65 24.44 20 - Preps. of veg, fruits, nuts & plants 5.69 9.97 17.58 20.15 23.05 25.80 21 – Misc. edible preparations 23.99 37.75 50.93 62.51 73.05 69.28 22 - Beverages, spirits & vinegar 22.06 104.54 98.82 88.31 35.13 23.95 23 - Residues from food industry 31.29 52.26 71.78 38.95 57.09 38.96 24 - Tobacco & tobacco products 39.15 79.62 68.22 82.97 74.11 68.09 Source: Bureau of Statistics of the Republic of Serbia

ARCOTRASS- Consortium Study on the State of Agriculture in Five Applicant Countries
Country Report: Serbia page 66
Table A3.2: Agricultural and food import, (in million Euro) Value in million euro EXPORT
2000 2001 2002 2003 2004 2005CHAPTER
Total 01 to 24 320.61 345.08 519.93 596.13 587.00 722.50
01 - Live Animals 7.56 7.94 4.86 5.76 2.27 1.95 02 - Meat and edible meat offal 11.65 3.75 2.12 9.97 8.07 10.96 03 - Fish, crustaceans, molluscs 1.21 1.48 2.36 3.24 2.16 0.93 04 - Dairy produce 3.10 3.28 3.23 15.79 5.90 7.64 05 - Products of animal origin 1.93 1.23 0.91 1.34 1.43 1.76 06 - Live trees and other plants 1.78 2.92 3.78 7.42 6.34 7.19 07 - Edible vegs, roots & tubers 20.74 37.78 38.95 29.72 31.35 34.98 08 - Edible fruits & nuts 89.19 97.45 133.76 148.45 126.76 127.77 09 - Coffee, tea, mate & spices 3.81 3.78 4.00 6.22 6.21 5.68 10 - Cereals 34.55 12.26 90.85 34.89 43.71 99.39 11 - Products of the milling industry 15.10 7.15 6.76 15.96 7.21 9.74 12 - Oil seeds & oleaginous fruits 6.85 5.52 8.36 11.43 12.20 16.58 13 - Lacs, gums, resins & other veg. 0.01 0.00 0.04 0.01 0.03 0.05 14 - Vegetable products n.e.s. 0.59 1.48 1.47 1.17 1.23 0.90 15 - Animal or vegetable fats & oils 18.42 20.39 18.78 23.93 47.82 36.05 16 - Preparations of meat 11.75 8.46 6.98 19.62 10.18 17.18 17 - Sugars & sugar confectionery 2.99 46.68 99.33 72.85 130.08 140.03 18 - Cocoa & cocoa preparations 10.33 12.09 13.73 22.64 12.32 30.67 19 - Preps. of cereals, flour, etc. 19.01 19.98 16.78 38.68 24.18 39.49 20 - Preps. of veg, fruits, nuts & plants 17.71 18.17 16.71 28.74 26.89 44.80 21 – Misc. edible preparations 13.21 12.04 14.14 28.97 23.22 30.09 22 - Beverages, spirits & vinegar 12.05 11.94 14.32 41.96 36.70 41.11 23 - Residues from food industry 14.75 6.09 14.61 19.37 15.73 14.66 24 - Tobacco & tobacco products 2.29 3.21 3.12 8.02 5.00 2.90 Source: Bureau of Statistics of the Republic of Serbia

ARCOTRASS- Consortium Study on the State of Agriculture in Five Applicant Countries
Country Report: Serbia page 67
Table A3.3: Agricultural and food trade balance, (in million Euro) Value in million euro
2000 2001 2002 2003 2004 2005CHAPTER
Total 01 to 24 5.13 -236.61 -112.62 -44.27 -27.58 109.68 0.00 0.00 0.00 0.00 0.00 0.00
01 - Live Animals 4.93 4.91 1.09 1.66 -0.81 -4.69 02 - Meat and edible meat offal 8.36 -1.41 -6.20 4.65 1.99 5.27 03 - Fish, crustaceans, molluscs -6.25 -18.69 -19.94 -20.70 -26.45 -27.05 04 - Dairy produce -3.88 -3.45 -5.65 9.20 -2.47 -0.93 05 - Products of animal origin 1.16 0.04 -0.28 0.17 -0.07 -0.02 06 - Live trees and other plants -1.17 -0.52 -1.01 0.74 -1.29 -1.41 07 - Edible vegs, roots & tubers 9.16 19.36 20.02 3.27 2.22 8.92 08 - Edible fruits & nuts 64.87 57.79 77.78 89.42 66.19 53.73 09 - Coffee, tea, mate & spices -79.48 -52.78 -47.59 -43.73 -15.79 -42.65 10 - Cereals 32.14 -25.68 85.68 22.73 16.39 91.52 11 - Products of the milling industry 11.89 1.38 1.63 11.22 -5.78 1.94 12 - Oil seeds & oleaginous fruits 0.31 -5.73 -7.48 -6.65 -12.69 -5.39 13 - Lacs, gums, resins & other veg. -3.02 -3.10 -3.76 -3.16 -3.71 -3.85 14 - Vegetable products n.e.s. 0.43 0.67 -0.40 -0.15 -0.25 0.60 15 - Animal or vegetable fats & oils 11.14 12.56 4.94 10.58 35.31 20.55 16 - Preparations of meat 9.15 1.46 -5.08 4.71 -6.92 -4.24 17 - Sugars & sugar confectionery -2.97 12.82 62.66 35.58 111.68 107.69 18 - Cocoa & cocoa preparations -6.62 -13.47 -25.93 -17.51 -28.75 -12.83 19 - Preps. of cereals, flour, etc. 17.14 9.91 1.31 19.52 -1.47 15.05 20 - Preps. of veg, fruits, nuts & plants 12.02 8.20 -0.87 8.59 3.84 19.00 21 – Misc. edible preparations -10.78 -25.71 -36.79 -33.54 -49.83 -39.19 22 - Beverages, spirits & vinegar -10.01 -92.60 -84.50 -46.35 1.57 17.15 23 - Residues from food industry -16.54 -46.17 -57.17 -19.59 -41.35 -24.31 24 - Tobacco & tobacco products -36.86 -76.41 -65.10 -74.94 -69.11 -65.19 Source: Bureau of Statistics of the Republic of Serbia
Table A3.4: Five Key Agricultural Foreign Trade commodities for Exports and Imports (FAO, 2004, in million Euro)
Commodity Export Import Balance
Beer of Barley 18.61 12.80 5.81
Food Prepared nes 18.18 62.28 -44.10
Fruit Prepared nes 104.24 7.69 96.56
Sugar Refined 102.27 11.91 90.36 Wine 9.39 10.64 -1.25
Source: FAO
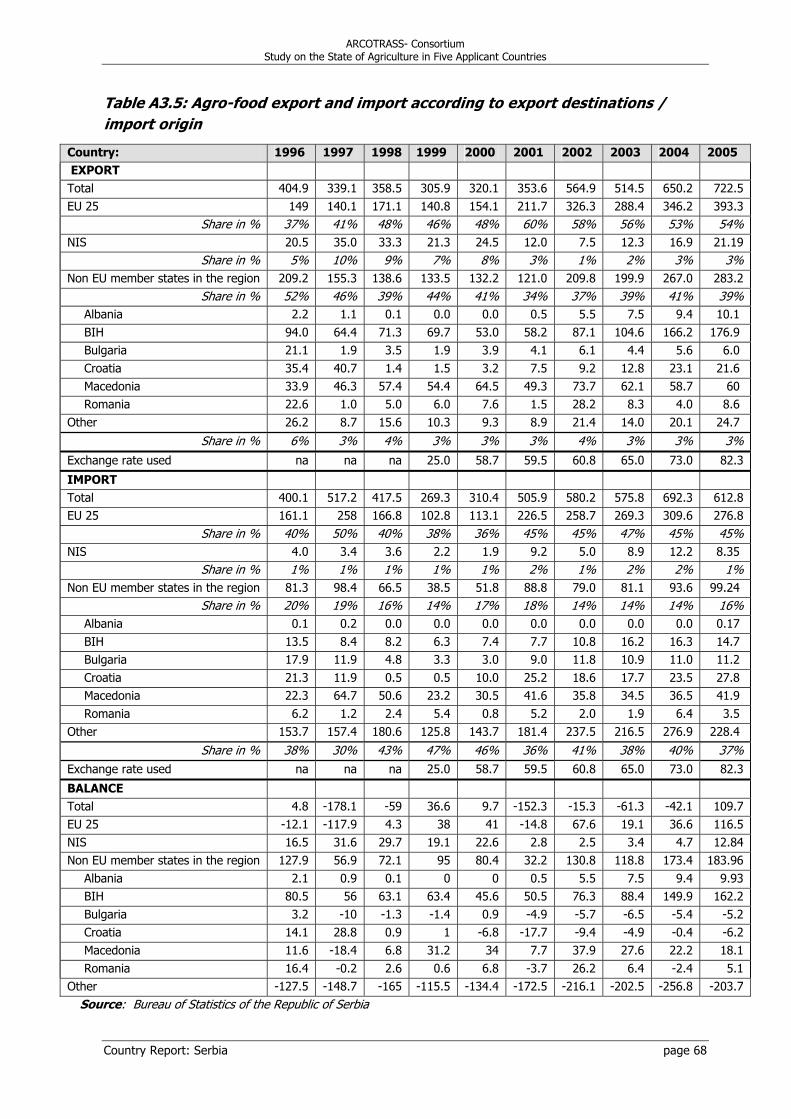
ARCOTRASS- Consortium Study on the State of Agriculture in Five Applicant Countries
Country Report: Serbia page 68
Table A3.5: Agro-food export and import according to export destinations / import origin
Country: 1996 1997 1998 1999 2000 2001 2002 2003 2004 2005 EXPORT Total 404.9 339.1 358.5 305.9 320.1 353.6 564.9 514.5 650.2 722.5 EU 25 149 140.1 171.1 140.8 154.1 211.7 326.3 288.4 346.2 393.3
Share in % 37% 41% 48% 46% 48% 60% 58% 56% 53% 54% NIS 20.5 35.0 33.3 21.3 24.5 12.0 7.5 12.3 16.9 21.19
Share in % 5% 10% 9% 7% 8% 3% 1% 2% 3% 3% Non EU member states in the region 209.2 155.3 138.6 133.5 132.2 121.0 209.8 199.9 267.0 283.2
Share in % 52% 46% 39% 44% 41% 34% 37% 39% 41% 39% Albania 2.2 1.1 0.1 0.0 0.0 0.5 5.5 7.5 9.4 10.1 BIH 94.0 64.4 71.3 69.7 53.0 58.2 87.1 104.6 166.2 176.9 Bulgaria 21.1 1.9 3.5 1.9 3.9 4.1 6.1 4.4 5.6 6.0 Croatia 35.4 40.7 1.4 1.5 3.2 7.5 9.2 12.8 23.1 21.6 Macedonia 33.9 46.3 57.4 54.4 64.5 49.3 73.7 62.1 58.7 60 Romania 22.6 1.0 5.0 6.0 7.6 1.5 28.2 8.3 4.0 8.6
Other 26.2 8.7 15.6 10.3 9.3 8.9 21.4 14.0 20.1 24.7
Share in % 6% 3% 4% 3% 3% 3% 4% 3% 3% 3% Exchange rate used na na na 25.0 58.7 59.5 60.8 65.0 73.0 82.3
IMPORT Total 400.1 517.2 417.5 269.3 310.4 505.9 580.2 575.8 692.3 612.8 EU 25 161.1 258 166.8 102.8 113.1 226.5 258.7 269.3 309.6 276.8
Share in % 40% 50% 40% 38% 36% 45% 45% 47% 45% 45% NIS 4.0 3.4 3.6 2.2 1.9 9.2 5.0 8.9 12.2 8.35
Share in % 1% 1% 1% 1% 1% 2% 1% 2% 2% 1% Non EU member states in the region 81.3 98.4 66.5 38.5 51.8 88.8 79.0 81.1 93.6 99.24
Share in % 20% 19% 16% 14% 17% 18% 14% 14% 14% 16% Albania 0.1 0.2 0.0 0.0 0.0 0.0 0.0 0.0 0.0 0.17 BIH 13.5 8.4 8.2 6.3 7.4 7.7 10.8 16.2 16.3 14.7 Bulgaria 17.9 11.9 4.8 3.3 3.0 9.0 11.8 10.9 11.0 11.2 Croatia 21.3 11.9 0.5 0.5 10.0 25.2 18.6 17.7 23.5 27.8 Macedonia 22.3 64.7 50.6 23.2 30.5 41.6 35.8 34.5 36.5 41.9 Romania 6.2 1.2 2.4 5.4 0.8 5.2 2.0 1.9 6.4 3.5
Other 153.7 157.4 180.6 125.8 143.7 181.4 237.5 216.5 276.9 228.4
Share in % 38% 30% 43% 47% 46% 36% 41% 38% 40% 37% Exchange rate used na na na 25.0 58.7 59.5 60.8 65.0 73.0 82.3
BALANCE Total 4.8 -178.1 -59 36.6 9.7 -152.3 -15.3 -61.3 -42.1 109.7 EU 25 -12.1 -117.9 4.3 38 41 -14.8 67.6 19.1 36.6 116.5 NIS 16.5 31.6 29.7 19.1 22.6 2.8 2.5 3.4 4.7 12.84 Non EU member states in the region 127.9 56.9 72.1 95 80.4 32.2 130.8 118.8 173.4 183.96
Albania 2.1 0.9 0.1 0 0 0.5 5.5 7.5 9.4 9.93 BIH 80.5 56 63.1 63.4 45.6 50.5 76.3 88.4 149.9 162.2 Bulgaria 3.2 -10 -1.3 -1.4 0.9 -4.9 -5.7 -6.5 -5.4 -5.2 Croatia 14.1 28.8 0.9 1 -6.8 -17.7 -9.4 -4.9 -0.4 -6.2 Macedonia 11.6 -18.4 6.8 31.2 34 7.7 37.9 27.6 22.2 18.1 Romania 16.4 -0.2 2.6 0.6 6.8 -3.7 26.2 6.4 -2.4 5.1
Other -127.5 -148.7 -165 -115.5 -134.4 -172.5 -216.1 -202.5 -256.8 -203.7 Source: Bureau of Statistics of the Republic of Serbia

ARCOTRASS- Consortium Study on the State of Agriculture in Five Applicant Countries
Country Report: Serbia page 69
Table A3.6: Nominal Protection for selected Agricultural Commodities, Republic of Serbia (2002)
Official Price
Average Producer
Pricea)
Domestic Price at Borderb)
International Price at Borderb)
Nominal Protection Coefficient
Commodity
(Euro/kgc) Wheat 0.10 - 0.13 0.10 0.10 0.09 d) 1.12 Maize na 0.09 0.10 0.09 1.04 Soybean na 0.25 0.25 0.28 g) 0.89 Sunflower na 0.21 0.21 0.32 d) 0.66 Raspberry (2001) na 0.75 1.50 2.00 0.75 Pork na 1.40 (lwt) 1.91 (cc wt) 1.69 (cc wt) 1.13 Sugar beet 0.03 e) 0.03 na na na Refined Sugar (ex-factory) na na 0.53 0.35 f)
1.52
Milk 0.00 0.00 0.00 0.00 New Zealand na 0.09 i) na na na Serbia na 0.18 na na na EU na 0.26 j) na na na

ARCOTRASS- Consortium Study on the State of Agriculture in Five Applicant Countries
Country Report: Serbia page 70
Annex 4: Rural Development Data by Counties (Population, Employment Income)
Table A4.1: Demographic and Employment Data at County Level for 2002 (NUTS III Level)
Beograd Sev.bački
okrug Sred.banat
.okrug Sev.banat.
okrug Juž.banat.
okrug Zap.bački
okrug Juž.bački
okrug Sremski okrug
Mačvanski okrug
Kolub.okrug
Podunavski okrug
Braničevski okrug
Šumadijski okrug
Total population 1,576,124 200,140 208,456 165,881 313,937 214,011 593,666 335,901 329,625 192,204 210,290 200,503 298,778
Area km2 3,227 1,784 3,254 2,328 4,250 2,419 4,015 3,485 3,269 2,474 1,251 3,865 2,388
Population density 488 112 64 71 74 88 148 96 101 78 168 52 125
Rural population 294,323 76,243 108,007 63,823 139,355 103,816 193,812 194,641 238,611 116,505 105,975 131,439 112,508
% rural of total 18.67 38.09 51.81 38.48 44.39 48.51 32.65 57.95 72.39 60.62 50.39 65.55 37.66
Importance of aged people (% people aged more than 65 years) 15.66 17.80 18.41 18.56 18.23 18.92 15.15 16.97 18.26 22.83 20.18 26.41 23.78
Demographic Labour Pressure (Ratio population aged 5-14 to population aged 55-64) 108.58 92.86 103.99 99.67 106.42 94.38 116.13 111.05 110.52 92.64 111.97 96.25 93.29
Total employed rural population 103,770 27,023 38,367 23,784 49,046 32,656 66,407 64,788 95,977 54,138 38,386 52,350 41,967
Employment as % of total employment
primary sector 24.08 47.83 46.90 56.13 48.97 40.82 31.29 38.86 55.95 68.04 47.09 70.80 50.66
secondary 53.90 40.76 39.67 33.74 36.49 44.76 49.75 40.96 31.77 23.35 40.64 19.67 36.87
tertiary 22.02 11.41 13.43 10.13 14.54 14.42 18.96 20.18 12.28 8.61 12.27 9.53 12.48
employment in agriculture, hunting, forestry and fisheries 21562 12922 17685 13124 23803 13316 20579 25029 53029 34917 18036 34719 19966
Farmers younger than 35 12742 9073 11504 10731 16312 9707 17650 17080 32245 17010 10746 20703 12179
Farmers older than 55 11410 4981 7395 5895 12293 4646 9552 11994 23436 17759 8650 14819 10012
Ratio 35/55 1.12 1.82 1.56 1.82 1.33 2.09 1.85 1.42 1.38 0.96 1.24 1.40 1.22
female as % of total farmers population 48.53 46.90 46.30 46.86 47.22 46.69 46.87 47.33 47.78 48.72 48.65 50.38 48.14
Agricultural population older than 15:
Without formal education 51,892 19,710 28,129 18,665 38,993 24,786 41,035 45,751 72,579 44,504 31,660 50,815 37,996
Primary school 67,490 19,897 24,855 16,910 35,234 25,167 44,971 43,853 51,116 26,928 27,642 36,714 25,399
Secondary 108,556 22,015 32,675 15,933 36,326 33,987 64,621 62,688 65,420 22,571 25,459 19,862 28,492
Higher education (college and/or Faculty) 13,709 2,445 4,328 1,648 4,433 3,819 8,106 7,574 7,440 2,588 2,430 2,232 2,846
unknown 4,572 113 509 258 1,272 424 1,566 2,845 3,208 2,452 1,333 1,513 1,539

ARCOTRASS- Consortium Study on the State of Agriculture in Five Applicant Countries
Country Report: Serbia page 71
Demographic and Employment Data at County Level for 2002 (NUTS III Level) Table A4.1 continued
Pomoravski
okrug Borski okrug
Zaječarski okrug
Zlatiborski okrug
Moravički okrug
Raški okrug
Rasinski okrug
Nišavski okrug
Toplički okrug
Pirotski okrug
Jablanički okrug
Pčinjski okrug
Total population 227,435 146,551 137,561 313,396 224,772 291,230 259,441 381,757 102,075 105,654 240,923 227,690
Area km2 2,614 3,507 3,623 6,142 3,016 3,922 2,667 2,728 2,231 2,761 2,770 3,520
Population density 87 42 38 51 75 74 97 140 46 38 87 65
Rural population 129,846 65,985 65,180 157,190 108,892 145,307 168,691 177,253 55,147 44,807 142,503 132,246
% rural of total 57.09 45.03 47.38 50.16 48.45 49.89 65.02 46.43 54.03 42.41 59.15 58.08
Importance of aged people (% people aged more than 65 years) 25.32 28.93 34.34 21.44 23.97 17.57 22.55 23.43 28.12 35.07 21.66 16.69
Demographic Labour Pressure (Ratio population aged 5-14 to population aged 55-64) 88.73 64.36 49.68 92.84 81.31 124.03 92.22 80.13 68.57 54.73 90.82 167.40
Total employed rural population 45,502 22,490 21,203 58,911 45,063 47,790 62,905 60,454 16,354 13,587 52,107 37,905
Employment as % of total employment
primary sector 49.22 57.27 55.85 49.62 50.60 40.88 48.50 36.28 45.82 31.38 52.52 40.21
secondary 39.20 30.79 31.17 40.13 40.08 42.07 39.22 45.86 37.70 55.49 35.94 41.21
tertiary 11.58 11.93 12.97 10.25 9.32 17.06 12.28 17.85 16.48 13.13 11.54 18.58
employment in agriculture, hunting, forestry and fisheries 21544 11406 10542 28935 22200 18613 30293 21756 7485 4247 27225 14965
Farmers younger than 35 11206 5499 4164 16314 11137 13623 17855 9057 3708 1337 16275 11736
Farmers older than 55 10935 5452 5633 14405 11417 8307 14348 12590 4295 2811 12843 7254
Ratio 35/55 1.02 1.01 0.74 1.13 0.98 1.64 1.24 0.72 0.86 0.48 1.27 1.62
female as % of total farmers population 50.74 53.53 52.79 48.84 47.55 50.31 49.06 51.19 47.09 46.31 49.14 48.24
Agricultural population older than 15:
Without formal education 48,197 29,805 31,317 51,174 36,876 38,880 56,320 55,604 21,344 19,513 50,854 36,041
Primary school 30,499 16,075 14,908 38,990 25,251 37,440 39,922 39,331 12,667 10,530 28,287 35,996
Secondary 28,298 8,593 9,074 37,459 27,757 34,987 40,459 45,940 10,417 7,953 31,480 20,625
Higher education (college and/or Faculty) 3,012 1,101 1,253 3,857 2,909 4,459 5,407 5,265 1,309 979 3,238 3,356
unknown 1,067 2,077 1,917 1,455 1,051 2,579 1,945 5,860 1,745 1,231 6,027 6,123

ARCOTRASS- Consortium Study on the State of Agriculture in Five Applicant Countries
Country Report: Serbia page 72
Table A4.2: National Income Data at NUTS I / NUTS II Level for 2002
NUTS I NUTS II
R.Srbija C.Srbija Vojvodina Agriculture, hunting, forestry and water works supply 17.27 14.77 23.04
Fishing 0.04 0.01 0.10
Mining and quarrying 17.45 1.74 5.94
Manufacturing 151.62 23.54 32.27
Electricity, gas and water supply 28.09 5.37 3.66
Construction 40.73 8.14 4.47
Wholesale and retail trade; repair of motor vehicles 143.29 27.21 19.04
Hotels and restaurants 10.90 2.12 1.33
Transport, storage and communications 59.77 11.80 6.90
Real estate, renting and business activities 24.84 4.88 2.93
Health and social work 1.35 0.25 0.21
Other community, social and personal service activity 0.90 0.18 0.10

ARCOTRASS- Consortium Study on the State of Agriculture in Five Applicant Countries
Country Report: Serbia page 73
Table A4.3:National Income Data at County Level (NUTS III Level) for 2002
Beograd Sev.bački
okrug Sred.banat
.okrug Sev.banat.
okrug Juž.banat.
okrug Zap.bački
okrug Juž.bački
okrug Sremski okrug
Mačvanski okrug
Kolub.okrug
Podunavski okrug
Braničevski okrug
Šumadijski okrug
Agriculture, hunting, forestry and water works supply 3.60 22.09 27.99 25.51 21.95 24.75 16.84 37.22 34.46 34.24 29.11 34.04 29.12
Fishing 0.00 0.09 0.38 0.18 0.05 0.16 0.05 0.00 0.04 0.00 0.03 -0.05 0.00
Mining and quarrying 1.82 0.00 2.88 14.38 0.25 0.02 13.48 0.15 1.63 5.95 0.08 12.11 2.45
Manufacturing 19.13 25.09 27.27 26.48 49.45 42.84 29.31 15.91 28.13 18.49 31.84 11.56 23.13
Electricity, gas and water supply 4.97 10.02 9.57 8.75 8.08 7.72 -7.12 10.95 3.82 2.85 0.51 9.29 5.12
Construction 9.83 5.80 2.49 2.55 2.90 2.50 6.55 4.69 2.56 9.29 5.70 5.87 5.91
Wholesale and retail trade; repair of motor vehicles 35.25 24.14 17.74 13.36 9.22 13.39 26.48 19.39 19.58 16.36 21.53 16.73 19.30
Hotels and restaurants 2.22 1.41 2.97 0.82 0.80 1.99 1.20 0.87 1.27 2.25 1.40 2.23 1.48
Transport, storage and communications 14.84 8.66 6.33 5.98 5.66 4.87 7.64 8.45 6.38 8.74 6.34 6.80 11.54
Real estate, renting and business activities 8.00 2.27 2.07 1.61 1.35 1.47 5.31 2.07 1.84 1.47 1.43 0.99 1.48
Health and social work 0.07 0.22 0.19 0.26 0.27 0.24 0.15 0.19 0.25 0.34 2.02 0.40 0.46
Other community, social and personal service activity 0.28 0.22 0.12 0.13 0.03 0.04 0.12 0.11 0.02 0.02 0.01 0.01 0.00

ARCOTRASS- Consortium Study on the State of Agriculture in Five Applicant Countries
Country Report: Serbia page 74
National Income Data at County Level (NUTS III Level) for 2002 Table A4.3 continued
Pomoravski
okrug Borski okrug
Zaječarski okrug
Zlatiborski okrug
Moravički okrug
Raški okrug
Rasinski okrug
Nišavski okrug
Toplički okrug
Pirotski okrug
Jablanički okrug
Pčinjski okrug
Agriculture, hunting, forestry and water works supply 26.10 37.80 43.02 20.60 22.71 17.00 25.17 12.25 44.45 24.43 32.82 17.70
Fishing 0.00 0.07 0.01 0.03 0.00 0.09 0.00 0.00 0.00 0.00 0.00 0.00
Mining and quarrying 6.60 -14.87 1.84 0.18 0.53 1.59 0.10 0.17 0.00 0.46 0.00 1.05
Manufacturing 25.68 15.17 14.80 32.13 35.98 18.01 36.70 35.80 16.57 41.80 25.61 38.75
Electricity, gas and water supply 5.56 24.68 5.14 8.82 3.87 5.73 4.41 4.06 6.02 8.50 4.65 8.11
Construction 7.18 5.07 5.97 6.79 4.76 9.52 6.97 6.29 7.86 7.38 7.55 9.54
Wholesale and retail trade; repair of motor vehicles 17.80 18.90 15.39 16.45 19.42 28.55 16.15 24.55 15.25 7.31 18.63 15.03
Hotels and restaurants 1.43 2.73 2.50 3.15 1.53 4.13 1.24 2.25 2.01 1.41 1.84 1.74
Transport, storage and communications 8.13 9.08 10.17 9.27 9.07 13.18 7.60 10.87 6.67 6.63 6.35 6.62
Real estate, renting and business activities 1.07 1.12 0.55 2.22 1.95 1.52 1.30 3.47 0.52 0.32 1.99 1.20
Health and social work 0.45 0.23 0.61 0.20 0.14 0.66 0.27 0.27 0.64 0.39 0.37 0.19
Other community, social and personal service activity 0.00 0.02 0.00 0.17 0.02 0.01 0.10 0.02 0.01 1.36 0.19 0.05