coton, f.n. and galbraith, r.a.mcd. and green, r.b. (2005...
TRANSCRIPT
Coton, F.N. and Galbraith, R.A.McD. and Green, R.B. (2005) Analysis of model rotor blade pressures during parallel interaction with twin vortices. Journal of Aircraft 42(6):pp. 1553-1565.
http://eprints.gla.ac.uk/3382/
Glasgow ePrints Service http://eprints.gla.ac.uk
Analysis of Model Rotor Blade Pressures during Parallel Interaction with Twin
Vortices
By
F.N. Coton∗, R.B. Green†, R.A.McD. Galbraith‡
University of Glasgow,
Glasgow, G12 8QQ
U.K.
∗ Professor of Low Speed Aerodynamics, Department of Aerospace Engineering† Senior Lecturer, Department of Aerospace Engineering‡ Shoda Professor of Aerospace Systems, Department of Aerospace Engineering
ABSTRACT
This paper presents and provides analysis of unsteady surface pressures measured on a
model rotor blade as the blade experienced near parallel blade vortex interaction with a
twin vortex system. To provide a basis for analysis, the vortex system was characterized
by hot-wire measurements made in the interaction plane but in the absence of the rotor.
The unsteady pressure response resulting from a single vortex interaction is then
presented to provide a frame of reference for the twin vortex results. A series of twin
vortex interaction cases are then presented and analyzed. It is shown that the unsteady
blade pressures and forces are very sensitive to the inclination angle and separation
distance of the vortex pair. When the vortex cores lie almost parallel to the blade chord,
the interaction is characterized by a two-stage response associated with the sequential
passage of the two cores. Conversely, when the cores lie on a plane that is almost
perpendicular to the blade chord, the response is similar to that of a single vortex
interaction. In all cases, the normal force response is consistent with the distribution of
vertical velocity in the flow field of the vortex system. The pitching moment response,
on the other hand, depends on the localized suction associated with the vortex cores as
they traverse the blade chord.

NOMENCLATURE
c interacting blade chord (m)
cb vortex generator blade chord (m)
Cn sectional normal force coefficient N 12 ρVTIP
2 c( )
Cm1/4 sectional quarter chord pitching moment coefficient M 12 ρVTIP
2 c2( )
Cp pressure coefficient P 12 ρVTIP
2( )
d diameter of twin vortex generator placement circle
lv geometric lateral distance of either single generator or centroid of twin generator
placement circle from the tunnel centerline (m)
r radial position of measurement array (m)
R rotor radius (m)
rc vortex core radius (m)
rc* Non-dimensional vortex core radius (rc/cb)
x distance along chord (m)
xv perpendicular horizontal distance between the leading edge pressure transducer
and vortex generator (m)
yv geometric height of either single generator or centroid of twin generator
placement circle above or below rotor disk (m)
U free stream velocity (m/s)
VTIP rotor tip velocity (m/s)
v vertical velocity
v* non-dimensional vertical velocity (v/(Ωr))

δ inclination angle of twin generator blade tips
θ rotor pitch setting (o)
ρ air density (kg/m3)
Γ Vortex strength (m2/s)
Γ* Non-dimensional vortex strength (Γ/(Ucb))
ΓI Non-dimensional interaction parameter (Γ/(Ωrc))
µ Advance Ratio ΩR/U
Ω Rotor angular velocity
INTRODUCTION
The tip vortices trailed from helicopter rotor blades may be considered to be the primary
features of the highly complex aerodynamic operating environment of the aircraft. In
addition to limiting its operational capabilities, these vortices interact with either their
originating blade, other blades in the rotor system or the helicopter fuselage to produce
unwanted noise and vibration. Much has been done to develop an understanding of
vortex generation, convection and interaction including both experimental1-9 and
numerical studies10-13 which have provided a basis for many design improvements. As
understanding of the flow phenomena has increased, attention has focused on the
potential for both active and passive flow control to ameliorate undesirable aerodynamic
effects. Efforts have concentrated on either modifying the rotor tip vortex system by
direct intervention during its formation or through changes to the tip planform shape.
The most popular direct intervention method has been the injection of air at the blade
tip14. Early attempts to do this relied on high levels of blowing to achieve any significant
levels of vortex control. More recent studies, however, using discrete jets have
demonstrated that significant changes can be made to the vortex structure with relatively
low levels of blowing. For example, Gowanlock et al.15, have recently shown that
selective use of discrete jets oriented in the spanwise direction, can reduce the peak
rotational velocities in the tip vortex by as much as 50% on a model rotor, even at
momentum blowing coefficients as low as 0.0033. Similarly, Liu et al.16 computed the
benefits of blowing air at 5% of the freestream speed from a spanwise slot positioned
near the tip trailing edge on the upper surface of a rotor blade. They postulated that
pulsed blowing from this type of slot could be useful in reducing the higher harmonic
loads and noise during a blade vortex interaction (BVI). More recently, Coton et al.17
demonstrated that multi-directional blowing at the tip trailing edge can produce an
expansion of the vortex core and a corresponding reduction in the severity of near-core
BVI events.
Modification of the blade tip planform is not a new concept, in fact tip shapes designed to
enhance specific aspects of the helicopter performance are now commonplace on in-
service helicopters. Possibly the most notable of these is the Westland Helicopters
BERP tip. It has been documented by Scott et. al.18 that this tip can generate two trailed
vortices at moderate-to-high incidence with the outboard vortex being stronger than the
inboard which is of opposite sense. Lowson19 also stated that this tip reduces the noise in
low speed descent, where BVI is predominant.
It has also been possible to consider the design of tip planforms specifically to modify the
tip vortex structure in a manner which potentially reduces the severity of the associated
BVI events. Hoad20 studied the effects of a variety of different tip planforms on the
impulsive noise from blade vortex interaction. Some of these planforms resulted in the
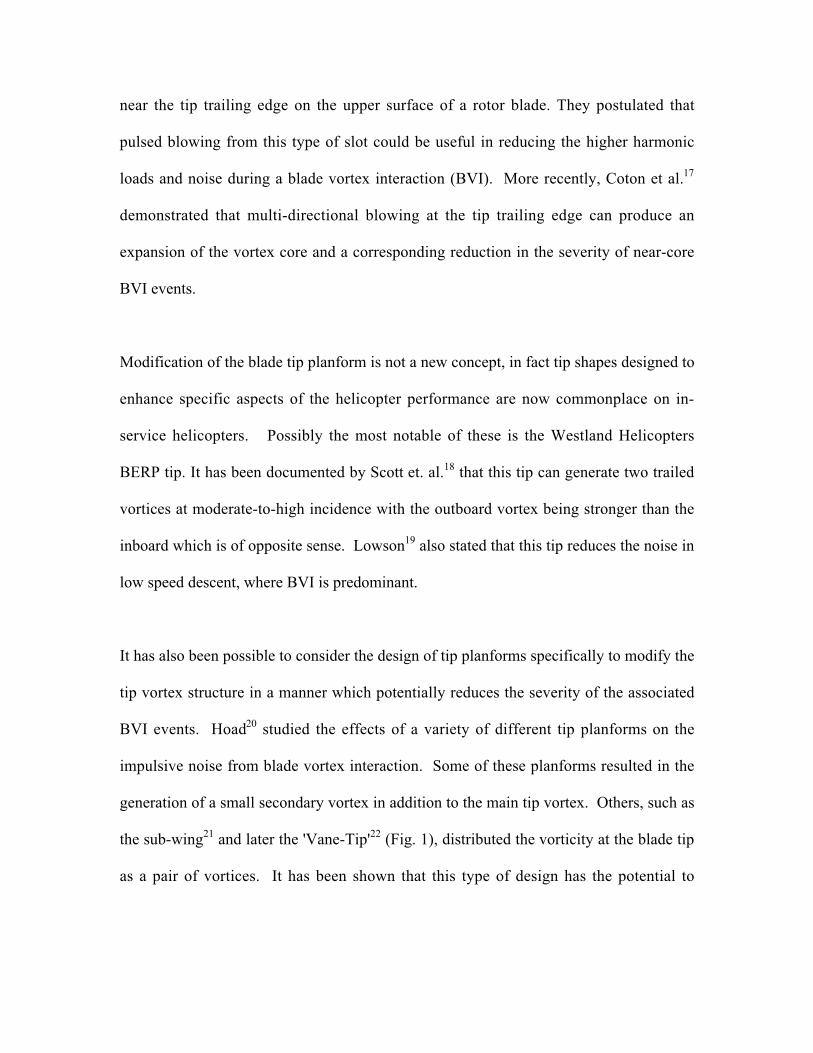
generation of a small secondary vortex in addition to the main tip vortex. Others, such as
the sub-wing21 and later the 'Vane-Tip'22 (Fig. 1), distributed the vorticity at the blade tip
as a pair of vortices. It has been shown that this type of design has the potential to
considerably reduce the severity of individual BVI events thus producing a corresponding
reduction in noise23.
Until relatively recently, little was known about the temporal and spatial development of
two such closely spaced trailed vortices and so it is difficult to assess the actual effect that
such a tip design would have. A study was conducted at the University of Glasgow to
investigate possible methods of generating such a vortex pair in the controlled
environment of a wind tunnel and to further investigate the temporal and spatial
development of the vortex system24. The primary objective of this study was to provide
a suitable twin vortex generation method for subsequent blade vortex interaction studies.
It was demonstrated that a stable vortex pair could be generated and that the rotation of
the pair could be represented in time by a relatively simple two-dimensional induced
velocity model. It was also shown that the spacing of the vortex pair and their strengths
remained almost constant with downstream distance from the vortex generator. In
contrast, the vortex cores grew almost linearly with downstream distance and eventually
merged far downstream when the ratio of the separation distance to the vortex core
diameter was approximately 1.9 or less as originally suggested by Rossow25.
In this paper, a twin vortex system is generated in a low speed wind tunnel and used to
study its parallel interaction with a rotating blade set at zero incidence. The results are
compared with those from interaction experiments in the same facility involving a single
vortex26.
EXPERIMENT
Model and test Set-up
All tests were performed in the University of Glasgow 1.61 m x 2.13 m low speed,
atmospheric pressure, closed return “Handley Page” wind tunnel at a flow velocity of
47m/s. Figure 2 illustrates the basic test set-up which consisted of a vortex generator
located upstream of a rigid, untwisted single rotor blade. This arrangement is similar to
that used by Horner et al.8,9.
Two vortex generators were manufactured to produce either a single vortex or twin
vortex system. Each vortex generator consisted of two NACA 0015 section cantilever
wings of chord 0.1524m made of suitably shaped aluminum spars enclosed in glass fiber
skins. These wings were positioned at the roof and floor of the mouth of the working
section and set at equal and opposite incidences to produce vortices of the required
strength and rotational sense. For the single BVI investigations, the generator wing pair
was pinned at the blade intersection and was of sufficient length to pass through the
tunnel roof and floor. Due to the proximity of the pinned intersection, a single vortex was
formed. For the twin vortex generator, the wing tips could be separated laterally and
vertically resulting in two distinct rolled up vortices. The resulting vortex system was
then convected downstream by the tunnel flow to interact with the clockwise-rotating
rotor (viewed from above). This approach to twin vortex generation was adopted on the
basis of the previous proof of concept study by Copland et al.24. Vertical positioning of
the twin vortex generator was achieved by a telescopic arrangement in which the bases of
the generator wing pair were moved in and out of streamlined fairings. Lateral
positioning of the wings was achieved manually.
Velocity measurements of the vortices produced by the two generators were made using a
TSI IFA-300 Hot Wire Anemometer system using DANTEC 55P61 cross wire probes.
The probes used 5µm diameter platinum plated tungsten wires with a length-to-diameter
ratio of 250. The measuring volume of the probe was approximately 0.8mm in diameter
and 0.5mm in height. The probe was calibrated in a special wind tunnel dedicated to the
purpose. During calibration, the probe was rotated (in 6o steps) ±30o in the plane of the
sensor wires to determine yaw sensitivity. A full account of the calibration procedures
used can be found in Copland27.
The interacting rotor blade, of NACA 0015 cross-section, was manufactured from carbon
fiber using a purpose built Nylatron mould and had a chord of 0.1524m and a span of
0.944m (based on rotor disk radius) resulting in an aspect ratio of 6.19. The blade merged
to a tapered circular section at the root which was located within an aluminum hub and
counterweight assembly. The tapered section provided the centrifugal pull-out load
reaction force, whilst the circular section and pitch grip clamp allowed the rotor pitch
angle to be set at discrete values. The blade was instrumented with 72 miniature Kulite
pressure transducers located at the spanwise locations shown in Table 1 and on the
dashed lines shown in Figure 3. This allowed detailed chordwise and spanwise pressure
data to be collected along the blade during a BVI event.

The rotor blade, hub and counterweight were mounted on a hollow cylindrical drive shaft
located vertically in the test section and passing through the tunnel roof and floor (Figure
1). The rotor was driven at 600 rpm (10 Hz) by a DC electric motor and bevel gear
arrangement located above the tunnel roof. The resultant rotor speed provided a tip Mach
number of 0.17 and a nominal tip Reynolds number of 600,000. The electrical wiring
from the pressure transducers was passed through the drive shaft, and the signals were
collected via a slip ring set by a BE256 data logger. All data were recorded over a 144o
capture angle at 50 kHz sampling rate with 32,000 samples being logged per channel, per
run, over 16 revolutions. The resulting azimuth angle resolution between samples was
0.072o.
The flow velocity and rotor rotational speeds used in the experiment correspond to an
advance ratio µ=0.79 which contrasts with the nominal range of 0.15 - 0.2 generally
associated with BVI on a helicopter rotor. One consequence of this is that
unrepresentative local flow skew angles exist in the measurement region of the blade and
will inevitably influence the measured data. Comparisons of previous measurements in
the same facility with other experiments and numerical predictions8, however, suggest
that the collected data will exhibit the essential features of parallel BVI.
Test Geometry
The test geometry used for the single BVI investigations is illustrated in Figure 4. All
parameters were taken relative to the vortex generator wing junction located 2.1 rotor
radii upstream of the rotor. Parameter lv was used as a measure of the lateral offset of this
junction from the tunnel centerline which, for parallel interactions, was zero.
In order to provide a temporal reference frame for a BVI interaction, the xv parameter was
used. This provided a measure of the perpendicular distance between the generator wing
junction and the leading edge pressure transducer at a particular station. Hence, xv was a
function of both blade station, r/R, and blade azimuth angle.
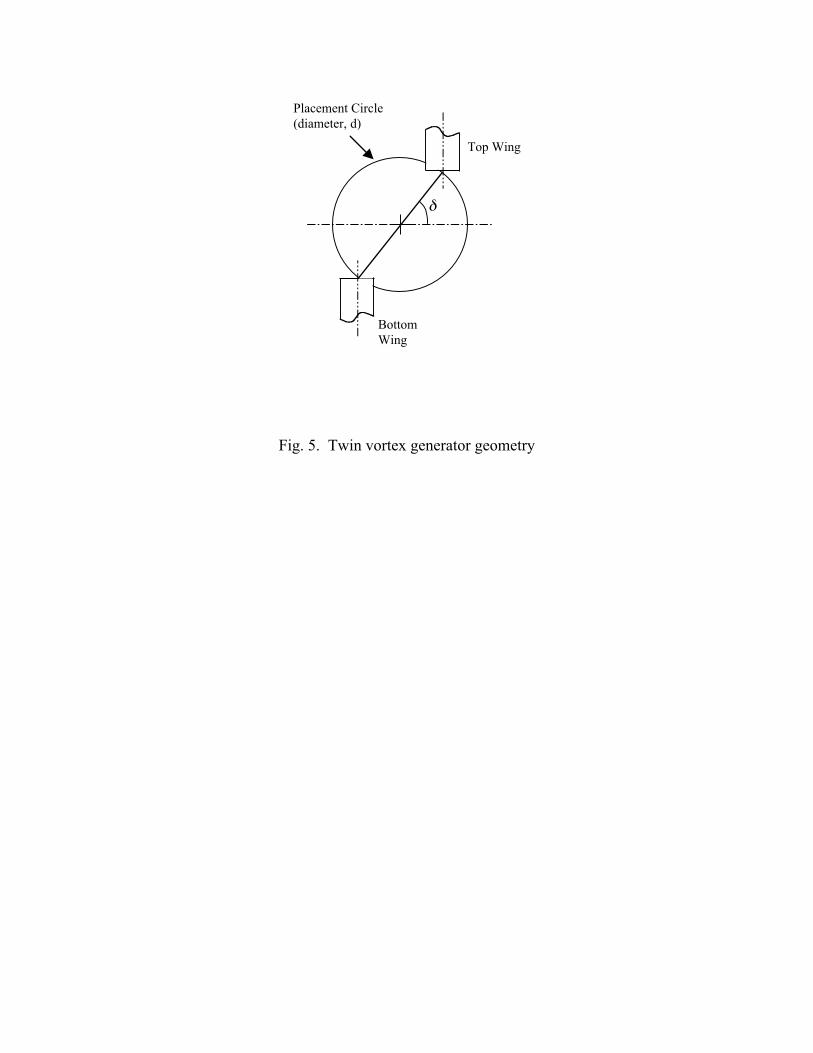
Figure 5 illustrates the test geometry used for the twin BVI investigations. For this case,
parameters xv, and lv were taken relative to the centre of the placement circle about which
the top and bottom wings of the twin vortex generator were positioned. This placement
circle also introduced a slight obliqueness within the twin BVI events considered.
Additional parameters were used to geometrically position the twin generator wings on
the circumference of this circle, namely the placement circle diameter, d, and the blade
angular position on the placement circle, δ.
It should be noted that all the above parameters are geometrical in origin and do not
account for the effects of vortex meander.
The twin vortex test program was performed for a rotor pitch setting of θ = 0o only. The
centre of the generator placement circle was placed in the lv/c = 0 position and at heights
of yv = 0, ± 0.2c, about which points the placement circle diameter, d, was set at either
O.5c, 0.75c, or 1c. The angular position of the twin vortex generator, δ, together with the
other parameter settings used in the test program are detailed in Table 2.
In the following discussion, BVI measurements corresponding to cases in which there
was no lateral or vertical offset of the vortex system, i.e. yv = lv= 0, are presented. Twin
vortex BVI measurements are presented for a range of vortex generator angular positions
but with the core separation and individual vortex strength fixed at 0.5c and 2.9m2/s
respectively. These results are compared with a single vortex parallel BVI interaction
case with a vortex strength of 5.8 m2/s, corresponding to a generator blade incidence or
12.5o. It should be noted that this is the same incidence setting as that used on the twin
vortex generator to generate the weaker twin vortices.
Experimental Errors
The data acquisition system and software has an automatic gain adjustment feature that
allows measurements to be taken at the maximum resolution of the system. On the basis
of previous experience with Kulite miniature transducers26 and taking account of
discretization and calibration factor errors, the uncertainty in the measured pressure
coefficients is estimated to be 0.5%.
The blade pitch of the vortex generator could be set to an accuracy of better than
0.25o. The vortex strengths, determined from the hot-wire measurements, were accurate
to within 2% and the corresponding estimates of core size to within 5%. A significant
source of uncertainty in the measurements was the position of the vortex system. Once
produced by the rotor rig, the vortex system convected through the wind tunnel and was
subject to forcing from the rotating blade in the working section. Although the position
of the vortex generator could be set to within 0.5mm, the vortex system was found to
meander. The maximum meander, has been estimated using PIV to be around 40mm; the
primary effect is a change in vortex height. To provide an indication of the effect this has
on the normal force and pitching moments, plots of several cycles of data are presented in
the results section.
RESULTS AND DISCUSSION
Vortex Characteristics
In the present study, measurements of both the twin and single vortex systems were made
with the hot-wire anemometry system. These measurements were made using an X-wire
probe in the BVI measurement plane but in the absence of the rotor rig and were used to
establish the relationship between the vortex generator settings and the resulting vortex
systems. The technique used to determine the individual strengths of each of the twin
vortices followed that used in a previous study in a smaller wind tunnel by Copland et
al24. In essence, the cross-flow velocities due to the twin vortex system were measured
on a two-dimensional grid at a specific location downstream of the vortex generator. The
vortex core locations were then input to a numerical model based on superposition and
the core sizes and vortex strengths adjusted until a best fit was obtained between the
model and the experimentally measured flow field. Full details of this method and
example comparisons between the model and experimental data are provided in Ref. 24.
The variation of vortex strength is plotted against the incidence setting of the generator
wings for both the twin and single vortex cases in Fig. 6. From this figure, it may be
observed that, for a given generator wing incidence, the strength of the single vortex is
twice that of each of the twin vortices. In essence, this implies that in the former case
the vorticity from the two generating wings is channeled into one intersection vortex,
whereas, in the latter, the vorticity from each wing is channeled into its own isolated tip
vortex.
In their previous study, Copland et al.24 found that, the core sizes of the vortices produced
by the generator were insensitive to the wing incidence. This is confirmed in the present
case by Fig. 7 which shows that the variations in the core sizes of both the twin and
single vortices with wing incidence are very small. Interestingly, however, the core size
of the single vortex is around 30% larger than those of the twin vortices.
Generally, it was found that the measurements of vortex core size and strength were
repeatable for a given generator wing incidence, regardless of the wing tip location in the
generator placement circle. Copland et al.24 noted, in the previous study, that the spacing
between the two vortex cores showed some dependency on the orientation of the vortices
with respect to each other. This effect was attributed to interference from the probe
traversing system and was again observed in the present study. This effect introduces
some uncertainty in the measured orientation and spacing of the vortices. Table 3 shows
the measured geometric characteristics of three different twin vortex configurations in the
BVI measurement plane. The three vortex systems were produced with a spacing of 0.5c
between the vortex generator wings and δ settings of 0o, 45o and 90o. Although the
measurements exhibit variability in core spacing, it should be noted that this should not
be attributed solely to traverse interference since the roll-up process is also influential. It
is known that tip vortices roll up slightly inboard of the wing tip which, in the δ=90o case
where the wing tips were separated vertically, would result in an increased spacing
between the cores in line with the measured data. Possibly, however, the most interesting
feature of the measurements is the angular difference between the three vortex systems.
In terms of the tips of the vortex generator wings, the three cases are progressively spaced
by 45o whereas the measurements indicate a progressive rotation of more than 75o
between the vortex systems. The reason for this is unclear but the way in which the roll
up process is influenced by the mutual inductance between the two wings may be a factor
in this. The previously mentioned traverse interference is also a possible contributory
factor although, from the BVI results presented in the following section, it appears that
the measured orientations are not significantly different from those experienced by the
interacting blade in the absence of the traverse.
BVI Measurements
In this section all aerodynamic data were non-dimensionalized using the rotor tip
velocity, VTIP. This resulted in comparable aerodynamic scaling between the rotor and
vortex generator. To aid interpretation of the twin vortex BVI results, a case will be
presented in which the blade interacts with a single vortex. This case is typical of
measurements that have been fully described elsewhere26, but its description here will
allow the gross features of the basic interaction to be characterized before consideration
of the more complex twin case.
Single Vortex Interaction
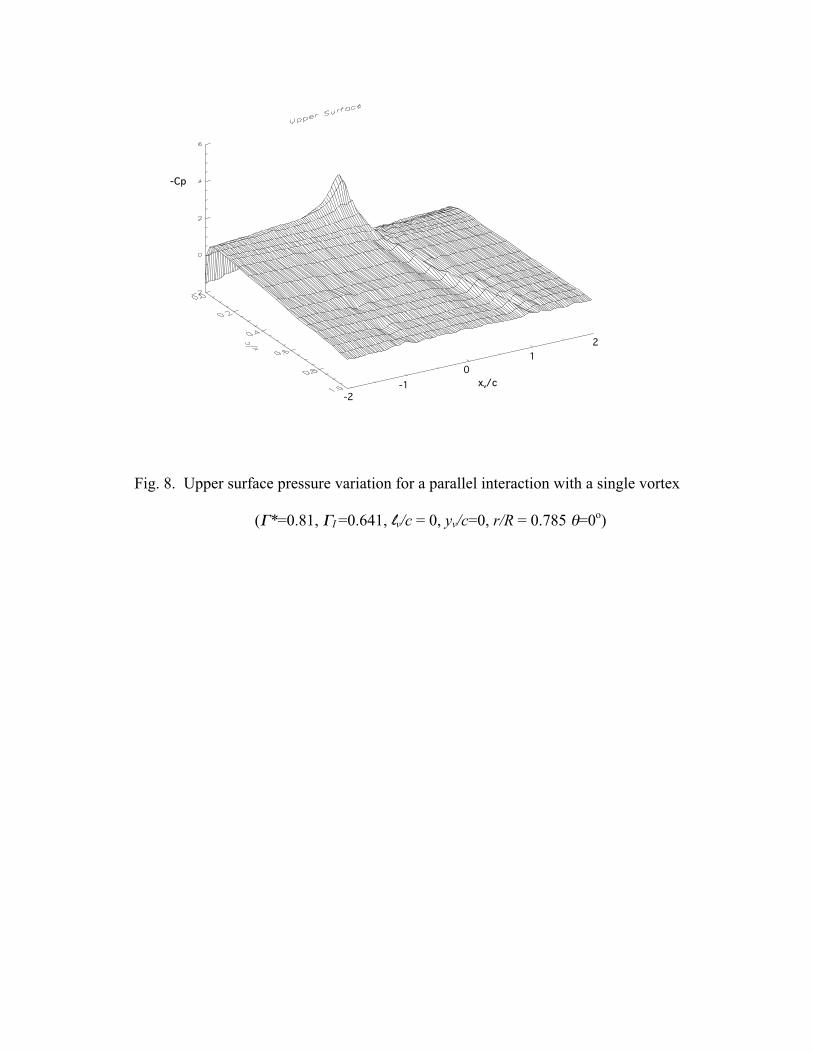
Figure 8 illustrates the temporal variation of the upper surface pressure distribution
during a parallel interaction ( lv/c = 0, yv/c=0 ) with a vortex of strength Γ= 5.8m2/s at the
inboard ( r/R = 0.785) station. It should be noted that the data, in this figure, are from
one of the sixteen recorded revolutions for this particular case. The plot shows -Cp on the
vertical axis plotted against the transducer chord position, x/c, and non-dimensional time,
xv/c, in the foreground. It should be noted, at this stage, that the vortex was prone to
meandering during the experiment. This can be attributed to the forcing of the rotating
blade in the wind tunnel working section since the vortex was stable during the hot-wire
measurements described above. This meandering effect has been observed during
previous BVI experiments at Glasgow7,8,9 and its magnitude has been estimated, using
Particle Image Velocimetry, to be around 0.25c. Thus, given the potential variability
between individual revolutions, it was inappropriate to cycle average the data as this
would have resulted in attenuation of significant local features of the response. Great
care has, therefore, been taken to ensure that the individual interactions presented in this
paper are representative of the general behavior exhibited in the sixteen revolutions
collected for each case.
The plot presented in Fig. 8 illustrates the typical upper surface response to blade vortex
interaction, observed in previous studies, for a rotor pitch of 0o7,8,9. It shows the
characteristic slow increase in leading edge suction peak associated with the flow field
induced by the approaching vortex. This is followed by a rapid collapse of this peak as
the vortex moves onto and over the leading portions of the blade in the 0 <xv/c < 0.35
region. After this, a more clearly defined low-pressure ridge associated with the vortex
convection over the blade is seen until the vortex finally leaves the blade at
approximately xv/c = 0.92. Following this, the trailing edge region remains disturbed for
a short time before gradually returning to its undisturbed state. The origin of this
disturbance was examined in PIV studies at Glasgow9. These showed that subsequent to
the passage of the vortex off the trailing edge, the rear most portions of the blade remain
in a highly disturbed flow field as the vortex initially moves downwards and then
upwards in the blade wake.
The behavior on the lower surface of the blade during such an interaction has been
observed in previous studies and will, for completeness be described briefly here. Due to
the sense of the vortex, the flow velocities on the lower surface of the blade are inhibited
and no large suction region occurs as the vortex approaches the blade. Rather, the
pressures aft of the stagnation point on the forward portion of the lower surface increase
slightly as the vortex approaches the blade. Once the vortex passes the leading edge, there
is a recovery in the lower surface suction pressures as the low pressures associated with
the impinging vortex begin to dominate. The low-pressure ridge associated with the
passage of the vortex across the surface is also observed although the vortex takes longer
to pass over the lower surface of the blade than the upper. This may be due to influence
of the blade bound circulation slowing its progression.
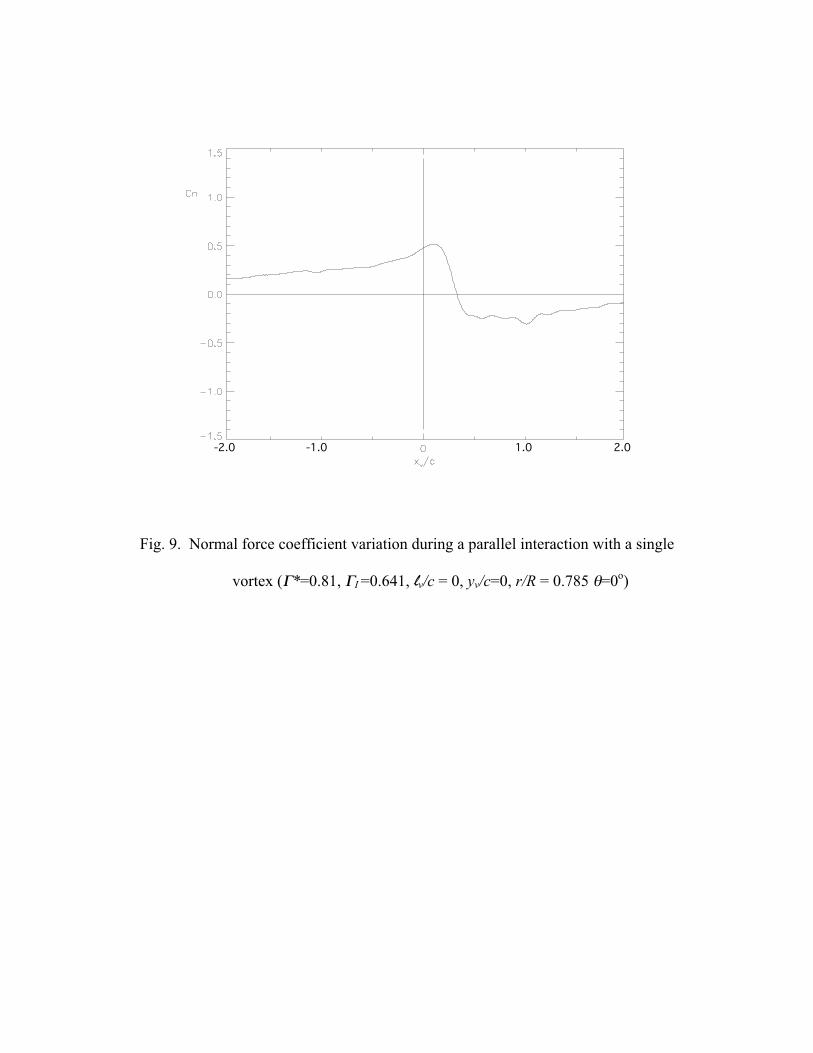
Figure 9 illustrates the sectional normal force coefficient non-dimensional time histories
obtained by integrating the upper and lower surface pressures at the 0.785 span station for
the case presented in Fig. 8. It may be observed that Cn steadily increases as the vortex
approaches the blade and reaches a maximum value just after xv/c= 0. Following this, the
normal force decreases abruptly, flattens out and then following a sudden decrease in Cn
near xv/c = 1, gradually tends towards zero. Consideration of this plot together with Fig.
8 allows the Cn response to be explained in terms of the Cp data. In particular, the initial
rise followed by the sudden reversal in Cn occurs as the vortex first approaches and then
convects over the front section of the blade. The resulting suction peak produces the
corresponding maximum Cn value just after the xv/c= 0. Following this, the collapse in
suction pressures on the forward portion of the blade results in the rapid reduction in Cn.
Subsequently, the relatively constant upward force increment associated with the low
pressure vortex convection ridge, halts the drop in the normal force. This causes the Cn
values to level off until the vortex convects off the trailing edge of the blade. The
following negative spike corresponds to the loss of vortex induced upward force on the
rotor as the low pressure vortex convects off the blade. In addition, the vortex flow field
also causes a corresponding increase in the local pressures recorded at the trailing edge of
the lower surface which further contributes to the magnitude of this spike. This induced
effect then decreases as the vortex convects away from the blade, and the Cn tends
towards zero.
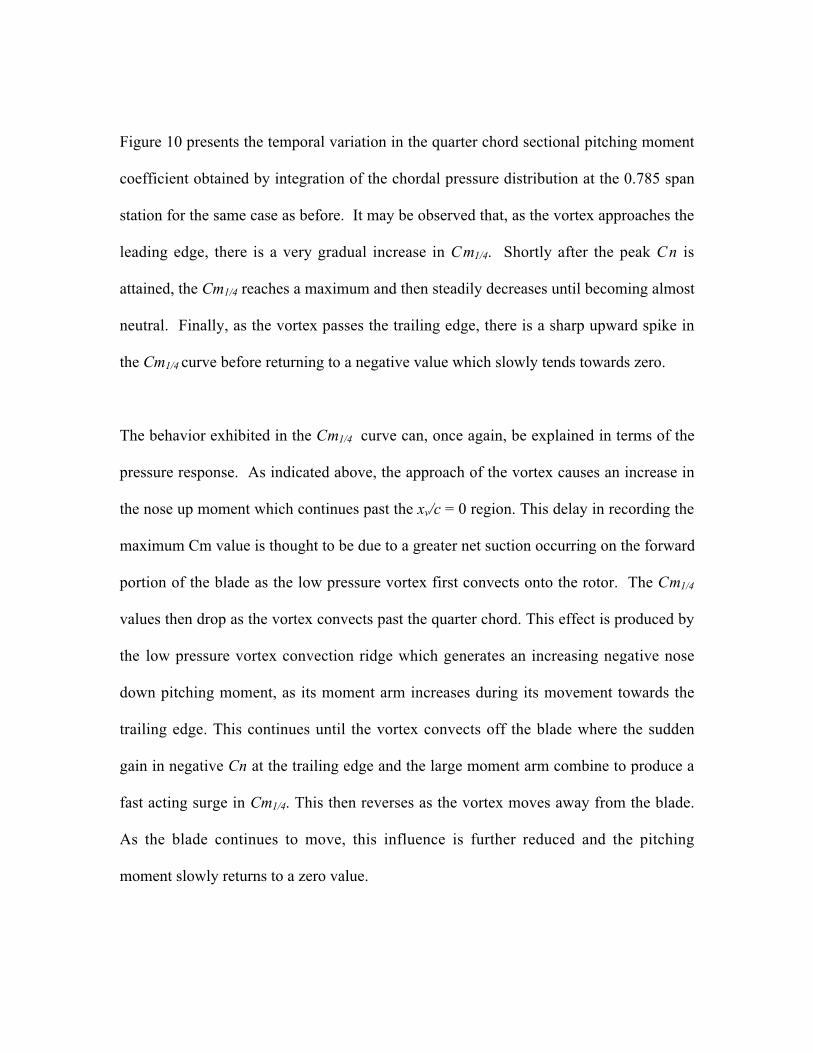
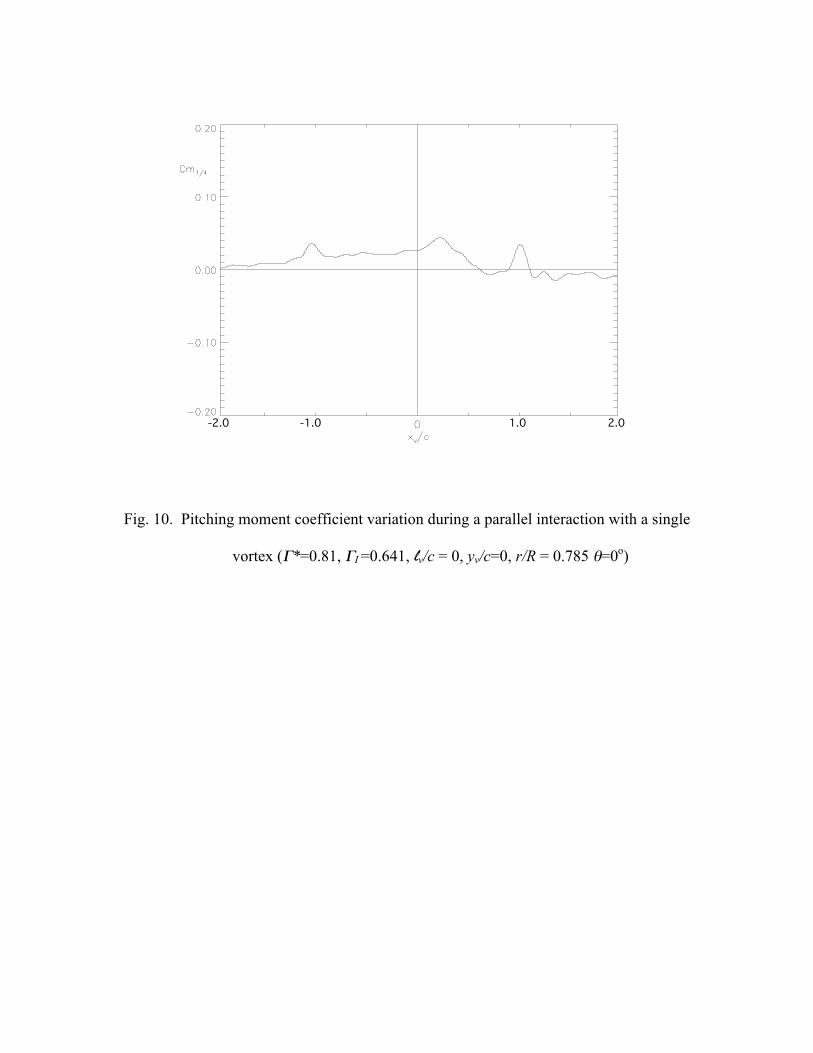
Figure 10 presents the temporal variation in the quarter chord sectional pitching moment
coefficient obtained by integration of the chordal pressure distribution at the 0.785 span
station for the same case as before. It may be observed that, as the vortex approaches the
leading edge, there is a very gradual increase in Cm1/4. Shortly after the peak Cn is
attained, the Cm1/4 reaches a maximum and then steadily decreases until becoming almost
neutral. Finally, as the vortex passes the trailing edge, there is a sharp upward spike in
the Cm1/4 curve before returning to a negative value which slowly tends towards zero.
The behavior exhibited in the Cm1/4 curve can, once again, be explained in terms of the
pressure response. As indicated above, the approach of the vortex causes an increase in
the nose up moment which continues past the xv/c = 0 region. This delay in recording the
maximum Cm value is thought to be due to a greater net suction occurring on the forward
portion of the blade as the low pressure vortex first convects onto the rotor. The Cm1/4
values then drop as the vortex convects past the quarter chord. This effect is produced by
the low pressure vortex convection ridge which generates an increasing negative nose
down pitching moment, as its moment arm increases during its movement towards the
trailing edge. This continues until the vortex convects off the blade where the sudden
gain in negative Cn at the trailing edge and the large moment arm combine to produce a
fast acting surge in Cm1/4. This then reverses as the vortex moves away from the blade.
As the blade continues to move, this influence is further reduced and the pitching
moment slowly returns to a zero value.
Twin Vortex Interaction
In the following discussion, data are presented for twin BVI events involving vortex pairs
with an initial separation, d/c, of 0.5c. Cases are presented for a range of vortex
generator inclination angles to examine how the nature of the interaction changes with
the orientation of the vortex system. In all cases, the parameters yv/c and lv/c were set
equal to zero and each vortex had a strength of Γ=2.9m2/s giving a combined vortex
strength of the twin system of Γ=5.8m2/s.
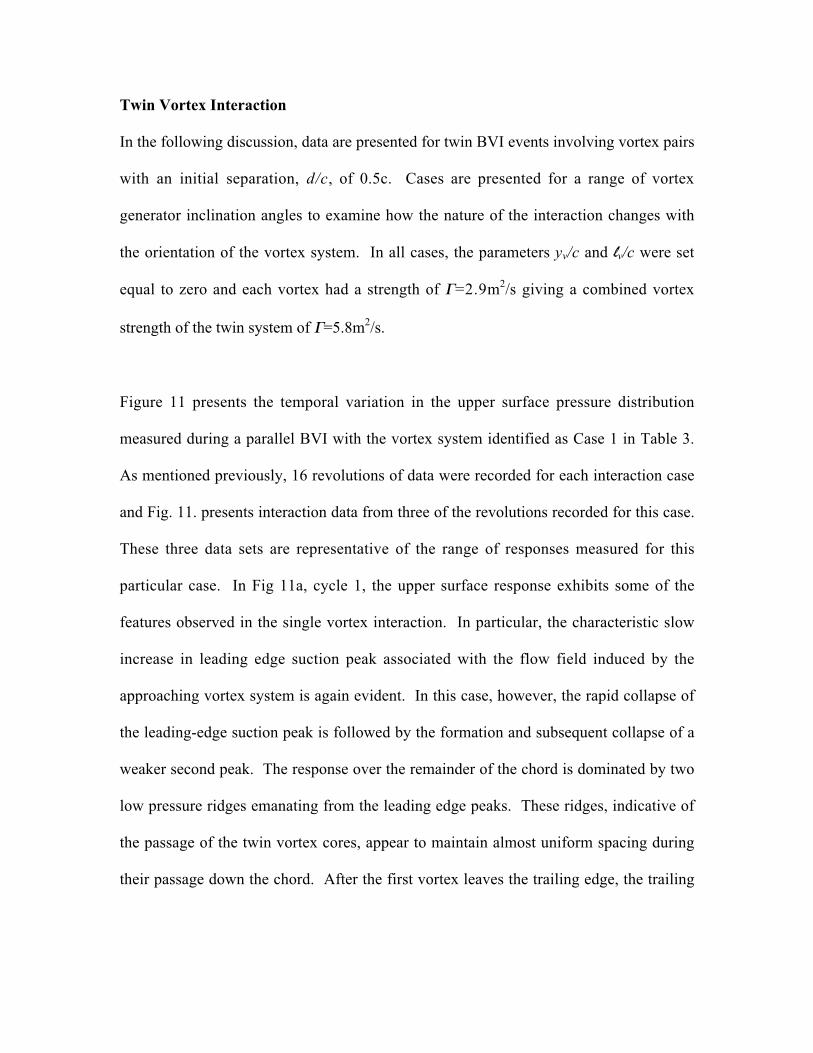
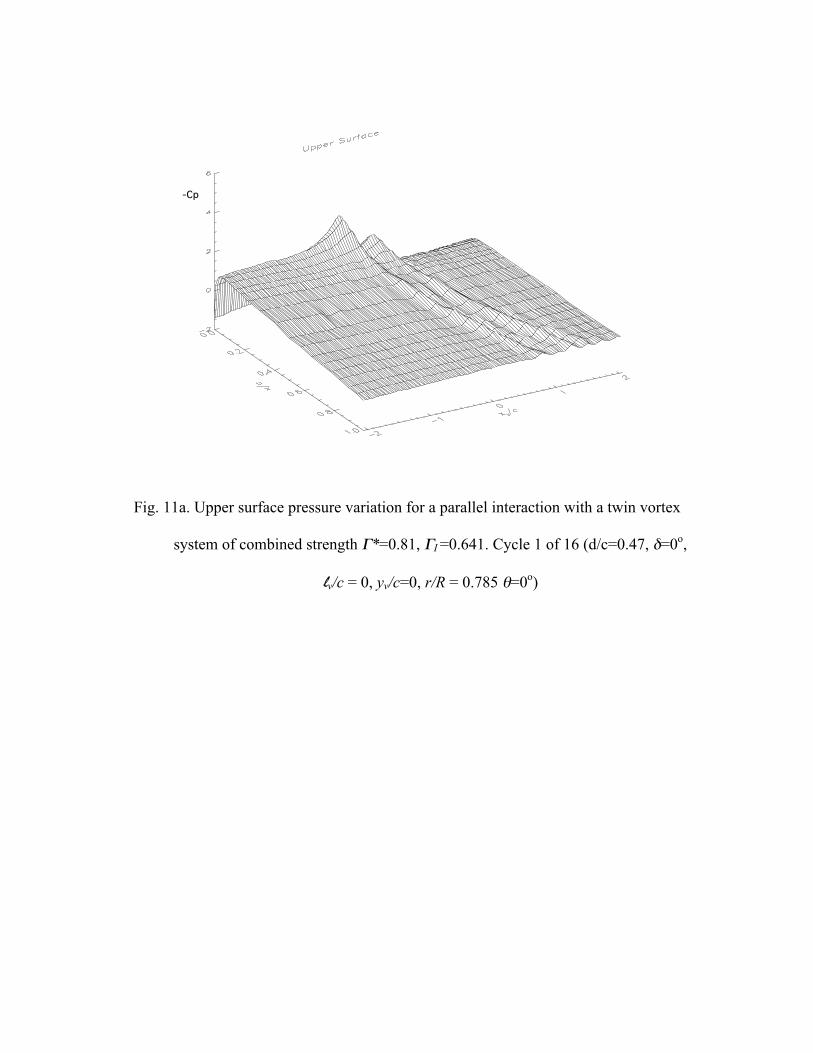
Figure 11 presents the temporal variation in the upper surface pressure distribution
measured during a parallel BVI with the vortex system identified as Case 1 in Table 3.
As mentioned previously, 16 revolutions of data were recorded for each interaction case
and Fig. 11. presents interaction data from three of the revolutions recorded for this case.
These three data sets are representative of the range of responses measured for this
particular case. In Fig 11a, cycle 1, the upper surface response exhibits some of the
features observed in the single vortex interaction. In particular, the characteristic slow
increase in leading edge suction peak associated with the flow field induced by the
approaching vortex system is again evident. In this case, however, the rapid collapse of
the leading-edge suction peak is followed by the formation and subsequent collapse of a
weaker second peak. The response over the remainder of the chord is dominated by two
low pressure ridges emanating from the leading edge peaks. These ridges, indicative of
the passage of the twin vortex cores, appear to maintain almost uniform spacing during
their passage down the chord. After the first vortex leaves the trailing edge, the trailing
edge pressure response becomes disturbed and this continues up to and beyond the
passage of the second vortex.
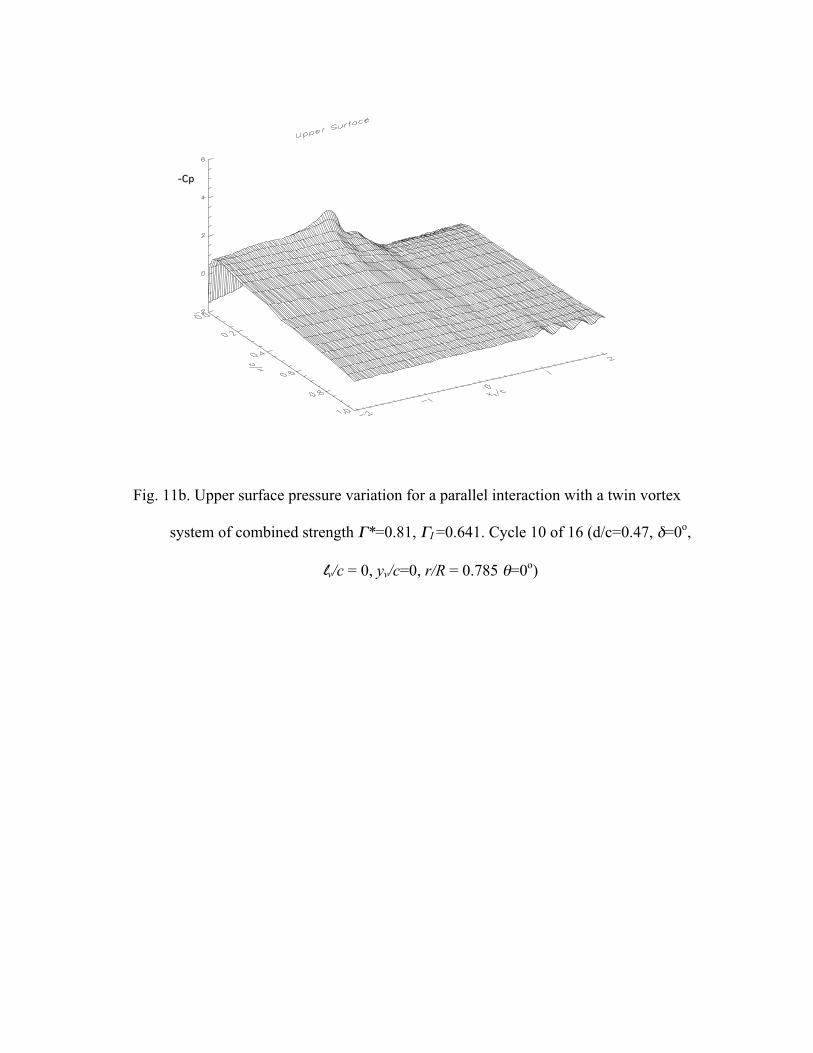
A quite different response is obtained in Fig. 11b, cycle 10, where, although the pressure
levels before and after the interaction are almost identical to cycle 1, the interaction itself
is quite different. Here, the severity of the leading edge response is greatly reduced and
the second suction peak is barely discernible. There is also little evidence of the two
suction ridges associated with the passage of the vortex system over the blade.
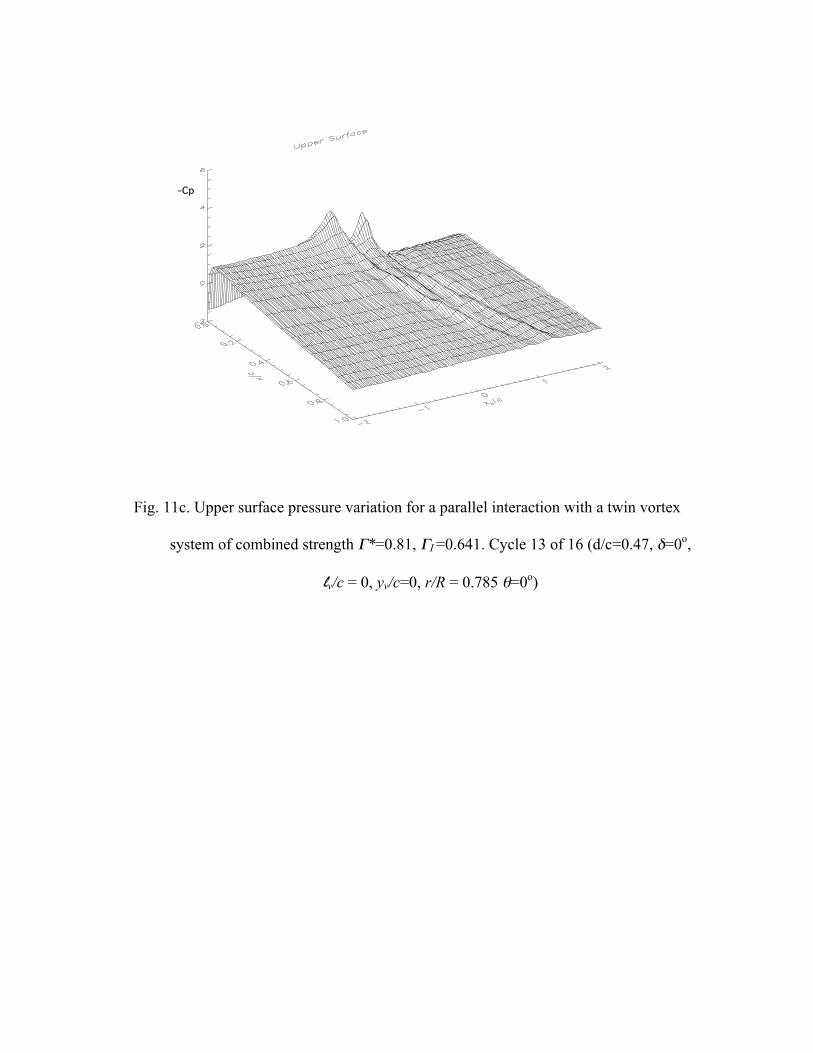
The response exhibited in Fig. 11c, cycle 13, is almost identical to that in cycle 1. The
only obvious differences in the two plots are a higher secondary leading-edge peak in
cycle 13 and the reduced disturbance at the trailing edge subsequent to the passage of the
vortex system. Otherwise, both plots display the same general features.
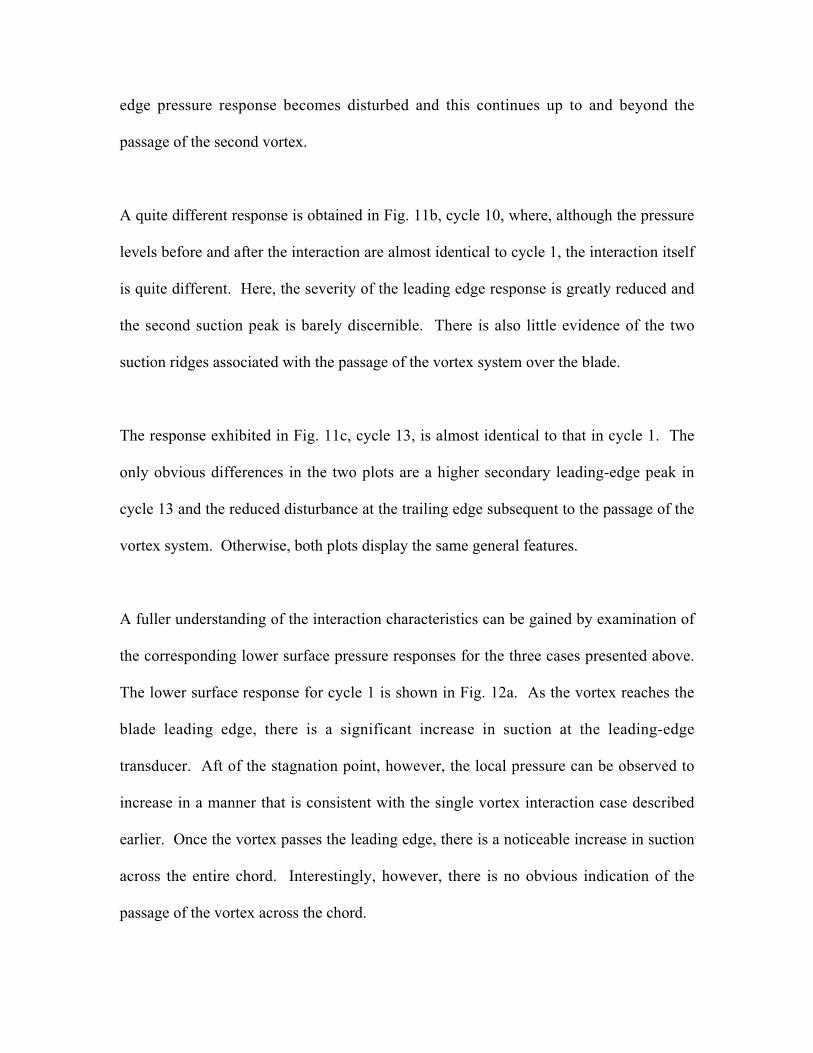
A fuller understanding of the interaction characteristics can be gained by examination of
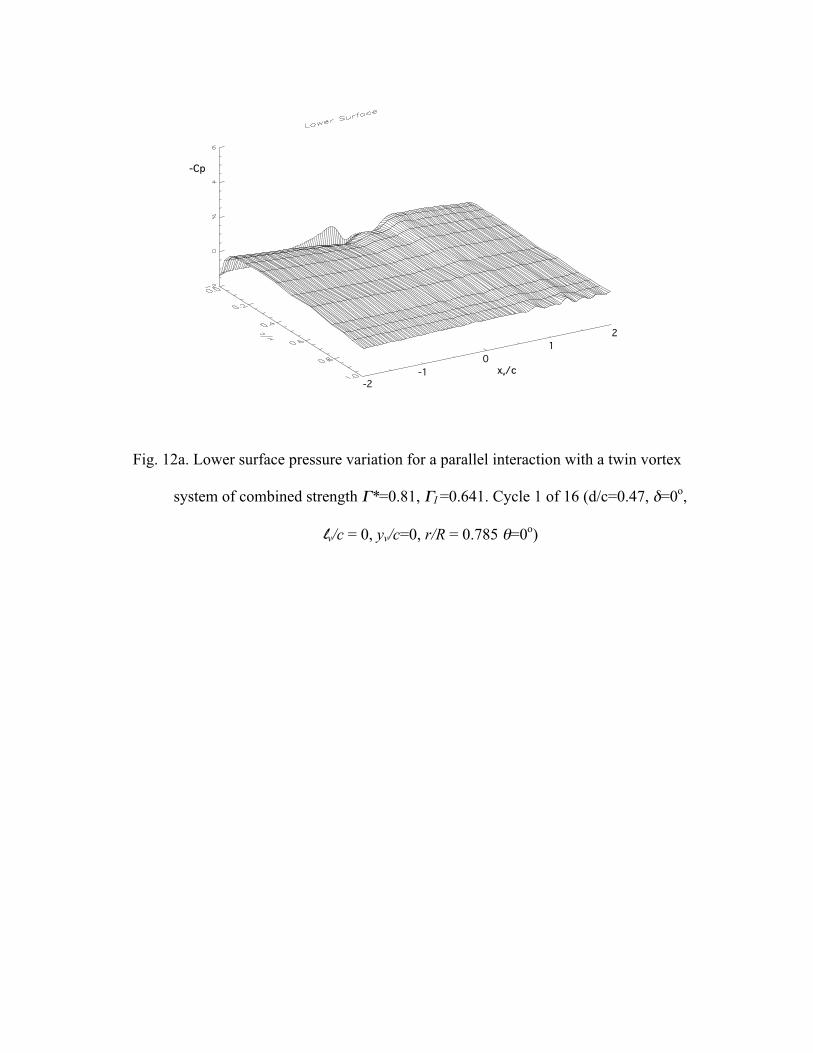
the corresponding lower surface pressure responses for the three cases presented above.
The lower surface response for cycle 1 is shown in Fig. 12a. As the vortex reaches the
blade leading edge, there is a significant increase in suction at the leading-edge
transducer. Aft of the stagnation point, however, the local pressure can be observed to
increase in a manner that is consistent with the single vortex interaction case described
earlier. Once the vortex passes the leading edge, there is a noticeable increase in suction
across the entire chord. Interestingly, however, there is no obvious indication of the
passage of the vortex across the chord.

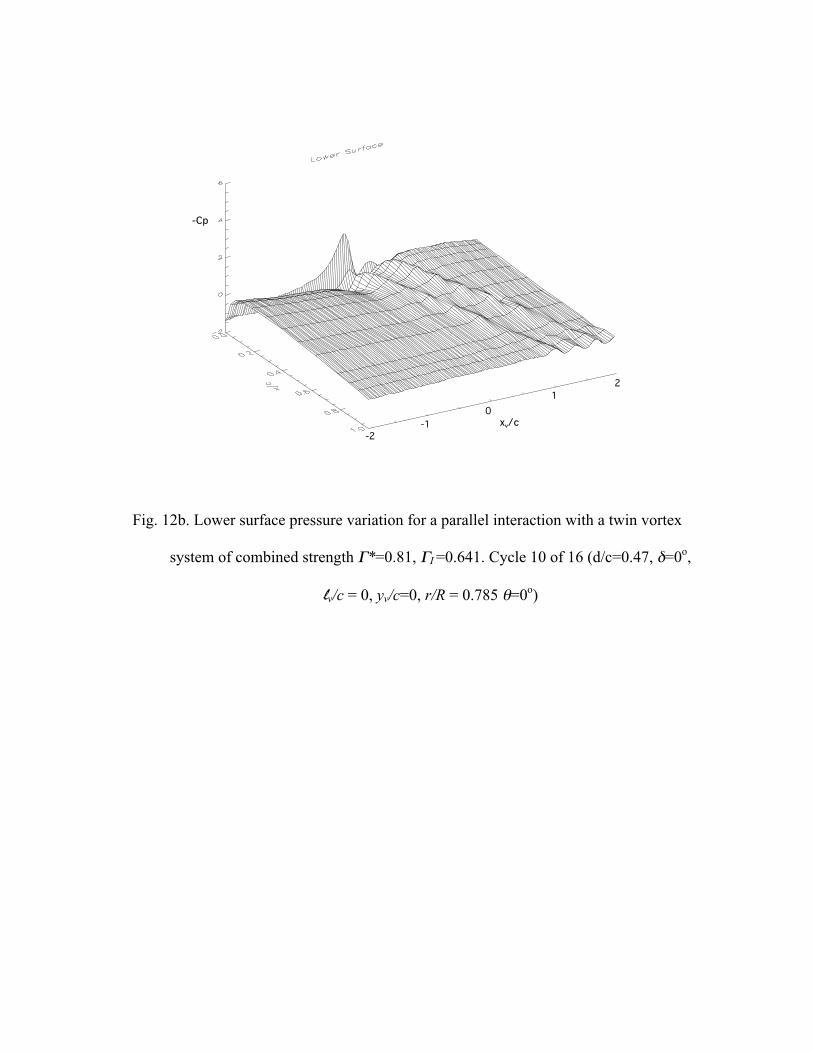
Figure 12b presents the lower surface response corresponding to cycle 10. This case
exhibits the same gross features as cycle 1 but the detail response is quite different. In
particular, two clear ridges associated with the chordwise convection of the vortex system
are evident in this case.
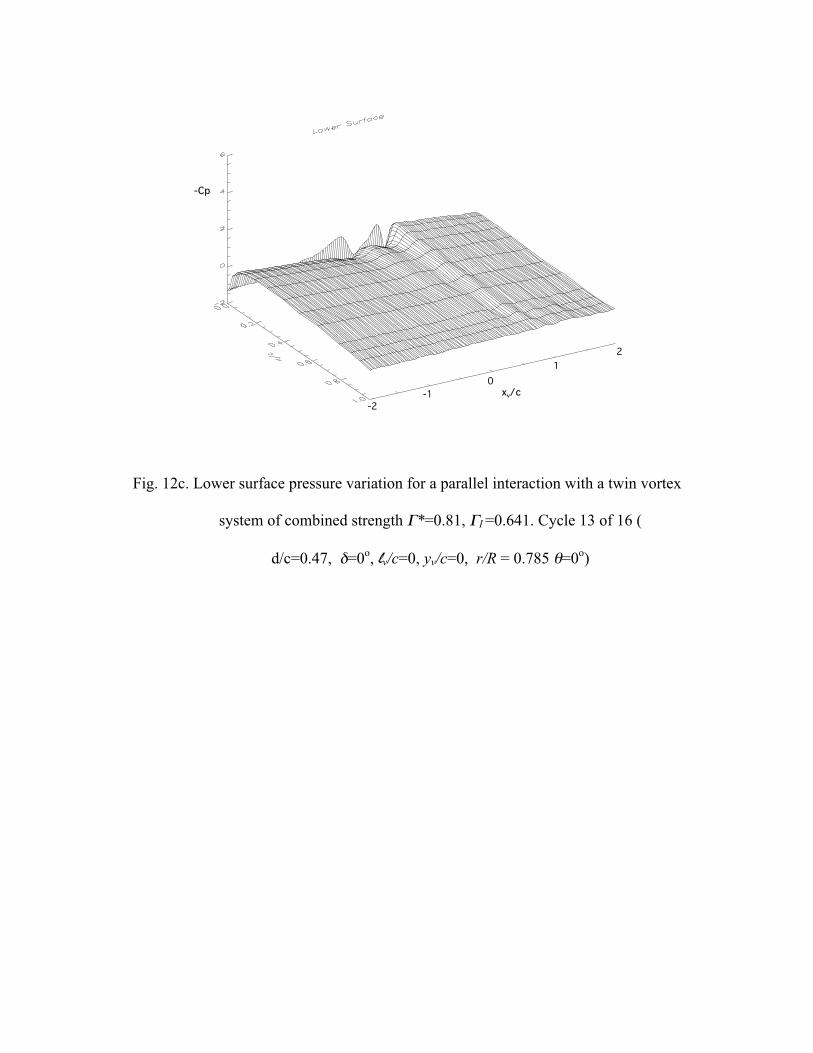
Finally, Fig 12c presents the lower surface response measured during cycle 13. The early
stages of the response in Fig. 12c are almost identical to cycle 1 but the latter stages are
quite different. Both figures show a two stage rise in suction as the vortex system moves
over the blade but the second stage response in Fig. 12c is much more dramatic than in
Fig. 12a.
The behavior exhibited in Figures 11 and 12 is illustrative of the extent to which vortex
meander can significantly change the detail of the interaction. For this case, Table 3
suggests that both vortices in the system lie in the plane of the blade. Thus, on a purely
geometric basis, it would be expected that the blade would cut the vortices one after the
other. If this were to happen, it would also be expected that the passage of the vortex
fragments over the upper and lower surfaces would be marked by the appearance of
convective ridges of the type observed in Fig. 11a and Fig 12b. This is clearly not
happening as, in each of the cycles presented, the ridges only appear on one surface. In
other words the vortex system is being convected either above (cycles 1 and 13) or below
(cycle 10) the blade. This is not unexpected as previous studies in the same facility have
shown that the vortex system is prone to meandering in this way with the vortex core
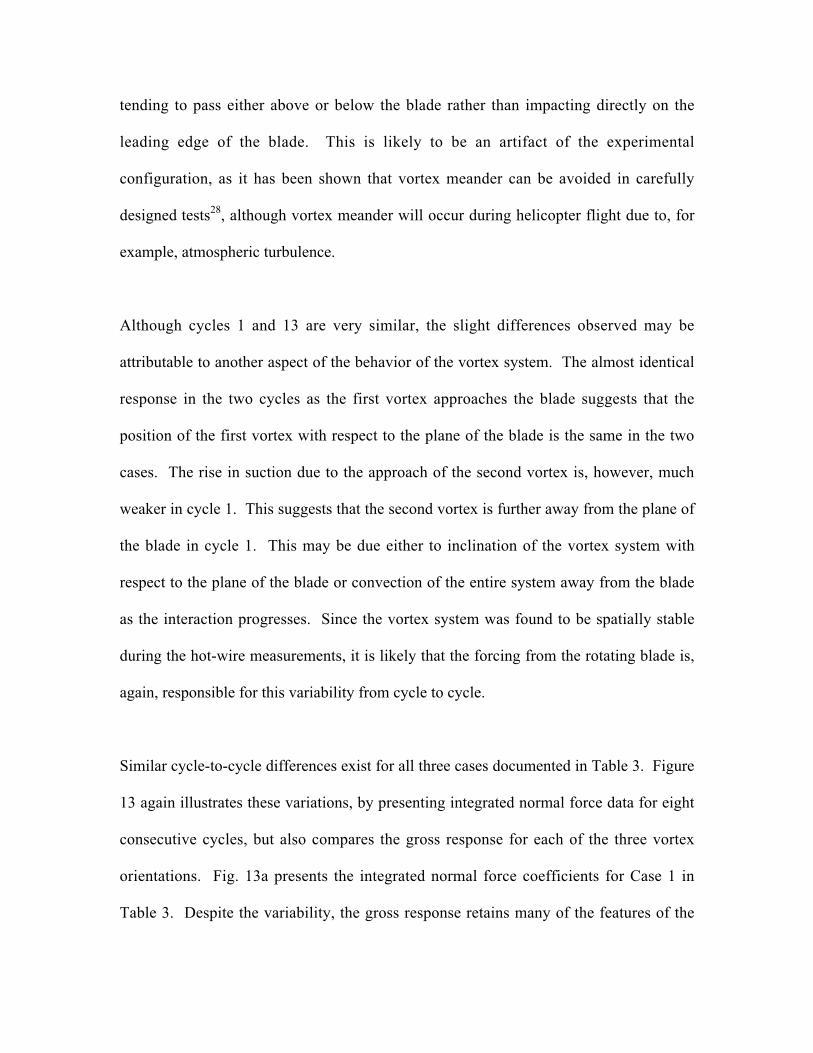
tending to pass either above or below the blade rather than impacting directly on the
leading edge of the blade. This is likely to be an artifact of the experimental
configuration, as it has been shown that vortex meander can be avoided in carefully
designed tests28, although vortex meander will occur during helicopter flight due to, for
example, atmospheric turbulence.
Although cycles 1 and 13 are very similar, the slight differences observed may be
attributable to another aspect of the behavior of the vortex system. The almost identical
response in the two cycles as the first vortex approaches the blade suggests that the
position of the first vortex with respect to the plane of the blade is the same in the two
cases. The rise in suction due to the approach of the second vortex is, however, much
weaker in cycle 1. This suggests that the second vortex is further away from the plane of
the blade in cycle 1. This may be due either to inclination of the vortex system with
respect to the plane of the blade or convection of the entire system away from the blade
as the interaction progresses. Since the vortex system was found to be spatially stable
during the hot-wire measurements, it is likely that the forcing from the rotating blade is,
again, responsible for this variability from cycle to cycle.
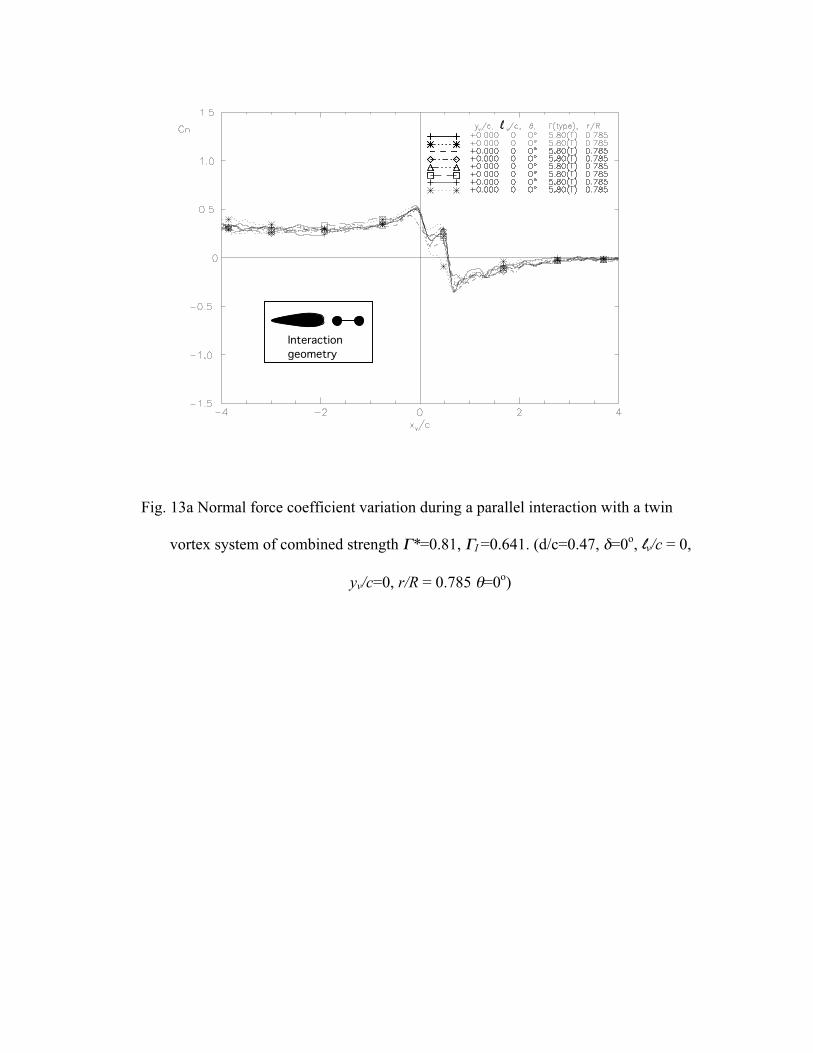
Similar cycle-to-cycle differences exist for all three cases documented in Table 3. Figure
13 again illustrates these variations, by presenting integrated normal force data for eight
consecutive cycles, but also compares the gross response for each of the three vortex
orientations. Fig. 13a presents the integrated normal force coefficients for Case 1 in
Table 3. Despite the variability, the gross response retains many of the features of the
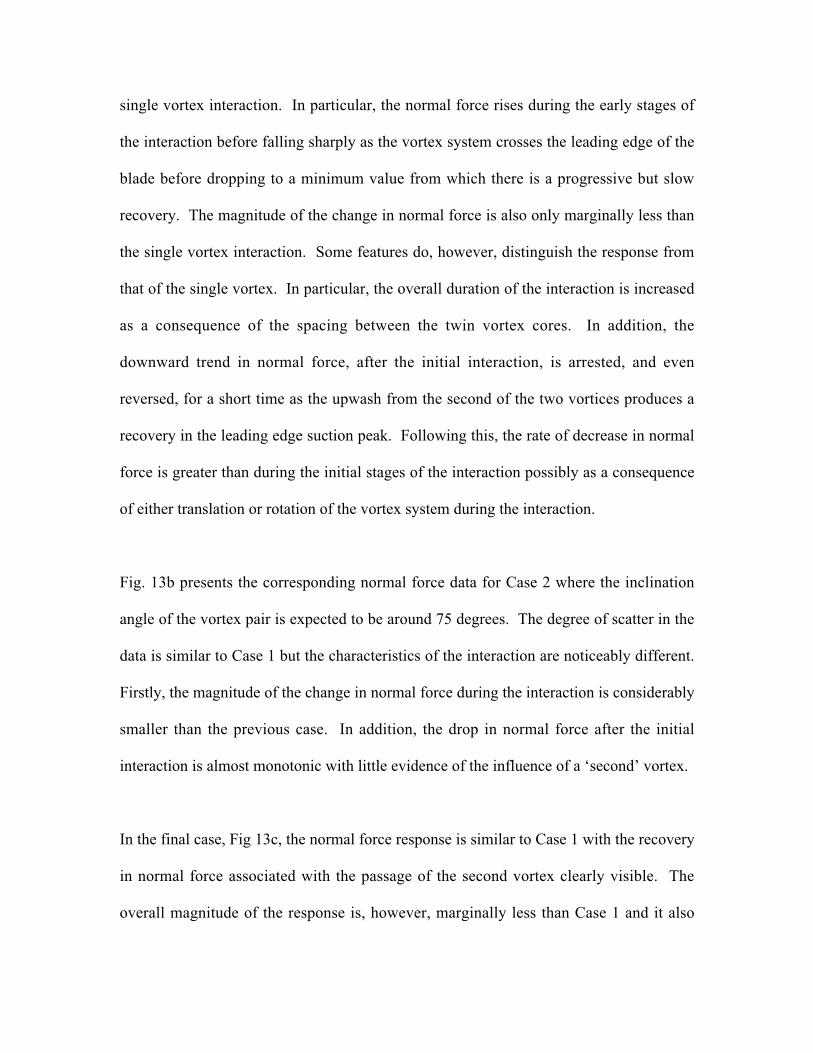
single vortex interaction. In particular, the normal force rises during the early stages of
the interaction before falling sharply as the vortex system crosses the leading edge of the
blade before dropping to a minimum value from which there is a progressive but slow
recovery. The magnitude of the change in normal force is also only marginally less than
the single vortex interaction. Some features do, however, distinguish the response from
that of the single vortex. In particular, the overall duration of the interaction is increased
as a consequence of the spacing between the twin vortex cores. In addition, the
downward trend in normal force, after the initial interaction, is arrested, and even
reversed, for a short time as the upwash from the second of the two vortices produces a
recovery in the leading edge suction peak. Following this, the rate of decrease in normal
force is greater than during the initial stages of the interaction possibly as a consequence
of either translation or rotation of the vortex system during the interaction.
Fig. 13b presents the corresponding normal force data for Case 2 where the inclination
angle of the vortex pair is expected to be around 75 degrees. The degree of scatter in the
data is similar to Case 1 but the characteristics of the interaction are noticeably different.
Firstly, the magnitude of the change in normal force during the interaction is considerably
smaller than the previous case. In addition, the drop in normal force after the initial
interaction is almost monotonic with little evidence of the influence of a ‘second’ vortex.
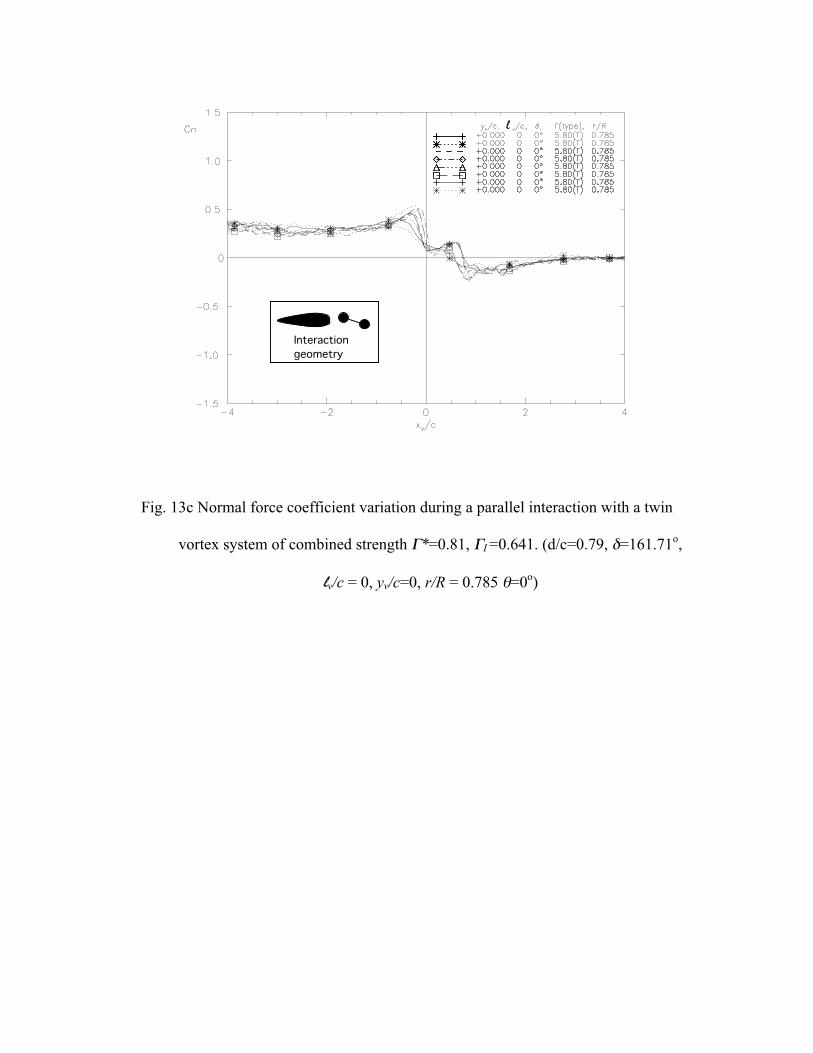
In the final case, Fig 13c, the normal force response is similar to Case 1 with the recovery
in normal force associated with the passage of the second vortex clearly visible. The
overall magnitude of the response is, however, marginally less than Case 1 and it also
appears to have a longer duration. These features are consistent with the increased
separation distance between the two vortices in the measurement plane, identified by the
hot-wire measurements.
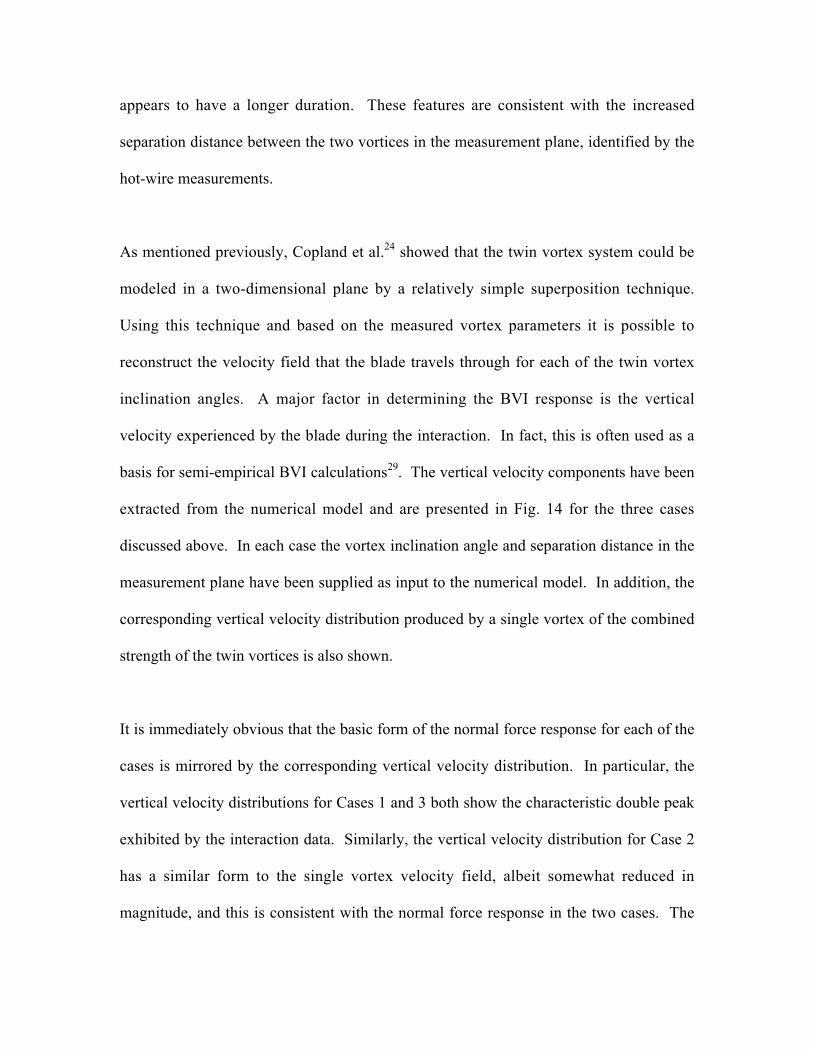
As mentioned previously, Copland et al.24 showed that the twin vortex system could be
modeled in a two-dimensional plane by a relatively simple superposition technique.
Using this technique and based on the measured vortex parameters it is possible to
reconstruct the velocity field that the blade travels through for each of the twin vortex
inclination angles. A major factor in determining the BVI response is the vertical
velocity experienced by the blade during the interaction. In fact, this is often used as a
basis for semi-empirical BVI calculations29. The vertical velocity components have been
extracted from the numerical model and are presented in Fig. 14 for the three cases
discussed above. In each case the vortex inclination angle and separation distance in the
measurement plane have been supplied as input to the numerical model. In addition, the
corresponding vertical velocity distribution produced by a single vortex of the combined
strength of the twin vortices is also shown.
It is immediately obvious that the basic form of the normal force response for each of the
cases is mirrored by the corresponding vertical velocity distribution. In particular, the
vertical velocity distributions for Cases 1 and 3 both show the characteristic double peak
exhibited by the interaction data. Similarly, the vertical velocity distribution for Case 2
has a similar form to the single vortex velocity field, albeit somewhat reduced in
magnitude, and this is consistent with the normal force response in the two cases. The
increased extent of the velocity field and the decrease in peak vertical velocity associated
with the increased spacing between the vortices in CASE 3 is also a notable feature of the
plot.
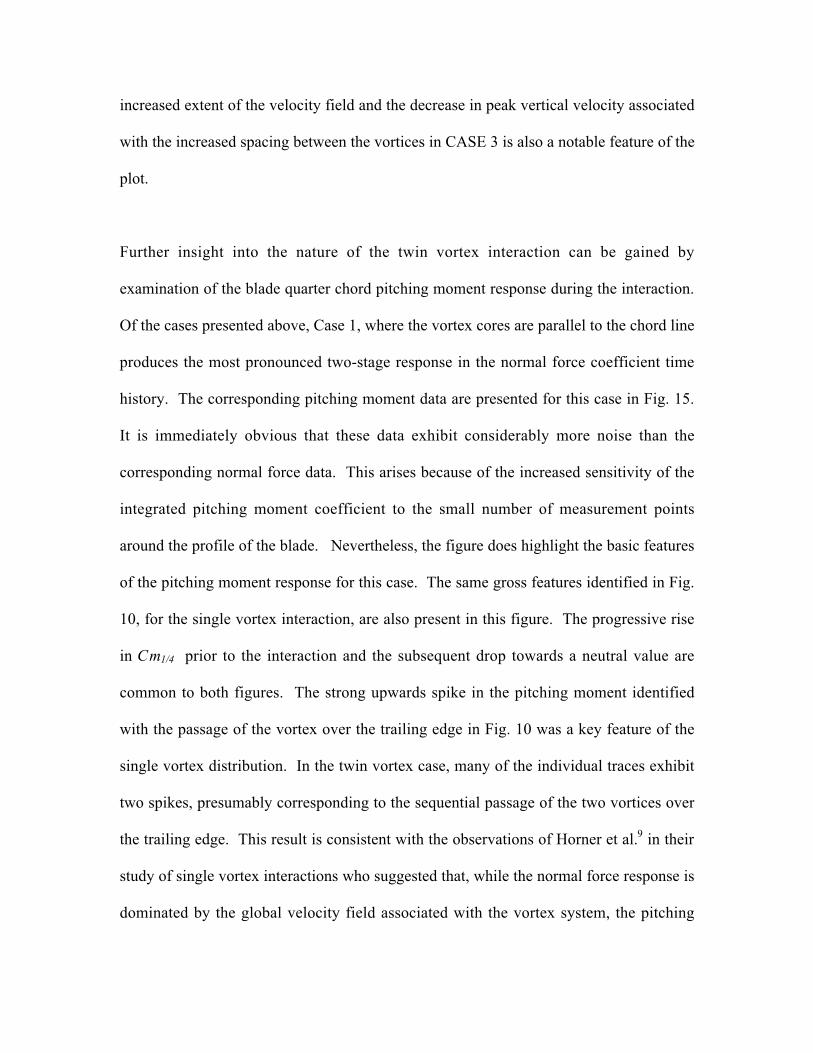
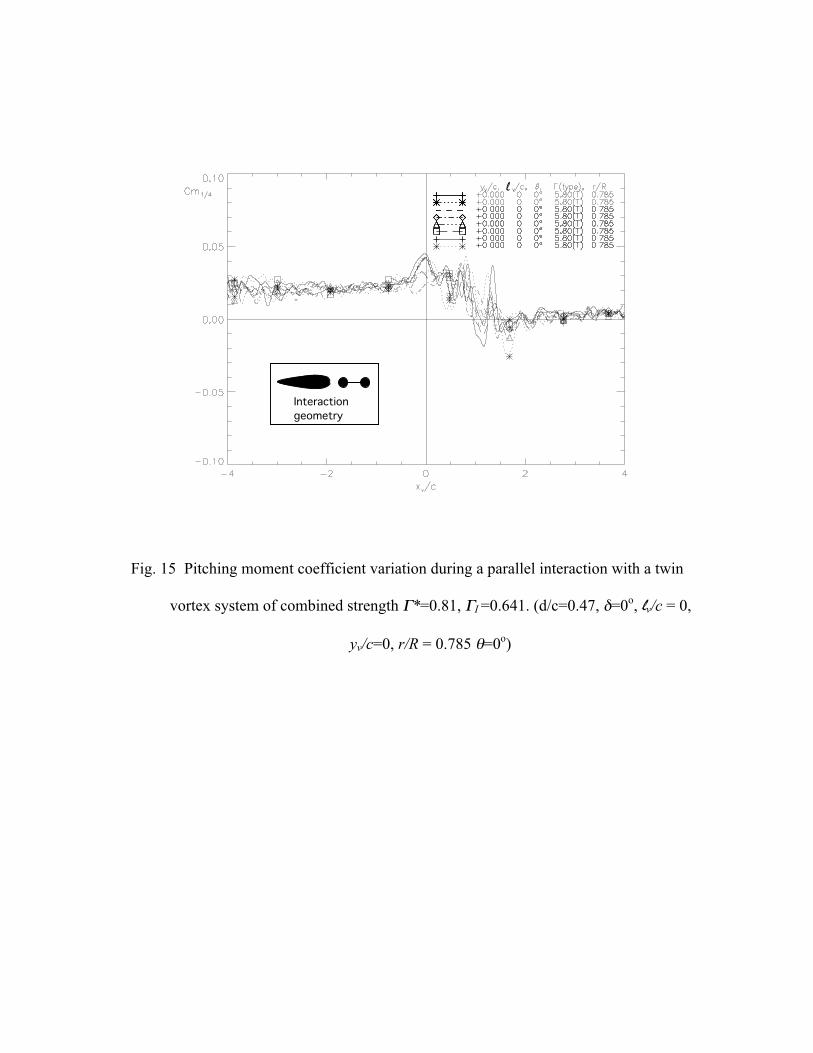
Further insight into the nature of the twin vortex interaction can be gained by
examination of the blade quarter chord pitching moment response during the interaction.
Of the cases presented above, Case 1, where the vortex cores are parallel to the chord line
produces the most pronounced two-stage response in the normal force coefficient time
history. The corresponding pitching moment data are presented for this case in Fig. 15.
It is immediately obvious that these data exhibit considerably more noise than the
corresponding normal force data. This arises because of the increased sensitivity of the
integrated pitching moment coefficient to the small number of measurement points
around the profile of the blade. Nevertheless, the figure does highlight the basic features
of the pitching moment response for this case. The same gross features identified in Fig.
10, for the single vortex interaction, are also present in this figure. The progressive rise
in Cm1/4 prior to the interaction and the subsequent drop towards a neutral value are
common to both figures. The strong upwards spike in the pitching moment identified
with the passage of the vortex over the trailing edge in Fig. 10 was a key feature of the
single vortex distribution. In the twin vortex case, many of the individual traces exhibit
two spikes, presumably corresponding to the sequential passage of the two vortices over
the trailing edge. This result is consistent with the observations of Horner et al.9 in their
study of single vortex interactions who suggested that, while the normal force response is
dominated by the global velocity field associated with the vortex system, the pitching
moment response is dominated by the local suction produced by the proximity of the
vortex core to the surface of the blade.
CONCLUDING REMARKS
Details are given of a Blade Vortex Interaction (BVI) test series performed in the
University of Glasgow 1.61m x 2.13m low speed, closed return, 'Handley Page' wind
tunnel, in which single and twin vortex interactions with a rigid, unloaded model rotor
blade were investigated.
A specially designed vortex generator allowed the rotational position of the twin vortex
pair to be varied so that a range of interaction geometries could be studied. Hot wire
anemometry was used to measure strength, size and orientation of the vortex pairs in the
interaction plane.
It was found that blade surface pressures, normal force and pitching moment responses
strongly depended on the orientation of the vortex pair in the interaction plane. When the
vortex cores lay almost parallel to the blade chord, the interaction was characterized by a
two-stage response associated with the sequential passage of the two cores. Conversely,
when the cores lay on a plane that was almost perpendicular to the blade chord, the
response was similar to that of a single vortex interaction.
It was shown that, for all cases, the normal force response was consistent with the
expected distribution of vertical velocity in the flow field. It was also demonstrated that
while the normal force response was dominated by the global velocity field, the pitching
moment response depended on the localized suction associated with the vortex cores.
It is important to note that the flow velocity and rotor rotational speeds used in the current
study correspond to a much higher advance ratio than is generally associated with BVI on
a helicopter rotor. This will inevitably result in differences between the fluid dynamic
response measured here and that which may be expected in flight. Previous experience
suggests, however, that these differences are likely to be relatively minor. In addition,
although the present results highlight the general features of the blade response to a twin
BVI, there are numerous sources of unsteadiness in the experiments that introduce
variability from cycle to cycle of the interacting blade. It is hoped to gain further insight
into the detail of the interaction process in the future by simultaneously capturing both
surface pressure and global flow field information during individual interactions.
ACKNOWLEDGEMENT
The authors wish to acknowledge the significant contributions of Mr. Allan Masson and
Dr. Christopher Copland to the experimental work described in this paper.
REFERENCES
1Padakannaya R. "Experimental Study of Rotor Unsteady Airloads due to Blade Vortex
Interaction", NASA CR - 1909, November, 1971.
2Ham, N.D., "Some Conclusions from an Investigation on Blade-Vortex Interaction",
Journal of the American Helicopter Society, Vol. 20, pp 26-31, October, 1975.
3Caradonna, F.X., Laub, G.H. and Tung, C. "An Experimental Study of Rotor-Vortex
Interaction", NASA TM-86005, November, 1984.
4Booth, E.R.Jr., and Yu, J.C., "Two-Dimensional Blade-Vortex Flow Visualisation
Investigation", AIAA Journal ,Vol. 24, No. 9, September, 1986.
5Caradonna, F.X., Lautenschlager, J.L. and Silva, M.J., "An Experimental Study of
Rotor-Vortex Interactions", AIAA Paper 88-0045, AIAA 26th Aerospace Sciences
Meeting, Reno, Nevada, January, 1988.
6Straus, J., Renzoni, O. and Mayle, R.E., "Airfoil Pressure Measurements During a
Blade-Vortex Interaction and a Comparison with Theory", AIAA Paper 88 0669, AIAA
26th Aerospace Sciences Meeting, Reno, Nevada, January, 1988.
7Horner, M.B., Saliveros. E., and Galbraith, R.A.McD. "An Examination of Vortex
Convection Effects During Blade-Vortex Interaction, The Aeronautical Journal, Vol. 96,
Number 960, December 1992.
8Horner, M.B., Saliveros, E., Kokkalis, A., and Galbraith, R.A.McD. "Results from a Set
of Low Speed Blade-Vortex Interaction Experiments", Journal of Experiments in Fluids,
14, pp. 341-352, May 1993.
9Horner, M.B., Stewart, J.N., Galbraith, R.A.McD., Grant, I., Coton, F.N., “An
examination of vortex deformation during blade-vortex interaction utilising particle
image velocimetry”, AIAA Journal, Vol. 34, No. 6, pp. 1188-1194, 1996
10Sears, W.R., "Aerodynamics, Noise and the Sonic Boom", AIAA Journal, Vol. 7, No. 4,
April, 1969.
11Panaras, A., "Numerical Modelling of the Vortex- Airfoil Interaction", AIAA Journal,
Vol. 2S, No. 1, January, 1987.
12Lee, D.J. and Smith, C.A., Distortion of Vortex Core during Blade/Vortex Interaction",
AIAA Paper 87- 1243, AIM 19th. Fluid Dynamics, Plasma Dynamics : Lasers
Conference Honolulu, Hawaii, June, 1987.
13Jones, H.E., and Caradonna, F.X., "Full Potential Modelling of Blade-Vortex
Interactions", Vertica, Vol. 12 No. 1/2, pp. 129-145, 1988.
14Wu, J.M., Vakilli, A., Chen, Z.L., “Investigation of the effects of discrete wingtip jets”,
21st AIAA Applied Sciences Conference, AIAA paper no. 83-0546, Reno, Jan 1983
15Gowanlock, D.K. and Matthewson, C.S., “Control of rotor tip vortices”, 37th AIAA
Applied Sciences Conference, AIAA paper No. 99-0012, Reno, Jan 1999
16Liu, Z., Sankar, L.N., Hassan, A.A., “Alteration of the tip vortex structure of a hovering
rotor by blowing”, 37th AIAA Applied Sciences Conference, AIAA paper No. 99-0906,
Reno, Jan 1999
17Coton, F.N., Green, R.B., Early, J.M., Wang, T., “An investigation of the effect of tip
vortex mass injection on blade-vortex interaction”, Proceedings of the 27th European
Rotorcraft Forum, Moscow, pp. 58.1-58.7, 2001
18Scott M.T., Sigl D., Strawn R.C., “Computational and Experimental Evaluation of
Helicopter Rotor Tips for High -Speed Flight”, J.Aircraft Vol. 28, pp. 403-409, June
1991.
19Lowson M.V., “Progress Towards Quieter Civil Helicopters”, The Aeronautical
Journal , Vol. 96, No. 956, pp 209-223, June/July 1992.
20Hoad, D.R., “Helicopter Model Scale Results of Blade Vortex Interaction Impulsive
Noise as Affected by Tip Modification”, 36th American Helicopter Society Forum, May
1980
21Tangler, J.L., ‘Experimental investigation of the subwing tip and its vortex structure’,
NASA CR-3058, 1978
22Brocklehurst A., Pike A.C., “Reduction of B.V.I. Noise Using a Vane Tip”, A.H.S.
Aeromechanics Specialists Conf., San Francisco, Jan. 1994.
23Tyler D.J., Vincent A.H., “Future Rotorcraft Technology Developments”, The
Aeronautical Journal, Vol. 100, No. 1000, pp 451-460, Dec.1996.
24Copland, C.M. , Coton, F.N., Galbraith, R.A.McD., “An experimental study on the
idealised vortex system of a novel rotor blade tip”, The Aeronautical Journal, Vol. 102,
No. 1017, pp.385-392, 1998
25Rossow V.J., “Convective Merging of Vortex Cores in Lift-Generated Wakes”, J.
Aircraft, Vol. 14, 283-290, 1977.
26Masson, C.A., Green, R.B., Galbraith, R.A.McD., Coton, F.N., “Experimental
investigation of a loaded rotor blade’s interaction with a single vortex”, The Aeronautical
Journal, Vol. 102, No. 1018, pp.451-458, 1998
27Copland, C.M., “The Generation of Transverse and Longitudinal Vortices in Low
Speed Wind Tunnels”, Ph.D. Thesis, The University of Glasgow, 1997
28Caradonna, F. X, Henley, E., Silva, M., Huang, S., Komerath, N. M., Reddy, U. C.,
Mahalingam, R., Funk, R. B., Wong, O., Ames, R., Darden, L.A., Villareal, L.,
Gregory,J., “ An Experimental Study of a Rotor in Axial Flight”, AHS Technical
Specialists Meeting for Rotorcraft Aeroacoustics and Aerodynamics, October 1997,
Williamsburg,VA.
29Beddoes, T.S., “Two and Three Dimensional Indicial Methods for Rotor Dynamic
Airloads”, AHS National Specialist’s Meeting on Rotorcraft Dynamics, Arlington, Texas,
Nov. 1989
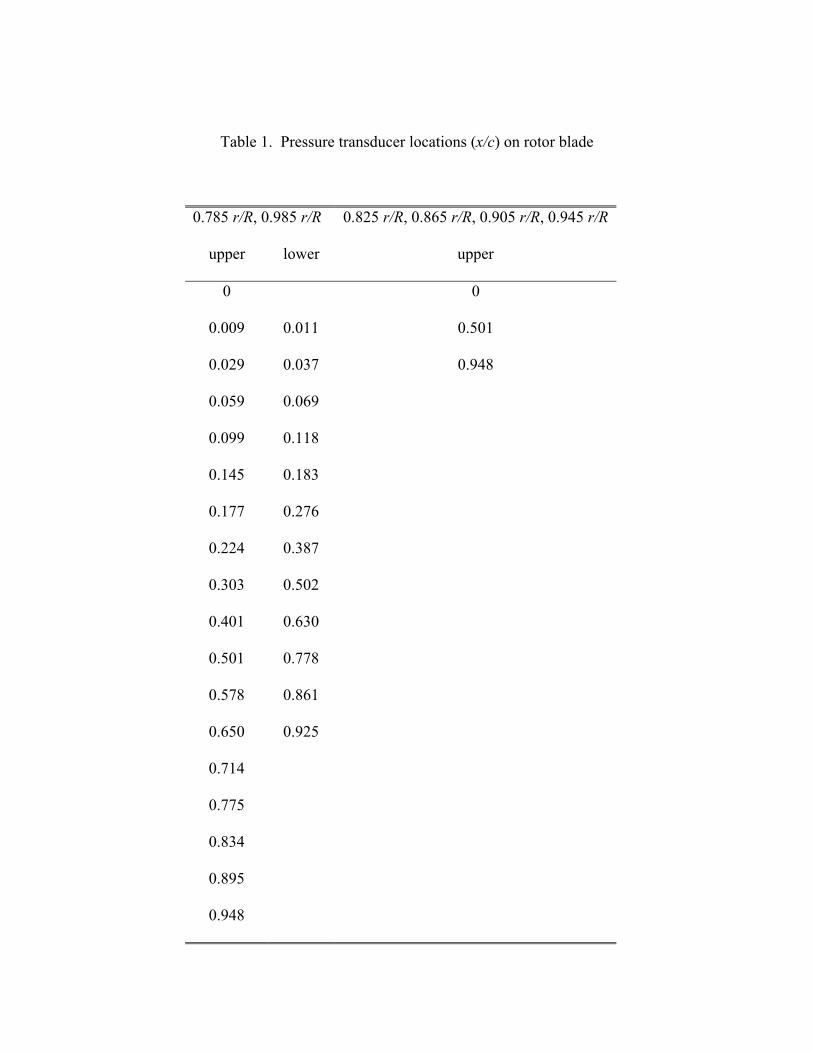
Table 1. Pressure transducer locations (x/c) on rotor blade
0.785 r/R, 0.985 r/R 0.825 r/R, 0.865 r/R, 0.905 r/R, 0.945 r/R
upper lower upper
0 0
0.009 0.011 0.501
0.029 0.037 0.948
0.059 0.069
0.099 0.118
0.145 0.183
0.177 0.276
0.224 0.387
0.303 0.502
0.401 0.630
0.501 0.778
0.578 0.861
0.650 0.925
0.714
0.775
0.834
0.895
0.948
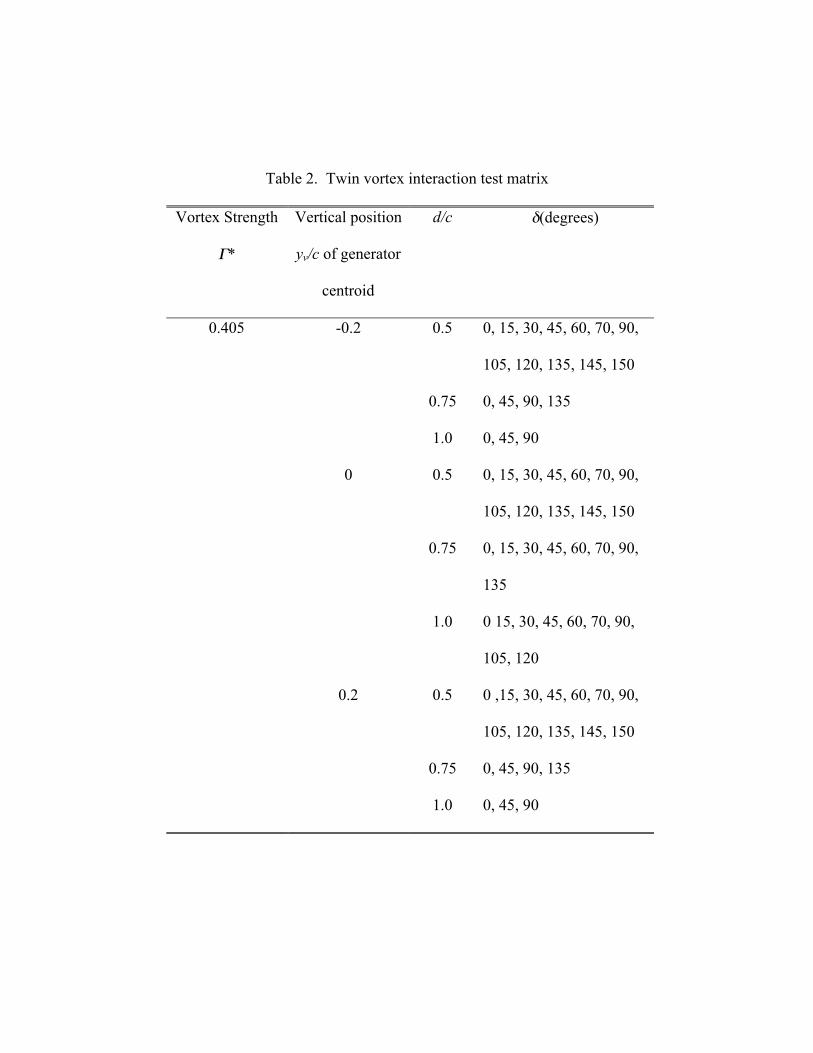
Table 2. Twin vortex interaction test matrix
Vortex Strength
Γ*
Vertical position
yv/c of generator
centroid
d/c δ(degrees)
0.5 0, 15, 30, 45, 60, 70, 90,
105, 120, 135, 145, 150
0.75 0, 45, 90, 135
-0.2
1.0 0, 45, 90
0.5 0, 15, 30, 45, 60, 70, 90,
105, 120, 135, 145, 150
0.75 0, 15, 30, 45, 60, 70, 90,
135
0
1.0 0 15, 30, 45, 60, 70, 90,
105, 120
0.5 0 ,15, 30, 45, 60, 70, 90,
105, 120, 135, 145, 150
0.75 0, 45, 90, 135
0.405
0.2
1.0 0, 45, 90
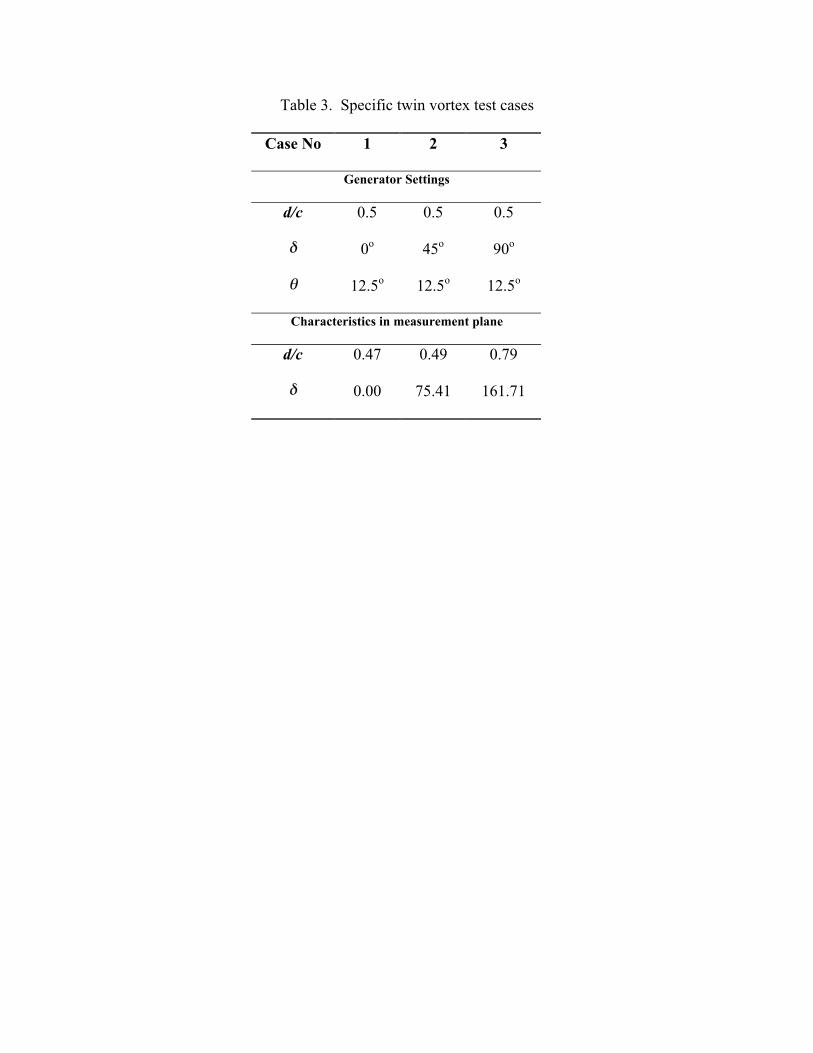
Table 3. Specific twin vortex test cases
Case No 1 2 3
Generator Settings
d/c 0.5 0.5 0.5
δ 0o 45o 90o
θ 12.5o 12.5o 12.5o
Characteristics in measurement plane
d/c 0.47 0.49 0.79
δ 0.00 75.41 161.71
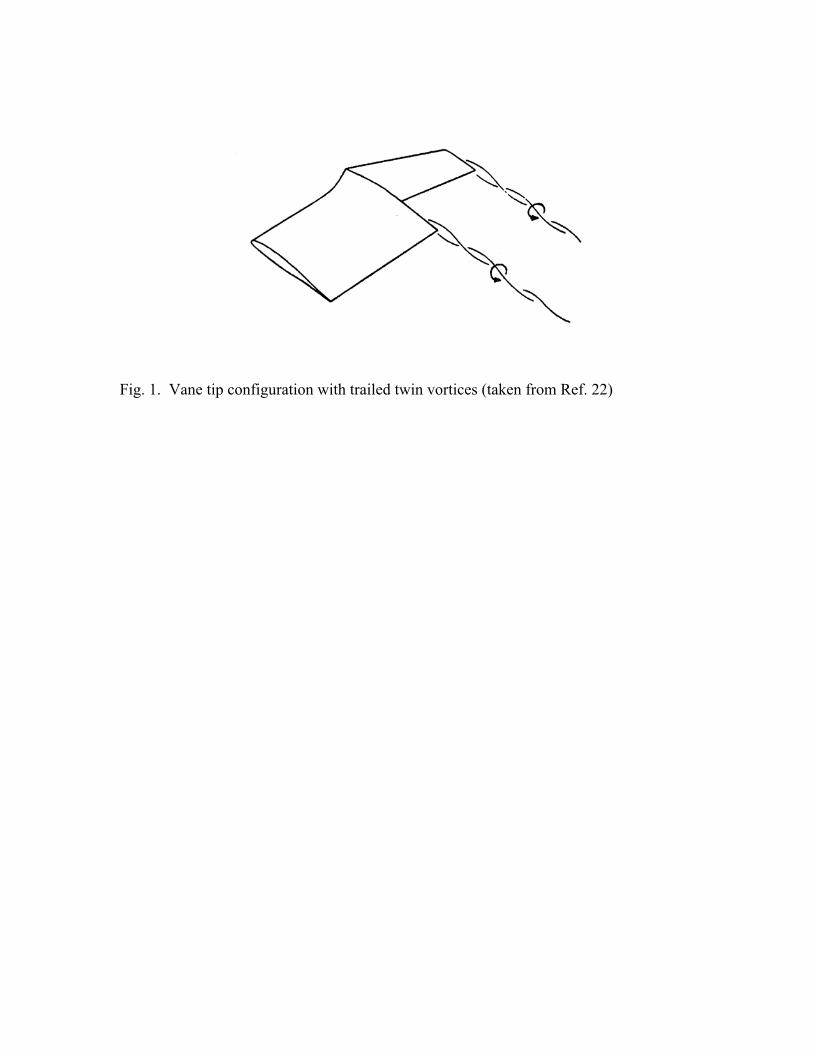
Fig. 1. Vane tip configuration with trailed twin vortices (taken from Ref. 22)
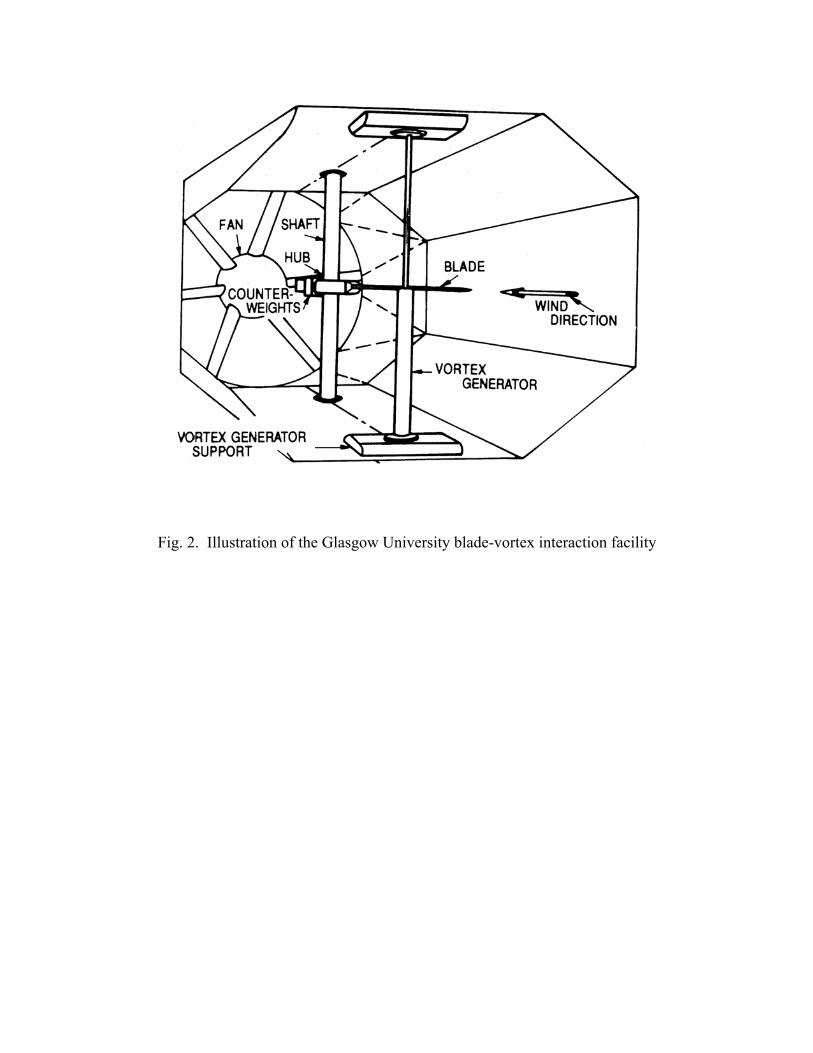
Fig. 2. Illustration of the Glasgow University blade-vortex interaction facility
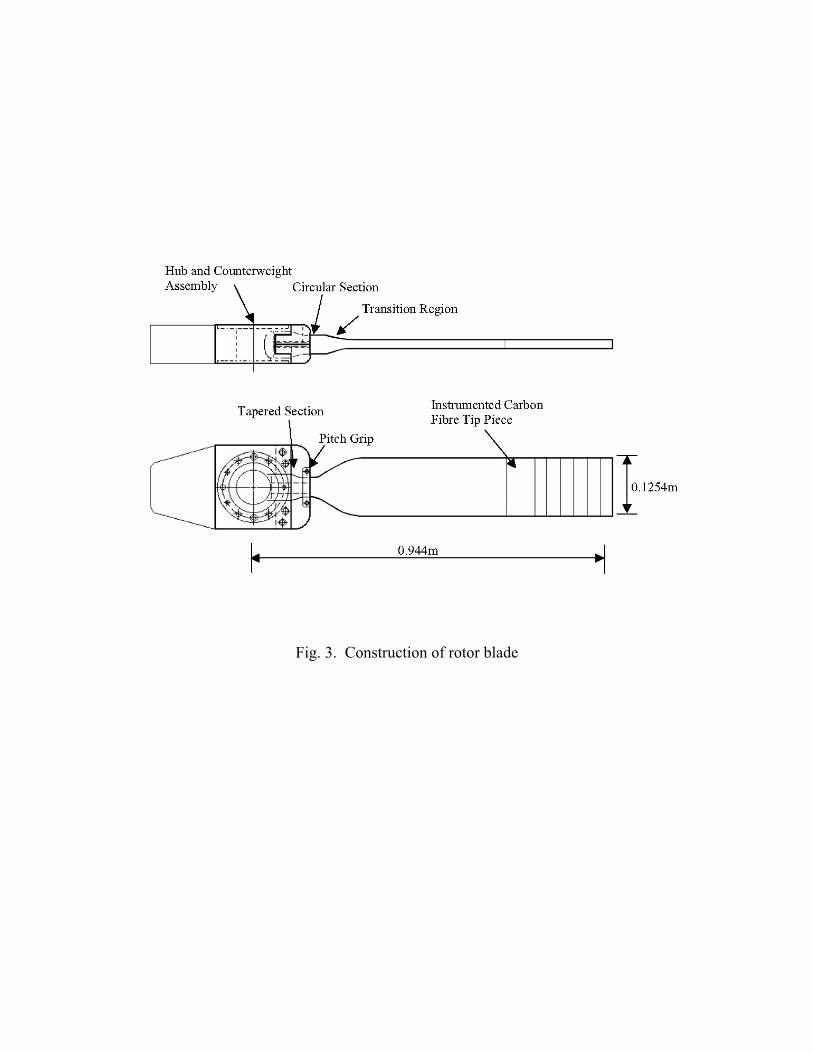
Fig. 3. Construction of rotor blade
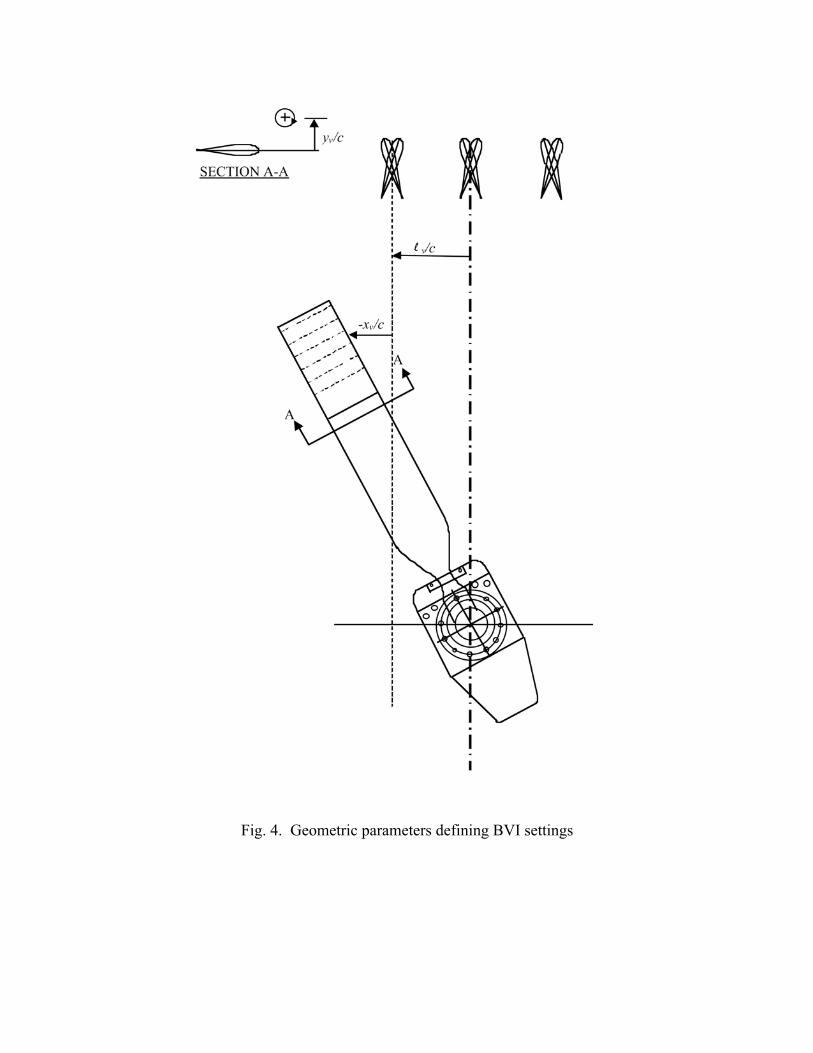
Fig. 4. Geometric parameters defining BVI settings
Top Wing
BottomWing
Placement Circle(diameter, d)
Fig. 5. Twin vortex generator geometry
δ
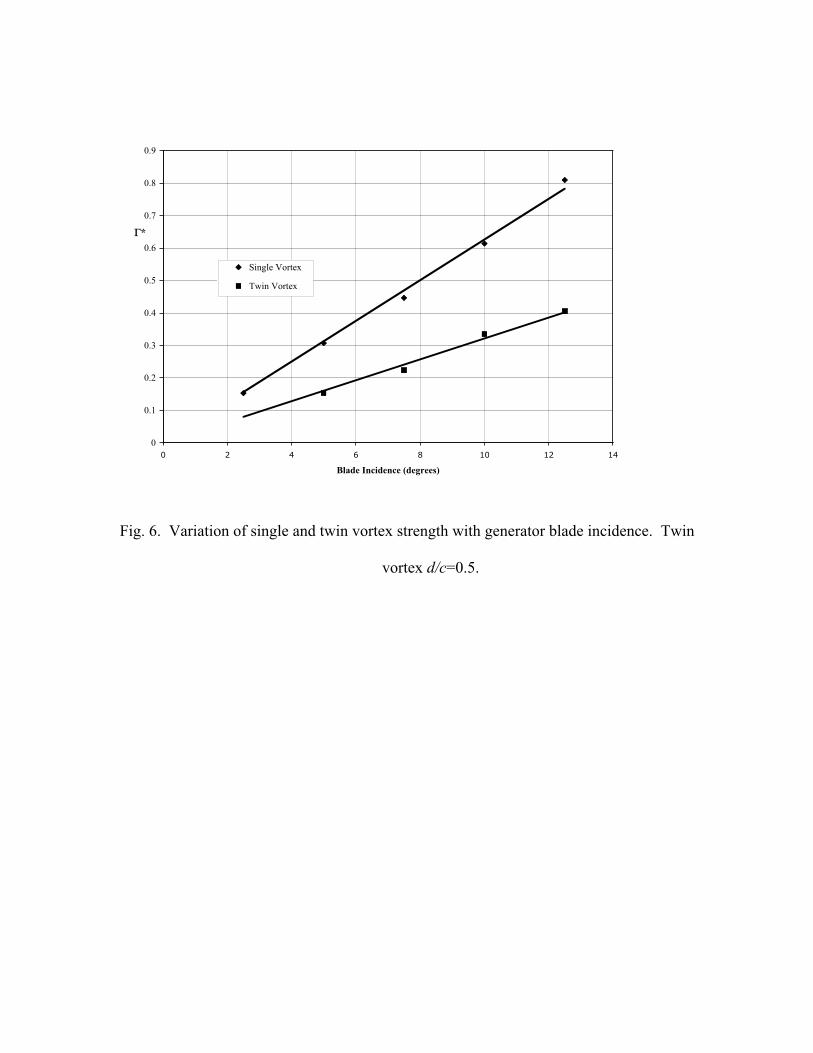
Fig. 6. Variation of single and twin vortex strength with generator blade incidence. Twin
vortex d/c=0.5.
0
0.1
0.2
0.3
0.4
0.5
0.6
0.7
0.8
0.9
0 2 4 6 8 10 12 14
Blade Incidence (degrees)
Γ*
Single Vortex
Twin Vortex
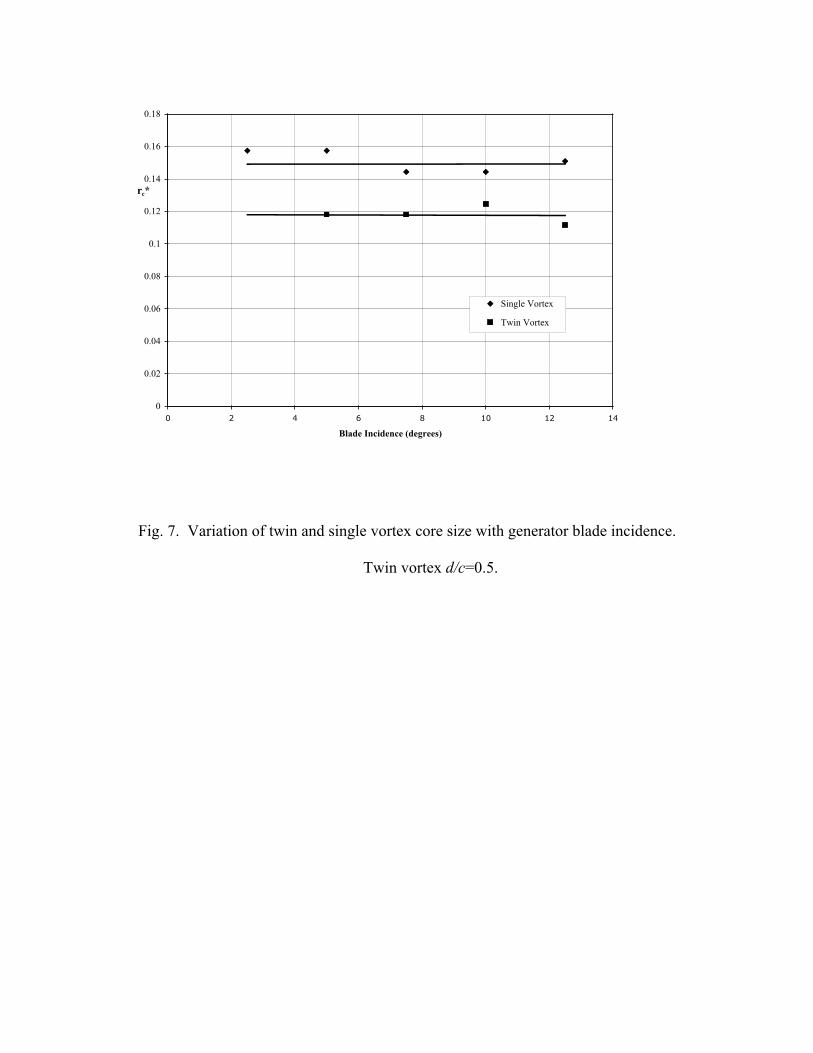
Fig. 7. Variation of twin and single vortex core size with generator blade incidence.
Twin vortex d/c=0.5.
0
0.02
0.04
0.06
0.08
0.1
0.12
0.14
0.16
0.18
0 2 4 6 8 10 12 14
Blade Incidence (degrees)
rc*
Single Vortex
Twin Vortex
-2-1
01
2
xv/c
-Cp
Fig. 8. Upper surface pressure variation for a parallel interaction with a single vortex
(Γ*=0.81, ΓI =0.641, lv/c = 0, yv/c=0, r/R = 0.785 θ=0o)
-2.0 -1.0 1.0 2.0
Fig. 9. Normal force coefficient variation during a parallel interaction with a single
vortex (Γ*=0.81, ΓI =0.641, lv/c = 0, yv/c=0, r/R = 0.785 θ=0o)
-2.0 -1.0 1.0 2.0
Fig. 10. Pitching moment coefficient variation during a parallel interaction with a single
vortex (Γ*=0.81, ΓI =0.641, lv/c = 0, yv/c=0, r/R = 0.785 θ=0o)
-Cp
Fig. 11a. Upper surface pressure variation for a parallel interaction with a twin vortex
system of combined strength Γ*=0.81, ΓI =0.641. Cycle 1 of 16 (d/c=0.47, δ=0o,
lv/c = 0, yv/c=0, r/R = 0.785 θ=0o)
-Cp
Fig. 11b. Upper surface pressure variation for a parallel interaction with a twin vortex
system of combined strength Γ*=0.81, ΓI =0.641. Cycle 10 of 16 (d/c=0.47, δ=0o,
lv/c = 0, yv/c=0, r/R = 0.785 θ=0o)
-Cp
Fig. 11c. Upper surface pressure variation for a parallel interaction with a twin vortex
system of combined strength Γ*=0.81, ΓI =0.641. Cycle 13 of 16 (d/c=0.47, δ=0o,
lv/c = 0, yv/c=0, r/R = 0.785 θ=0o)
-2-1
01
2
xv/c
-Cp
Fig. 12a. Lower surface pressure variation for a parallel interaction with a twin vortex
system of combined strength Γ*=0.81, ΓI =0.641. Cycle 1 of 16 (d/c=0.47, δ=0o,
lv/c = 0, yv/c=0, r/R = 0.785 θ=0o)
-2-1
01
2
xv/c
-Cp
Fig. 12b. Lower surface pressure variation for a parallel interaction with a twin vortex
system of combined strength Γ*=0.81, ΓI =0.641. Cycle 10 of 16 (d/c=0.47, δ=0o,
lv/c = 0, yv/c=0, r/R = 0.785 θ=0o)
-2-1
01
2
xv/c
-Cp
Fig. 12c. Lower surface pressure variation for a parallel interaction with a twin vortex
system of combined strength Γ*=0.81, ΓI =0.641. Cycle 13 of 16 (
d/c=0.47, δ=0o, lv/c=0, yv/c=0, r/R = 0.785 θ=0o)
Interactiongeometry
l
Fig. 13a Normal force coefficient variation during a parallel interaction with a twin
vortex system of combined strength Γ*=0.81, ΓI =0.641. (d/c=0.47, δ=0o, lv/c = 0,
yv/c=0, r/R = 0.785 θ=0o)

Interactiongeometry
l
Fig. 13b Normal force coefficient variation during a parallel interaction with a twin
vortex system of combined strength Γ*=0.81, ΓI =0.641. (d/c=0.49, δ=75.41o, lv/c
= 0, yv/c=0, r/R = 0.785 θ=0o)
Interactiongeometry
l
Fig. 13c Normal force coefficient variation during a parallel interaction with a twin
vortex system of combined strength Γ*=0.81, ΓI =0.641. (d/c=0.79, δ=161.71o,
lv/c = 0, yv/c=0, r/R = 0.785 θ=0o)
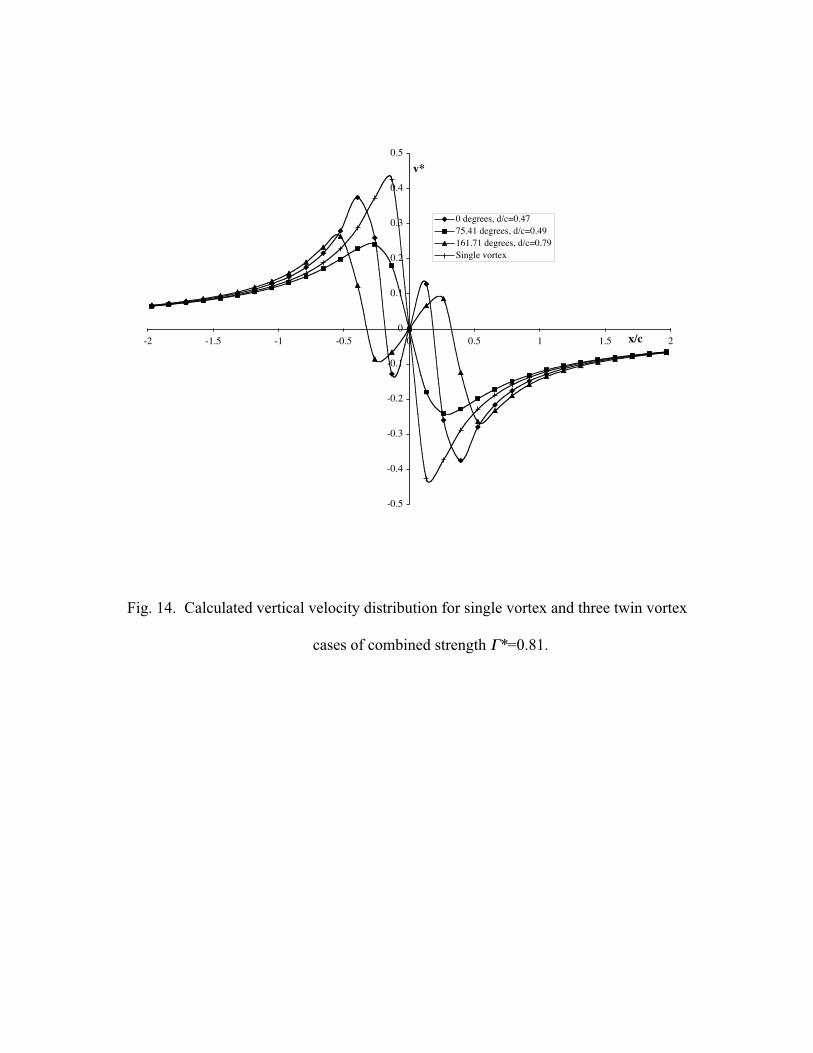
Fig. 14. Calculated vertical velocity distribution for single vortex and three twin vortex
cases of combined strength Γ*=0.81.
v*
-0.5
-0.4
-0.3
-0.2
-0.1
0
0.1
0.2
0.3
0.4
0.5
-2 -1.5 -1 -0.5 0 0.5 1 1.5 2x/c
0 degrees, d/c=0.4775.41 degrees, d/c=0.49161.71 degrees, d/c=0.79Single vortex
Interactiongeometry
l
Fig. 15 Pitching moment coefficient variation during a parallel interaction with a twin
vortex system of combined strength Γ*=0.81, ΓI =0.641. (d/c=0.47, δ=0o, lv/c = 0,
yv/c=0, r/R = 0.785 θ=0o)