costs and limits of phenotypic plasticity in island populations of the common frog rana temporaria...
TRANSCRIPT
ORIGINAL ARTICLE
doi:10.1111/j.1558-5646.2009.00647.x
COSTS AND LIMITS OF PHENOTYPICPLASTICITY IN ISLAND POPULATIONS OF THECOMMON FROG RANA TEMPORARIA UNDERDIVERGENT SELECTION PRESSURESMartin I. Lind1,2 and Frank Johansson1
1Department of Ecology and Environmental Science, Umea University, 901 87 Umea, Sweden2E-mail: [email protected]
Received August 19, 2008
Accepted January 14, 2009
Costs and limits are assumed to be the major constraints on the evolution of phenotypic plasticity. However, despite their expected
importance, they have been surprisingly hard to find in natural populations. It has therefore been argued that natural selection
might have removed high-cost genotypes in all populations. However, if costs of plasticity are linked to the degree of plasticity
expressed, then high costs of plasticity would only be present in populations where increased plasticity is under selection. We
tested this hypothesis by investigating costs and limits of adaptive phenotypic plasticity in development time in a common garden
study of island populations of the common frog Rana temporaria, which have varying levels of development time and phenotypic
plasticity. Costs of plasticity were only found in populations with high-plastic genotypes, whereas the populations with the most
canalized genotypes instead had a cost of canalization. Moreover, individuals displaying the most extreme phenotypes also were
the most plastic ones, which mean we found no limits of plasticity. This suggests that costs of plasticity increase with increased
level of plasticity in the populations, and therefore costs of plasticity might be more commonly found in high-plastic populations.
KEY WORDS: Costs of plasticity, development time, limits of plasticity, pool permanence, size at metamorphosis.
Adaptive phenotypic plasticity is the ability of a genotype to
express different adaptive phenotypes in different environments
(Pigliucci 2005). Theory shows that in the absence of constraints,
adaptive phenotypic plasticity is generally favored over special-
ization in heterogeneous environments (e.g., Via and Lande 1985;
Moran 1992; Van Tienderen 1997; Sultan and Spencer 2002). This
has been supported in studies of species (Richter-Boix et al. 2006;
Hollander 2008) and natural populations (Lind and Johansson
2007). However, phenotypic plasticity is not always present (De-
lasalle and Blum 1994; Pigliucci 1997), and often the degree of
plasticity varies between populations (Donohue et al. 2000; Van
Buskirk and Arioli 2005; Lind and Johansson 2007). Although
the benefits of plasticity are clear, it is less clear what constrains
plasticity (DeWitt 1998), although it is generally believed that
the two most important factors that can constrain the evolution of
phenotypic plasticity are fitness costs of the ability to be plastic
and limits to the phenotypes that a plastic genotype can express
(DeWitt et al. 1998).
Costs of plasticity imply that a plastic genotype has a fitness
cost compared to a nonplastic genotype when expressing the same
trait value (Pigliucci 2005). De Witt et al. (1998) have suggested
a number of possible costs paid by plastic individuals but not by
specialists, such as costs of maintaining the sensory and response
pathways necessary for an accurate plastic response and extra
costs of producing the trait not paid by the specialist. The fitness
cost could either be constant, that is, independent of the level of
plasticity of the genotype (e.g., Moran 1992; Sultan and Spencer
2002), or increase with the degree of plasticity (Van Tienderen
1 5 0 8C© 2009 The Author(s). Journal compilation C© 2009 The Society for the Study of Evolution.Evolution 63-6: 1508–1518
COSTS AND LIMITS OF PHENOTYPIC PLASTICITY
1997). Obviously, without some costs of plasticity, plasticity has
only advantages and becomes the common outcome in theoretical
models in which specialization is the alternative (Van Tienderen
1997). However, despite the assumed importance of plasticity
costs, they have been surprisingly hard to find in natural popu-
lations (see a recent meta-analysis by Van Buskirk and Steiner
2009) and have only been detected in a fraction of measured
traits in these experiments (DeWitt 1998; Scheiner and Berrigan
1998; Donohue et al. 2000; Dorn et al. 2000; Poulton and Winn
2002; Relyea 2002; Steinger et al. 2003; Callahan et al. 2005;
Weijschede et al. 2006; Weinig et al. 2006; Avramov et al. 2007;
Steiner and Van Buskirk 2008), or only in a few measured en-
vironments and populations (Donohue et al. 2000; Merila et al.
2004; Callahan et al. 2005). Many studies have also found sig-
nificant positive relationships between plasticity and fitness (e.g.,
Dorn et al. 2000; Relyea 2002; Weijschede et al. 2006; Weinig
et al. 2006; Avramov et al. 2007; Steiner and Van Buskirk 2008),
which have been interpreted either as costs of homeostasis (Dorn
et al. 2000), or costs of canalization (Poulton and Winn 2002;
Steiner and Van Buskirk 2008). Interestingly, the meta-analysis
by Van Buskirk and Steiner (2009) found that costs of plasticity
and canalization were about equally uncommon (costs of plas-
ticity were only found in 14% of all published species, trait, and
treatment combinations, costs of canalization in 11% of the pub-
lished species, trait, and treatment combinations). Unfortunately,
the importance of costs of canalization on the evolution of phe-
notypic plasticity has never been theoretically investigated.
Limits of plasticity mean that the plastic genotype can only
produce phenotypes within a certain range. More extreme phe-
notypes cannot be achieved by plastic genotypes: they are only
produced by specialized genotypes (Pigliucci 2005). Theory sug-
gests that “the jack of all trades is the master of none” (Levins
1968), implying that although phenotypic plasticity allows indi-
viduals to deal with different environmental conditions, they are
inferior to a nonplastic specialist in any particular environment
(Newman 1992; DeWitt et al. 1998; van Kleunen and Fischer
2005). Thus, the theory assumes that if there is no stabilizing
selection within each environment; the optimum phenotype will
be within the range of the phenotypes that the plastic genotype
can express, and the extreme phenotype is no longer the optimal
phenotype. Limits to plasticity have received much less scrutiny
than costs of plasticity: limits of plasticity have been investigated
in a few studies only, and surprisingly neither DeWitt (1998) nor
Relyea (2002) found evidence of limits. Instead, they found that
the most plastic genotypes were also able to express the most
extreme traits.
DeWitt (1998), Sultan and Spencer (2002), Callahan et al.
(2005), and Weinig et al. (2006) have suggested that the failure of
most studies to find costs of plasticity may be due to the action of
natural selection, which might already have removed plastic geno-
types with high costs. However, we argue that our inability to find
strong evidence for costs and limits of plasticity might instead be
due to the fact that these factors can differ among populations and
environments. The current studies of costs and limits of plasticity
have seldom included more than one population (but see Donohue
et al. 2000; Merila et al. 2004). Because selection pressures can
differ over the landscape (Thompson 2005), populations can dif-
fer in both trait means (Reznick et al. 1997; Johansson et al. 2005)
and plasticity (Donohue et al. 2000; Merila et al. 2004; Lind and
Johansson 2007). Thus, within a species, different populations
can be subjected to opposing selection pressures, potentially in-
fluencing how the costs and limits of plasticity are expressed. If
costs of plasticity are genetically linked to the degree of plasticity
expressed, as assumed in the models of van Tienderen (1997),
then high costs of plasticity would only be present in popula-
tions where increased plasticity is under selection. However, if
all plastic genotypes pay the same costs, costs of plasticity would
not differ between populations, as plastic genotypes pay the same
costs of being plastic whether or not plasticity is expressed (De
Witt et al. 1998). As for costs, limits of plasticity might also be
population specific. It has been argued that limits of plasticity will
not be detected if selection periodically alternates for and against
specialized genotypes (Relyea 2002). Therefore, limits of plas-
ticity should be most easily detected in populations specialized
to an extreme environment, where the selection pressures may be
expected to constantly favor extreme phenotypes.
Therefore, studies in which these factors are compared
among populations that are expected to differ with regard to costs
and limits of plasticity are needed. Temporary pools are excellent
systems for the study of phenotypic plasticity (Newman 1992; De
Block and Stoks 2005), and among organisms inhabiting these
environments, amphibian metamorphosis is well studied (e.g.,
Wilbur 1987; Newman 1992; Denver et al. 1998; Brady and Grif-
fiths 2000; Loman and Claesson 2003; Merila et al. 2004). Time
to, and size at, metamorphosis are important fitness components in
amphibians; a large metamorphic size has substantial fitness ben-
efits after metamorphosis (Smith 1987; Berven 1990; Morey and
Reznick 2001; Altwegg and Reyer 2003), but is traded off against
short development time in response to pool desiccation (Laurila
and Kujasalo 1999). Therefore, we use metamorphic weight as our
estimate of fitness. In this study, we investigate costs and limits of
adaptive phenotypic plasticity in development time in isolated is-
land populations of the common frog (Rana temporaria Linnaeus
1758) in an archipelago in the Gulf of Bothnia, northern Swe-
den. Because of the land uplift, the islands in the archipelago are
relatively young, and the estimated ages of the frog populations
in the area are between 23 and 267 generations (Johansson et al.
2005). The frogs breed in pools on the islands and these pools
differs in drying regime. The rate of pool drying does not appear
to be correlated with any other environmental variable associated
EVOLUTION JUNE 2009 1 5 0 9
M. I . LIND AND F. JOHANSSON
with islands (Lind and Johansson 2007). The populations show
local adaptation in fixed development time as a response to the
risk of pool desiccation so that tadpoles from islands with only
temporary pools have a genetically shorter development time than
those from islands with only permanent pools (Johansson et al.
2005; Lind and Johansson 2007; Lind et al. 2008). Moreover, the
populations differ in their plasticity in development time, and the
degree of plasticity is correlated with the within-island hetero-
geneity in pool-drying regimes (Lind and Johansson 2007). Thus,
plasticity is adaptive and we can compare the costs and limits of
plasticity in relatively young replicated natural populations with
high or low levels of phenotypic plasticity in development time,
and in populations locally adapted to the extreme environments
(permanent or temporary pools). These factors are likely to influ-
ence the costs and limits of plasticity (Relyea 2002; Weinig et al.
2006).
We performed a common garden experiment with constant
water level and artificial drying as treatments to estimate the costs
and limits of phenotypic plasticity in development time. If nat-
ural selection quickly removes costly genotypes, and costs of
plasticity are paid by all individuals expressing plasticity, then
we predict no difference in costs between environments. How-
ever, if costs of plasticity are positively correlated to the de-
gree of plasticity expressed, we expect to find more costs of
plasticity in high-plasticity populations. We also predict stronger
limits of plasticity on islands with more homogeneous environ-
ments (i.e., islands with either temporary or permanent drying
regimes) because natural selection has favored specialists in these
environments.
MethodologyIn a common garden experiment, we compared the costs and
limits of phenotypic plasticity in populations with high or low
natural levels of phenotypic plasticity, and populations originat-
ing from islands with temporary or permanent pools. To sam-
ple populations from a range of pool-drying regimes (from is-
land with temporary to permanent pools), eggs were collected
from nine islands in an archipelago outside Umea, northern Swe-
den (Ahallan 63◦40′N, 20◦23′E; Algrundet 63◦41′N, 20◦25′E;
Bredskar 63◦39′N, 20◦18′E; Lillklyvan 63◦42′N, 20◦26′E; Oster
Hallskar 63◦48′N, 20◦37′E; Savar-Tarnogern 63◦45′N, 20◦36′E;
Stora Fjaderagg 63◦48′N, 21◦0′E; Storhaddingen 63◦40′N,
20◦25′E; Vitskar 63◦40′N, 20◦22′E) between 9 and 13 May 2006
(for a map, see Lind and Johansson 2007). To assess the pool-
drying regime present on an island, the decrease in water level
of the pools was estimated as follows. Maximum pool depth was
measured at egg collection and at 16 and 17 August 2006. The
percentage decrease in pool depth between the two sampling
dates was then used as a proxy for the hydroperiod, following
Lind and Johansson (2007). For two deep permanent pools (Stora
Fjaderagg, Oster Hallskar), pool depth was not measured.
To estimate development time and plasticity, eggs were taken
from the breeding poles on the island and transported to the lab-
oratory. From 12 different egg clutches from each island, 40–50
eggs were sampled. If multiple pools were present on an island,
eggs were taken from all pools in which breeding had occurred
and the mean pool-drying regime of the breeding pools was cal-
culated, to get a value for the average pool-drying regime of the
island. Each egg clutch corresponds to the offspring of one fe-
male because female R. temporaria lay only one egg clutch per
year in this region (Elmberg 1991). The eggs were kept at 4◦C
in the laboratory to slow down development, until all eggs were
collected. This water temperature is at the mean temperature for
spawning onset of R. temporaria in this region (Elmberg 1990).
When all eggs were collected, the temperature of the laboratory
was set to 22◦C for the remainder of the experiment.
To separate the genetic and the environmental effects on de-
velopment time and plasticity, both were estimated in a common
garden, where replicate siblings from each egg clutch were sub-
jected to one of two treatments. Development time was estimated
in two laboratory treatments: constant water level (C) and arti-
ficial pool drying (D), and plasticity in development time was
defined as the reduction in development time in the artificial dry-
ing treatment, see Lind and Johansson (2007). Six tadpoles from
each female, three allocated to each water level treatment, were
randomly chosen and placed individually into plastic containers
(9.5 × 9.5 cm, height 10 cm). The experimental containers were
filled with 750 mL of tap water, previously aged and aerated to-
gether with dried deciduous leaves, which were removed when
the water was transferred to the experimental containers. This en-
sured sufficient oxygen levels for the tadpoles. In the simulated
pool-drying treatment, the initial water volume of 750 mL was
reduced by 33% every fourth day, starting at day 5 and continuing
until day 25, after which the water volume was kept constant at
66 mL. The water temperature did not differ between the two
treatments. The tadpoles were fed ad libitum every fourth day on
a mixture (1:1) of finely ground fish food and rabbit chow. The
tadpoles were given 15 mg food per tadpole at the beginning of
the experiment, and it was increased to 30 mg at day 9, 45 mg
at day 13, 60 mg at day 17, and 75 mg from day 21 to the end
of the experiment, following Lind and Johansson (2007). Water
was replaced every fourth day, prior to feeding. A light:dark cycle
of 18:6 h was employed, which corresponds to the natural cy-
cle in the area of egg collection. Experiments were started when
the tadpoles entered Gosner stage 23 (active swimming) (Gosner
1960).
Maternal effects can always influence the phenotypic ex-
pression and needs to be controlled for. As maternal effects in
R. temporaria most commonly are transferred through the size of
1 5 1 0 EVOLUTION JUNE 2009
COSTS AND LIMITS OF PHENOTYPIC PLASTICITY
the egg (Laugen et al. 2002), we estimated the egg size of every
clutch. Prior to hatching, at Gosner stage 10 (Gosner 1960), 10
eggs from each clutch were placed in a petri dish, completely
covered with water, and photographed together with a scale us-
ing a vertically placed digital camera (Canon EOS 350D [Tokyo,
Japan] with Tamron SP AF 90 mm F/2.8 Di Macro 1:1 lens [Tam-
ron, Saitama, Japan]). The mean egg size of each female was
then calculated using the image analysis program ImageJ version
1.36b (http://rsb.info.nih.gov/ij/), which later allowed us to con-
trol for egg-size-mediated maternal effects (Laugen et al. 2002)
on development time and plasticity.
The experiment was terminated when the tadpoles entered
Gosner stage 42 (Gosner 1960). At this stage, the forelimbs are
visible and we define this as our estimate of metamorphosis. We
used metamorphic weight as our fitness estimate because large
size at metamorphosis is generally positively correlated with var-
ious aspects of fitness in amphibians (Smith 1987; Berven 1990;
Morey and Reznick 2001; Altwegg and Reyer 2003). Therefore,
the tadpoles were weighed (wet weight) and the time from the
start of the experiment (at Gosner stage 23) until metamorphosis
was recorded as development time. Plasticity in development time
was defined as the mean development time for each family under
constant water level conditions minus the mean development time
under the artificial drying treatment, that is, how much the tad-
poles were able to speed up the development time as a response
too the artificial pool-drying treatment. Population level plastic-
ity was defined as the mean plasticity in development time of
the families in the populations and was used to distinguish high-
and low-plasticity populations for analyzing costs and limits of
plasticity.
STATISTICAL ANALYSES
Costs of developmental plasticity imply that the plastic geno-
types have fitness costs compared to nonplastic genotypes when
expressing the same trait value (DeWitt et al. 1998), and were es-
timated using the following model (Van Tienderen 1991; Scheiner
and Berrigan 1998):
W = X + X2 + plX + X × plX + X2 × plX, (1)
where W is the estimate of fitness (metamorphic weight in our
case) in one environment, X is the age at metamorphosis (de-
velopment time) in that environment and plX is the plasticity
in age at metamorphosis, as measured between the two envi-
ronments. X and X2 estimate the linear and nonlinear selection
components (Scheiner and Berrigan 1998). A negative regression
component of the plX term indicates that the more plastic geno-
types have a fitness cost when expressing the same trait value,
that is, a lower metamorphic weight than a less plastic genotype
at a given development time, whereas a positive regression coef-
ficient implies that there is a fitness cost of possessing the ability
to express a canalized (i.e., environmental insensitive) phenotype
(Scheiner and Berrigan 1998; Poulton and Winn 2002). Egg size
was included in the model as a covariate, to control for egg-size-
mediated maternal effects (Laugen et al. 2002). Population was
included in the model as a random effect. The model was fitted
separately for the two treatments (constant water level and arti-
ficial pool drying), and for the three populations with highest or
lowest mean plasticity in development time.
Limits of plasticity imply that the most plastic families can-
not express the extreme traits. Therefore, limits of plasticity were
investigated by correlating the development time of the families
with their plasticity in development time in each environment
(DeWitt 1998; DeWitt et al. 1998; Relyea 2002). Egg size was
incorporated in the model as a covariate to control for egg-size-
mediated maternal effects. To estimate whether plasticity was
limiting the expression of the extreme trait value, we had to de-
fine the direction of the extreme trait value in each environment.
In the time-constrained artificial pool-drying treatment, the adap-
tive developmental extreme is a short development time, whereas
in the constant water level treatment, the adaptive extreme is an
extended development time (Newman 1988). Thus, in the pool-
drying treatment, limits of plasticity are present if we find a pos-
itive correlation between development time and plasticity in de-
velopment time. In contrast, if there are limits of plasticity in the
constant water level treatment, they will be identified by a negative
correlation between development time and plasticity in develop-
ment time. This does not mean that plastic genotypes must show
negative, nonadaptive plasticity for limits to be present, rather
than the limited plastic genotypes shall have a relatively shorter
development time than the less plastic genotypes under constant
water level conditions, and a relatively longer development time
than the less plastic genotypes under artificial drying conditions.
Because our main aim was to estimate costs and limits of
plasticity in populations that differ in regard to drying regime
and in their degree of plasticity in development time, we chose
populations from the extreme ends of the plasticity and pool per-
manence continuum for our analyses (see Table 1). Therefore,
not all populations were used in the analyses; only the extreme
populations in plasticity or pool-drying regime. Even if pool dry-
ing (lowering of the water surface) was observed for most pools,
none of the extreme permanent pools has dried out completely
in earlier years, whereas all pools on the temporary extreme are
known to dry out regularly. Hence, for the costs of plasticity
analysis, the three populations with the lowest and three popula-
tions with the highest mean family plasticity in development time
were compared. For limits of plasticity, in addition to comparing
populations with high and low plasticity’s, the populations inhab-
iting the three islands with most temporary pools were compared
to the populations originating from the three islands with most
permanent pools (Table 1).
EVOLUTION JUNE 2009 1 5 1 1
M. I . LIND AND F. JOHANSSON
Table 1. Estimated pool drying, expressed as decrease in maxi-
mum pool depth between May and August 2006 in pools in which
breeding had occurred. If multiple breeding pools were present
within an island, the mean pool-drying regime was calculated.
Population level plasticity in development time was measured in
the laboratory as the decrease in development time between the
constant water level and the artificial drying treatment. Number
of families on each island in which individuals from both treat-
ments survived to metamorphosis is indicated. For more detailed
information, see Supporting Information Table S1.
Island name Pool Plasticity in Familiesdrying (%) development
time (days)±SE
Ahallan 88.4 1.24±0.24 12Algrundet 100 1.28±0.21 12Bredskar 59.8 1.28±0.19 9Lillklyvan 77.8 0.85±0.43 11Oster Hallskar 0 2.99±0.82 9Savar-Tarnogern 100 1.40±0.32 12Stora Fjaderagg 0 1.34±0.36 12Storhaddingen 73.6 0.75±0.41 12Vitskar 86.7 1.08±0.19 9
A Bayesian approach was used to calculate parameter esti-
mates and confidence intervals of the models above, using Markov
chain Monte Carlo (MCMC) methods. The models were fitted us-
ing the lmer function in the lme4 library of the statistical package
R (http://www.r-project.org). We used the mcmcsamp function to
sample from the posterior density of the parameters of the fitted
models. Two MCMC chains of 50,000 steps were run, and the
first 1000 steps were discharged as burn-in samples. Confidence
intervals were calculated as the region containing 95% of the pos-
terior probability mass. Parameter estimates and 95% confidence
intervals are presented in Figures 1 and 3, if the confidence in-
terval overlaps zero, the parameter estimate does not differ from
zero.
ResultsHATCHING SURVIVAL
Of the 800 tadpoles in the experiment, 719 survived until meta-
morphosis. Most cases of mortality were identified early in the
experiment by developmental abnormalities and unusually slow
development, before the treatments had any effect.
COSTS OF PLASTICITY
Costs of plasticity imply that the plastic genotypes have fitness
costs (lower metamorphic weight, our fitness estimate) compared
to nonplastic genotypes when expressing the same trait value
(development time). The costs of plasticity were environment-
as well as treatment-specific because the regression coefficient
10 5 0 5 10
regression coefficient
plasticity x age2
plasticity x age
plasticity
age2
age
eggsize A constant
10 5 0 5 10
regression coefficient
plasticity x age2
plasticity x age
plasticity
age2
age
eggsizeB drying
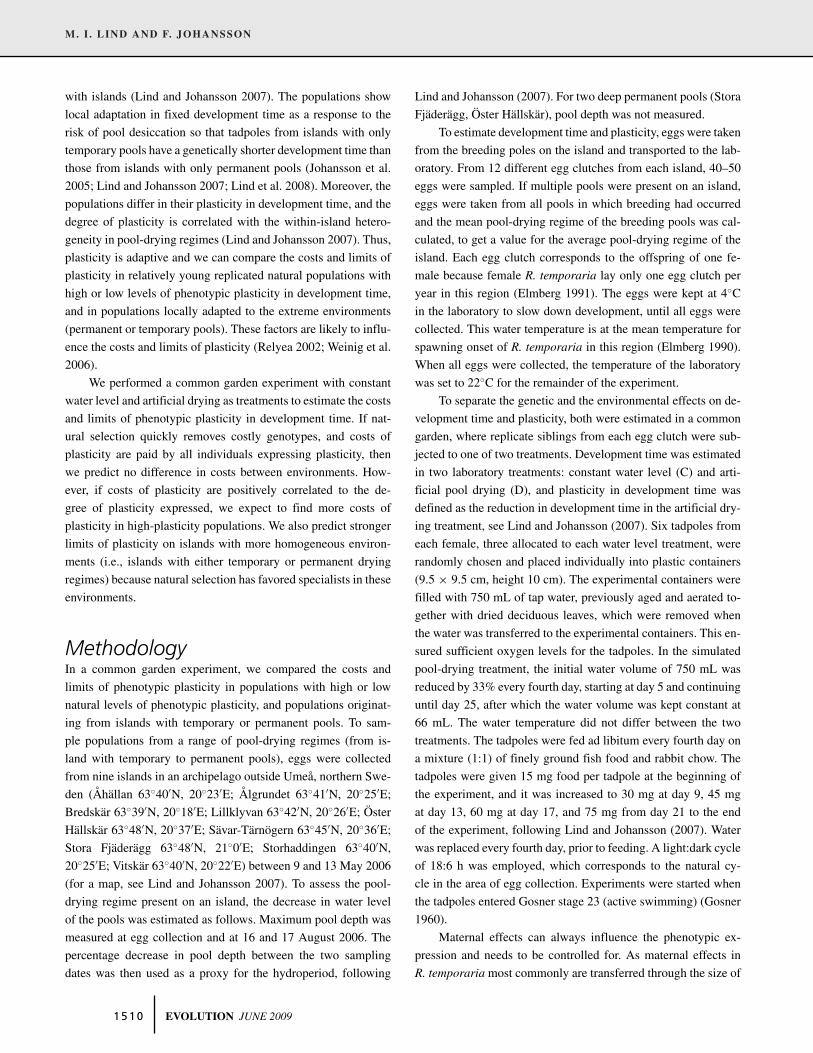
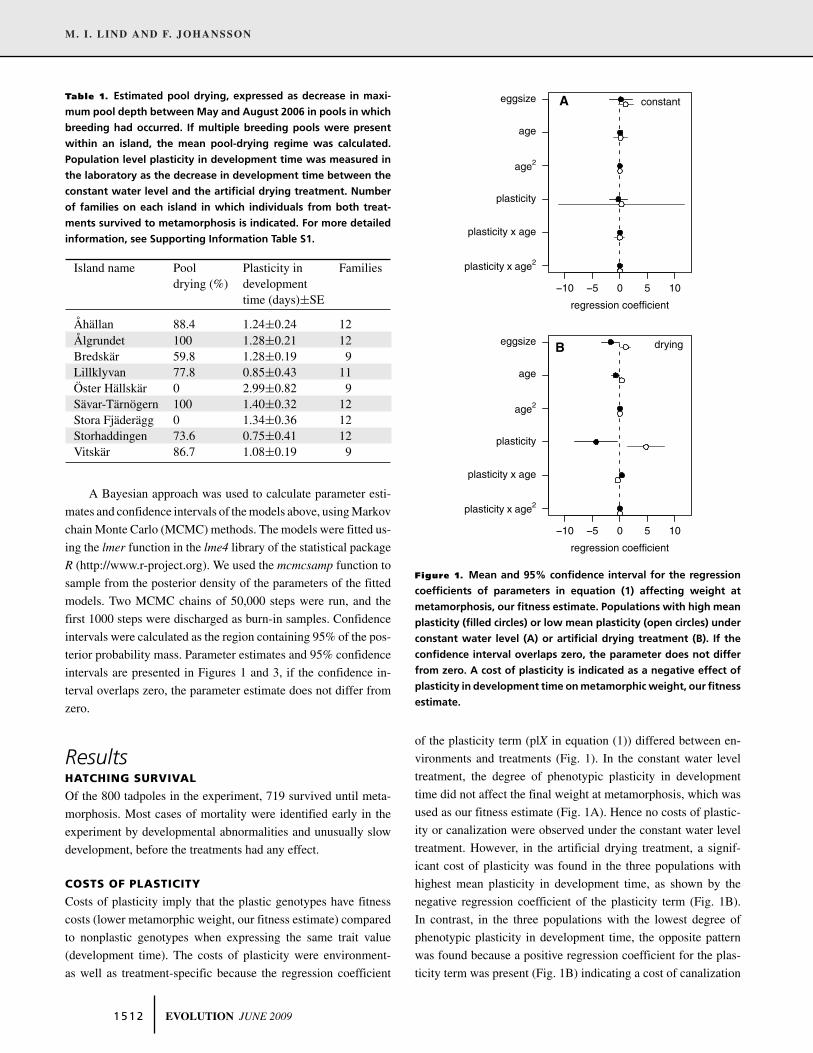
Figure 1. Mean and 95% confidence interval for the regression
coefficients of parameters in equation (1) affecting weight at
metamorphosis, our fitness estimate. Populations with high mean
plasticity (filled circles) or low mean plasticity (open circles) under
constant water level (A) or artificial drying treatment (B). If the
confidence interval overlaps zero, the parameter does not differ
from zero. A cost of plasticity is indicated as a negative effect of
plasticity in development time on metamorphic weight, our fitness
estimate.
of the plasticity term (plX in equation (1)) differed between en-
vironments and treatments (Fig. 1). In the constant water level
treatment, the degree of phenotypic plasticity in development
time did not affect the final weight at metamorphosis, which was
used as our fitness estimate (Fig. 1A). Hence no costs of plastic-
ity or canalization were observed under the constant water level
treatment. However, in the artificial drying treatment, a signif-
icant cost of plasticity was found in the three populations with
highest mean plasticity in development time, as shown by the
negative regression coefficient of the plasticity term (Fig. 1B).
In contrast, in the three populations with the lowest degree of
phenotypic plasticity in development time, the opposite pattern
was found because a positive regression coefficient for the plas-
ticity term was present (Fig. 1B) indicating a cost of canalization
1 5 1 2 EVOLUTION JUNE 2009
COSTS AND LIMITS OF PHENOTYPIC PLASTICITY
0 2 4 6 8
2224
2628
3032
34
Plasticity in development time
Age
at m
etam
orph
osis
A permanent
n.s.
●
●
●●
●
●
●
●●
●
●
●
●
●●
●●●
●
●
●
●
●
●
●
●
●
●
● ●●
●
●
●
●
●
●
●●
●
●
●
●
●●
●●●
●
●
●
●
●
●
●
●
●
●
●
●
0 2 4 6 8
2224
2628
3032
34
Plasticity in development time
Age
at m
etam
orph
osis
B temporary
●
●●
●
●
●●●
●●
●
●
●●●
●●
●
●
●
●
●●●
●
●
●
●●
●
●
●
●
●●
●
●
●●
●
●
●●●
●●
●
●
●●●
●
●
●
●
●
●
●●●
●
●
●
●●
●
●
●
●
●●
●
0 2 4 6 8
2224
2628
3032
34
Plasticity in development time
Age
at m
etam
orph
osis
C low plasticity
n.s.
●
●
●
●
●
●
●●
●
●●
●●
●
●
●
●
●●●
●
●
●●
●
●●●
●
●● ●
●
●
●
●
●
●
●●●
●●
●●
●
●
●
●
●●●
●
●
●●
●
●●●
●
●
●
●
0 2 4 6 8
2224
2628
3032
34
Plasticity in development time
Age
at m
etam
orph
osis
D high plasticity
n.s.
●
●
●
●
●●●
●
●●
●
●●
●●●
●●
●
●
●●
●
●
●
●●
●●
●
●
● ●●
●
●
●
●
●●
●
●
●
●
●●
●●●
●●
●
●
●●
●
●
●
●●
●●
●
●
●
●
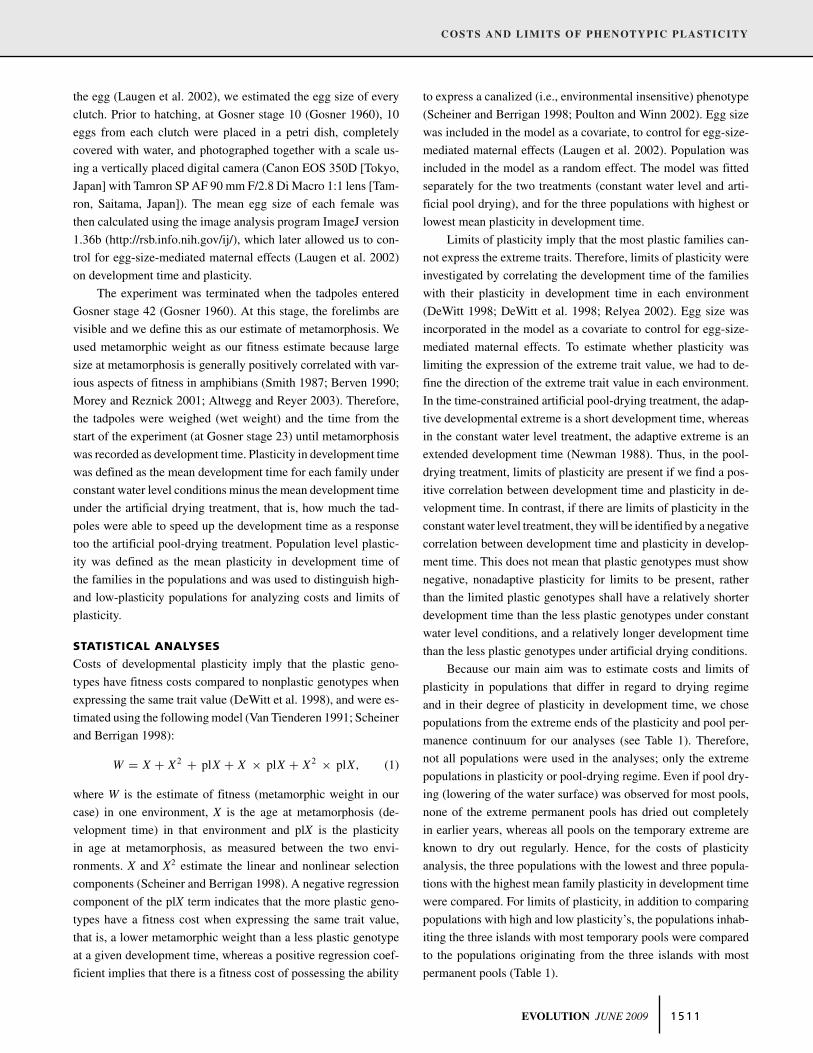
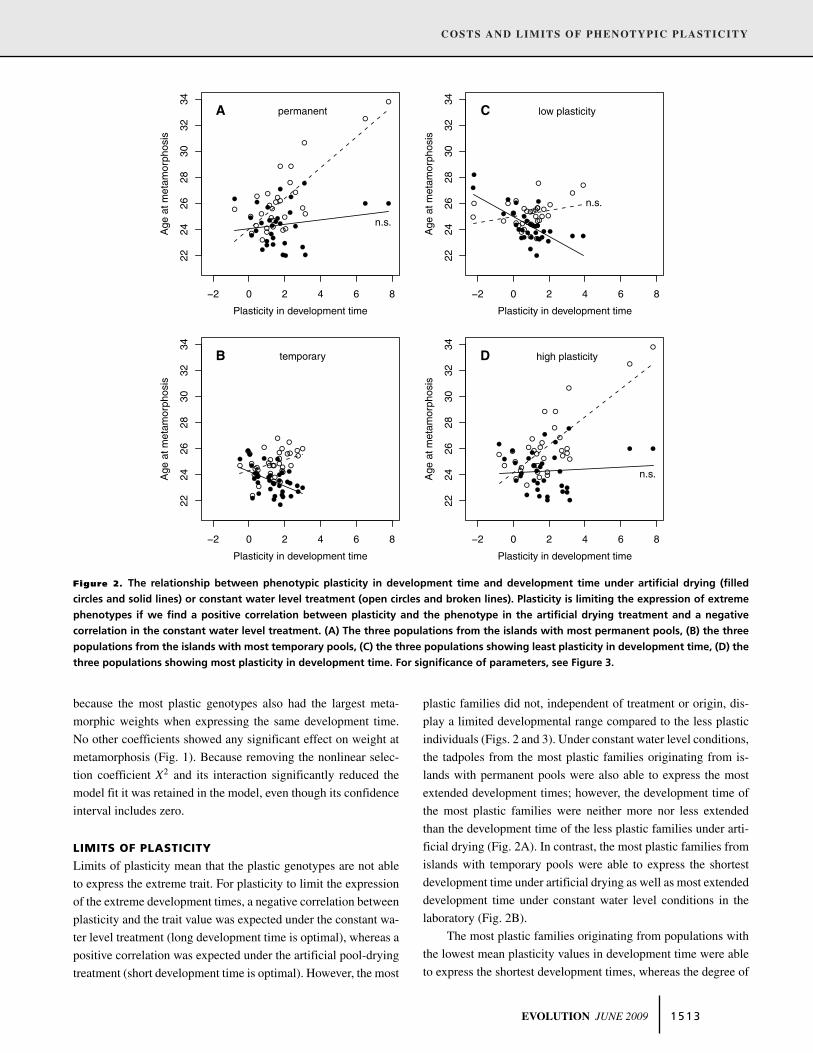
Figure 2. The relationship between phenotypic plasticity in development time and development time under artificial drying (filled
circles and solid lines) or constant water level treatment (open circles and broken lines). Plasticity is limiting the expression of extreme
phenotypes if we find a positive correlation between plasticity and the phenotype in the artificial drying treatment and a negative
correlation in the constant water level treatment. (A) The three populations from the islands with most permanent pools, (B) the three
populations from the islands with most temporary pools, (C) the three populations showing least plasticity in development time, (D) the
three populations showing most plasticity in development time. For significance of parameters, see Figure 3.
because the most plastic genotypes also had the largest meta-
morphic weights when expressing the same development time.
No other coefficients showed any significant effect on weight at
metamorphosis (Fig. 1). Because removing the nonlinear selec-
tion coefficient X2 and its interaction significantly reduced the
model fit it was retained in the model, even though its confidence
interval includes zero.
LIMITS OF PLASTICITY
Limits of plasticity mean that the plastic genotypes are not able
to express the extreme trait. For plasticity to limit the expression
of the extreme development times, a negative correlation between
plasticity and the trait value was expected under the constant wa-
ter level treatment (long development time is optimal), whereas a
positive correlation was expected under the artificial pool-drying
treatment (short development time is optimal). However, the most
plastic families did not, independent of treatment or origin, dis-
play a limited developmental range compared to the less plastic
individuals (Figs. 2 and 3). Under constant water level conditions,
the tadpoles from the most plastic families originating from is-
lands with permanent pools were also able to express the most
extended development times; however, the development time of
the most plastic families were neither more nor less extended
than the development time of the less plastic families under arti-
ficial drying (Fig. 2A). In contrast, the most plastic families from
islands with temporary pools were able to express the shortest
development time under artificial drying as well as most extended
development time under constant water level conditions in the
laboratory (Fig. 2B).
The most plastic families originating from populations with
the lowest mean plasticity values in development time were able
to express the shortest development times, whereas the degree of
EVOLUTION JUNE 2009 1 5 1 3
M. I . LIND AND F. JOHANSSON
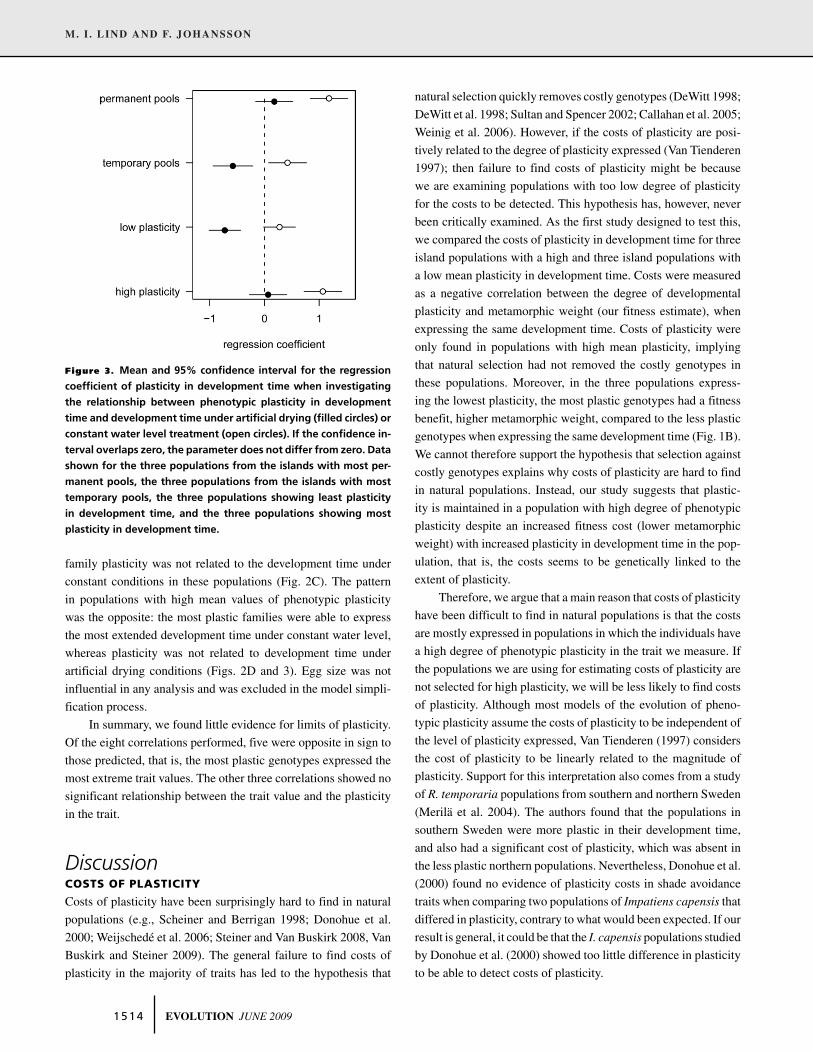
Figure 3. Mean and 95% confidence interval for the regression
coefficient of plasticity in development time when investigating
the relationship between phenotypic plasticity in development
time and development time under artificial drying (filled circles) or
constant water level treatment (open circles). If the confidence in-
terval overlaps zero, the parameter does not differ from zero. Data
shown for the three populations from the islands with most per-
manent pools, the three populations from the islands with most
temporary pools, the three populations showing least plasticity
in development time, and the three populations showing most
plasticity in development time.
family plasticity was not related to the development time under
constant conditions in these populations (Fig. 2C). The pattern
in populations with high mean values of phenotypic plasticity
was the opposite: the most plastic families were able to express
the most extended development time under constant water level,
whereas plasticity was not related to development time under
artificial drying conditions (Figs. 2D and 3). Egg size was not
influential in any analysis and was excluded in the model simpli-
fication process.
In summary, we found little evidence for limits of plasticity.
Of the eight correlations performed, five were opposite in sign to
those predicted, that is, the most plastic genotypes expressed the
most extreme trait values. The other three correlations showed no
significant relationship between the trait value and the plasticity
in the trait.
DiscussionCOSTS OF PLASTICITY
Costs of plasticity have been surprisingly hard to find in natural
populations (e.g., Scheiner and Berrigan 1998; Donohue et al.
2000; Weijschede et al. 2006; Steiner and Van Buskirk 2008, Van
Buskirk and Steiner 2009). The general failure to find costs of
plasticity in the majority of traits has led to the hypothesis that
natural selection quickly removes costly genotypes (DeWitt 1998;
DeWitt et al. 1998; Sultan and Spencer 2002; Callahan et al. 2005;
Weinig et al. 2006). However, if the costs of plasticity are posi-
tively related to the degree of plasticity expressed (Van Tienderen
1997); then failure to find costs of plasticity might be because
we are examining populations with too low degree of plasticity
for the costs to be detected. This hypothesis has, however, never
been critically examined. As the first study designed to test this,
we compared the costs of plasticity in development time for three
island populations with a high and three island populations with
a low mean plasticity in development time. Costs were measured
as a negative correlation between the degree of developmental
plasticity and metamorphic weight (our fitness estimate), when
expressing the same development time. Costs of plasticity were
only found in populations with high mean plasticity, implying
that natural selection had not removed the costly genotypes in
these populations. Moreover, in the three populations express-
ing the lowest plasticity, the most plastic genotypes had a fitness
benefit, higher metamorphic weight, compared to the less plastic
genotypes when expressing the same development time (Fig. 1B).
We cannot therefore support the hypothesis that selection against
costly genotypes explains why costs of plasticity are hard to find
in natural populations. Instead, our study suggests that plastic-
ity is maintained in a population with high degree of phenotypic
plasticity despite an increased fitness cost (lower metamorphic
weight) with increased plasticity in development time in the pop-
ulation, that is, the costs seems to be genetically linked to the
extent of plasticity.
Therefore, we argue that a main reason that costs of plasticity
have been difficult to find in natural populations is that the costs
are mostly expressed in populations in which the individuals have
a high degree of phenotypic plasticity in the trait we measure. If
the populations we are using for estimating costs of plasticity are
not selected for high plasticity, we will be less likely to find costs
of plasticity. Although most models of the evolution of pheno-
typic plasticity assume the costs of plasticity to be independent of
the level of plasticity expressed, Van Tienderen (1997) considers
the cost of plasticity to be linearly related to the magnitude of
plasticity. Support for this interpretation also comes from a study
of R. temporaria populations from southern and northern Sweden
(Merila et al. 2004). The authors found that the populations in
southern Sweden were more plastic in their development time,
and also had a significant cost of plasticity, which was absent in
the less plastic northern populations. Nevertheless, Donohue et al.
(2000) found no evidence of plasticity costs in shade avoidance
traits when comparing two populations of Impatiens capensis that
differed in plasticity, contrary to what would been expected. If our
result is general, it could be that the I. capensis populations studied
by Donohue et al. (2000) showed too little difference in plasticity
to be able to detect costs of plasticity.
1 5 1 4 EVOLUTION JUNE 2009
COSTS AND LIMITS OF PHENOTYPIC PLASTICITY
Our study adds to the numerous examples showing that, even
if plasticity costs are present in a trait, these costs are treatment
dependent (Dorn et al. 2000; Relyea 2002). This is of special
concern because theoretical modeling has shown that only global
costs (costs expressed over multiple environments) will influence
the evolution of plasticity (Sultan and Spencer 2002). The fit-
ness cost of plasticity in development time was expressed only
in the time-stressed artificial drying treatment, which is predicted
(Van Tienderen 1991) and commonly found in studies on animals
(Van Buskirk and Steiner 2009) because individuals in stress-
ful treatments might be unable to allocate enough resources to
both maintenance of developmental systems underlying plastic-
ity and growth (Van Tienderen 1991; DeWitt 1998; Dorn et al.
2000; Steinger et al. 2003; van Kleunen and Fischer 2005; Weinig
et al. 2006, but see Merila et al. 2004; Steiner and Van Buskirk
2008).
It has been argued that, if the degree of plasticity is coupled
to the trait mean (Via 1993), an increase in the trait mean would
also increase the degree of plasticity and potentially lead to the
accumulation of costs (Weijschede et al. 2006). This does not
occur in our system because the trait mean (development time)
and the degree of plasticity in development time are not correlated
under any treatment in our study system (Lind and Johansson
2007). It should also be noted that there might be costs of plasticity
unrelated to our fitness estimate (metamorphic size) and that they
therefore went undetected in our analysis. However, we emphasize
that metamorphic weight is positively correlated to a number
of fitness measures in amphibians (Smith 1987; Berven 1990;
Morey and Reznick 2001; Altwegg and Reyer 2003). Another
general problem with studies using the regression approach to
detect potential plasticity costs is that costs might be hard to
detect if the plastic genotypes are not able to express the extreme
phenotypes because the fitness function will be heavily weighted
by these extreme nonplastic phenotypes. However, that is not a
problem in the current study, as the most plastic genotypes also
expressed the extreme phenotypes and no limits of plasticity were
present.
In addition to a fitness cost of plasticity for individuals from
populations with high plasticity, a fitness benefit of plasticity was
found in the populations with lowest mean plasticity in devel-
opment time (Fig. 1B), indicating a cost of canalization (Dorn
et al. 2000; Poulton and Winn 2002; Steiner and Van Buskirk
2008). Although costs of canalization have been found in a num-
ber of studies of both animals and plants (e.g., Dorn et al. 2000;
Relyea 2002; Weijschede et al. 2006; Weinig et al. 2006; Avramov
et al. 2007; Steiner and Van Buskirk 2008), canalization costs
have not been considered as a factor influencing the cost/benefit
trade-off in the evolution of phenotypic plasticity (Van Tienderen
1991; DeWitt et al. 1998; Scheiner and Berrigan 1998). Yet the
empirical evidence for costs of canalization suggests that they are
common (Van Buskirk and Steiner 2009) and might influence the
evolution of plasticity and specialization.
LIMITS OF PLASTICITY
The hypothesis that limits of plasticity exist is based on the as-
sumption that plastic genotypes have higher fitness costs com-
pared to nonplastic ones. In models in which the population has
access to two environments, increased costs of plasticity generally
lead to a shift from plastic generalists to specialists on the two
environments, with more extreme phenotypes (e.g., Moran 1992;
Wilson and Yoshimura 1994; Sultan and Spencer 2002). How-
ever, our study adds to the previous empirical evidence (DeWitt
1998; Relyea 2002) that limits of plasticity do not exist in natural
populations and that the developmental ranges of plastic geno-
types are not smaller than those of the fixed specialists (Figs. 2
and 3). If plasticity is not costlier than specialization, as experi-
mental evidence suggests (e.g., Scheiner and Berrigan 1998; Re-
lyea 2002; Steiner and Van Buskirk 2008), there is no reason for
limits of plasticity to exist, and this is what we find.
One proposed explanation for the lack of plasticity limits
is that alternating selection pressures would select against the
nonplastic extreme specialists (Relyea 2002). However, no limits
of plasticity were present in the populations expressing the low-
est levels of phenotypic plasticity in this experiment, despite the
fact that individuals in these populations were more specialized.
Moreover, plasticity was not limiting the expression of the ex-
treme development times in the populations from temporary or
permanent environments, despite the fact that individuals from
these populations are locally adapted in their development time to
the pool-drying regime present (Johansson et al. 2005; Lind and
Johansson 2007; Lind et al. 2008). Therefore, we found no sup-
port for the hypothesis that limits of plasticity should be present in
populations with low plasticity or local adaptation to an extreme
environment.
Another explanation to the lack of studies finding limits of
plasticity is that, for limits to be found, the most extreme pheno-
type must also be the most optimal phenotype in each environ-
ment, for example, directional and not stabilizing selection on the
trait must take place within each environment. Stabilizing selec-
tion is the most likely scenario in our system because the specialist
genotypes often expressed a development time in between the ex-
tremes of the plastic genotypes. Because the degree of phenotypic
plasticity and the trait mean can evolve as independent charac-
ters (Scheiner and Lyman 1991; Pigliucci and Schmitt 1999); the
adaptation to temporary pools seems to have been driven by a shift
in the trait mean (Lind and Johansson 2007). Yet plasticity around
that mean development time has been retained, as only the most
plastic individuals have been able to express the extreme devel-
opment time. Therefore it will be hard to find limits of plasticity
in the frog system studied.
EVOLUTION JUNE 2009 1 5 1 5

M. I . LIND AND F. JOHANSSON
Both canalization and phenotypic plasticity were found in
our study system because development times and plasticity in de-
velopment times are not correlated (Lind and Johansson 2007).
Within an island population, genotypes adapt either by devel-
opment time becoming canalized to the mean drying regime on
the island, or by increased plasticity in development time. As a
consequence of this local adaptation to the local environment in
every population, the individuals within a population with one
environment will appear as specialists to that environment when
compared to individuals from island populations with contrasting
environmental conditions. Possibly, the shifts in the trait mean
when the frogs have invaded the islands with temporary pools
have been accommodated by phenotypic plasticity in develop-
ment time, making them able to express the shorter development
time needed to survive in those temporary pools through a Bald-
win effect (Crispo 2007).
The analysis of limits of plasticity also provides insight into
the direction of the plastic response in development time to pool
drying. Although the most plastic individuals from populations
with temporary pools can both speed up and slow down their de-
velopment times depending upon treatment (Fig. 2B), the most
plastic tadpoles from islands with permanent pools do not develop
faster than the less plastic individuals under artificial drying, but
have longer development times under constant water level condi-
tions (Fig. 2A). Because the risk of complete pool drying is very
low in these pools, there is probably no selection pressure to de-
crease the development time. The observation that the most plastic
tadpoles were also able to express the longest development times
in the permanent conditions in these pools indicates that plastic-
ity in development time is an important trait in these permanent
pools. Therefore, despite the stable environment in permanent
pools, plasticity is maintained by selection because only the most
plastic tadpoles can express the extreme trait (Fig. 2D). Because
no cost of being plastic was found in the constant water level
treatment, plasticity in development time is not selected against in
populations inhabiting islands with permanent (constant) pools.
CONCLUSIONS
This study is the first to test the general hypothesis that the lack
of ubiquitous presence of plasticity costs is the consequence of
natural selection removing costly genotypes. Our results, how-
ever, showed that high levels of plasticity occurred in populations
despite increasing costs of plasticity. Taken together, these results
suggest that phenotypic plasticity can evolve despite increasing
costs with high levels of plasticity and that costs of plasticity
therefore are most likely to be found in populations in which the
individuals express a high level of phenotypic plasticity. More-
over, costs of canalization were found, a cost that has not been
included in models of phenotypic plasticity. The study also adds
to the existing empirical evidence that limits of plasticity are un-
common in natural populations. Together, these results suggest
that the current theories of costs and limits of plasticity need
to be extended, to include varying costs between environments
(Steinger et al. 2003) and to investigate the reason why plastic-
ity costs seem to increase, rather than decrease, with increased
plasticity in a population (Merila et al. 2004). This may indicate
that plasticity costs are not important constraints for the evolution
of plasticity as previously believed (DeWitt et al. 1998). More-
over, our study also highlights the fact that costs of plasticity are
population specific (see also Merila et al. 2004) and can differ
substantially between populations adapted to different environ-
ments. We agree with Steiner and Van Buskirk (2008) that the
reason that we observe different levels of plasticity in different
populations is that they are maintained by differences in environ-
mental selection affecting plasticity (or drift), rather than costs of
plasticity. In addition to costs of plasticity, another strong predic-
tor if plasticity or specialization will evolve in theoretical models
is the accuracy of the response to the environment (e.g., Moran
1992; Sultan and Spencer 2002). We hope that more experimental
studies will investigate the accuracy of the plastic response, as this
might be one of the most important constraints on the evolution
of phenotypic plasticity in natural populations.
ACKNOWLEDGMENTSWe thank F. Bokma, B. Giles, A. Laurila, and three anonymous reviewersfor their constructive comments on earlier drafts of this manuscript, and P.Ingvarsson for statistical advice. The research was funded by the SwedishResearch Council and the Swedish Research Council FORMAS.
LITERATURE CITEDAltwegg, R., and H. U. Reyer. 2003. Patterns of natural selection on size at
metamorphosis in water frogs. Evolution 57:872–882.Avramov, S., D. Pemac, and B. Tucic. 2007. Phenotypic plasticity in response
to an irradiance gradient in Iris pumila : adaptive value and evolutionaryconstraints. Plant Ecol. 190:275–290. DOI: 10.1007/s11258-006-9207-3.
Berven, K. A. 1990. Factors affecting population fluctuations in larval andadult stages of the wood frog (Rana sylvatica). Ecology 71:1599–1608.
Brady, L. D., and R. A. Griffiths. 2000. Developmental responses to ponddesiccation in tadpoles of the British anuran amphibians (Bufo bufo, B.calamita and Rana temporaria). J. Zool. 252:61–69.
Callahan, H. S., N. Dhanoolal, and M. C. Ungerer. 2005. Plasticity genesand plasticity costs: a new approach using an Arabidopsis recombi-nant inbred population. New Phyt. 166:129–140. DOI: 10.1111/j.1469-8137.2005.01368.x.
Crispo, E. 2007. The Baldwin effect and genetic assimilation: revisiting twomechanisms of evolutionary change mediated by phenotypic plasticity.Evolution 61:2469–2479.
De Block, M., and R. Stoks. 2005. Pond drying and hatching date shapethe tradeoff between age and size at emergence in a damselfly. Oikos108:485–494.
Delasalle, V. A., and S. Blum. 1994. Variation in germination and survivalamong families of Sagittaria latifolia in response to salinity and tem-perature. Int. J. Plant Sci. 155:187–195.
1 5 1 6 EVOLUTION JUNE 2009
COSTS AND LIMITS OF PHENOTYPIC PLASTICITY
Denver, R. J., N. Mirhadi, and M. Phillips. 1998. Adaptive plasticity in am-phibian metamorphosis: Response of Scaphiopus hammondii tadpolesto habitat desiccation. Ecology 79:1859–1872.
DeWitt, T. J. 1998. Costs and limits of phenotypic plasticity: tests withpredator-induced morphology and life history in a freshwater snail. J.Evol. Biol. 11:465–480.
DeWitt, T. J., A. Sih, and D. S. Wilson 1998. Costs and limits of phenotypicplasticity. Trends Ecol. Evol. 13:77–81.
Donohue, K., D. Messiqua, E. H. Pyle, M. S. Heschel, and J. Schmitt. 2000. Ev-idence of adaptive divergence in plasticity: density- and site-dependentselection on shade-avoidance responses in Impatiens capenses. Evolu-tion 54:1956–1968. DOI: 10.1111/j.0014-3820.2000.tb01240.x.
Dorn, L. A., E. H. Pyle, and J. Schmitt. 2000. Plasticity to light cues andresources in Arabidopsis thaliana: testing for adaptive value and costs.Evolution 54:1982–1994. DOI:10.1111/j.0014-3820.2000.tb01242.x.
Elmberg, J. 1990. Long-term survival, length of breeding season and opera-tional sex ratio in a boreal population of common frogs Rana temporaria.Can. J. Zool. 68:121–127.
Elmberg, J. 1991. Ovarian cyclicity and fecundity in boreal common frogsRana temporaria L. along a climatic gradient. Func. Ecol. 5:340–350.
Gosner, K. L. 1960. A simplified table for staging anuran embryos and larvaewith notes on identification. Herpetologica 16:183–190.
Hollander, J. 2008. Testing the grain-size model for the evolution ofphenotypic plasticity. Evolution 62:1381–1389. DOI: 10.1111/j.1558-5646.2008.00365.x.
Johansson, F., J. Hjelm, and B. E. Giles. 2005. Life history and morphologyof Rana temporaria in response to pool permanence. Evol. Ecol. Res.7:1025–1038.
van Kleunen, M., and M. Fischer. 2005. Constraints on the evolutionof adaptive phenotypic plasticity in plants. New Phyt. 166:49–60.DOI:10.1111/j.1469-8137.2004.01296.x.
Laugen, A. T., A. Laurila, and J. Merila. 2002. Maternal and genetic contri-butions to geographical variation in Rana temporaria larval life-historytraits. Biol. J. Linn. Soc. 76:61–70.
Laurila, A., and J. Kujasalo. 1999. Habitat duration, predation risk and phe-notypic plasticity in common frog (Rana temporaria) tadpoles. J. Anim.Ecol. 68:1123–1132.
Levins, R. 1968. Evolution in changing environments: some theoretical ex-plorations, Monographs in population biology; 2. Princeton Univ. Press,Princeton, NJ.
Lind, M. I., and F. Johansson. 2007. The degree of phenotypic plasticity iscorrelated with the spatial environmental heterogeneity experienced byisland populations of Rana temporaria. J. Evol. Biol. 20:1288–1297.DOI: 10.1111/j.1420-9101.2007.01353.x.
Lind, M. I., F. Persbo, and F. Johansson. 2008. Pool desiccation and develop-mental thresholds in the common frog, Rana temporaria. Proc. R. Soc.B. 275:1073–1080. DOI: 10.1098/rspb.2007.1737.
Loman, J., and D. Claesson. 2003. Plastic response to pond drying in tadpolesRana temporaria: tests of cost models. Evol. Ecol. Res. 5:179–194.
Merila, J., A. Laurila, and B. Lindgren. 2004. Variation in the degree and costsof adaptive phenotypic plasticity among Rana temporaria populations.J. Evol. Biol. 17:1132–1140.
Moran, N. A. 1992. The evolutionary maintenance of alternative phenotypes.Am. Nat. 139:971–989.
Morey, S., and D. Reznick. 2001. Effects of larval density on postmetamorphicspadefoot toads (Spea hammondii). Ecology 82:510–522.
Newman, R. A. 1988. Adaptive plasticity in development of Scaphiopus
coichii tadpoles in desert ponds. Evolution 42:774–783.———. 1992. Adaptive plasticity in amphibian metamorphosis: what type of
phenotypic variation is adaptive, and what are the costs of such plasticity.BioScience 42:671–678.
Pigliucci, M. 1997. Ontogenetic phenotypic plasticity during the reproductivephase in Arabidopsis thaliana (Brassicaceae). Am. J. Bot. 84:887–895.
———. 2005. Evolution of phenotypic plasticity: where are we going now?Trends Ecol. Evol. 20:481–486.
Pigliucci, M., and J. Schmitt. 1999. Genes affecting phenotypic plasticityin Arabidopsis: pleiotropic effects and reproductive fitness of photo-morphogenic mutants. J. Evol. Biol. 12:551–562. DOI: 10.1046/j.1420-9101.1999.00057.x.
Poulton, J., and A. A. Winn. 2002. Costs of canalization and plasticity inresponse to neighbors in Brassica rapa. Plant Species Biol. 17:109–118. DOI: 10.1046/j.1442-1984.2002.00081.x.
Relyea, R. A. 2002. Costs of phenotypic plasticity. Am. Nat. 159:272–282.Reznick, D. N., F. H. Shaw, F. H. Rodd, and R. G. Shaw. 1997. Evalua-
tion of the rate of evolution in natural populations of guppies (Poecilia
reticulata). Science 275:1934–1937.Richter-Boix, A., G. A. Llorente, and A. Montori. 2006. A comparative anal-
ysis of the adaptive developmental plasticity hypothesis in six Mediter-ranean anuran species along a pond permanency gradient. Evol. Ecol.Res. 8:1139–1154.
Scheiner, S. M., and D. Berrigan. 1998. The genetics of phenotypic plasticity.VIII. The cost of plasticity in Daphnia pulex. Evolution 52:368–378.
Scheiner, S. M., and R. F. Lyman. 1991. The genetics of phenotypic plasticity.II. Response to selection. J. Evol. Biol. 4:23–50.
Smith, D. C. 1987. Adult recruitment in chorus frogs: effects of size and dateat metamorphosis. Ecology 68:344–350.
Steiner, U. K., and J. Van Buskirk. 2008. Environmental stress and the costs ofwhole-organism phenotypic plasticity in tadpoles. J. Evol. Biol. 21:97–103. DOI: 10.1111/j.1420-9101.2007.01463.x.
Steinger, T., B. A. Roy, and M. L. Stanton. 2003. Evolution in stressful environ-ments II: adaptive value and costs of plasticity in response to low lightin Sinapis arvensis. J. Evol. Biol. 16:313–323. DOI: 10.1046/j.1420-9101.2003.00518.x.
Sultan, S. E., and H. G. Spencer. 2002. Metapopulation structure favoursplasticity over local adaptation. Am. Nat. 160:271–283.
Thompson, J. N. 2005. The geographic mosaic of coevolution, Interspecificinteractions. Univ. of Chicago Press, Chicago, IL.
Van Buskirk, J., and M. Arioli. 2005. Habitat specialization and adaptivephenotypic divergence of anuran populations. J. Evol. Biol. 18:596–608.
Van Buskirk, J., and U. K. Steiner. 2009. The fitness costs of developmentalcanalization and plasticity. J. Evol. Biol. 22:In press.
Van Tienderen, P. H. 1991. Evolution of generalists and specialists in spatiallyheterogeneous environments. Evolution 45:1317–1331.
———. 1997. Generalists, specialists, and the evolution of phenotypic plas-ticity in sympatric populations of distinct species. Evolution 51:1372–1380.
Via, S. 1993. Adaptive phenotypic plasticity: target or by-product of selectionin a variable environment? Am. Nat. 142:352–365.
Via, S., and R. Lande. 1985. Genotype-environment interaction and the evo-lution of phenotypic plasticity. Evolution 39:505–522.
Weijschede, J., J. Martınkova, H. de Kroon, and H. Huber. 2006. Shadeavoidance in Trifolium repens: costs and benefits of plasticity in petiolelength and leaf size. New Phyt. 172:655–666.
Weinig, C., J. Johnston, Z. M. German, and L. M. Demink. 2006. Local andglobal costs of adaptive plasticity to density in Arabidopsis thaliana.Am. Nat. 167:826–836.
Wilbur, H. M. 1987. Regulation of structure in complex systems: experimentaltemporary pond communities. Ecology 68:1437–1452.
Wilson, D. S., and J. Yoshimura. 1994. On the coexistence of specialists andgeneralists. Am. Nat. 144:692–707.
Associate Editor: J. Wolf
EVOLUTION JUNE 2009 1 5 1 7

M. I . LIND AND F. JOHANSSON
Supporting InformationThe following supporting information is available for this article:
Table S1: Mean and standard error of the metamorphic weight and development time for all islands.
Supporting Information may be found in the online version of this article.
(This link will take you to the article abstract).
Please note: Wiley-Blackwell are not responsible for the content or functionality of any supporting informations supplied
by the authors. Any queries (other than missing material) should be directed to the corresponding author for the article.
1 5 1 8 EVOLUTION JUNE 2009