cost - uc davis ecebbaas/116/notes/handout05.cost.pdfeec 116, b. baas 147 nre cost is increasing...
TRANSCRIPT
144
COST
EEC 116, B. Baas

145EEC 116, B. Baas 145
Design Metrics
• Metrics to evaluate performance of a digital circuit (at any level; e.g. gate, block, …)
– Energy to perform a function
– Performance (clock maximum operating frequency, workload throughput, workload latency)
– Cost
– Design time
– Power dissipation (often peak power is of greatest concern)
– Scalability
– Reliability
• Relative cost depends on the application, for example:
– Heart pacemaker (reliability, energy most important)
– RFID (cost, energy most important)
– PC graphics processor (speed most important)

146EEC 116, B. Baas 146
Cost of Integrated Circuits
• cost/chip = fixed cost per design + variable cost per chip
– Cost varies tremendously depending on the number of chips sold
• Fixed costs per design, NRE (non-recurrent engineering)
– Design time and effort (designers and designer support)
– Mask generation
– CAD (computer aided design) software tools
– Company costs (sales, marketing, building,…)
• Recurrent costs are costs for each chip
– Some cost reductions with higher volumes
– Silicon processing
• Cost is strongly tied to chip area
– Chip packaging and test
147EEC 116, B. Baas 147
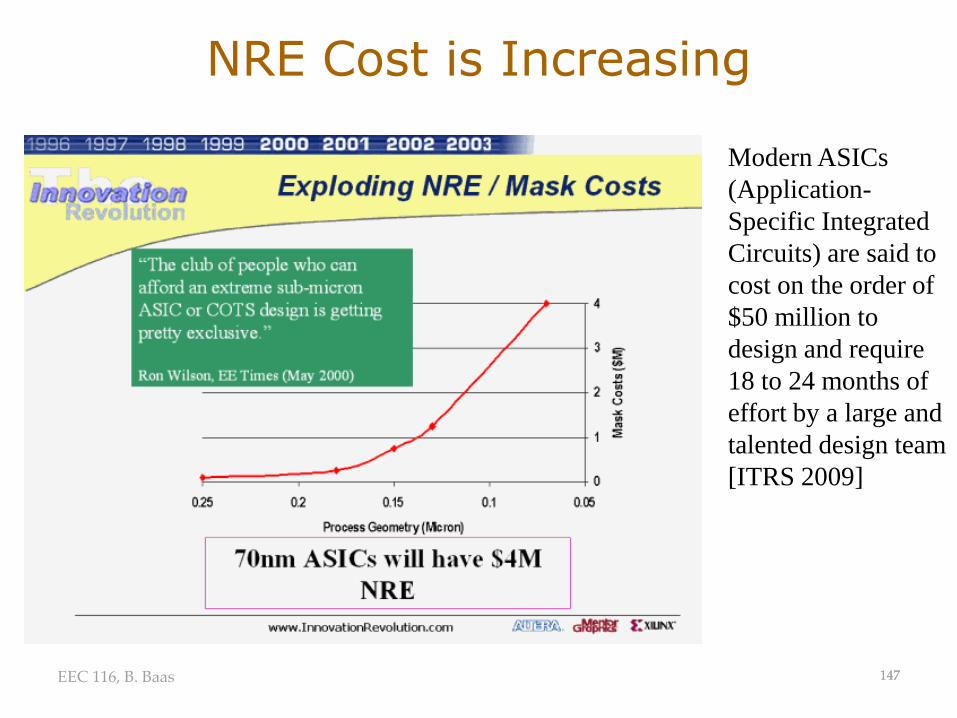
NRE Cost is Increasing
Modern ASICs
(Application-
Specific Integrated
Circuits) are said to
cost on the order of
$50 million to
design and require
18 to 24 months of
effort by a large and
talented design team
[ITRS 2009]

148EEC 116, B. Baas 148
Die Cost
Single die
Wafer
Source: http://www.amd.com
149EEC 116, B. Baas 149
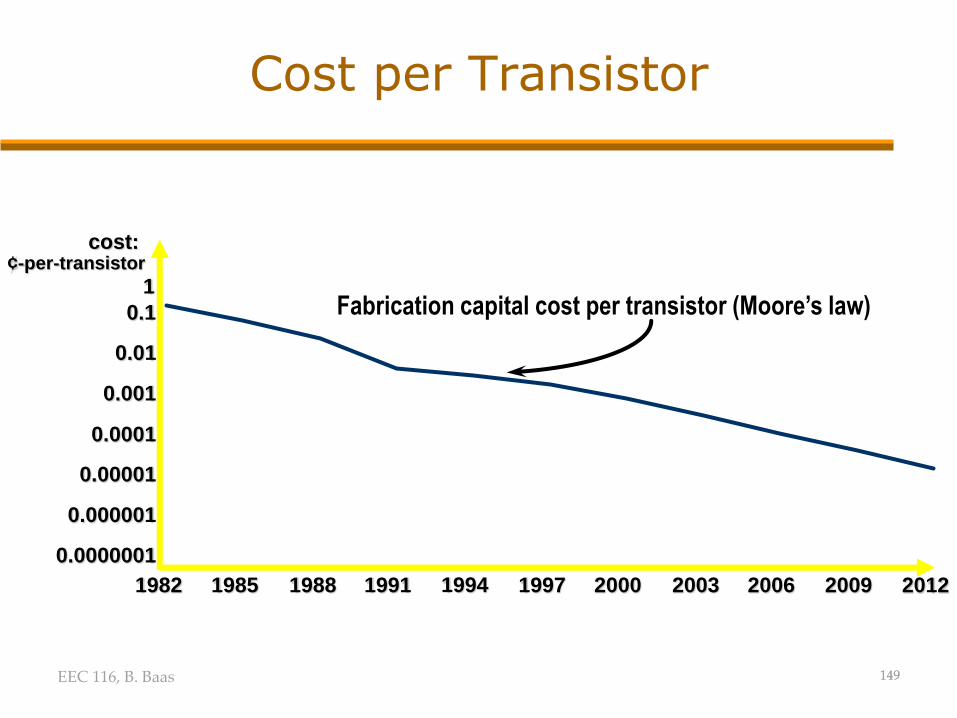
Cost per Transistor
0.0000001
0.000001
0.00001
0.0001
0.001
0.01
0.1
1
1982 1985 1988 1991 1994 1997 2000 2003 2006 2009 2012
cost: ¢-per-transistor
Fabrication capital cost per transistor (Moore’s law)
150EEC 116, B. Baas 150
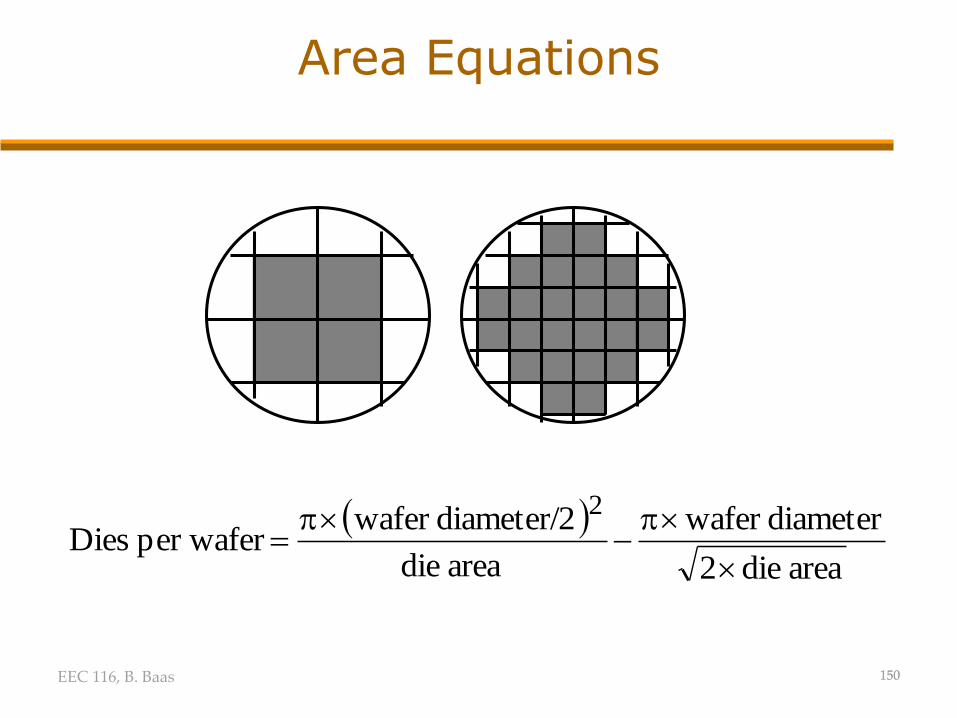
Area Equations
area die2
diameterwafer
area die
diameter/2wafer per wafer Dies
2
151EEC 116, B. Baas 151
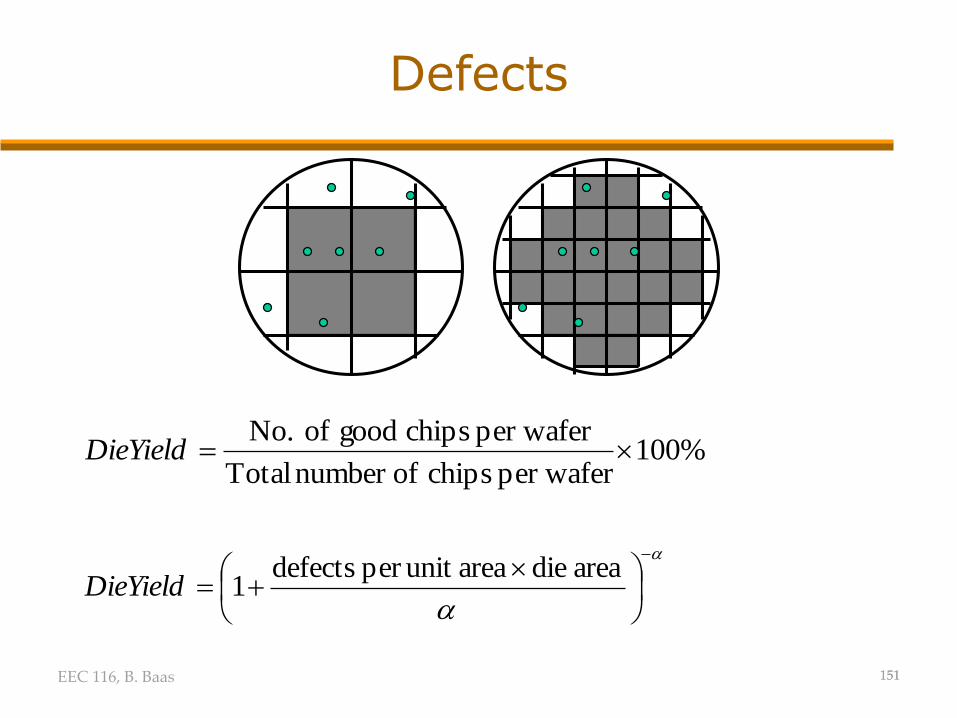
Defects
area dieareaunit per defects1DieYield
%100per wafer chips ofnumber Total
per wafer chips good of No.DieYield

152EEC 116, B. Baas 152
Defects
• Alpha is roughly proportional to the number of “mask layers” (discussed next lecture)
• Alpha = 3 approximately for modern CMOS processes
• 0.5 – 1 defects/cm2 typical for modern CMOS process
)(
DieYieldper wafer Dies
WaferCost
4DieAreafDieCost
DieCost
sPerWaferNumGoodDie
WaferCostDieCost

153EEC 116, B. Baas 153
Some Examples (1994)
Chip Metal layers
Line width
Wafer cost
Def./ cm2
Area mm2
Dies/wafer
Yield Die cost
386DX 2 0.90 $900 1.0 43 360 71% $4
486 DX2 3 0.80 $1200 1.0 81 181 54% $12
Power PC 601 4 0.80 $1700 1.3 121 115 28% $53
HP PA 7100 3 0.80 $1300 1.0 196 66 27% $73
DEC Alpha 3 0.70 $1500 1.2 234 53 19% $149
Super Sparc 3 0.70 $1700 1.6 256 48 13% $272
Pentium 3 0.80 $1500 1.5 296 40 9% $417
154EEC 116, B. Baas 154
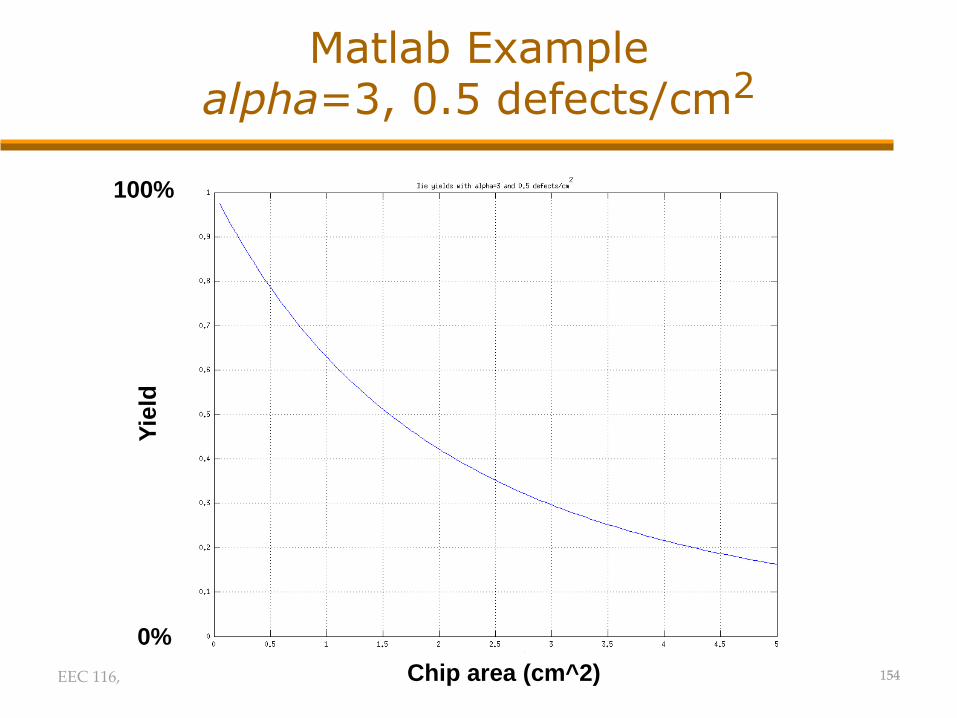
Matlab Example alpha=3, 0.5 defects/cm2
Yie
ld
Chip area (cm^2)
100%
0%
155EEC 116, B. Baas 155
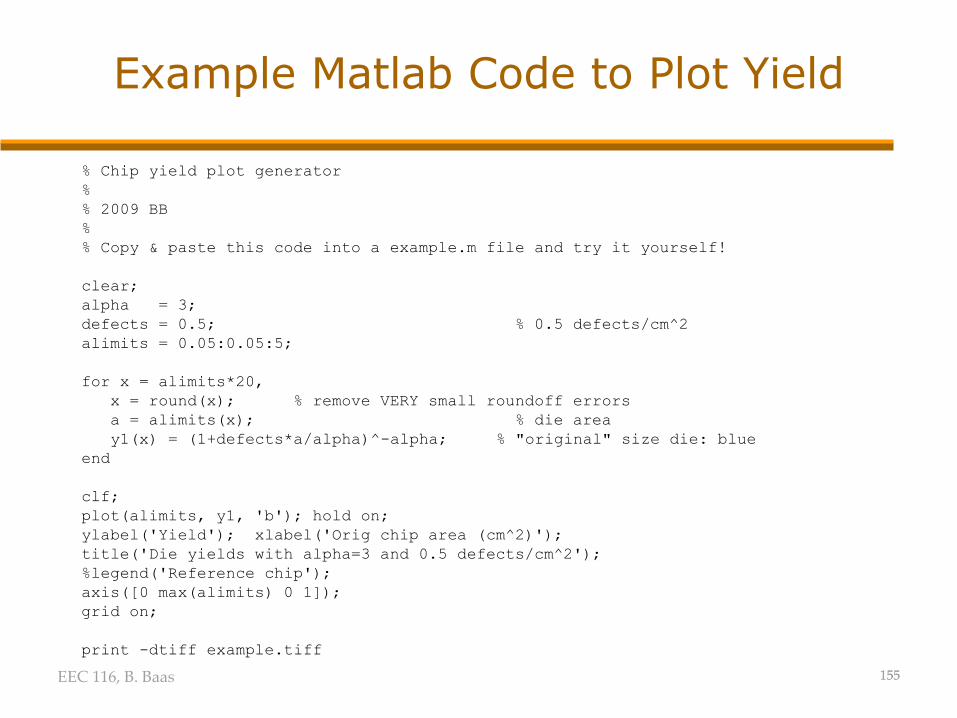
Example Matlab Code to Plot Yield
% Chip yield plot generator
%
% 2009 BB
%
% Copy & paste this code into a example.m file and try it yourself!
clear;
alpha = 3;
defects = 0.5; % 0.5 defects/cm^2
alimits = 0.05:0.05:5;
for x = alimits*20,
x = round(x); % remove VERY small roundoff errors
a = alimits(x); % die area
y1(x) = (1+defects*a/alpha)^-alpha; % "original" size die: blue
end
clf;
plot(alimits, y1, 'b'); hold on;
ylabel('Yield'); xlabel('Orig chip area (cm^2)');
title('Die yields with alpha=3 and 0.5 defects/cm^2');
%legend('Reference chip');
axis([0 max(alimits) 0 1]);
grid on;
print -dtiff example.tiff