cost-effectiveness of interventions for chronic ...€¦ · interventions for chronic obstructive...
TRANSCRIPT

Ontario Health Technology Assessment Series; Vol. 12: No. 12, pp. 1–61, March 2012
Cost-Effectiveness of Interventions for Chronic Obstructive Pulmonary Disease (COPD) Using an Ontario Policy Model
K Chandra, G Blackhouse, BR McCurdy, M Bornstein, K Campbell, V Costa, J Franek, K Kaulback, L Levin, S Sehatzadeh, N Sikich, M Thabane, R Goeree March 2012

Ontario Health Technology Assessment Series; Vol. 12: No. 12, pp. 1–61, March 2012 2
Suggested Citation This report should be cited as follows: Chandra K, Blackhouse G, McCurdy BR, Bornstein M, Campbell K, Costa V, Franek J, Kaulback K, Levin L, Sehatzadeh S, Thabane M, Sikich N, Goeree R. Cost-effectiveness of interventions for chronic obstructive pulmonary disease using an Ontario policy model. Ont Health Technol Assess Ser [Internet]. 2012 Mar; 12(12):1-61. Available from: www.hqontario.ca/en/mas/tech/pdfs/2012/rev_COPD_Economic_March.pdf Indexing The Ontario Health Technology Assessment Series is currently indexed in Excerpta Medica/EMBASE and the Center for Reviews and Dissemination database. Permission Requests All inquiries regarding permission to reproduce any content in the Ontario Health Technology Assessment Series should be directed to: [email protected]. How to Obtain Issues in the Ontario Health Technology Assessment Series All reports in the Ontario Health Technology Assessment Series are freely available in PDF format at the following URL: http://www.hqontario.ca/en/mas/mas_ohtas_mn.html. Conflict of Interest Statement All analyses in the Ontario Health Technology Assessment Series are impartial and subject to a systematic evidence-based assessment process. There are no competing interests or conflicts of interest to declare. Peer Review All analyses in the Ontario Health Technology Assessment Series are subject to external expert peer review. Additionally, the public consultation process is also available to individuals wishing to comment on an analysis prior to finalization. For more information, please visit: http://www.hqontario.ca/en/mas/ohtac_public_engage_overview.html.

Ontario Health Technology Assessment Series; Vol. 12: No. 12, pp. 1–61, March 2012 3
About the Medical Advisory Secretariat Effective April 5, 2011, the Medical Advisory Secretariat (MAS) became a part of Health Quality Ontario (HQO), an independent body funded by the Ministry of Health and Long-Term Care. The mandate of MAS is to provide evidence-based recommendations on the coordinated uptake of health services and health technologies in Ontario to the Ministry of Health and Long-Term Care and to the health care system. This mandate helps to ensure that residents of Ontario have access to the best available and most appropriate health services and technologies to improve patient outcomes. To fulfill its mandate, MAS conducts systematic reviews of evidence and consults with experts in the health care services community. The resulting evidence-based analyses are reviewed by the Ontario Health Technology Advisory Committee—to which MAS also provides a secretariat function—and published in the Ontario Health Technology Assessment Series. About the Ontario Health Technology Assessment Series To conduct its comprehensive analyses, MAS systematically reviews the available scientific literature, making every effort to consider all relevant national and international research; collaborates with partners across relevant government branches; consults with clinical and other external experts and developers of new health technologies; and solicits any necessary supplemental information. In addition, the Secretariat collects and analyzes information about how a new technology fits within current practice and existing treatment alternatives. Details about the technology’s diffusion into current health care practices add an important dimension to the review of the provision and delivery of the health technology in Ontario. Information concerning the health benefits; economic and human resources; and ethical, regulatory, social and legal issues relating to the technology assist decision-makers in making timely and relevant decisions to optimize patient outcomes. The public consultation process is available to individuals wishing to comment on an analysis prior to publication. For more information, please visit: http://www.hqontario.ca/en/mas/ohtac_public_engage_overview.html. Disclaimer This evidence-based analysis was prepared by MAS for the Ontario Health Technology Advisory Committee and developed from analysis, interpretation, and comparison of scientific research and/or technology assessments conducted by other organizations. It also incorporates, when available, Ontario data and information provided by experts and applicants to MAS to inform the analysis. While every effort has been made to reflect all scientific research available, this document may not fully do so. Additionally, other relevant scientific findings may have been reported since completion of the review. This evidence-based analysis is current to the date of the literature review specified in the methods section. This analysis may be superseded by an updated publication on the same topic. Please check the MAS website for a list of all evidence-based analyses: http://www.hqontario.ca/en/mas/mas_ohtas_mn.html.

Ontario Health Technology Assessment Series; Vol. 12: No. 12, pp. 1–61, March 2012 4
Table of Contents Table of Contents ........................................................................................................................................ 4
List of Tables ............................................................................................................................................... 6
List of Figures .............................................................................................................................................. 7
List of Abbreviations .................................................................................................................................. 8
Executive Summary .................................................................................................................................... 9 Background .................................................................................................................................................................. 10
Objective...................................................................................................................................................................... 10
Methods ....................................................................................................................................................................... 10
Results ......................................................................................................................................................................... 11
Conclusions ................................................................................................................................................................. 12
Purpose ...................................................................................................................................................... 13
Background ............................................................................................................................................... 15
Objective .................................................................................................................................................... 16
Economic Literature Review.................................................................................................................... 17 Literature Search.......................................................................................................................................................... 17
Economic Literature Review Results .......................................................................................................................... 17
Primary Economic Evaluation ................................................................................................................. 18 Cost-Effectiveness Analysis Method ........................................................................................................................... 18
Interventions Evaluated ...................................................................................................................................... 18
Target Population ............................................................................................................................................... 19
Perspective .......................................................................................................................................................... 20
Discounting and Time Horizon ........................................................................................................................... 20
Variability and Uncertainty ................................................................................................................................ 20
Generalizability .................................................................................................................................................. 20
Model Structure .................................................................................................................................................. 20
Model Input Parameters ..................................................................................................................................... 22
Cost-Effectiveness Analysis Results ........................................................................................................................... 32
Smoking Cessation Programs ............................................................................................................................. 35
Multidisciplinary Care Teams ............................................................................................................................ 37
Pulmonary Rehabilitation ................................................................................................................................... 38
Long-Term Oxygen Therapy ............................................................................................................................... 39
Ventilation Strategies .......................................................................................................................................... 40
Summary ............................................................................................................................................................. 41
Budget Impact Analysis—Ontario Perspective ...................................................................................... 42 Incidence and Prevalence of COPD............................................................................................................................. 42
Impacted Populations .................................................................................................................................................. 42
Smoking Cessation Programs ............................................................................................................................. 42
Multidisciplinary Care Teams ............................................................................................................................ 43
Pulmonary Rehabilitation ................................................................................................................................... 43
Long-Term Oxygen Therapy ............................................................................................................................... 44

Ontario Health Technology Assessment Series; Vol. 12: No. 12, pp. 1–61, March 2012 5
Ventilation Strategies .......................................................................................................................................... 44
Summary ............................................................................................................................................................. 44
Budget Impact Analysis Results .................................................................................................................................. 47
Limitations ................................................................................................................................................. 49
Conclusion ................................................................................................................................................. 50
Glossary ..................................................................................................................................................... 51
Acknowledgements ................................................................................................................................... 54
Appendices ................................................................................................................................................. 56 Appendix 1: Literature Search Strategy ....................................................................................................................... 56
References .................................................................................................................................................. 59

Ontario Health Technology Assessment Series; Vol. 12: No. 12, pp. 1–61, March 2012 6
List of Tables Table 1: The Four Stages of COPD Severity* ............................................................................................ 15 Table 2: COPD Interventions and Comparators Evaluated in the Primary Economic Model* .................. 19 Table 3: Starting Cohort Demographics Used in the COPD Model* ......................................................... 19 Table 4: Natural History Model Input Parameters by COPD Severity* ..................................................... 22 Table 5: Summary Estimates Used in the COPD Model* .......................................................................... 23 Table 6: Cost per Patient of Smoking Cessation Programs*† .................................................................... 25 Table 7: Cost per Visit with Multidisciplinary Care Teams*† ................................................................... 26 Table 8: Cost per Visit for a Short-Term Pulmonary Rehabilitation Program*† ....................................... 27 Table 9: Total Cost per Patient over the Duration of an Outpatient Pulmonary Rehabilitation Program* . 28 Table 10: Ministry of Health and Long-Term Care Expenditures on Long-Term Oxygen Therapy by
Fiscal Year* ................................................................................................................................... 29 Table 11: Most Responsible Diagnosis for COPD Restricted to Ventilation* ........................................... 29 Table 12: Costs and Assumptions Associated with NPPV versus UMC*† ................................................ 30 Table 13: Costs and Assumptions Associated with Weaning with NPPV versus Weaning with IMV*† .. 30 Table 14: Cost per Patient of Interventions Run in the COPD Model*† .................................................... 31 Table 15: COPD Model Results—Study Intervention Minus Usual Care/Placebo*† ................................ 33 Table 16: COPD Model Results—Probability of Cost-Effectiveness by Ceiling Ratio*† ......................... 41 Table 17: COPD Prevalence and Incidence in Ontario, 1996 to 2007* ...................................................... 42 Table 18: Assumptions Regarding Prevalent Patients Accessing Smoking Cessation Programs* ............. 42 Table 19: Assumptions Regarding Prevalent Patients Accessing Multidisciplinary Care Teams*† .......... 43 Table 20: Assumptions Regarding Prevalent Patients Accessing Pulmonary Rehabilitation* ................... 43 Table 21: Assumptions Regarding Prevalent Patients Accessing Long-Term Oxygen Therapy* .............. 44 Table 22: Assumptions Regarding Prevalent Patients Accessing Ventilation* .......................................... 44 Table 23: Impacted Populations for COPD Interventions in Ontario* ....................................................... 46 Table 24: Budget Impact Analyses of COPD Interventions*† ................................................................... 48

Ontario Health Technology Assessment Series; Vol. 12: No. 12, pp. 1–61, March 2012 7
List of Figures Figure 1: Structure of COPD Model* ......................................................................................................... 21 Figure 2: Structure of COPD Model—Modifications for Smoking Cessation Intervention Analyses* ..... 22 Figure 3: Cost-Effectiveness Acceptability of Intensive Counselling for Smoking Cessation*† ............... 35 Figure 4: Cost-Effectiveness Acceptability of Nicotine Replacement Therapy for Smoking Cessation*† 35 Figure 5: Cost-Effectiveness Acceptability of Intensive Counselling plus Nicotine Replacement Therapy
for Smoking Cessation*† ............................................................................................................... 36 Figure 6: Cost-Effectiveness Acceptability of Bupropion for Smoking Cessation*† ................................ 36 Figure 7: Cost-Effectiveness Acceptability of Multidisciplinary Care Teams (Base Case Cost)*† ........... 37 Figure 8: Cost-Effectiveness Acceptability of Multidisciplinary Care Teams (Varying Cost of Program
per Patient)*† ................................................................................................................................. 37 Figure 9: Cost-Effectiveness Acceptability of Pulmonary Rehabilitation (Base Case Cost)*† .................. 38 Figure 10: Cost-Effectiveness Acceptability of Pulmonary Rehabilitation (Varying Cost of Program per
Patient)*† ....................................................................................................................................... 38 Figure 11: Cost-Effectiveness Acceptability of Long-Term Oxygen Therapy*† ....................................... 39 Figure 12: Cost-Effectiveness Acceptability of Noninvasive Ventilation*† .............................................. 40 Figure 13: Cost-Effectiveness Acceptability of Weaning with Noninvasive Ventilation*† ....................... 40

Ontario Health Technology Assessment Series; Vol. 12: No. 12, pp. 1–61, March 2012 8
List of Abbreviations CCI Canadian Classification of Health Interventions
CEAC Cost-effectiveness acceptability curve
CI Confidence interval
COPD Chronic obstructive pulmonary disease
CPS Compendium of Pharmaceuticals and Specialties
CUA Cost-utility analysis
EBA Evidence-based analysis
FEV1 Forced expiratory volume in 1 second
FHT Family Health Team
FVC Forced vital capacity
FY Fiscal year
GOLD Global Initiative for Chronic Obstructive Lung Disease
GP General practitioner
IC Intensive counselling
ICD International Classification of Diseases
ICER Incremental cost-effectiveness ratio
ICU Intensive care unit
IMV Invasive mechanical ventilation
LOS Length of stay
LTOT Long-term oxygen therapy
MAS Medical Advisory Secretariat
MDC Multidisciplinary care
NPPV Noninvasive positive pressure ventilation
NRT Nicotine replacement therapy
OCCI Ontario Case Costing Initiative
ODB Ontario Drug Benefit
OSB Ontario Schedule of Physician Benefits
PR Pulmonary rehabilitation
QALY Quality-adjusted life-year
QOL Quality of life
RN Registered nurse
RR Relative risk
UC Usual care
UMC Usual medical care
WTP Willingness to pay

Ontario Health Technology Assessment Series; Vol. 12: No. 12, pp. 1–61, March 2012 9
Executive Summary
In July 2010, the Medical Advisory Secretariat (MAS) began work on a Chronic Obstructive Pulmonary Disease (COPD) evidentiary framework, an evidence-based review of the literature surrounding treatment strategies for patients with COPD. This project emerged from a request by the Health System Strategy Division of the Ministry of Health and Long-Term Care that MAS provide them with an evidentiary platform on the effectiveness and cost-effectiveness of COPD interventions.
After an initial review of health technology assessments and systematic reviews of COPD literature, and consultation with experts, MAS identified the following topics for analysis: vaccinations (influenza and pneumococcal), smoking cessation, multidisciplinary care, pulmonary rehabilitation, long-term oxygen therapy, noninvasive positive pressure ventilation for acute and chronic respiratory failure, hospital-at-home for acute exacerbations of COPD, and telehealth (including telemonitoring and telephone support). Evidence-based analyses were prepared for each of these topics. For each technology, an economic analysis was also completed where appropriate. In addition, a review of the qualitative literature on patient, caregiver, and provider perspectives on living and dying with COPD was conducted, as were reviews of the qualitative literature on each of the technologies included in these analyses.
The Chronic Obstructive Pulmonary Disease Mega-Analysis series is made up of the following reports, which can be publicly accessed at the MAS website at: http://www.hqontario.ca/en/mas/mas_ohtas_mn.html.
Chronic Obstructive Pulmonary Disease (COPD) Evidentiary Framework Influenza and Pneumococcal Vaccinations for Patients With Chronic Obstructive Pulmonary Disease
(COPD): An Evidence-Based Analysis Smoking Cessation for Patients With Chronic Obstructive Pulmonary Disease (COPD): An Evidence-
Based Analysis Community-Based Multidisciplinary Care for Patients With Stable Chronic Obstructive Pulmonary Disease
(COPD): An Evidence-Based Analysis Pulmonary Rehabilitation for Patients With Chronic Obstructive Pulmonary Disease (COPD): An
Evidence-Based Analysis Long-Term Oxygen Therapy for Patients With Chronic Obstructive Pulmonary Disease (COPD): An
Evidence-Based Analysis Noninvasive Positive Pressure Ventilation for Acute Respiratory Failure Patients With Chronic Obstructive
Pulmonary Disease (COPD): An Evidence-Based Analysis Noninvasive Positive Pressure Ventilation for Chronic Respiratory Failure Patients With Stable Chronic
Obstructive Pulmonary Disease (COPD): An Evidence-Based Analysis Hospital-at-Home Programs for Patients With Acute Exacerbations of Chronic Obstructive Pulmonary
Disease (COPD): An Evidence-Based Analysis Home Telehealth for Patients With Chronic Obstructive Pulmonary Disease (COPD): An Evidence-Based
Analysis Cost-Effectiveness of Interventions for Chronic Obstructive Pulmonary Disease Using an Ontario Policy
Model Experiences of Living and Dying With COPD: A Systematic Review and Synthesis of the Qualitative
Empirical Literature
For more information on the qualitative review, please contact Mita Giacomini at: http://fhs.mcmaster.ca/ceb/faculty_member_giacomini.htm.
For more information on the economic analysis, please visit the PATH website: http://www.path-hta.ca/About-Us/Contact-Us.aspx.
The Toronto Health Economics and Technology Assessment (THETA) collaborative has produced an associated report on patient preference for mechanical ventilation. For more information, please visit the THETA website: http://theta.utoronto.ca/static/contact.

Ontario Health Technology Assessment Series; Vol. 12: No. 12, pp. 1–61, March 2012 10
Background Chronic obstructive pulmonary disease (COPD) is characterized by chronic inflammation throughout the airways, parenchyma, and pulmonary vasculature. The inflammation causes repeated cycles of injury and repair in the airway wall—inflammatory cells release a variety of chemicals and lead to cellular damage. The inflammation process also contributes to the loss of elastic recoil pressure in the lung, thereby reducing the driving pressure for expiratory flow through narrowed and poorly supported airways, in which airflow resistance is significantly increased. Expiratory flow limitation is the pathophysiological hallmark of COPD. Exacerbations of COPD contribute considerably to morbidity and mortality, and impose a burden on the health care system. They are a leading cause of emergency room visits and hospitalizations, particularly in the winter. In Canada, the reported average cost for treating a moderate exacerbation is $641; for a major exacerbation, the cost is $10,086.
Objective The objective of this study was to evaluate the cost-effectiveness and budget impact of the following interventions in moderate to very severe COPD, investigated in the Medical Advisory Secretariat Chronic Obstructive Pulmonary Disease Mega-Analysis Series:
smoking cessation programs in moderate COPD in an outpatient setting:
– intensive counselling (IC) versus usual care (UC)
– nicotine replacement therapy (NRT) versus UC
– IC + NRT versus placebo
– bupropion versus placebo
multidisciplinary care (MDC) teams versus UC in moderate to severe COPD in an outpatient setting
pulmonary rehabilitation (PR) versus UC following acute exacerbations in moderate to severe COPD
long-term oxygen therapy (LTOT) versus UC in severe hypoxemia in COPD in an outpatient setting
ventilation:
– noninvasive positive pressure ventilation (NPPV) + usual medical care versus usual medical care in acute respiratory failure due to an acute exacerbation in severe COPD in an inpatient setting
– weaning with NPPV versus weaning with invasive mechanical ventilation in acute respiratory failure due to an acute exacerbation in very severe COPD in an inpatient setting
Methods A cost-utility analysis was conducted using a Markov probabilistic model. The model consists of different health states based on the Global Initiative for Chronic Obstructive Lung Disease COPD severity classification. Patients were assigned different costs and utilities depending on their severity health state during each model cycle. In addition to moving between health states, patients were at risk of acute exacerbations of COPD in each model cycle. During each cycle, patients could have no acute exacerbation, a minor acute exacerbation, or a major exacerbation. For the purposes of the model, a major

Ontario Health Technology Assessment Series; Vol. 12: No. 12, pp. 1–61, March 2012 11
exacerbation was defined as one that required hospitalization. Patients were assigned different costs and utilities in each model cycle, depending on whether they experienced an exacerbation, and its severity. Starting cohorts reflected the various patient populations from the trials analyzed. Incremental cost-effectiveness ratios (ICERs)—that is, costs per quality-adjusted life-year (QALY)—were estimated for each intervention using clinical parameters and summary estimates of relative risks of (re)hospitalization, as well as mortality and abstinence rates, from the COPD mega-analysis evidence-based analyses. A budget impact analysis was also conducted to project incremental costs already being incurred or resources already in use in Ontario. Using provincial data, medical literature, and expert opinion, health system impacts were calculated for the strategies investigated. All costs are reported in Canadian dollars.
Results All smoking cessation programs were dominant (i.e., less expensive and more effective overall). Assuming a base case cost of $1,041 and $1,527 per patient for MDC and PR, the ICER was calculated to be $14,123 per QALY and $17,938 per QALY, respectively. When the costs of MDC and PR were varied in a 1-way sensitivity analysis to reflect variation in resource utilization reported in the literature, the ICER increased to $55,322 per QALY and $56,270 per QALY, respectively. Assuming a base case cost of $2,261 per year per patient for LTOT as reported by data from the Ontario provincial program, the ICER was calculated to be $38,993 per QALY. Ventilation strategies were dominant (i.e., cheaper and more effective), as reflected by the clinical evidence of significant in-hospital days avoided in the study group. Ontario currently pays for IC through physician billing (translating to a current burden of $8 million) and bupropion through the Ontario Drug Benefit program (translating to a current burden of almost $2 million). The burden of NRT was projected to be $10 million, with future expenditures of up to $1 million in Years 1 to 3 for incident cases. Ontario currently pays for some chronic disease management programs. Based on the most recent Family Health Team data, the costs of MDC programs to manage COPD were estimated at $85 million in fiscal year 2010, with projected future expenditures of up to $51 million for incident cases, assuming the base case cost of the program. However, this estimate does not accurately reflect the current costs to the province because of lack of report by Family Health Teams, lack of capture of programs outside this model of care by any data set in the province, and because the resource utilization and frequency of visits/follow-up phone calls were based on the findings in the literature rather than the actual Family Health Team COPD management programs in place in Ontario. Therefore, MDC resources being utilized in the province are unknown and difficult to measure. Data on COPD-related hospitalizations were pulled from Ontario administrative data sets and based on consultation with experts. Half of hospitalized patients will access PR resources at least once, and half of these will repeat the therapy, translating to a potential burden of $17 million to $32 million, depending on the cost of the program. These resources are currently being absorbed, but since utilization is not being captured by any data set in the province, it is difficult to quantify and estimate. Provincial programs may be under-resourced, and patients may not be accessing these services effectively.

Ontario Health Technology Assessment Series; Vol. 12: No. 12, pp. 1–61, March 2012 12
Data from the LTOT provincial program (based on fiscal year 2006 information) suggested that the burden was $65 million, with potential expenditures of up to $0.2 million in Years 1 to 3 for incident cases. From the clinical evidence on ventilation (i.e., reduction in length of stay in hospital), there were potential cost savings to the hospitals of $42 million and $12 million for NPPV and weaning with NPPV, respectively, if the study intervention were adopted. Future cost savings were projected to be up to $4 million and $1 million, respectively, for incident cases.
Conclusions Currently, costs for most of these interventions are being absorbed by provider services, the Ontario Drug Benefit Program, the Assistive Devices Program, and the hospital global budget. The most cost-effective intervention for COPD will depend on decision-makers’ willingness to pay. Lack of provincial data sets capturing resource utilization for the various interventions poses a challenge for estimating current burden and future expenditures.

Ontario Health Technology Assessment Series; Vol. 12: No. 12, pp. 1–61, March 2012 13
Purpose
In July 2010, the Medical Advisory Secretariat (MAS) began work on a Chronic Obstructive Pulmonary Disease (COPD) evidentiary framework, an evidence-based review of the literature surrounding treatment strategies for patients with COPD. This project emerged from a request by the Health System Strategy Division of the Ministry of Health and Long-Term Care that MAS provide them with an evidentiary platform on the effectiveness and cost-effectiveness of COPD interventions.
After an initial review of health technology assessments and systematic reviews of COPD literature, and consultation with experts, MAS identified the following topics for analysis: vaccinations (influenza and pneumococcal), smoking cessation, multidisciplinary care, pulmonary rehabilitation, long-term oxygen therapy, noninvasive positive pressure ventilation for acute and chronic respiratory failure, hospital-at-home for acute exacerbations of COPD, and telehealth (including telemonitoring and telephone support). Evidence-based analyses were prepared for each of these topics. For each technology, an economic analysis was also completed where appropriate. In addition, a review of the qualitative literature on patient, caregiver, and provider perspectives on living and dying with COPD was conducted, as were reviews of the qualitative literature on each of the technologies included in these analyses.
The Chronic Obstructive Pulmonary Disease Mega-Analysis series is made up of the following reports, which can be publicly accessed at the MAS website at: http://www.hqontario.ca/en/mas/mas_ohtas_mn.html.
Chronic Obstructive Pulmonary Disease (COPD) Evidentiary Framework Influenza and Pneumococcal Vaccinations for Patients With Chronic Obstructive Pulmonary Disease
(COPD): An Evidence-Based Analysis Smoking Cessation for Patients With Chronic Obstructive Pulmonary Disease (COPD): An Evidence-
Based Analysis Community-Based Multidisciplinary Care for Patients With Stable Chronic Obstructive Pulmonary Disease
(COPD): An Evidence-Based Analysis Pulmonary Rehabilitation for Patients With Chronic Obstructive Pulmonary Disease (COPD): An
Evidence-Based Analysis Long-Term Oxygen Therapy for Patients With Chronic Obstructive Pulmonary Disease (COPD): An
Evidence-Based Analysis Noninvasive Positive Pressure Ventilation for Acute Respiratory Failure Patients With Chronic Obstructive
Pulmonary Disease (COPD): An Evidence-Based Analysis Noninvasive Positive Pressure Ventilation for Chronic Respiratory Failure Patients With Stable Chronic
Obstructive Pulmonary Disease (COPD): An Evidence-Based Analysis Hospital-at-Home Programs for Patients With Acute Exacerbations of Chronic Obstructive Pulmonary
Disease (COPD): An Evidence-Based Analysis Home Telehealth for Patients With Chronic Obstructive Pulmonary Disease (COPD): An Evidence-Based
Analysis Cost-Effectiveness of Interventions for Chronic Obstructive Pulmonary Disease Using an Ontario Policy
Model Experiences of Living and Dying With COPD: A Systematic Review and Synthesis of the Qualitative
Empirical Literature
For more information on the qualitative review, please contact Mita Giacomini at: http://fhs.mcmaster.ca/ceb/faculty_member_giacomini.htm.
For more information on the economic analysis, please visit the PATH website: http://www.path-hta.ca/About-Us/Contact-Us.aspx.
The Toronto Health Economics and Technology Assessment (THETA) collaborative has produced an associated report on patient preference for mechanical ventilation. For more information, please visit the THETA website: http://theta.utoronto.ca/static/contact.

Ontario Health Technology Assessment Series; Vol. 12: No. 12, pp. 1–61, March 2012 14
The Programs for Assessment of Technology in Health Research Institute was commissioned by the Medical Advisory Secretariat (MAS) of Health Quality Ontario to predict the long-term costs and effects, along with the cost-effectiveness, of interventions for the management and treatment of chronic obstructive pulmonary disease (COPD). This report summarizes the structure and inputs for the COPD economic model used to estimate the cost-effectiveness of the various treatment strategies, and it presents the results of the economic analyses for the following interventions: smoking cessation programs, multidisciplinary care, pulmonary rehabilitation, long-term oxygen therapy, and ventilation. Additionally, this report reviews published economic evaluations of these COPD interventions and presents estimates of the budget impact of implementing them. MAS conducts full evidence-based analyses (EBAs) of health technologies being considered for use in Ontario. These analyses are then presented to the Ontario Health Technology Advisory Committee, whose mandate is to provide evidence-based examination of proposed health technologies in the context of existing clinical practice and provide advice and recommendations to Ontario practitioners, the broader health care system, and the Ministry of Health and Long-Term Care.
DISCLAIMER: The Medical Advisory Secretariat (MAS) uses a standardized costing method for its economic analyses of interventions. The main cost categories and the associated methods from the province’s perspective are as follows:
Hospital: Ontario Case Costing Initiative (OCCI) cost data are used for in-hospital stay, emergency visit and day procedure costs for the designated International Classification of Diseases (ICD) diagnosis codes and Canadian Classification of Health Interventions (CCI) procedure codes. Adjustments may be required to reflect accuracy in estimated costs of the diagnoses and procedures under consideration. Due to the difficulties of estimating indirect costs in hospitals associated with a particular diagnosis or procedure, the Secretariat normally defaults to considering direct treatment costs only.
Non-hospital: These include physician services costs obtained from the Ontario Schedule of Benefits (OSB), laboratory fees from the Ontario Schedule of Laboratory Fees (OSLF), drug costs from the Ontario Drug Benefit Formulary (ODB), and device costs from the perspective of local health care institutions whenever possible or its manufacturer.
Discounting: For cost-effectiveness analyses, a discount rate of 5% is applied as recommended by economic guidelines.
Downstream costs: All numbers reported are based on assumptions on population trends (i.e., incidence, prevalence, and mortality rates), time horizon, resource utilization, patient compliance, health care patterns, market trends (i.e., rates of intervention uptake or trends in current programs in place in the province), and estimates on funding and prices. These may or may not be realized by the system or individual institutions and are often based on evidence from the medical literature, standard listing references, provincial data sets, and educated hypotheses from expert panels. In cases where a deviation from this standard is used, an explanation is offered as to the reasons, the assumptions, and the revised approach. The economic analysis represents an estimate only, based on the assumptions and costing methods that have been explicitly stated above. These estimates will change if different assumptions and costing methods are applied to the analysis.
NOTE: Numbers are rounded to the nearest decimal and are reported from an Excel spreadsheet.

Ontario Health Technology Assessment Series; Vol. 12: No. 12, pp. 1–61, March 2012 15
Background COPD is characterized by chronic inflammation throughout the airways, parenchyma, and pulmonary vasculature. This inflammation causes repeated cycles of injury and repair in the airway wall—inflammatory cells release a variety of chemicals and lead to cellular damage. (1;2) The inflammation process also contributes to the loss of elastic recoil pressure in the lung, thereby reducing the driving pressure for expiratory flow through narrowed and poorly supported airways, in which airflow resistance is significantly increased. (3) Expiratory flow limitation is the pathophysiological hallmark of COPD. The Global Initiative for Chronic Obstructive Lung Disease (GOLD) defines COPD as a preventable and treatable disease with numerous extrapulmonary effects that may contribute to the severity of disease in individual patients. (4) Its pulmonary component is characterized by airflow limitation that is not fully reversible. The GOLD criteria outline 4 stages of COPD severity, defined by postbronchodilator spirometry measures. These are shown in Table 1, along with a description of the symptoms a patient might experience. Table 1: The Four Stages of COPD Severity*
Stage FEV1 Value FEV1/FVC
Value Description
I: Mild ≥ 80% predicted < 0.70 The patient is probably unaware that lung function is starting to decline
II: Moderate 50% ≤ FEV1 < 80% predicted < 0.70 Symptoms during this stage progress, with shortness of breath developing upon exertion
III: Severe 30% ≤ FEV1 < 50% predicted < 0.70 Shortness of breath becomes worse at this stage, and COPD exacerbations are common
IV: Very severe < 30% predicted or < 50%
predicted plus chronic respiratory failure
< 0.70 Quality of life at this stage is considerably impaired; COPD exacerbations can be life-threatening
*Abbreviations: COPD, chronic obstructive pulmonary disease; FEV1, forced expiratory volume in 1 second; FVC, forced vital capacity. Source: Global Initiative for Chronic Obstructive Lung Disease, 2010 (4)
Exacerbations of COPD contribute considerably to morbidity and mortality, and impose a burden on the health care system. They are a leading cause of emergency room visits and hospitalizations, particularly in the winter. In Canada, the reported average cost for treating a moderate exacerbation is $641; for a major exacerbation, the cost is $10,086. (5)

Ontario Health Technology Assessment Series; Vol. 12: No. 12, pp. 1–61, March 2012 16
Objective The objective of this study was to evaluate the cost-effectiveness and budget impact of the following interventions in moderate to very severe COPD, investigated in the MAS Chronic Obstructive Pulmonary Disease Mega-Analysis series:
smoking cessation programs in moderate COPD in an outpatient setting:
– intensive counselling (IC) versus usual care (UC)
– nicotine replacement therapy (NRT) versus UC
– IC + NRT versus placebo
– bupropion versus placebo
multidisciplinary care (MDC) teams versus UC in moderate to severe COPD in an outpatient setting
pulmonary rehabilitation (PR) versus UC following acute exacerbations in moderate to severe COPD
long-term oxygen therapy (LTOT) versus UC in severe hypoxemia in COPD in an outpatient setting
ventilation:
– noninvasive positive pressure ventilation (NPPV) + usual medical care (UMC)1 versus UMC in acute respiratory failure due to an acute exacerbation in severe COPD in an inpatient setting
– weaning with NPPV versus weaning with invasive mechanical ventilation (IMV) in acute respiratory failure due to an acute exacerbation in very severe COPD in an inpatient setting
Only interventions that had high, moderate, or low quality evidence (based on the GRADE criteria (6)) with statistically significant differences in outcomes were evaluated in the economic model. COPD interventions that had very low quality evidence were excluded (i.e., vaccinations, hospital at home, home telehealth); the estimates of effect for these investigations were judged to be too uncertain to provide meaningful results. Technologies that were not effective or did not reach statistical significance based on the clinical evidence were also excluded from evaluation in the economic model.
1 Usual medical care is the term used for the medical treatment of patients with acute respiratory failure as an alternative to NPPV. Usual care is the generic term for the comparison group in other analyses.

Ontario Health Technology Assessment Series; Vol. 12: No. 12, pp. 1–61, March 2012 17
Economic Literature Review
Literature Search Economic literature searches were conducted for each intervention investigated in the COPD mega-analysis, and the following databases were searched: OVID MEDLINE, MEDLINE In-Process and Other Non-Indexed Citations, OVID EMBASE, Wiley Cochrane, CINAHL, Centre for Reviews and Dissemination/International Agency for Health Technology Assessment, and EconLit. The following criteria were considered when reviewing abstracts and extracting economic evaluations:
full economic evaluations (i.e., cost-utility analysis [CUA], cost-effectiveness analysis, cost-benefit analysis)
economic evaluations reporting total costs and benefits, or incremental cost-effectiveness ratios (ICERs) (i.e., cost per quality-adjusted life-year [QALY] per life years gained or cost per event avoided)
studies in patients with COPD
studies reporting on smoking cessation programs, MDC, PR, LTOT, or ventilation
studies in the English language
There was a large volume of cost analyses in the economic literature; therefore, a second literature search was conducted in July 2011 to investigate only CUAs, since the primary economic evaluation was a CUA. This second literature search is described in the appendix.
Economic Literature Review Results CUAs in COPD, published since 2009, were reviewed. Two articles were identified that described assessments of smoking cessation programs and MDC using the same COPD model. Hoogendoorn et al (7) estimated the long-term cost-effectiveness of smoking cessation interventions for patients with COPD. The 4 interventions assessed were UC, minimal counselling, IC, and IC + pharmacotherapy. A population model for COPD was used to predict the costs and benefits of these strategies compared to UC (for policy-making decisions). Abstinence rates were estimated to be 1.4% for UC, 2.6% for minimal counselling, 6.0% for IC, and 12.3% for IC + pharmacotherapy. Compared with UC, the costs per QALY gained for minimal counselling, IC, and IC + pharmacotherapy were €16,900, €8,200, and €2,400, respectively, over a 25-year time horizon. The authors concluded that IC + pharmacotherapy resulted in low costs per QALY gained, was cost-saving, and dominated the other interventions. The same group used the same policy model to assess MDC in COPD management. (8) The authors conducted the analysis alongside a 2 year randomized controlled trial, in which 199 patients were assigned to either the Interdisciplinary Community-Based COPD Management (INTERCOM) program or UC. The INTERCOM program consisted of exercise training, education, nutrition therapy, and smoking cessation counselling offered by community-based physiotherapists, dietitians, and hospital-based respiratory nurses. The authors found that the INTERCOM program significantly improved disease-specific quality of life (QOL), but did not affect exacerbation rates. The cost per QALY was estimated to be €32,425, and the authors concluded that this estimate was within the acceptable range.

Ontario Health Technology Assessment Series; Vol. 12: No. 12, pp. 1–61, March 2012 18
Primary Economic Evaluation The published economic evaluations identified in the literature review addressed only 2 of the interventions of interest (smoking cessation programs and MDC). Neither of these published studies took a Canadian perspective. Due to these limitations, primary economic evaluations of the COPD interventions of interest were conducted.
Cost-Effectiveness Analysis Method A CUA was conducted using a Markov probabilistic model for patients with COPD, based on the GOLD classification of disease severity. Cost per QALY allows the QOL impact of the COPD treatment interventions to be incorporated. The QALY is a measure of disease burden, including both the quality and quantity of life lived. (9) Perfect health is assigned a value of 1.0, and death is assigned a value of 0. Negative scores can be reported, indicating a situation considered to be worse than death. Health states not lived in full health are given a score/utility depending on how patients perceive their state. For example, if the patient would be blind or have to use a wheelchair, extra life-years are given a value to account for this. The weight values can be determined using time trade-off and standard gamble methods, visual analogue scales, and/or pre-existing indices (i.e., Health Utilities Index, EQ-5D). (9) The EQ-5D questionnaire, for example, categorizes health states according to the following dimensions: mobility, self-care, usual activities (e.g., work, study, homework, or leisure activities), pain/discomfort, and anxiety/depression. (9) The QALY is used in assessing the value for money of a medical intervention. The use of a common metric such as the cost per QALY outcome also allows for comparison with evaluations of different interventions (given similar population characteristics) and may be used to infer from other disease areas that report this standard outcome. The cost-effectiveness acceptability curve (CEAC) is a method for summarizing uncertainty in estimates of cost-effectiveness. Distributions are assigned to the summary estimates from the clinical evidence reviews, and CEACs are derived from the joint distribution of costs and effects, illustrating the Bayesian probability that the data may or may not be cost-effective, depending on a specified ceiling ratio that a decision-maker is willing to invest to achieve 1 unit of effectiveness. Interventions Evaluated
Separate evaluations were conducted for the various COPD interventions, compared to UC or placebo. UC was defined according to the trials investigated in the COPD mega-analysis. Table 2 summarizes the interventions evaluated by the economic model, along with the comparator for each intervention.

Ontario Health Technology Assessment Series; Vol. 12: No. 12, pp. 1–61, March 2012 19
Table 2: COPD Interventions and Comparators Evaluated in the Primary Economic Model*
Intervention Comparator
Smoking cessation programs
Intensive counselling Usual care
Nicotine replacement therapy Usual care
Intensive counselling + nicotine replacement therapy Placebo
Bupropion Placebo
Multidisciplinary care teams Usual care
Pulmonary rehabilitation Usual care
Long-term oxygen therapy Usual care
Ventilation strategies
Noninvasive positive pressure ventilation + usual medical care
Usual medical care
Weaning with noninvasive positive pressure ventilation Weaning with invasive mechanical ventilation
*Abbreviation: COPD, chronic obstructive pulmonary disease.
Target Population
The target population for the economic analyses was patients with moderate to very severe COPD. Cohorts differed in terms of sex, starting age, and starting COPD severity level. Cohort demographics were based on average characteristics described in the trials for each intervention. For further description on trial characteristics, please see individual EBAs from the COPD mega-analysis. Table 3 describes the starting cohorts for the COPD economic model. Table 3: Starting Cohort Demographics Used in the COPD Model*
Intervention Age, years Female, % Mild, % Moderate, % Severe, % Very severe, %
Smoking cessation programs
IC vs. UC 48 37 0 100 0 0
NRT vs. UC 48 37 0 100 0 0
IC + NRT vs. placebo 48 37 0 100 0 0
Bupropion vs. placebo 48 37 0 100 0 0
Multidisciplinary care teams
MDC vs. UC 68 12 0 50 50 0
Pulmonary rehabilitation
PR vs. UC 68 46 0 40 60 0
Long-term oxygen therapy
LTOT vs. UC 58 24 0 0 0 100
Ventilation strategies
NPPV + UMC vs. UMC 65 33 0 0 100 0
Weaning with NPPV versus weaning with IMV
64 30 0 0 0 100
*Abbreviations: COPD, chronic obstructive pulmonary disease; IC, intensive counselling; IMV, invasive mechanical ventilation; LTOT, long-term oxygen therapy; MDC, multidisciplinary care; NPPV, noninvasive positive pressure ventilation; NRT, nicotine replacement therapy; PR, pulmonary rehabilitation; UC, usual care; UMC, usual medical care.

Ontario Health Technology Assessment Series; Vol. 12: No. 12, pp. 1–61, March 2012 20
Populations varied with respect to disease severity and distribution of age and sex. Except for the smoking cessation interventions, trials largely reflected an elderly patient population (over 65 years of age) and a skewed distribution (higher proportion of males). Perspective
The analysis was taken from the perspective of a publicly funded health care system. Costs from this perspective included drugs covered by provincial formularies, inpatient costs described by the Ontario Case Costing Initiative (OCCI), (10) and physician fees and laboratory fees for services covered by provincial fee schedules. Indirect costs, such as productivity losses, were not considered in the analysis; the base case starting age was 65 years for most interventions, so productivity costs were assumed to be minimal. Costs to family members were beyond the scope of this analysis. All costs are reported in Canadian dollars. Discounting and Time Horizon
An annual discount rate of 5% was applied to both costs and QALYs as recommended by economic guidelines. (11) A lifelong time horizon was used in all analyses. Variability and Uncertainty
Variability and uncertainty were assessed using a probabilistic model and 1-way sensitivity analyses. The program costs of MDC and PR were varied in 1-way analyses. Model parameter uncertainty was assessed using probabilistic sensitivity analysis by assigning distributions around the point estimate. Results were presented in the form of CEACs showing the probability that the intervention would be cost-effective by ceiling ratio (i.e., willingness to pay [WTP] values). Generalizability
The findings of this economic analysis cannot be generalized to all patients with COPD. They may, however, be used to guide decision-making about the specific patient populations addressed in the trials investigated at MAS. Model Structure
Because COPD is a chronic progressive disease, a Markov model was used for the analyses. The overall structure of the model, including the transitions between health states, is presented in Figure 1. The circles in the diagram represent different health states based on the GOLD COPD severity classification, and the arrows show the possible patient transitions in a given model cycle. The circular arrows represent cycling within a health state until transition to the next state. Severity is defined by forced expiratory volume in 1 second (FEV1) as a percentage of predicted FEV1. The 4 severity-based health states in the model are mild (FEV1 ≥ 80%), moderate (50% ≤ FEV1 < 80%), severe (30% ≤ FEV1 < 50%), and very severe (FEV1
<30%). Patients were assigned different costs and utilities depending on their severity health state during each model cycle. In addition to moving between health states, patients were at risk of acute exacerbations of COPD in each model cycle: they could have no acute exacerbation, a minor acute exacerbation, or a major exacerbation. For the purposes of the model, a major exacerbation was defined as one that required hospitalization. Patients suffering a major exacerbation were at risk of inpatient death. Patients were assigned different

Ontario Health Technology Assessment Series; Vol. 12: No. 12, pp. 1–61, March 2012 21
costs and utilities in each model cycle, depending on whether they experienced an exacerbation, and its severity.
Figure 1: Structure of COPD Model*
Figure 2 describes up-front modifications to the model structure made for the analyses of smoking cessation interventions. These modifications were made because the original model structure could not accommodate smoking abstinence rates—the primary outcome evaluated in the literature review for the smoking cessation EBA. As shown in Figure 2, a proportion of the cohort was assumed to have successfully quit smoking (quitters), while a proportion of patients continued to smoke (non-quitters). The proportion of quitters was based on abstinence rates reported in the smoking cessation trials. Quitters and non-quitters were treated differently in the model in 2 ways. First, quitters were assigned a reduction in overall mortality throughout the lifetime model, while non-quitters are assumed to have the same background mortality as the unmodified COPD model. Second, quitters were assumed to have different annual reductions in FEV1 throughout the model. These differences in FEV1 change affected the progress of patients to worse COPD health states.
Mild, moderate, severe, and very severe COPD based on Global Initiative for Chronic Obstructive Lung Disease (GOLD) staging, which in turn, is based on postbronchodilator spirometry. In the GOLD system, there are 4 stages that range from I to IV. (For more detailed descriptions, see Table 1). *Abbreviations: COPD, chronic obstructive pulmonary disease; FEV1, forced expiratory volume in 1 second.

Ontario Health Technology Assessment Series; Vol. 12: No. 12, pp. 1–61, March 2012 22
Figure 2: Structure of COPD Model—Modifications for Smoking Cessation Intervention Analyses*
Model Input Parameters
A number of different input parameters were used to populate the model. These include variables used to model the natural history of the disease and variables that modify the natural history model to account for treatment effects and costs of the COPD interventions being evaluated. Natural History Model Input Parameters Several input parameters were used to model the natural history of COPD: the annual probability of minor and major exacerbations by COPD severity; QOL utility values by COPD severity; and annual maintenance costs (i.e., clinical visits and drugs) (Table 4). The disutilities from major and minor exacerbations were assumed to be 0.042 (12) and 0.010, (12) respectively. The relative risk of mortality for COPD patients compared to the general population was assumed to be 3.3 (95% confidence interval [CI] 3.1–3.6), (13) and the costs of a major and minor exacerbation were assumed to be $10,086 and $212, respectively. (5) Costs and QALYs derived using the natural history model input parameters were also used for the UC/placebo comparators. Table 4: Natural History Model Input Parameters by COPD Severity*
Model Parameter Mild Moderate Severe Very Severe
Annual total exacerbation rate (95% CI) (14) 0.82
(0.46–1.49)
1.17
(0.93–1.50)
1.61
(1.51–1.74)
2.1
(1.51–2.94)
Annual major exacerbation rate (95% CI) (14) 0.11
(0.02–1.49)
0.16
(0.07–0.33)
0.22
(0.20–0.23)
0.28
(0.14–0.63)
No exacerbation–utility value (12;15) 0.85 0.81 0.76 0.66
Annual maintenance cost (16) $500 $500 $1,488 $2,176
*Abbreviations: CI, confidence interval; COPD, chronic obstructive pulmonary disease.
Modifications to the COPD Model (Figure 1) to accommodate smoking abstinence rates, the primary outcome in the smoking cessation evidence-based analysis *Abbreviations: COPD, chronic obstructive pulmonary disease; FEV1, forced expiratory volume in 1 second.

Ontario Health Technology Assessment Series; Vol. 12: No. 12, pp. 1–61, March 2012 23
Treatment Effect Model Input Parameters Treatment effect model input parameters were derived from the EBAs in the COPD mega-analysis. The treatment effect varied by COPD intervention. For smoking cessation interventions, abstinence rate was the treatment effect implemented in the model, and pooled abstinence rates for UC and placebo were 5.6% and 7.2%, respectively. The long-term benefits of smoking cessation were extracted from the Lung Health Study, (17) a long-term randomized controlled trial in which COPD smokers were randomized to receive UC, IC, or pharmacotherapy. The trial compared those who remained sustained quitters to those who were continuing smokers after 11 years of follow-up. The significant mortality benefit of quitting smoking was reported to be 0.54. The significant improvement in lung function was reported as a change in FEV1, as described below:
first year: quitters = +4.87 mL; non-quitters = −6.81 mL
second year and beyond: quitters = −2.86 mL; non-quitters = −6.19 mL
These inputs, along with the abstinence rates derived from the MAS EBA, were used in the model to predict the long-term benefits of smoking cessation. The relative risk (RR) of major exacerbation (rehospitalization) was used in the analyses of MDC and PR. The RR of all-cause mortality was used to model LTOT. The RR of inpatient mortality was used to model ventilation. Table 5 provides a summary of the clinical treatment effects by intervention, derived from the individual EBAs.
Table 5: Summary Estimates Used in the COPD Model*
Intervention Population Outcome Relative Risk
(95% CI) Quality of Evidence
Effect Duration
Smoking cessation programs
IC vs. UC Stable COPD Abstinence 7.70 (4.64–12.79) Moderate Lifetime
NRT vs. UC Stable COPD Abstinence 3.01 (1.02–8.89) Moderate Lifetime
IC + NRT vs. placebo Stable COPD Abstinence 4.41 (3.60–5.39) Moderate Lifetime
Bupropion vs. placebo Stable COPD Abstinence 2.01 (1.24–3.24) Moderate Lifetime
Multidisciplinary care teams
MDC vs. UC Stable COPD Rehospitalization 0.67 (0.52–0.87) Moderate 1 year
Pulmonary rehabilitation
PR vs. UC Acute COPD Rehospitalization 0.41 (0.18–0.93) Moderate 1 year
Long-term oxygen therapy
LTOT vs. UC Stable COPD All-cause mortality 0.68 (0.46–1.0) Low Lifetime
Ventilation strategies
NPPV + UMC vs. UMC Acute COPD Inpatient mortality 0.53 (0.35–0.81) Moderate 1 episode
Weaning with NPPV vs. weaning with IMV
Acute COPD Inpatient mortality 0.47 (0.23–0.97) Moderate 1 episode
*Abbreviations: CI, confidence interval; COPD, chronic obstructive pulmonary disease; IC, intensive counselling; IMV, invasive mechanical ventilation; LTOT, long-term oxygen therapy; MDC, multidisciplinary care; NPPV, noninvasive positive pressure ventilation; NRT, nicotine replacement therapy; PR, pulmonary rehabilitation; UC, usual care; usual medical care.
Individual RRs were compared to different control groups (i.e., UC or placebo), depending on the inclusion criteria of the individual EBA. For further details on the comparisons, please see the individual EBAs.

Ontario Health Technology Assessment Series; Vol. 12: No. 12, pp. 1–61, March 2012 24
Intervention Cost Model Input Parameters All intervention costs were based on resources reported in the medical literature, consultation with an expert panel, and consultation with Ministry of Health and Long-Term Care whenever an existing program was available in Ontario. Baseline costs in the model were assumed to be UC or placebo for all interventions, except for smoking cessation programs, in which UC was assumed to be a family physician visit. Ventilation strategies (both intervention and comparator) were costed based on average length of stay (LOS) in hospital, since hospital costs are reported per diem based on the case costing for the ventilation episode in acute COPD. Total costs included all costs directly related to the provision of care: nursing (operating room and intensive care unit), diagnostic imaging, pharmacy, and laboratory tests. Ventilator acquisition costs were not included as an amortized portion, and assumptions were not made regarding clinical visits by specialists. Smoking Cessation Programs Resources for smoking cessation programs were identified from the trials investigated in the smoking cessation EBA, and included pharmacotherapy and health care professional counselling. Bupropion was costed from the Ontario Drug Benefit (ODB) formulary (18) based on a typical regimen for smoking cessation (maximum of 12 weeks) as per the product monograph in the 2009 Compendium of Pharmaceuticals and Specialties (CPS). (19) NRT costs were also based on a typical regimen (maximum of 6 months) from the CPS, and the cost of NRT was obtained from the manufacturer pricing list from an Internet source. (20) Counselling was costed based on physician billing in the Ontario Schedule of Physician Benefits (OSB). (21) IC was defined in the smoking cessation EBA as ≥ 90 minutes of counselling with a health care professional (MAS EBA), such as a general practitioner (GP). Nurses could also conduct the counselling. Based on expert opinion (Personal communication, Expert Panel, March 2011), IC was assumed to be 3 GP counselling sessions of 30 minutes each, with costing based on the OSB. UC was defined as a single physician visit (based on trial data) and was also costed based on the OSB. The program costs per patient and the assumptions used to calculate these costs are presented in Table 6.

Ontario Health Technology Assessment Series; Vol. 12: No. 12, pp. 1–61, March 2012 25
Table 6: Cost per Patient of Smoking Cessation Programs*†
Intervention Cost per Patient
Assumptions Sources
UC $35.40 UC = 1 GP visit at $33.50; pamphlets/ manuals included in the visit cost
Program from MAS EBA; cost from A004 OSB (21)
IC $165.15 Smoking cessation counselling is billed to the province; minimal counselling = 30 minutes at $55.05 and IC = at least 90 minutes at $55.05 x 3 = $165.15; pamphlets/manuals included in the visit cost
Program from expert panel‡; cost from KO13 OSB (21)
NRT $203.34 NRT was costed based on a typical regimen of Nicorette gum (i.e., 10–12 pieces a day in the first month; every 2–4 hours [6 pieces a day] in the second month; and every 4–8 hours [3 pieces a day] in the third month, up to 6 months). Costed up to 6 months at $22.15/pack (100 4 mg pieces = $0.2215/piece)
Regimen from 2009 CPS (19); cost from manufacturer (20)
IC + NRT $368.49 Individual costs for IC and NRT, above —
Bupropion $37.92 Bupropion was costed based on a typical regimen (i.e., 150 mg/day in the first 3 days, then 300 mg/day for a minimum of 7 weeks, up to a maximum of 12 weeks). Costed up to 12 weeks at $0.2298/150 mg tablet
Regimen from 2009 CPS (19); cost from ODB formulary (18)
*Abbreviations: CPS, Compendium of Pharmaceuticals and Specialties; EBA, evidence-based analysis; GP, general practitioner; IC, intensive counselling; MAS, Medical Advisory Secretariat; NRT, nicotine replacement therapy; ODB, Ontario Drug Benefit; OSB, Ontario Schedule of Physician Benefits; UC, usual care.
†All costs are reported in Canadian dollars.
‡Personal communication, Expert Panel, March 2011.
All resources reported for smoking cessation programs (i.e., counselling and pharmacotherapy) are currently reimbursed by the province/Ministry of Health and Long-Term Care through OSB and ODB. NRT is now being offered through participating Family Health Teams (FHTs), combined with counselling. Coverage was announced in early 2011, while this analysis was being conducted (http://news.ontario.ca/mhp/en/2011/01/helping-more-ontarians-quit-smoking.html; accessed December 2011). Multidisciplinary Care Teams Resources reported in the trials investigated in the MDC EBA were costed and totalled for each trial. Total costs were then averaged to calculate a cost per patient over 6 to 12 months. Resources varied and included visits with GPs, dietitians, social workers, physiotherapists, respiratory nurses, and pharmacists. Resource utilization and frequency of visits and/or follow-up phone calls also varied between trials, and reporting was inconsistent; assumptions were made to quantify utilization whenever data inconsistencies were encountered. Health care professional costs were obtained from the OSB and the Guide to Interdisciplinary Provider Compensation (22) for FHTs in Ontario. Table 7 describes the proportion of trials that reported the use of health care professionals and the unit cost associated with each visit. The frequency of visits was also obtained from the trials investigated. A total cost for the duration of the program was calculated and divided by the number of programs to obtain a program cost per patient of $1,041 ($427–$3,049). Costs were not weighted based on the trials reporting the resource, because only 6 trials were extracted for

Ontario Health Technology Assessment Series; Vol. 12: No. 12, pp. 1–61, March 2012 26
MDC, but the weights are shown in Table 7 to show resource utilization. The cost of a MDC program was also varied in a 1-way sensitivity analysis using the maximum value of $3,049 per patient to reflect the differences in resource utilization reported in the trials. Table 7: Cost per Visit with Multidisciplinary Care Teams*†
Health Care Professional
Trials Reporting
Resource, %
Visit Cost
Assumptions Sources
Dietitian 17 $29.91 Average maximum salary of a dietitian from a FHT reimbursed by the Ministry of Health and Long-Term Care for a 40 hour week ($62,219)
FHT guide (22)
General practitioner
67 $35.40 General re-assessment visit A004 OSB (21)
Nurse 50 $35.80 COPD case manager (RN) Mitmann et al (5)
Pharmacist 33 $42.73 Average maximum salary of a pharmacist from a FHT reimbursed by the Ministry of Health and Long-Term Care for a 40 hour week ($88,869)
FHT guide (22)
Physiotherapist 17 $32.00 Same salary as an occupational therapist from a FHT reimbursed by the Ministry of Health and Long-Term Care for a 40 hour week ($66,568)
FHT guide (22)
Respiratory therapist
33 $32.00 Same salary as an occupational therapist from a FHT reimbursed by the Ministry of Health and Long-Term Care for a 40 hour week ($66,568)
FHT guide (22)
Respirologist 17 $148.95 Consult with a respiratory disease specialist
A475 OSB (21)
Social worker 17 $32.00 Average maximum salary of a social worker from a FHT reimbursed by the Ministry of Health and Long-Term Care for a 40 hour week ($66,568)
FHT guide (22)
*Abbreviations: COPD, chronic obstructive pulmonary disease; FHT, Family Health Team; OSB, Ontario Schedule of Physician Benefits; RN, registered nurse.
†All costs are reported in Canadian dollars.
All resources reported in MDC (i.e., health care professional visits) are currently reimbursed by the Ministry of Health and Long-Term Care through FHTs and/or services listed in the OSB. Because utilization of these resources is not being captured by specific data sets for COPD, they are difficult to quantify.

Ontario Health Technology Assessment Series; Vol. 12: No. 12, pp. 1–61, March 2012 27
Pulmonary Rehabilitation Resources were costed based on a Toronto paper (23) that characterized PR programs in Canada, and an average cost per patient was calculated for short-term (average 4 weeks) outpatient treatment following an acute exacerbation. Resource utilization varied by province and setting. Costs were obtained from the OSB (21) and the Guide to Interdisciplinary Provider Compensation (22) and are reported in Table 8. Table 8: Cost per Visit for a Short-Term Pulmonary Rehabilitation Program*†
Resource Visit Cost Assumptions Sources
Dietitian $29.91 Average maximum salary of a dietitian from a FHT reimbursed by the Ministry of Health and Long-Term Care for a 40 hour week ($62,219)
FHT guide (22)
General practitioner $35.40 GP general re-assessment visit A004 OSB (21)
Manager/director $35.40 GP is manager/director of program A004 OSB (21)
Nurse $35.80 COPD case manager (RN) Mitmann et al (5)
Occupational therapist $32.00 Average maximum salary of an occupational therapist from a FHT reimbursed by the Ministry of Health and Long-Term Care for a 40 hour week ($66,568)
FHT guide (22)
Pharmacist $42.73 Average maximum salary of a pharmacist from a FHT reimbursed by the Ministry of Health and Long-Term Care for a 40 hour week ($88,869)
FHT guide (22)
Physiotherapist $32.00 Same salary as an occupational therapist from a FHT reimbursed by the Ministry of Health and Long-Term Care for a 40 hour week ($66,568)
FHT guide (22)
Respiratory therapist $32.00 Same salary as an occupational therapist from a FHT reimbursed by the Ministry of Health and Long-Term Care for a 40 hour week ($66,568)
FHT guide (22)
Respirologist $148.95 Consult with a respiratory disease specialist A475 OSB (21)
Social worker $32.00 Average maximum salary of a social worker from a FHT reimbursed by the Ministry of Health and Long-Term Care for a 40 hour week ($66,568)
FHT guide (22)
*Abbreviations: COPD, chronic obstructive pulmonary disease; GP, general practitioner; FHT, Family Health Team; OSB, Ontario Schedule of Physician Benefits; RN, registered nurse.
†All costs are reported in Canadian dollars.
Close to 100 programs were evaluated in the paper, providing a fair estimate of resource utilization by setting. (23) Costs were therefore weighted by setting and resource utilization to calculate a cost per patient for each resource in each setting. The authors also reported the mean (minimum, maximum) duration of a PR program. Table 9 provides an estimate of the total cost per patient over the duration of a PR program, assuming an outpatient setting.

Ontario Health Technology Assessment Series; Vol. 12: No. 12, pp. 1–61, March 2012 28
Table 9: Total Cost per Patient over the Duration of an Outpatient Pulmonary Rehabilitation Program*
Parameter Cost per Patient
Total cost per hour $39.55
Mean hours per session 1.8
Mean number of sessions per week 5.5
Mean duration, weeks (minimum, maximum) 3.9 (1.7, 6.1)
Mean cost of program (minimum, maximum) $1,526.92 ($665.58, $2,388.26)
*All costs are reported in Canadian dollars.
Source: Brooks et al, 2007 (23)
PR programs can be resource-intensive, (23) so resource costs can run high. The cost of a PR program was varied in the COPD model in a 1-way sensitivity analysis using the value of $2,863 per patient reported by Brooks et al (23) to reflect potential differences in resource utilization. All resources reported in PR (i.e., health care professional visits) are currently reimbursed by the Ministry of Health and Long-Term Care or by the hospital global budget, depending on whether the program is outpatient or inpatient. PR resource utilization is not being captured properly in Ontario, and is therefore difficult to estimate. Long-Term Oxygen Therapy Ontario has a provincial program that provides LTOT to patients with severe hypoxemia. Based on the latest data provided by the Assistive Devices Program of the Ministry of Health and Long-Term Care, the average annual cost per patient for LTOT was $2,261 in fiscal year (FY) 2006 (Personal communication, Ministry of Health and Long-Term Care, January 2011). Resources offered through the program include the following: home assessment, 24 hour emergency service, maintenance and repair, training and education, oxygen supply system, and disposables (i.e., nasal cannula, tubing). It was assumed that LTOT costs would be incurred annually, since patients were assumed to stay on LTOT indefinitely. Table 10 describes the annual expenditures associated with LTOT for FYs 1997 to 2006.

Ontario Health Technology Assessment Series; Vol. 12: No. 12, pp. 1–61, March 2012 29
Table 10: Ministry of Health and Long-Term Care Expenditures on Long-Term Oxygen Therapy by Fiscal Year*
Fiscal Year Patients, n Total Expenditure Average Cost per Patient
1997/1998 20,740 $57,664,896 $2,780.37
1998/1999 20,589 $59,493,393 $2,889.57
1999/2000 22,785 $63,294,833 $2,777.92
2000/2001 21,507 $59,589,042 $2,770.68
2001/2002 20,632 $51,338,684 $2,488.30
2002/2003 22,627 $54,398,158 $2,404.13
2003/2004 22,522 $53,987,252 $2,397.09
2004/2005 25,085 $58,653,537 $2,338.19
2005/2006 25,478 $59,908,932 $2,351.40
2006/2007 28,654 $64,792,268 $2,261.19
*All costs are reported in Canadian dollars.
Source: Assistive Devices Program (Personal communication, Ministry of Health and Long-Term Care, January 2011).
Ventilation Strategies Two in-hospital ventilation strategies were investigated: NPPV versus UMC and weaning with NPPV versus weaning with IMV. Because these strategies were delivered within a hospital setting and patients remained over an average LOS, the hospital event was costed, rather than the intervention alone. OCCI (10) is a standard data set for hospitalization costs in the province based on most responsible diagnosis codes (International Classification of Diseases, 10th edition) and principal procedure codes (Canadian Classification of Health Interventions [CCI]). Codes were identified via the Canadian Institute for Health Information (24) and are reported in Table 11. Table 11: Most Responsible Diagnosis for COPD Restricted to Ventilation*
Codes Description
Most responsible diagnosis codes (ICD-10)
J440 COPD with acute lower respiratory infection
J441 COPD with acute exacerbation unspecified
J448 Other specified COPD
J449 COPD unspecified
Principal procedure codes (CCI)
1GZ31CAND Invasive ventilation
1GZ31CBND Noninvasive ventilation
*Abbreviations: CCI, Canadian Classification of Health Interventions; COPD, chronic obstructive pulmonary disease; ICD-10, International Classification of Diseases, 10th edition. Source: Canadian Institute for Health Information, 2006 (24).

Ontario Health Technology Assessment Series; Vol. 12: No. 12, pp. 1–61, March 2012 30
Based on these codes, the weighted average direct cost per diem for invasive and noninvasive ventilation in COPD were obtained from the most recent acute inpatient OCCI data (10) (i.e., FY 2008). The cost for UC for a COPD hospitalization was obtained from the Canadian literature: (5)
invasive ventilation: $1,679 per diem
noninvasive ventilation: $864 per diem
usual medical care: $1,009 per diem Direct costs included resources related to the provision of care, such as nursing care, operating room, intensive care unit, diagnostic imaging, pharmacy, and laboratory tests. Ventilator acquisition costs were not estimated. Indirect costs were also excluded from the analysis and included overhead expenses relating to the running of hospitals, such as administration, finance, human resources, and plant operations. Based on the average LOS reported in the trials investigated in the ventilation EBAs, total costs for the hospitalization episode of each arm were calculated and reported. There were cost savings for both ventilation strategies versus their comparators, since ventilated patients stayed in hospital for fewer days. Assumptions and total costs per patient are reported in Tables 12 and 13. Table 12: Costs and Assumptions Associated with NPPV versus UMC*†
Intervention Cost per
Diem LOS, days Total Cost Assumptions Sources
NPPV $863.98 7.32 $6,324.33 Based on MAS EBA, there is a significant reduction of 2.86 days in LOS with NPPV vs. UC
OCCI (10)
UMC $1,008.60 10 $10,086.00 Average LOS of 10 days and cost from Canadian literature
Mittman et al (5)
Difference NPPV–UC
−$144.62 −2.68 −$3,761.67 — —
*Abbreviations: EBA, evidence-based analysis; LOS, length of stay; MAS, Medical Advisory Secretariat; OCCI, Ontario Case Costing Initiative; NPPV, noninvasive positive pressure ventilation; UMC, usual medical care.
†All costs are reported in Canadian dollars.
Table 13: Costs and Assumptions Associated with Weaning with NPPV versus Weaning with
IMV*†
Intervention Cost per
Diem ICU, days
IMV, days
NPPV, days
UC, days
Total Cost Assumptions
Weaning with NPPV
$863.98 11.4 7.98 3.40 — $16,332.95 Weighted ICU LOS from MAS EBA; days not spent on IMV were spent on NPPV in ICU
Weaning with IMV
$1,678.56 16.6 11.5 — 5.06 $24,464.09 Weighted ICU LOS from MAS EBA; days not spent on IMV were spent on UC in ICU
Difference NPPV–IMV
−$814.58 −5.2 −3.52 — — −$8,131.14 —
*Abbreviations: EBA, evidence-based analysis; ICU, intensive care unit; IMV, invasive mechanical ventilation; LOS, length of stay; MAS, Medical Advisory Secretariat; NPPV, noninvasive positive pressure ventilation; UC, usual care.
†All costs are reported in Canadian dollars.
Source: Ontario Case Costing Initiative, 2011 (10).

Ontario Health Technology Assessment Series; Vol. 12: No. 12, pp. 1–61, March 2012 31
All resources reported in the ventilation strategies are currently absorbed by the hospital global budget; averages are reported above. Summary Costs per patient associated with each intervention run in the COPD economic model are summarized in Table 14. Table 14: Cost per Patient of Interventions Run in the COPD Model*†
Intervention Duration of Intervention
Cost of Intervention per Patient
Perspective Frequency of
Cost per Patient
Smoking cessation programs
UC 6–12 months $35.40 Ministry of Health and Long-Term Care
1-time cost
IC vs. UC 6–12 months $165.15 Ministry of Health and Long-Term Care
1-time cost
NRT vs. UC 6–12 months $203.34 Ministry of Health and Long-Term Care
1-time cost
IC + NRT vs. placebo 6–12 months $368.49 Ministry of Health and Long-Term Care
1-time cost
Bupropion vs. placebo 6–12 months $37.92 Ministry of Health and Long-Term Care
1-time cost
Multidisciplinary care teams
MDC vs. UC 6–12 months $1,041.03 Ministry of Health and Long-Term Care
1-time cost
MDC vs. UC, sensitivity analysis
6–12 months $3,048.88 Ministry of Health and Long-Term Care
1-time cost
Pulmonary rehabilitation
PR vs. UC 6–12 months $1,526.92 Ministry of Health and Long-Term Care or hospital
1-time cost
PR vs. UC, sensitivity analysis
6–12 months $2,863.19 Ministry of Health and Long-Term Care or hospital
1-time cost
Long-term oxygen therapy
LTOT vs. UC Continuous $2,261.19 Ministry of Health and Long-Term Care
Annual cost
Ventilation strategies
NPPV + UMC vs. UMC
Cost of NPPV Hospital stay $6,324.33 Hospital 1-time cost
Cost of UMC Hospital stay $10,086.00 Hospital 1-time cost
Weaning with NPPV vs. weaning with IMV
Cost of weaning with NPPV Hospital stay $16,332.95 Hospital 1-time cost
Cost of weaning with IMV Hospital stay $24,464.09 Hospital 1-time cost
*Abbreviations: COPD, chronic obstructive pulmonary disease; IC, intensive counselling; IMV, invasive mechanical ventilation; LTOT, long-term oxygen therapy; MDC, multidisciplinary care; NPPV, noninvasive positive pressure ventilation; NRT, nicotine replacement therapy; PR, pulmonary rehabilitation; UC, usual care; UMC, usual medical care.
†All costs are reported in Canadian dollars.

Ontario Health Technology Assessment Series; Vol. 12: No. 12, pp. 1–61, March 2012 32
Cost-Effectiveness Analysis Results Table 15 describes the total lifetime incremental costs, life years, and QALYs for an intervention and its comparator. Also shown are the incremental cost per life year and cost per QALY.

Ontario Health Technology Assessment Series; Vol. 12: No. 12, pp. 1–61, March 2012 33
Table 15: COPD Model Results—Study Intervention Minus Usual Care/Placebo*†
Intervention Incremental Intervention
Cost
Incremental Hospital
Cost
Incremental Maintenance
Cost Total
Incremental Life Years
Incremental QALYs
Cost per Life Year
Cost per QALY
Smoking cessation programs
IC vs. UC $130 −$597 −$1,778 −$2,245 0.62 0.58 Dominates Dominates
NRT vs. UC $203 −$285 −$941 −$1,023 0.32 0.31 Dominates Dominates
IC + NRT vs. placebo $333 −$303 −$874 −$844 0.31 0.29 Dominates Dominates
Bupropion vs. placebo $38 −$131 −$402 −$495 0.14 0.13 Dominates Dominates
Multidisciplinary care teams
MDC vs. UC $1,041 −$464 $111 $688 0.12 0.06 $10,686 $14,123
MDC, sensitivity analysis $3,049 −$464 $111 $2,696 0.12 0.06 $41,860 $55,322
Pulmonary rehabilitation
PR vs. UC $1,527 −$978 $77 $626 0.04 0.03 $14,616 $17,938
PR, sensitivity analysis $2,863 −$978 $77 $1,962 0.04 0.03 $45,849 $56,270
Long-term oxygen therapy
LTOT vs. UC $24,668 $4,218 $503 $29,389 1.21 0.75 $24,347 $38,993
Ventilation strategies
NPPV + UMC vs. UMC −$3,762 $583 $433 −$2746 0.19 0.13 Dominates Dominates
Weaning with NPPV vs. weaning with IMV
−$8,131 $201 $146 −$7784 0.07 0.05 Dominates Dominates
*Abbreviations: COPD, chronic obstructive pulmonary disease; IC, intensive counselling; IMV, invasive mechanical ventilation; LTOT, long-term oxygen therapy; MDC, multidisciplinary care; NPPV, noninvasive positive pressure ventilation; NRT, nicotine replacement therapy; PR, pulmonary rehabilitation; QALY, quality-adjusted life-year; UC, usual care; UMC, usual medical care.
†All costs are reported in Canadian dollars.

Ontario Health Technology Assessment Series; Vol. 12: No. 12, pp. 1–61, March 2012 34
The costs and benefits are reported as the difference between the intervention and its comparator. The costs are broken down into lifetime intervention costs, lifetime exacerbation (hospitalization) costs, and lifetime maintenance costs (for non–hospital-related resources, such as clinical visits and drugs). The benefits are broken down into LYs and QALYs. The total costs and benefits are impacted by the benefits extracted from the individual EBAs. Interventions that had an impact on mortality and no impact on hospitalization result in increased hospitalization and maintenance costs, since more people are staying alive and incurring events (i.e., costs). Smoking cessation programs had a benefit in terms of lung function and mortality. A benefit in lung function led to an improvement in disease; therefore, patients experienced fewer exacerbations, incurring fewer costs overall. MDC and PR had a benefit in terms of decreased hospital events. Fewer hospital events led to lower hospitalization costs but indirectly impacted inpatient mortality, leading to more people living with COPD and therefore incurring higher non–hospital-related costs. LTOT had a benefit in mortality; therefore, patients were living longer with disease and incurring more events and more costs. Finally, ventilation had a benefit in inpatient mortality; therefore, patients were living longer with COPD and incurring more events and more costs. The model’s parameter uncertainty was assessed using simulations. Using confidence intervals from the systematic review, distributions were assigned to the summary point estimates, and probabilistic sensitivity analyses were run. The CEACs for each comparison are presented below. The following figures show the probability that each intervention will be cost-effective according to different WTP thresholds per QALY. Single CEACs are presented because the interventions investigated in the COPD mega-analysis were assessed in different patient populations with different COPD severities. Whenever possible, given that patient populations could be grouped and compared, an evaluation between curves is reported.
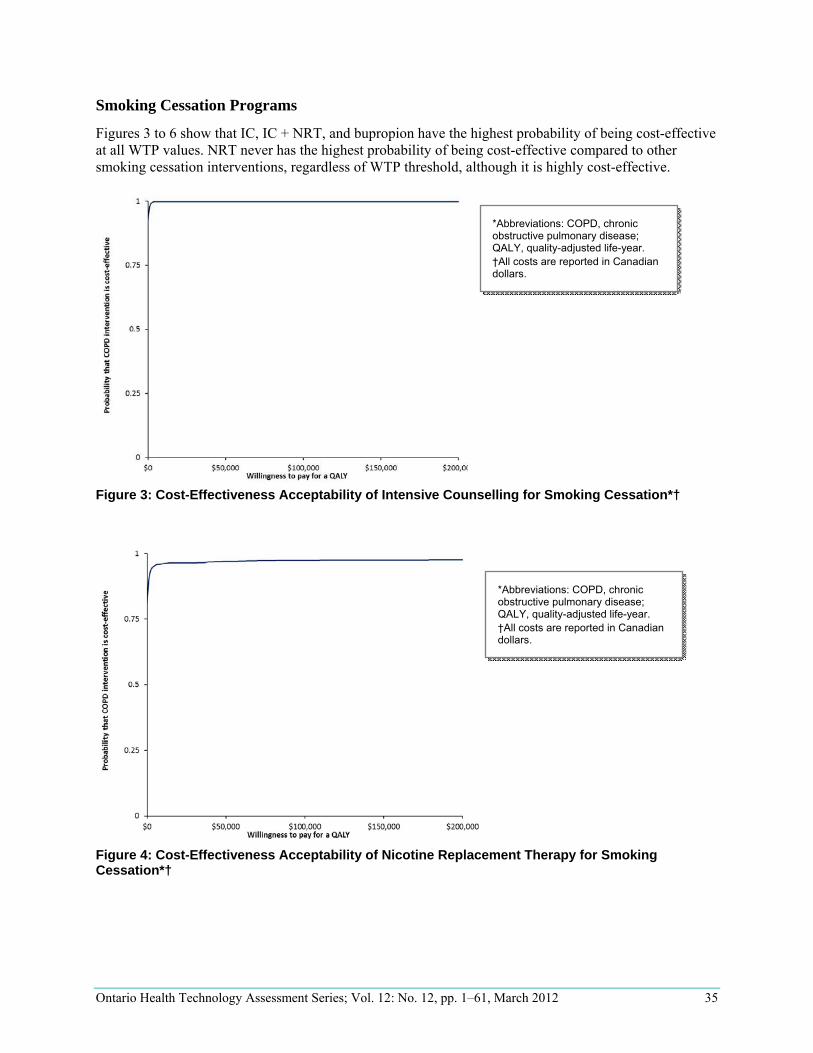
Ontario Health Technology Assessment Series; Vol. 12: No. 12, pp. 1–61, March 2012 35
Smoking Cessation Programs
Figures 3 to 6 show that IC, IC + NRT, and bupropion have the highest probability of being cost-effective at all WTP values. NRT never has the highest probability of being cost-effective compared to other smoking cessation interventions, regardless of WTP threshold, although it is highly cost-effective.
Figure 3: Cost-Effectiveness Acceptability of Intensive Counselling for Smoking Cessation*†
Figure 4: Cost-Effectiveness Acceptability of Nicotine Replacement Therapy for Smoking Cessation*†
*Abbreviations: COPD, chronic obstructive pulmonary disease; QALY, quality-adjusted life-year. †All costs are reported in Canadian dollars.
*Abbreviations: COPD, chronic obstructive pulmonary disease; QALY, quality-adjusted life-year. †All costs are reported in Canadian dollars.

Ontario Health Technology Assessment Series; Vol. 12: No. 12, pp. 1–61, March 2012 36
Figure 5: Cost-Effectiveness Acceptability of Intensive Counselling plus Nicotine Replacement Therapy for Smoking Cessation*†
Figure 6: Cost-Effectiveness Acceptability of Bupropion for Smoking Cessation*†
*Abbreviations: COPD, chronic obstructive pulmonary disease; QALY, quality-adjusted life-year. †All costs are reported in Canadian dollars.
*Abbreviations: COPD, chronic obstructive pulmonary disease; QALY, quality-adjusted life-year. †All costs are reported in Canadian dollars.

Ontario Health Technology Assessment Series; Vol. 12: No. 12, pp. 1–61, March 2012 37
Multidisciplinary Care Teams
MDC has the highest probability of being cost-effective above the threshold of $75,000 per QALY in the base case scenario (Figure 7). When the cost of the program is varied in a 1-way sensitivity analysis, the highest probability of MDC being cost-effective is above the threshold of $200,000 per QALY (Figure 8).
Figure 7: Cost-Effectiveness Acceptability of Multidisciplinary Care Teams (Base Case Cost)*†
Figure 8: Cost-Effectiveness Acceptability of Multidisciplinary Care Teams (Varying Cost of Program per Patient)*†
*Abbreviations: COPD, chronic obstructive pulmonary disease; QALY, quality-adjusted life-year. †All costs are reported in Canadian dollars.
*Abbreviations: COPD, chronic obstructive pulmonary disease; QALY, quality-adjusted life-year. †All costs are reported in Canadian dollars.

Ontario Health Technology Assessment Series; Vol. 12: No. 12, pp. 1–61, March 2012 38
Pulmonary Rehabilitation
In the base case scenario, PR becomes more cost-effective at a WTP value of greater $50,000 per QALY (Figure 9). The 1-way sensitivity analysis showed that PR has a higher probability of being cost-effective above the WTP threshold of $200,000 per QALY (Figure 10).
Figure 9: Cost-Effectiveness Acceptability of Pulmonary Rehabilitation (Base Case Cost)*†
Figure 10: Cost-Effectiveness Acceptability of Pulmonary Rehabilitation (Varying Cost of Program per Patient)*†
*Abbreviations: COPD, chronic obstructive pulmonary disease; QALY, quality-adjusted life-year. †All costs are reported in Canadian dollars.
*Abbreviations: COPD, chronic obstructive pulmonary disease; QALY, quality-adjusted life-year. †All costs are reported in Canadian dollars.

Ontario Health Technology Assessment Series; Vol. 12: No. 12, pp. 1–61, March 2012 39
Long-Term Oxygen Therapy
LTOT has the highest probability of being cost-effective at thresholds higher than $50,000 per QALY (Figure 11).
Figure 11: Cost-Effectiveness Acceptability of Long-Term Oxygen Therapy*†
*Abbreviations: COPD, chronic obstructive pulmonary disease; QALY, quality-adjusted life-year. †All costs are reported in Canadian dollars.

Ontario Health Technology Assessment Series; Vol. 12: No. 12, pp. 1–61, March 2012 40
Ventilation Strategies
NPPV has the highest probability of being cost-effective at all WTP thresholds (Figure 12). Weaning with NPPV remains highly cost-effective, but the probability of being cost-effective decreases slightly at the $50,000 per QALY threshold (Figure 13).
Figure 12: Cost-Effectiveness Acceptability of Noninvasive Ventilation*†
Figure 13: Cost-Effectiveness Acceptability of Weaning with Noninvasive Ventilation*†
*Abbreviations: COPD, chronic obstructive pulmonary disease; QALY, quality-adjusted life-year. †All costs are reported in Canadian dollars.
*Abbreviations: COPD, chronic obstructive pulmonary disease; QALY, quality-adjusted life-year. †All costs are reported in Canadian dollars.

Ontario Health Technology Assessment Series; Vol. 12: No. 12, pp. 1–61, March 2012 41
Summary
All smoking cessation programs were dominant (i.e., less expensive and more effective overall). Assuming a base case program cost of $1,041 and $1,527 per patient for MDC and PR, the ICER was calculated to be $14,123 per QALY and $17,938 per QALY, respectively. When the costs of MDC and PR were varied in a 1-way sensitivity analysis to reflect variation in resource utilization reported in the literature, the ICER increased to $55,322 per QALY and $56,270 per QALY, respectively. Assuming a base case cost of $2,261 per year per patient for LTOT as reported by data from the Ontario provincial program, the ICER was calculated to be $38,993 per QALY. Ventilation strategies were dominant (i.e., cheaper and more effective), as reflected by the clinical evidence of significant in-hospital days avoided in the study group. The probability of cost-effectiveness for each intervention is shown in Table 16. Table 16: COPD Model Results—Probability of Cost-Effectiveness by Ceiling Ratio*†
Intervention Cost per
QALY Probability of Cost-Effectiveness by Ceiling Ratios
$25,000 $50,000 $75,000 $100,000 $200,000
Smoking cessation programs
IC vs. UC Dominates 1.00 1.00 1.00 1.00 1.00
NRT vs. UC Dominates 0.96 0.97 0.97 0.97 0.98
IC + NRT vs. placebo Dominates 1.00 1.00 1.00 1.00 1.00
Bupropion vs. placebo Dominates 1.00 1.00 1.00 1.00 1.00
Multidisciplinary care teams
MDC vs. UC $14,123 0.73 0.79 0.80 0.81 0.81
MDC, sensitivity analysis $55,322 0.06 0.51 0.65 0.71 0.75
Pulmonary rehabilitation
PR vs. UC $17,938 0.69 0.94 0.98 0.99 1.00
PR, sensitivity analysis $56,270 0.03 0.36 0.75 0.91 0.99
Long-term oxygen therapy
LTOT vs. UC $38,993 0.04 0.71 0.85 0.90 0.94
Ventilation strategies
NPPV + UMC vs. UMC Dominates 1.00 1.00 1.00 1.00 1.00
Weaning with NPPV vs. weaning with IMV
Dominates 1.00 1.00 0.98 0.97 0.92
*Abbreviations: COPD, chronic obstructive pulmonary disease; IC, intensive counselling; IMV, invasive mechanical ventilation; LTOT, long-term oxygen therapy; MDC, multidisciplinary care; NPPV, noninvasive positive pressure ventilation; NRT, nicotine replacement therapy; PR, pulmonary rehabilitation; QALY, quality-adjusted life-year; UC, usual care; usual medical care.
†All costs are reported in Canadian dollars.

Ontario Health Technology Assessment Series; Vol. 12: No. 12, pp. 1–61, March 2012 42
Budget Impact Analysis—Ontario Perspective
Incidence and Prevalence of COPD COPD prevalence and incidence data were obtained from Canadian literature (25) and used to estimate the populations impacted by the interventions investigated in this report (Table 17). Table 17: COPD Prevalence and Incidence in Ontario, 1996 to 2007*
Variable Estimate Source
Population in Ontario, Canada, in 2007 (aged ≥ 35 years) 7,082,086 Gershon et al (25)
Prevalence of COPD in Ontario, Canada, in 2007 (males and females aged ≥ 35 years)
708,743 Gershon et al (25)
Relative increase in prevalence from 1996 to 2007 23% Gershon et al (25)
Incidence of COPD in Ontario, Canada, in 2007 (males and females aged ≥ 35 years)
60,198 Gershon et al (25)
Relative decrease in incidence from 1996 to 2007 28% Gershon et al (25)
Very severe COPD 18% ICES†
Severe COPD 21% ICES†
Moderate COPD 60% ICES†
*Abbreviations: COPD, chronic obstructive pulmonary disease; ICES, Institute of Clinical Evaluative Sciences.
†Personal communication, ICES, January 2011.
Impacted Populations A number of assumptions were made to estimate impacted populations; these are described in the following sections. Smoking Cessation Programs
The trials investigated in the smoking cessation EBA assessed patients with moderate COPD. Based on expert opinion (Personal communication, ICES, May 2011), it was assumed that 60% of COPD patients were smokers, and of these, 20% would seek treatment (Table 18). Table 18: Assumptions Regarding Prevalent Patients Accessing Smoking Cessation Programs*
Variable Proportion Source
Prevalence of COPD in Ontario, Canada, in 2007 (males and females aged ≥ 35 years)
708,743 Gershon et al (25)
Moderate COPD 60% ICES†
Smokers 60% ICES†
Smokers motivated to seek treatment 20% ICES†
Impacted population 51,029
*Abbreviations: COPD, chronic obstructive pulmonary disease; ICES, Institute for Clinical and Evaluative Sciences.
†Personal communication, ICES, May 2011.

Ontario Health Technology Assessment Series; Vol. 12: No. 12, pp. 1–61, March 2012 43
The same assumptions were used to calculate the incident population, assuming a relative decrease in incidence in subsequent years. (25) Multidisciplinary Care Teams
Using the FHT model of care in Ontario, data from half of the FHTs that reported back in FY 2010 (Personal communication, Ministry of Health and Long-Term Care, May 2011) suggested that 81,289 patients with COPD are accessing a chronic disease management program (Table 19). Table 19: Assumptions Regarding Prevalent Patients Accessing Multidisciplinary Care Teams*†
Variable Proportion Source
Number of patients accessing a chronic disease management program through FHTs, FY 2010
81,289 Personal communication, Ministry of Health and Long-Term Care, May 2011
*Abbreviations: FHT, Family Health Team; FY, fiscal year.
†Likely to be an underestimate; overall, multidisciplinary care resources being utilized in the province are unknown and difficult to measure.
The incident population was calculated by assuming a starting incident population of moderate (60%) to severe (21%) COPD (Personal communication, Expert, January 2011), and assuming a relative decrease in incidence in subsequent years. (25) Nevertheless, due to lack of report by FHTs and the fact that programs outside the FHT model are not captured, this number is likely to be an underestimate and not necessarily representative of the Ontario population accessing multidisciplinary care for COPD. Pulmonary Rehabilitation
Data on COPD-related hospitalization were pulled from Ontario administrative data sets (26) to calculate the potential impact of patients accessing PR programs. There were 22,485 hospitalizations due to COPD in FY 2009. Based on consultation with experts (Personal communication, Expert Panel, May 2011), it was assumed that half of hospitalized patients would access PR resources at least once, and half of these would repeat the therapy (Table 20). Table 20: Assumptions Regarding Prevalent Patients Accessing Pulmonary Rehabilitation*
Variable Proportion Source
Patients hospitalized for COPD in FY 2009 22,485 Ministry of Health and Long-Term Care (26)
Patients accessing PR at least once post-acute exacerbation
50% Expert panel†
Impacted population 11,243 —
Patients repeating PR once 50% Expert panel†
Impacted population 5,621 —
*Abbreviations: COPD, chronic obstructive pulmonary disease; FY, fiscal year; PR, pulmonary rehabilitation.
†Personal communication, Expert panel, May 2011.
The incident population was calculated by assuming a starting incident population of moderate (60%) to severe (21%) COPD (Personal communication, Expert, January 2011) who would experience

Ontario Health Technology Assessment Series; Vol. 12: No. 12, pp. 1–61, March 2012 44
exacerbations (3%) (27) and would access PR at least once (50%). Half of these would repeat treatment (Personal communication, Expert, May 2011). A relative decrease in incidence in subsequent years was also assumed. (25) Long-Term Oxygen Therapy
The most recent data from the LTOT provincial program indicated that 28,654 patients with severe hypoxemia accessed services in FY 2006 (Table 21) (Personal communication, Ministry of Health and Long-Term Care, January 2011). Table 21: Assumptions Regarding Prevalent Patients Accessing Long-Term Oxygen Therapy*
Variable Proportion Source Number of patients accessing LTOT, FY 2006
28,654 Personal communication, Ministry of Health and Long-Term Care, January 2011
*Abbreviations: LTOT, long-term oxygen therapy; FY, fiscal year.
The incident population was calculated by assuming a starting incident population of very severe COPD (18%) (Personal communication, Expert, January 2011) with severe hypoxemia (25%) and severe respiratory failure (3%) (Personal communication, Expert, January 2011). A relative decrease in incidence in subsequent years was also assumed. (25) Ventilation Strategies
Based on consultation with experts (Personal communication, Expert, May 2011), it was assumed that 15% of the patient population at risk (severe COPD for NPPV and very severe COPD for weaning with NPPV) were eligible for ventilation. Of these, 50% would choose to be ventilated. Of the very severe patients on IMV, 15% would fail breathing assessment and therefore continue to be ventilated. Table 22 describes the assumptions and impacted populations. Table 22: Assumptions Regarding Prevalent Patients Accessing Ventilation*
Variable Proportion Source
Patients with severe COPD eligible for NPPV 22,325 Expert panel†
Patients with very severe COPD for weaning with NPPV 19,136 Expert panel†
Very severe patients who fail breathing assessment and continue to be ventilated
15% Expert panel†
Patients opting for either ventilation type 50% Expert panel†
Impacted population for NPPV 11,163 —
Impacted population for weaning with NPPV 1,435 —
*Abbreviations: COPD, chronic obstructive pulmonary disease; NPPV, noninvasive positive pressure ventilation.
†Personal communication, Expert Panel, May 2011.
The same assumptions were used to calculate incident population, assuming a relative decrease in incidence in subsequent years. (25) Summary
The provincial burden reflects what the province is currently paying based on the costing assumptions reported here and the prevalent population accessing the interventions/services. Future projections were

Ontario Health Technology Assessment Series; Vol. 12: No. 12, pp. 1–61, March 2012 45
based on COPD incidence, assuming a relative decrease in subsequent years. (25) Future projections did not capture patients who would fail and repeat treatment, reflecting the short-term nature of treatment and follow-up reported in the trials included in the MAS EBAs. Future projections also did not capture changes in disease prevalence. Current and future impacted populations are summarized in Table 23.

Ontario Health Technology Assessment Series; Vol. 12: No. 12, pp. 1–61, March 2012 46
Table 23: Impacted Populations for COPD Interventions in Ontario*
Intervention Assumptions Prevalent Population,
Current Burden Incident Populations
Year 1 Year 2 Year 3
Smoking cessation programs
IC vs. UC Incidence and prevalence: assumed moderate COPD, smokers, motivated to seek treatment
51,029 4,334 3,108 2,228
NRT vs. UC Incidence and prevalence: assumed moderate COPD, smokers, motivated to seek treatment
51,029 4,334 3,108 2,228
IC + NRT vs. placebo Incidence and prevalence: assumed moderate COPD, smokers, motivated to seek treatment
51,029 4,334 3,108 2,228
Bupropion vs. placebo Incidence and prevalence: assumed moderate COPD, smokers, motivated to seek treatment
51,029 4,334 3,108 2,228
Multidisciplinary care teams
MDC vs. UC Prevalence: assumed patients accessing COPD management program through FHTs. Incidence: assumed moderate and severe COPD
81,289† 48,760† 34,961† 25,067†
Pulmonary rehabilitation
PR vs. UC, 1 treatment Prevalence: assumed COPD patients post-exacerbation, at least 1 treatment. Incidence: assumed moderate and severe COPD, experiencing exacerbation, seeking treatment once
11,243 805 577 414
PR vs. UC, repeat treatment
Prevalence: assumed COPD patients post-exacerbation, repeat treatment. Incidence: assumed moderate and severe COPD, experiencing exacerbation, seeking repeat treatment
5,621 402 288 207
Long-term oxygen therapy
LTOT vs. UC Prevalence: assumed patient accessing LTOT through ADP, Ministry of Health and Long-Term Care. Incidence: assumed very severe COPD, with severe hypoxemia and severe respiratory failure
28,654 81 58 42
Ventilation strategies
NPPV + UMC vs. UMC Prevalence and incidence: assumed severe COPD, eligible for ventilation, choosing to be ventilated
11,163 948 680 487
Weaning with NPPV vs. weaning with IMV
Prevalence and incidence: assumed very severe COPD, eligible for ventilation, failing breathing assessment, choosing to be ventilated
1,435 122 87 63
*Abbreviations: ADP, Assistive Devices Program; COPD, chronic obstructive pulmonary disease; FHT, Family Health Team; IC, intensive counselling; IMV, invasive mechanical ventilation; LTOT, long-term oxygen therapy; MDC, multidisciplinary care; NPPV, noninvasive positive pressure ventilation; NRT, nicotine replacement therapy; PR, pulmonary rehabilitation; SA, sensitivity analysis; UC, usual care; UMC, usual medical care. †Likely to be an underestimate; overall, multidisciplinary care resources being utilized in the province are unknown and difficult to measure.

Ontario Health Technology Assessment Series; Vol. 12: No. 12, pp. 1–61, March 2012 47
Budget Impact Analysis Results Ontario currently pays for IC through physician billing (translating to a current burden of $8 million) and bupropion through ODB (translating to a current burden of almost $2 million). The burden of NRT was projected to be $10 million, with future expenditures of up to $1 million in Years 1 to 3 for incident cases. Ontario currently pays for some chronic disease management programs. Based on the most recent FHT data, the costs of MDC programs to manage COPD were estimated at $85 million in FY 2010, with projected future expenditures of up to $51 million for incident cases, assuming the base case cost of program. However, this estimate does not accurately reflect the current costs to the province because of lack of report by FHTs, lack of capture of programs outside this model of care by any data set in the province, and because the resource utilization and frequency of visits/follow-up phone calls were based on the findings in the literature rather than the actual FHT COPD management programs in place in Ontario. Therefore, MDC resources being utilized in the province are unknown and difficult to measure. Data on COPD-related hospitalization were pulled from Ontario administrative data sets (26) and based on consultation with experts (Personal communication, Ministry of Health and Long-Term Care, May 2011). Half of hospitalized patients will access PR resources at least once, and half of these will repeat therapy, translating to a potential burden of $17 million to $32 million, depending on the cost of the program. The costs of these resources are currently being absorbed by current systems, but since utilization is not being captured by any data set in the province, it is difficult to quantify and estimate. Provincial programs may be under-resourced, and patients may not be accessing these services effectively. (23) Data from the LTOT provincial program (based on FY 2006 information) suggested that the burden was $65 million (Personal communication, Ministry of Health and Long-Term Care, January 2011), with potential expenditures of up to $0.2 million in Years 1 to 3 for incident cases. From the clinical evidence on ventilation (i.e., a reduction of LOS in hospital), there were potential cost savings of $42 million and $12 million for NPPV and weaning with NPPV, respectively, if the study intervention were adopted. Future cost savings were projected to be up to $4 million and $1 million, respectively, for incident cases. Current and projected expenditures are summarized in Table 24.

Ontario Health Technology Assessment Series; Vol. 12: No. 12, pp. 1–61, March 2012 48
Table 24: Budget Impact Analyses of COPD Interventions*†
Intervention Current Impact
($ millions)
Year 1 Impact
($ millions)
Year 2 Impact
($ millions)
Year 3 Impact
($ millions) Funding
Smoking cessation programs
UC in smoking cessation
1.8 0.2 0.1 0.1 Ministry of Health and Long-Term Care (physician billing)
IC vs. UC 8.4 0.7 0.5 0.4 Ministry of Health and Long-Term Care (physician billing)
NRT vs. UC 10.4 0.9 0.6 0.5 NRT is an out-of-pocket expense
IC + NRT vs. placebo 18.8 1.6 1.1 0.8 —
Bupropion vs. placebo 1.9 0.2 0.1 0.1 Ministry of Health and Long-Term Care (drug branch)
Multidisciplinary care teams
MDC vs. UC‡ 84.6 50.8 36.4 26.1 Ministry of Health and Long-Term Care (FHT programs)
MDC, sensitivity analysis‡
247.8 148.7 106.6 76.4 Ministry of Health and Long-Term Care (FHT programs)
Pulmonary rehabilitation
PR (at least once) vs. UC
17.2 1.2 0.9 0.6 Ministry of Health and Long-Term Care or hospital programs
PR (at least once) sensitivity analysis
32.2 2.3 1.7 1.2 Ministry of Health and Long-Term Care or hospital programs
PR (repeat) vs. UC 17.2 0.6 0.4 0.3 Ministry of Health and Long-Term Care or hospital programs
PR (repeat) sensitivity analysis
32.2 1.2 0.8 0.6 Ministry of Health and Long-Term Care or hospital programs
Long-term oxygen therapy
LTOT vs. UC 64.8 0.2 0.1 0.1 Ministry of Health and Long-Term Care (ADP)
Ventilation strategies
NPPV + UMC vs. UMC −42.0 −3.6 −2.6 −1.8 Hospital global budget
NPPV 70.6 6.0 4.3 3.1 Hospital global budget
UC 112.6 9.6 6.9 4.9 Hospital global budget
Weaning with NPPV vs. weaning with IMV
−11.7 −1.0 −0.7 −0.5 Hospital global budget
Weaning with NPPV 23.4 2.0 1.4 1.0 Hospital global budget
Weaning with IMV 35.1 3.0 2.1 1.5 Hospital global budget
*Abbreviations: COPD, chronic obstructive pulmonary disease; FHT, family health team; IC, intensive counselling; IMV, invasive mechanical ventilation; LTOT, long-term oxygen therapy; MDC, multidisciplinary care; NPPV, noninvasive positive pressure ventilation; NRT, nicotine replacement therapy; PR, pulmonary rehabilitation; UC, usual care; UMC, usual medical care. †All costs are reported in Canadian dollars. ‡Likely to be an underestimate; overall, multidisciplinary care resources being utilized in the province are unknown and difficult to measure.

Ontario Health Technology Assessment Series; Vol. 12: No. 12, pp. 1–61, March 2012 49
Limitations There were several limitations to this analysis. Costing was limited to the resources used for each intervention investigated in the COPD mega-analysis EBAs. The costs of program implementation were not included in the analysis and require further investigation and expertise to identify. Summary estimates of the impact of each intervention were captured from the MAS EBAs on individual interventions and are limited to the studies included in the investigations. The patient populations varied in the trials assessed and may not be generalizable to the context of Ontario health systems and services. Furthermore, caution should be exercised when comparing results across analyses, since the patient populations reflect different disease severities. The model inputs populating the natural history of COPD are limited to the probabilities, costs, and utilities derived from the medical literature and are not based on a prospective collection of patient-level data from an Ontario COPD cohort. Therefore, assumptions were made to interpret outputs from the model in an Ontario context. Further to this, a utility value can be interpreted as a patient preference estimate, as opposed to a health benefit, since the weight assigned to a particular condition can vary greatly depending on the population being surveyed. It was challenging to quantify the patient populations currently accessing services, as these are not necessarily captured by provincial data sets. Populations used in the analysis were based on assumptions from expert opinion and subject to variability between experts based on their individual experiences of treating patients with COPD. COPD prevalence is increasing, and incidence is decreasing. It is feasible to assume that patients would repeat treatment, leading to higher costs in subsequent years based on prevalence data; however, only incident estimates were reported to reflect trial data, showing that patients will access services once on a short-term basis.

Ontario Health Technology Assessment Series; Vol. 12: No. 12, pp. 1–61, March 2012 50
Conclusion Currently, resources for most of these interventions are being absorbed through provider services, the ODB program, the Assistive Devices Program, and the hospital global budget. The most cost-effective intervention for COPD will depend on decision-makers’ willingness to pay. Lack of provincial data sets capturing resource utilization for the various interventions poses a challenge for estimating the current burden and future expenditures.

Ontario Health Technology Assessment Series; Vol. 12: No. 12, pp. 1–61, March 2012 51
Glossary
6 Minute Walking Test (6MWT)
A measure of exercise capacity which measures the distance that a patient can quickly walk on a flat, hard surface in a period of 6 minutes. A widely used outcome measure in respiratory rehabilitation of patients with COPD.
Acute exacerbations of chronic obstructive pulmonary disease (AECOPD)
A change in baseline symptoms that is beyond day-to-day variation, particularly increased breathlessness, cough, and/or sputum, which has an abrupt onset.
Admission avoidance hospital-at-home program
Treatment program for patients experiencing acute exacerbations of COPD which allows patients to receive treatment in their home and avoid admission to hospital. After patients are assessed in the emergency department for an acute exacerbation, they are prescribed the necessary medications and additional care needed (e.g., oxygen therapy) and then sent home where they receive regular visits from a medical professional until the exacerbation has resolved.
Ambulatory oxygen therapy
Provision of oxygen therapy during exercise and activities of daily living for individuals who demonstrate exertional desaturation.
Bilevel positive airway pressure (BiPAP)
A continuous positive airway pressure mode used during noninvasive positive pressure ventilation (see definition below) that delivers preset levels of inspiratory and expiratory positive airway pressure. The pressure is higher when inhaling and falls when exhaling, making it easier to breathe.
Cost-effectiveness acceptability curve (CEAC)
A method for summarizing uncertainty in estimates of cost-effectiveness.
Cor pulmonale Right heart failure, as a result of the effects of respiratory failure on the heart.
Dyspnea Difficulty breathing or breathlessness.
Early discharge hospital-at-home program
Treatment program for patients experiencing acute exacerbations of COPD which allows patients to receive treatment in their home and decrease their length of stay in hospital. After being assessed in the emergency department for acute exacerbations, patients are admitted to the hospital where they receive the initial phase of their treatment. These patients are discharged early into a hospital-at-home program where they receive regular visits from a medical professional until the exacerbation has resolved.
Forced expiratory volume in 1 second (FEV1)
A measure of lung function used for COPD severity staging; the amount of air that can be forcibly exhaled from the lungs in the first second of a forced exhalation.
Forced vital capacity The amount of air that can be forcibly exhaled from the lungs after taking

Ontario Health Technology Assessment Series; Vol. 12: No. 12, pp. 1–61, March 2012 52
(FVC)
the deepest breath possible.
Fraction of inspired oxygen (FiO2)
The percentage of oxygen participating in gas exchange.
Hypercapnia Occurs when there is too much carbon dioxide in the blood (arterial blood carbon dioxide > 45 to 60 mm Hg).
Hypopnea Slow or shallow breathing.
Hypoxemia Low arterial blood oxygen levels while breathing air at rest. May be severe (PaO2 ≤ 55 mm Hg), moderate (56 mm Hg ≤ PaO2 < 65 mm Hg), or mild-to-moderate (66 mm Hg < PaO2 ≤ 74 mm Hg).2
Incremental cost-effectiveness ratio (ICER)
Ratio of the change in costs of a therapeutic intervention to the change in effects of the intervention compared to the alternative (often usual care).
Intention-to-treat analysis (ITT)
An analysis based on the initial treatment the participant was assigned to, not on the treatment eventually administered.
Invasive mechanical ventilation (IMV)
Mechanical ventilation via an artificial airway (endotracheal tube or tracheostomy tube).
Long-term oxygen therapy (LTOT)
Continuous oxygen use for about 15 hours per day. Use is typically restricted to patients fulfilling specific criteria.
Multidisciplinary care Defined as care provided by a team (compared to a single provider). Typically involves professionals from a range of disciplines working together to deliver comprehensive care that addresses as many of the patient’s health care and psychosocial needs as possible.
Nicotine replacement therapy (NRT)
The administration of nicotine to the body by means other than tobacco, usually as part of smoking cessation.
Noninvasive positive pressure ventilation (NPPV)
Noninvasive method of delivering ventilator support (without the use of an endotracheal tube) using positive pressure. Provides ventilatory support through a facial or nasal mask and reduces inspiratory work.
Partial pressure of carbon dioxide (PaCO2)
The pressure of carbon dioxide dissolved in arterial blood. This measures how well carbon dioxide is able to move out of the body.
Partial pressure of oxygen (PaO2)
The pressure of oxygen dissolved in arterial blood. This measures how well oxygen is able to move from the airspace of the lungs into the blood.
Palliative oxygen therapy
Use of oxygen for mildly hypoxemic or nonhypoxemic individuals to relieve symptoms of breathlessness. Used short term. This therapy is “palliative” in that treatment is not curative of the underlying disease.
2 The mild-to-moderate classification was created for the purposes of the report.

Ontario Health Technology Assessment Series; Vol. 12: No. 12, pp. 1–61, March 2012 53
Pulmonary rehabilitation
Multidisciplinary program of care for patients with chronic respiratory impairment that is individually tailored and designed to optimize physical and social performance and autonomy. Exercise training is the cornerstone of pulmonary rehabilitation programs.
Pulse oximetry A noninvasive sensor, which is attached to the finger, toe, or ear to detect oxygen saturation of arterial blood.
Quality-adjusted life-years (QALYs)
A measure of disease burden that includes both the quantity and the quality of the life lived that is used to help assess the value for money of a medical intervention.
Respiratory failure Respiratory failure occurs when the respiratory system cannot oxygenate the blood and/or remove carbon dioxide from the blood. It can be either acute (acute respiratory failure, ARF) or chronic, and is classified as either hypoxemic (type I) or hypercapnic (type II) respiratory failure. Acute hypercapnic respiratory failure frequently occurs in COPD patients experiencing acute exacerbations of COPD.
Short-burst oxygen therapy
Short-duration, intermittent, supplemental oxygen administered either before or after exercise to relieve breathlessness with exercise.
Sleep apnea Interruption of breathing during sleep due to obstruction of the airway or alterations in the brain. Associated with excessive daytime sleepiness.
Smoking cessation The process of discontinuing the practice of inhaling a smoked substance.
Spirometry The gold standard test for diagnosing COPD. Patients breathe into a mouthpiece attached to a spirometer which measures airflow limitation.
SpO2 Oxygen saturation of arterial blood as measured by a pulse oximeter.
Stable COPD The profile of COPD patients which predominates when patients are not experiencing an acute exacerbation.
Supplemental oxygen therapy
Oxygen use during periods of exercise or exertion to relieve hypoxemia.
Telemedicine (or telehealth)
Refers to using advanced information and communication technologies and electronic medical devices to support the delivery of clinical care, professional education, and health-related administrative services.
Telemonitoring (or remote monitoring)
Refers to the use of medical devices to remotely collect a patient’s vital signs and/or other biologic health data and the transmission of those data to a monitoring station for interpretation by a health care provider.
Telephone only support Refers to disease/disorder management support provided by a health care provider to a patient who is at home via telephone or videoconferencing technology in the absence of transmission of patient biologic data.
Ventilator-associated pneumonia (VAP)
Pneumonia that occurs in patients undergoing mechanical ventilation while in a hospital.

Ontario Health Technology Assessment Series; Vol. 12: No. 12, pp. 1–61, March 2012 54
Acknowledgements Editorial Staff Jeanne McKane COPD Expert Advisory Panel The role of the expert panel was to provide direction on the scope of the project and the relevant outcomes measures of effectiveness, to review the evidence-based analyses and to identify any societal or systemic issues that are relevant to intervention effectiveness. However, the statements, conclusions and views expressed in this report do not necessarily represent the views of the expert panel members. Jeremy Grimshaw, MD, MBChB, PhD (Chair) Senior Scientist, Ottawa Hospital Research Institute Professor, Department of Medicine, University of Ottawa Dina Brooks, PhD Professor, Department of Physical Therapy, University of Toronto Debbie Coutts, RRT, CRE Andrea Gershon, MD, MSc, FRCP(C) Scientist, Institute for Clinical Evaluative Sciences Respirologist, Sunnybrook Health Sciences Centre Assistant Professor, Departments of Medicine and Health Policy, Management and Evaluation,
University of Toronto Mita Giacomini, BSc, MPH, MA, PhD Professor, Department of Clinical Epidemiology & Biostatistics, McMaster University Ron Goeree, BA, MA Director, PATH Research Institute, St. Joseph’s Hospital (Hamilton) Associate Professor, Department of Clinical Epidemiology & Biostatistics, McMaster University Roger Goldstein, MBCHB, FRCP(C), FRCP(UK) NSA Chair in Respiratory Rehabilitation Research Director, Respiratory Services, and Senior Scientist, West Park Healthcare Centre Professor, Medicine and Physical Therapy, University of Toronto Alan G Kaplan, MD, CCFP(EM), FCFP Chairperson, Family Physician Airways Group of Canada Chairperson, Special Interest Focused Care Group in Respiratory Medicine, College of Family Physicians
of Canada Clinical Lecturer, Department of Family and Community Medicine, University of Toronto DE O’Donnell, MD, FRCP(C) Director, COPD Centre, Kingston General Hospital Professor, Department of Medicine, Queen’s University

Ontario Health Technology Assessment Series; Vol. 12: No. 12, pp. 1–61, March 2012 55
Asad Razzaque, MD Family Physician Holger Schünemann, MD, PhD, MSc, FRCP(C) Michael Gent Chair in Healthcare Research Chair, Department of Clinical Epidemiology & Biostatistics, McMaster University Professor, Department of Clinical Epidemiology & Biostatistics and Medicine, McMaster University Tasnim Sinuff, MD, PhD, FRCP(C) Clinician Scientist, Sunnybrook Health Sciences Centre Assistant Professor, Department of Medicine, University of Toronto
Laura Watling, RRT, BSc(HK) Clinical Practice Leader/Clinical Coordinator, Respiratory Therapy, West Park Healthcare Centre

Ontario Health Technology Assessment Series; Vol. 12: No. 12, pp. 1–61, March 2012 56
Appendices
Appendix 1: Literature Search Strategy Databases: Ovid Medline/Medline IP, Embase & NHSEED, PubMed (for non-Medline records); HEED (Wiley) Limits: 2009-present COPD Concept exp *Pulmonary Disease, Chronic Obstructive/ ((chronic ADJ2 obstructi*) ADJ5 (airflow OR airway OR bronchitis OR bronchopulmonary OR lung)).ti. (obstructi* ADJ2 (lung disease* OR pulmonary disease* OR pulmonary disorder* OR respiratory disease* OR respiratory tract disease*)).ti. (COAD OR COPD).ti. *Chronic Obstructive Lung Disease/ AND Cost utility analyses *Health Status Indicators/ OR *"Quality of Life"/ *Economics/ exp *"Costs and Cost Analysis"/ (econom* OR cost* OR pharmacoeconomic* OR pharmaco-economic*).ti. ((cost* ADJ utilit*) OR costutilit*).ti,ab. (EuroQol* OR Euro Qol* OR EQ5D* OR EQ 5D*).mp. (hui* OR health utilities index* OR health utilities indic* OR health utility index* OR health utility indic*).mp. (SF6D OR SF 6D OR Short Form 6D OR ShortForm 6D OR Short-Form 6-Dimension* OR ShortForm 6-Dimension* OR Short-Form 6Dimension* OR ShortForm 6Dimension*).mp. (standard ADJ2 gamble*).mp. (Time Trade Off* OR Time TradeOff* OR TTO*).mp. ("preference based quality of life" OR (("preference based" OR "patient based") ADJ (utilit* OR measure?)) OR health preference? OR preference elicit* OR (patient* ADJ (utilit* OR preference*))).tw. *Economic Evaluation/ OR "Cost Utility Analysis"/ Search run 2011Jul19 Embase 1980 to 2011 Week 28, Ovid MEDLINE(R) In-Process & Other Non-Indexed Citations and Ovid MEDLINE(R) 1948 to Present # Searches Results
1 exp *Pulmonary Disease, Chronic Obstructive/ 44623
2 (chronic adj2 obstructi* adj5 (airflow or airway or bronchitis or bronchopulmonary or lung)).ti.
5592
3 (obstructi* adj2 (lung disease* or pulmonary disease* or pulmonary disorder* or respiratory disease* or respiratory tract disease*)).ti.
24427
4 (COAD or COPD).ti. 16581
5 *Chronic Obstructive Lung Disease/ 44226
6 or/1-4 55292

Ontario Health Technology Assessment Series; Vol. 12: No. 12, pp. 1–61, March 2012 57
7 or/2-5 54942
8 *Health Status Indicators/ or *"Quality of Life"/ 100444
9 *Economics/ 20958
10 exp *"Costs and Cost Analysis"/ 87425
11 (econom* or cost* or pharmacoeconomic* or pharmaco-economic*).ti. 210443
12 ((cost* adj utilit*) or costutilit*).ti,ab. 4145
13 (EuroQol* or Euro Qol* or EQ5D* or EQ 5D*).mp. 5681
14 (hui* or health utilities index* or health utilities indic* or health utility index* or health utility indic*).mp.
12126
15 (standard adj2 gamble*).mp. 1222
16 (Time Trade Off* or Time TradeOff* or TTO*).mp. 2786
17 ("preference based quality of life" or (("preference based" or "patient based") adj (utilit* or measure?)) or health preference? or preference elicit* or (patient* adj (utilit* or preference*))).tw.
11667
18 *Economic Evaluation/ or "Cost Utility Analysis"/ 4854
19 or/8-17 397517
20 or/11-18 242114
21 6 and 19 use prmz 1035
22 7 and 20 use emez 575
23 21 or 22 1610
24 limit 23 to yr="2009 -Current" 383
25 remove duplicates from 24 295 Database: EBM Reviews - NHS Economic Evaluation Database <3rd Quarter 2011> Search Strategy: 1 exp Pulmonary Disease, Chronic Obstructive/ (77) 2 (chronic adj2 obstructi* adj5 (airflow or airway or bronchitis or bronchopulmonary or lung)).mp. (17) 3 (obstructi* adj2 (lung disease* or pulmonary disease* or pulmonary disorder* or respiratory disease* or respiratory tract disease*)).mp. (154) 4 (COAD or COPD).ti. (25) 5 *Health Status Indicators/ or *"Quality of Life"/ (0) 6 *Economics/ (0) 7 exp *"Costs and Cost Analysis"/ (0) 8 (econom* or cost* or pharmacoeconomic* or pharmaco-economic*).ti. (8217) 9 ((cost* adj utilit*) or costutilit*).ti,ab. (344) 10 (EuroQol* or Euro Qol* or EQ5D* or EQ 5D*).mp. (488) 11 (hui* or health utilities index* or health utilities indic* or health utility index* or health utility indic*).mp. (103) 12 (standard adj2 gamble*).mp. (177) 13 (Time Trade Off* or Time TradeOff* or TTO*).mp. (303) 14 ("preference based quality of life" or (("preference based" or "patient based") adj (utilit* or measure?)) or health preference? or preference elicit* or (patient* adj (utilit* or preference*))).tw. (367) 15 ((cost* adj utilit*) or costutilit*).if. (2232) 16 (or/1-4) and (or/5-15) (117)
Ontario Health Technology Assessment Series; Vol. 12: No. 12, pp. 1–61, March 2012 58
17 limit 16 to yr="2009 -Current" (25) PubMed Search run 2011Jul19 Search Most Recent Queries Time Result
#19 Search #6 AND #17 AND #18 15:07:44 21
#18 Search publisher[sb] OR in process[sb] OR pubmednotmedline[sb] 15:07:17 1616736
#17 Search #7 OR #8 OOR #9 OR #10 OR #11 OR #12 OR #13 OR #14 OR #15 OR #16
15:07:09 71323
#16 Search (preference based quality of life[tiab] OR ((preference based[tiab] OR patient based[tiab]) AND (utilit*[tiab] OR measure*[tiab])) OR health preference*[tiab] OR preference elicit*[tiab] OR (patient*[tiab] AND (utilit*[tiab] OR preference*[tiab]))
15:06:35 52176
#15 Search Time Trade Off*[all] OR Time TradeOff*[all] OR TTO*[all] 15:06:27 1597
#14 Search standard[all] AND gamble*[all] 15:06:19 859
#13 Search SF6D[all] OR SF 6D[all] OR Short Form 6D[all] OR ShortForm 6D[all] OR Short-Form 6-Dimension*[all] OR ShortForm 6-Dimension*[all] OR Short-Form 6Dimension*[all] OR ShortForm 6Dimension*[all]
15:06:08 262
#12 Search hui*[all] OR health utilities index*[all] OR health utilities indic*[all] OR health utility index*[all] OR health utility indic*[all]
15:05:55 12483
#11 Search EuroQol*[all] OR Euro Qol*[all] OR EQ5D*[all] OR EQ 5D*[all] 15:05:47 2513
#10 Search economic*[tiab] OR cost[tiab] OR costs[tiab] OR costing[tiab] OR cost* utilit*[tiab] OR costutilit*[tiab]
15:05:28 8190
#9 Search Costs and Cost Analysis[mh] 15:03:33 156444
#8 Search Economics[mh] 15:03:22 437731
#7 Search Health Status Indicators[mh] OR Quality of Life[mh] 15:02:28 230567
#6 Search #3 OR #4 OR #5 15:01:44 20551
#5 Search copd[ti] 15:01:32 7249
#4 Search (chronic[ti] AND obstructi*[ti]) AND (airflow[ti] OR airway[ti] OR bronchitis[ti] OR bronchopulmonary[ti] OR lung[ti])
15:01:06 3108
#3 Search Pulmonary Disease, Chronic Obstructive[mh] 14:59:49 15829
HEED COPD + cost utility = 18 results

Ontario Health Technology Assessment Series; Vol. 12: No. 12, pp. 1–61, March 2012 59
References
(1) Pauwels RA, Buist AS, Calverley PM, Jenkins CR, Hurd SS. Global strategy for the diagnosis, management, and prevention of chronic obstructive pulmonary disease. NHLBI/WHO Global Initiative for Chronic Obstructive Lung Disease (GOLD) Workshop summary. Am J Respir Crit Care Med. 2001 Apr;163(5):1256-76.
(2) Saetta M, Di SA, Turato G, Facchini FM, Corbino L, Mapp CE, et al. CD8+ T-lymphocytes in peripheral airways of smokers with chronic obstructive pulmonary disease. Am J Respir Crit Care Med. 1998 Mar;157(3 Pt 1):822-6.
(3) O'Donnell DE, Laveneziana P. The clinical importance of dynamic lung hyperinflation in COPD. COPD. 2006 Dec;3(4):219-32.
(4) Global Initiative for Chronic Obstructive Lung Disease. Global strategy for the diagnosis, management, and prevention of chronic obstructive pulmonary disease [Internet]. [place unknown]: Global Initiative for Chronic Obstructive Lung Disease; [updated 2010; cited 2011 Jul 6]. Available from: http://www.goldcopd.org/uploads/users/files/GOLDReport_April112011.pdf
(5) Mittmann N, Kuramoto L, Seung SJ, Haddon JM, Bradley-Kennedy C, Fitzgerald JM. The cost of moderate and severe COPD exacerbations to the Canadian healthcare system. Respir Med. 2008 Mar;102(3):413-21.
(6) GRADE Working Group. Grading quality of evidence and strength of recommendations. Br Med J. 2006;328(7454):1490-4.
(7) Hoogendoorn M, Feenstra TL, Hoogenveen RT, Rutten-van Molken MP. Long-term effectiveness and cost-effectiveness of smoking cessation interventions in patients with COPD. Thorax. 2010;65(8):711-8.
(8) Hoogendoorn M, van Wetering CR, Schols AM, Rutten-van Molken MP. Is INTERdisciplinary COMmunity-based COPD management (INTERCOM) cost-effective? Eur Respir J. 2010;35(1):79-87.
(9) Drummond M, McGuire A. Economic evaluation in health care - merging theory with practice. New York: Oxford University Press Inc.; 2001.
(10) Ontario Case Costing Initiative [Internet]. Toronto: Ontario Case Costing Initiative; [updated 2011 Jun; cited 2011 May]. Available from: http://www.occp.com/
(11) Canadian Agency for Drugs and Technologies in Health (CADTH). Guidelines for the economic evaluation of health technologies: Canada. Ottawa (ON); CADTH: 2006.
(12) Rutten-van Molken MP, Hoogendoorn M, Lamers LM. Holistic preferences for 1-year health profiles describing fluctuations in health: the case of chronic obstructive pulmonary disease. Pharmacoeconomics. 2009;27(6):465-77.
(13) Ringbaek T, Seersholm N, Viskum K. Standardised mortality rates in females and males with COPD and asthma. Eur Respir J. 2005 May;25(5):891-5.

Ontario Health Technology Assessment Series; Vol. 12: No. 12, pp. 1–61, March 2012 60
(14) Hoogendoorn M, Feenstra TL, Hoogenveen RT, Al M, Molken MR. Association between lung function and exacerbation frequency in patients with COPD. Int J Chron Obstruct Pulmon Dis. 2010;5:435-44.
(15) Rutten-van Molken MP, Oostenbrink JB, Miravitlles M, Monz BU. Modelling the 5-year cost effectiveness of tiotropium, salmeterol and ipratropium for the treatment of chronic obstructive pulmonary disease in Spain. Eur J Health Econ. 2007 Jun;8(2):123-35.
(16) Spencer M, Briggs AH, Grossman RF, Rance L. Development of an economic model to assess the cost effectiveness of treatment interventions for chronic obstructive pulmonary disease. Pharmacoeconomics. 2005;23(6):619-37.
(17) Anthonisen NR, Skeans MA, Wise RA, Manfreda J, Kanner RE, Connett JE. The effects of a smoking cessation intervention on 14.5-year mortality: a randomized clinical trial. Ann Intern Med. 2005 Feb 15;142(4):233-9.
(18) Ontario drug benefit formulary [Internet]. Toronto: Ministry of Health and Long-Term Care (Ontario); [updated 2011 Apr 15; cited 2011 May]. Available from: http://www.health.gov.on.ca/english/providers/program/drugs/odbf_eformulary.html
(19) Compendium of pharmaceuticals and specialties (Canada). 44th ed. Ottawa (ON): Canadian Pharmacists Association; 2009.
(20) Glaxosmithkline Nicorette Nicotine Gum 4mg Starter Kit 110 [Internet]. [updated 2011; cited 2011 Mar]. Available from: http://www.shopping.com/GlaxoSmithKline-Nicorette-Nicotine-Gum-4mg-Starter-Kit-110-GlaxoSmithKline/info
(21) Schedule of benefits for physician services under the Health Insurance Act: effective March 24, 2010. Toronto: Ministry of Health and Long-Term Care (Ontario); 2010.
(22) Guide to interdisciplinary provider compensation. Toronto: Ministry of Health and Long-Term Care (Ontario); 2011 May. Available from: http://www.health.gov.on.ca/transformation/fht/guides/fht_inter_provider.pdf
(23) Brooks D, Sottana R, Bell B, Hanna M, Laframboise L, Selvanayagarajah S, et al. Characterization of pulmonary rehabilitation programs in Canada in 2005. Can Respir J. 2007;14(2):87-92.
(24) Canadian classification of health interventions - ICD-10-CA/CCI. Ottawa (ON): Canadian Institute for Health Information; 2006.
(25) Gershon AS, Wang C, Wilton AS, Raut R, To T. Trends in chronic obstructive pulmonary disease prevalence, incidence, and mortality in ontario, Canada, 1996 to 2007: a population-based study. Arch Intern Med. 2010 Mar 22;170(6):560-5.
(26) Ontario Ministry of Health and Long-Term Care. IntelliHEALTH Ontario [database online]. Toronto (ON): Ontario Ministry of Health and Long-Term Care; [updated 2008; cited 2011 May]. Available from: https://www.intellihealth.moh.gov.on.ca/
(27) Lawati NA, FitzGerald JM. Acute exacerbation of chronic obstructive pulmonary disease. BC Med J. 2008;50(3):138-42.

Ontario Health Technology Assessment Series; Vol. 12: No. 12, pp. 1–61, March 2012 61
Health Quality Ontario 130 Bloor Street West, 10th Floor
Toronto, Ontario M5S 1N5
Tel: 416-323-6868 Toll Free: 1-866-623-6868
Fax: 416-323-9261 Email: [email protected]
www.hqontario.ca
ISSN 1915-7398 (online) ISBN 978-1-4435-8871-3 (PDF)
© Queen’s Printer for Ontario, 2012