cost-benefit of improving the efficiency of room air ... · cost-benefit of improving the...
TRANSCRIPT

LBNL-1005787
ERNEST ORLANDO LAWRENCE BERKELEY NATIONAL LABORATORY
Cost-Benefit of Improving the Efficiency
of Room Air Conditioners (Inverter and
Fixed Speed) in India
Nihar Shah, Nikit Abhyankar, Won Young Park, and Amol Phadke
Lawrence Berkeley National Laboratory
Saurabh Diddi Bureau of Energy Efficiency, Government of India
Deepanshu Ahuja, P.K. Mukherjee, and Archana Walia
Collaborative Labeling and Appliance Standards Program (CLASP)
Energy Analysis and Environmental Impacts Division
June 2016
This work was funded by the U.S.-India Space Cooling Collaboration through the U.S. Department of Energy’s Office of International Affairs under Lawrence Berkeley National Laboratory Contract No. DE-AC02-05CH11231.
2
Disclaimer
This document was prepared as an account of work sponsored by the United States Government. While
this document is believed to contain correct information, neither the United States Government nor any
agency thereof, nor The Regents of the University of California, nor any of their employees, makes any
warranty, express or implied, or assumes any legal responsibility for the accuracy, completeness, or
usefulness of any information, apparatus, product, or process disclosed, or represents that its use would
not infringe privately owned rights. Reference herein to any specific commercial product, process, or
service by its trade name, trademark, manufacturer, or otherwise, does not necessarily constitute or imply
its endorsement, recommendation, or favoring by the United States Government or any agency thereof, or
The Regents of the University of California. The views and opinions of authors expressed herein do not
necessarily state or reflect those of the United States Government or any agency thereof, or The Regents
of the University of California.
Ernest Orlando Lawrence Berkeley National Laboratory is an equal opportunity employer.
3
Acknowledgements
Thanks are due to Gabrielle Dreyfus, US Department of Energy, for her support, guidance and helpful
review, to Ari Reeves, and Amit Khare, CLASP, for their review and comments, the Room Air
Conditioners Manufacturers Association (RAMA) for generously providing much of the underlying data
and also their review and comments, Rajeev Ralhan, Price Waterhouse Coopers (PWC) for collecting the
cost data underlying this analysis, Anna Spurlock, and Alex Lekov, LBNL for their review and comments
and finally to Julie Glover and Heather Thomson for helping with administration and final publication.
Any errors and omissions are the authors' own.
This work was funded by the U.S.-India Space Cooling Collaboration through the U.S. Department of
Energy’s Office of International Affairs under Lawrence Berkeley National Laboratory Contract No. DE-
AC02-05CH11231.

4
Table of Contents
Acknowledgements ....................................................................................................................................... 3
Executive Summary ....................................................................................................................................... 5
Introduction ................................................................................................................................................... 6
Summary of Methodology ............................................................................................................................ 7
Detailed Methodology ................................................................................................................................... 9
Incremental Costs of Efficiency Improvement ............................................................................................. 9
Estimating AC Performance in the ISEER Metric ...................................................................................... 11
An Illustrative Example: Design Combinations and Incremental Cost of Increasing ISEER from 2.8
(W/W) to 3.5(W/W) ..................................................................................................................................... 11
Price Increase Required to Cover the Cost of Efficiency Improvement ..................................................... 12
Alternative Strategies to Reach ISEER of 3.5 and Estimates of the Price Increase ................................... 13
Least Cost Curve for Improving Efficiency ................................................................................................ 14
Commercial Availability of Efficient ACs ................................................................................................. 16
Cost-Benefit of Efficiency Improvement from a Consumer Perspective ................................................... 16
Conclusions ................................................................................................................................................. 18
References ................................................................................................................................................... 19
Appendix A: Trends in Efficiency and Prices for Room ACs and Appliances ......................................... 20
Appendix B: Incremental Costs and Energy Savings for Key Components ............................................... 24
Appendix C: Bill of Materials Costs for Fixed Speed ACs in India ........................................................... 25

5
Executive Summary
Improving efficiency of air conditioners (ACs) typically involves improving the efficiency of various
components such as compressors, heat exchangers, expansion valves, refrigerant and fans.1 We estimate
the incremental cost of improving the efficiency of room ACs based on the cost of improving the
efficiency of its key components. Further, we estimate the retail price increase required to cover the cost
of efficiency improvement, compare it with electricity bill savings, and calculate the payback period for
consumers to recover the additional price of a more efficient AC. We assess several efficiency levels,
two of which are summarized below.
Table S1: Cost-benefit of efficiency improvement from a consumer perspective
ISEER2
Retail price increase
required to cover the
cost of efficiency
improvement (Rs. %)
Net consumer savings = Bill
savings over lifetime –
increase in retail price (Rs.)
Simple payback
period (years)
(Watt/Watt)
Average
estimate
Range
with
sensitivity
analysis
Average
estimate
Range with
sensitivity
analysis
Average
estimate
Range
with
sensitivity
analysis
Improvement
from 2.8 to 3.5
4900
(~15%)
2450-7350
(7-20%) 26300 23700-29000 0.7 0.4-1.1
Improvement
from 2.8 to 4
10000
(~30%)
5000-
15000
(15-50%)
34100 30700-37500 1.5 0.8-2.3
Note: Assuming a least cost strategy to improve efficiency based on the cost of efficient components
The finding that significant efficiency improvement is cost effective from a consumer perspective is
robust over a wide range of assumptions. If we assume a 50% higher incremental price compared to our
baseline estimate, the payback period for the efficiency level of 3.5 ISEER is 1.1 years. Given the
findings of this study, establishing more stringent minimum efficiency performance criteria (one star
level) should be evaluated rigorously considering significant benefits to consumers, energy security and
environment.
1 Improvements in efficiency due to switching to low-GWP refrigerants are between +/-10%. Since alternate refrigerants are
still being tested and not commercialized yet in any equipment, we do not consider them here. See (Shah et al 2015) for more details.
2 In 2015, BEE adopted the ISO 16358 standard but modified the temperature bin distribution to account for the hotter
weather in India. BEE has developed the ISEER metric to be able to capture the seasonal energy efficiency performance of both fixed speed and inverter ACs. Hence we use ISEER as the room AC performance metric for this analysis. The units for this metric are Watt/Watt or W/W.

6
Introduction
Recent studies by the US Department of Energy, the European Ecodesign Initiative and the Super-
efficient Equipment and Appliance Deployment (SEAD) Initiative have shown significant cost effective
potential for improving room air conditioner efficiency (DOE, 2011, EuP, 2009, Shah et al, 2013, Phadke
et al, 2013). In this paper, we assess the cost and benefit of improving the efficiency of Room ACs using
recently collected data in India on the cost of key components of a Room AC with improved efficiency.
Cost-benefit of efficiency improvement for a Room AC from a consumer perspective can be assessed by
comparing the additional price of an efficient product with reduced electricity bills. One simple approach
to estimate the additional price for efficiency improvement is to compare the prices of baseline efficiency
products to efficient products available in the market. However, in several instances, efficient products
(for example five star ACs)3 are sold as premium products with additional features bundled with
efficiency and are likely to have higher cost margins.4 Hence the price difference between a baseline
efficiency model (one star or two stars) and a higher efficiency model (five star) could be due to several
factors in addition to efficiency and is typically significantly higher than what is required for just
improving efficiency. Although statistical approaches can be used to estimate the price increase due to
efficiency alone based on prices observed in the market, they face several limitations including the
inability to estimate varying profit margins across products. Further, assessment based on retail prices
alone cannot provide estimates of costs of improving the efficiency beyond what is currently available on
the market in a certain region or a country.
The retail price increase required to cover the cost of efficiency improvement can be based on a bottom up
estimate of the incremental cost of efficiency improvement and an estimate of the price based on an
estimate of the mark-up seen for baseline models which cover typical wholesale and retail costs. This has
been the preferred methodology in the US and EU to assess the impact on consumers of increasing the
stringency of the minimum energy performance standard (MEPs) which specify the minimum efficiency
requirement for a product to be sold in the market. This approach is used because the current price of an
efficient product (e.g., a five star AC) is not a good predictor of its future price if it becomes the baseline
product (e.g. a one or two star AC) with a revision of the stringency of MEPs given that baseline products
are likely to have lower margins. Studies have shown that the price of efficient products (which are
typically sold as premium products) drops when they become the base-line products with the increasing
stringency of MEPs (see Spurlock, 2014). Further, as discussed previously, a bottom up estimate of
incremental costs is possible even for efficiency levels that are currently not available in a particular
region or country. Next, we summarize this bottom up methodology which we use in this study.
3 Room AC efficiency in India is rated through a “star rating system” established by the Bureau of Energy Efficiency. Efficiency
levels progress from one-star which is the lowest efficiency to five-star which is the highest efficiency rating in the system. The rating is revised approximately every two years. 4 Examples of some non-energy related features are sleep mode of operation, air filtering, occupancy and image sensors,
ionization etc.

7
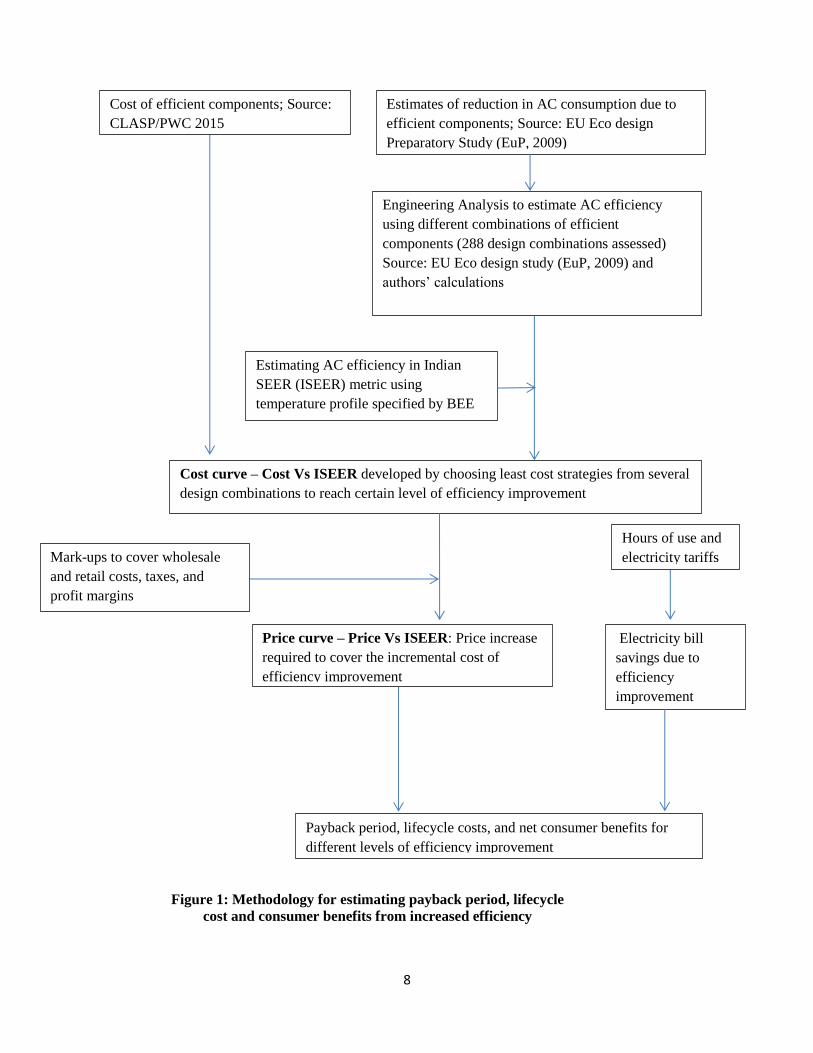
Summary of Methodology
Based on the estimates of reduction in AC electricity consumption due to improvement of efficiency of its
key components, we analyze the performance of an AC under several configurations of more efficient
components (288 unique design combinations, for example of different compressor and heat exchanger
designs)5. Since our analysis is based on the EU Ecodesign preparatory study, the AC performance is
analyzed using energy savings estimates in that study. From these we estimate AC performance in the
Indian SEER (ISEER metric) by developing a relationship using performance data between the ISEER
and EER for fixed speed ACs and a relationship between the ISEER and the EUSEER for variable speed
ACs considering the temperature profile specified by the Bureau of Energy Efficiency (BEE) for the
ISEER metric.6
Based on the cost estimates of more efficient components and the results of the analysis, we estimate the
incremental cost of each design combination. We then estimate the lowest cost design configuration to
reach a certain level of efficiency to develop a cost curve for efficiency improvement. Note that we use
estimates of cost of more efficient components in India that were developed by the Collaborative Labels
and Standards Project (CLASP) and Price Waterhouse Coopers (PWC) using market research and
interviews with appliance and component manufacturers.
We then estimate the price increase required to cover the cost of efficiency improvement based on
estimates of mark-ups to cover wholesale and retail costs, profit margins, and taxes, reported in CLASP,
2015. We estimate the electricity bill savings due to efficiency improvement and compare these with the
price increase required for improving efficiency to estimate payback periods, life cycle costs, and net
consumer benefits. See Figure 1 below for the summary of this methodology.
5 The permutations and combinations of different design options to improve efficiency shown in Table 1 below with each
other leads to 288 unique designs of different compressors, heat exchangers, expansion devices and fixed or variable speed drives. 6 While the EU energy savings estimates are evaluated at the ISO 5151 T2 conditions and the ISEER is evaluated at ISO 5151
T1 test conditions, we assume that the energy performance of both the baseline and more efficient ACs shown in Table 1 below is affected similarly at higher temperatures as a first order approximation.
8
Cost of efficient components; Source:
CLASP/PWC 2015
Cost curve – Cost Vs ISEER developed by choosing least cost strategies from several
design combinations to reach certain level of efficiency improvement
Engineering Analysis to estimate AC efficiency
using different combinations of efficient
components (288 design combinations assessed)
Source: EU Eco design study (EuP, 2009) and
authors’ calculations
Estimates of reduction in AC consumption due to
efficient components; Source: EU Eco design
Preparatory Study (EuP, 2009)
Estimating AC efficiency in Indian
SEER (ISEER) metric using
temperature profile specified by BEE
Price curve – Price Vs ISEER: Price increase
required to cover the incremental cost of
efficiency improvement
Electricity bill
savings due to
efficiency
improvement
Payback period, lifecycle costs, and net consumer benefits for
different levels of efficiency improvement
Mark-ups to cover wholesale
and retail costs, taxes, and
profit margins
Figure 1: Methodology for estimating payback period, lifecycle
cost and consumer benefits from increased efficiency
Hours of use and
electricity tariffs
9
Methodology Validation
We provide an explanation of why a certain design combination leads to a particular level of efficiency
improvement and also provide an estimate based on a simple and transparent engineering analysis.
Further, we show that the efficiency levels analyzed are widely commercially available in the global
market by identifying models which reach those efficiency levels. We also provide an initial validation of
our price prediction for higher efficiency models by observing prices of such models in the global market.
Detailed Methodology
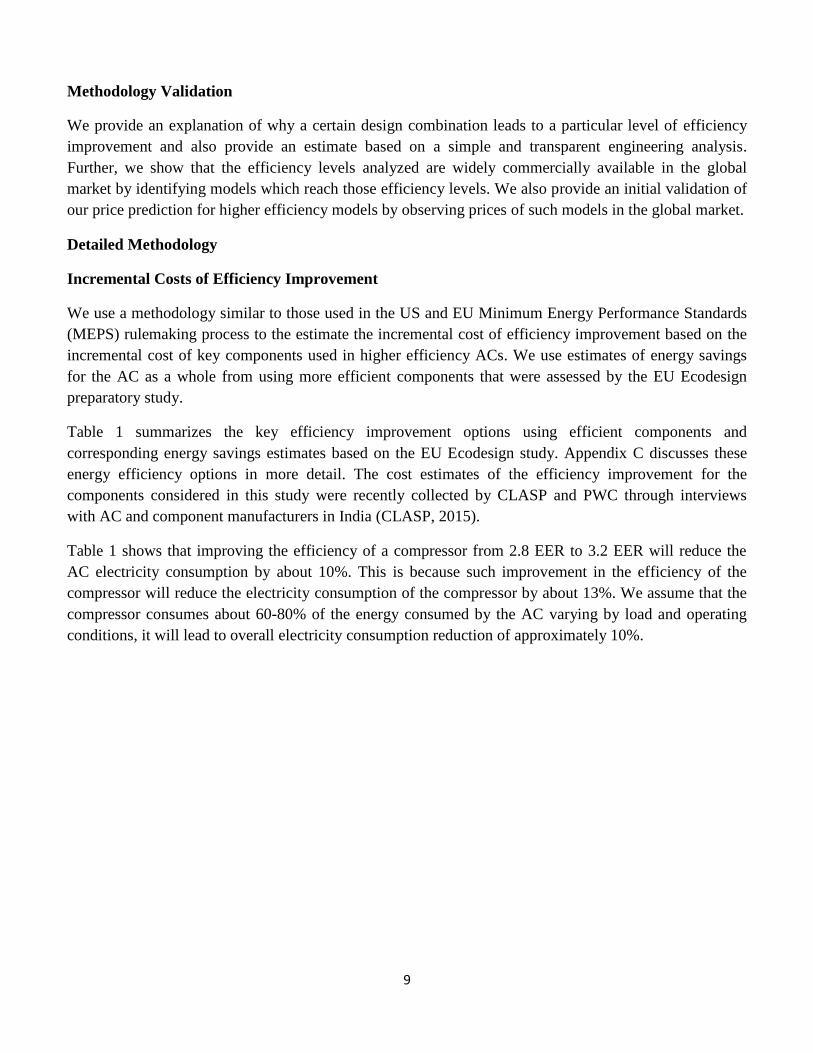
Incremental Costs of Efficiency Improvement
We use a methodology similar to those used in the US and EU Minimum Energy Performance Standards
(MEPS) rulemaking process to the estimate the incremental cost of efficiency improvement based on the
incremental cost of key components used in higher efficiency ACs. We use estimates of energy savings
for the AC as a whole from using more efficient components that were assessed by the EU Ecodesign
preparatory study.
Table 1 summarizes the key efficiency improvement options using efficient components and
corresponding energy savings estimates based on the EU Ecodesign study. Appendix C discusses these
energy efficiency options in more detail. The cost estimates of the efficiency improvement for the
components considered in this study were recently collected by CLASP and PWC through interviews
with AC and component manufacturers in India (CLASP, 2015).
Table 1 shows that improving the efficiency of a compressor from 2.8 EER to 3.2 EER will reduce the
AC electricity consumption by about 10%. This is because such improvement in the efficiency of the
compressor will reduce the electricity consumption of the compressor by about 13%. We assume that the
compressor consumes about 60-80% of the energy consumed by the AC varying by load and operating
conditions, it will lead to overall electricity consumption reduction of approximately 10%.

10
Table 1: Component-wise incremental costs of efficiency improvement for 1.5 ton ACs (Source: CLASP and
PWC, 2015)
Component
Energy
Savings
from
Base
Case1
Incremental
Manufacturing Cost
(Rs)
Retail Price Increase
from Base Case (Rs) 2
Baseline
Range
(50% lower
to 50%
higher than
baseline)
Baseline Range
Baseline Compressor (2.8 EER), 1.5 TR Cooling
Capacity - -
-
3.0 EER compressor 5.5% 200 100-300 480 240-720
3.2 EER compressor 10.5% 400 200-600 960 480-1440
3.4 EER compressor 15.0% 575 280-860 1,380 690-2070
Alternating Current Compressor variable speed drive 21.0% 3,600 1800-5400 8,640 4320-12960
Direct Current Compressor variable speed drive 23.0% 5,400 2700-8100 12,960 6480-19440
Variable speed drives for fans and compressor 26.0% 6,300 3150-9450 15,120 7560-22680
UA value of both heat exchangers increased by 20% 7.5% 1,470 735-2200 3,528 1760-5290
UA value of both heat exchangers increased by 40% 13.5% 3,240 1620-4860 7,776 3880-11660
UA value of both heat exchangers increased by 60% 17.5% 4,210 2100-6310 10,104 5050-15150
UA value of both heat exchangers increased by 80% 21.0% 6,080 3040-9120 14,592 7300-21890
UA value of both heat exchangers increased by 100% 24.0% 7,350 3675-
11000 17,640 8820-2640
Thermostatic Expansion Valve 3.5% 250 125-375 600 300-900
Electronic Expansion Valve 6.5% 1500 750-2250 3600 1800-5400 1
Energy savings estimates are based on EuP, 2009 energy savings data as per EU test procedure. These will be different if the
ISEER metric is used. We apply an additional adjustment for conversion of these values to ISEER as discussed above.
2Estimates based on reported component costs from CLASP, 2015 and a markup of 140% for assembly, wholesale and retail
costs and taxes as discussed earlier. PWC and CLASP estimate manufacturing cost of a baseline model to be 14500 (see
Appendix B) and a price of baseline model to be 34,800 which indicates a mark-up of 140%. Cost for Thermostatic Expansion
Valve is interpolated based on EuP, 2009 and reported cost for Electronic Expansion Valve based on CLASP, 2015.
Several combinations of efficient components can be used to reduce the consumption of an AC and reach
a certain efficiency level. We draw upon the simulations of AC performance with different design
combinations of efficient components conducted in the EU Ecodesign study. Note that the EU Ecodesign
study verified the simulated performance using actual performance data on efficient ACs. Since that study
reported AC performance in EU SEER metric, we discuss how we adjusted these estimates for our
analysis to report AC performance in the ISEER metric by taking into account the temperature profile
specified by BEE for the ISEER metric.
11
Estimating AC Performance in the ISEER Metric
Most countries in the world, including India and the EU use the International Organization for
Standardization (ISO) standard 5151 test procedure for testing the performance of room ACs.
Until 2014, the standards and labeling program in India only covered fixed speed ACs and the prevalent
metric to measure Room AC performance was the Energy Efficiency Ratio (EER). In 2013, the ISO
issued the ISO standard 16358 procedure for calculating the seasonal performance metric for both fixed-
speed and inverter ACs using a weighted average based on a standard temperature bin distribution, of AC
performance using ISO 5151 test data. For cooling only operation, this metric is known as the cooling
season performance factor (CSPF).
In 2015, BEE has adopted the ISO 16358 standard but modified the temperature bin distribution to
account for the hotter weather in India to calculate the Indian SEER (ISEER) metric for fixed speed and
inverter ACs. BEE has developed the ISEER metric to measure the performance of Room ACs in India in
the future. Hence we use ISEER as the room AC performance metric for this analysis. The units for this
metric are Watt/Watt or W/W.
Based on this Indian temperature distribution, and test data on several AC models, we established a
relationship between the ISEER and EER for fixed speed ACs and ISEER and EU SEER for variable
speed ACs based on performance data of variable speed AC models.
An Illustrative Example: Design combinations and incremental cost of increasing ISEER from 2.8
(W/W) to 3.5(W/W)
Although several combinations of more efficient components can be used to improve the AC efficiency,
as an example, we consider efficiency improvement in two components, the compressor and the
expansion valve.
Based on the preparatory study done for the EU Ecodesign regulation (EuP, 2009) the baseline room AC
model with 2.8 EER uses a 2.8 EER compressor and a capillary tube expansion valve.7
Based on the data in Table 1, using a 3.4 EER compressor instead of 2.8 EER compressor reduces the
electricity consumption of the baseline room AC by 15%. The estimate of 15% energy savings are
verified with actual performance measurements conducted as part of the EU Ecodesign study. Improving
the EER of a compressor from 2.8 to 3.4 will reduce the compressor electricity consumption by roughly
21% (3.4/2.8-1) and given that compressor accounts for about 70% of the electricity consumed by the AC,
it reduces the energy consumption of the AC by about 15%. Using heat exchangers with UA value 20%
higher than the baseline model increase energy savings by about 7.5% of a baseline AC model. The
engineering simulations shown in the EU Ecodesign Study show that by using these two options, the
consumption of the baseline AC can be reduced by 20%. If improving the efficiency of the compressor
and using an electronic expansion valve reduces the AC energy consumption by 15% and 7.5%
7 Note that the 2.8 EER is roughly equivalent (after rounding) to a 2.8 ISEER level for fixed speed ACs.
12
respectively, simultaneously implementing these options will reduce the AC energy consumption by
roughly [1- (1-0.15)*(1- 0.075)] = 0.21, i.e., just over 21%. This is because reduction due to a second
option applies to the already reduced energy consumption from the first option and hence the total energy
savings are less than a simple addition of savings from the two options. Incremental cost of improving the
ISEER from 2.8 to 3.5 is Rs. 2045 (Rs. 575 for the efficient compressor + Rs. 1470 for the efficient heat
exchangers)
Price Increase Required to Cover the Cost of Efficiency Improvement
The price increase required to cover the cost of efficiency improvement is estimated as:
Price increase required = incremental cost of efficiency improvement*mark-up for a baseline product
Mark-up is estimated based on estimates of manufacturing costs and the retail prices observed in the
market. Based on the PWC-CLASP 2015 report, manufacturing cost of a baseline 1.5 Ton Room AC is
about Rs. 14500 and the retail prices of baseline (1-2 star) models is about Rs. 34,800.8 Hence the total
mark-up for base line products in the market is about 140% which means that cost increase of Rs. 1000 to
improve efficiency will require a price increase of approximately Rs. 2400 to cover items such as profit
margins, wholesale, and retail costs. Across many markets the markup for baseline models is found to
stay the same even after the revision of MEPS (Spurlock, 2013) i.e. in the Indian context, even if the star
labels are revised the markup for one and two star products (entry-level) is expected to remain the same.
Figure 2 shows a sensitivity analysis of the retail prices for 50% higher and lower costs.
The mark-up for a 5 star high efficiency models on the market may be higher due to other non-efficiency
related features and also because these products are marketed as “premium” products implying other
pricing and brand positioning strategies. The markup on premium products is between 200-240% based
on data collected by CLASP.
8 Source: CLASP

13
Figure 2: Sensitivity analysis for total markup. Total markup is assumed to be 140%.9
Alternative Strategies to Reach ISEER of 3.5 and Estimates of the Price Increase
Incremental cost of improving the ISEER from 2.8 to 3.5 is about Rs. 2045 (Rs. 575 for the efficient
compressor + Rs. 1470 for efficient heat exchangers) and will require a retail price increase of Rs. 4900
(based on a 140% mark-up) to cover the incremental cost of efficiency improvement.
In arriving at an estimate of the incremental cost of efficiency improvement as discussed above, we
estimated the least cost approach to improving efficiency based on the cost data collected by PWC and
CLASP. However, various manufacturers may have other approaches to arrive at the same level of
efficiency. In Table 2 below, we outline various ways to achieve the ISEER level of about 3.5 (W/W) and
estimate additional manufacturing costs, retail prices (assuming 140% markup), annual bill savings, and
payback periods. Annual bill savings are estimated assuming 1600 hours of operation per year (based on
hours of use specified by the Bureau of Indian Standards) and an electricity tariff of Rs. 7/kWh which is
typical tariff for residential consumers in higher consumption slabs given that use of AC corresponds to
being in a higher consumption slab. Note that we test the sensitivity of our findings to alternative
assumptions of hours of use and electricity tariffs.
9 ISEER levels calculated are shown for an India-specific temperature distribution being considered by India’s Bureau of
Energy Efficiency (BEE) that considers temperatures from 24 deg. C to 43 deg. C and considering 1600 hours of use annually.
0
10
20
30
40
50
60
70
80
90
2.0 3.0 4.0 5.0 6.0 7.0
Co
st a
nd
Pri
ce (
tho
usa
nd
Rs)
ISEER (W/W)
Least Mfg Costs and Retail Prices by ISEER
Least cost validation
Estimated Retail Price (1000 Rs)50% higher costs
50% lower costs

14
Table 2: Range of additional manufacturing costs, retail prices, and payback period for achieving ISEER of
3.5 W/W
ISEER
(W/W) Compressor
Heat
Exchanger
Expansion
Valve
Incremental
Manufacturing
Cost (Rs.)
Additional
Retail Price
(Rs.)
Electricity
Consumption
(kW)
Annual
Energy
Consumption
(kWh/yr)
Annual
Bill
Saving
(Rs/yr)
Payback
Period
(yrs)
3.5
3.4 EER
Compressor
(Rs. 575)
UA value
of HX
increased
by 20%
(Rs. 1470)
Capillary
Tube 2045 4908 1.5 2400 4200 1.2
3.5
3.2 EER
Compressor
(Rs. 400)
UA value
of HX
increased
by 40%
(Rs. 3240)
Capillary
Tube 3640 8736 1.5 2400 4200 2.1
3.5
3.0 EER
Compressor
(Rs. 200)
UA value
of HX
increased
by 40%
(Rs. 3240)
Thermostatic
Expansion
Valve (Rs.
250)
3690 8856 1.5 2400 4200 2.1
Least Cost Curve for Improving Efficiency
Based on the data on costs of and savings due to efficient AC components (shown in Table 1), we
estimated efficiency improvements and incremental costs of all possible design combinations (288) of
efficient components (e.g. more efficient heat exchangers, compressors, variable speed drives, and
expansion valves) to estimate the lowest cost of improving efficiency of a Room AC at various levels of
efficiency improvement.
This cost versus efficiency curve (see Figure 2) approximates the decisions undertaken by manufacturers
in designing higher efficiency air conditioners. As seen in Figure 2, if least cost strategies are
implemented, an energy efficiency improvement of approximately 20% (to an ISEER of 3.5 W/W) can be
achieved at a relatively modest incremental retail price of about 15% and a more substantial increase in
energy efficiency of approximately 30% (to an ISEER of 4 W/W) can be achieved at an incremental price
of Rs 9360 (~27%).
Figure 2 also shows retail prices where the incremental cost of the components is 50% higher and 50%
lower than our baseline estimates. Studies have shown that the actual incremental costs and prices are
typically significantly lower than those estimated by bottom up analysis because such analyses do not
taken into account future price reduction in efficient technology due to learning or economies of scale (see
Dale et al., 2013 and Taylor et al, 2015). We show the effect of such a scenario by showing retail prices
assuming 50% lower incremental manufacturing costs for efficient components. We also model a scenario
where incremental manufacturing costs are 50% higher to test the robustness of finding if costs are higher
than what we have estimated.

15
We have also shown actual retail prices of split room AC models in India and Korea to provide an initial
validation of our price predictions. For India, we have shown prices of 1.5 Ton models only.
Note that while improving the efficiency of Room ACs, manufacturers may consider criteria other than
cost and hence the strategies arrived with a least cost criteria may not always mimic the design decisions
of the manufacturers. Our cost-benefit analysis, which considers a least cost for efficiency improvement
strategy, suggests adoption of inverters only beyond ISEER of 4.5.
Engineering based techno-economic analysis including this analysis typically show that improving
efficiency adds to costs which leads to increase in retail prices at a given point in time. However, several
studies tracking efficiency and price trends over time have shown that efficiency of appliances and their
components improves over time while the prices continue to decline. For example in Japan, between 1995
and 2008, efficiency improved by 180% while prices dropped by over 50 % in real terms (See Appendix
B for details). While, several factors such as economies of scale, and changes in mark-ups have been
identified as potential drivers for this overall trend, the primary driver is likely technological learning.
Hence the revision of the stringency of the minimum energy performance standard (one star level) may
not result in increase in prices in real terms compared to the levels before the revision. For example, a
more stringent standard could speed up technological change or increase economies of scale in production
of the new minimum efficiency level products, thereby reducing the prices of those products further than
this bottom-up engineering analysis reflects.
Commercial Availability of Efficient ACs
Given that the current labeling program in India only covers fixed speed ACs, independent information
from the Indian market on performance is only available for fixed speed ACs. Currently, Godrej’s NXW
inverter AC which with an estimated ISEER of 5.2 is one of the most efficient inverter AC on the Indian
market and is sold at Rs. 57,500.10
Cost-Benefit of Efficiency Improvement from a Consumer Perspective
Figure 2 above shows the estimates of retail price increases required to cover the cost of efficiency
improvement which the consumers have to bear. Efficiency improvements also lead to reduced electricity
consumption and bills. Table 3 below shows increase in retail prices, consumer bill savings over the
lifetime of the ACs, consumer payback period, and the return on consumer investment (due to increased
retail price) given the bill savings.
10see:http://www.godrejappliances.com/GodrejAppliances/product.aspx?id=6&menuid=346&catid=92&p
roductid=4153&subcatid=122&subsubcatid=736
16
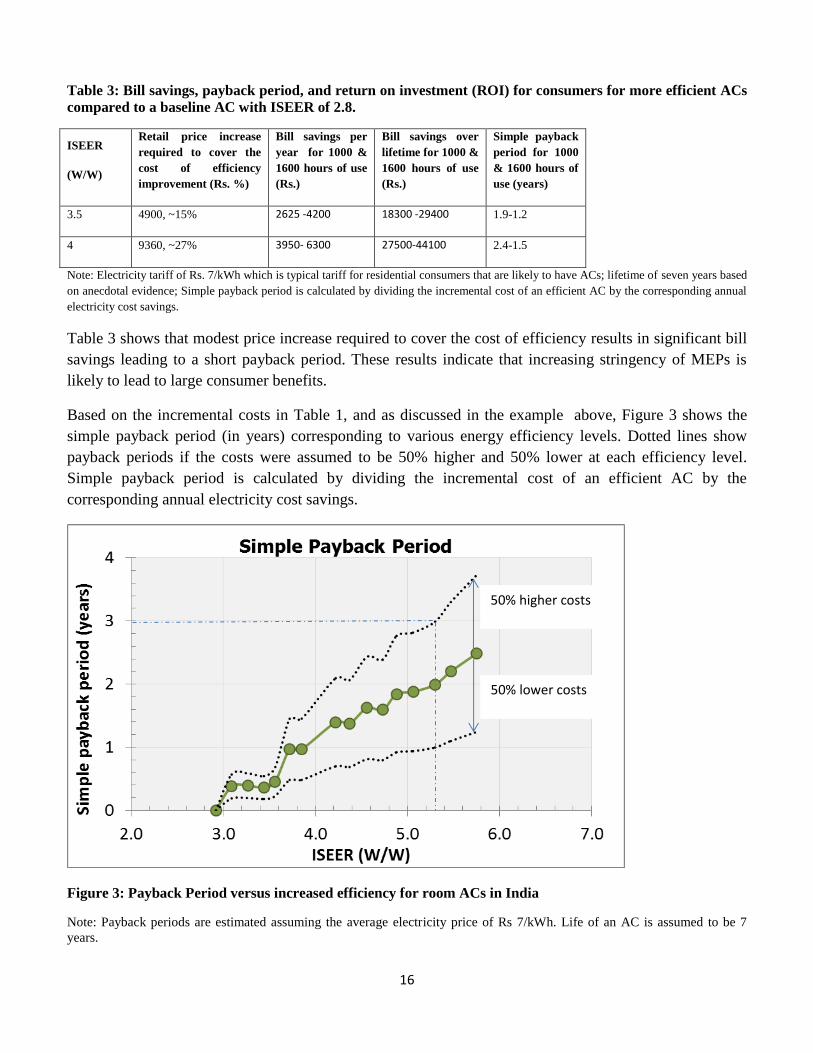
Table 3: Bill savings, payback period, and return on investment (ROI) for consumers for more efficient ACs
compared to a baseline AC with ISEER of 2.8.
ISEER
(W/W)
Retail price increase
required to cover the
cost of efficiency
improvement (Rs. %)
Bill savings per
year for 1000 &
1600 hours of use
(Rs.)
Bill savings over
lifetime for 1000 &
1600 hours of use
(Rs.)
Simple payback
period for 1000
& 1600 hours of
use (years)
3.5 4900, ~15% 2625 -4200 18300 -29400 1.9-1.2
4 9360, ~27% 3950- 6300 27500-44100 2.4-1.5
Note: Electricity tariff of Rs. 7/kWh which is typical tariff for residential consumers that are likely to have ACs; lifetime of seven years based
on anecdotal evidence; Simple payback period is calculated by dividing the incremental cost of an efficient AC by the corresponding annual
electricity cost savings.
Table 3 shows that modest price increase required to cover the cost of efficiency results in significant bill
savings leading to a short payback period. These results indicate that increasing stringency of MEPs is
likely to lead to large consumer benefits.
Based on the incremental costs in Table 1, and as discussed in the example above, Figure 3 shows the
simple payback period (in years) corresponding to various energy efficiency levels. Dotted lines show
payback periods if the costs were assumed to be 50% higher and 50% lower at each efficiency level.
Simple payback period is calculated by dividing the incremental cost of an efficient AC by the
corresponding annual electricity cost savings.
Figure 3: Payback Period versus increased efficiency for room ACs in India
Note: Payback periods are estimated assuming the average electricity price of Rs 7/kWh. Life of an AC is assumed to be 7
years.
50% higher costs
50% lower costs
17
If one considers a three year payback as a criterion for consumer cost effectiveness, efficiency
improvement of ISEER from 2.8 to over 5.2 ISEER is cost effective depending on the assumptions about
costs.
Consumer benefits and payback period depends on their electricity tariff. Table 4 shows alternative
assumptions tested and the corresponding payback period ranges for 3.5 ISEER and 4.0 ISEER for a
range of electricity tariffs.

18
Table 4: Sensitivity of payback period estimates to electricity prices and incremental costs
Base case
electricity
price
Sensitivity
case
electricity
price
Rationale Effect on
payback
period for 3.5
ISEER (yrs)11
Effect on
payback
period for 4.0
ISEER (yrs)
Rs. 7/kWh Rs5-10/kWh Tariffs vary across states and consumer categories. In some
states commercial tariffs are as high as Rs. 10/kWh
whereas for some exceptions, tariffs are as low as Rs
5/kWh for residential consumers for the appropriate slab
(higher consumption slab)
0.5-1.0 1.1-2.1
Consumer benefits will be lowest in the scenario where electricity price and hours of use are lower and
incremental price is higher. Even in such a scenario, the payback period for improving the ISEER to 3.5 is
less than three years indicating significant net consumer benefits even under such an unlikely worst case
scenario from a consumer benefits perspective.
Conclusions
If a least cost strategy is followed, significant efficiency improvement can be achieved at a modest
incremental cost which requires a modest increase in retail price. This price increase will be paid back
relatively quickly through electricity bill savings.
ISEER improvement by 20% to 3.5(W/W) will require a retail price increase of Rs. 4900 (~15%
increase over baseline) to cover the cost of efficiency improvement.
ISEER of a Room AC improvement by over 30% to 4(W/W) will require a retail price increase of
Rs. 9360 (~27% increase over baseline) to cover the cost of efficiency improvement.
Increasing the stringency of MEPS is one of the key strategies to ensure improvement in the
efficiency of the AC models sold in the market and should be evaluated rigorously considering the
findings of this study.
11
Please note that higher electricity prices result in lower payback period as the electricity bill savings from efficiency are higher. Hence the 5Rs/kWh electricity price obtains the higher range of payback periods, i.e. 1.0 year for a 3.5 ISEER and 2.1 years for a 4 ISEER efficiency level, while the 10Rs/kWh electricity price results in the lower range of payback periods i.e. 0.5-1.1years for 3.5 and 4 ISEER efficiency levels respectively. The payback periods are presented in ascending order for the ease of the reader.

19
References
1) DOE, 2011, “Technical Support Document: Energy Efficiency Program for Consumer Products:
Residential Central Air Conditioners, Heat Pumps, and Furnaces”.
2) EuP, 2009 “ECODESIGN of Energy using Products-Preparatory study on the environmental performance
of residential room conditioning appliances Lot 10, Task 7 Final report”.
3) Shah, N., Waide, P. and Phadke, A. 2013 “Cooling the Planet: Opportunities for Deployment of
Superefficient Room Air Conditioners”.
4) CLASP, 2015 “Techno-economic assessment, revision and racheting up of energy performance standards
of room-air conditioners<3TR- CLASP”(unpublished draft report).
5) Phadke, A., N. Abhyankar, and N. Shah, 2013 “Avoiding 100 New Power Plants by Increasing Efficiency
of Room Air Conditioners in India: Opportunities and Challenges” Presented at Energy Efficiency in
Domestic Appliances and Lighting Conference, Coimbra, Portugal, 11-13 September, 2013.
6) Phadke, A. Park, W.Y., Abhyankar, N., and Shah, N. 2014, “Appliance Standards & Labeling Policies,
Energy Efficiency, and Prices: Empirical Evidence for Residential Air-Conditioners” (unpublished draft).
7) Shah, N. Wei, M Letschert, V and Phadke A (2015). “Benefits of Leapfrogging to Superefficiency and Low
Global Warming Potential Refrigerants in Room Air Conditioning”. LBNL-1003671
8) Spurlock, C. A. (2013). “Appliance Efficiency Standards and Price Discrimination”. LBNL-6283,
Lawrence Berkeley National Laboratory.
9) OEA. 2009. Wholesale Price Index (WPI) Data 1994-2005. Office of the Economic Advisor to the
Government of India (Ministry of Commerce and Industry).
10) ———. 2013. Wholesale Price Index (WPI) Data 2006-2013. Office of the Economic Advisor to the
Government of India (Ministry of Commerce and Industry).
11) Taylor, Margaret, C. Anna Spurlock, and Hung-Chia Yang. "Confronting Regulatory Cost and
Quality Expectations: An Exploration of Technical Change in Minimum Efficiency Performance
Standards.", 2015. LBNL-1000576
20
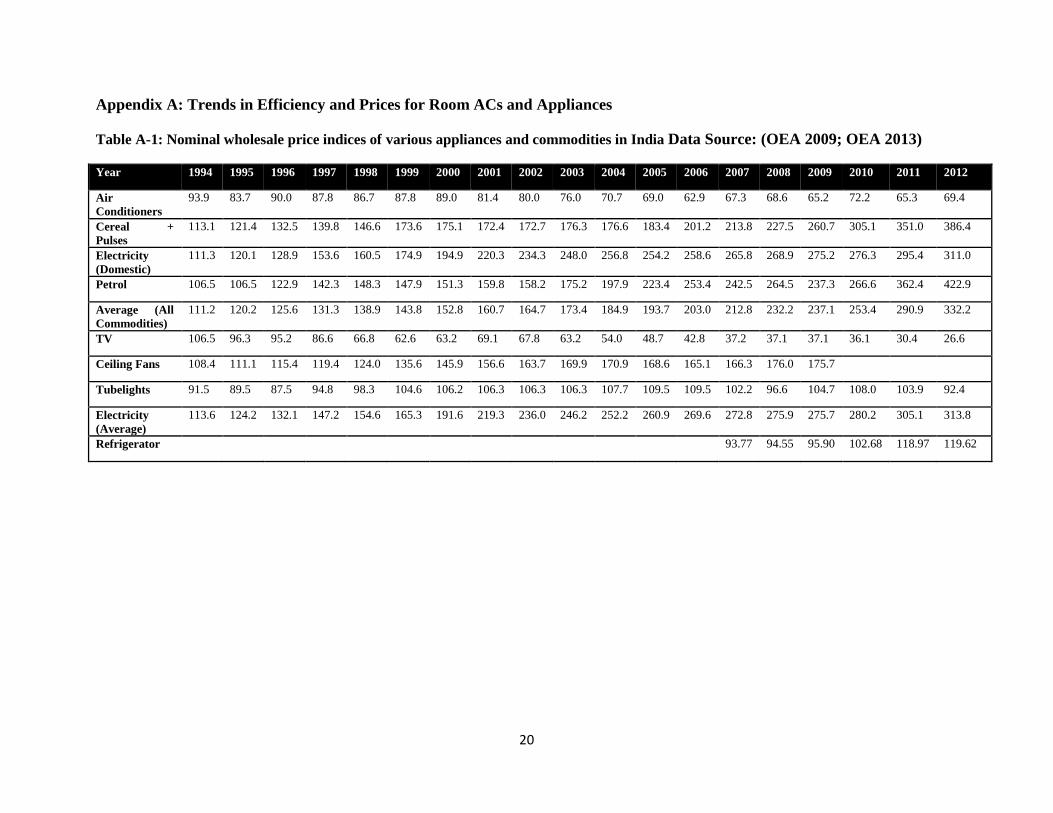
Appendix A: Trends in Efficiency and Prices for Room ACs and Appliances
Table A-1: Nominal wholesale price indices of various appliances and commodities in India Data Source: (OEA 2009; OEA 2013)
Year 1994 1995 1996 1997 1998 1999 2000 2001 2002 2003 2004 2005 2006 2007 2008 2009 2010 2011 2012
Air
Conditioners
93.9 83.7 90.0 87.8 86.7 87.8 89.0 81.4 80.0 76.0 70.7 69.0 62.9 67.3 68.6 65.2 72.2 65.3 69.4
Cereal +
Pulses
113.1 121.4 132.5 139.8 146.6 173.6 175.1 172.4 172.7 176.3 176.6 183.4 201.2 213.8 227.5 260.7 305.1 351.0 386.4
Electricity
(Domestic)
111.3 120.1 128.9 153.6 160.5 174.9 194.9 220.3 234.3 248.0 256.8 254.2 258.6 265.8 268.9 275.2 276.3 295.4 311.0
Petrol 106.5 106.5 122.9 142.3 148.3 147.9 151.3 159.8 158.2 175.2 197.9 223.4 253.4 242.5 264.5 237.3 266.6 362.4 422.9
Average (All
Commodities)
111.2 120.2 125.6 131.3 138.9 143.8 152.8 160.7 164.7 173.4 184.9 193.7 203.0 212.8 232.2 237.1 253.4 290.9 332.2
TV 106.5 96.3 95.2 86.6 66.8 62.6 63.2 69.1 67.8 63.2 54.0 48.7 42.8 37.2 37.1 37.1 36.1 30.4 26.6
Ceiling Fans 108.4 111.1 115.4 119.4 124.0 135.6 145.9 156.6 163.7 169.9 170.9 168.6 165.1 166.3 176.0 175.7
Tubelights 91.5 89.5 87.5 94.8 98.3 104.6 106.2 106.3 106.3 106.3 107.7 109.5 109.5 102.2 96.6 104.7 108.0 103.9 92.4
Electricity
(Average)
113.6 124.2 132.1 147.2 154.6 165.3 191.6 219.3 236.0 246.2 252.2 260.9 269.6 272.8 275.9 275.7 280.2 305.1 313.8
Refrigerator 93.77 94.55 95.90 102.68 118.97 119.62

21
Table A-2: Real (inflation adjusted) wholesale price indices of various appliances and commodities in India Data Source: (OEA 2009;
OEA 2013)
Year 1994 1995 1996 1997 1998 1999 2000 2001 2002 2003 2004 2005 2006 2007 2008 2009 2010 2011 2012
Air Conditioners 84 70 72 67 62 61 58 51 49 44 38 36 31 32 30 27 28 22 21
Cereal + Pulses 102 101 105 106 106 121 115 107 105 102 96 95 99 100 98 110 120 121 116
Electricity
(Domestic)
100 100 103 117 116 122 128 137 142 143 139 131 127 125 116 116 109 102 94
Petrol 96 89 98 108 107 103 99 99 96 101 107 115 125 114 114 100 105 125 127
Average (All
Commodities)
100 100 100 100 100 100 100 100 100 100 100 100 100 100 100 100 100 100 100
TV 96 80 76 66 48 44 41 43 41 36 29 25 21 17 16 16 14 10 8
Ceiling Fans 97 92 92 91 89 94 95 97 99 98 92 87 81 78 76 74 0 0 0
Tubelights 82 74 70 72 71 73 70 66 65 61 58 57 54 48 42 44 43 36 28
Electricity
(Average)
102 103 105 112 111 115 125 136 143 142 136 135 133 128 119 116 111 105 94
Refrigerator 90 85 82 81 91 83 76
Note: All prices are converted to 1994 base year and compared with the average WPI for all commodities. The 2009 OEA report used 1994 as the
base year series and the 2013 report used 2005 as the base year.

22
Figure A-1: Real (inflation adjusted) prices of various appliances in India Data Source: (OEA 2009;
OEA 2013)
Authors’ calculation based on Kimura 2010, Shibata 2012, and CPI data from the Japanese Bureau of Statistics
Figure A-2: Room AC (2.8kW) Efficiency12
and Price Trends in Japan
12
For energy efficiency metric for ACs, Japan used the average coefficient of performance (COP) combined with
cooling and heating COPs, but for the second target year (2010), modified test methods and replaced the COP metric

23
Authors’ calculation based on OEA 2009, OEA 2013
Figure A-3: Room AC Efficiency and Price Trends in India
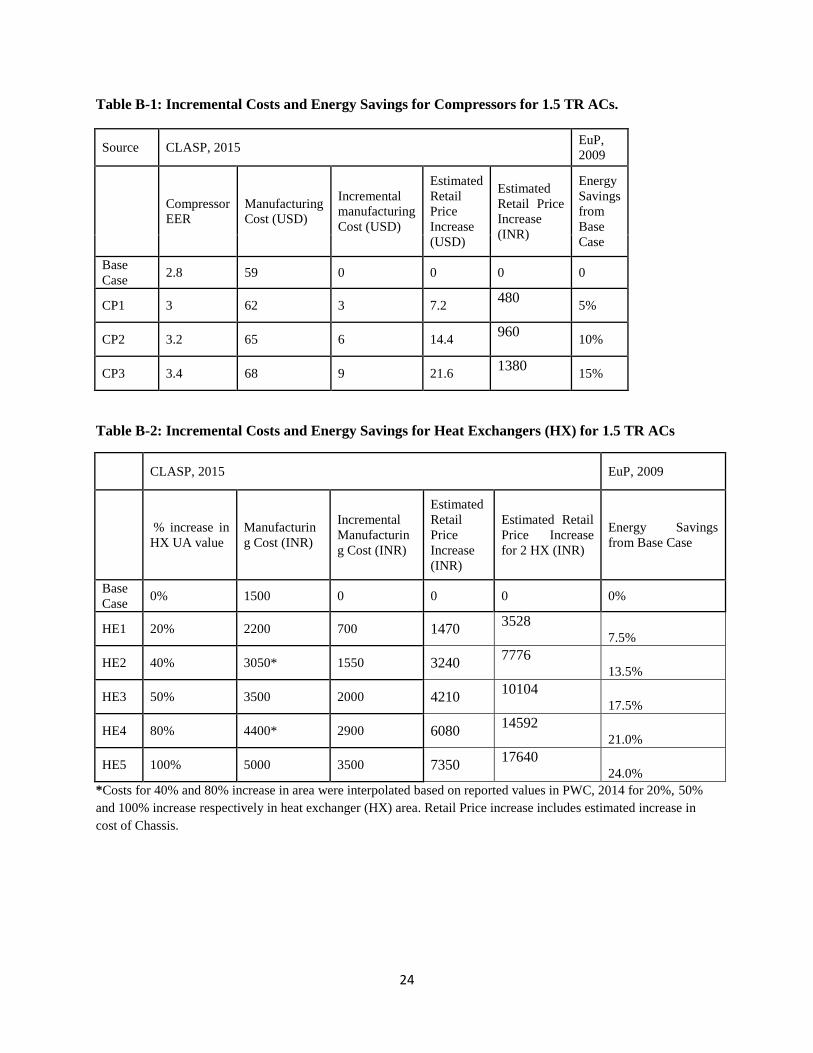
Appendix B: Incremental Costs and Energy Savings for Key Components
with annual performance factor (APF) which reflects the actual changes of outdoor temperature and corresponding
indoor thermal load.
24
Table B-1: Incremental Costs and Energy Savings for Compressors for 1.5 TR ACs.
Source CLASP, 2015 EuP,
2009
Compressor
EER
Manufacturing
Cost (USD)
Incremental
manufacturing
Cost (USD)
Estimated
Retail
Price
Increase
(USD)
Estimated
Retail Price
Increase
(INR)
Energy
Savings
from
Base
Case
Base
Case 2.8 59 0 0 0 0
CP1 3 62 3 7.2 480
5%
CP2 3.2 65 6 14.4 960
10%
CP3 3.4 68 9 21.6 1380
15%
Table B-2: Incremental Costs and Energy Savings for Heat Exchangers (HX) for 1.5 TR ACs
CLASP, 2015 EuP, 2009
% increase in
HX UA value
Manufacturin
g Cost (INR)
Incremental
Manufacturin
g Cost (INR)
Estimated
Retail
Price
Increase
(INR)
Estimated Retail
Price Increase
for 2 HX (INR)
Energy Savings
from Base Case
Base
Case 0% 1500 0 0 0 0%
HE1 20% 2200 700 1470 3528
7.5%
HE2 40% 3050* 1550 3240 7776
13.5%
HE3 50% 3500 2000 4210 10104
17.5%
HE4 80% 4400* 2900 6080 14592
21.0%
HE5 100% 5000 3500 7350 17640
24.0%
*Costs for 40% and 80% increase in area were interpolated based on reported values in PWC, 2014 for 20%, 50%
and 100% increase respectively in heat exchanger (HX) area. Retail Price increase includes estimated increase in
cost of Chassis.
25
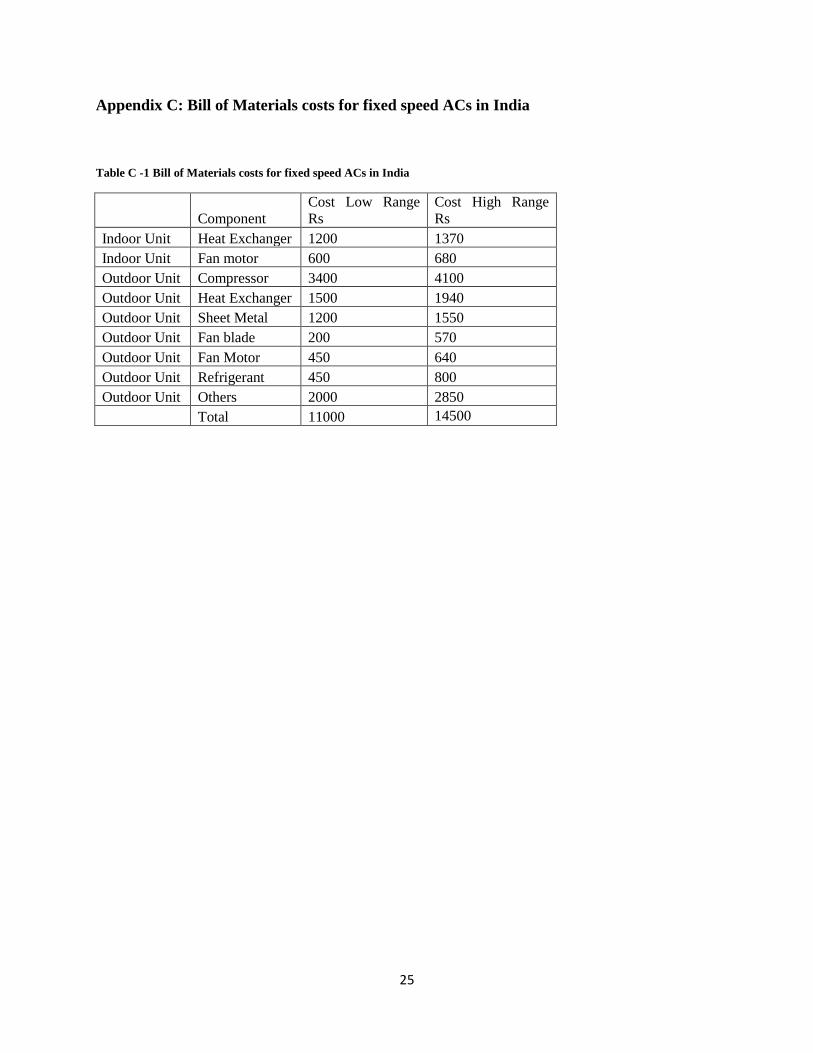
Appendix C: Bill of Materials costs for fixed speed ACs in India
Table C -1 Bill of Materials costs for fixed speed ACs in India
Component
Cost Low Range
Rs
Cost High Range
Rs
Indoor Unit Heat Exchanger 1200 1370
Indoor Unit Fan motor 600 680
Outdoor Unit Compressor 3400 4100
Outdoor Unit Heat Exchanger 1500 1940
Outdoor Unit Sheet Metal 1200 1550
Outdoor Unit Fan blade 200 570
Outdoor Unit Fan Motor 450 640
Outdoor Unit Refrigerant 450 800
Outdoor Unit Others 2000 2850
Total 11000 14500
26
Lawrence Berkeley National Laboratory Disclaimer
This document was prepared as an account of work sponsored by the United States Government. While this document is believed to contain correct information, neither the United States Government nor any agency thereof, nor the Regents of the University of California, nor any of their employees, makes any warranty, express or implied, or assumes any legal responsibility for the accuracy, completeness, or usefulness of any information, apparatus, product, or process disclosed, or represents that its use would not infringe privately owned rights. Reference herein to any specific commercial product, process, or service by its trade name, trademark, manufacturer, or otherwise, does not necessarily constitute or imply its endorsement, recommendation, or favoring by the United States Government or any agency thereof, or the Regents of the University of California. The views and opinions of authors expressed herein do not necessarily state or reflect those of the United States Government or any agency thereof or the Regents of the University of California.
Lawrence Berkeley National Laboratory is a member of the national laboratory system supported by the U.S. Department of Energy through its Office of Science. It is managed by the University of California (UC) and is charged with conducting unclassified research across a wide range of scientific disciplines.
Lawrence Berkeley National Laboratory One Cyclotron Road Berkeley, CA 94720 http://www.lbl.gov/