improving us access success indicators: testing...
TRANSCRIPT
Improving US Access Success Indicators: Testing Benefit Design Assumptions
Kevin Fitzpatrick, Principal, IMS Consulting
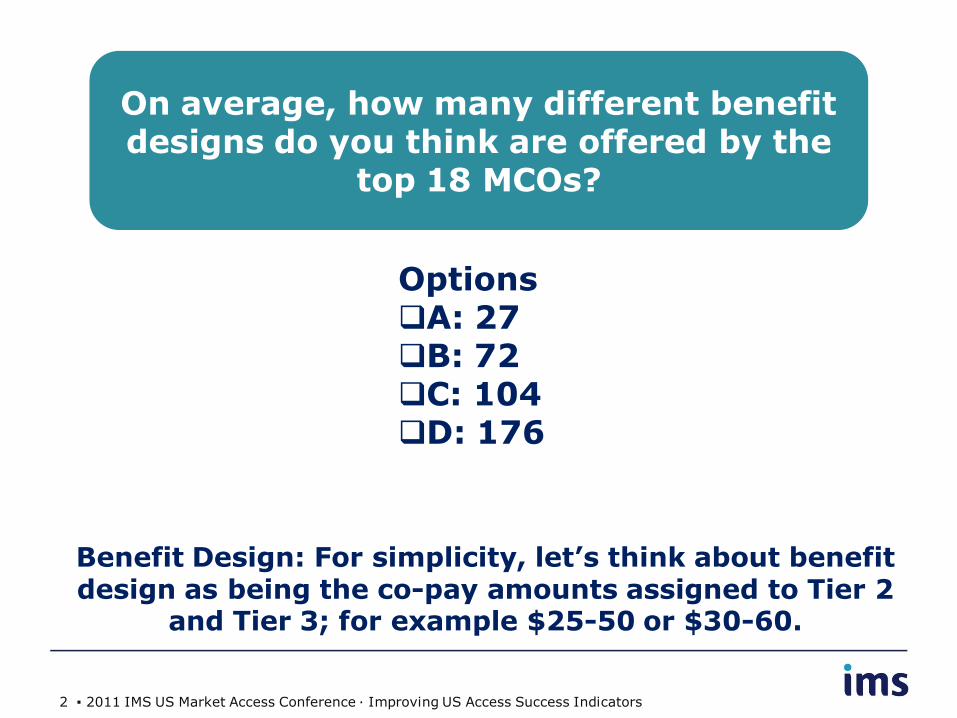
On average, how many different benefit designs do you think are offered by the
top 18 MCOs?
Options A: 27 B: 72 C: 104 D: 176
Benefit Design: For simplicity, let’s think about benefit design as being the co-pay amounts assigned to Tier 2
and Tier 3; for example $25-50 or $30-60.
2 ▪ 2011 IMS US Market Access Conference ∙ Improving US Access Success Indicators
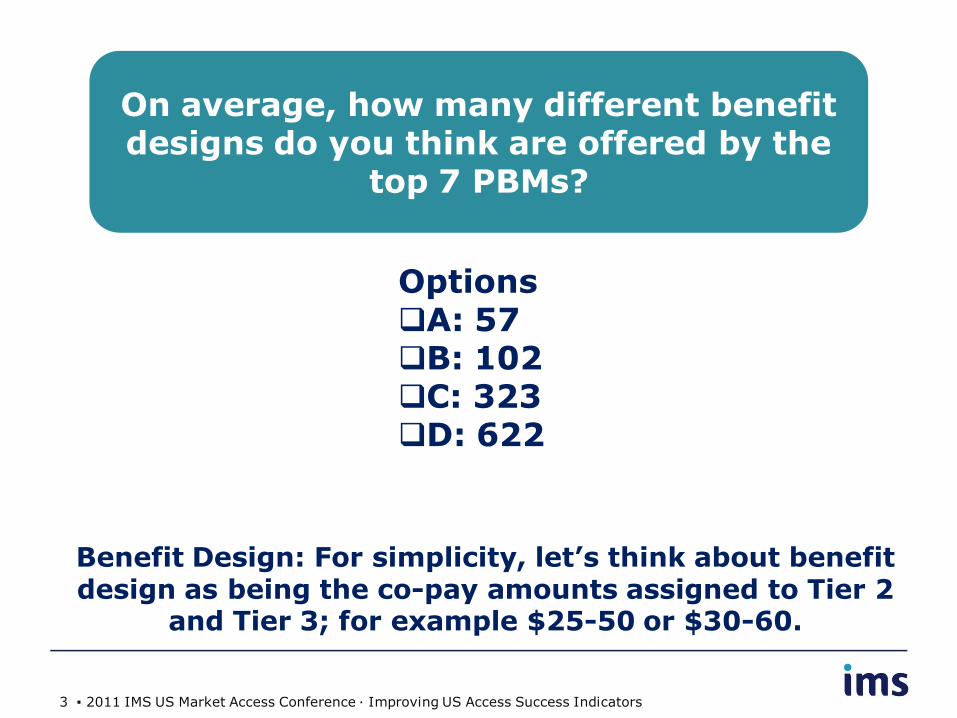
On average, how many different benefit designs do you think are offered by the
top 7 PBMs?
Options A: 57 B: 102 C: 323 D: 622
Benefit Design: For simplicity, let’s think about benefit design as being the co-pay amounts assigned to Tier 2
and Tier 3; for example $25-50 or $30-60.
3 ▪ 2011 IMS US Market Access Conference ∙ Improving US Access Success Indicators
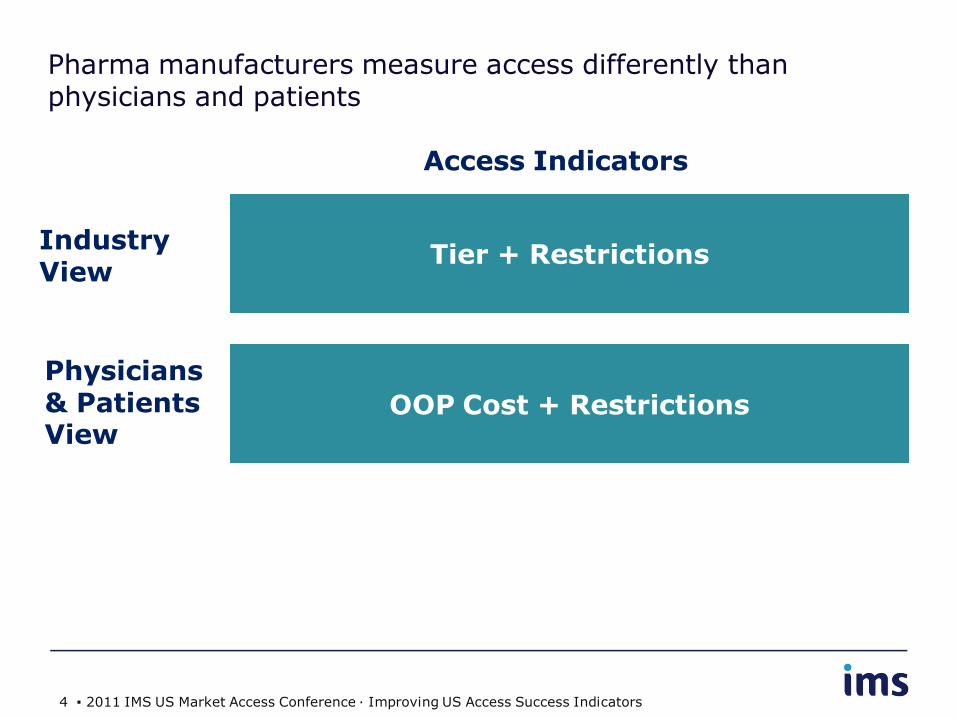
Pharma manufacturers measure access differently than physicians and patients
Tier + Restrictions
OOP Cost + Restrictions
Industry View
Physicians & Patients View
Access Indicators
4 ▪ 2011 IMS US Market Access Conference ∙ Improving US Access Success Indicators
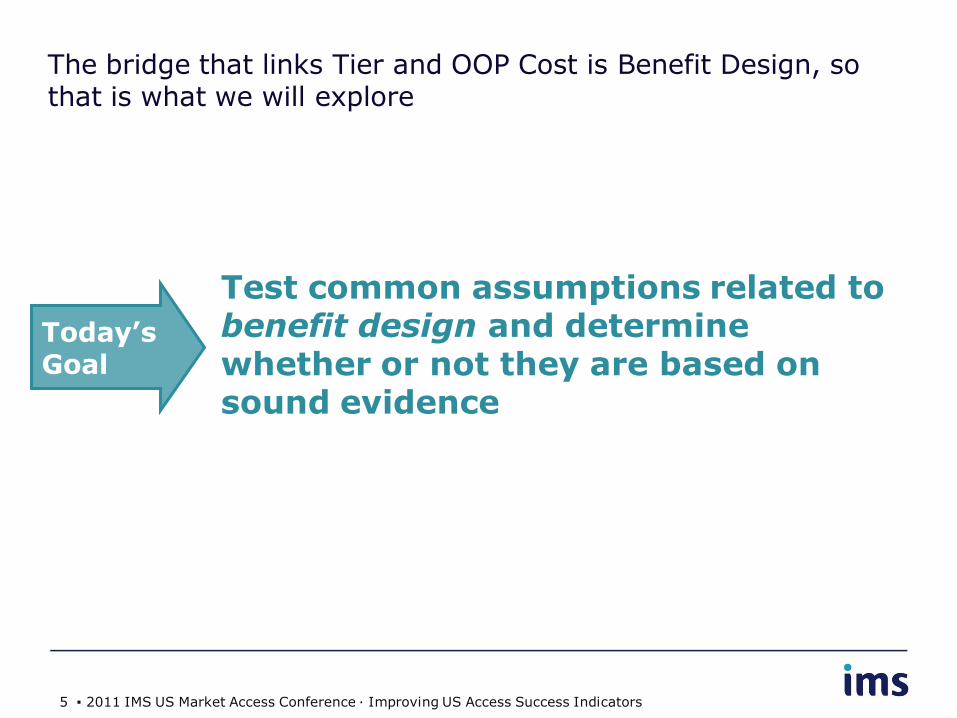
The bridge that links Tier and OOP Cost is Benefit Design, so that is what we will explore
Today’s Goal
Test common assumptions related to benefit design and determine whether or not they are based on sound evidence
5 ▪ 2011 IMS US Market Access Conference ∙ Improving US Access Success Indicators
Assumption #1: What you see is what you get
Fact #1
Fact #2
Fact #3
Most Common Benefit Design (MCBD) is an appropriate measure to understand the benefit design of a plan
6 ▪ 2011 IMS US Market Access Conference ∙ Improving US Access Success Indicators
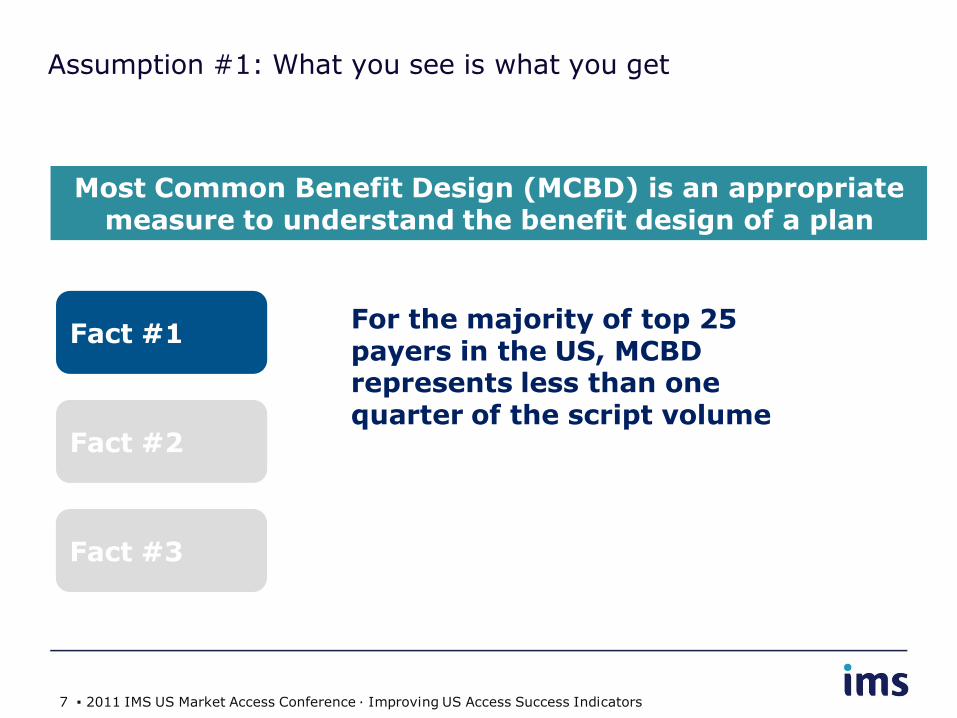
Assumption #1: What you see is what you get
Fact #1
Fact #2
Fact #3
For the majority of top 25 payers in the US, MCBD represents less than one quarter of the script volume
Most Common Benefit Design (MCBD) is an appropriate measure to understand the benefit design of a plan
7 ▪ 2011 IMS US Market Access Conference ∙ Improving US Access Success Indicators
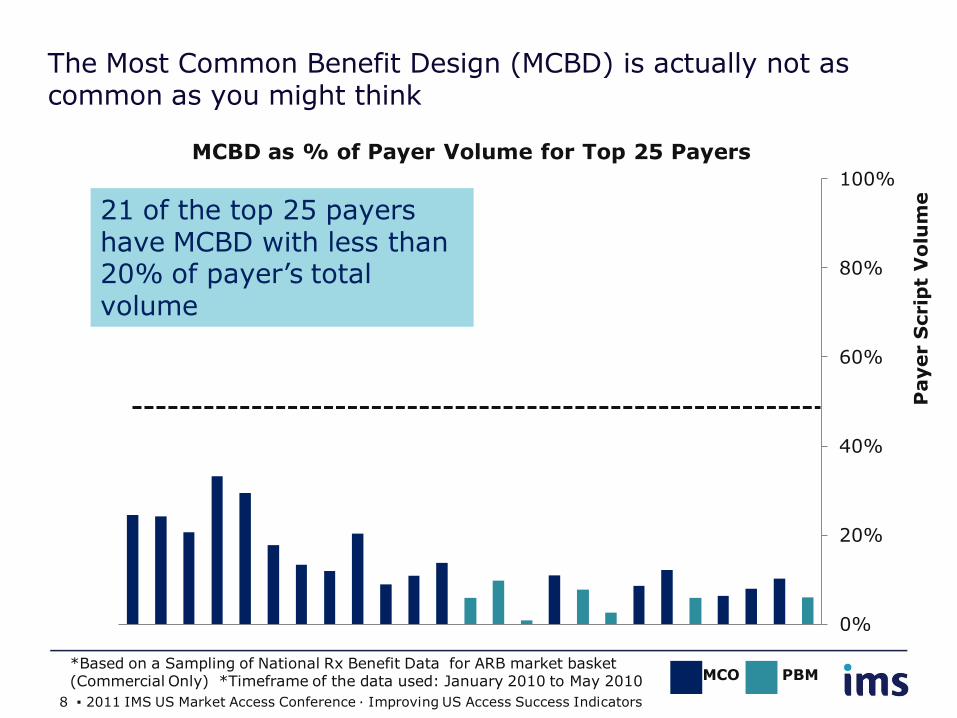
The Most Common Benefit Design (MCBD) is actually not as common as you might think
MCO PBM
21 of the top 25 payers have MCBD with less than 20% of payer’s total volume
0%
20%
40%
60%
80%
100%
MCBD as % of Payer Volume for Top 25 Payers
Payer S
crip
t V
olu
me
*Based on a Sampling of National Rx Benefit Data for ARB market basket (Commercial Only) *Timeframe of the data used: January 2010 to May 2010
8 ▪ 2011 IMS US Market Access Conference ∙ Improving US Access Success Indicators
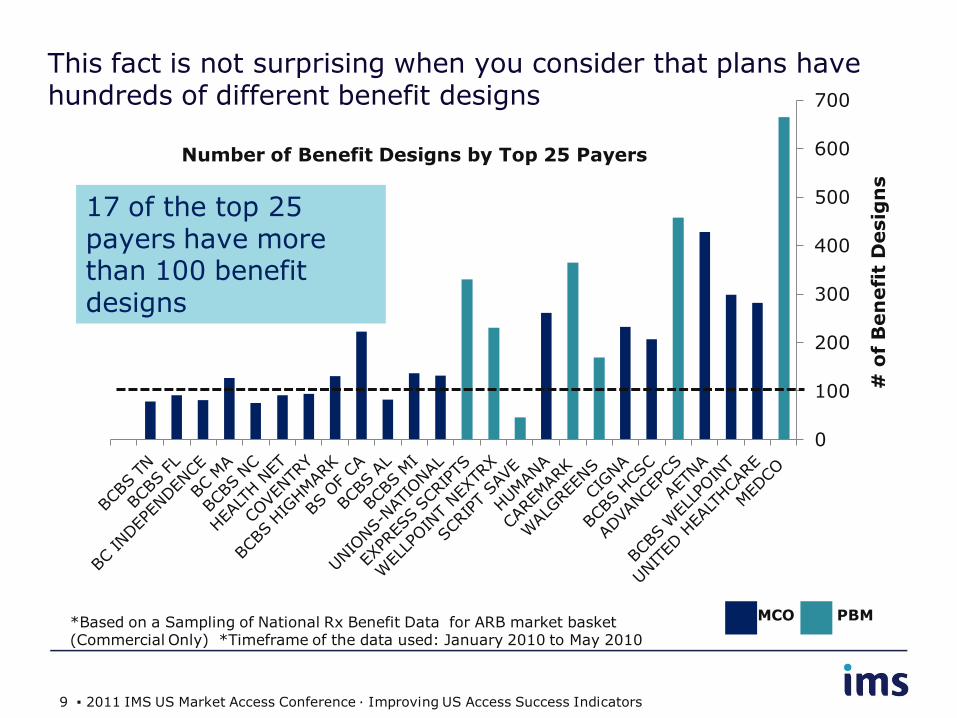
This fact is not surprising when you consider that plans have hundreds of different benefit designs
0
100
200
300
400
500
600
700
# o
f B
en
efi
t D
esig
ns
MCO PBM
Number of Benefit Designs by Top 25 Payers
17 of the top 25 payers have more than 100 benefit designs
*Based on a Sampling of National Rx Benefit Data for ARB market basket (Commercial Only) *Timeframe of the data used: January 2010 to May 2010
9 ▪ 2011 IMS US Market Access Conference ∙ Improving US Access Success Indicators
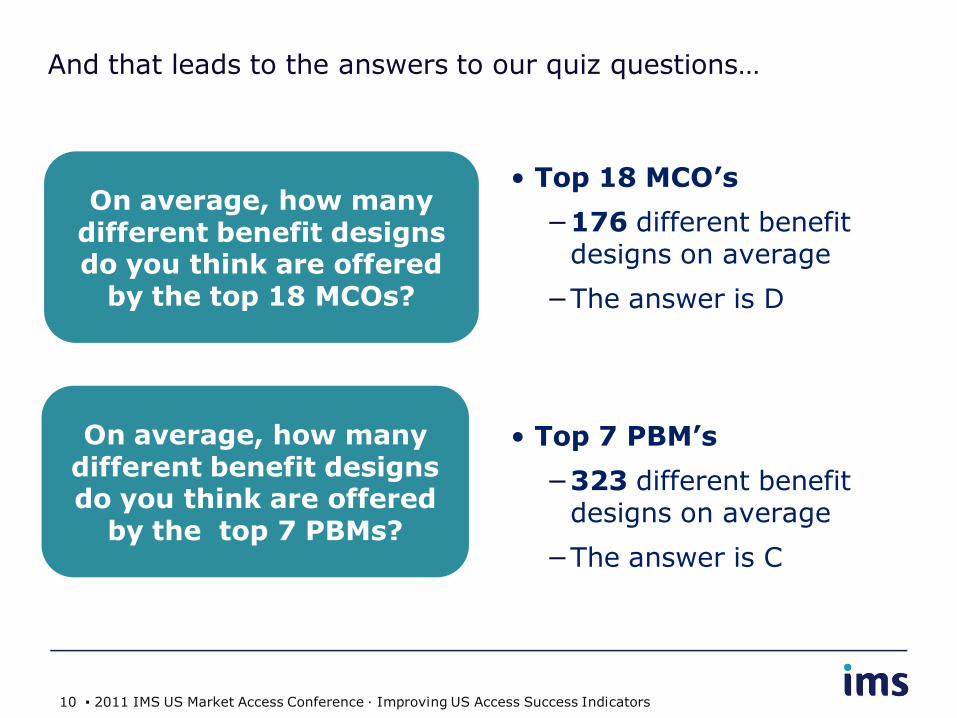
And that leads to the answers to our quiz questions…
• Top 18 MCO’s
−176 different benefit designs on average
−The answer is D
• Top 7 PBM’s
−323 different benefit designs on average
−The answer is C
On average, how many different benefit designs do you think are offered
by the top 18 MCOs?
On average, how many different benefit designs do you think are offered
by the top 7 PBMs?
10 ▪ 2011 IMS US Market Access Conference ∙ Improving US Access Success Indicators
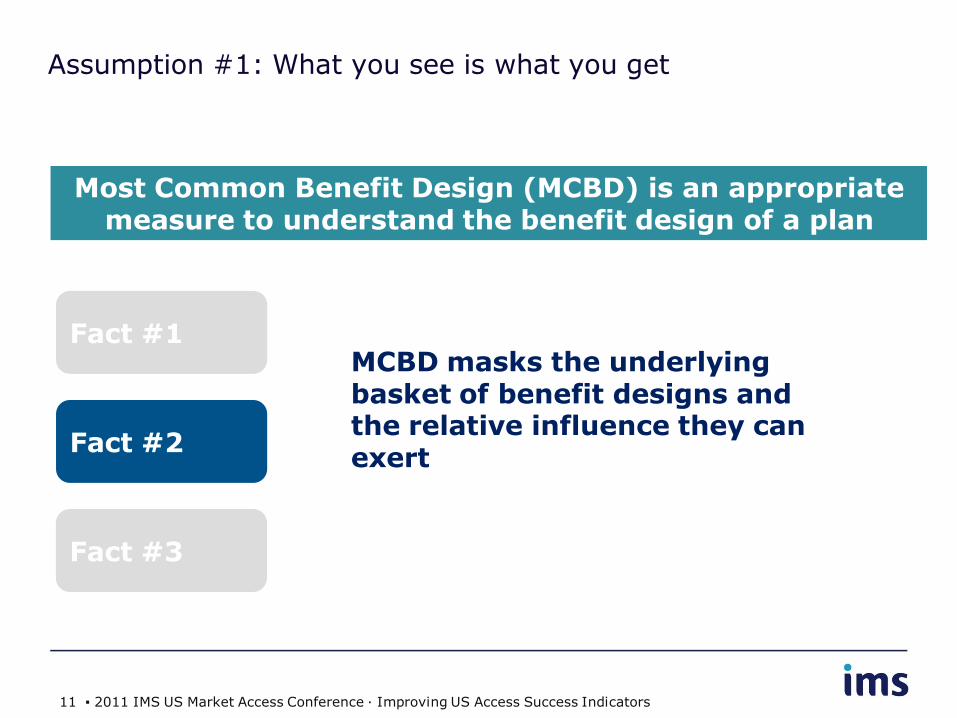
Assumption #1: What you see is what you get
Fact #1
Fact #2
Fact #3
MCBD masks the underlying basket of benefit designs and the relative influence they can exert
Most Common Benefit Design (MCBD) is an appropriate measure to understand the benefit design of a plan
11 ▪ 2011 IMS US Market Access Conference ∙ Improving US Access Success Indicators
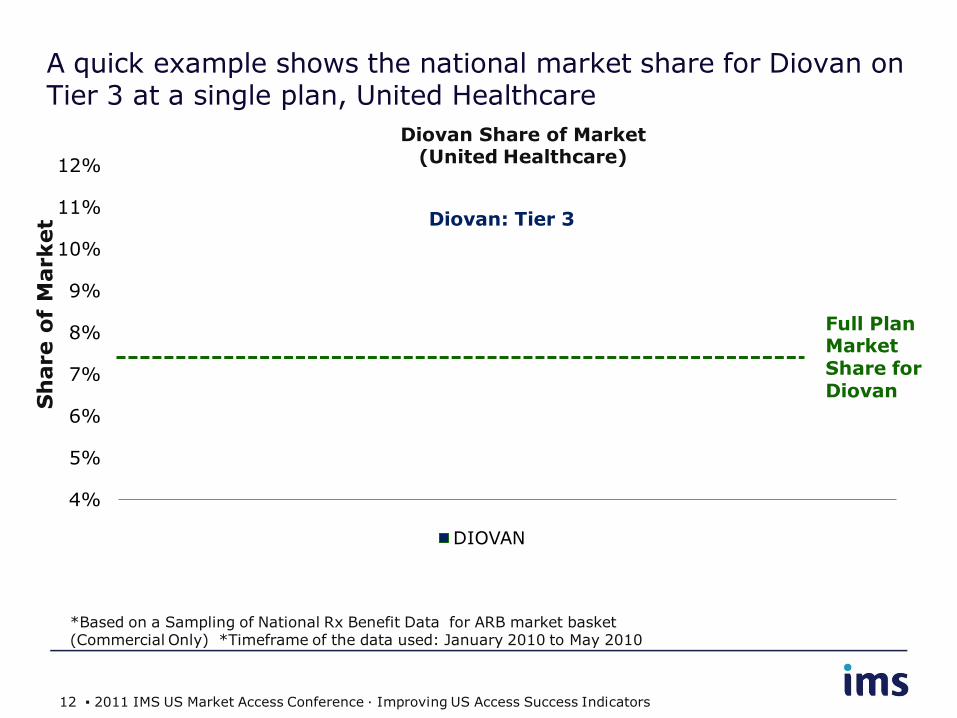
A quick example shows the national market share for Diovan on Tier 3 at a single plan, United Healthcare
4%
5%
6%
7%
8%
9%
10%
11%
12%
DIOVAN
Sh
are o
f M
arket
Diovan Share of Market (United Healthcare)
Full Plan Market Share for Diovan
Diovan: Tier 3
*Based on a Sampling of National Rx Benefit Data for ARB market basket (Commercial Only) *Timeframe of the data used: January 2010 to May 2010
12 ▪ 2011 IMS US Market Access Conference ∙ Improving US Access Success Indicators

Looking more closely across benefit designs shows the impact of T2:T3 differentials on market share for Diovan
4%
5%
6%
7%
8%
9%
10%
11%
12%
$5 $10 $15 $20 $25 $30 $35 $40
DIOVAN Linear (DIOVAN)
Tier2:Tier3 Co-Pay Differentials ($)
Diovan Shares of Market by T2:T3 Co-Pay Differentials
Diovan: Tier 3
Sh
are o
f M
arket
Full Plan Market Share for Diovan
*Based on a Sampling of National Rx Benefit Data for ARB market basket (Commercial Only) *Timeframe of the data used: January 2010 to May 2010
13 ▪ 2011 IMS US Market Access Conference ∙ Improving US Access Success Indicators
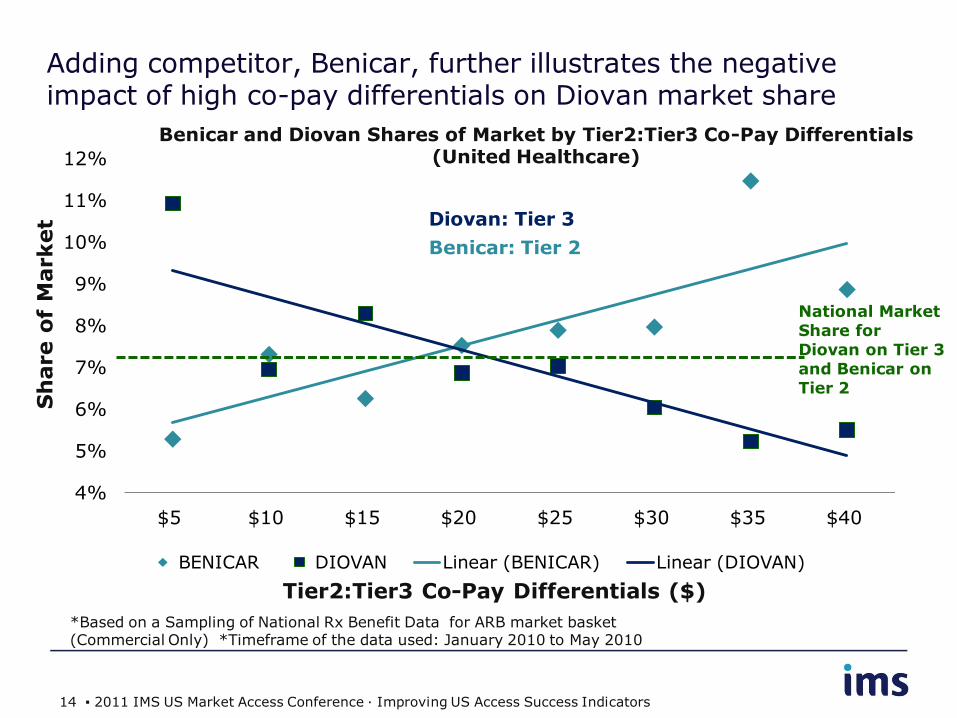
Adding competitor, Benicar, further illustrates the negative impact of high co-pay differentials on Diovan market share
4%
5%
6%
7%
8%
9%
10%
11%
12%
$5 $10 $15 $20 $25 $30 $35 $40
BENICAR DIOVAN Linear (BENICAR) Linear (DIOVAN)
Tier2:Tier3 Co-Pay Differentials ($)
Benicar and Diovan Shares of Market by Tier2:Tier3 Co-Pay Differentials (United Healthcare)
Benicar: Tier 2
Diovan: Tier 3
Sh
are o
f M
arket
National Market Share for Diovan on Tier 3 and Benicar on Tier 2
*Based on a Sampling of National Rx Benefit Data for ARB market basket (Commercial Only) *Timeframe of the data used: January 2010 to May 2010
14 ▪ 2011 IMS US Market Access Conference ∙ Improving US Access Success Indicators
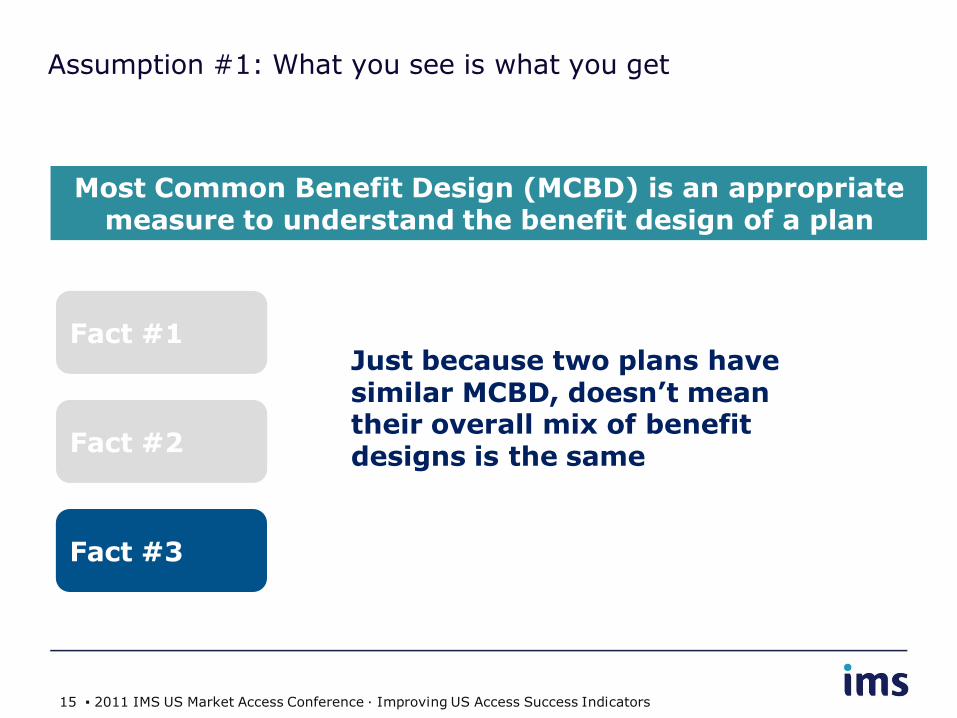
Assumption #1: What you see is what you get
Fact #1
Fact #2
Fact #3
Just because two plans have similar MCBD, doesn’t mean their overall mix of benefit designs is the same
Most Common Benefit Design (MCBD) is an appropriate measure to understand the benefit design of a plan
15 ▪ 2011 IMS US Market Access Conference ∙ Improving US Access Success Indicators
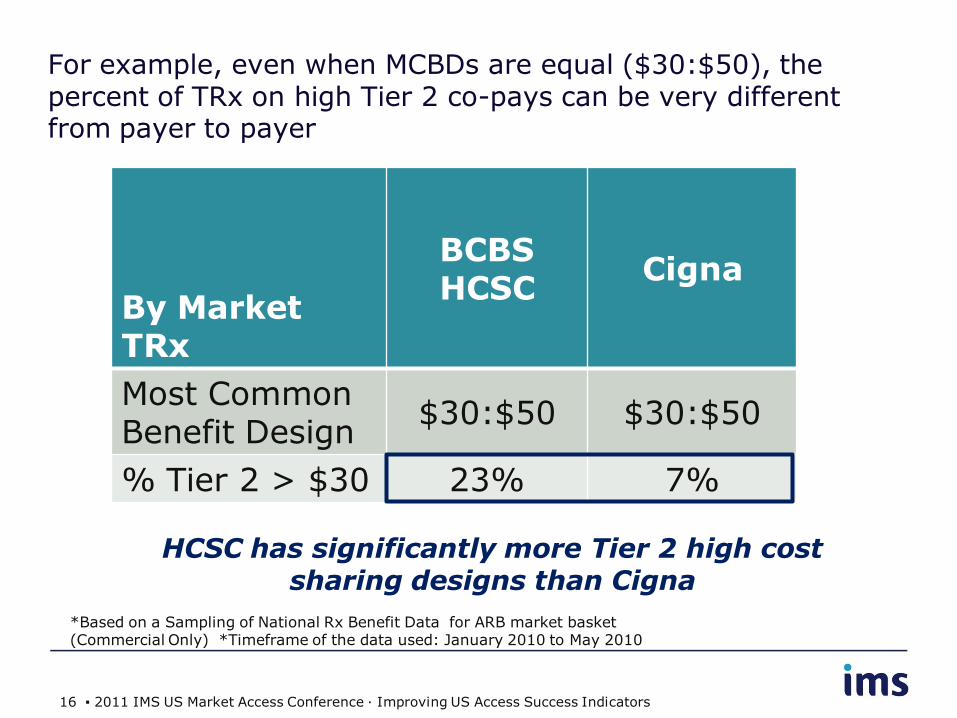
For example, even when MCBDs are equal ($30:$50), the percent of TRx on high Tier 2 co-pays can be very different from payer to payer
By Market TRx
BCBS HCSC
Cigna
Most Common Benefit Design
$30:$50 $30:$50
% Tier 2 > $30 23% 7%
HCSC has significantly more Tier 2 high cost sharing designs than Cigna
*Based on a Sampling of National Rx Benefit Data for ARB market basket (Commercial Only) *Timeframe of the data used: January 2010 to May 2010
16 ▪ 2011 IMS US Market Access Conference ∙ Improving US Access Success Indicators
Assumption #2: The Price is Right
Fact #2
Fact #1
Tier 2 co-pay is $20-30
17 ▪ 2011 IMS US Market Access Conference ∙ Improving US Access Success Indicators

Assumption #2: The Price is Right
Fact #1
Fact #2
Tier 2 co-pay is $20-30
Co-pay on Tier 2 varies significantly… …and so does Tier 3 co-pay
18 ▪ 2011 IMS US Market Access Conference ∙ Improving US Access Success Indicators
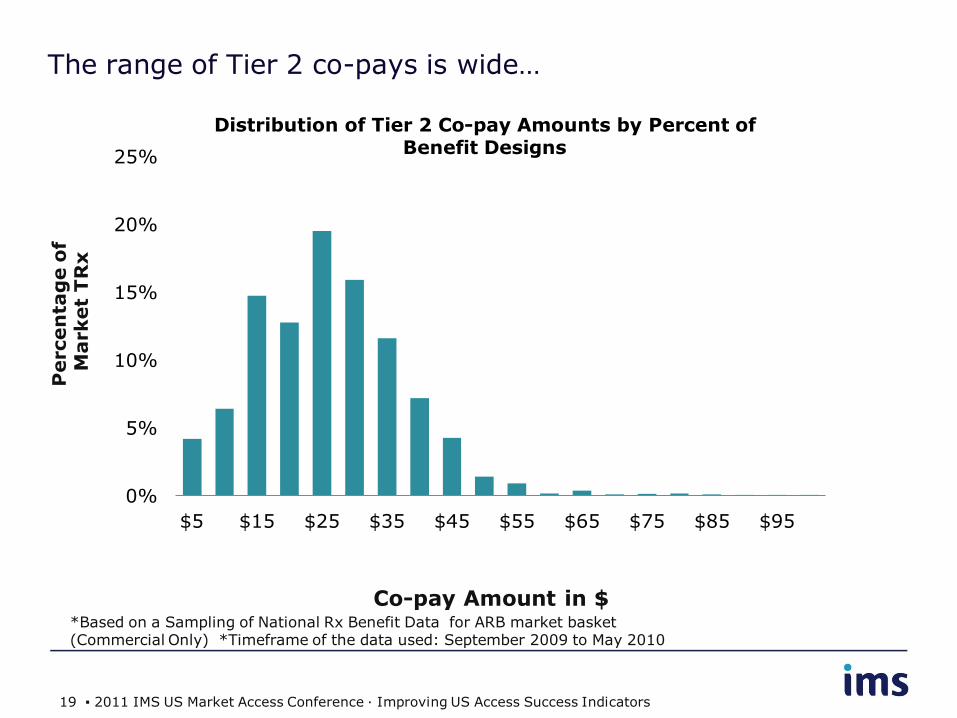
The range of Tier 2 co-pays is wide…
Co-pay Amount in $
0%
5%
10%
15%
20%
25%
$5 $15 $25 $35 $45 $55 $65 $75 $85 $95
Distribution of Tier 2 Co-pay Amounts by Percent of Benefit Designs
Percen
tag
e o
f M
arket
TR
x
*Based on a Sampling of National Rx Benefit Data for ARB market basket (Commercial Only) *Timeframe of the data used: September 2009 to May 2010
19 ▪ 2011 IMS US Market Access Conference ∙ Improving US Access Success Indicators

…and overlaps significantly with Tier 3 Co-pays
Co-pay Amount in $
0%
5%
10%
15%
20%
25%
$5 $15 $25 $35 $45 $55 $65 $75 $85 $95
Distribution of Tier 2 and Tier 3 Co-pay Amounts by Percent of Benefit Designs
T2 Co-pay T3 Co-pay
Percen
tag
e o
f M
arket
TR
x
*Based on a Sampling of National Rx Benefit Data for ARB market basket (Commercial Only) *Timeframe of the data used: September 2009 to May 2010
20 ▪ 2011 IMS US Market Access Conference ∙ Improving US Access Success Indicators
Assumption #2: The Price is Right
Fact #1
Fact #2
Tier 2 co-pay is less than Tier 3 co-pay
That’s true, but how much lower is it? Tiers 2 and 3 co-pay differentials vary markedly
21 ▪ 2011 IMS US Market Access Conference ∙ Improving US Access Success Indicators
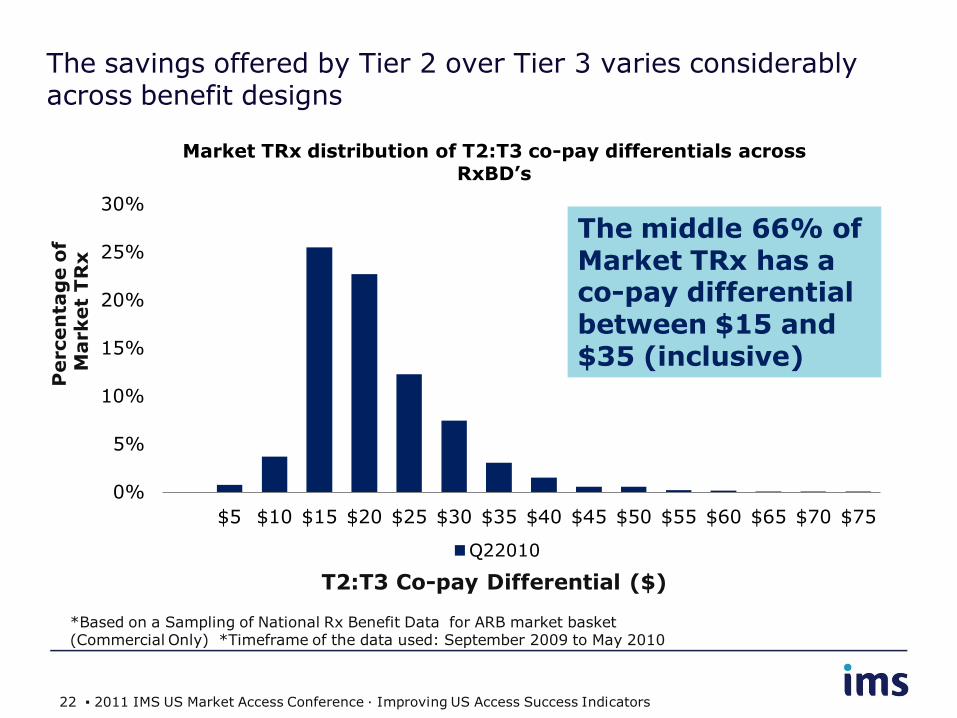
The savings offered by Tier 2 over Tier 3 varies considerably across benefit designs
0%
5%
10%
15%
20%
25%
30%
$5 $10 $15 $20 $25 $30 $35 $40 $45 $50 $55 $60 $65 $70 $75
Market TRx distribution of T2:T3 co-pay differentials across RxBD’s
Q22010
Percen
tag
e o
f M
arket
TR
x
T2:T3 Co-pay Differential ($)
The middle 66% of Market TRx has a co-pay differential between $15 and $35 (inclusive)
*Based on a Sampling of National Rx Benefit Data for ARB market basket (Commercial Only) *Timeframe of the data used: September 2009 to May 2010
22 ▪ 2011 IMS US Market Access Conference ∙ Improving US Access Success Indicators
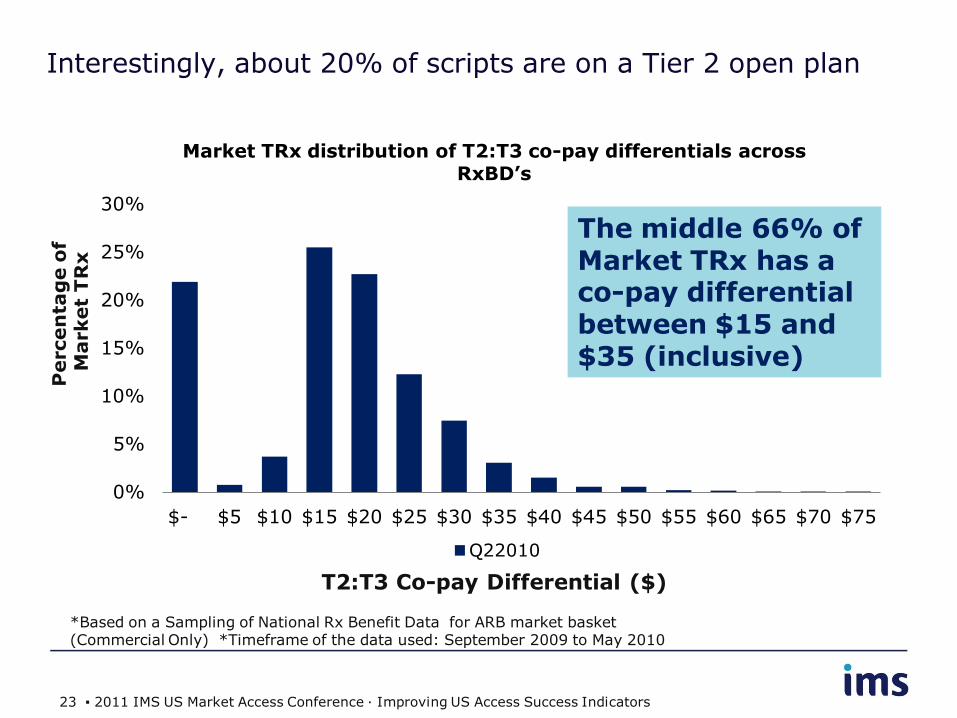
Interestingly, about 20% of scripts are on a Tier 2 open plan
0%
5%
10%
15%
20%
25%
30%
$- $5 $10 $15 $20 $25 $30 $35 $40 $45 $50 $55 $60 $65 $70 $75
Market TRx distribution of T2:T3 co-pay differentials across RxBD’s
Q22010
Percen
tag
e o
f M
arket
TR
x
T2:T3 Co-pay Differential ($)
*Based on a Sampling of National Rx Benefit Data for ARB market basket (Commercial Only) *Timeframe of the data used: September 2009 to May 2010
The middle 66% of Market TRx has a co-pay differential between $15 and $35 (inclusive)
23 ▪ 2011 IMS US Market Access Conference ∙ Improving US Access Success Indicators

Assumption #3: Location, Location, Location
Benefit design varies geographically
Fact #1
24 ▪ 2011 IMS US Market Access Conference ∙ Improving US Access Success Indicators
Assumption #3: Location, Location, Location
The assumption is true – there are important differences in benefit design across the US
Fact #1
Benefit design varies geographically
25 ▪ 2011 IMS US Market Access Conference ∙ Improving US Access Success Indicators
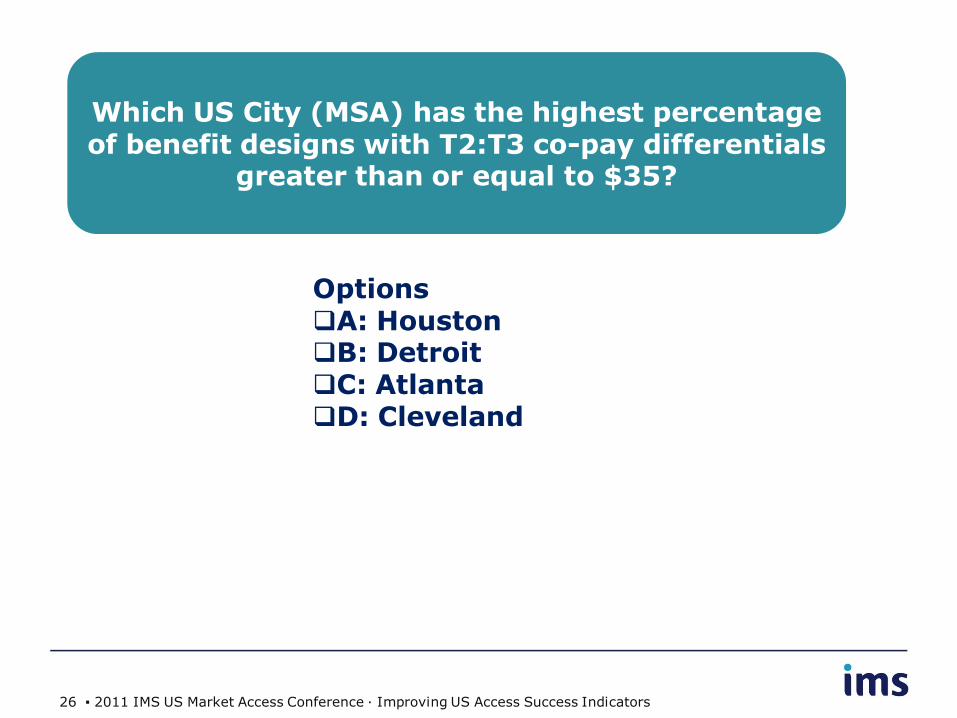
Which US City (MSA) has the highest percentage of benefit designs with T2:T3 co-pay differentials
greater than or equal to $35?
Options A: Houston B: Detroit C: Atlanta D: Cleveland
26 ▪ 2011 IMS US Market Access Conference ∙ Improving US Access Success Indicators
And the answer is… Atlanta
Atlanta has approximately 16% of scripts falling under
such a design
Which major US City (MSA) has the
highest percentage of benefit designs with T2:T3 co-pay
differentials greater than or equal to
$35?
27 ▪ 2011 IMS US Market Access Conference ∙ Improving US Access Success Indicators
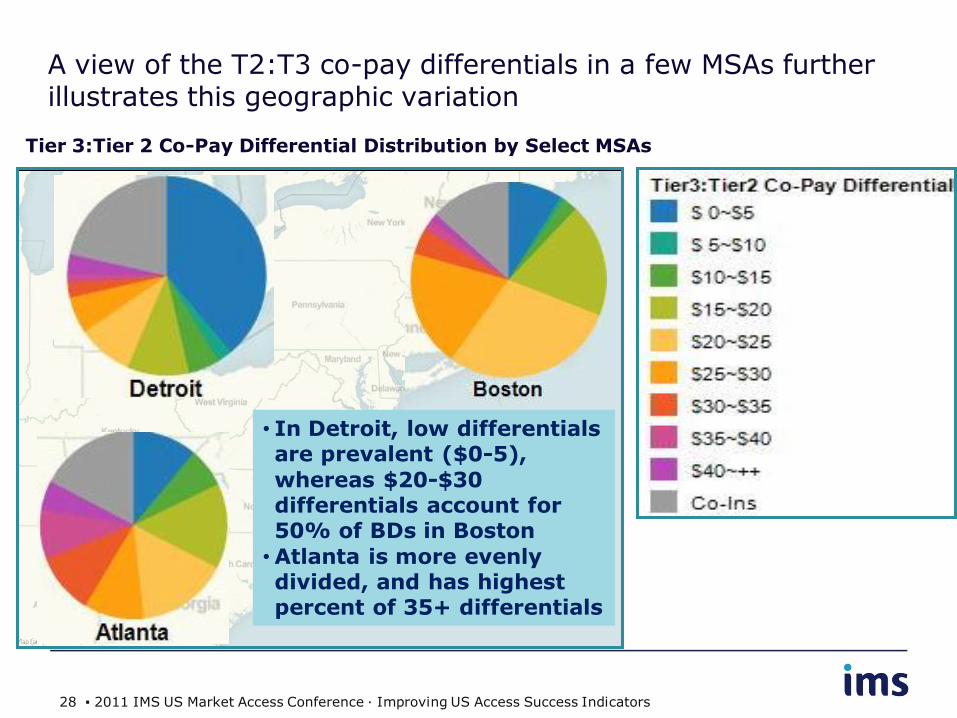
A view of the T2:T3 co-pay differentials in a few MSAs further illustrates this geographic variation
• In Detroit, low differentials are prevalent ($0-5),
whereas $20-$30 differentials account for 50% of BDs in Boston
• Atlanta is more evenly divided, and has highest percent of 35+ differentials
Tier 3:Tier 2 Co-Pay Differential Distribution by Select MSAs
28 ▪ 2011 IMS US Market Access Conference ∙ Improving US Access Success Indicators
So What?
29 ▪ 2011 IMS US Market Access Conference ∙ Improving US Access Success Indicators
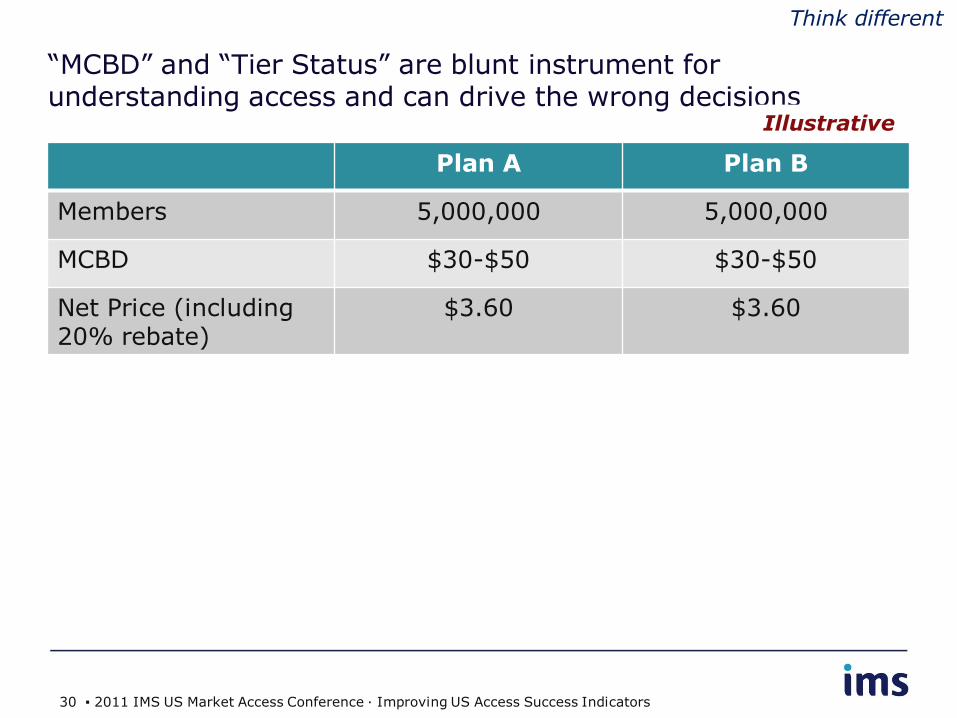
“MCBD” and “Tier Status” are blunt instrument for understanding access and can drive the wrong decisions
Plan A Plan B
Members 5,000,000 5,000,000
MCBD $30-$50 $30-$50
Net Price (including 20% rebate)
$3.60 $3.60
Illustrative
Think different
30 ▪ 2011 IMS US Market Access Conference ∙ Improving US Access Success Indicators
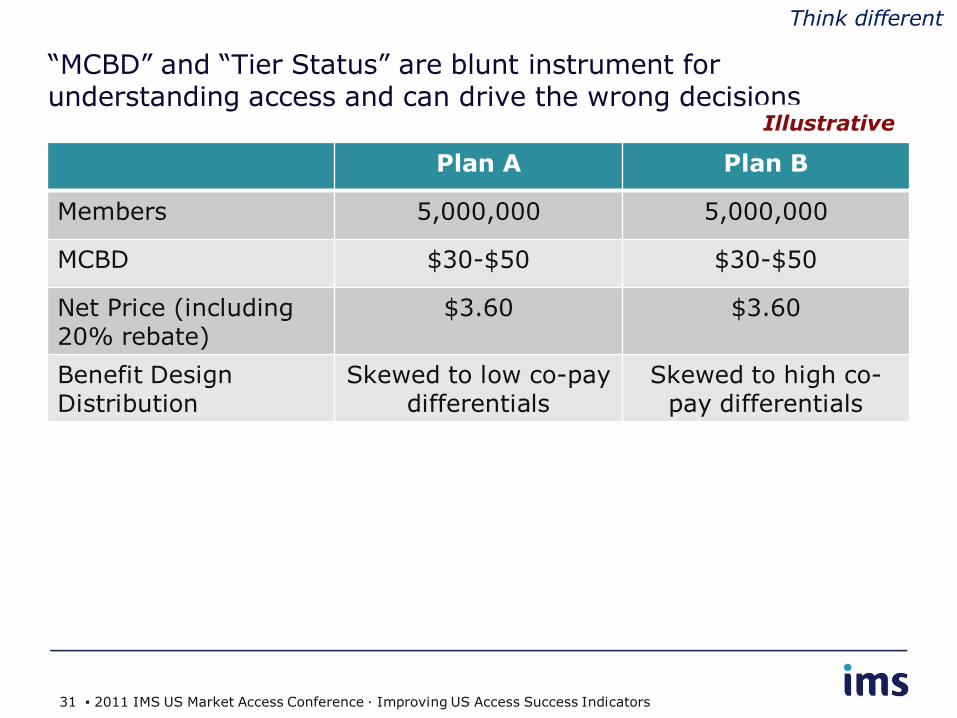
“MCBD” and “Tier Status” are blunt instrument for understanding access and can drive the wrong decisions
Plan A Plan B
Members 5,000,000 5,000,000
MCBD $30-$50 $30-$50
Net Price (including 20% rebate)
$3.60 $3.60
Benefit Design Distribution
Skewed to low co-pay differentials
Skewed to high co-pay differentials
Illustrative
Think different
31 ▪ 2011 IMS US Market Access Conference ∙ Improving US Access Success Indicators
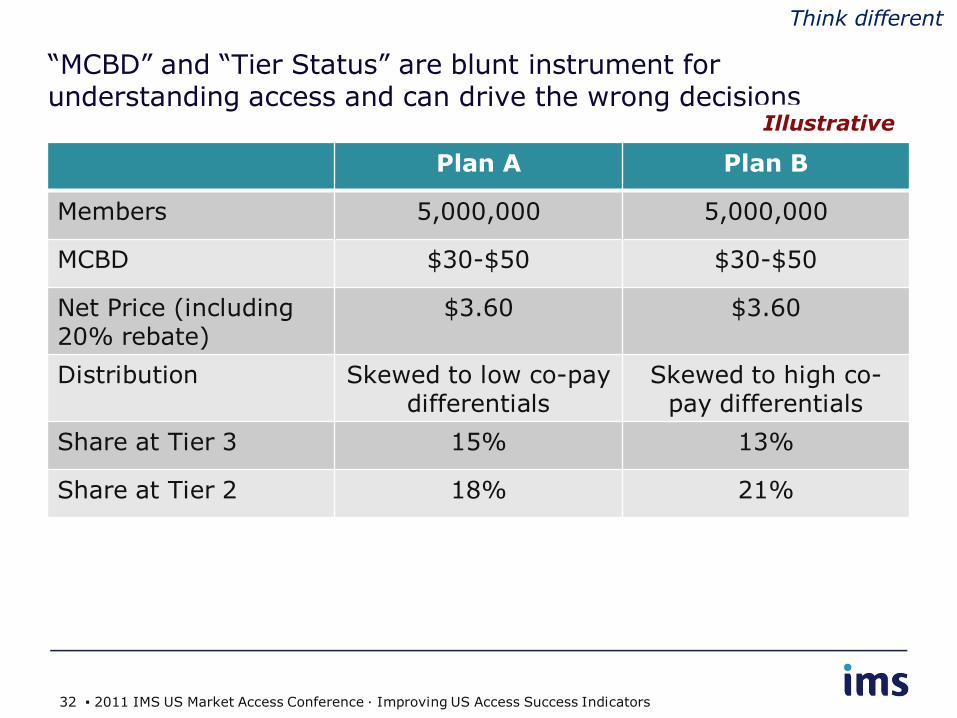
“MCBD” and “Tier Status” are blunt instrument for understanding access and can drive the wrong decisions
Plan A Plan B
Members 5,000,000 5,000,000
MCBD $30-$50 $30-$50
Net Price (including 20% rebate)
$3.60 $3.60
Distribution Skewed to low co-pay differentials
Skewed to high co-pay differentials
Share at Tier 3 15% 13%
Share at Tier 2 18% 21%
Illustrative
Think different
32 ▪ 2011 IMS US Market Access Conference ∙ Improving US Access Success Indicators
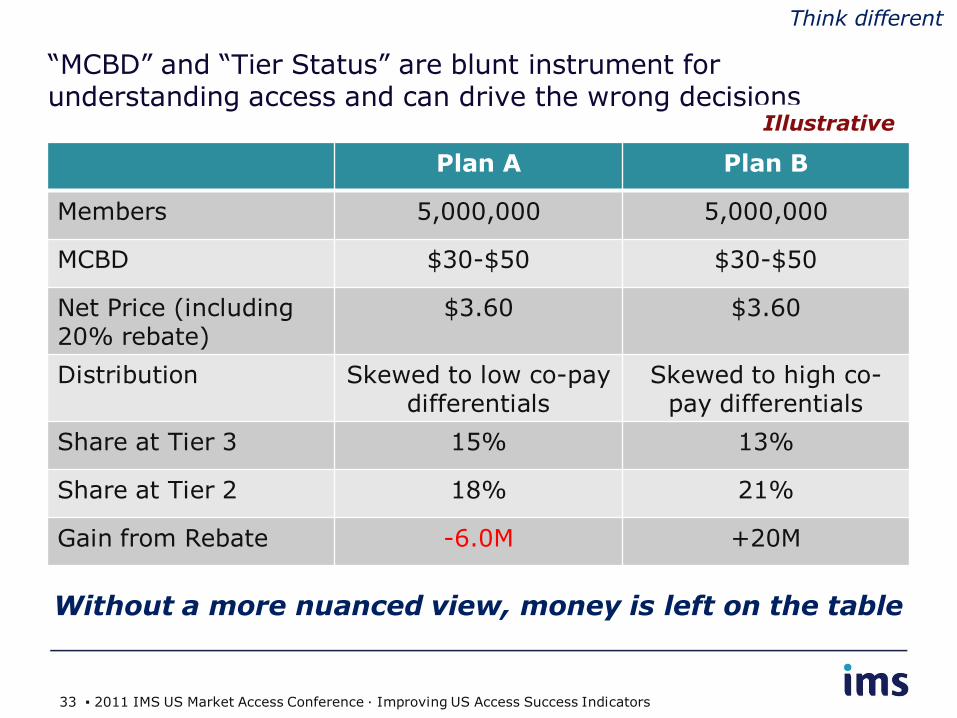
“MCBD” and “Tier Status” are blunt instrument for understanding access and can drive the wrong decisions
Plan A Plan B
Members 5,000,000 5,000,000
MCBD $30-$50 $30-$50
Net Price (including 20% rebate)
$3.60 $3.60
Distribution Skewed to low co-pay differentials
Skewed to high co-pay differentials
Share at Tier 3 15% 13%
Share at Tier 2 18% 21%
Gain from Rebate -6.0M +20M
Without a more nuanced view, money is left on the table
Illustrative
Think different
33 ▪ 2011 IMS US Market Access Conference ∙ Improving US Access Success Indicators

Set & Communicate Access Objectives Differently
• Have you set thresholds for Tier 2?
• Is your threshold appropriate for your product?
− Absolute co-pay level
− Co-pay differential
− Tailored to geography
• Are you effectively applying other co-pay
levers?
Do not contract
Co-pay Differential
Ab
solu
te
Tie
r 2
Co-
pay
Move from “Tier 2 or Bust”
To “Strategic Investment in T2”
Low High
Low
High
1
Act different
34 ▪ 2011 IMS US Market Access Conference ∙ Improving US Access Success Indicators
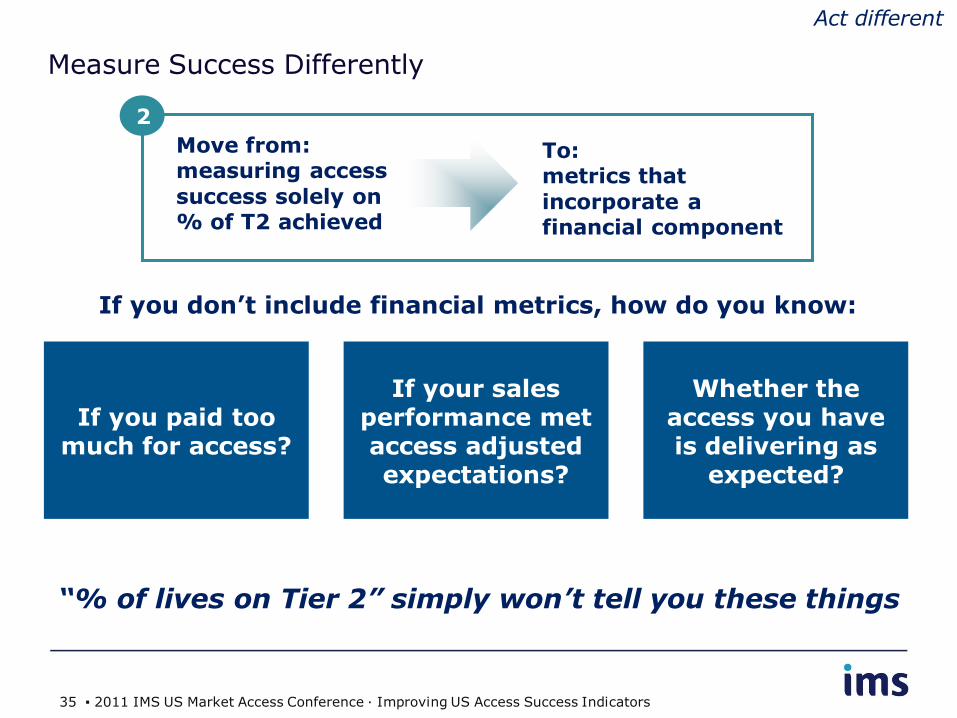
Measure Success Differently
“% of lives on Tier 2” simply won’t tell you these things
If you don’t include financial metrics, how do you know:
If you paid too much for access?
If your sales performance met access adjusted expectations?
Whether the access you have is delivering as
expected?
2
Move from: measuring access
success solely on % of T2 achieved
To: metrics that
incorporate a financial component
Act different
35 ▪ 2011 IMS US Market Access Conference ∙ Improving US Access Success Indicators