corridor resources 2011 reserve report
TRANSCRIPT

CORRIDOR RESOURCES INC.
RESERVES ASSESSMENT ANDCANADIAN OIL AND GAS PROPERTIES
CORPORATE SUMMARY
Effective December 31, 2011
1121357
Page: 1 of 102
Petroleum ConsultantsGLJ

Page: 2 of 102
Petroleum ConsultantsGLJ
CORPORATE SUMMARY
TABLE OF CONTENTS
Page
COVERING LETTER 3
INDEPENDENT PETROLEUM CONSULTANTS' CONSENT 4
INTRODUCTION 5
SUMMARY 8
RESERVES DEFINITIONS 45
EVALUATION PROCEDURE 49
PRODUCT PRICE AND MARKET FORECASTS 55
SECURITIES REPORTING 59
AFTER TAX ANALYSIS 77
APPENDIX ICertificates of Qualification 98
March 13, 2012 15:51:05
February 17, 2012 Project 1121357 Chairman of the Reserves Committee c/o Ms. Lisette Hachey Corridor Resources Inc. 301, 5475 Spring Garden Road Halifax, Nova Scotia B3J 3T2 Dear Madam: Re: Corridor Resources Inc. Corporate Evaluation Effective December 31, 2011 GLJ Petroleum Consultants (GLJ) has completed an independent reserves assessment and evaluation of the oil and gas properties of Corridor Resources Inc. (the “Company”). The effective date of this evaluation is December 31, 2011. This report has been prepared for the Company for the purpose of annual disclosure and other financial requirements. This evaluation has been prepared in accordance with reserves definitions, standards and procedures contained in the Canadian Oil and Gas Evaluation Handbook. It was GLJ’s primary mandate in this evaluation to provide an independent evaluation of the oil and gas reserves of the Company in aggregate. Accordingly it may not be appropriate to extract individual property or entity estimates for other purposes. Our engagement letter notes these limitations on the use of this report. It is trusted that this evaluation meets your current requirements. Should you have any questions regarding this analysis, please contact the undersigned. Yours very truly, GLJ PETROLEUM CONSULTANTS LTD. “ ORIGINALLY SIGNED BY”
Jodi L. Anhorn, M. Sc., P. Eng. Executive Vice President & COO JLA/ljn Attachments
GLJ PetroleumConsultants
Principal Officers:
Keith M. Braaten, P. Eng.President & CEO
Jodi L. Anhorn, M.Sc., P. Eng.Executive Vice President & COO
Officers / Vice Presidents:
Terry L. Aarsby, P. Eng.Caralyn P. Bennett, P. Eng.Leonard L. Herchen, P. Eng.Myron J. Hladyshevsky, P. Eng.Bryan M. Joa, P. Eng.Mark Jobin, P. Geol.John E. Keith, P. Eng.John H. Stilling, P. Eng.Douglas R. Sutton, P. Eng.James H. Willmon, P. Eng.
4100, 400 - 3rd Avenue S.W., Calgary, Alberta, Canada T2P 4H2 • (403) 266-9500 • Fax (403) 262-1855 • GLJPC.com

INDEPENDENT PETROLEUM CONSULTANTS’ CONSENT The undersigned firm of Independent Petroleum Consultants of Calgary, Alberta, Canada has prepared an independent evaluation of the Corridor Resources Inc. (the “Company”) Canadian oil and gas properties and hereby gives consent to the use of its name and to the said estimates. The effective date of the evaluation is December 31, 2011. In the course of the evaluation, the Company provided GLJ Petroleum Consultants Ltd. personnel with basic information which included land data, well information, geological information, reservoir studies, estimates of on-stream dates, contract information, current hydrocarbon product prices, operating cost data, capital budget forecasts, financial data and future operating plans. Other engineering, geological or economic data required to conduct the evaluation and upon which this report is based, were obtained from public records, other operators and from GLJ Petroleum Consultants Ltd. nonconfidential files. The Company has provided a representation letter confirming that all information provided to GLJ Petroleum Consultants Ltd. is correct and complete to the best of its knowledge. Procedures recommended in the Canadian Oil and Gas Evaluation (COGE) Handbook to verify certain interests and financial information were applied in this evaluation. In applying these procedures and tests, nothing came to GLJ Petroleum Consultants Ltd.’s attention that would suggest that information provided by the Company was not complete and accurate. GLJ Petroleum Consultants Ltd. reserves the right to review all calculations referred to or included in this report and to revise the estimates in light of erroneous data supplied or information existing but not made available which becomes known subsequent to the preparation of this report. The accuracy of any reserves and production estimate is a function of the quality and quantity of available data and of engineering interpretation and judgment. While reserves and production estimates presented herein are considered reasonable, the estimates should be accepted with the understanding that reservoir performance subsequent to the date of the estimate may justify revision, either upward or downward. Revenue projections presented in this report are based in part on forecasts of market prices, currency exchange rates, inflation, market demand and government policy which are subject to many uncertainties and may, in future, differ materially from the forecasts utilized herein. Present values of revenues documented in this report do not necessarily represent the fair market value of the reserves evaluated herein.
PERMIT TO PRACTICE GLJ PETROLEUM CONSULTANTS LTD.
ORIGINALLY SIGNED BY Signature: Carolyn P. Bennett Date: February 17, 2012
PERMIT NUMBER: P 2066 The Association of Professional Engineers, Geologists and Geophysicists of Alberta
ORIGINALLY SIGNED BY Keith M. Braaten GLJ Petroleum Consultants Ltd.
Page: 4 of 102
Petroleum ConsultantsGLJ

INTRODUCTION
GLJ Petroleum Consultants (GLJ) was commissioned by Corridor Resources Inc. (the
“Company”) to prepare an independent evaluation of its oil and gas reserves effective December
31, 2011. The locations of the most significant reserves properties are indicated on the attached
index map.
The evaluation was initiated in December 2011 and completed by February 2012. Estimates of
reserves and projections of production were generally prepared using well information and
production data available from public sources to approximately December 31, 2011. The
Company provided land, accounting data and other technical information not available in the
public domain to approximately December 31, 2011. In certain instances, the Company also
provided recent engineering, geological and other information up to December 31, 2011. The
Company has confirmed that, to the best of its knowledge, all information provided to GLJ is
correct and complete as of the effective date.
This evaluation has been prepared in accordance with procedures and standards contained in the
Canadian Oil and Gas Evaluation (COGE) Handbook. The reserves definitions used in preparing
this report (included herein under “Reserves Definitions”) are those contained in the COGE
Handbook and the Canadian Securities Administrators National Instrument 51-101 (NI 51-101).
The evaluation was conducted on the basis of the GLJ January 1, 2012 Price Forecast which is
summarized in the Product Price and Market Forecasts section of this report.
Tables summarizing production, royalties, costs, revenue projections, reserves and present value
estimates for various reserves categories for individual properties and the Company total are
provided in the tabbed sections of this Summary Report.
The Evaluation Procedure section outlines general procedures used in preparing this evaluation. The
individual property reports, provided under separate cover, provide additional evaluation details.
The following summarizes evaluation matters that have been included/excluded in cash flow
projections:
• processing income has been included as “Other Income”,
• in accordance with NI 51-101, the effect on projected revenues of the Company’s
financial hedging activity has not been included,
Page: 5 of 102
Petroleum ConsultantsGLJ

• provisions for the abandonment of all of the Company’s wells to which reserves have
been attributed have been included; all other abandonment and reclamation costs have
not been included,
• general and administrative (G&A) costs and overhead recovery have not been included,
• undeveloped land values have not been included.
The “Securities Reporting” section of this report provides reserves data in a format that is consistent
with the disclosure requirements set out in NI 51-101.
Economic forecasts are provided on an after tax basis including tax pools provided by the Company
in the “After Tax Analysis” section.
Page: 6 of 102
Petroleum ConsultantsGLJ

Page: 7 of 102
Petroleum ConsultantsGLJ

Page: 8 of 102
Petroleum ConsultantsGLJ
SUMMARY
TABLE OF CONTENTS
Page
LIST OF TABLESTable 1 Summary of Reserves and Values 9Table 2 Company Production, Reserves and Present Value Summary 10
LIST OF DRAWINGSDrawing 1 Historical and Forecast Company Interest Oil Equivalent Production 11Drawing 2 Historical and Forecast Company Interest Production Oil/Sales Gas/NGL 12
PROVED RESERVES 13
PROBABLE AND PROVED PLUS PROBABLE RESERVES 27
POSSIBLE AND PROVED PLUS PROBABLE PLUS POSSIBLE RESERVES 36
March 13, 2012 15:51:06

Table 1Company: Corridor Resources Inc. Reserve Class: VariousProperty: Corporate Development Class: ClassificationsDescription: Summary Pricing: GLJ (2012-01)
Effective Date: December 31, 2011
Summary of Reserves and Values
Proved TotalDeveloped Proved
Proved Non- Proved Total Total Plus TotalProducing producing Undeveloped Proved Probable Probable PPP
MARKETABLE RESERVESLight/Medium Oil (Mbbl)Total Company Interest 0 0 87 87 434 521 694Working Interest 0 0 87 87 434 521 694Net After Royalty 0 0 79 79 393 471 628
Gas (MMcf)Total Company Interest 21,949 0 36,739 58,688 43,967 102,654 216,732Working Interest 21,949 0 36,739 58,688 43,967 102,654 216,732Net After Royalty 20,944 0 33,249 54,192 39,955 94,147 197,558
Natural Gas Liquids (Mbbl)Total Company Interest 28 0 47 75 56 131 277Working Interest 28 0 47 75 56 131 277Net After Royalty 27 0 42 69 51 120 252
Oil Equivalent (Mbbl)Total Company Interest 3,686 0 6,257 9,943 7,818 17,761 37,093Working Interest 3,686 0 6,257 9,943 7,818 17,761 37,093Net After Royalty 3,517 0 5,662 9,180 7,103 16,282 33,807
BEFORE TAX PRESENT VALUE (M$)0% 68,004 0 151,236 219,240 244,854 464,094 1,217,0075% 55,395 0 83,361 138,756 127,138 265,894 593,7148% 49,612 0 60,516 110,128 91,823 201,951 426,51210% 46,325 0 49,417 95,742 75,405 171,147 351,48812% 43,416 0 40,621 84,037 62,717 146,754 294,51215% 39,645 0 30,547 70,192 48,508 118,701 231,56620% 34,602 0 19,232 53,834 32,905 86,738 163,152
FIRST 6 YEARS BEFORE TAX CASH FLOW (M$)2012 9,619 0 102 9,721 385 10,106 10,6632013 8,778 0 -7,680 1,098 -229 869 3,5752014 8,087 0 -7,671 416 -5,717 -5,301 -8012015 7,400 0 -1,579 5,821 7,094 12,915 23,0662016 6,770 0 10,846 17,616 -798 16,818 25,3142017 6,181 0 18,063 24,244 18,905 43,149 62,194
BOE Factors: HVY OIL 1.0 RES GAS 6.0 PROPANE 1.0 ETHANE 1.0COND 1.0 SLN GAS 6.0 BUTANE 1.0 SULPHUR 0.0
Run Date: February 16, 2012 11:30:22
1121357 Class (A,B1,B2,C,F,I,R), GLJ (2012-01), psum February 16, 2012 12:52:00
Page: 9 of 102
Petroleum ConsultantsGLJ

Table 2Company: Corridor Resources Inc. Reserve Class: VariousProperty: Corporate Development Class: ClassificationsDescription: Summary Pricing: GLJ (2012-01)
Effective Date: December 31, 2011
Company Production, Reserves and Present Value Summary
2012 Company Interest Prod'n Company Interest Reserves Net After Royalty Reserves Reserve Before Income TaxLife Discounted Present Value (M$)
Gas Oil NGL Oil Eq. Gas Oil NGL Sulphur Oil Eq. Gas Oil NGL Sulphur Oil Eq. IndexEntity Description Mcf/d bbl/d bbl/d boe/d MMcf Mbbl Mbbl Mlt Mboe MMcf Mbbl Mbbl Mlt Mboe yrs 0% 8% 10% 12%
Proved Producing 9,348 0 12 1,570 21,949 0 28 0 3,686 20,944 0 27 0 3,517 6.4 68,004 49,612 46,325 43,416
Proved Developed Nonproducing 0 0 0 0 0 0 0 0 0 0 0 0 0 0 0.0 0 0 0 0
Proved Undeveloped 0 0 0 0 36,739 87 47 0 6,257 33,249 79 42 0 5,662 34.6 151,236 60,516 49,417 40,621
Total Proved 9,348 0 12 1,570 58,688 87 75 0 9,943 54,192 79 69 0 9,180 17.4 219,240 110,128 95,742 84,037
Probable Producing 204 0 0 34 5,951 0 8 0 999 5,551 0 7 0 932 79.8 26,644 13,737 11,892 10,381
Probable Developed Nonproducing 0 0 0 0 0 0 0 0 0 0 0 0 0 0 0.0 0 0 0 0
Probable Undeveloped 0 0 0 0 38,016 434 49 0 6,818 34,404 393 44 0 6,171 102.5 218,210 78,086 63,513 52,336
Total Probable 204 0 0 34 43,967 434 56 0 7,818 39,955 393 51 0 7,103 624.3 244,854 91,823 75,405 62,717
Proved Plus Probable Producing 9,553 0 12 1,604 27,899 0 36 0 4,686 26,494 0 34 0 4,450 8.0 94,648 63,349 58,217 53,797
Proved Plus Probable Developed Nonproducing 0 0 0 0 0 0 0 0 0 0 0 0 0 0 0.0 0 0 0 0
Proved Plus Probable Undeveloped 0 0 0 0 74,755 521 95 0 13,075 67,653 471 86 0 11,833 52.9 369,446 138,602 112,930 92,958
Total Proved Plus Probable 9,553 0 12 1,604 102,654 521 131 0 17,761 94,147 471 120 0 16,282 30.3 464,094 201,951 171,147 146,754
Total Possible 190 0 0 32 114,078 174 146 0 19,332 103,411 157 132 0 17,524 999.9 752,914 224,561 180,341 147,758
Total PPP 9,743 0 12 1,636 216,732 694 277 0 37,093 197,558 628 252 0 33,807 62.1 1,217,007 426,512 351,488 294,512
Reserves CharacterizationPercentage of Total PPP Company Interest BOE Reserves
NGLs (<1 %)
L & M Oil (2 %)
Natural Gas (97 %)
Product Types
Pv UDev (17 %)
Pv Prd (10 %)
Poss Prd (4 %)
Poss UDev (48 %)
Pb UDev (18 %)
Pb Prd (3 %)
Reserves Classifications
BOE Factors: HVY OIL 1.0 RES GAS 6.0 PROPANE 1.0 ETHANE 1.0COND 1.0 SLN GAS 6.0 BUTANE 1.0 SULPHUR 0.0
1121357 Class (A,B1,B2,C,D,E1,E2,F,G,H1,H2,I,O,R), GLJ (2012-01), crv February 16, 2012 12:52:02
Page: 10 of 102
Petroleum ConsultantsGLJ

Historical and Forecast ProductionCompany: Corridor Resources Inc. Pricing: GLJ (2012-01)Property: Corporate Effective Date: December 31, 2011Description: Summary
2007 2008 2009 2010 2011 2012 2013 2014 2015 2016 2017 2018 2019 2020 2021 2022 2023 2024 2025 2026 2027 2028 2029 2030 2031
Year
010
0020
0030
0040
0050
0060
0070
0080
00
(bo
e/d)
AC
I
R
Legend
A Proved ProducingC Total ProvedI Total Proved Plus Probable
R Total PPP
Company Interest Oil Equivalent
2007 2008 2009 2010 2011 2012 2013 2014 2015 2016 2017 2018 2019 2020 2021 2022 2023 2024 2025 2026 2027 2028 2029 2030 2031
Year
010
0020
0030
0040
0050
0060
0070
0080
00
(bo
e/d)
Legend
Sales Gas
Natural Gas Liquids
Light Medium Oil
Company Interest Oil Equivalent - Total PPP
lease production. Consequently, company actuals may differ from the history shown due to changes in ownership.*Note: Historical company interest production is based on current interests in the evaluated reserves entities applied to reported actual gross
Company Interest Oil Equivalent1121357 / Feb 16, 2012
Drawing 1
Page: 11 of 102
Petroleum ConsultantsGLJ

Historical and Forecast ProductionCompany: Corridor Resources Inc. Pricing: GLJ (2012-01)Property: Corporate Effective Date: December 31, 2011Description: Summary
2007 2008 2009 2010 2011 2012 2013 2014 2015 2016 2017 2018 2019 2020 2021 2022 2023 2024 2025 2026 2027 2028 2029 2030 2031
Year
050
100
150
200
250
300
350
400
450
500
(bb
l/d)
C I
R
Legend
A Proved ProducingC Total ProvedI Total Proved Plus Probable
R Total PPP
Company Interest Oil
2007 2008 2009 2010 2011 2012 2013 2014 2015 2016 2017 2018 2019 2020 2021 2022 2023 2024 2025 2026 2027 2028 2029 2030 2031
Year
05
1015
2025
3035
4045
50
(M
Mcf
/d)
A C
I
R
Legend
A Proved ProducingC Total ProvedI Total Proved Plus Probable
R Total PPP
Company Interest Sales Gas
2007 2008 2009 2010 2011 2012 2013 2014 2015 2016 2017 2018 2019 2020 2021 2022 2023 2024 2025 2026 2027 2028 2029 2030 2031
Year
05
1015
2025
3035
4045
5055
60
(bb
l/d)
A C
I
R
Legend
A Proved ProducingC Total ProvedI Total Proved Plus Probable
R Total PPP
Company Interest NGL
lease production. Consequently, company actuals may differ from the history shown due to changes in ownership.*Note: Historical company interest production is based on current interests in the evaluated reserves entities applied to reported actual gross
Company Interest Oil1121357 / Feb 16, 2012
Drawing 2
Page: 12 of 102
Petroleum ConsultantsGLJ

Page: 13 of 102
Petroleum ConsultantsGLJ
PROVED RESERVES
TABLE OF CONTENTS
Page
SUMMARY OF RESERVES AND VALUES 14
COMPANY PRODUCTION, RESERVES AND PRESENT VALUE SUMMARY 15
ECONOMIC FORECASTSProved Producing 16Proved Undeveloped 18Total Proved Nonproducing 21Total Proved 24
March 13, 2012 15:51:06

Company: Corridor Resources Inc. Reserve Class: VariousProperty: Corporate Development Class: ClassificationsDescription: Summary Pricing: GLJ (2012-01)
Effective Date: December 31, 2011
Summary of Reserves and Values
Proved TotalDeveloped Proved
Proved Non- Proved Non- TotalProducing producing Undeveloped producing Proved
MARKETABLE RESERVESLight/Medium Oil (Mbbl)Total Company Interest 0 0 87 87 87Working Interest 0 0 87 87 87Net After Royalty 0 0 79 79 79
Gas (MMcf)Total Company Interest 21,949 0 36,739 36,739 58,688Working Interest 21,949 0 36,739 36,739 58,688Net After Royalty 20,944 0 33,249 33,249 54,192
Natural Gas Liquids (Mbbl)Total Company Interest 28 0 47 47 75Working Interest 28 0 47 47 75Net After Royalty 27 0 42 42 69
Oil Equivalent (Mbbl)Total Company Interest 3,686 0 6,257 6,257 9,943Working Interest 3,686 0 6,257 6,257 9,943Net After Royalty 3,517 0 5,662 5,662 9,180
BEFORE TAX PRESENT VALUE (M$)0% 68,004 0 151,236 151,236 219,2405% 55,395 0 83,361 83,361 138,7568% 49,612 0 60,516 60,516 110,12810% 46,325 0 49,417 49,417 95,74212% 43,416 0 40,621 40,621 84,03715% 39,645 0 30,547 30,547 70,19220% 34,602 0 19,232 19,232 53,834
FIRST 6 YEARS BEFORE TAX CASH FLOW (M$)2012 9,619 0 102 102 9,7212013 8,778 0 -7,680 -7,680 1,0982014 8,087 0 -7,671 -7,671 4162015 7,400 0 -1,579 -1,579 5,8212016 6,770 0 10,846 10,846 17,6162017 6,181 0 18,063 18,063 24,244
BOE Factors: HVY OIL 1.0 RES GAS 6.0 PROPANE 1.0 ETHANE 1.0COND 1.0 SLN GAS 6.0 BUTANE 1.0 SULPHUR 0.0
Run Date: February 16, 2012 11:30:21
1121357 Class (A,B1,B2,B,C), GLJ (2012-01), psum February 16, 2012 12:52:04
Page: 14 of 102
Petroleum ConsultantsGLJ

Company: Corridor Resources Inc. Reserve Class: VariousProperty: Corporate Development Class: ClassificationsDescription: Summary Pricing: GLJ (2012-01)
Effective Date: December 31, 2011
Company Production, Reserves and Present Value Summary
2012 Company Interest Prod'n Company Interest Reserves Net After Royalty Reserves Reserve Before Income TaxLife Discounted Present Value (M$)
Gas Oil NGL Oil Eq. Gas Oil NGL Sulphur Oil Eq. Gas Oil NGL Sulphur Oil Eq. IndexEntity Description Mcf/d bbl/d bbl/d boe/d MMcf Mbbl Mbbl Mlt Mboe MMcf Mbbl Mbbl Mlt Mboe yrs 0% 8% 10% 12%
Proved ProducingMcCully 9,348 0 12 1,570 21,949 0 28 0 3,686 20,944 0 27 0 3,517 6.4 68,004 49,612 46,325 43,416
Total: Proved Producing 9,348 0 12 1,570 21,949 0 28 0 3,686 20,944 0 27 0 3,517 6.4 68,004 49,612 46,325 43,416
Proved UndevelopedMcCully 0 0 0 0 36,739 87 47 0 6,257 33,249 79 42 0 5,662 34.6 151,236 60,516 49,417 40,621
Total: Proved Undeveloped 0 0 0 0 36,739 87 47 0 6,257 33,249 79 42 0 5,662 34.6 151,236 60,516 49,417 40,621
Total Proved NonproducingMcCully 0 0 0 0 36,739 87 47 0 6,257 33,249 79 42 0 5,662 34.6 151,236 60,516 49,417 40,621
Total: Total Proved Nonproducing 0 0 0 0 36,739 87 47 0 6,257 33,249 79 42 0 5,662 34.6 151,236 60,516 49,417 40,621
Total ProvedMcCully 9,348 0 12 1,570 58,688 87 75 0 9,943 54,192 79 69 0 9,180 17.4 219,240 110,128 95,742 84,037
Total: Total Proved 9,348 0 12 1,570 58,688 87 75 0 9,943 54,192 79 69 0 9,180 17.4 219,240 110,128 95,742 84,037
BOE Factors: HVY OIL 1.0 RES GAS 6.0 PROPANE 1.0 ETHANE 1.0COND 1.0 SLN GAS 6.0 BUTANE 1.0 SULPHUR 0.0
1121357 Class (A,B2,B,C), GLJ (2012-01), crv February 17, 2012 15:13:03
Page: 15 of 102
Petroleum ConsultantsGLJ

Company: Corridor Resources Inc. Reserve Class: ProvedProperty: Corporate Development Class: ProducingDescription: Summary Pricing: GLJ (2012-01)
Effective Date: December 31, 2011
Economic Forecast
PRODUCTION FORECAST
Residue Gas Production Condensate Production Total Oil Equiv. Production
Company Company Company Company Company Company CompanyGas Daily Yearly Net Yearly Price Daily Yearly Net Yearly Price Daily Yearly Net Yearly Price
Year Wells Mcf/d MMcf MMcf $/Mcf bbl/d Mbbl Mbbl $/bbl boe/d Mboe Mboe $/boe
2012 22 9,348 3,412 3,224 3.50 12 4 4 86.50 1,570 573 542 21.502013 22 7,733 2,823 2,690 4.17 10 4 3 86.50 1,299 474 452 25.482014 19 6,409 2,339 2,243 4.70 8 3 3 83.44 1,076 393 377 28.652015 17 5,131 1,873 1,805 5.24 7 2 2 81.40 862 315 303 31.822016 17 4,358 1,591 1,545 5.77 6 2 2 81.40 732 267 259 35.002017 17 3,837 1,400 1,368 6.31 5 2 2 81.40 644 235 230 38.192018 17 3,409 1,244 1,195 6.59 4 2 2 82.78 573 209 201 39.842019 17 3,064 1,118 1,050 6.73 4 1 1 84.85 515 188 176 40.692020 16 2,768 1,010 955 6.88 4 1 1 86.96 465 170 160 41.602021 16 2,490 909 864 7.03 3 1 1 89.11 418 153 145 42.512022 16 2,240 818 784 7.17 3 1 1 91.31 376 137 132 43.362023 15 1,998 729 706 7.31 3 1 1 93.55 336 122 119 44.23Sub. 19,267 18,430 5.33 25 24 85.12 3,236 3,095 32.41Rem. 2,682 2,514 7.73 3 3 100.10 450 422 46.78Tot. 21,949 20,944 5.63 28 27 86.95 3,686 3,517 34.17
REVENUE AND EXPENSE FORECAST
Revenue Before BurdensRoyalty Burdens Gas Processing Total Net
Working Interest Royalty Company Pre-Processing Allowance Royalty Revenue Operating ExpensesInterest Interest After After
Oil Gas NGL+Sul Total Total Total Crown Other Crown Other Process. Royalty Fixed Variable TotalYear M$ M$ M$ M$ M$ M$ M$ M$ M$ M$ M$ M$ M$ M$ M$
2012 0 11,943 377 12,320 0 12,320 678 0 0 0 678 11,642 2,766 648 3,4142013 0 11,767 312 12,079 0 12,079 568 0 0 0 568 11,511 2,802 547 3,3492014 0 11,004 249 11,253 0 11,253 461 0 0 0 461 10,792 2,819 462 3,2822015 0 9,813 195 10,007 0 10,007 360 0 0 0 360 9,647 2,829 378 3,2062016 0 9,185 165 9,350 0 9,350 271 0 0 0 271 9,079 2,877 327 3,2042017 0 8,835 145 8,980 0 8,980 207 0 0 0 207 8,774 2,930 294 3,2232018 0 8,195 131 8,326 0 8,326 333 0 0 0 333 7,993 2,980 266 3,2462019 0 7,522 121 7,643 0 7,643 466 0 0 0 466 7,177 3,039 244 3,2842020 0 6,947 112 7,059 0 7,059 388 0 0 0 388 6,671 3,084 225 3,3092021 0 6,384 103 6,488 0 6,488 318 0 0 0 318 6,170 3,134 206 3,3402022 0 5,860 95 5,955 0 5,955 244 0 0 0 244 5,711 3,176 189 3,3652023 0 5,330 87 5,417 0 5,417 173 0 0 0 173 5,243 3,203 172 3,375Sub. 0 102,784 2,093 104,878 0 104,878 4,468 0 0 0 4,468 100,410 35,637 3,959 39,597Rem. 0 20,728 343 21,070 0 21,070 1,342 0 0 0 1,342 19,728 16,538 670 17,208Tot. 0 123,512 2,436 125,948 0 125,948 5,810 0 0 0 5,810 120,138 52,175 4,629 56,805Disc 0 71,531 1,533 73,064 0 73,064 3,235 0 0 0 3,235 69,828 25,070 2,860 27,930
Net Net Capital Investment Before Tax Cash FlowMineral Capital NPI Prod'n Other Aband. Oper.
Tax Tax Burden Revenue Income Costs Income Dev. Plant Tang. Total Annual Cum. 10.0% DcfYear M$ M$ M$ M$ M$ M$ M$ M$ M$ M$ M$ M$ M$ M$
2012 0 0 0 8,228 1,391 0 9,619 0 0 0 0 9,619 9,619 9,1712013 0 0 0 8,163 1,125 510 8,778 0 0 0 0 8,778 18,397 16,7802014 0 0 0 7,510 967 390 8,087 0 0 0 0 8,087 26,484 23,1522015 0 0 0 6,441 960 0 7,400 0 0 0 0 7,400 33,884 28,4532016 0 0 0 5,875 895 0 6,770 0 0 0 0 6,770 40,654 32,8622017 0 0 0 5,550 769 138 6,181 0 0 0 0 6,181 46,835 36,5222018 0 0 0 4,747 677 0 5,424 0 0 0 0 5,424 52,259 39,4412019 0 0 0 3,893 601 144 4,350 0 0 0 0 4,350 56,609 41,5692020 0 0 0 3,362 540 146 3,755 0 0 0 0 3,755 60,364 43,2392021 0 0 0 2,830 471 0 3,301 0 0 0 0 3,301 63,666 44,5742022 0 0 0 2,346 426 305 2,467 0 0 0 0 2,467 66,133 45,4812023 0 0 0 1,869 388 311 1,946 0 0 0 0 1,946 68,079 46,132Sub. 0 0 0 60,813 9,209 1,944 68,079 0 0 0 0 68,079 68,079 46,132Rem. 0 0 0 2,520 1,960 4,554 -74 0 0 0 0 -74 68,004 46,325Tot. 0 0 0 63,334 11,169 6,498 68,004 0 0 0 0 68,004 68,004 46,325Disc 0 0 0 41,898 6,644 2,217 46,325 0 0 0 0 46,325 46,325 46,325
1121357 Proved Producing, GLJ (2012-01), pri February 16, 2012 12:52:08
Page: 16 of 102
Petroleum ConsultantsGLJ

Page 2
SUMMARY OF RESERVES
Remaining Reserves at Jan 01, 2012 Oil Equivalents Reserve Life Indic. (yr)
Working Roy/NPI Total Oil Eq. Company % of Reserve Life HalfProduct Units Interest Interest Company Net Factor Mboe Total Life Index Life
Residue Gas MMcf 21,949 0 21,949 20,944 6.000 3,658 99 17.0 6.4 4.3Gas Heat Content BBtu 23,266 0 23,266 22,200 0.000 0 0 17.0 6.4 4.3Condensate Mbbl 28 0 28 27 1.000 28 1 17.0 6.4 4.3Total: Oil Eq. Mboe 3,686 0 3,686 3,517 1.000 3,686 100 17.0 6.4 4.3
PRODUCT REVENUE AND EXPENSES
Average First Year Unit Values Net Revenue After Royalties
Wellhead Operating Other Prod'n Undisc % of 10% Disc % ofProduct Units Base Price Price Adjust. Price Net Burdens Expenses Expenses Revenue M$ Total M$ Total
Residue Gas $/Mcf 3.29 0.21 3.50 0.19 1.00 0.00 2.31 117,815 98 68,365 98Condensate $/bbl 107.14 -20.64 86.50 4.76 0.00 0.00 81.75 2,323 2 1,463 2Total: Oil Eq. $/boe 20.42 1.08 21.50 1.18 5.96 0.00 14.36 120,138 100 69,828 100
REVENUE BURDENS AND NET PRESENT VALUE SUMMARY
Net Present Value Before Income Tax
Revenue Burdens (%) Disc. Prod'n Operating Capital Cash FlowRate Revenue Income Invest.
Initial Average % M$ M$ M$ M$ $/boe
Crown Royalty 5.5000 4.6130 0.0 63,334 68,004 0.0 68,004 18.45Non-crown Royalty 0.0000 0.0000 5.0 50,639 55,395 0.0 55,395 15.03Mineral Tax 0.0000 0.0000 8.0 45,033 49,612 0.0 49,612 13.46
10.0 41,898 46,325 0.0 46,325 12.5712.0 39,154 43,416 0.0 43,416 11.7815.0 35,634 39,645 0.0 39,645 10.7620.0 30,986 34,602 0.0 34,602 9.39
Evaluator: Werth, James P.Run Date: February 16, 2012 11:30:19
1121357 Proved Producing, GLJ (2012-01), pri February 16, 2012 12:52:08
Page: 17 of 102
Petroleum ConsultantsGLJ

Company: Corridor Resources Inc. Reserve Class: ProvedProperty: Corporate Development Class: UndevelopedDescription: Summary Pricing: GLJ (2012-01)
Effective Date: December 31, 2011
Economic Forecast
PRODUCTION FORECAST
Light/Medium Oil Production Solution Gas Production Residue Gas Production
Company Wells Company Company Company Company Company CompanyDaily Yearly Net Yearly Price Daily Yearly Net Yearly Price Daily Yearly Net Yearly Price
Year Oil Gas bbl/d Mbbl Mbbl $/bbl Mcf/d MMcf MMcf $/Mcf Mcf/d MMcf MMcf $/Mcf
2012 0 0 0 0 0 0.00 0 0 0 0.00 0 0 0 0.002013 1 5 59 22 20 101.34 46 17 15 4.17 2,546 929 841 4.172014 1 8 65 24 21 98.28 51 19 17 4.70 7,063 2,578 2,333 4.702015 1 13 35 13 12 96.24 27 10 9 5.24 10,478 3,825 3,461 5.242016 1 15 22 8 7 96.24 17 6 6 5.77 11,456 4,181 3,784 5.772017 1 15 15 5 5 96.24 12 4 4 6.31 9,702 3,541 3,205 6.312018 1 15 11 4 4 97.62 9 3 3 6.59 7,788 2,842 2,572 6.592019 1 15 8 3 3 99.69 7 2 2 6.73 6,412 2,340 2,118 6.732020 1 15 7 2 2 101.80 5 2 2 6.88 5,399 1,971 1,783 6.882021 1 15 5 2 2 103.95 4 2 1 7.03 4,594 1,677 1,517 7.032022 1 15 4 2 1 106.15 3 1 1 7.17 3,972 1,450 1,312 7.172023 1 15 4 1 1 108.39 3 1 1 7.31 3,473 1,267 1,147 7.31Sub. 86 78 98.97 67 61 5.21 26,602 24,075 6.09Rem. 1 1 110.67 1 1 7.45 10,069 9,113 8.55Tot. 87 79 99.08 68 61 5.23 36,671 33,187 6.77
Total Gas Production Condensate Production Total Oil + NGL Production
Company Company Company Company Company CompanyDaily Yearly Net Yearly Price Daily Yearly Net Yearly Price Daily Yearly Net Yearly Price
Year Mcf/d MMcf MMcf $/Mcf bbl/d Mbbl Mbbl $/bbl bbl/d Mbbl Mbbl $/bbl
2012 0 0 0 0.00 0 0 0 0.00 0 0 0 0.002013 2,593 946 856 4.17 3 1 1 86.50 63 23 21 100.562014 7,113 2,596 2,350 4.70 9 3 3 83.44 74 27 24 96.462015 10,506 3,835 3,470 5.24 13 5 4 81.40 48 18 16 92.132016 11,473 4,188 3,790 5.77 15 5 5 81.40 37 13 12 90.312017 9,713 3,545 3,209 6.31 12 5 4 81.40 27 10 9 89.532018 7,796 2,846 2,575 6.59 10 4 3 82.78 21 8 7 90.552019 6,419 2,343 2,120 6.73 8 3 3 84.85 17 6 5 92.332020 5,404 1,973 1,785 6.88 7 3 2 86.96 13 5 4 94.192021 4,598 1,678 1,519 7.03 6 2 2 89.11 11 4 4 96.142022 3,975 1,451 1,313 7.17 5 2 2 91.31 9 3 3 98.162023 3,475 1,269 1,148 7.31 4 2 1 93.55 8 3 3 100.24Sub. 26,669 24,135 6.09 34 31 84.24 120 109 94.80Rem. 10,070 9,113 8.55 13 12 112.97 14 12 112.84Tot. 36,739 33,249 6.76 47 42 92.12 134 121 96.64
Total Oil Equiv. Production
Company CompanyDaily Yearly Net Yearly Price
Year boe/d Mboe Mboe $/boe
2012 0 0 0 0.002013 495 181 163 34.592014 1,260 460 416 32.232015 1,799 657 594 33.072016 1,949 711 644 35.692017 1,646 601 544 38.722018 1,320 482 436 40.322019 1,086 397 359 41.142020 914 334 302 42.032021 777 284 257 42.932022 672 245 222 43.772023 587 214 194 44.63Sub. 4,565 4,131 38.05Rem. 1,692 1,531 51.81Tot. 6,257 5,662 41.77
1121357 Proved Undeveloped, GLJ (2012-01), pri February 16, 2012 12:52:15
Page: 18 of 102
Petroleum ConsultantsGLJ

Page 2
REVENUE AND EXPENSE FORECAST
Revenue Before BurdensRoyalty Burdens Gas Processing Total Net
Working Interest Royalty Company Pre-Processing Allowance Royalty Revenue Operating ExpensesInterest Interest After After
Oil Gas NGL+Sul Total Total Total Crown Other Crown Other Process. Royalty Fixed Variable TotalYear M$ M$ M$ M$ M$ M$ M$ M$ M$ M$ M$ M$ M$ M$ M$
2012 0 0 0 0 0 0 0 0 0 0 0 0 0 0 02013 2,197 3,945 104 6,246 0 6,246 593 0 0 0 593 5,653 64 288 3522014 2,329 12,214 277 14,819 0 14,819 1,408 0 0 0 1,408 13,411 178 630 8092015 1,232 20,091 398 21,722 0 21,722 2,064 0 0 0 2,064 19,658 303 838 1,1402016 773 24,178 435 25,387 0 25,387 2,412 0 0 0 2,412 22,975 390 903 1,2922017 528 22,368 368 23,265 0 23,265 2,210 0 0 0 2,210 21,054 424 773 1,1962018 390 18,741 301 19,431 0 19,431 1,846 0 0 0 1,846 17,585 432 630 1,0632019 303 15,757 254 16,314 0 16,314 1,550 0 0 0 1,550 14,764 441 528 9692020 244 13,561 219 14,024 0 14,024 1,332 0 0 0 1,332 12,692 450 452 9022021 200 11,791 191 12,182 0 12,182 1,157 0 0 0 1,157 11,025 459 392 8512022 168 10,398 169 10,735 0 10,735 1,020 0 0 0 1,020 9,715 468 345 8132023 144 9,271 151 9,567 0 9,567 909 0 0 0 909 8,658 477 308 785Sub. 8,507 162,316 2,868 173,691 0 173,691 16,501 0 0 0 16,501 157,190 4,086 6,087 10,173Rem. 89 86,120 1,452 87,661 0 87,661 8,328 0 0 0 8,328 79,333 9,250 2,788 12,039Tot. 8,596 248,436 4,320 261,352 0 261,352 24,828 0 0 0 24,828 236,523 13,337 8,875 22,212Disc 6,122 106,937 1,919 114,978 0 114,978 10,923 0 0 0 10,923 104,055 3,412 4,065 7,476
Net Net Capital Investment Before Tax Cash FlowMineral Capital NPI Prod'n Other Aband. Oper.
Tax Tax Burden Revenue Income Costs Income Dev. Plant Tang. Total Annual Cum. 10.0% DcfYear M$ M$ M$ M$ M$ M$ M$ M$ M$ M$ M$ M$ M$ M$
2012 0 0 0 0 102 0 102 0 0 0 0 102 102 972013 0 0 0 5,301 325 0 5,626 13,306 0 0 13,306 -7,680 -7,578 -6,5602014 0 0 0 12,603 919 0 13,522 21,193 0 0 21,193 -7,671 -15,250 -12,6052015 0 0 0 18,518 1,785 0 20,303 21,882 0 0 21,882 -1,579 -16,829 -13,7362016 0 0 0 21,682 1,763 0 23,446 12,600 0 0 12,600 10,846 -5,983 -6,6732017 0 0 0 19,858 1,418 0 21,276 3,213 0 0 3,213 18,063 12,080 4,0212018 0 0 0 16,522 1,170 0 17,692 0 0 0 0 17,692 29,772 13,5432019 0 0 0 13,795 983 0 14,778 0 0 0 0 14,778 44,550 20,7732020 0 0 0 11,789 840 0 12,629 0 0 0 0 12,629 57,179 26,3912021 0 0 0 10,174 723 0 10,897 0 0 0 0 10,897 68,076 30,7972022 0 0 0 8,902 631 0 9,533 0 0 0 0 9,533 77,609 34,3012023 0 0 0 7,873 556 0 8,429 0 0 0 0 8,429 86,038 37,118Sub. 0 0 0 147,017 11,214 0 158,231 72,193 0 0 72,193 86,038 86,038 37,118Rem. 0 0 0 67,295 4,822 6,919 65,198 0 0 0 0 65,198 151,236 49,417Tot. 0 0 0 214,312 16,036 6,919 223,429 72,193 0 0 72,193 151,236 151,236 49,417Disc 0 0 0 96,578 7,412 558 103,433 54,016 0 0 54,016 49,417 49,417 49,417
SUMMARY OF RESERVES
Remaining Reserves at Jan 01, 2012 Oil Equivalents Reserve Life Indic. (yr)
Working Roy/NPI Total Oil Eq. Company % of Reserve Life HalfProduct Units Interest Interest Company Net Factor Mboe Total Life Index Life
Light/Med Oil Mbbl 87 0 87 79 1.000 87 1 13.0 4.0 2.9Solution Gas MMcf 68 0 68 61 6.000 11 0 13.0 4.0 2.9Residue Gas MMcf 36,671 0 36,671 33,187 6.000 6,112 98 39.0 39.5 7.2Total: Gas MMcf 36,739 0 36,739 33,249 6.000 6,123 98 39.0 38.8 7.2Gas Heat Content BBtu 38,943 0 38,943 35,244 0.000 0 0 39.0 38.8 7.2Condensate Mbbl 47 0 47 42 1.000 47 1 39.0 38.8 7.2Total: Oil+NGL Mbbl 134 0 134 121 1.000 134 2 39.0 5.8 4.0Total: Oil Eq. Mboe 6,257 0 6,257 5,662 1.000 6,257 100 39.0 34.6 7.1
PRODUCT REVENUE AND EXPENSES
Average First Year Unit Values Net Revenue After Royalties
Wellhead Operating Other Prod'n Undisc % of 10% Disc % ofProduct Units Base Price Price Adjust. Price Net Burdens Expenses Expenses Revenue M$ Total M$ Total
Light/Med Oil $/bbl 0.00 0.00 0.00 0.00 0.00 0.00 0.00 7,779 3 5,540 5Solution Gas $/Mcf 0.00 0.00 0.00 0.00 0.00 0.00 0.00 321 0 220 0Residue Gas $/Mcf 0.00 0.00 0.00 0.00 0.00 0.00 0.00 224,514 95 96,558 93Total: Gas $/Mcf 0.00 0.00 0.00 0.00 0.00 0.00 0.00 224,835 95 96,778 93Condensate $/bbl 0.00 0.00 0.00 0.00 0.00 0.00 0.00 3,909 2 1,737 2Total: Oil+NGL $/bbl 0.00 0.00 0.00 0.00 0.00 0.00 0.00 11,688 5 7,277 7Total: Oil Eq. $/boe 0.00 0.00 0.00 0.00 0.00 0.00 0.00 236,523 100 104,055 100
1121357 Proved Undeveloped, GLJ (2012-01), pri February 16, 2012 12:52:15
Page: 19 of 102
Petroleum ConsultantsGLJ

Page 3
REVENUE BURDENS AND NET PRESENT VALUE SUMMARY
Net Present Value Before Income Tax
Revenue Burdens (%) Disc. Prod'n Operating Capital Cash FlowRate Revenue Income Invest.
Initial Average % M$ M$ M$ M$ $/boe
Crown Royalty 0.0000 9.5000 0.0 214,312 223,429 72,193 151,236 24.17Non-crown Royalty 0.0000 0.0000 5.0 136,932 145,507 62,146 83,361 13.32Mineral Tax 0.0000 0.0000 8.0 110,054 117,585 57,069 60,516 9.67
10.0 96,578 103,433 54,016 49,417 7.9012.0 85,584 91,817 51,196 40,621 6.4915.0 72,482 77,904 47,357 30,547 4.8820.0 56,715 61,074 41,843 19,232 3.07
Evaluator: Werth, James P.Run Date: February 16, 2012 11:30:21
1121357 Proved Undeveloped, GLJ (2012-01), pri February 16, 2012 12:52:15
Page: 20 of 102
Petroleum ConsultantsGLJ

Company: Corridor Resources Inc. Reserve Class: ProvedProperty: Corporate Development Class: Total NonproducingDescription: Summary Pricing: GLJ (2012-01)
Effective Date: December 31, 2011
Economic Forecast
PRODUCTION FORECAST
Light/Medium Oil Production Solution Gas Production Residue Gas Production
Company Wells Company Company Company Company Company CompanyDaily Yearly Net Yearly Price Daily Yearly Net Yearly Price Daily Yearly Net Yearly Price
Year Oil Gas bbl/d Mbbl Mbbl $/bbl Mcf/d MMcf MMcf $/Mcf Mcf/d MMcf MMcf $/Mcf
2012 0 0 0 0 0 0.00 0 0 0 0.00 0 0 0 0.002013 1 5 59 22 20 101.34 46 17 15 4.17 2,546 929 841 4.172014 1 8 65 24 21 98.28 51 19 17 4.70 7,063 2,578 2,333 4.702015 1 13 35 13 12 96.24 27 10 9 5.24 10,478 3,825 3,461 5.242016 1 15 22 8 7 96.24 17 6 6 5.77 11,456 4,181 3,784 5.772017 1 15 15 5 5 96.24 12 4 4 6.31 9,702 3,541 3,205 6.312018 1 15 11 4 4 97.62 9 3 3 6.59 7,788 2,842 2,572 6.592019 1 15 8 3 3 99.69 7 2 2 6.73 6,412 2,340 2,118 6.732020 1 15 7 2 2 101.80 5 2 2 6.88 5,399 1,971 1,783 6.882021 1 15 5 2 2 103.95 4 2 1 7.03 4,594 1,677 1,517 7.032022 1 15 4 2 1 106.15 3 1 1 7.17 3,972 1,450 1,312 7.172023 1 15 4 1 1 108.39 3 1 1 7.31 3,473 1,267 1,147 7.31Sub. 86 78 98.97 67 61 5.21 26,602 24,075 6.09Rem. 1 1 110.67 1 1 7.45 10,069 9,113 8.55Tot. 87 79 99.08 68 61 5.23 36,671 33,187 6.77
Total Gas Production Condensate Production Total Oil + NGL Production
Company Company Company Company Company CompanyDaily Yearly Net Yearly Price Daily Yearly Net Yearly Price Daily Yearly Net Yearly Price
Year Mcf/d MMcf MMcf $/Mcf bbl/d Mbbl Mbbl $/bbl bbl/d Mbbl Mbbl $/bbl
2012 0 0 0 0.00 0 0 0 0.00 0 0 0 0.002013 2,593 946 856 4.17 3 1 1 86.50 63 23 21 100.562014 7,113 2,596 2,350 4.70 9 3 3 83.44 74 27 24 96.462015 10,506 3,835 3,470 5.24 13 5 4 81.40 48 18 16 92.132016 11,473 4,188 3,790 5.77 15 5 5 81.40 37 13 12 90.312017 9,713 3,545 3,209 6.31 12 5 4 81.40 27 10 9 89.532018 7,796 2,846 2,575 6.59 10 4 3 82.78 21 8 7 90.552019 6,419 2,343 2,120 6.73 8 3 3 84.85 17 6 5 92.332020 5,404 1,973 1,785 6.88 7 3 2 86.96 13 5 4 94.192021 4,598 1,678 1,519 7.03 6 2 2 89.11 11 4 4 96.142022 3,975 1,451 1,313 7.17 5 2 2 91.31 9 3 3 98.162023 3,475 1,269 1,148 7.31 4 2 1 93.55 8 3 3 100.24Sub. 26,669 24,135 6.09 34 31 84.24 120 109 94.80Rem. 10,070 9,113 8.55 13 12 112.97 14 12 112.84Tot. 36,739 33,249 6.76 47 42 92.12 134 121 96.64
Total Oil Equiv. Production
Company CompanyDaily Yearly Net Yearly Price
Year boe/d Mboe Mboe $/boe
2012 0 0 0 0.002013 495 181 163 34.592014 1,260 460 416 32.232015 1,799 657 594 33.072016 1,949 711 644 35.692017 1,646 601 544 38.722018 1,320 482 436 40.322019 1,086 397 359 41.142020 914 334 302 42.032021 777 284 257 42.932022 672 245 222 43.772023 587 214 194 44.63Sub. 4,565 4,131 38.05Rem. 1,692 1,531 51.81Tot. 6,257 5,662 41.77
1121357 Total Proved Nonproducing, GLJ (2012-01), pri February 16, 2012 12:52:20
Page: 21 of 102
Petroleum ConsultantsGLJ

Page 2
REVENUE AND EXPENSE FORECAST
Revenue Before BurdensRoyalty Burdens Gas Processing Total Net
Working Interest Royalty Company Pre-Processing Allowance Royalty Revenue Operating ExpensesInterest Interest After After
Oil Gas NGL+Sul Total Total Total Crown Other Crown Other Process. Royalty Fixed Variable TotalYear M$ M$ M$ M$ M$ M$ M$ M$ M$ M$ M$ M$ M$ M$ M$
2012 0 0 0 0 0 0 0 0 0 0 0 0 0 0 02013 2,197 3,945 104 6,246 0 6,246 593 0 0 0 593 5,653 64 288 3522014 2,329 12,214 277 14,819 0 14,819 1,408 0 0 0 1,408 13,411 178 630 8092015 1,232 20,091 398 21,722 0 21,722 2,064 0 0 0 2,064 19,658 303 838 1,1402016 773 24,178 435 25,387 0 25,387 2,412 0 0 0 2,412 22,975 390 903 1,2922017 528 22,368 368 23,265 0 23,265 2,210 0 0 0 2,210 21,054 424 773 1,1962018 390 18,741 301 19,431 0 19,431 1,846 0 0 0 1,846 17,585 432 630 1,0632019 303 15,757 254 16,314 0 16,314 1,550 0 0 0 1,550 14,764 441 528 9692020 244 13,561 219 14,024 0 14,024 1,332 0 0 0 1,332 12,692 450 452 9022021 200 11,791 191 12,182 0 12,182 1,157 0 0 0 1,157 11,025 459 392 8512022 168 10,398 169 10,735 0 10,735 1,020 0 0 0 1,020 9,715 468 345 8132023 144 9,271 151 9,567 0 9,567 909 0 0 0 909 8,658 477 308 785Sub. 8,507 162,316 2,868 173,691 0 173,691 16,501 0 0 0 16,501 157,190 4,086 6,087 10,173Rem. 89 86,120 1,452 87,661 0 87,661 8,328 0 0 0 8,328 79,333 9,250 2,788 12,039Tot. 8,596 248,436 4,320 261,352 0 261,352 24,828 0 0 0 24,828 236,523 13,337 8,875 22,212Disc 6,122 106,937 1,919 114,978 0 114,978 10,923 0 0 0 10,923 104,055 3,412 4,065 7,476
Net Net Capital Investment Before Tax Cash FlowMineral Capital NPI Prod'n Other Aband. Oper.
Tax Tax Burden Revenue Income Costs Income Dev. Plant Tang. Total Annual Cum. 10.0% DcfYear M$ M$ M$ M$ M$ M$ M$ M$ M$ M$ M$ M$ M$ M$
2012 0 0 0 0 102 0 102 0 0 0 0 102 102 972013 0 0 0 5,301 325 0 5,626 13,306 0 0 13,306 -7,680 -7,578 -6,5602014 0 0 0 12,603 919 0 13,522 21,193 0 0 21,193 -7,671 -15,250 -12,6052015 0 0 0 18,518 1,785 0 20,303 21,882 0 0 21,882 -1,579 -16,829 -13,7362016 0 0 0 21,682 1,763 0 23,446 12,600 0 0 12,600 10,846 -5,983 -6,6732017 0 0 0 19,858 1,418 0 21,276 3,213 0 0 3,213 18,063 12,080 4,0212018 0 0 0 16,522 1,170 0 17,692 0 0 0 0 17,692 29,772 13,5432019 0 0 0 13,795 983 0 14,778 0 0 0 0 14,778 44,550 20,7732020 0 0 0 11,789 840 0 12,629 0 0 0 0 12,629 57,179 26,3912021 0 0 0 10,174 723 0 10,897 0 0 0 0 10,897 68,076 30,7972022 0 0 0 8,902 631 0 9,533 0 0 0 0 9,533 77,609 34,3012023 0 0 0 7,873 556 0 8,429 0 0 0 0 8,429 86,038 37,118Sub. 0 0 0 147,017 11,214 0 158,231 72,193 0 0 72,193 86,038 86,038 37,118Rem. 0 0 0 67,295 4,822 6,919 65,198 0 0 0 0 65,198 151,236 49,417Tot. 0 0 0 214,312 16,036 6,919 223,429 72,193 0 0 72,193 151,236 151,236 49,417Disc 0 0 0 96,578 7,412 558 103,433 54,016 0 0 54,016 49,417 49,417 49,417
SUMMARY OF RESERVES
Remaining Reserves at Jan 01, 2012 Oil Equivalents Reserve Life Indic. (yr)
Working Roy/NPI Total Oil Eq. Company % of Reserve Life HalfProduct Units Interest Interest Company Net Factor Mboe Total Life Index Life
Light/Med Oil Mbbl 87 0 87 79 1.000 87 1 13.0 4.0 2.9Solution Gas MMcf 68 0 68 61 6.000 11 0 13.0 4.0 2.9Residue Gas MMcf 36,671 0 36,671 33,187 6.000 6,112 98 39.0 39.5 7.2Total: Gas MMcf 36,739 0 36,739 33,249 6.000 6,123 98 39.0 38.8 7.2Gas Heat Content BBtu 38,943 0 38,943 35,244 0.000 0 0 39.0 38.8 7.2Condensate Mbbl 47 0 47 42 1.000 47 1 39.0 38.8 7.2Total: Oil+NGL Mbbl 134 0 134 121 1.000 134 2 39.0 5.8 4.0Total: Oil Eq. Mboe 6,257 0 6,257 5,662 1.000 6,257 100 39.0 34.6 7.1
PRODUCT REVENUE AND EXPENSES
Average First Year Unit Values Net Revenue After Royalties
Wellhead Operating Other Prod'n Undisc % of 10% Disc % ofProduct Units Base Price Price Adjust. Price Net Burdens Expenses Expenses Revenue M$ Total M$ Total
Light/Med Oil $/bbl 0.00 0.00 0.00 0.00 0.00 0.00 0.00 7,779 3 5,540 5Solution Gas $/Mcf 0.00 0.00 0.00 0.00 0.00 0.00 0.00 321 0 220 0Residue Gas $/Mcf 0.00 0.00 0.00 0.00 0.00 0.00 0.00 224,514 95 96,558 93Total: Gas $/Mcf 0.00 0.00 0.00 0.00 0.00 0.00 0.00 224,835 95 96,778 93Condensate $/bbl 0.00 0.00 0.00 0.00 0.00 0.00 0.00 3,909 2 1,737 2Total: Oil+NGL $/bbl 0.00 0.00 0.00 0.00 0.00 0.00 0.00 11,688 5 7,277 7Total: Oil Eq. $/boe 0.00 0.00 0.00 0.00 0.00 0.00 0.00 236,523 100 104,055 100
1121357 Total Proved Nonproducing, GLJ (2012-01), pri February 16, 2012 12:52:20
Page: 22 of 102
Petroleum ConsultantsGLJ

Page 3
REVENUE BURDENS AND NET PRESENT VALUE SUMMARY
Net Present Value Before Income Tax
Revenue Burdens (%) Disc. Prod'n Operating Capital Cash FlowRate Revenue Income Invest.
Initial Average % M$ M$ M$ M$ $/boe
Crown Royalty 0.0000 9.5000 0.0 214,312 223,429 72,193 151,236 24.17Non-crown Royalty 0.0000 0.0000 5.0 136,932 145,507 62,146 83,361 13.32Mineral Tax 0.0000 0.0000 8.0 110,054 117,585 57,069 60,516 9.67
10.0 96,578 103,433 54,016 49,417 7.9012.0 85,584 91,817 51,196 40,621 6.4915.0 72,482 77,904 47,357 30,547 4.8820.0 56,715 61,074 41,843 19,232 3.07
Evaluator: Werth, James P.Run Date: February 16, 2012 11:30:20
1121357 Total Proved Nonproducing, GLJ (2012-01), pri February 16, 2012 12:52:20
Page: 23 of 102
Petroleum ConsultantsGLJ

Company: Corridor Resources Inc. Reserve Class: ProvedProperty: Corporate Development Class: TotalDescription: Summary Pricing: GLJ (2012-01)
Effective Date: December 31, 2011
Economic Forecast
PRODUCTION FORECAST
Light/Medium Oil Production Solution Gas Production Residue Gas Production
Company Wells Company Company Company Company Company CompanyDaily Yearly Net Yearly Price Daily Yearly Net Yearly Price Daily Yearly Net Yearly Price
Year Oil Gas bbl/d Mbbl Mbbl $/bbl Mcf/d MMcf MMcf $/Mcf Mcf/d MMcf MMcf $/Mcf
2012 0 22 0 0 0 0.00 0 0 0 0.00 9,348 3,412 3,224 3.502013 1 26 59 22 20 101.34 46 17 15 4.17 10,279 3,752 3,531 4.172014 1 27 65 24 21 98.28 51 19 17 4.70 13,471 4,917 4,576 4.702015 1 30 35 13 12 96.24 27 10 9 5.24 15,609 5,697 5,267 5.242016 1 32 22 8 7 96.24 17 6 6 5.77 15,814 5,772 5,329 5.772017 1 32 15 5 5 96.24 12 4 4 6.31 13,538 4,941 4,573 6.312018 1 32 11 4 4 97.62 9 3 3 6.59 11,197 4,087 3,767 6.592019 1 32 8 3 3 99.69 7 2 2 6.73 9,476 3,459 3,168 6.732020 1 31 7 2 2 101.80 5 2 2 6.88 8,167 2,981 2,738 6.882021 1 31 5 2 2 103.95 4 2 1 7.03 7,083 2,585 2,382 7.032022 1 31 4 2 1 106.15 3 1 1 7.17 6,212 2,268 2,096 7.172023 1 30 4 1 1 108.39 3 1 1 7.31 5,470 1,997 1,853 7.31Sub. 86 78 98.97 67 61 5.21 45,868 42,504 5.77Rem. 1 1 110.67 1 1 7.45 12,752 11,627 8.38Tot. 87 79 99.08 68 61 5.23 58,620 54,131 6.34
Total Gas Production Condensate Production Total Oil + NGL Production
Company Company Company Company Company CompanyDaily Yearly Net Yearly Price Daily Yearly Net Yearly Price Daily Yearly Net Yearly Price
Year Mcf/d MMcf MMcf $/Mcf bbl/d Mbbl Mbbl $/bbl bbl/d Mbbl Mbbl $/bbl
2012 9,348 3,412 3,224 3.50 12 4 4 86.50 12 4 4 86.502013 10,326 3,769 3,546 4.17 13 5 5 86.50 73 26 24 98.652014 13,522 4,936 4,593 4.70 17 6 6 83.44 82 30 27 95.162015 15,637 5,707 5,276 5.24 20 7 7 81.40 55 20 18 90.862016 15,831 5,778 5,334 5.77 20 7 7 81.40 42 15 14 89.142017 13,550 4,946 4,577 6.31 17 6 6 81.40 32 12 11 88.302018 11,205 4,090 3,770 6.59 14 5 5 82.78 25 9 8 89.212019 9,483 3,461 3,170 6.73 12 4 4 84.85 20 7 7 90.892020 8,172 2,983 2,740 6.88 10 4 3 86.96 17 6 6 92.692021 7,088 2,587 2,383 7.03 9 3 3 89.11 14 5 5 94.582022 6,216 2,269 2,097 7.17 8 3 3 91.31 12 4 4 96.562023 5,473 1,998 1,854 7.31 7 3 2 93.55 11 4 4 98.64Sub. 45,936 42,565 5.77 59 54 84.61 145 132 93.15Rem. 12,752 11,627 8.38 16 15 110.27 17 16 110.28Tot. 58,688 54,192 6.34 75 69 90.19 162 148 94.96
Total Oil Equiv. Production
Company CompanyDaily Yearly Net Yearly Price
Year boe/d Mboe Mboe $/boe
2012 1,570 573 542 21.502013 1,794 655 615 27.992014 2,336 853 793 30.582015 2,661 971 898 32.672016 2,681 978 903 35.502017 2,291 836 774 38.572018 1,893 691 637 40.182019 1,601 584 535 41.002020 1,379 503 462 41.882021 1,196 436 402 42.782022 1,048 383 354 43.622023 923 337 313 44.48Sub. 7,801 7,226 35.71Rem. 2,142 1,953 50.75Tot. 9,943 9,180 38.95
1121357 Total Proved, GLJ (2012-01), pri February 16, 2012 12:52:25
Page: 24 of 102
Petroleum ConsultantsGLJ

Page 2
REVENUE AND EXPENSE FORECAST
Revenue Before BurdensRoyalty Burdens Gas Processing Total Net
Working Interest Royalty Company Pre-Processing Allowance Royalty Revenue Operating ExpensesInterest Interest After After
Oil Gas NGL+Sul Total Total Total Crown Other Crown Other Process. Royalty Fixed Variable TotalYear M$ M$ M$ M$ M$ M$ M$ M$ M$ M$ M$ M$ M$ M$ M$
2012 0 11,943 377 12,320 0 12,320 678 0 0 0 678 11,642 2,766 648 3,4142013 2,197 15,712 416 18,326 0 18,326 1,161 0 0 0 1,161 17,164 2,865 835 3,7012014 2,329 23,218 526 26,073 0 26,073 1,869 0 0 0 1,869 24,203 2,997 1,093 4,0902015 1,232 29,904 593 31,729 0 31,729 2,424 0 0 0 2,424 29,305 3,131 1,215 4,3472016 773 33,364 600 34,737 0 34,737 2,683 0 0 0 2,683 32,054 3,267 1,230 4,4972017 528 31,203 514 32,245 0 32,245 2,417 0 0 0 2,417 29,828 3,354 1,066 4,4202018 390 26,935 432 27,757 0 27,757 2,179 0 0 0 2,179 25,578 3,412 896 4,3092019 303 23,279 375 23,957 0 23,957 2,016 0 0 0 2,016 21,941 3,481 772 4,2522020 244 20,508 331 21,083 0 21,083 1,721 0 0 0 1,721 19,362 3,534 677 4,2112021 200 18,175 294 18,669 0 18,669 1,475 0 0 0 1,475 17,194 3,592 598 4,1912022 168 16,257 264 16,690 0 16,690 1,264 0 0 0 1,264 15,426 3,644 535 4,1782023 144 14,601 239 14,984 0 14,984 1,082 0 0 0 1,082 13,901 3,680 480 4,160Sub. 8,507 265,101 4,961 278,568 0 278,568 20,968 0 0 0 20,968 257,600 39,723 10,046 49,770Rem. 89 106,848 1,795 108,731 0 108,731 9,670 0 0 0 9,670 99,061 25,788 3,458 29,246Tot. 8,596 371,948 6,756 387,300 0 387,300 30,638 0 0 0 30,638 356,661 65,512 13,504 79,016Disc 6,122 178,468 3,452 188,041 0 188,041 14,158 0 0 0 14,158 173,883 28,481 6,925 35,406
Net Net Capital Investment Before Tax Cash FlowMineral Capital NPI Prod'n Other Aband. Oper.
Tax Tax Burden Revenue Income Costs Income Dev. Plant Tang. Total Annual Cum. 10.0% DcfYear M$ M$ M$ M$ M$ M$ M$ M$ M$ M$ M$ M$ M$ M$
2012 0 0 0 8,228 1,493 0 9,721 0 0 0 0 9,721 9,721 9,2682013 0 0 0 13,464 1,450 510 14,404 13,306 0 0 13,306 1,098 10,818 10,2202014 0 0 0 20,113 1,886 390 21,609 21,193 0 0 21,193 416 11,234 10,5472015 0 0 0 24,958 2,745 0 27,703 21,882 0 0 21,882 5,821 17,055 14,7172016 0 0 0 27,557 2,658 0 30,216 12,600 0 0 12,600 17,616 34,671 26,1892017 0 0 0 25,408 2,187 138 27,457 3,213 0 0 3,213 24,244 58,915 40,5422018 0 0 0 21,269 1,846 0 23,116 0 0 0 0 23,116 82,031 52,9832019 0 0 0 17,688 1,584 144 19,128 0 0 0 0 19,128 101,159 62,3422020 0 0 0 15,151 1,380 146 16,385 0 0 0 0 16,385 117,543 69,6302021 0 0 0 13,004 1,195 0 14,198 0 0 0 0 14,198 131,742 75,3712022 0 0 0 11,248 1,058 305 12,000 0 0 0 0 12,000 143,742 79,7832023 0 0 0 9,742 944 311 10,374 0 0 0 0 10,374 154,116 83,250Sub. 0 0 0 207,831 20,423 1,944 226,310 72,193 0 0 72,193 154,116 154,116 83,250Rem. 0 0 0 69,815 6,782 11,473 65,124 0 0 0 0 65,124 219,240 95,742Tot. 0 0 0 277,645 27,205 13,417 291,433 72,193 0 0 72,193 219,240 219,240 95,742Disc 0 0 0 138,477 14,056 2,775 149,758 54,016 0 0 54,016 95,742 95,742 95,742
SUMMARY OF RESERVES
Remaining Reserves at Jan 01, 2012 Oil Equivalents Reserve Life Indic. (yr)
Working Roy/NPI Total Oil Eq. Company % of Reserve Life HalfProduct Units Interest Interest Company Net Factor Mboe Total Life Index Life
Light/Med Oil Mbbl 87 0 87 79 1.000 87 1 13.0 4.0 2.9Solution Gas MMcf 68 0 68 61 6.000 11 0 13.0 4.0 2.9Residue Gas MMcf 58,620 0 58,620 54,131 6.000 9,770 98 39.0 17.2 6.2Total: Gas MMcf 58,688 0 58,688 54,192 6.000 9,781 98 39.0 17.2 6.2Gas Heat Content BBtu 62,209 0 62,209 57,444 0.000 0 0 39.0 17.2 6.2Condensate Mbbl 75 0 75 69 1.000 75 1 39.0 17.2 6.2Total: Oil+NGL Mbbl 162 0 162 148 1.000 162 2 39.0 37.1 4.0Total: Oil Eq. Mboe 9,943 0 9,943 9,180 1.000 9,943 100 39.0 17.4 6.2
PRODUCT REVENUE AND EXPENSES
Average First Year Unit Values Net Revenue After Royalties
Wellhead Operating Other Prod'n Undisc % of 10% Disc % ofProduct Units Base Price Price Adjust. Price Net Burdens Expenses Expenses Revenue M$ Total M$ Total
Light/Med Oil $/bbl 0.00 0.00 0.00 0.00 0.00 0.00 0.00 7,779 2 5,540 3Solution Gas $/Mcf 0.00 0.00 0.00 0.00 0.00 0.00 0.00 321 0 220 0Residue Gas $/Mcf 3.29 0.21 3.50 0.19 1.00 0.00 2.31 342,329 96 164,923 95Total: Gas $/Mcf 3.29 0.21 3.50 0.19 1.00 0.00 2.31 342,650 96 165,143 95Condensate $/bbl 107.14 -20.64 86.50 4.76 0.00 0.00 81.75 6,232 2 3,200 2Total: Oil+NGL $/bbl 107.14 -20.64 86.50 4.76 0.00 0.00 81.75 14,011 4 8,740 5Total: Oil Eq. $/boe 20.42 1.08 21.50 1.18 5.96 0.00 14.36 356,661 100 173,883 100
1121357 Total Proved, GLJ (2012-01), pri February 16, 2012 12:52:25
Page: 25 of 102
Petroleum ConsultantsGLJ
Page 3
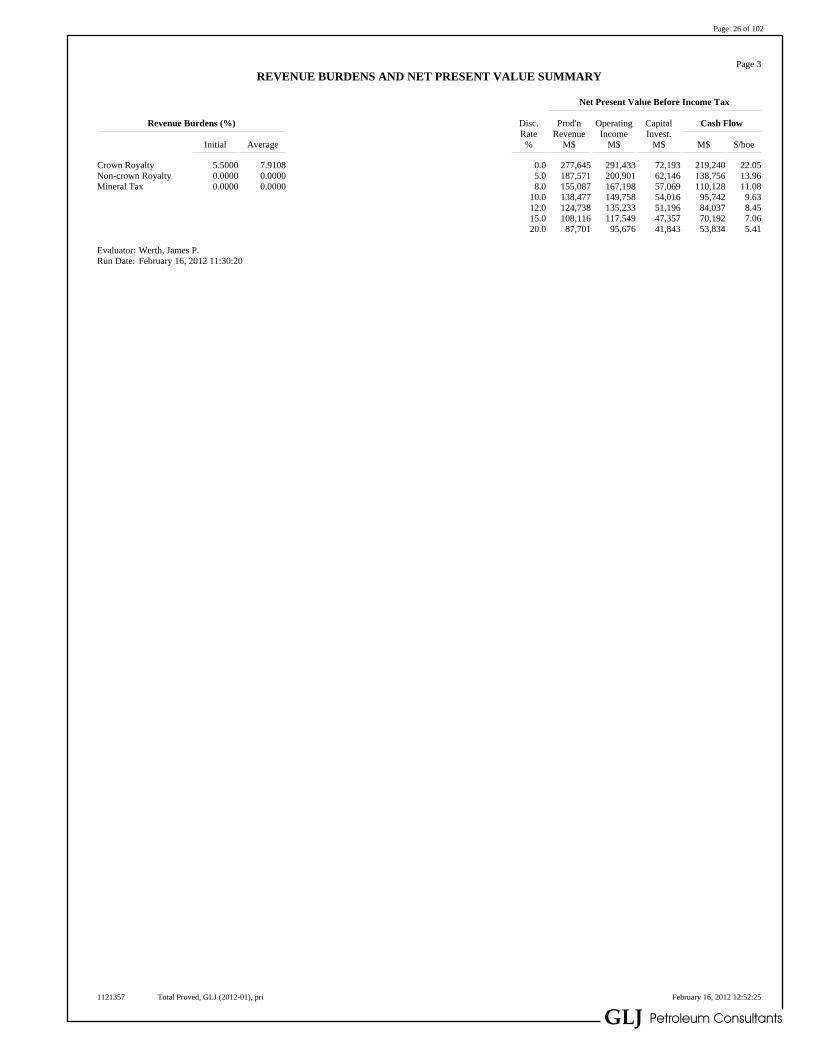
REVENUE BURDENS AND NET PRESENT VALUE SUMMARY
Net Present Value Before Income Tax
Revenue Burdens (%) Disc. Prod'n Operating Capital Cash FlowRate Revenue Income Invest.
Initial Average % M$ M$ M$ M$ $/boe
Crown Royalty 5.5000 7.9108 0.0 277,645 291,433 72,193 219,240 22.05Non-crown Royalty 0.0000 0.0000 5.0 187,571 200,901 62,146 138,756 13.96Mineral Tax 0.0000 0.0000 8.0 155,087 167,198 57,069 110,128 11.08
10.0 138,477 149,758 54,016 95,742 9.6312.0 124,738 135,233 51,196 84,037 8.4515.0 108,116 117,549 47,357 70,192 7.0620.0 87,701 95,676 41,843 53,834 5.41
Evaluator: Werth, James P.Run Date: February 16, 2012 11:30:20
1121357 Total Proved, GLJ (2012-01), pri February 16, 2012 12:52:25
Page: 26 of 102
Petroleum ConsultantsGLJ

Page: 27 of 102
Petroleum ConsultantsGLJ
PROBABLE AND PROVED PLUS PROBABLE RESERVES
TABLE OF CONTENTS
Page
SUMMARY OF RESERVES AND VALUES 28
COMPANY PRODUCTION, RESERVES AND PRESENT VALUE SUMMARY 29
ECONOMIC FORECASTSTotal Probable 30Total Proved Plus Probable 33
March 13, 2012 15:51:06

Company: Corridor Resources Inc. Reserve Class: VariousProperty: Corporate Development Class: ClassificationsDescription: Summary Pricing: GLJ (2012-01)
Effective Date: December 31, 2011
Summary of Reserves and Values
TotalProved
Total PlusProbable Probable
MARKETABLE RESERVESLight/Medium Oil (Mbbl)
Total Company Interest 434 521Working Interest 434 521Net After Royalty 393 471
Gas (MMcf)Total Company Interest 43,967 102,654Working Interest 43,967 102,654Net After Royalty 39,955 94,147
Natural Gas Liquids (Mbbl)Total Company Interest 56 131Working Interest 56 131Net After Royalty 51 120
Oil Equivalent (Mbbl)Total Company Interest 7,818 17,761Working Interest 7,818 17,761Net After Royalty 7,103 16,282
BEFORE TAX PRESENT VALUE (M$)0% 244,854 464,0945% 127,138 265,8948% 91,823 201,95110% 75,405 171,14712% 62,717 146,75415% 48,508 118,70120% 32,905 86,738
FIRST 6 YEARS BEFORE TAX CASH FLOW (M$)2012 385 10,1062013 -229 8692014 -5,717 -5,3012015 7,094 12,9152016 -798 16,8182017 18,905 43,149
BOE Factors: HVY OIL 1.0 RES GAS 6.0 PROPANE 1.0 ETHANE 1.0COND 1.0 SLN GAS 6.0 BUTANE 1.0 SULPHUR 0.0
Run Date: February 16, 2012 11:30:20
1121357 Class (F,I), GLJ (2012-01), psum February 16, 2012 12:52:27
Page: 28 of 102
Petroleum ConsultantsGLJ

Company: Corridor Resources Inc. Reserve Class: VariousProperty: Corporate Development Class: ClassificationsDescription: Summary Pricing: GLJ (2012-01)
Effective Date: December 31, 2011
Company Production, Reserves and Present Value Summary
2012 Company Interest Prod'n Company Interest Reserves Net After Royalty Reserves Reserve Before Income TaxLife Discounted Present Value (M$)
Gas Oil NGL Oil Eq. Gas Oil NGL Sulphur Oil Eq. Gas Oil NGL Sulphur Oil Eq. IndexEntity Description Mcf/d bbl/d bbl/d boe/d MMcf Mbbl Mbbl Mlt Mboe MMcf Mbbl Mbbl Mlt Mboe yrs 0% 8% 10% 12%
Total ProbableMcCully 204 0 0 34 43,967 434 56 0 7,818 39,955 393 51 0 7,103 624.3 244,854 91,823 75,405 62,717
Total: Total Probable 204 0 0 34 43,967 434 56 0 7,818 39,955 393 51 0 7,103 624.3 244,854 91,823 75,405 62,717
Total Proved Plus ProbableMcCully 9,553 0 12 1,604 102,654 521 131 0 17,761 94,147 471 120 0 16,282 30.3 464,094 201,951 171,147 146,754
Total: Total Proved Plus Probable 9,553 0 12 1,604 102,654 521 131 0 17,761 94,147 471 120 0 16,282 30.3 464,094 201,951 171,147 146,754
BOE Factors: HVY OIL 1.0 RES GAS 6.0 PROPANE 1.0 ETHANE 1.0COND 1.0 SLN GAS 6.0 BUTANE 1.0 SULPHUR 0.0
1121357 Class (F,I), GLJ (2012-01), crv February 16, 2012 12:52:28
Page: 29 of 102
Petroleum ConsultantsGLJ
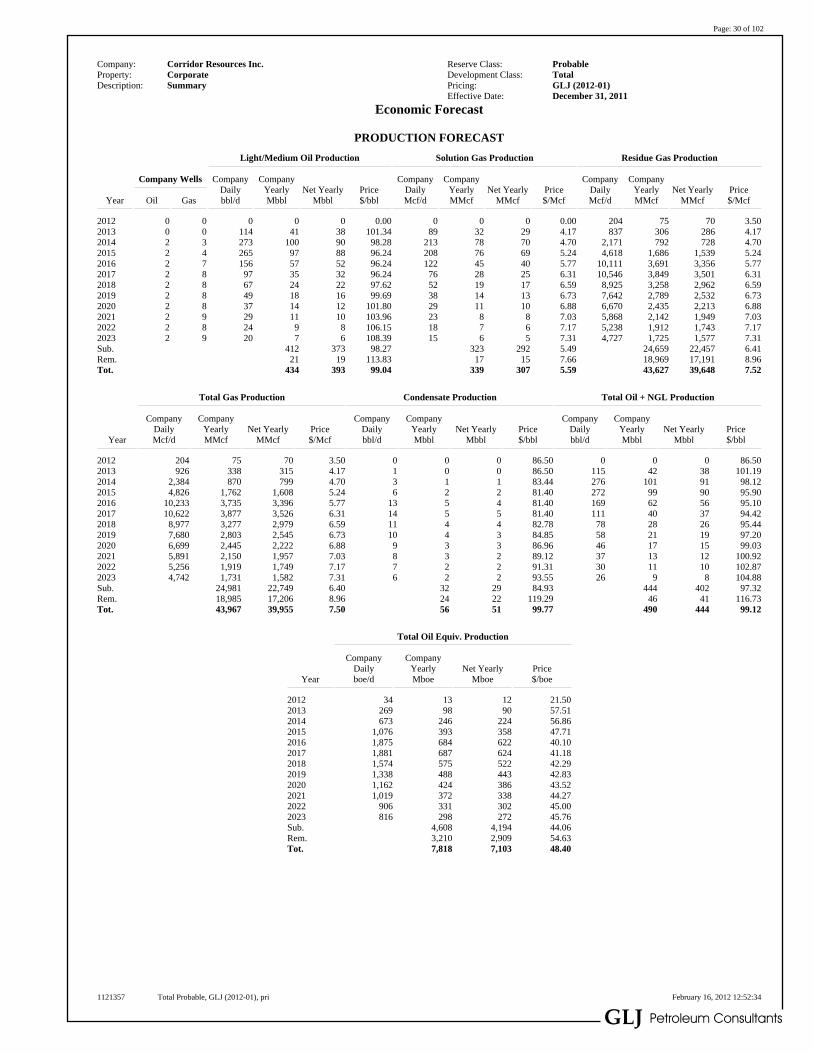
Company: Corridor Resources Inc. Reserve Class: ProbableProperty: Corporate Development Class: TotalDescription: Summary Pricing: GLJ (2012-01)
Effective Date: December 31, 2011
Economic Forecast
PRODUCTION FORECAST
Light/Medium Oil Production Solution Gas Production Residue Gas Production
Company Wells Company Company Company Company Company CompanyDaily Yearly Net Yearly Price Daily Yearly Net Yearly Price Daily Yearly Net Yearly Price
Year Oil Gas bbl/d Mbbl Mbbl $/bbl Mcf/d MMcf MMcf $/Mcf Mcf/d MMcf MMcf $/Mcf
2012 0 0 0 0 0 0.00 0 0 0 0.00 204 75 70 3.502013 0 0 114 41 38 101.34 89 32 29 4.17 837 306 286 4.172014 2 3 273 100 90 98.28 213 78 70 4.70 2,171 792 728 4.702015 2 4 265 97 88 96.24 208 76 69 5.24 4,618 1,686 1,539 5.242016 2 7 156 57 52 96.24 122 45 40 5.77 10,111 3,691 3,356 5.772017 2 8 97 35 32 96.24 76 28 25 6.31 10,546 3,849 3,501 6.312018 2 8 67 24 22 97.62 52 19 17 6.59 8,925 3,258 2,962 6.592019 2 8 49 18 16 99.69 38 14 13 6.73 7,642 2,789 2,532 6.732020 2 8 37 14 12 101.80 29 11 10 6.88 6,670 2,435 2,213 6.882021 2 9 29 11 10 103.96 23 8 8 7.03 5,868 2,142 1,949 7.032022 2 8 24 9 8 106.15 18 7 6 7.17 5,238 1,912 1,743 7.172023 2 9 20 7 6 108.39 15 6 5 7.31 4,727 1,725 1,577 7.31Sub. 412 373 98.27 323 292 5.49 24,659 22,457 6.41Rem. 21 19 113.83 17 15 7.66 18,969 17,191 8.96Tot. 434 393 99.04 339 307 5.59 43,627 39,648 7.52
Total Gas Production Condensate Production Total Oil + NGL Production
Company Company Company Company Company CompanyDaily Yearly Net Yearly Price Daily Yearly Net Yearly Price Daily Yearly Net Yearly Price
Year Mcf/d MMcf MMcf $/Mcf bbl/d Mbbl Mbbl $/bbl bbl/d Mbbl Mbbl $/bbl
2012 204 75 70 3.50 0 0 0 86.50 0 0 0 86.502013 926 338 315 4.17 1 0 0 86.50 115 42 38 101.192014 2,384 870 799 4.70 3 1 1 83.44 276 101 91 98.122015 4,826 1,762 1,608 5.24 6 2 2 81.40 272 99 90 95.902016 10,233 3,735 3,396 5.77 13 5 4 81.40 169 62 56 95.102017 10,622 3,877 3,526 6.31 14 5 5 81.40 111 40 37 94.422018 8,977 3,277 2,979 6.59 11 4 4 82.78 78 28 26 95.442019 7,680 2,803 2,545 6.73 10 4 3 84.85 58 21 19 97.202020 6,699 2,445 2,222 6.88 9 3 3 86.96 46 17 15 99.032021 5,891 2,150 1,957 7.03 8 3 2 89.12 37 13 12 100.922022 5,256 1,919 1,749 7.17 7 2 2 91.31 30 11 10 102.872023 4,742 1,731 1,582 7.31 6 2 2 93.55 26 9 8 104.88Sub. 24,981 22,749 6.40 32 29 84.93 444 402 97.32Rem. 18,985 17,206 8.96 24 22 119.29 46 41 116.73Tot. 43,967 39,955 7.50 56 51 99.77 490 444 99.12
Total Oil Equiv. Production
Company CompanyDaily Yearly Net Yearly Price
Year boe/d Mboe Mboe $/boe
2012 34 13 12 21.502013 269 98 90 57.512014 673 246 224 56.862015 1,076 393 358 47.712016 1,875 684 622 40.102017 1,881 687 624 41.182018 1,574 575 522 42.292019 1,338 488 443 42.832020 1,162 424 386 43.522021 1,019 372 338 44.272022 906 331 302 45.002023 816 298 272 45.76Sub. 4,608 4,194 44.06Rem. 3,210 2,909 54.63Tot. 7,818 7,103 48.40
1121357 Total Probable, GLJ (2012-01), pri February 16, 2012 12:52:34
Page: 30 of 102
Petroleum ConsultantsGLJ

Page 2
REVENUE AND EXPENSE FORECAST
Revenue Before BurdensRoyalty Burdens Gas Processing Total Net
Working Interest Royalty Company Pre-Processing Allowance Royalty Revenue Operating ExpensesInterest Interest After After
Oil Gas NGL+Sul Total Total Total Crown Other Crown Other Process. Royalty Fixed Variable TotalYear M$ M$ M$ M$ M$ M$ M$ M$ M$ M$ M$ M$ M$ M$ M$
2012 0 261 8 269 0 269 15 0 0 0 15 254 0 14 142013 4,204 1,409 37 5,650 0 5,650 498 0 0 0 498 5,152 20 267 2862014 9,786 4,094 93 13,972 0 13,972 1,273 0 0 0 1,273 12,700 47 664 7112015 9,324 9,230 183 18,737 0 18,737 1,708 0 0 0 1,708 17,029 119 844 9632016 5,491 21,566 388 27,445 0 27,445 2,515 0 0 0 2,515 24,930 195 1,062 1,2572017 3,410 24,460 403 28,272 0 28,272 2,572 0 0 0 2,572 25,700 257 999 1,2562018 2,372 21,580 346 24,298 0 24,298 2,216 0 0 0 2,216 22,082 270 831 1,1012019 1,768 18,853 304 20,924 0 20,924 1,932 0 0 0 1,932 18,992 264 709 9722020 1,381 16,811 271 18,463 0 18,463 1,688 0 0 0 1,688 16,775 283 620 9032021 1,108 15,107 245 16,460 0 16,460 1,486 0 0 0 1,486 14,975 301 549 8502022 916 13,747 224 14,886 0 14,886 1,319 0 0 0 1,319 13,567 313 494 8072023 772 12,651 207 13,630 0 13,630 1,179 0 0 0 1,179 12,450 345 451 796Sub. 40,531 159,768 2,708 203,008 0 203,008 18,401 0 0 0 18,401 184,607 2,414 7,502 9,917Rem. 2,429 170,045 2,891 175,365 0 175,365 16,487 0 0 0 16,487 158,878 26,981 5,628 32,609Tot. 42,960 329,813 5,599 378,373 0 378,373 34,888 0 0 0 34,888 343,485 29,395 13,130 42,526Disc 28,079 108,969 1,867 138,916 0 138,916 12,657 0 0 0 12,657 126,259 4,790 5,136 9,927
Net Net Capital Investment Before Tax Cash FlowMineral Capital NPI Prod'n Other Aband. Oper.
Tax Tax Burden Revenue Income Costs Income Dev. Plant Tang. Total Annual Cum. 10.0% DcfYear M$ M$ M$ M$ M$ M$ M$ M$ M$ M$ M$ M$ M$ M$
2012 0 0 0 240 145 0 385 0 0 0 0 385 385 3672013 0 0 0 4,866 331 -510 5,707 5,936 0 0 5,936 -229 156 1682014 0 0 0 11,989 590 130 12,448 18,165 0 0 18,165 -5,717 -5,561 -4,3372015 0 0 0 16,066 690 398 16,358 9,264 0 0 9,264 7,094 1,533 7452016 0 0 0 23,674 727 0 24,401 25,199 0 0 25,199 -798 734 2252017 0 0 0 24,444 749 -138 25,331 6,426 0 0 6,426 18,905 19,639 11,4172018 0 0 0 20,980 726 0 21,706 0 0 0 0 21,706 41,346 23,1002019 0 0 0 18,020 692 0 18,712 0 0 0 0 18,712 60,058 32,2552020 0 0 0 15,872 657 -146 16,675 0 0 0 0 16,675 76,733 39,6722021 0 0 0 14,125 630 149 14,606 0 0 0 0 14,606 91,338 45,5782022 0 0 0 12,760 595 -305 13,659 0 0 0 0 13,659 104,997 50,5992023 0 0 0 11,655 545 -155 12,355 0 0 0 0 12,355 117,352 54,728Sub. 0 0 0 174,691 7,076 -577 182,343 64,991 0 0 64,991 117,352 117,352 54,728Rem. 0 0 0 126,268 7,759 6,526 127,501 0 0 0 0 127,501 244,854 75,405Tot. 0 0 0 300,959 14,835 5,949 309,845 64,991 0 0 64,991 244,854 244,854 75,405Disc 0 0 0 116,333 5,047 -336 121,716 46,311 0 0 46,311 75,405 75,405 75,405
SUMMARY OF RESERVES
Remaining Reserves at Jan 01, 2012 Oil Equivalents Reserve Life Indic. (yr)
Working Roy/NPI Total Oil Eq. Company % of Reserve Life HalfProduct Units Interest Interest Company Net Factor Mboe Total Life Index Life
Light/Med Oil Mbbl 434 0 434 393 1.000 434 6 17.0 10.5 3.8Solution Gas MMcf 339 0 339 307 6.000 57 1 17.0 10.5 3.8Residue Gas MMcf 43,627 0 43,627 39,648 6.000 7,271 93 43.0 585.1 10.4Total: Gas MMcf 43,967 0 43,967 39,955 6.000 7,328 94 43.0 589.6 10.3Gas Heat Content BBtu 46,605 0 46,605 42,352 0.000 0 0 43.0 589.6 10.3Condensate Mbbl 56 0 56 51 1.000 56 1 43.0 589.6 10.3Total: Oil+NGL Mbbl 490 0 490 444 1.000 490 6 43.0 999.9 4.1Total: Oil Eq. Mboe 7,818 0 7,818 7,103 1.000 7,818 100 43.0 624.3 9.8
PRODUCT REVENUE AND EXPENSES
Average First Year Unit Values Net Revenue After Royalties
Wellhead Operating Other Prod'n Undisc % of 10% Disc % ofProduct Units Base Price Price Adjust. Price Net Burdens Expenses Expenses Revenue M$ Total M$ Total
Light/Med Oil $/bbl 0.00 0.00 0.00 0.00 0.00 0.00 0.00 38,879 11 25,412 20Solution Gas $/Mcf 0.00 0.00 0.00 0.00 0.00 0.00 0.00 1,718 1 1,083 1Residue Gas $/Mcf 3.29 0.21 3.50 0.19 0.19 0.00 3.12 297,803 87 98,065 78Total: Gas $/Mcf 3.29 0.21 3.50 0.19 0.19 0.00 3.12 299,520 87 99,148 79Condensate $/bbl 107.14 -20.64 86.50 4.76 0.00 0.00 81.75 5,085 1 1,700 1Total: Oil+NGL $/bbl 107.14 -20.64 86.50 4.76 0.00 0.00 81.75 43,964 13 27,112 21Total: Oil Eq. $/boe 20.42 1.08 21.50 1.18 1.13 0.00 19.18 343,485 100 126,259 100
1121357 Total Probable, GLJ (2012-01), pri February 16, 2012 12:52:34
Page: 31 of 102
Petroleum ConsultantsGLJ

Page 3
REVENUE BURDENS AND NET PRESENT VALUE SUMMARY
Net Present Value Before Income Tax
Revenue Burdens (%) Disc. Prod'n Operating Capital Cash FlowRate Revenue Income Invest.
Initial Average % M$ M$ M$ M$ $/boe
Crown Royalty 5.5000 9.2205 0.0 300,959 309,845 64,991 244,854 31.32Non-crown Royalty 0.0000 0.0000 5.0 174,186 181,690 54,552 127,138 16.26Mineral Tax 0.0000 0.0000 8.0 135,059 141,205 49,383 91,823 11.75
10.0 116,333 121,716 46,311 75,405 9.6512.0 101,477 106,218 43,500 62,717 8.0215.0 84,255 88,225 39,717 48,508 6.2120.0 64,220 67,281 34,377 32,905 4.21
Evaluator: Werth, James P.Run Date: February 16, 2012 11:30:20
1121357 Total Probable, GLJ (2012-01), pri February 16, 2012 12:52:34
Page: 32 of 102
Petroleum ConsultantsGLJ

Company: Corridor Resources Inc. Reserve Class: Proved Plus ProbableProperty: Corporate Development Class: TotalDescription: Summary Pricing: GLJ (2012-01)
Effective Date: December 31, 2011
Economic Forecast
PRODUCTION FORECAST
Light/Medium Oil Production Solution Gas Production Residue Gas Production
Company Wells Company Company Company Company Company CompanyDaily Yearly Net Yearly Price Daily Yearly Net Yearly Price Daily Yearly Net Yearly Price
Year Oil Gas bbl/d Mbbl Mbbl $/bbl Mcf/d MMcf MMcf $/Mcf Mcf/d MMcf MMcf $/Mcf
2012 0 22 0 0 0 0.00 0 0 0 0.00 9,553 3,487 3,295 3.502013 1 26 173 63 57 101.34 135 49 45 4.17 11,117 4,058 3,817 4.172014 3 31 338 123 112 98.28 264 96 87 4.70 15,642 5,709 5,305 4.702015 3 34 301 110 99 96.24 235 86 78 5.24 20,228 7,383 6,806 5.242016 3 38 178 65 59 96.24 139 51 46 5.77 25,925 9,463 8,684 5.772017 3 40 112 41 37 96.24 88 32 29 6.31 24,084 8,791 8,074 6.312018 3 40 78 28 26 97.62 61 22 20 6.59 20,122 7,345 6,729 6.592019 3 40 57 21 19 99.69 45 16 15 6.73 17,118 6,248 5,701 6.732020 3 39 44 16 14 101.80 34 12 11 6.88 14,837 5,416 4,951 6.882021 3 39 34 13 11 103.95 27 10 9 7.03 12,952 4,727 4,331 7.032022 3 39 28 10 9 106.15 22 8 7 7.17 11,450 4,179 3,839 7.172023 3 39 23 8 8 108.39 18 7 6 7.31 10,198 3,722 3,430 7.31Sub. 498 451 98.40 390 353 5.44 70,527 64,962 5.99Rem. 22 20 113.71 17 16 7.65 31,720 28,817 8.73Tot. 521 471 99.05 407 368 5.53 102,247 93,779 6.84
Total Gas Production Condensate Production Total Oil + NGL Production
Company Company Company Company Company CompanyDaily Yearly Net Yearly Price Daily Yearly Net Yearly Price Daily Yearly Net Yearly Price
Year Mcf/d MMcf MMcf $/Mcf bbl/d Mbbl Mbbl $/bbl bbl/d Mbbl Mbbl $/bbl
2012 9,553 3,487 3,295 3.50 12 4 4 86.50 12 4 4 86.502013 11,252 4,107 3,861 4.17 14 5 5 86.50 187 68 62 100.202014 15,906 5,806 5,392 4.70 20 7 7 83.44 358 131 118 97.442015 20,463 7,469 6,883 5.24 26 10 9 81.40 327 119 108 95.052016 26,065 9,514 8,730 5.77 33 12 11 81.40 212 77 70 93.912017 24,172 8,823 8,103 6.31 31 11 10 81.40 143 52 47 93.042018 20,183 7,367 6,749 6.59 26 9 9 82.78 103 38 34 93.922019 17,162 6,264 5,715 6.73 22 8 7 84.85 79 29 26 95.562020 14,871 5,428 4,962 6.88 19 7 6 86.96 63 23 21 97.312021 12,979 4,737 4,340 7.03 17 6 6 89.12 51 19 17 99.142022 11,472 4,187 3,847 7.17 15 5 5 91.31 43 16 14 101.052023 10,216 3,729 3,436 7.31 13 5 4 93.55 36 13 12 103.04Sub. 70,917 65,314 5.99 91 83 84.73 589 534 96.29Rem. 31,738 28,833 8.72 41 37 115.67 63 57 114.98Tot. 102,654 94,147 6.84 131 120 94.29 652 591 98.09
Total Oil Equiv. Production
Company CompanyDaily Yearly Net Yearly Price
Year boe/d Mboe Mboe $/boe
2012 1,604 586 553 21.502013 2,063 753 706 31.852014 3,009 1,098 1,017 36.462015 3,737 1,364 1,255 37.002016 4,556 1,663 1,525 37.402017 4,172 1,523 1,398 39.752018 3,467 1,265 1,159 41.142019 2,939 1,073 979 41.832020 2,541 928 848 42.632021 2,214 808 740 43.472022 1,955 713 655 44.262023 1,739 635 585 45.08Sub. 12,408 11,420 38.81Rem. 5,352 4,862 53.08Tot. 17,761 16,282 43.11
1121357 Total Proved Plus Probable, GLJ (2012-01), pri February 16, 2012 12:52:40
Page: 33 of 102
Petroleum ConsultantsGLJ

Page 2
REVENUE AND EXPENSE FORECAST
Revenue Before BurdensRoyalty Burdens Gas Processing Total Net
Working Interest Royalty Company Pre-Processing Allowance Royalty Revenue Operating ExpensesInterest Interest After After
Oil Gas NGL+Sul Total Total Total Crown Other Crown Other Process. Royalty Fixed Variable TotalYear M$ M$ M$ M$ M$ M$ M$ M$ M$ M$ M$ M$ M$ M$ M$
2012 0 12,204 385 12,589 0 12,589 692 0 0 0 692 11,897 2,766 662 3,4282013 6,401 17,122 453 23,976 0 23,976 1,659 0 0 0 1,659 22,317 2,885 1,102 3,9872014 12,115 27,312 618 40,045 0 40,045 3,142 0 0 0 3,142 36,903 3,044 1,757 4,8012015 10,556 39,134 776 50,466 0 50,466 4,132 0 0 0 4,132 46,334 3,251 2,059 5,3102016 6,264 54,930 988 62,182 0 62,182 5,198 0 0 0 5,198 56,984 3,462 2,291 5,7532017 3,937 55,663 917 60,517 0 60,517 4,989 0 0 0 4,989 55,528 3,610 2,065 5,6762018 2,762 48,515 778 52,055 0 52,055 4,395 0 0 0 4,395 47,660 3,683 1,728 5,4102019 2,071 42,132 678 44,881 0 44,881 3,948 0 0 0 3,948 40,933 3,744 1,481 5,2252020 1,624 37,319 602 39,546 0 39,546 3,408 0 0 0 3,408 36,137 3,817 1,297 5,1142021 1,308 33,282 539 35,130 0 35,130 2,961 0 0 0 2,961 32,169 3,894 1,147 5,0412022 1,084 30,005 488 31,577 0 31,577 2,583 0 0 0 2,583 28,993 3,957 1,029 4,9862023 916 27,252 445 28,613 0 28,613 2,262 0 0 0 2,262 26,352 4,025 931 4,956Sub. 49,038 424,869 7,669 481,576 0 481,576 39,369 0 0 0 39,369 442,207 42,137 17,549 59,686Rem. 2,518 276,893 4,686 284,096 0 284,096 26,157 0 0 0 26,157 257,939 52,770 9,086 61,856Tot. 51,556 701,762 12,355 765,672 0 765,672 65,526 0 0 0 65,526 700,146 94,907 26,635 121,542Disc 34,201 287,437 5,319 326,957 0 326,957 26,815 0 0 0 26,815 300,142 33,272 12,061 45,333
Net Net Capital Investment Before Tax Cash FlowMineral Capital NPI Prod'n Other Aband. Oper.
Tax Tax Burden Revenue Income Costs Income Dev. Plant Tang. Total Annual Cum. 10.0% DcfYear M$ M$ M$ M$ M$ M$ M$ M$ M$ M$ M$ M$ M$ M$
2012 0 0 0 8,468 1,638 0 10,106 0 0 0 0 10,106 10,106 9,6352013 0 0 0 18,330 1,781 0 20,111 19,242 0 0 19,242 869 10,974 10,3882014 0 0 0 32,102 2,475 520 34,057 39,358 0 0 39,358 -5,301 5,673 6,2112015 0 0 0 41,025 3,435 398 44,061 31,146 0 0 31,146 12,915 18,588 15,4622016 0 0 0 51,231 3,385 0 54,616 37,799 0 0 37,799 16,818 35,405 26,4142017 0 0 0 49,852 2,935 0 52,788 9,639 0 0 9,639 43,149 78,554 51,9602018 0 0 0 42,250 2,572 0 44,822 0 0 0 0 44,822 123,376 76,0832019 0 0 0 35,708 2,276 144 37,840 0 0 0 0 37,840 161,216 94,5972020 0 0 0 31,023 2,037 0 33,060 0 0 0 0 33,060 194,276 109,3022021 0 0 0 27,128 1,825 149 28,804 0 0 0 0 28,804 223,080 120,9502022 0 0 0 24,007 1,652 0 25,659 0 0 0 0 25,659 248,739 130,3822023 0 0 0 21,396 1,489 155 22,729 0 0 0 0 22,729 271,469 137,978Sub. 0 0 0 382,521 27,498 1,367 408,653 137,184 0 0 137,184 271,469 271,469 137,978Rem. 0 0 0 196,083 14,541 17,999 192,625 0 0 0 0 192,625 464,094 171,147Tot. 0 0 0 578,604 42,039 19,366 601,278 137,184 0 0 137,184 464,094 464,094 171,147Disc 0 0 0 254,810 19,103 2,439 271,474 100,326 0 0 100,326 171,147 171,147 171,147
SUMMARY OF RESERVES
Remaining Reserves at Jan 01, 2012 Oil Equivalents Reserve Life Indic. (yr)
Working Roy/NPI Total Oil Eq. Company % of Reserve Life HalfProduct Units Interest Interest Company Net Factor Mboe Total Life Index Life
Light/Med Oil Mbbl 521 0 521 471 1.000 521 3 17.0 8.2 3.7Solution Gas MMcf 407 0 407 368 6.000 68 0 17.0 8.2 3.7Residue Gas MMcf 102,247 0 102,247 93,779 6.000 17,041 96 43.0 29.3 7.8Total: Gas MMcf 102,654 0 102,654 94,147 6.000 17,109 96 43.0 29.4 7.8Gas Heat Content BBtu 108,814 0 108,814 99,796 0.000 0 0 43.0 29.4 7.8Condensate Mbbl 131 0 131 120 1.000 131 1 43.0 29.4 7.8Total: Oil+NGL Mbbl 652 0 652 591 1.000 652 4 43.0 146.4 4.0Total: Oil Eq. Mboe 17,761 0 17,761 16,282 1.000 17,761 100 43.0 30.3 7.6
PRODUCT REVENUE AND EXPENSES
Average First Year Unit Values Net Revenue After Royalties
Wellhead Operating Other Prod'n Undisc % of 10% Disc % ofProduct Units Base Price Price Adjust. Price Net Burdens Expenses Expenses Revenue M$ Total M$ Total
Light/Med Oil $/bbl 0.00 0.00 0.00 0.00 0.00 0.00 0.00 46,658 7 30,952 10Solution Gas $/Mcf 0.00 0.00 0.00 0.00 0.00 0.00 0.00 2,039 0 1,303 0Residue Gas $/Mcf 3.29 0.21 3.50 0.19 0.98 0.00 2.32 640,132 91 262,988 88Total: Gas $/Mcf 3.29 0.21 3.50 0.19 0.98 0.00 2.32 642,170 92 264,290 88Condensate $/bbl 107.14 -20.64 86.50 4.76 0.00 0.00 81.75 11,317 2 4,900 2Total: Oil+NGL $/bbl 107.14 -20.64 86.50 4.76 0.00 0.00 81.75 57,976 8 35,852 12Total: Oil Eq. $/boe 20.42 1.08 21.50 1.18 5.85 0.00 14.46 700,146 100 300,142 100
1121357 Total Proved Plus Probable, GLJ (2012-01), pri February 16, 2012 12:52:40
Page: 34 of 102
Petroleum ConsultantsGLJ

Page 3
REVENUE BURDENS AND NET PRESENT VALUE SUMMARY
Net Present Value Before Income Tax
Revenue Burdens (%) Disc. Prod'n Operating Capital Cash FlowRate Revenue Income Invest.
Initial Average % M$ M$ M$ M$ $/boe
Crown Royalty 5.5000 8.5580 0.0 578,604 601,278 137,184 464,094 26.13Non-crown Royalty 0.0000 0.0000 5.0 361,757 382,591 116,698 265,894 14.97Mineral Tax 0.0000 0.0000 8.0 290,146 308,403 106,452 201,951 11.37
10.0 254,810 271,474 100,326 171,147 9.6412.0 226,215 241,451 94,696 146,754 8.2615.0 192,371 205,774 87,073 118,701 6.6820.0 151,920 162,958 76,219 86,738 4.88
Evaluator: Werth, James P.Run Date: February 16, 2012 11:30:20
1121357 Total Proved Plus Probable, GLJ (2012-01), pri February 16, 2012 12:52:40
Page: 35 of 102
Petroleum ConsultantsGLJ

Page: 36 of 102
Petroleum ConsultantsGLJ
POSSIBLE AND PROVED PLUS PROBABLE PLUS POSSIBLE RESERVES
TABLE OF CONTENTS
Page
SUMMARY OF RESERVES AND VALUES 37
COMPANY PRODUCTION, RESERVES AND PRESENT VALUE SUMMARY 38
ECONOMIC FORECASTSTotal Possible 39Total PPP 42
March 13, 2012 15:51:06

Company: Corridor Resources Inc. Reserve Class: VariousProperty: Corporate Development Class: ClassificationsDescription: Summary Pricing: GLJ (2012-01)
Effective Date: December 31, 2011
Summary of Reserves and Values
Total TotalPossible PPP
MARKETABLE RESERVESLight/Medium Oil (Mbbl)
Total Company Interest 174 694Working Interest 174 694Net After Royalty 157 628
Gas (MMcf)Total Company Interest 114,078 216,732Working Interest 114,078 216,732Net After Royalty 103,411 197,558
Natural Gas Liquids (Mbbl)Total Company Interest 146 277Working Interest 146 277Net After Royalty 132 252
Oil Equivalent (Mbbl)Total Company Interest 19,332 37,093Working Interest 19,332 37,093Net After Royalty 17,524 33,807
BEFORE TAX PRESENT VALUE (M$)0% 752,914 1,217,0075% 327,821 593,7148% 224,561 426,51210% 180,341 351,48812% 147,758 294,51215% 112,865 231,56620% 76,414 163,152
FIRST 6 YEARS BEFORE TAX CASH FLOW (M$)2012 557 10,6632013 2,706 3,5752014 4,500 -8012015 10,151 23,0662016 8,496 25,3142017 19,045 62,194
BOE Factors: HVY OIL 1.0 RES GAS 6.0 PROPANE 1.0 ETHANE 1.0COND 1.0 SLN GAS 6.0 BUTANE 1.0 SULPHUR 0.0
Run Date: February 16, 2012 11:30:22
1121357 Class (O,R), GLJ (2012-01), psum February 16, 2012 12:52:42
Page: 37 of 102
Petroleum ConsultantsGLJ

Company: Corridor Resources Inc. Reserve Class: VariousProperty: Corporate Development Class: ClassificationsDescription: Summary Pricing: GLJ (2012-01)
Effective Date: December 31, 2011
Company Production, Reserves and Present Value Summary
2012 Company Interest Prod'n Company Interest Reserves Net After Royalty Reserves Reserve Before Income TaxLife Discounted Present Value (M$)
Gas Oil NGL Oil Eq. Gas Oil NGL Sulphur Oil Eq. Gas Oil NGL Sulphur Oil Eq. IndexEntity Description Mcf/d bbl/d bbl/d boe/d MMcf Mbbl Mbbl Mlt Mboe MMcf Mbbl Mbbl Mlt Mboe yrs 0% 8% 10% 12%
Total PossibleMcCully 190 0 0 32 114,078 174 146 0 19,332 103,411 157 132 0 17,524 999.9 752,914 224,561 180,341 147,758
Total: Total Possible 190 0 0 32 114,078 174 146 0 19,332 103,411 157 132 0 17,524 999.9 752,914 224,561 180,341 147,758
Total PPPMcCully 9,743 0 12 1,636 216,732 694 277 0 37,093 197,558 628 252 0 33,807 62.1 1,217,007 426,512 351,488 294,512
Total: Total PPP 9,743 0 12 1,636 216,732 694 277 0 37,093 197,558 628 252 0 33,807 62.1 1,217,007 426,512 351,488 294,512
BOE Factors: HVY OIL 1.0 RES GAS 6.0 PROPANE 1.0 ETHANE 1.0COND 1.0 SLN GAS 6.0 BUTANE 1.0 SULPHUR 0.0
1121357 Class (O,R), GLJ (2012-01), crv February 16, 2012 12:52:44
Page: 38 of 102
Petroleum ConsultantsGLJ

Company: Corridor Resources Inc. Reserve Class: PossibleProperty: Corporate Development Class: TotalDescription: Summary Pricing: GLJ (2012-01)
Effective Date: December 31, 2011
Economic Forecast
PRODUCTION FORECAST
Light/Medium Oil Production Solution Gas Production Residue Gas Production
Company Wells Company Company Company Company Company CompanyDaily Yearly Net Yearly Price Daily Yearly Net Yearly Price Daily Yearly Net Yearly Price
Year Oil Gas bbl/d Mbbl Mbbl $/bbl Mcf/d MMcf MMcf $/Mcf Mcf/d MMcf MMcf $/Mcf
2012 0 0 0 0 0 0.00 0 0 0 0.00 190 69 66 3.502013 1 1 11 4 4 101.34 8 3 3 4.17 1,709 624 573 4.172014 1 1 47 17 15 98.28 37 13 12 4.70 5,357 1,955 1,782 4.702015 1 4 65 24 21 96.24 51 19 17 5.24 8,176 2,984 2,715 5.242016 1 5 59 22 20 96.24 46 17 15 5.77 10,578 3,861 3,513 5.772017 1 8 46 17 15 96.24 36 13 12 6.31 15,331 5,596 5,084 6.312018 1 10 36 13 12 97.62 28 10 9 6.59 19,748 7,208 6,539 6.592019 1 11 29 11 10 99.69 23 8 7 6.73 19,647 7,171 6,500 6.732020 1 12 24 9 8 101.80 18 7 6 6.88 17,192 6,275 5,690 6.882021 1 12 19 7 6 103.96 15 6 5 7.03 15,113 5,516 5,005 7.032022 1 12 16 6 5 106.15 13 5 4 7.17 13,523 4,936 4,482 7.172023 1 12 14 5 5 108.39 11 4 4 7.31 12,239 4,467 4,061 7.31Sub. 134 121 98.73 105 95 5.98 50,664 46,010 6.53Rem. 40 36 120.28 31 28 8.07 63,279 57,278 9.75Tot. 174 157 103.65 136 123 6.46 113,942 103,288 8.32
Total Gas Production Condensate Production Total Oil + NGL Production
Company Company Company Company Company CompanyDaily Yearly Net Yearly Price Daily Yearly Net Yearly Price Daily Yearly Net Yearly Price
Year Mcf/d MMcf MMcf $/Mcf bbl/d Mbbl Mbbl $/bbl bbl/d Mbbl Mbbl $/bbl
2012 190 69 66 3.50 0 0 0 86.50 0 0 0 86.502013 1,718 627 576 4.17 2 1 1 86.50 13 5 4 98.822014 5,394 1,969 1,794 4.70 7 3 2 83.44 54 20 18 96.382015 8,227 3,003 2,732 5.24 11 4 3 81.40 75 28 25 94.172016 10,624 3,878 3,528 5.77 14 5 5 81.40 73 27 24 93.472017 15,368 5,609 5,096 6.31 20 7 7 81.40 66 24 22 91.832018 19,777 7,219 6,548 6.59 25 9 8 82.78 62 22 20 91.542019 19,670 7,179 6,507 6.73 25 9 8 84.85 54 20 18 92.812020 17,210 6,282 5,697 6.88 22 8 7 86.96 46 17 15 94.652021 15,128 5,522 5,010 7.03 19 7 6 89.11 39 14 13 96.572022 13,536 4,941 4,487 7.17 17 6 6 91.31 34 12 11 98.532023 12,250 4,471 4,064 7.31 16 6 5 93.55 30 11 10 100.54Sub. 50,768 46,104 6.53 65 59 85.79 199 180 94.51Rem. 63,310 57,307 9.74 81 73 131.60 120 109 127.88Tot. 114,078 103,411 8.31 146 132 111.21 319 289 107.10
Total Oil Equiv. Production
Company CompanyDaily Yearly Net Yearly Price
Year boe/d Mboe Mboe $/boe
2012 32 12 11 21.502013 299 109 100 28.192014 953 348 317 32.072015 1,446 528 480 34.712016 1,843 673 612 36.962017 2,627 959 871 39.212018 3,358 1,226 1,112 40.472019 3,332 1,216 1,102 41.212020 2,914 1,064 964 42.092021 2,560 934 848 42.982022 2,290 836 759 43.812023 2,071 756 687 44.66Sub. 8,660 7,864 40.45Rem. 10,672 9,660 59.25Tot. 19,332 17,524 50.83
1121357 Total Possible, GLJ (2012-01), pri February 16, 2012 12:52:50
Page: 39 of 102
Petroleum ConsultantsGLJ

Page 2
REVENUE AND EXPENSE FORECAST
Revenue Before BurdensRoyalty Burdens Gas Processing Total Net
Working Interest Royalty Company Pre-Processing Allowance Royalty Revenue Operating ExpensesInterest Interest After After
Oil Gas NGL+Sul Total Total Total Crown Other Crown Other Process. Royalty Fixed Variable TotalYear M$ M$ M$ M$ M$ M$ M$ M$ M$ M$ M$ M$ M$ M$ M$
2012 0 243 8 251 0 251 14 0 0 0 14 237 0 13 132013 396 2,614 69 3,079 0 3,079 257 0 0 0 257 2,822 25 140 1652014 1,682 9,261 210 11,153 0 11,153 999 0 0 0 999 10,154 99 474 5722015 2,278 15,733 312 18,323 0 18,323 1,666 0 0 0 1,666 16,657 116 725 8402016 2,077 22,389 403 24,869 0 24,869 2,252 0 0 0 2,252 22,618 136 908 1,0452017 1,631 35,389 583 37,602 0 37,602 3,444 0 0 0 3,444 34,159 192 1,266 1,4572018 1,297 47,540 763 49,599 0 49,599 4,610 0 0 0 4,610 44,989 260 1,616 1,8762019 1,056 48,286 778 50,120 0 50,120 4,695 0 0 0 4,695 45,425 339 1,625 1,9642020 878 43,188 697 44,764 0 44,764 4,172 0 0 0 4,172 40,591 351 1,446 1,7982021 739 38,795 628 40,162 0 40,162 3,722 0 0 0 3,722 36,440 359 1,294 1,6532022 634 35,403 576 36,613 0 36,613 3,368 0 0 0 3,368 33,245 380 1,179 1,5592023 550 32,680 534 33,764 0 33,764 3,075 0 0 0 3,075 30,689 399 1,086 1,485Sub. 13,218 331,521 5,559 350,299 0 350,299 32,274 0 0 0 32,274 318,026 2,656 11,772 14,429Rem. 4,766 616,909 10,634 632,309 0 632,309 60,027 0 0 0 60,027 572,282 58,045 20,199 78,244Tot. 17,984 948,430 16,194 982,608 0 982,608 92,301 0 0 0 92,301 890,308 60,701 31,971 92,672Disc 8,948 235,548 4,002 248,499 0 248,499 23,016 0 0 0 23,016 225,483 5,825 8,342 14,167
Net Net Capital Investment Before Tax Cash FlowMineral Capital NPI Prod'n Other Aband. Oper.
Tax Tax Burden Revenue Income Costs Income Dev. Plant Tang. Total Annual Cum. 10.0% DcfYear M$ M$ M$ M$ M$ M$ M$ M$ M$ M$ M$ M$ M$ M$
2012 0 0 0 224 334 0 557 0 0 0 0 557 557 5312013 0 0 0 2,657 356 0 3,012 306 0 0 306 2,706 3,264 2,8772014 0 0 0 9,581 454 -520 10,555 6,055 0 0 6,055 4,500 7,764 6,4232015 0 0 0 15,817 643 133 16,327 6,176 0 0 6,176 10,151 17,915 13,6952016 0 0 0 21,573 1,882 0 23,455 14,959 0 0 14,959 8,496 26,411 19,2282017 0 0 0 32,701 2,822 414 35,109 16,064 0 0 16,064 19,045 45,456 30,5032018 0 0 0 43,113 3,010 0 46,124 19,663 0 0 19,663 26,461 71,916 44,7442019 0 0 0 43,461 2,516 -144 46,120 10,028 0 0 10,028 36,092 108,009 62,4032020 0 0 0 38,794 2,125 0 40,919 0 0 0 0 40,919 148,928 80,6042021 0 0 0 34,787 1,825 -149 36,762 0 0 0 0 36,762 185,689 95,4692022 0 0 0 31,686 1,609 0 33,295 0 0 0 0 33,295 218,984 107,7082023 0 0 0 29,203 1,453 -155 30,812 0 0 0 0 30,812 249,796 118,005Sub. 0 0 0 303,597 19,028 -422 323,047 73,251 0 0 73,251 249,796 249,796 118,005Rem. 0 0 0 494,038 19,909 10,829 503,118 0 0 0 0 503,118 752,914 180,341Tot. 0 0 0 797,635 38,936 10,407 826,165 73,251 0 0 73,251 752,914 752,914 180,341Disc 0 0 0 211,316 12,681 -545 224,543 44,202 0 0 44,202 180,341 180,341 180,341
SUMMARY OF RESERVES
Remaining Reserves at Jan 01, 2012 Oil Equivalents Reserve Life Indic. (yr)
Working Roy/NPI Total Oil Eq. Company % of Reserve Life HalfProduct Units Interest Interest Company Net Factor Mboe Total Life Index Life
Light/Med Oil Mbbl 174 0 174 157 1.000 174 1 22.0 44.4 6.3Solution Gas MMcf 136 0 136 123 6.000 23 0 22.0 44.4 6.3Residue Gas MMcf 113,942 0 113,942 103,288 6.000 18,990 98 50.0 999.9 13.6Total: Gas MMcf 114,078 0 114,078 103,411 6.000 19,013 98 50.0 999.9 13.6Gas Heat Content BBtu 120,922 0 120,922 109,615 0.000 0 0 50.0 999.9 13.6Condensate Mbbl 146 0 146 132 1.000 146 1 50.0 999.9 13.6Total: Oil+NGL Mbbl 319 0 319 289 1.000 319 2 50.0 999.9 8.9Total: Oil Eq. Mboe 19,332 0 19,332 17,524 1.000 19,332 100 50.0 999.9 13.5
PRODUCT REVENUE AND EXPENSES
Average First Year Unit Values Net Revenue After Royalties
Wellhead Operating Other Prod'n Undisc % of 10% Disc % ofProduct Units Base Price Price Adjust. Price Net Burdens Expenses Expenses Revenue M$ Total M$ Total
Light/Med Oil $/bbl 0.00 0.00 0.00 0.00 0.00 0.00 0.00 16,276 2 8,098 4Solution Gas $/Mcf 0.00 0.00 0.00 0.00 0.00 0.00 0.00 793 0 379 0Residue Gas $/Mcf 3.29 0.21 3.50 0.19 0.19 0.00 3.12 858,566 96 213,374 95Total: Gas $/Mcf 3.29 0.21 3.50 0.19 0.19 0.00 3.12 859,359 97 213,752 95Condensate $/bbl 107.14 -20.64 86.50 4.76 0.00 0.00 81.75 14,673 2 3,632 2Total: Oil+NGL $/bbl 107.14 -20.64 86.50 4.76 0.00 0.00 81.75 30,949 3 11,730 5Total: Oil Eq. $/boe 20.42 1.08 21.50 1.18 1.13 0.00 19.18 890,308 100 225,483 100
1121357 Total Possible, GLJ (2012-01), pri February 16, 2012 12:52:50
Page: 40 of 102
Petroleum ConsultantsGLJ

Page 3
REVENUE BURDENS AND NET PRESENT VALUE SUMMARY
Net Present Value Before Income Tax
Revenue Burdens (%) Disc. Prod'n Operating Capital Cash FlowRate Revenue Income Invest.
Initial Average % M$ M$ M$ M$ $/boe
Crown Royalty 5.5000 9.3934 0.0 797,635 826,165 73,251 752,914 38.95Non-crown Royalty 0.0000 0.0000 5.0 363,900 384,239 56,418 327,821 16.96Mineral Tax 0.0000 0.0000 8.0 257,590 273,201 48,640 224,561 11.62
10.0 211,316 224,543 44,202 180,341 9.3312.0 176,697 188,027 40,269 147,758 7.6415.0 138,874 148,035 35,170 112,865 5.8420.0 98,071 104,792 28,379 76,414 3.95
Evaluator: Werth, James P.Run Date: February 16, 2012 11:30:22
1121357 Total Possible, GLJ (2012-01), pri February 16, 2012 12:52:50
Page: 41 of 102
Petroleum ConsultantsGLJ

Company: Corridor Resources Inc. Reserve Class: PPPProperty: Corporate Development Class: TotalDescription: Summary Pricing: GLJ (2012-01)
Effective Date: December 31, 2011
Economic Forecast
PRODUCTION FORECAST
Light/Medium Oil Production Solution Gas Production Residue Gas Production
Company Wells Company Company Company Company Company CompanyDaily Yearly Net Yearly Price Daily Yearly Net Yearly Price Daily Yearly Net Yearly Price
Year Oil Gas bbl/d Mbbl Mbbl $/bbl Mcf/d MMcf MMcf $/Mcf Mcf/d MMcf MMcf $/Mcf
2012 0 22 0 0 0 0.00 0 0 0 0.00 9,743 3,556 3,361 3.502013 2 27 184 67 61 101.34 144 52 47 4.17 12,826 4,682 4,390 4.172014 4 32 385 140 127 98.28 301 110 99 4.70 20,999 7,665 7,087 4.702015 4 38 365 133 121 96.24 286 104 94 5.24 28,404 10,367 9,520 5.242016 4 43 237 87 78 96.24 186 68 61 5.77 36,503 13,323 12,197 5.772017 4 47 159 58 52 96.24 124 45 41 6.31 39,415 14,387 13,158 6.312018 4 49 114 42 38 97.62 89 33 29 6.59 39,870 14,553 13,268 6.592019 4 51 86 31 28 99.69 67 25 22 6.73 36,765 13,419 12,200 6.732020 4 51 67 25 22 101.80 53 19 17 6.88 32,029 11,691 10,641 6.882021 4 51 54 20 18 103.96 42 15 14 7.03 28,065 10,244 9,336 7.032022 4 51 44 16 15 106.15 35 13 11 7.17 24,974 9,115 8,322 7.172023 4 51 37 14 12 108.39 29 11 10 7.31 22,437 8,190 7,491 7.31Sub. 632 572 98.47 494 447 5.55 121,191 110,971 6.22Rem. 62 56 117.93 48 44 7.92 94,999 86,096 9.40Tot. 694 628 100.20 543 491 5.76 216,189 197,067 7.62
Total Gas Production Condensate Production Total Oil + NGL Production
Company Company Company Company Company CompanyDaily Yearly Net Yearly Price Daily Yearly Net Yearly Price Daily Yearly Net Yearly Price
Year Mcf/d MMcf MMcf $/Mcf bbl/d Mbbl Mbbl $/bbl bbl/d Mbbl Mbbl $/bbl
2012 9,743 3,556 3,361 3.50 12 5 4 86.50 12 5 4 86.502013 12,970 4,734 4,437 4.17 17 6 6 86.50 200 73 66 100.122014 21,300 7,774 7,186 4.70 27 10 9 83.44 412 150 136 97.302015 28,689 10,472 9,615 5.24 37 13 12 81.40 402 147 133 94.892016 36,688 13,391 12,259 5.77 47 17 16 81.40 284 104 94 93.802017 39,539 14,432 13,199 6.31 50 18 17 81.40 209 76 69 92.662018 39,959 14,585 13,297 6.59 51 19 17 82.78 165 60 55 93.032019 36,832 13,444 12,222 6.73 47 17 16 84.85 133 49 44 94.442020 32,082 11,710 10,659 6.88 41 15 14 86.96 108 40 36 96.192021 28,107 10,259 9,350 7.03 36 13 12 89.11 90 33 30 98.032022 25,008 9,128 8,333 7.17 32 12 11 91.31 76 28 25 99.942023 22,466 8,200 7,500 7.31 29 10 10 93.55 66 24 22 101.92Sub. 121,685 111,419 6.22 155 142 85.17 788 714 95.84Rem. 95,047 86,140 9.40 121 110 126.28 183 166 123.46Tot. 216,732 197,558 7.61 277 252 103.20 971 880 101.05
Total Oil Equiv. Production
Company CompanyDaily Yearly Net Yearly Price
Year boe/d Mboe Mboe $/boe
2012 1,636 597 564 21.502013 2,362 862 806 31.382014 3,962 1,446 1,334 35.412015 5,184 1,892 1,735 36.362016 6,399 2,336 2,137 37.272017 6,799 2,482 2,269 39.542018 6,825 2,491 2,271 40.812019 6,272 2,289 2,081 41.502020 5,455 1,991 1,812 42.342021 4,774 1,743 1,588 43.212022 4,244 1,549 1,414 44.022023 3,810 1,391 1,272 44.85Sub. 21,068 19,284 39.48Rem. 16,024 14,522 57.19Tot. 37,093 33,807 47.13
1121357 Total PPP, GLJ (2012-01), pri February 16, 2012 12:52:55
Page: 42 of 102
Petroleum ConsultantsGLJ

Page 2
REVENUE AND EXPENSE FORECAST
Revenue Before BurdensRoyalty Burdens Gas Processing Total Net
Working Interest Royalty Company Pre-Processing Allowance Royalty Revenue Operating ExpensesInterest Interest After After
Oil Gas NGL+Sul Total Total Total Crown Other Crown Other Process. Royalty Fixed Variable TotalYear M$ M$ M$ M$ M$ M$ M$ M$ M$ M$ M$ M$ M$ M$ M$
2012 0 12,447 393 12,839 0 12,839 706 0 0 0 706 12,133 2,766 676 3,4422013 6,797 19,736 523 27,055 0 27,055 1,916 0 0 0 1,916 25,139 2,909 1,242 4,1522014 13,797 36,573 828 51,198 0 51,198 4,141 0 0 0 4,141 47,057 3,143 2,231 5,3732015 12,834 54,867 1,088 68,789 0 68,789 5,797 0 0 0 5,797 62,992 3,366 2,784 6,1502016 8,342 77,319 1,391 87,052 0 87,052 7,449 0 0 0 7,449 79,602 3,598 3,200 6,7982017 5,568 91,052 1,499 98,120 0 98,120 8,433 0 0 0 8,433 89,687 3,802 3,331 7,1332018 4,059 96,055 1,541 101,654 0 101,654 9,005 0 0 0 9,005 92,649 3,943 3,343 7,2862019 3,127 90,418 1,456 95,001 0 95,001 8,643 0 0 0 8,643 86,358 4,084 3,105 7,1892020 2,502 80,507 1,300 84,309 0 84,309 7,580 0 0 0 7,580 76,729 4,169 2,744 6,9122021 2,047 72,077 1,167 75,292 0 75,292 6,683 0 0 0 6,683 68,609 4,252 2,441 6,6932022 1,717 65,408 1,064 68,189 0 68,189 5,951 0 0 0 5,951 62,238 4,337 2,208 6,5452023 1,467 59,932 979 62,378 0 62,378 5,337 0 0 0 5,337 57,041 4,424 2,017 6,441Sub. 62,257 756,390 13,229 831,875 0 831,875 71,643 0 0 0 71,643 760,233 44,794 29,321 74,115Rem. 7,284 893,802 15,320 916,405 0 916,405 86,184 0 0 0 86,184 830,221 110,815 29,285 140,100Tot. 69,541 1,650,192 28,548 1,748,281 0 1,748,281 157,827 0 0 0 157,827 1,590,454 155,608 58,606 214,214Disc 43,149 522,986 9,321 575,456 0 575,456 49,831 0 0 0 49,831 525,625 39,096 20,403 59,499
Net Net Capital Investment Before Tax Cash FlowMineral Capital NPI Prod'n Other Aband. Oper.
Tax Tax Burden Revenue Income Costs Income Dev. Plant Tang. Total Annual Cum. 10.0% DcfYear M$ M$ M$ M$ M$ M$ M$ M$ M$ M$ M$ M$ M$ M$
2012 0 0 0 8,692 1,971 0 10,663 0 0 0 0 10,663 10,663 10,1672013 0 0 0 20,987 2,136 0 23,123 19,548 0 0 19,548 3,575 14,238 13,2652014 0 0 0 41,683 2,929 0 44,612 45,413 0 0 45,413 -801 13,437 12,6342015 0 0 0 56,842 4,078 531 60,389 37,323 0 0 37,323 23,066 36,503 29,1582016 0 0 0 72,804 5,267 0 78,071 52,757 0 0 52,757 25,314 61,816 45,6422017 0 0 0 82,554 5,757 414 87,897 25,703 0 0 25,703 62,194 124,010 82,4632018 0 0 0 85,363 5,583 0 90,946 19,663 0 0 19,663 71,283 195,293 120,8272019 0 0 0 79,169 4,792 0 83,960 10,028 0 0 10,028 73,932 269,225 157,0012020 0 0 0 69,817 4,162 0 73,979 0 0 0 0 73,979 343,204 189,9062021 0 0 0 61,915 3,650 0 65,565 0 0 0 0 65,565 408,769 216,4182022 0 0 0 55,693 3,261 0 58,954 0 0 0 0 58,954 467,723 238,0902023 0 0 0 50,600 2,942 0 53,541 0 0 0 0 53,541 521,265 255,983Sub. 0 0 0 686,118 46,526 945 731,700 210,435 0 0 210,435 521,265 521,265 255,983Rem. 0 0 0 690,121 34,449 28,828 695,743 0 0 0 0 695,743 1,217,007 351,488Tot. 0 0 0 1,376,240 80,976 29,773 1,427,443 210,435 0 0 210,435 1,217,007 1,217,007 351,488Disc 0 0 0 466,126 31,785 1,894 496,016 144,528 0 0 144,528 351,488 351,488 351,488
SUMMARY OF RESERVES
Remaining Reserves at Jan 01, 2012 Oil Equivalents Reserve Life Indic. (yr)
Working Roy/NPI Total Oil Eq. Company % of Reserve Life HalfProduct Units Interest Interest Company Net Factor Mboe Total Life Index Life
Light/Med Oil Mbbl 694 0 694 628 1.000 694 2 22.0 10.3 4.1Solution Gas MMcf 543 0 543 491 6.000 90 0 22.0 10.3 4.1Residue Gas MMcf 216,189 0 216,189 197,067 6.000 36,032 97 50.0 60.8 10.5Total: Gas MMcf 216,732 0 216,732 197,558 6.000 36,122 97 50.0 60.9 10.4Gas Heat Content BBtu 229,736 0 229,736 209,412 0.000 0 0 50.0 60.9 10.4Condensate Mbbl 277 0 277 252 1.000 277 1 50.0 60.9 10.4Total: Oil+NGL Mbbl 971 0 971 880 1.000 971 3 50.0 213.9 5.1Total: Oil Eq. Mboe 37,093 0 37,093 33,807 1.000 37,093 100 50.0 62.1 10.3
PRODUCT REVENUE AND EXPENSES
Average First Year Unit Values Net Revenue After Royalties
Wellhead Operating Other Prod'n Undisc % of 10% Disc % ofProduct Units Base Price Price Adjust. Price Net Burdens Expenses Expenses Revenue M$ Total M$ Total
Light/Med Oil $/bbl 0.00 0.00 0.00 0.00 0.00 0.00 0.00 62,934 4 39,050 7Solution Gas $/Mcf 0.00 0.00 0.00 0.00 0.00 0.00 0.00 2,831 0 1,682 0Residue Gas $/Mcf 3.29 0.21 3.50 0.19 0.97 0.00 2.34 1,498,698 94 476,361 91Total: Gas $/Mcf 3.29 0.21 3.50 0.19 0.97 0.00 2.34 1,501,529 94 478,043 91Condensate $/bbl 107.14 -20.64 86.50 4.76 0.00 0.00 81.75 25,991 2 8,532 2Total: Oil+NGL $/bbl 107.14 -20.64 86.50 4.76 0.00 0.00 81.75 88,925 6 47,582 9Total: Oil Eq. $/boe 20.42 1.08 21.50 1.18 5.76 0.00 14.55 1,590,454 100 525,625 100
1121357 Total PPP, GLJ (2012-01), pri February 16, 2012 12:52:55
Page: 43 of 102
Petroleum ConsultantsGLJ

Page 3
REVENUE BURDENS AND NET PRESENT VALUE SUMMARY
Net Present Value Before Income Tax
Revenue Burdens (%) Disc. Prod'n Operating Capital Cash FlowRate Revenue Income Invest.
Initial Average % M$ M$ M$ M$ $/boe
Crown Royalty 5.5000 9.0276 0.0 1,376,240 1,427,443 210,435 1,217,007 32.81Non-crown Royalty 0.0000 0.0000 5.0 725,658 766,830 173,116 593,714 16.01Mineral Tax 0.0000 0.0000 8.0 547,735 581,604 155,092 426,512 11.50
10.0 466,126 496,016 144,528 351,488 9.4812.0 402,912 429,477 134,965 294,512 7.9415.0 331,245 353,809 122,243 231,566 6.2420.0 249,991 267,750 104,598 163,152 4.40
Evaluator: Werth, James P.Run Date: February 16, 2012 11:30:22
1121357 Total PPP, GLJ (2012-01), pri February 16, 2012 12:52:55
Page: 44 of 102
Petroleum ConsultantsGLJ

RESERVES DEFINITIONS
Reserves estimates have been prepared by GLJ Petroleum Consultants (GLJ) in accordance with
standards contained in the Canadian Oil and Gas Evaluation (COGE) Handbook. The following
reserves definitions are set out by the Canadian Securities Administrators in National Instrument
51-101 Standards of Disclosure for Oil and Gas Activities (NI 51-101; in Part 2 of the Glossary to
NI 51-101) with reference to the COGE Handbook.
Reserves Categories
Reserves are estimated remaining quantities of oil and natural gas and related substances anticipated to be recoverable from known accumulations, as of a given date, based on:
• analysis of drilling, geological, geophysical, and engineering data;
• the use of established technology;
• specified economic conditions1, which are generally accepted as being reasonable, and shall be disclosed.
Reserves are classified according to the degree of certainty associated with the estimates. Proved Reserves Proved reserves are those reserves that can be estimated with a high degree of certainty to be recoverable. It is likely that the actual remaining quantities recovered will exceed the estimated proved reserves. Probable Reserves Probable reserves are those additional reserves that are less certain to be recovered than proved reserves. It is equally likely that the actual remaining quantities recovered will be greater or less than the sum of the estimated proved plus probable reserves. Possible Reserves Possible reserves are those additional reserves that are less certain to be recovered than probable reserves. It is unlikely that the actual remaining quantities recovered will exceed the sum of the estimated proved plus probable plus possible reserves. Other criteria that must also be met for the classification of reserves are provided in [Section 5.5 of the COGE Handbook].
Development and Production Status Each of the reserves categories (proved, probable, and possible) may be divided into developed and undeveloped categories.
1 For securities reporting, the key economic assumptions will be the prices and costs used in the estimate. The required assumptions may vary by jurisdiction, for example: (a) forecast prices and costs, in Canada under NI 51-101 (b) constant prices and costs, based on the average of the first day posted prices in each of the 12
months of the reporting issuer’s financial year, under US SEC rules (this is optional disclosure under NI 51-101).
Page: 45 of 102
Petroleum ConsultantsGLJ

Developed Reserves Developed reserves are those reserves that are expected to be recovered from existing wells and installed facilities or, if facilities have not been installed, that would involve a low expenditure (e.g., when compared to the cost of drilling a well) to put the reserves on production. The developed category may be subdivided into producing and non-producing. Developed Producing Reserves Developed producing reserves are those reserves that are expected to be recovered from completion intervals open at the time of the estimate. These reserves may be currently producing or, if shut in, they must have previously been on production, and the date of resumption of production must be known with reasonable certainty. Developed Non-producing Reserves Developed non-producing reserves are those reserves that either have not been on production, or have previously been on production, but are shut in, and the date of resumption of production is unknown. Undeveloped Reserves Undeveloped reserves are those reserves expected to be recovered from known accumulations where a significant expenditure (for example, when compared to the cost of drilling a well) is required to render them capable of production. They must fully meet the requirements of the reserves category (proved, probable, possible) to which they are assigned. In multi-well pools, it may be appropriate to allocate total pool reserves between the developed and undeveloped categories or to subdivide the developed reserves for the pool between developed producing and developed non-producing. This allocation should be based on the estimator’s assessment as to the reserves that will be recovered from specific wells, facilities, and completion intervals in the pool and their respective development and production status.
Levels of Certainty for Reported Reserves
The qualitative certainty levels referred to in the definitions above are applicable to individual reserves entities (which refers to the lowest level at which reserves calculations are performed) and to Reported Reserves (which refers to the highest level sum of individual entity estimates for which reserves estimates are presented). Reported Reserves should target the following levels of certainty under a specific set of economic conditions:
• at least a 90 percent probability that the quantities actually recovered will equal or exceed the estimated proved reserves;
• at least a 50 percent probability that the quantities actually recovered will equal or exceed the sum of the estimated proved plus probable reserves;
• at least a 10 percent probability that the quantities actually recovered will equal or exceed the sum of the estimated proved plus probable plus possible reserves.
A quantitative measure of the certainty levels pertaining to estimates prepared for the various reserves categories is desirable to provide a clearer understanding of the associated risks and uncertainties. However, the majority of reserves estimates are prepared using deterministic methods that do not provide a mathematically derived quantitative measure of probability. In principle, there should be no difference between estimates prepared using probabilistic or deterministic methods. Additional clarification of certainty levels associated with reserves estimates and the effect of aggregation is provided in Section 5.5.3 [of the COGE Handbook].
Page: 46 of 102
Petroleum ConsultantsGLJ

DOCUMENTED RESERVES CATEGORIES Production and revenue projections are prepared for each of the following main reserves
categories:
Reserves Category Proved Proved Plus Probable Proved Plus Probable Plus Possible Production and Development Status Developed Producing* Developed Non-producing Undeveloped Total (sum of developed producing, developed non-producing and undeveloped) * as producing reserves are inherently developed, GLJ simply refers to “developed producing”
reserves as “producing”
Reserves and revenue projections are available in GLJ’s evaluation database for any reserves and
development subcategory including those determined by difference (e.g., probable producing).
The following reserves categories are documented in this Corporate Summary volume:
Proved Producing Proved Developed Non-producing Proved Undeveloped Total Proved Total Probable Total Proved Plus Probable Total Possible Total Proved Plus Probable Plus Possible Documentation for the following additional reserves categories is provided in the “Expanded
Corporate Summary Information”, which has been provided to the Company in electronic format
only.
Proved Developed Producing Developed Non-producing Undeveloped Total
Page: 47 of 102
Petroleum ConsultantsGLJ

Probable Developed Producing Developed Non-producing Undeveloped Total Proved Plus Probable Developed Producing Developed Non-producing Undeveloped Total Proved Plus Probable Plus Possible Developed Producing Developed Non-producing Undeveloped Total
Individual property evaluation reports contain detailed documentation of reserves estimation
methodology and evaluation procedures.
When evaluating reserves, GLJ evaluators generally first identify the producing situation and
assign proved, proved plus probable and proved plus probable plus possible reserves in
recognition of the existing level of development and the existing depletion strategy. Incremental
non-producing (developed non-producing or undeveloped) reserves are subsequently assigned
recognizing future development opportunities and enhancements to the depletion mechanism. It
should be recognized that future developments may result in accelerated recovery of producing
reserves.
Page: 48 of 102
Petroleum ConsultantsGLJ

EVALUATION PROCEDURE
TABLE OF CONTENTS INTEREST DESCRIPTIONS WELL DATA ACCOUNTING SUMMARY PRODUCTION FORECASTS OTHER INCOME ECONOMIC PARAMETERS OIL EQUIVALENT OR GAS EQUIVALENT LIST OF ABBREVIATIONS List of Tables Table EP-1 Summary of Company Annual Other Income
Page: 49 of 102
Petroleum ConsultantsGLJ

EVALUATION PROCEDURE
The following outlines the methodology employed by GLJ Petroleum Consultants (GLJ) in
conducting the evaluation of the Company’s oil and gas properties. GLJ evaluation procedures are
in compliance with standards contained in the Canadian Oil and Gas Evaluation (COGE)
Handbook.
INTEREST DESCRIPTIONS
The Company provided GLJ with current land interest information. The Company provided a
representation letter confirming accuracy of land information. Certain cross-checks of land and
accounting information were undertaken by GLJ as recommended in the COGE Handbook. In this
process, nothing came to GLJ’s attention that indicated that information provided by the Company
was incomplete or unreliable.
In GLJ’s reports, “Company Interest” reserves and values refer to the sum of royalty interest* and
working interest reserves before deduction of royalty burdens payable. “Working Interest” reserves
equate to those reserves that are referred to as “Company Gross” reserves by the Canadian
Securities Administrators (CSA) in NI 51-101.
In the Securities Reporting section, working interest (or Company Gross) volumes are presented in
tables to correspond to NI 51-101 disclosure requirements.
*Royalty interest reserves include royalty volumes derived only from other working interest owners. WELL DATA
Pertinent interest and offset well data such as drill stem tests, workovers, pressure surveys,
production tests, etc., were provided by the Company or were obtained from other operators, public
records or GLJ nonconfidential files.
ACCOUNTING SUMMARY
The Company provided GLJ with available accounting data on a property basis and for the
corporate total for the period January 1, 2011 to December 31, 2011. In some circumstances this
information was also provided on a cost centre basis to address major reserves entities that are a
subset of a Company property.
Page: 50 of 102
Petroleum ConsultantsGLJ

PRODUCTION FORECASTS
In establishing all production forecasts, consideration was given to existing gas contracts and the
possibility of contract revisions, to the operator's plans for development drilling and to reserves
and well capability. Generally, development drilling in an area was not considered unless there
was some indication from the operator that drilling could be expected.
The on-stream date for currently shut-in reserves was estimated with consideration given to the
following:
• proximity to existing facilities • plans of the operator • economics
OTHER INCOME The following streams are included as “Other Income” in the Company’s corporate total economic
forecasts:
• Processing Income – The Company receives revenue from processing partner and third-party oil, gas and/or water volumes in certain properties as summarized (for the total proved plus probable reserves category) in Table EP-1.
ECONOMIC PARAMETERS
Pertinent economic parameters are listed as follows:
a) The effective date is December 31, 2011.
b) Operating and capital costs were estimated in 2012 dollars and then escalated as summarized in
the Product Price and Market Forecasts section of this report.
c) Economic forecasts were prepared for each property on a before income tax basis. Detailed
discounting of future cash flow was performed using a discount factor of 10.0 percent with all
values discounted annually to December 31, 2011, on a mid-calendar-year basis.
Page: 51 of 102
Petroleum ConsultantsGLJ

d) Alberta crown royalties have been determined in accordance with the Alberta New Royalty
Framework (NRF) which passed provincial legislation in December 2008, including March 11
and May 27, 2010 announcements.
e) Royalty holidays applicable to existing wells or forecast drilling are included in individual
well economics. These credits are itemized within the property reports.
f) Gas processing allowances relating to remaining undepreciated capital bases, were included in
individual property economic evaluations. Alberta gas cost allowance calculations have
incorporated changes associated with the Alberta NRF.
g) Mineral taxes on freehold interests were included.
h) Field level overhead charges have been included; recovery of overhead expenses has not been
included.
i) The Company’s office G&A costs have not been included.
j) Well abandonment costs for all wells with reserves have been included at the property level.
Additional abandonment costs associated with non-reserves wells, lease reclamation costs and
facility abandonment and reclamation expenses have not been included in this analysis.
OIL EQUIVALENT OR GAS EQUIVALENT
In this report, quantities of hydrocarbons have been converted to barrels of oil equivalent (boe);
or to sales gas equivalent (sge) using factors of 6 Mcf/boe for gas, 1 bbl/boe for all liquids, and 0
boe for sulphur. Users of oil equivalent values are cautioned that while boe based metrics are
useful for comparative purposes, they may be misleading when used in isolation.
LIST OF ABBREVIATIONS
AOF absolute open flow bbl barrels Bcf billion cubic feet of gas at standard conditions boe barrel of oil equivalent, in this evaluation determined using 6 Mcf/boe
for gas, 1 bbl/boe for all liquids, and 0 boe for sulphur bopd barrels of oil per day Btu British thermal units bwpd barrels of water per day DSU drilling spacing unit
Page: 52 of 102
Petroleum ConsultantsGLJ

GCA gas cost allowance GOC gas-oil contact GOR gas-oil ratio GORR gross overriding royalty GWC gas-water contact Mbbl thousand barrels Mboe thousand boe Mcf thousand cubic feet of gas at standard conditions Mcfe thousand cubic feet of gas equivalent Mlt thousand long tons M$ thousand Canadian dollars MM$ million Canadian dollars MMbbl million barrels MMboe million boe MMBtu million British thermal units MMcf million cubic feet of gas at standard conditions MRL maximum rate limitation Mstb thousand stock tank barrels MMstb million stock tank barrels NGL natural gas liquids (ethane, propane, butane and condensate) NPI net profits interest OGIP original gas-in-place OOIP original oil-in-place ORRI overriding royalty interest OWC oil-water contact P&NG petroleum and natural gas psia pounds per square inch absolute psig pounds per square inch gauge PVT pressure-volume-temperature RLI reserves life index, calculated by dividing reserves by the forecast of
first year production scf standard cubic feet sge sales gas equivalent – if presented in this evaluation, determined using 1
barrel of oil or natural gas liquid = 6 Mcfe; 0 for sulphur stb stock tank barrel WI working interest WTI West Texas Intermediate
Page: 53 of 102
Petroleum ConsultantsGLJ

Table EP-1Company: Corridor Resources Inc. Reserve Class: Proved Plus ProbableProperty: Corporate Development Class: TotalDescription: Summary Pricing: GLJ (2012-01)
Effective Date: December 31, 2011
Company Annual Other Income (M$)
Year Totals
Entity Description 2012 2013 2014 2015 2016 2017 2018 2019 2020 2021 2022 2023 Subtotal Remainder Total
SummaryMcCully 1,638 1,781 2,475 3,435 3,385 2,935 2,572 2,276 2,037 1,825 1,652 1,489 27,498 14,541 42,039
Total: Summary 1,638 1,781 2,475 3,435 3,385 2,935 2,572 2,276 2,037 1,825 1,652 1,489 27,498 14,541 42,039
1121357 Total Proved Plus Probable, GLJ (2012-01), oth February 16, 2012 12:52:57
Page: 54 of 102
Petroleum ConsultantsGLJ

PRODUCT PRICE AND MARKET FORECASTSJanuary 1, 2012
GLJ Petroleum Consultants has prepared its January 1, 2012 price and market forecasts as
summarized in the attached Tables 1 to 3 after a comprehensive review of information.
Information sources include numerous government agencies, industry publications, Canadian oil
refiners and natural gas marketers. The forecasts presented herein are based on an informed
interpretation of currently available data. While these forecasts are considered reasonable at this
time, users of these forecasts should understand the inherent high uncertainty in forecasting any
commodity or market. These forecasts will be revised periodically as market, economic and
political conditions change. These future revisions may be significant.
Page: 55 of 102
Petroleum ConsultantsGLJ

Table 1GLJ Petroleum Consultants Ltd.
Crude Oil and Natural Gas LiquidsPrice Forecast
Effective January 1, 2012
Bank of Canada
ICE Brent Near Month Futures
ContractLight Sweet Crude Oil
Bow River Crude Oil
Lloyd Blend Crude Oil WCS Heavy Crude Oil Light Crude Oil Medium Crude Oil Alberta Natural Gas Liquids
Average Crude Oil at Crude Oil (40 API, 0.3%S) Stream Quality Stream Quality Stream Quality Proxy (12 API) (35 API, 1.2%S) (29 API, 2.0%S) (Then Current Dollars)Noon Cushing Oklahoma FOB North Sea at Edmonton at Hardisty at Hardisty at Hardisty at Hardisty at Cromer at Cromer Edmonton
Exchange Constant Then Then Then Then Then Then Then Then Then Spec Edmonton Edmonton PentanesInflation Rate 2012 $ Current Current Current Current Current Current Current Current Current Ethane Propane Butane Plus
Year % $US/$Cdn $US/bbl $US/bbl $US/bbl $Cdn/bbl $Cdn/bbl $Cdn/bbl $Cdn/bbl $Cdn/bbl $Cdn/bbl $Cdn/bbl $Cdn/bbl $Cdn/bbl $Cdn/bbl $Cdn/bbl1996 1.6 0.733 30.16 21.98 20.31 29.38 25.12 21.55 N/A 20.06 28.41 26.08 N/A 23.13 17.83 30.051997 1.6 0.722 27.84 20.62 19.32 27.85 21.18 20.55 N/A 14.41 26.52 23.72 N/A 19.41 19.76 30.911998 1.0 0.675 19.18 14.44 13.34 20.36 14.63 15.38 N/A 9.45 19.31 16.96 N/A 11.74 12.69 21.871999 1.7 0.673 25.38 19.25 17.99 27.63 23.78 22.14 N/A 19.49 26.97 25.37 N/A 15.86 18.65 27.642000 2.7 0.673 39.12 30.23 28.41 44.57 35.28 32.61 N/A 27.49 43.28 39.92 N/A 32.15 35.59 46.312001 2.5 0.646 32.75 26.00 24.87 39.44 27.69 23.47 N/A 16.77 35.22 31.58 N/A 31.92 31.25 42.482002 2.3 0.637 32.05 26.08 25.02 40.33 31.83 30.60 N/A 26.57 37.43 35.48 N/A 21.39 27.08 40.732003 2.8 0.716 37.32 31.07 28.47 43.66 32.11 31.18 N/A 26.26 40.09 37.55 N/A 32.14 34.36 44.232004 1.8 0.770 48.41 41.38 38.02 52.96 37.43 36.31 N/A 29.11 49.14 45.64 N/A 34.70 39.97 53.942005 2.2 0.826 64.96 56.58 55.14 69.02 44.73 43.03 43.74 34.07 62.18 56.77 N/A 43.04 51.80 69.572006 2.0 0.882 74.35 66.22 66.16 73.21 51.82 50.36 50.66 41.84 66.38 62.26 N/A 43.85 60.17 75.412007 2.2 0.935 79.74 72.39 72.71 77.06 53.64 52.03 52.38 43.42 71.13 65.71 N/A 49.56 61.78 77.382008 2.4 0.943 107.29 99.64 98.30 102.89 84.31 82.60 82.95 74.94 96.08 93.10 N/A 58.38 75.33 104.782009 0.4 0.880 65.02 61.78 62.50 66.32 60.18 58.40 58.66 54.46 63.84 62.96 N/A 38.03 48.17 68.172010 1.8 0.971 83.35 79.52 80.25 77.87 68.45 66.95 67.27 60.76 76.58 73.76 N/A 46.84 65.91 84.27
2011 (e) 3.0 1.012 97.65 94.83 110.63 95.15 78.12 76.37 76.68 67.03 91.61 87.57 N/A 53.47 74.24 103.75
2012 Q1 2.0 0.980 97.00 97.00 105.00 97.96 83.27 81.31 81.61 72.37 93.06 90.12 10.50 58.78 76.41 107.762012 Q2 2.0 0.980 97.00 97.00 105.00 97.96 83.27 81.31 81.61 72.37 93.06 90.12 10.98 58.78 76.41 107.762012 Q3 2.0 0.980 97.00 97.00 105.00 97.96 83.27 81.31 81.61 72.37 93.06 90.12 11.61 58.78 76.41 107.762012 Q4 2.0 0.980 97.00 97.00 105.00 97.96 83.27 81.31 81.61 72.37 93.06 90.12 12.72 58.78 76.41 107.76
2012 Full Year 2.0 0.980 97.00 97.00 105.00 97.96 83.27 81.31 81.61 72.37 93.06 90.12 11.46 58.78 76.41 107.76
2013 2.0 0.980 98.04 100.00 105.00 101.02 84.35 82.33 82.63 73.60 94.96 92.94 13.67 60.61 78.80 108.092014 2.0 0.980 96.12 100.00 102.00 101.02 84.35 82.33 82.63 74.51 93.95 91.93 15.26 60.61 78.80 105.062015 2.0 0.980 94.23 100.00 100.00 101.02 84.35 82.33 82.63 74.51 93.95 91.93 16.85 60.61 78.80 105.062016 2.0 0.980 92.38 100.00 100.00 101.02 84.35 82.33 82.63 74.51 93.95 91.93 18.43 60.61 78.80 105.062017 2.0 0.980 90.57 100.00 100.00 101.02 84.35 82.33 82.63 74.51 93.95 91.93 20.02 60.61 78.80 105.062018 2.0 0.980 90.00 101.35 101.35 102.40 85.50 83.45 83.75 75.54 95.23 93.18 20.84 61.44 79.87 106.492019 2.0 0.980 90.00 103.38 103.38 104.47 87.23 85.14 85.44 77.09 97.16 95.07 21.25 62.68 81.49 108.652020 2.0 0.980 90.00 105.45 105.45 106.58 89.00 86.86 87.16 78.67 99.12 96.99 21.70 63.95 83.13 110.842021 2.0 0.980 90.00 107.56 107.56 108.73 90.79 88.62 88.92 80.28 101.12 98.95 22.14 65.24 84.81 113.08
2022+ 2.0 0.980 90.00 +2.0%/yr +2.0%/yr +2.0%/yr +2.0%/yr +2.0%/yr +2.0%/yr +2.0%/yr +2.0%/yr +2.0%/yr +2.0%/yr +2.0%/yr +2.0%/yr +2.0%/yr
Historical futures contract price is an average of the daily settlement price of the near month contract over the calendar month.Revised 2011-12-31
Nymex Wti Near Month Futures Contract
Page: 56 of 102
Petroleum ConsultantsGLJ

Table 2GLJ Petroleum Consultants Ltd.
Natural Gas and SulphurPrice Forecast
Effective January 1, 2012
Henry Hub Nymex Midwest Alberta Plant Gate Saskatchewan Plant Gate British Columbia Alberta Near Month Contract Price @ Chicago AECO/NIT Spot Spot Sulphur Sulphur
Constant Then Then Then Constant Then Westcoast Spot FOB at Plant 2012 $ Current Current Current 2012 $ Current ARP Aggregator Alliance SaskEnergy Spot Sumas Spot Station 2 Plant Gate Vancouver Gate
Year $US/mmbtu $US/mmbtu $US/mmbtu $Cdn/mmbtu $/mmbtu $/mmbtu $/mmbtu $/mmbtu $/mmbtu $/mmbtu $/mmbtu $US/mmbtu $/mmbtu $/mmbtu $US/LT $Cdn/LT1996 3.44 2.51 2.73 1.39 1.72 1.26 1.63 1.49 N/A 1.52 1.31 1.32 1.49 1.47 36.28 6.481997 3.34 2.47 2.75 1.85 2.29 1.70 1.97 1.69 N/A 1.85 1.77 1.71 1.90 1.98 34.75 5.121998 2.87 2.16 2.20 2.03 2.49 1.87 1.94 1.78 N/A 2.05 1.94 1.60 2.15 2.00 24.59 -6.511999 3.05 2.31 2.33 2.92 3.63 2.75 2.48 2.17 N/A 2.82 2.84 2.15 2.93 2.78 33.74 6.932000 5.58 4.32 3.96 5.08 6.37 4.93 4.50 4.44 N/A 4.79 4.99 4.15 5.06 4.88 38.14 13.592001 5.08 4.03 4.45 6.23 7.65 6.07 5.41 4.97 5.29 5.72 6.15 4.57 6.32 6.29 18.29 -14.672002 4.13 3.36 3.25 4.04 4.77 3.88 3.88 3.64 3.66 4.04 3.96 2.68 4.18 3.93 29.38 3.042003 6.57 5.47 5.46 6.66 7.80 6.49 6.13 5.87 6.15 6.41 6.57 4.66 6.45 6.32 59.81 39.832004 7.23 6.18 6.13 6.88 7.83 6.70 6.31 6.16 6.39 6.48 6.78 5.26 6.56 6.45 62.99 38.612005 10.34 9.00 8.24 8.58 9.66 8.42 8.30 8.27 8.29 8.36 8.48 7.13 8.22 8.12 63.50 33.772006 7.85 6.99 6.93 7.16 7.81 6.96 6.57 6.36 6.34 6.67 7.06 6.27 6.58 6.45 55.07 19.272007 7.83 7.12 6.83 6.65 7.08 6.43 6.20 6.13 5.86 6.18 6.55 6.52 6.40 6.25 81.66 42.032008 9.58 8.90 8.91 8.16 8.53 7.92 7.88 7.85 7.84 8.07 8.04 8.33 8.21 8.09 497.39 488.642009 4.38 4.16 4.05 4.19 4.19 3.98 3.85 3.69 3.23 3.87 4.04 3.91 4.17 4.04 57.06 24.572010 4.60 4.40 4.53 4.17 4.11 3.93 3.77 3.63 3.31 3.96 4.00 4.31 4.01 3.91 88.94 48.26
2011 (e) 4.15 4.03 4.26 3.68 3.58 3.47 3.57 3.40 2.89 3.67 3.72 3.88 3.37 3.28 217.14 172.03
2012 Q1 3.50 3.50 3.60 3.21 3.02 3.02 2.96 2.89 2.36 3.06 3.15 3.20 3.01 2.86 200.00 161.082012 Q2 3.65 3.65 3.75 3.35 3.16 3.16 3.09 3.02 2.50 3.19 3.29 3.35 3.15 3.00 200.00 161.082012 Q3 3.85 3.85 3.95 3.54 3.34 3.34 3.27 3.20 2.70 3.37 3.48 3.55 3.34 3.18 200.00 161.082012 Q4 4.20 4.20 4.30 3.86 3.66 3.66 3.58 3.50 3.04 3.68 3.80 3.90 3.66 3.50 200.00 161.08
2012 Full Year 3.80 3.80 3.90 3.49 3.29 3.29 3.23 3.15 2.65 3.33 3.43 3.50 3.29 3.14 200.00 161.08
2013 4.41 4.50 4.60 4.13 3.85 3.93 3.85 3.76 3.33 3.95 4.07 4.20 3.93 3.78 175.00 135.572014 4.81 5.00 5.10 4.59 4.21 4.39 4.30 4.20 3.82 4.40 4.53 4.70 4.39 4.23 150.00 110.062015 5.18 5.50 5.60 5.05 4.56 4.84 4.74 4.64 4.31 4.84 4.99 5.20 4.85 4.69 125.00 84.552016 5.54 6.00 6.10 5.51 4.89 5.30 5.19 5.08 4.80 5.29 5.45 5.70 5.31 5.14 125.00 84.552017 5.89 6.50 6.60 5.97 5.21 5.75 5.64 5.51 5.29 5.74 5.91 6.20 5.77 5.60 127.50 87.102018 6.00 6.76 6.86 6.21 5.32 5.99 5.87 5.74 5.55 5.97 6.15 6.46 6.01 5.84 130.05 89.702019 6.00 6.89 6.99 6.33 5.32 6.11 5.98 5.85 5.67 6.08 6.27 6.59 6.13 5.95 132.65 92.362020 6.00 7.03 7.13 6.46 5.32 6.23 6.11 5.98 5.81 6.21 6.40 6.73 6.26 6.08 135.30 95.062021 6.00 7.17 7.27 6.58 5.32 6.36 6.23 6.10 5.95 6.33 6.52 6.87 6.38 6.21 138.01 97.83
2022+ 6.00 +2.0%/yr +2.0%/yr +2.0%/yr 5.32 +2.0%/yr +2.0%/yr +2.0%/yr +2.0%/yr +2.0%/yr +2.0%/yr +2.0%/yr +2.0%/yr +2.0%/yr +2.0%/yr +2.0%/yr
Unless otherwise stated, the gas price reference point is the receipt point on the applicable provincial gas transmission system known as the plant gate.The plant gate price represents the price before raw gas gathering and processing charges are deducted.AECO-C Spot refers to the one month price averaged for the year.
Revised 2011-12-31
Page: 57 of 102
Petroleum ConsultantsGLJ

Table 3GLJ Petroleum Consultants Ltd.
Crude and Natural GasGLJ (2012-01)
Effective January 01, 2012
NYMEX WTI Near NationalMonth Futures Contract Brent Blend Balancing
Bank of Crude Oil at Crude Oil Henry Hub Nova Scotia PointCanada Cushing Oklahoma FOB North Sea Spot Goldboro (UK)
Average Noon Can. - UK Can. - EUROExchange Exchange Exchange Then Then Then Then Then Then Then Then Then Then
Inflation Rate Rate Rate Current Current Current Current Current Current Current Current Current CurrentYear % $US/$C $C/GBP $C/EURO $US/bbl $C/bbl $US/bbl $C/bbl $US/MMbtu $C/MMbtu $US/MMbtu $C/MMbtu $US/MMbtu C$/MMbtu
2002 2.3 0.637 2.3587 1.4266 26.08 40.93 25.02 39.27 3.36 5.27 2.70 4.23 2.58 4.05
2003 2.8 0.716 2.2877 1.5229 31.07 43.60 28.47 39.93 5.47 7.67 5.16 7.31 3.38 4.69
2004 1.8 0.770 2.3837 1.5559 41.38 53.65 38.02 49.29 6.18 8.02 5.62 7.32 4.76 6.13
2005 2.2 0.826 2.2057 1.4523 56.58 68.42 55.14 66.69 9.00 10.83 8.19 9.87 7.51 9.02
2006 2.0 0.882 2.0898 1.3686 66.22 75.08 66.16 75.01 6.99 7.94 6.20 7.04 8.34 9.48
2007 2.2 0.935 2.1475 1.4361 72.39 76.89 72.71 77.33 7.12 7.65 6.33 6.84 6.14 6.44
2008 2.4 0.943 1.9605 1.5480 99.64 104.27 98.30 102.81 8.90 9.36 8.32 8.77 11.41 12.12
2009 0.4 0.880 1.7799 1.5850 61.78 69.57 62.50 70.47 4.16 4.75 3.35 3.87 4.95 5.68
2010 1.8 0.971 1.5928 1.3671 79.52 81.85 80.25 82.58 4.40 4.53 3.83 3.96 6.39 6.58
2011 3.0 1.012 1.5863 1.3764 94.83 93.68 110.63 109.32 4.03 3.98 3.41 3.65 9.38 8.49
2012 Q1 2.0 0.980 1.6000 1.3500 97.00 98.98 105.00 107.14 3.50 3.57 3.95 4.03 9.13 9.32
2012 Q2 2.0 0.980 1.6000 1.3500 97.00 98.98 105.00 107.14 3.65 3.72 2.42 2.47 9.13 9.32
2012 Q3 2.0 0.980 1.6000 1.3500 97.00 98.98 105.00 107.14 3.85 3.93 3.11 3.18 9.13 9.32
2012 Q4 2.0 0.980 1.6000 1.3500 97.00 98.98 105.00 107.14 4.20 4.29 3.46 3.53 9.13 9.32
2012 Full Year 2.0 0.980 1.6000 1.3500 97.00 98.98 105.00 107.14 3.80 3.88 3.24 3.30 9.13 9.32
2013 2.0 0.980 1.6000 1.3500 100.00 102.04 105.00 107.14 4.50 4.59 3.85 3.93 9.55 9.74
2014 2.0 0.980 1.6000 1.3500 100.00 102.04 102.00 104.08 5.00 5.10 4.35 4.44 9.71 9.91
2015 2.0 0.980 1.6000 1.3500 100.00 102.04 100.00 102.04 5.50 5.61 4.84 4.94 10.00 10.20
2016 2.0 0.980 1.6000 1.3500 100.00 102.04 100.00 102.04 6.00 6.12 5.34 5.45 10.00 10.20
2017 2.0 0.980 1.6000 1.3500 100.00 102.04 100.00 102.04 6.50 6.63 5.83 5.95 10.00 10.20
2018 2.0 0.980 1.6000 1.3500 101.35 103.42 101.35 103.42 6.76 6.90 6.09 6.21 10.14 10.34
2019 2.0 0.980 1.6000 1.3500 103.38 105.49 103.38 105.49 6.89 7.03 6.22 6.34 10.34 10.55
2020 2.0 0.980 1.6000 1.3500 105.45 107.60 105.45 107.60 7.03 7.17 6.36 6.49 10.55 10.76
2021 2.0 0.980 1.6000 1.3500 107.56 109.76 107.56 109.76 7.17 7.32 6.49 6.63 10.76 10.98
2022+ 2.0 0.980 1.6000 1.3500 +2.0%/yr +2.0%/yr +2.0%/yr +2.0%/yr +2.0%/yr +2.0%/yr +2.0%/yr +2.0%/yr +2.0%/yr +2.0%/yr
Historical futures contract price is an average of the daily settlement price of the near month contract over the calendar month.
Page: 58 of 102
Petroleum ConsultantsGLJ

Page: 59 of 102
Petroleum ConsultantsGLJ
SECURITIES REPORTING
TABLE OF CONTENTS
Page
SECURITIES OUTLINE 60
SECURITIES DISCUSSION 61
AFTER TAX FORECAST PRICING RESERVES DATATable FP-1 Reserves And NPV Summary 65Table FP-2 Total Future Net Revenue (Undiscounted) 66Table FP-3 Future Net Revenue by Production Group 67Table FP-4 Forecast Prices Used 68Table FP-5A Current Reserves Reconciliation 71Table FP-5B Prior Reserves Reconciliation 72Table FP-6 Undeveloped Reserves Attributed In Current Year 73Table FP-7 Company Annual Capital Expenditures 74Table FP-8 Company Annual Abandonment Costs 75Table FP-9 Summary of First Year Production and Oil and Gas Reserves 76
March 13, 2012 15:51:06
SECURITIES REPORTING OUTLINE PART 1 DATE OF STATEMENT 1.1 Relevant Dates 1. Effective Date 2. Data Date 3. Preparation Date PART 2 DISCLOSURE OF RESERVES DATA 2.1 Reserves Data (Forecast Prices and Costs) 1. Breakdown of Proved Reserves 2. Net Present Value of Future Net Revenue 3. Additional Information Concerning Future Net Revenue PART 3 PRICING ASSUMPTIONS 3.2 Forecast Prices Used in Estimates PART 4 RECONCILIATION OF CHANGES IN RESERVES 4.1 Reserves Reconciliation PART 5 ADDITIONAL INFORMATION RELATING TO RESERVES DATA 5.1 Undeveloped Reserves 5.2 Significant Factors or Uncertainties 5.3 Future Development Costs PART 6 OTHER OIL AND GAS INFORMATION 6.3 Forward Contracts 6.4 Additional Information Concerning Abandonment and Reclamation Costs 6.5 Tax Horizon 6.8 Production Estimates
Page: 60 of 102
Petroleum ConsultantsGLJ

SECURITIES REPORTING DISCUSSION The Canadian Securities Administrators (CSA) have set out disclosure standards for Canadian
publicly traded oil and gas companies in National Instrument 51-101 (NI 51-101).
This section presents reserves data following the item numbering and formatting in CSA Form
51-101F1 and the sample tables contained in Appendix 1 to the NI 51-101 Companion Policy
(51-101CP).
The Report on Reserves Data, Form 51-101F2, is provided separately.
Note Regarding Nomenclature: Throughout this report, “Company Interest” reserves refers to the sum of royalty interest* and working interest reserves before deduction of royalty burdens payable. “Working Interest” reserves equate to those reserves that are referred to as “Company Gross” reserves by the Canadian Securities Administrators (CSA) in NI 51-101.
In this Securities Reporting section, Company Gross (or working interest) volumes are presented in tables to correspond to NI 51-101 disclosure requirements. *Royalty interest reserves include royalty volumes derived only from other working interest owners.
PART 1 DATE OF STATEMENT Item 1.1 Relevant Dates
1. Effective Date:
The effective date of the reserves estimates and revenue projections in this report
is December 31, 2011.
2. Data Date:
Estimates of reserves and projections of production were generally prepared using
general well information and production data available in the public domain to
approximately December 31, 2011. The Company has provided GLJ with a
representation letter confirming that complete and correct information has been
provided to GLJ.
3. Preparation Date:
The preparation date (the latest date of receipt of information relevant to this
evaluation) of this report is February 15, 2012.
Page: 61 of 102
Petroleum ConsultantsGLJ

PART 2 DISCLOSURE OF RESERVES DATA
Item 2.1 Reserves Data (Forecast Prices and Costs) 1. Breakdown of Reserves (Forecast Case)
Refer to Table FP-1 2. Net Present Value of Future Net Revenue (Forecast Case)
Refer to Table FP-1 3. Additional Information Concerning Future Net Revenue (Forecast Case)
(a) and (b) Undiscounted Revenue and Costs Refer to Table FP-2
(c) Discounted Future Net Revenue by Production Group Refer to Table FP-3
PART 3 PRICING ASSUMPTIONS
Item 3.2 Forecast Prices Used in Estimates 1. (a) The forecast reference prices used in preparing the Company’s reserves
data are provided in Table FP-4.
This price forecast is GLJ’s standard price forecast effective January 1, 2012. PART 4 RECONCILIATION OF CHANGES IN RESERVES Item 4.1 Reserves Reconciliation Tables FP-5A and FP-5B provide reconciliations of Company Gross reserves
based on forecast prices and costs for the current and prior year-end evaluations,
respectively.
PART 5 ADDITIONAL INFORMATION RELATING TO RESERVES DATA Item 5.1 Undeveloped Reserves 1.(a) and 2.(a) Year First Attributed Table FP-6 provides a summary of the undeveloped reserves first attributed
during the current fiscal year and the Company total at the current year-end
effective date.
Page: 62 of 102
Petroleum ConsultantsGLJ

The following table sets out total Company undeveloped reserves evaluated by
GLJ utilizing the format preferred by the CSA.
Proved Undeveloped Reserves
* First Total at First Total at First Total at First Total at First Total at
Attributed Year-end Attributed Year-end Attributed Year-end Attributed Year-end Attributed Year-end
Prior 87 87 - - 21,790 45,987 28 59 3,747 7,810
2009 - 87 - - 7,836 45,239 10 58 1,316 7,684
2010 - 87 - - 1,513 35,772 2 46 254 6,094
2011 - 87 - - - 36,739 - 47 - 6,257
Probable Undeveloped Reserves
* First Total at First Total at First Total at First Total at First Total at
Attributed Year-end Attributed Year-end Attributed Year-end Attributed Year-end Attributed Year-end
Prior 434 434 - - 37,355 57,401 48 73 6,707 10,074
2009 - 434 - - 4,254 54,580 5 70 714 9,600
2010 - 434 - - 1,233 51,517 2 66 207 9,086
2011 - 434 - - 3,489 38,016 4 49 586 6,819
* "First Attributed" refers to reserves first attributed at year-end of the corresponding fiscal yr
Light & Medium Oil (Mbbl)
Heavy Oil (Mbbl) Natural Gas (MMcf) Natural Gas Liquids (Mbbl)
Light & Medium Oil (Mbbl)
Heavy Oil (Mbbl)
Company Gross Reserves First Attributed by Year
Natural Gas (MMcf)
Oil Equivalent (Mbbl)
Natural Gas Liquids (Mbbl)
Oil Equivalent (Mbbl)
1.(b) and 2.(b) General Basis for Reserves and Timing of Development Proved and probable undeveloped reserves have been estimated in accordance
with procedures and standards contained in the COGE Handbook. The significant
majority of the undeveloped reserves are scheduled to be developed within the
next two years.
Item 5.2 Significant Factors or Uncertainties The evaluated oil and gas properties of the Company have no material
extraordinary risks or uncertainties beyond those which are inherent of an oil and
gas producing company.
Item 5.3 Future Development Costs
1. Table FP-7 summarizes capital development costs related to the recovery
of the Company’s reserves.
Page: 63 of 102
Petroleum ConsultantsGLJ

PART 6 OTHER OIL AND GAS INFORMATION Item 6.3 Forward Contracts In accordance with the provisions in NI 51-101, the impact of the Company’s
financial hedges has not been included in this report. Item 6.4 Additional Information Concerning Abandonment and Reclamation Costs The following aspects of the Company’s future abandonment and reclamation
costs have been included/excluded in the economic forecasts.
Included: • Well Abandonment Costs:
o existing and future reserves wells Excluded:
• Well Abandonment Costs: o non-reserves wells
• Pipelines • Production Facilities • Site Reclamation
Total abandonment costs are included in the reserves data summarized in Table
FP-8.
Item 6.5 Tax Horizon
Based on after tax economic forecasts prepared by GLJ, income taxes are payable by the Company in 2016. After tax revenue projections are provided in the After Tax Analysis section of this report.
Item 6.8 Production Estimates Table FP-9 presents a forecast of the Company’s production by product type in
the first year of forecast.
Production for properties which individually account for 20 percent or more of the
Company’s forecast production (total proved plus probable reserves, BOE basis)
in the first year of forecast has been identified separately in this table.
Page: 64 of 102
Petroleum ConsultantsGLJ

Table FP-1Company: Corridor Resources Inc. Reserve Class: VariousProperty: Corporate Development Class: ClassificationsDescription: After Tax Analysis Pricing: GLJ (2012-01)
Effective Date: December 31, 2011
Summary Of Oil And Gas Reserves And Net Present Values of Future Net Revenue
RESERVES SUMMARY
Light And Medium Oil Heavy Oil Natural Gas Natural Gas Liquids Total Oil Equivalent
Company Company Company Company Company Company Company Company Company CompanyGross Net Gross Net Gross Net Gross Net Gross Net
Reserves Category Mbbl Mbbl Mbbl Mbbl MMcf MMcf Mbbl Mbbl Mboe Mboe
PROVEDProducing 0 0 0 0 21,949 20,944 28 27 3,686 3,517Developed Nonproducing 0 0 0 0 0 0 0 0 0 0Undeveloped 87 79 0 0 36,739 33,249 47 42 6,257 5,662
TOTAL PROVED 87 79 0 0 58,688 54,192 75 69 9,943 9,180
TOTAL PROBABLE 434 393 0 0 43,967 39,955 56 51 7,818 7,103
TOTAL PROVED PLUS PROBABLE 521 471 0 0 102,654 94,147 131 120 17,761 16,282
TOTAL PPP 694 628 0 0 216,732 197,558 277 252 37,093 33,807
NET PRESENT VALUE SUMMARY
Net Present Values of Future Net RevenueBefore Income Taxes Discounted At (%/year) Unit Value Before Income Tax
Discounted at 10%/year0% 5% 10% 15% 20%
Reserves Category M$ M$ M$ M$ M$ $/boe $/Mcfe
PROVEDProducing 68,004 55,395 46,325 39,645 34,602 13.17 2.20Developed Nonproducing 0 0 0 0 0 0.00 0.00Undeveloped 151,236 83,361 49,417 30,547 19,232 8.73 1.45
TOTAL PROVED 219,240 138,756 95,742 70,192 53,834 10.43 1.74
TOTAL PROBABLE 244,854 127,138 75,405 48,508 32,905 10.62 1.77
TOTAL PROVED PLUS PROBABLE 464,094 265,894 171,147 118,701 86,738 10.51 1.75
TOTAL PPP 1,217,007 593,714 351,488 231,566 163,152 10.40 1.73
Net Present Values of Future Net RevenueAfter Income Taxes Discounted At (%/year)
0% 5% 10% 15% 20%Reserves Category M$ M$ M$ M$ M$
PROVEDProducing 68,004 55,395 46,325 39,645 34,602Developed Nonproducing 0 0 0 0 0Undeveloped 143,176 80,594 48,392 30,141 19,062
TOTAL PROVED 211,180 135,989 94,717 69,786 53,664
TOTAL PROBABLE 176,697 94,147 57,408 37,922 26,345
TOTAL PROVED PLUS PROBABLE 387,877 230,136 152,124 107,708 80,009
TOTAL PPP 930,490 466,780 282,516 189,632 135,843
Note: Unit values are based on Company Net Reserves.
1121357 Class (A,B1,B2,C,F,I,R), GLJ (2012-01), cs1a February 16, 2012 12:23:22
Page: 65 of 102
Petroleum ConsultantsGLJ

Table FP-2Company: Corridor Resources Inc. Reserve Class: VariousProperty: Corporate Development Class: ClassificationsDescription: After Tax Analysis Pricing: GLJ (2012-01)
Effective Date: December 31, 2011
Total Future Net Revenue (Undiscounted)
Future FutureCapital Net Revenue Net Revenue
Operating Development Abandonment Before Income AfterRevenue Royalties Costs Costs Costs Income Taxes Tax Income Taxes
Reserves Category M$ M$ M$ M$ M$ M$ M$ M$
Proved Producing 137,117 5,810 56,805 0 6,498 68,004 0 68,004
Proved Developed Nonproducing 0 0 0 0 0 0 0 0
Proved Undeveloped 277,388 24,828 22,212 72,193 6,919 151,236 8,060 143,176
Total Proved 414,504 30,638 79,016 72,193 13,417 219,240 8,060 211,180
Total Probable 393,207 34,888 42,526 64,991 5,949 244,854 68,156 176,697
Total Proved Plus Probable 807,712 65,526 121,542 137,184 19,366 464,094 76,216 387,877
Total PPP 1,829,257 157,827 214,214 210,435 29,773 1,217,007 286,517 930,490
Notes1. Disclosure is required for Total Proved and Proved Plus Probable reserves
1121357 Class (A,B1,B2,C,F,I,R), GLJ (2012-01), cs2new February 16, 2012 12:53:43
Page: 66 of 102
Petroleum ConsultantsGLJ

Table FP-3Company: Corridor Resources Inc. Reserve Class: VariousProperty: Corporate Development Class: ClassificationsDescription: After Tax Analysis Pricing: GLJ (2012-01)
Effective Date: December 31, 2011
Future Net Revenue by Production Group
Future Net Revenue Before Income Taxes [3](Discounted at 10% per year)
M$ $/boe $/Mcfe
Proved ProducingLight & Medium Oil [1] 0 0.00 0.00Natural Gas [2] 46,325 13.17 2.20
Total: Proved Producing 46,325 13.17 2.20
Total ProvedLight & Medium Oil [1] 4,698 52.89 8.82Natural Gas [2] 91,044 10.01 1.67
Total: Total Proved 95,742 10.43 1.74
Total Proved Plus ProbableLight & Medium Oil [1] 14,695 27.57 4.60Natural Gas [2] 156,452 9.93 1.66
Total: Total Proved Plus Probable 171,147 10.51 1.75
Total PPPLight & Medium Oil [1] 26,033 30.34 5.06Natural Gas [2] 325,455 9.88 1.65
Total: Total PPP 351,488 10.40 1.73
Notes1. Including solution gas and other by-products2. Including by-products but excluding solution gas3.
Company Net Reserves.Other company revenue and costs not related to a specific production group have been allocated proportionately to production groups. Unit values are based on
Percentage of Future Net Revenue (10% DCF)
L & M Oil (4.9 %)
Natural Gas (95.1 %)
Total Proved
L & M Oil (8.6 %)
Natural Gas (91.4 %)
Total Proved Plus Probable
L & M Oil (7.4 %)
Natural Gas (92.6 %)
Total PPP
1121357 Class (A,C,I,R), GLJ (2012-01), cs3new March 13, 2012 15:45:45
Page: 67 of 102
Petroleum ConsultantsGLJ

Table FP-4GLJ Petroleum Consultants Ltd.
Crude Oil and Natural Gas LiquidsGLJ (2012-01)
Effective January 01, 2012
Light, Sweet Bow River Lloyd Blend WCS Crude Heavy Light Sour MediumNYMEX WTI Near Brent Blend Crude Oil Crude Oil Crude Oil Oil Crude Oil Crude Oil Crude Oil
Bank of Month Futures Contract Crude Oil (40 API, Stream Stream Stream Proxy (12 (35 API, (29 API, Alberta Natural Gas LiquidsCanada Crude Oil at FOB North 0.3%S) Quality Quality Quality API) 1.2%S) 2.0%S) (Then Current Dollars)Average Cushing Oklahoma Sea at Edmonton at Hardisty at Hardisty at Hardisty at Hardisty at Cromer at Cromer
Noon EdmontonExchange Constant Then Then Then Then Then Then Then Then Then Spec Edmonton Edmonton Pentanes
Inflation Rate 2012 $ Current Current Current Current Current Current Current Current Current Ethane Propane Butane PlusYear % $US/$C $US/bbl $US/bbl $US/bbl $C/bbl $C/bbl $C/bbl $C/bbl $C/bbl $C/bbl $C/bbl $C/bbl $C/bbl $C/bbl $C/bbl
2002 2.3 0.6369 32.05 26.08 25.02 40.33 31.83 30.60 N/A 26.57 37.43 35.48 N/A 21.39 27.08 40.73
2003 2.8 0.7158 37.32 31.07 28.47 43.66 32.11 31.18 N/A 26.26 40.09 37.55 N/A 32.14 34.36 44.23
2004 1.8 0.7698 48.41 41.38 38.02 52.96 37.43 36.31 N/A 29.11 49.14 45.64 N/A 34.70 39.97 53.94
2005 2.2 0.8260 64.96 56.58 55.14 69.02 44.73 43.03 43.74 34.07 62.18 56.77 N/A 43.04 51.80 69.57
2006 2.0 0.8818 74.35 66.22 66.16 73.21 51.82 50.36 50.66 41.84 66.38 62.26 N/A 43.85 60.17 75.41
2007 2.2 0.9352 79.74 72.39 72.71 77.06 53.64 52.03 52.38 43.42 71.13 65.71 N/A 49.56 61.78 77.38
2008 2.4 0.9428 107.29 99.64 98.30 102.89 84.31 82.60 82.95 74.94 96.08 93.10 N/A 58.38 75.33 104.78
2009 0.4 0.8798 65.02 61.78 62.50 66.32 60.18 58.40 58.66 54.46 63.84 62.96 N/A 38.03 48.17 68.17
2010 1.8 0.9711 83.35 79.52 80.25 77.87 68.45 66.95 67.27 60.76 76.58 73.76 N/A 46.84 65.91 84.27
2011 3.0 1.0118 97.65 94.83 110.63 95.15 78.12 76.37 76.68 67.03 91.61 87.57 N/A 53.47 74.24 103.75
2012 Q1 2.0 0.9800 97.00 97.00 105.00 97.96 83.27 81.31 81.61 72.37 93.06 90.12 10.50 58.78 76.41 107.76
2012 Q2 2.0 0.9800 97.00 97.00 105.00 97.96 83.27 81.31 81.61 72.37 93.06 90.12 10.98 58.78 76.41 107.76
2012 Q3 2.0 0.9800 97.00 97.00 105.00 97.96 83.27 81.31 81.61 72.37 93.06 90.12 11.61 58.78 76.41 107.76
2012 Q4 2.0 0.9800 97.00 97.00 105.00 97.96 83.27 81.31 81.61 72.37 93.06 90.12 12.72 58.78 76.41 107.76
2012 Full Year 2.0 0.9800 97.00 97.00 105.00 97.96 83.27 81.31 81.61 72.37 93.06 90.12 11.46 58.78 76.41 107.76
2013 2.0 0.9800 98.04 100.00 105.00 101.02 84.35 82.33 82.63 73.60 94.96 92.94 13.67 60.61 78.80 108.09
2014 2.0 0.9800 96.12 100.00 102.00 101.02 84.35 82.33 82.63 74.51 93.95 91.93 15.26 60.61 78.80 105.06
2015 2.0 0.9800 94.23 100.00 100.00 101.02 84.35 82.33 82.63 74.51 93.95 91.93 16.85 60.61 78.80 105.06
2016 2.0 0.9800 92.38 100.00 100.00 101.02 84.35 82.33 82.63 74.51 93.95 91.93 18.43 60.61 78.80 105.06
2017 2.0 0.9800 90.57 100.00 100.00 101.02 84.35 82.33 82.63 74.51 93.95 91.93 20.02 60.61 78.80 105.06
2018 2.0 0.9800 90.00 101.35 101.35 102.40 85.50 83.45 83.75 75.54 95.23 93.18 20.84 61.44 79.87 106.49
2019 2.0 0.9800 90.00 103.38 103.38 104.47 87.23 85.14 85.44 77.09 97.16 95.07 21.25 62.68 81.49 108.65
2020 2.0 0.9800 90.00 105.45 105.45 106.58 89.00 86.86 87.16 78.67 99.12 96.99 21.70 63.95 83.13 110.84
2021 2.0 0.9800 90.00 107.56 107.56 108.73 90.79 88.62 88.92 80.28 101.12 98.95 22.14 65.24 84.81 113.08
2022+ 2.0 0.9800 90.00 +2.0%/yr +2.0%/yr +2.0%/yr +2.0%/yr +2.0%/yr +2.0%/yr +2.0%/yr +2.0%/yr +2.0%/yr +2.0%/yr +2.0%/yr +2.0%/yr +2.0%/yr
Historical futures contract price is an average of the daily settlement price of the near month contract over the calendar month. Page: 68 of 102
Petroleum ConsultantsGLJ

Table FP-4 (Continued)GLJ Petroleum Consultants Ltd.
Natural Gas and SulphurGLJ (2012-01)
Effective January 01, 2012
Midwest Alberta Plant GateHenry Hub Nymex Price @ AECO/NIT
Near Month Contract Chicago Spot Spot British Columbia AlbertaSaskatchewan Plant Gate Sulphur Sulphur
Constant Then Then Then Then Westcoast Spot FOB at Plant2012 $ Current Current Current 2012 $ Current ARP Aggregator Alliance SaskEnergy Spot Sumas Spot Station 2 Plant Gate Vancouver Gate
Year $US/MMbtu $US/MMbtu $US/MMbtu $C/MMbtu $C/MMbtu $C/MMbtu $C/MMbtu $C/MMbtu $C/MMbtu $C/MMbtu $C/MMbtu $US/MMbtu $C/MMbtu $C/MMbtu $US/LT $C/LT
2002 4.13 3.36 3.25 4.04 4.77 3.88 3.88 3.64 3.66 4.04 3.96 2.68 4.18 3.93 29.38 3.04
2003 6.57 5.47 5.46 6.66 7.80 6.49 6.13 5.87 6.15 6.41 6.57 4.66 6.45 6.32 59.81 39.83
2004 7.23 6.18 6.13 6.88 7.83 6.70 6.31 6.16 6.39 6.48 6.78 5.26 6.56 6.45 62.99 38.61
2005 10.34 9.00 8.24 8.58 9.66 8.42 8.30 8.27 8.29 8.36 8.48 7.13 8.22 8.12 63.50 33.77
2006 7.85 6.99 6.93 7.16 7.81 6.96 6.57 6.36 6.34 6.67 7.06 6.27 6.58 6.45 55.07 19.27
2007 7.83 7.12 6.83 6.65 7.08 6.43 6.20 6.13 5.86 6.18 6.55 6.52 6.40 6.25 81.66 42.03
2008 9.58 8.90 8.91 8.16 8.53 7.92 7.88 7.85 7.84 8.07 8.04 8.33 8.21 8.09 497.39 488.64
2009 4.38 4.16 4.05 4.19 4.19 3.98 3.85 3.69 3.23 3.87 4.04 3.91 4.17 4.04 57.06 24.57
2010 4.60 4.40 4.53 4.17 4.11 3.93 3.77 3.63 3.31 3.96 4.00 4.31 4.01 3.91 88.94 48.26
2011 4.15 4.03 4.26 3.68 3.58 3.47 3.57 3.40 2.89 3.67 3.72 3.88 3.37 3.28 217.14 172.03
2012 Q1 3.50 3.50 3.60 3.21 3.02 3.02 2.96 2.89 2.36 3.06 3.15 3.20 3.01 2.86 200.00 161.08
2012 Q2 3.65 3.65 3.75 3.35 3.16 3.16 3.09 3.02 2.50 3.19 3.29 3.35 3.15 3.00 200.00 161.08
2012 Q3 3.85 3.85 3.95 3.54 3.34 3.34 3.27 3.20 2.70 3.37 3.48 3.55 3.34 3.18 200.00 161.08
2012 Q4 4.20 4.20 4.30 3.86 3.66 3.66 3.58 3.50 3.04 3.68 3.80 3.90 3.66 3.50 200.00 161.08
2012 Full Year 3.80 3.80 3.90 3.49 3.29 3.29 3.23 3.15 2.65 3.33 3.43 3.50 3.29 3.14 200.00 161.08
2013 4.41 4.50 4.60 4.13 3.85 3.93 3.85 3.76 3.33 3.95 4.07 4.20 3.93 3.78 175.00 135.57
2014 4.81 5.00 5.10 4.59 4.21 4.39 4.30 4.20 3.82 4.40 4.53 4.70 4.39 4.23 150.00 110.06
2015 5.18 5.50 5.60 5.05 4.56 4.84 4.74 4.64 4.31 4.84 4.99 5.20 4.85 4.69 125.00 84.55
2016 5.54 6.00 6.10 5.51 4.89 5.30 5.19 5.08 4.80 5.29 5.45 5.70 5.31 5.14 125.00 84.55
2017 5.89 6.50 6.60 5.97 5.21 5.75 5.64 5.51 5.29 5.74 5.91 6.20 5.77 5.60 127.50 87.10
2018 6.00 6.76 6.86 6.21 5.32 5.99 5.87 5.74 5.55 5.97 6.15 6.46 6.01 5.84 130.05 89.70
2019 6.00 6.89 6.99 6.33 5.32 6.11 5.98 5.85 5.67 6.08 6.27 6.59 6.13 5.95 132.65 92.36
2020 6.00 7.03 7.13 6.46 5.32 6.23 6.11 5.98 5.81 6.21 6.40 6.73 6.26 6.08 135.30 95.06
2021 6.00 7.17 7.27 6.58 5.32 6.36 6.23 6.10 5.95 6.33 6.52 6.87 6.38 6.21 138.01 97.83
2022+ 6.00 +2.0%/yr +2.0%/yr +2.0%/yr 5.32 +2.0%/yr +2.0%/yr +2.0%/yr +2.0%/yr +2.0%/yr +2.0%/yr +2.0%/yr +2.0%/yr +2.0%/yr +2.0%/yr +2.0%/yr
Unless otherwise stated, the gas price reference point is the receipt point on the applicable provincial gas transmission system known as the plant gate.The plant gate price represents the price before raw gas gathering and processing charges are deducted.AECO-C Spot refers to the one month price averaged for the year. Page: 69 of 102
Petroleum ConsultantsGLJ

Table FP-4 (Continued.)GLJ Petroleum Consultants Ltd.
Crude and Natural GasGLJ (2012-01)
Effective January 01, 2012
NYMEX WTI Near NationalMonth Futures Contract Brent Blend Balancing
Bank of Crude Oil at Crude Oil Henry Hub Nova Scotia PointCanada Cushing Oklahoma FOB North Sea Spot Goldboro (UK)
Average Noon Can. - UK Can. - EUROExchange Exchange Exchange Then Then Then Then Then Then Then Then Then Then
Inflation Rate Rate Rate Current Current Current Current Current Current Current Current Current CurrentYear % $US/$C $C/GBP $C/EURO $US/bbl $C/bbl $US/bbl $C/bbl $US/MMbtu $C/MMbtu $US/MMbtu $C/MMbtu $US/MMbtu C$/MMbtu
2002 2.3 0.637 2.3587 1.4266 26.08 40.93 25.02 39.27 3.36 5.27 2.70 4.23 2.58 4.05
2003 2.8 0.716 2.2877 1.5229 31.07 43.60 28.47 39.93 5.47 7.67 5.16 7.31 3.38 4.69
2004 1.8 0.770 2.3837 1.5559 41.38 53.65 38.02 49.29 6.18 8.02 5.62 7.32 4.76 6.13
2005 2.2 0.826 2.2057 1.4523 56.58 68.42 55.14 66.69 9.00 10.83 8.19 9.87 7.51 9.02
2006 2.0 0.882 2.0898 1.3686 66.22 75.08 66.16 75.01 6.99 7.94 6.20 7.04 8.34 9.48
2007 2.2 0.935 2.1475 1.4361 72.39 76.89 72.71 77.33 7.12 7.65 6.33 6.84 6.14 6.44
2008 2.4 0.943 1.9605 1.5480 99.64 104.27 98.30 102.81 8.90 9.36 8.32 8.77 11.41 12.12
2009 0.4 0.880 1.7799 1.5850 61.78 69.57 62.50 70.47 4.16 4.75 3.35 3.87 4.95 5.68
2010 1.8 0.971 1.5928 1.3671 79.52 81.85 80.25 82.58 4.40 4.53 3.83 3.96 6.39 6.58
2011 3.0 1.012 1.5863 1.3764 94.83 93.68 110.63 109.32 4.03 3.98 3.41 3.65 9.38 8.49
2012 Q1 2.0 0.980 1.6000 1.3500 97.00 98.98 105.00 107.14 3.50 3.57 3.95 4.03 9.13 9.32
2012 Q2 2.0 0.980 1.6000 1.3500 97.00 98.98 105.00 107.14 3.65 3.72 2.42 2.47 9.13 9.32
2012 Q3 2.0 0.980 1.6000 1.3500 97.00 98.98 105.00 107.14 3.85 3.93 3.11 3.18 9.13 9.32
2012 Q4 2.0 0.980 1.6000 1.3500 97.00 98.98 105.00 107.14 4.20 4.29 3.46 3.53 9.13 9.32
2012 Full Year 2.0 0.980 1.6000 1.3500 97.00 98.98 105.00 107.14 3.80 3.88 3.24 3.30 9.13 9.32
2013 2.0 0.980 1.6000 1.3500 100.00 102.04 105.00 107.14 4.50 4.59 3.85 3.93 9.55 9.74
2014 2.0 0.980 1.6000 1.3500 100.00 102.04 102.00 104.08 5.00 5.10 4.35 4.44 9.71 9.91
2015 2.0 0.980 1.6000 1.3500 100.00 102.04 100.00 102.04 5.50 5.61 4.84 4.94 10.00 10.20
2016 2.0 0.980 1.6000 1.3500 100.00 102.04 100.00 102.04 6.00 6.12 5.34 5.45 10.00 10.20
2017 2.0 0.980 1.6000 1.3500 100.00 102.04 100.00 102.04 6.50 6.63 5.83 5.95 10.00 10.20
2018 2.0 0.980 1.6000 1.3500 101.35 103.42 101.35 103.42 6.76 6.90 6.09 6.21 10.14 10.34
2019 2.0 0.980 1.6000 1.3500 103.38 105.49 103.38 105.49 6.89 7.03 6.22 6.34 10.34 10.55
2020 2.0 0.980 1.6000 1.3500 105.45 107.60 105.45 107.60 7.03 7.17 6.36 6.49 10.55 10.76
2021 2.0 0.980 1.6000 1.3500 107.56 109.76 107.56 109.76 7.17 7.32 6.49 6.63 10.76 10.98
2022+ 2.0 0.980 1.6000 1.3500 +2.0%/yr +2.0%/yr +2.0%/yr +2.0%/yr +2.0%/yr +2.0%/yr +2.0%/yr +2.0%/yr +2.0%/yr +2.0%/yr
Historical futures contract price is an average of the daily settlement price of the near month contract over the calendar month.
Page: 70 of 102
Petroleum ConsultantsGLJ
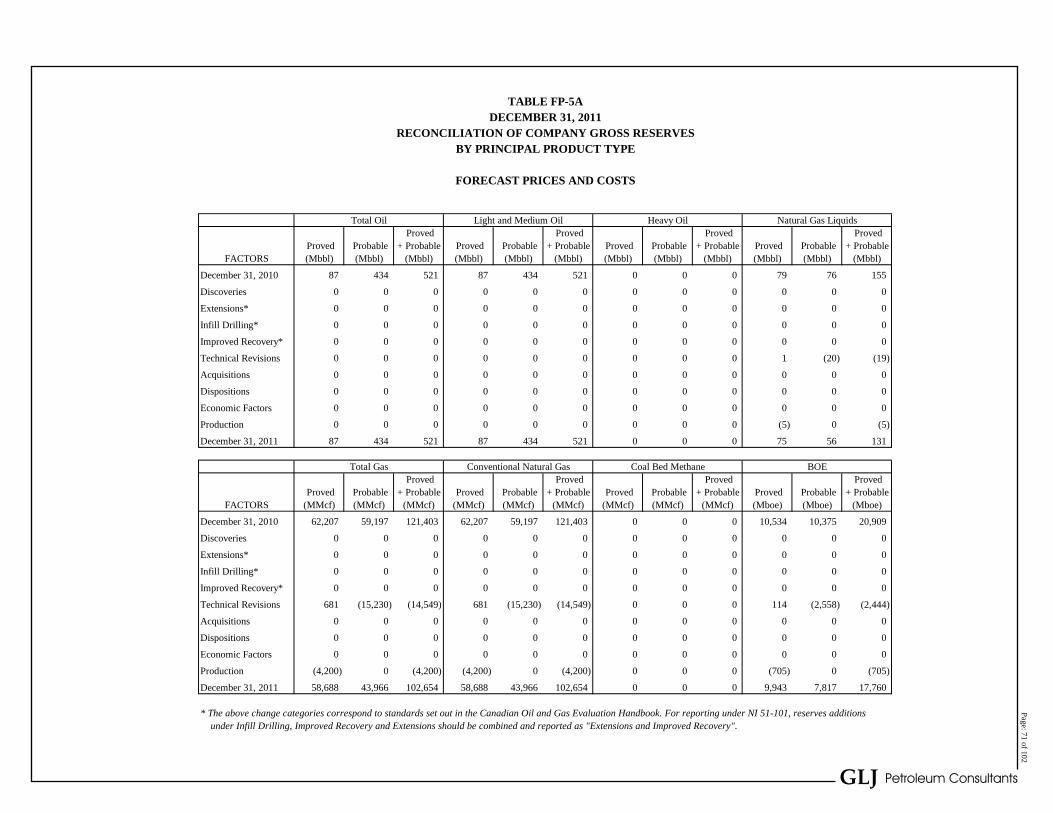
Total Oil Light and Medium Oil Heavy Oil Natural Gas Liquids Proved Proved Proved Proved
Proved Probable + Probable Proved Probable + Probable Proved Probable + Probable Proved Probable + ProbableFACTORS (Mbbl) (Mbbl) (Mbbl) (Mbbl) (Mbbl) (Mbbl) (Mbbl) (Mbbl) (Mbbl) (Mbbl) (Mbbl) (Mbbl)
December 31, 2010 87 434 521 87 434 521 0 0 0 79 76 155
Discoveries 0 0 0 0 0 0 0 0 0 0 0 0
Extensions* 0 0 0 0 0 0 0 0 0 0 0 0
Infill Drilling* 0 0 0 0 0 0 0 0 0 0 0 0
Improved Recovery* 0 0 0 0 0 0 0 0 0 0 0 0
Technical Revisions 0 0 0 0 0 0 0 0 0 1 (20) (19)
Acquisitions 0 0 0 0 0 0 0 0 0 0 0 0
Dispositions 0 0 0 0 0 0 0 0 0 0 0 0
Economic Factors 0 0 0 0 0 0 0 0 0 0 0 0
Production 0 0 0 0 0 0 0 0 0 (5) 0 (5)
December 31, 2011 87 434 521 87 434 521 0 0 0 75 56 131
Total Gas Conventional Natural Gas Coal Bed Methane BOE Proved Proved Proved Proved
Proved Probable + Probable Proved Probable + Probable Proved Probable + Probable Proved Probable + ProbableFACTORS (MMcf) (MMcf) (MMcf) (MMcf) (MMcf) (MMcf) (MMcf) (MMcf) (MMcf) (Mboe) (Mboe) (Mboe)
December 31, 2010 62,207 59,197 121,403 62,207 59,197 121,403 0 0 0 10,534 10,375 20,909
Discoveries 0 0 0 0 0 0 0 0 0 0 0 0
Extensions* 0 0 0 0 0 0 0 0 0 0 0 0
Infill Drilling* 0 0 0 0 0 0 0 0 0 0 0 0
Improved Recovery* 0 0 0 0 0 0 0 0 0 0 0 0
Technical Revisions 681 (15,230) (14,549) 681 (15,230) (14,549) 0 0 0 114 (2,558) (2,444)
Acquisitions 0 0 0 0 0 0 0 0 0 0 0 0
Dispositions 0 0 0 0 0 0 0 0 0 0 0 0
Economic Factors 0 0 0 0 0 0 0 0 0 0 0 0
Production (4,200) 0 (4,200) (4,200) 0 (4,200) 0 0 0 (705) 0 (705)
December 31, 2011 58,688 43,966 102,654 58,688 43,966 102,654 0 0 0 9,943 7,817 17,760
* The above change categories correspond to standards set out in the Canadian Oil and Gas Evaluation Handbook. For reporting under NI 51-101, reserves additions under Infill Drilling, Improved Recovery and Extensions should be combined and reported as "Extensions and Improved Recovery".
TABLE FP-5ADECEMBER 31, 2011
RECONCILIATION OF COMPANY GROSS RESERVESBY PRINCIPAL PRODUCT TYPE
FORECAST PRICES AND COSTS
Page: 71 of 102
Petroleum ConsultantsGLJ

Total Oil Light and Medium Oil Heavy Oil Natural Gas Liquids Proved Proved Proved Proved
Proved Probable + Probable Proved Probable + Probable Proved Probable + Probable Proved Probable + ProbableFACTORS (Mbbl) (Mbbl) (Mbbl) (Mbbl) (Mbbl) (Mbbl) (Mbbl) (Mbbl) (Mbbl) (Mbbl) (Mbbl) (Mbbl)
December 31, 2009 87 434 521 87 434 521 0 0 0 95 81 176
Discoveries 0 0 0 0 0 0 0 0 0 0 0 0
Extensions* 0 0 0 0 0 0 0 0 0 0 0 0
Infill Drilling* 0 0 0 0 0 0 0 0 0 0 0 0
Improved Recovery* 0 0 0 0 0 0 0 0 0 0 0 0
Technical Revisions 0 0 0 0 0 0 0 0 0 (9) (5) (15)
Acquisitions 0 0 0 0 0 0 0 0 0 0 0 0
Dispositions 0 0 0 0 0 0 0 0 0 0 0 0
Economic Factors 0 0 0 0 0 0 0 0 0 0 0 0
Production 0 0 0 0 0 0 0 0 0 (6) 0 (6)
December 31, 2010 87 434 521 87 434 521 0 0 0 79 76 155
Total Gas Conventional Natural Gas Coal Bed Methane BOE Proved Proved Proved Proved
Proved Probable + Probable Proved Probable + Probable Proved Probable + Probable Proved Probable + ProbableFACTORS (MMcf) (MMcf) (MMcf) (MMcf) (MMcf) (MMcf) (MMcf) (MMcf) (MMcf) (Mboe) (Mboe) (Mboe)
December 31, 2009 74,313 63,283 137,596 74,313 63,283 137,596 0 0 0 12,567 11,062 23,629
Discoveries 0 0 0 0 0 0 0 0 0 0 0 0
Extensions* 0 0 0 0 0 0 0 0 0 0 0 0
Infill Drilling* 0 0 0 0 0 0 0 0 0 0 0 0
Improved Recovery* 0 0 0 0 0 0 0 0 0 0 0 0
Technical Revisions (7,287) (4,087) (11,374) (7,287) (4,087) (11,374) 0 0 0 (1,224) (687) (1,911)
Acquisitions 0 0 0 0 0 0 0 0 0 0 0 0
Dispositions 0 0 0 0 0 0 0 0 0 0 0 0
Economic Factors 0 0 0 0 0 0 0 0 0 0 0 0
Production (4,819) 0 (4,819) (4,819) 0 (4,819) 0 0 0 (809) 0 (809)
December 31, 2010 62,207 59,197 121,403 62,207 59,197 121,403 0 0 0 10,534 10,375 20,909
* The above change categories correspond to standards set out in the Canadian Oil and Gas Evaluation Handbook. For reporting under NI 51-101, reserves additions under Infill Drilling, Improved Recovery and Extensions should be combined and reported as "Extensions and Improved Recovery".
DECEMBER 31, 2010RECONCILIATION OF COMPANY GROSS RESERVES
BY PRINCIPAL PRODUCT TYPE
FORECAST PRICES AND COSTS
TABLE FP-5B
Page: 72 of 102
Petroleum ConsultantsGLJ

Table FP-6Company: Corridor Resources Inc. Reserve Class: VariousProperty: Corporate Development Class: ClassificationsDescription: After Tax Analysis Pricing: GLJ (2012-01)
Effective Date: December 31, 2011
Undeveloped Reserves Attributed in Current Year
Proved Undeveloped Reserves
Conventional Natural GasL&M Oil (Mbbl) Heavy Oil (Mbbl) Natural Gas (MMcf) Liquids (Mbbl) BOE (Mbbl)
Attributed Current Attributed Current Attributed Current Attributed Current Attributed CurrentThis Year* Total This Year Total This Year Total This Year Total This Year Total
0 87 0 0 0 36,739 0 47 0 6,257
Probable Undeveloped Reserves
Conventional Natural GasL&M Oil (Mbbl) Heavy Oil (Mbbl) Natural Gas (MMcf) Liquids (Mbbl) BOE (Mbbl)
Attributed Current Attributed Current Attributed Current Attributed Current Attributed CurrentThis Year Total This Year Total This Year Total This Year Total This Year Total
0 434 0 0 3,489 38,016 4 49 586 6,818
* Refers to reserves first attributed in this fiscal year ending on the effective date.
BOE Factors: HVY OIL 1.0 RES GAS 6.0 PROPANE 1.0 ETHANE 1.0COND 1.0 SLN GAS 6.0 BUTANE 1.0 SULPHUR 0.0
1121357 Class (A,C,I,R), GLJ (2012-01), cs7a March 13, 2012 12:53:08
Page: 73 of 102
Petroleum ConsultantsGLJ

Table FP-7Company: Corridor Resources Inc. Reserve Class: VariousProperty: Corporate Development Class: ClassificationsDescription: After Tax Analysis Pricing: GLJ (2012-01)
Effective Date: December 31, 2011
Company Annual Capital Expenditures (M$)
Year Totals10%
Entity Description 2012 2013 2014 2015 2016 2017 2018 2019 2020 2021 2022 2023 Subtotal Remainder Total Discounted
Proved Producing 0 0 0 0 0 0 0 0 0 0 0 0 0 0 0 0
Total Proved 0 13,306 21,193 21,882 12,600 3,213 0 0 0 0 0 0 72,193 0 72,193 54,016
Total Proved Plus Probable 0 19,242 39,358 31,146 37,799 9,639 0 0 0 0 0 0 137,184 0 137,184 100,326
Total PPP 0 19,548 45,413 37,323 52,757 25,703 19,663 10,028 0 0 0 0 210,435 0 210,435 144,528
1121357 Class (A,C,I,R), GLJ (2012-01), cs4 February 16, 2012 12:54:04
Page: 74 of 102
Petroleum ConsultantsGLJ

Table FP-8Company: Corridor Resources Inc. Reserve Class: VariousProperty: Corporate Development Class: ClassificationsDescription: After Tax Analysis Pricing: GLJ (2012-01)
Effective Date: December 31, 2011
Company Annual Abandonment Costs (M$)
Year Totals10%
Entity Description 2012 2013 2014 2015 2016 2017 2018 2019 2020 2021 2022 2023 Subtotal Remainder Total Discounted
Proved Producing 0 510 390 0 0 138 0 144 146 0 305 311 1,944 4,554 6,498 2,217
Total Proved 0 510 390 0 0 138 0 144 146 0 305 311 1,944 11,473 13,417 2,775
Total Proved Plus Probable 0 0 520 398 0 0 0 144 0 149 0 155 1,367 17,999 19,366 2,439
Total PPP 0 0 0 531 0 414 0 0 0 0 0 0 945 28,828 29,773 1,894
1121357 Class (A,C,I,R), GLJ (2012-01), cs5 February 16, 2012 12:54:05
Page: 75 of 102
Petroleum ConsultantsGLJ

Table FP-9Company: Corridor Resources Inc. Reserve Class: VariousProperty: Corporate Development Class: ClassificationsDescription: After Tax Analysis Pricing: GLJ (2012-01)
Effective Date: December 31, 2011
Summary of First Year Production and Oil and Gas Reserves
2012 Average Daily Production Reserves
Light and Heavy Natural Natural Gas Oil Light and Heavy Natural OilMedium Oil Oil Gas Liquids Equivalent Medium Oil Oil Gas Natural Gas Equivalent
LiquidsCompny Compny Compny Compny Compny Compny Compny Compny Compny Compny Compny Compny Compny Compny Compny Compny Compny Compny
Gross Net Gross Net Gross Net Gross Net Gross Net Gross Net Gross Net Gross Net Compny Compny Gross NetEntity Description bbl/d bbl/d bbl/d bbl/d Mcf/d Mcf/d bbl/d bbl/d bbl/d bbl/d Mbbl Mbbl Mbbl Mbbl MMcf MMcf Gross Net Mboe Mboe
Proved ProducingMcCully 0 0 0 0 9,348 8,834 12 11 1,570 1,484 0 0 0 0 21,949 20,944 28 27 3,686 3,517
Total: Proved Producing 0 0 0 0 9,348 8,834 12 11 1,570 1,484 0 0 0 0 21,949 20,944 28 27 3,686 3,517
Proved Developed NonproducingMcCully 0 0 0 0 0 0 0 0 0 0 0 0 0 0 0 0 0 0 0 0
Total: Proved Developed Nonproducing 0 0 0 0 0 0 0 0 0 0 0 0 0 0 0 0 0 0 0 0
Proved UndevelopedMcCully 0 0 0 0 0 0 0 0 0 0 87 79 0 0 36,739 33,249 47 42 6,257 5,662
Total: Proved Undeveloped 0 0 0 0 0 0 0 0 0 0 87 79 0 0 36,739 33,249 47 42 6,257 5,662
Total ProvedMcCully 0 0 0 0 9,348 8,834 12 11 1,570 1,484 87 79 0 0 58,688 54,192 75 69 9,943 9,180
Total: Total Proved 0 0 0 0 9,348 8,834 12 11 1,570 1,484 87 79 0 0 58,688 54,192 75 69 9,943 9,180
Total ProbableMcCully 0 0 0 0 204 193 0 0 34 32 434 393 0 0 43,967 39,955 56 51 7,818 7,103
Total: Total Probable 0 0 0 0 204 193 0 0 34 32 434 393 0 0 43,967 39,955 56 51 7,818 7,103
Total Proved Plus ProbableMcCully 0 0 0 0 9,553 9,027 12 12 1,604 1,516 521 471 0 0 102,654 94,147 131 120 17,761 16,282
Total: Total Proved Plus Probable 0 0 0 0 9,553 9,027 12 12 1,604 1,516 521 471 0 0 102,654 94,147 131 120 17,761 16,282
Total PPPMcCully 0 0 0 0 9,743 9,207 12 12 1,636 1,546 694 628 0 0 216,732 197,558 277 252 37,093 33,807
Total: Total PPP 0 0 0 0 9,743 9,207 12 12 1,636 1,546 694 628 0 0 216,732 197,558 277 252 37,093 33,807
BOE Factors: HVY OIL 1.0 RES GAS 6.0 PROPANE 1.0 ETHANE 1.0COND 1.0 SLN GAS 6.0 BUTANE 1.0 SULPHUR 0.0
1121357 Class (A,B1,B2,C,F,I,R), GLJ (2012-01), cs6 March 13, 2012 10:15:35
Page: 76 of 102
Petroleum ConsultantsGLJ

Page: 77 of 102
Petroleum ConsultantsGLJ
AFTER TAX ANALYSIS
TABLE OF CONTENTS
Page
DISCUSSION 78
SUMMARY OF RESERVES AND VALUES 79
ECONOMIC FORECASTSProved Producing 80Proved Undeveloped 83Total Proved 86Total Probable 89Total Proved Plus Probable 92Total PPP 95
March 13, 2012 15:51:06

AFTER TAX ANALYSIS
Canadian income taxes were calculated based on currently legislated federal and provincial tax
rates, tax regulations and tax pool information provided by the Company. After tax values for
reserves development status or production status subcategories (i.e. developed, undeveloped,
producing, non-producing) are calculated by difference.
Tax Pools
The following tax pools as of the effective date were included in the income tax calculations:
Tax Pool Classification Write-Off Rate (%)_ Tax Pool (M$) Canadian Oil and Gas Property Expense (COGPE) 10 3,091
Canadian Exploration Expense (CEE) 100 72,387
Non-Capital Losses 100 626
Canadian Development Expense (CDE) 30 80,063
Capital Cost Allowance: (CCA)
Class 41 25 20,845
Class 10 30 18,716
Tax Rates Federal income tax calculations incorporate recently enacted reductions in general corporate
income tax rates as follows:
Year Federal Income
Tax Rate 2012+ 15.0%
Allocation of revenues to Canadian provinces for income tax purposes depends on several
factors in addition to the provincial origin of the resource revenues. The average future annual
provincial tax rate has been calculated based on an allocation of provincial resource revenues and
their respective tax rate as follows:
Year Alberta
Tax Rate Alberta
Allocation N.S.
Tax Rate N.S.
Allocation N.B.
Tax Rate N.B.
Allocation Man.
Tax Rate Man.
Allocation Avg. Ann. Tax Rate
2011+ 10.00% % 10.00% 65% 10.00% 35% 12.00% 0% 12.75%
Company total after tax economic forecasts for all reserves categories are attached.
Page: 78 of 102
Petroleum ConsultantsGLJ

Company: Corridor Resources Inc. Reserve Class: VariousProperty: Corporate Development Class: ClassificationsDescription: After Tax Analysis Pricing: GLJ (2012-01)
Effective Date: December 31, 2011
Summary of Reserves and Values
Proved TotalDeveloped Proved
Proved Non- Proved Total Total Plus TotalProducing producing Undeveloped Proved Probable Probable PPP
MARKETABLE RESERVESLight/Medium Oil (Mbbl)Total Company Interest 0 0 87 87 434 521 694Working Interest 0 0 87 87 434 521 694Net After Royalty 0 0 79 79 393 471 628
Gas (MMcf)Total Company Interest 21,949 0 36,739 58,688 43,967 102,654 216,732Working Interest 21,949 0 36,739 58,688 43,967 102,654 216,732Net After Royalty 20,944 0 33,249 54,192 39,955 94,147 197,558
Natural Gas Liquids (Mbbl)Total Company Interest 28 0 47 75 56 131 277Working Interest 28 0 47 75 56 131 277Net After Royalty 27 0 42 69 51 120 252
Oil Equivalent (Mbbl)Total Company Interest 3,686 0 6,257 9,943 7,818 17,761 37,093Working Interest 3,686 0 6,257 9,943 7,818 17,761 37,093Net After Royalty 3,517 0 5,662 9,180 7,103 16,282 33,807
BEFORE TAX PRESENT VALUE (M$)0% 68,004 0 151,236 219,240 244,854 464,094 1,217,0075% 55,395 0 83,361 138,756 127,138 265,894 593,7148% 49,612 0 60,516 110,128 91,823 201,951 426,51210% 46,325 0 49,417 95,742 75,405 171,147 351,48812% 43,416 0 40,621 84,037 62,717 146,754 294,51215% 39,645 0 30,547 70,192 48,508 118,701 231,56620% 34,602 0 19,232 53,834 32,905 86,738 163,152
AFTER TAX PRESENT VALUE (M$)0% 68,004 0 143,176 211,180 176,697 387,877 930,4905% 55,395 0 80,594 135,989 94,147 230,136 466,7808% 49,612 0 59,004 108,616 69,137 177,753 339,97810% 46,325 0 48,392 94,717 57,408 152,124 282,51612% 43,416 0 39,919 83,334 48,269 131,603 238,57015% 39,645 0 30,141 69,786 37,922 107,708 189,63220% 34,602 0 19,062 53,664 26,345 80,009 135,843
BOE Factors: HVY OIL 1.0 RES GAS 6.0 PROPANE 1.0 ETHANE 1.0COND 1.0 SLN GAS 6.0 BUTANE 1.0 SULPHUR 0.0
Run Date: February 16, 2012 11:30:22
1121357 Class (A,B1,B2,C,F,I,R), GLJ (2012-01), psum February 16, 2012 12:52:59
Page: 79 of 102
Petroleum ConsultantsGLJ

Company: Corridor Resources Inc. Reserve Class: ProvedProperty: Corporate Development Class: ProducingDescription: After Tax Analysis Pricing: GLJ (2012-01)
Effective Date: December 31, 2011
Economic Forecast
PRODUCTION FORECAST
Residue Gas Production Condensate Production Total Oil Equiv. Production
Company Company Company Company Company Company CompanyGas Daily Yearly Net Yearly Price Daily Yearly Net Yearly Price Daily Yearly Net Yearly Price
Year Wells Mcf/d MMcf MMcf $/Mcf bbl/d Mbbl Mbbl $/bbl boe/d Mboe Mboe $/boe
2012 22 9,348 3,412 3,224 3.50 12 4 4 86.50 1,570 573 542 21.502013 22 7,733 2,823 2,690 4.17 10 4 3 86.50 1,299 474 452 25.482014 19 6,409 2,339 2,243 4.70 8 3 3 83.44 1,076 393 377 28.652015 17 5,131 1,873 1,805 5.24 7 2 2 81.40 862 315 303 31.822016 17 4,358 1,591 1,545 5.77 6 2 2 81.40 732 267 259 35.002017 17 3,837 1,400 1,368 6.31 5 2 2 81.40 644 235 230 38.192018 17 3,409 1,244 1,195 6.59 4 2 2 82.78 573 209 201 39.842019 17 3,064 1,118 1,050 6.73 4 1 1 84.85 515 188 176 40.692020 16 2,768 1,010 955 6.88 4 1 1 86.96 465 170 160 41.602021 16 2,490 909 864 7.03 3 1 1 89.11 418 153 145 42.512022 16 2,240 818 784 7.17 3 1 1 91.31 376 137 132 43.362023 15 1,998 729 706 7.31 3 1 1 93.55 336 122 119 44.23Sub. 19,267 18,430 5.33 25 24 85.12 3,236 3,095 32.41Rem. 2,682 2,514 7.73 3 3 100.10 450 422 46.78Tot. 21,949 20,944 5.63 28 27 86.95 3,686 3,517 34.17
REVENUE AND EXPENSE FORECAST
Revenue Before BurdensRoyalty Burdens Gas Processing Total Net
Working Interest Royalty Company Pre-Processing Allowance Royalty Revenue Operating ExpensesInterest Interest After After
Oil Gas NGL+Sul Total Total Total Crown Other Crown Other Process. Royalty Fixed Variable TotalYear M$ M$ M$ M$ M$ M$ M$ M$ M$ M$ M$ M$ M$ M$ M$
2012 0 11,943 377 12,320 0 12,320 678 0 0 0 678 11,642 2,766 648 3,4142013 0 11,767 312 12,079 0 12,079 568 0 0 0 568 11,511 2,802 547 3,3492014 0 11,004 249 11,253 0 11,253 461 0 0 0 461 10,792 2,819 462 3,2822015 0 9,813 195 10,007 0 10,007 360 0 0 0 360 9,647 2,829 378 3,2062016 0 9,185 165 9,350 0 9,350 271 0 0 0 271 9,079 2,877 327 3,2042017 0 8,835 145 8,980 0 8,980 207 0 0 0 207 8,774 2,930 294 3,2232018 0 8,195 131 8,326 0 8,326 333 0 0 0 333 7,993 2,980 266 3,2462019 0 7,522 121 7,643 0 7,643 466 0 0 0 466 7,177 3,039 244 3,2842020 0 6,947 112 7,059 0 7,059 388 0 0 0 388 6,671 3,084 225 3,3092021 0 6,384 103 6,488 0 6,488 318 0 0 0 318 6,170 3,134 206 3,3402022 0 5,860 95 5,955 0 5,955 244 0 0 0 244 5,711 3,176 189 3,3652023 0 5,330 87 5,417 0 5,417 173 0 0 0 173 5,243 3,203 172 3,375Sub. 0 102,784 2,093 104,878 0 104,878 4,468 0 0 0 4,468 100,410 35,637 3,959 39,597Rem. 0 20,728 343 21,070 0 21,070 1,342 0 0 0 1,342 19,728 16,538 670 17,208Tot. 0 123,512 2,436 125,948 0 125,948 5,810 0 0 0 5,810 120,138 52,175 4,629 56,805Disc 0 71,531 1,533 73,064 0 73,064 3,235 0 0 0 3,235 69,828 25,070 2,860 27,930
Net Net Capital Investment Before Tax Cash FlowMineral Capital NPI Prod'n Other Aband. Oper.
Tax Tax Burden Revenue Income Costs Income Dev. Plant Tang. Total Annual Cum. 10.0% DcfYear M$ M$ M$ M$ M$ M$ M$ M$ M$ M$ M$ M$ M$ M$
2012 0 0 0 8,228 1,391 0 9,619 0 0 0 0 9,619 9,619 9,1712013 0 0 0 8,163 1,125 510 8,778 0 0 0 0 8,778 18,397 16,7802014 0 0 0 7,510 967 390 8,087 0 0 0 0 8,087 26,484 23,1522015 0 0 0 6,441 960 0 7,400 0 0 0 0 7,400 33,884 28,4532016 0 0 0 5,875 895 0 6,770 0 0 0 0 6,770 40,654 32,8622017 0 0 0 5,550 769 138 6,181 0 0 0 0 6,181 46,835 36,5222018 0 0 0 4,747 677 0 5,424 0 0 0 0 5,424 52,259 39,4412019 0 0 0 3,893 601 144 4,350 0 0 0 0 4,350 56,609 41,5692020 0 0 0 3,362 540 146 3,755 0 0 0 0 3,755 60,364 43,2392021 0 0 0 2,830 471 0 3,301 0 0 0 0 3,301 63,666 44,5742022 0 0 0 2,346 426 305 2,467 0 0 0 0 2,467 66,133 45,4812023 0 0 0 1,869 388 311 1,946 0 0 0 0 1,946 68,079 46,132Sub. 0 0 0 60,813 9,209 1,944 68,079 0 0 0 0 68,079 68,079 46,132Rem. 0 0 0 2,520 1,960 4,554 -74 0 0 0 0 -74 68,004 46,325Tot. 0 0 0 63,334 11,169 6,498 68,004 0 0 0 0 68,004 68,004 46,325Disc 0 0 0 41,898 6,644 2,217 46,325 0 0 0 0 46,325 46,325 46,325
1121357 Proved Producing, GLJ (2012-01), pri February 16, 2012 12:53:04
Page: 80 of 102
Petroleum ConsultantsGLJ

Page 2
AFTER TAX ANALYSIS
Tax Pool Balances Incl. Current Year Additions Depreciation & WriteoffsOper.
Income CCA COGPE CDE CEE Other CCA COGPE CDE CEE Other TotalYear M$ M$ M$ M$ M$ M$ M$ M$ M$ M$ M$ M$
2012 9,619 39,561 3,091 80,063 72,387 626 5,960 309 24,019 0 0 30,2882013 8,778 33,601 2,782 56,044 72,387 626 4,627 278 16,813 0 0 21,7192014 8,087 28,974 2,504 39,231 72,387 626 3,621 250 11,769 0 0 15,6412015 7,400 25,353 2,253 27,462 72,387 626 2,861 225 8,238 0 0 11,3252016 6,770 22,492 2,028 19,223 72,387 626 2,285 203 5,767 0 0 8,2542017 6,181 20,207 1,825 13,456 72,387 626 1,847 183 4,037 0 115 6,1812018 5,424 18,360 1,643 9,419 72,387 511 1,513 164 2,826 409 511 5,4242019 4,350 16,847 1,478 6,594 71,978 0 1,258 148 1,978 966 0 4,3502020 3,755 15,588 1,331 4,615 71,012 0 1,062 133 1,385 1,176 0 3,7552021 3,301 14,527 1,198 3,231 69,836 0 910 120 969 1,303 0 3,3012022 2,467 13,617 1,078 2,262 68,534 0 791 108 678 890 0 2,4672023 1,946 12,826 970 1,583 67,644 0 698 97 475 676 0 1,946Sub. 68,079 12,826 970 1,583 67,644 0 27,433 2,218 78,955 5,419 626 114,651Rem. -74 12,826 970 1,583 67,644 0 2,621 357 922 469 0 4,370Tot. 68,004 12,826 970 1,583 67,644 0 30,054 2,576 79,877 5,888 626 119,021Disc 46,325 20,647 1,567 62,949 2,433 343 87,940
Federal Provincial Net Cash Flow Net Cash FlowARTD & Income Before Income Tax After Income Tax
Taxable Tax Income Tax Income Investment TaxIncome Rate Tax Rate Tax Credits Payable Annual Cum. 10.0% Dcf Annual Cum. 10.0% Dcf
Year M$ % M$ % M$ M$ M$ M$ M$ M$ M$ M$ M$
2012 -20,669 15.0 0 12.8 0 0 0 9,619 9,619 9,171 9,619 9,619 9,1712013 -12,940 15.0 0 12.8 0 0 0 8,778 18,397 16,780 8,778 18,397 16,7802014 -7,554 15.0 0 12.8 0 0 0 8,087 26,484 23,152 8,087 26,484 23,1522015 -3,924 15.0 0 12.8 0 0 0 7,400 33,884 28,453 7,400 33,884 28,4532016 -1,485 15.0 0 12.8 0 0 0 6,770 40,654 32,862 6,770 40,654 32,8622017 0 15.0 0 12.8 0 0 0 6,181 46,835 36,522 6,181 46,835 36,5222018 0 15.0 0 12.8 0 0 0 5,424 52,259 39,441 5,424 52,259 39,4412019 0 15.0 0 12.8 0 0 0 4,350 56,609 41,569 4,350 56,609 41,5692020 0 15.0 0 12.8 0 0 0 3,755 60,364 43,239 3,755 60,364 43,2392021 0 15.0 0 12.8 0 0 0 3,301 63,666 44,574 3,301 63,666 44,5742022 0 15.0 0 12.8 0 0 0 2,467 66,133 45,481 2,467 66,133 45,4812023 0 15.0 0 12.8 0 0 0 1,946 68,079 46,132 1,946 68,079 46,132Sub. -46,573 0 0 0 0 68,079 68,079 46,132 68,079 68,079 46,132Rem. -4,444 0 0 0 0 -74 68,004 46,325 -74 68,004 46,325Tot. -51,017 0 0 0 0 68,004 68,004 46,325 68,004 68,004 46,325Disc -41,615 0 0 0 0 46,325 46,325 46,325 46,325 46,325 46,325
SUMMARY OF RESERVES
Remaining Reserves at Jan 01, 2012 Oil Equivalents Reserve Life Indic. (yr)
Working Roy/NPI Total Oil Eq. Company % of Reserve Life HalfProduct Units Interest Interest Company Net Factor Mboe Total Life Index Life
Residue Gas MMcf 21,949 0 21,949 20,944 6.000 3,658 99 17.0 6.4 4.3Gas Heat Content BBtu 23,266 0 23,266 22,200 0.000 0 0 17.0 6.4 4.3Condensate Mbbl 28 0 28 27 1.000 28 1 17.0 6.4 4.3Total: Oil Eq. Mboe 3,686 0 3,686 3,517 1.000 3,686 100 17.0 6.4 4.3
PRODUCT REVENUE AND EXPENSES
Average First Year Unit Values Net Revenue After Royalties
Wellhead Operating Other Prod'n Undisc % of 10% Disc % ofProduct Units Base Price Price Adjust. Price Net Burdens Expenses Expenses Revenue M$ Total M$ Total
Residue Gas $/Mcf 3.29 0.21 3.50 0.19 1.00 0.00 2.31 117,815 98 68,365 98Condensate $/bbl 107.14 -20.64 86.50 4.76 0.00 0.00 81.75 2,323 2 1,463 2Total: Oil Eq. $/boe 20.42 1.08 21.50 1.18 5.96 0.00 14.36 120,138 100 69,828 100
1121357 Proved Producing, GLJ (2012-01), pri February 16, 2012 12:53:04
Page: 81 of 102
Petroleum ConsultantsGLJ

Page 3
REVENUE BURDENS AND NET PRESENT VALUE SUMMARY
Net Present Value Before Income Tax Net Present Value After Income Tax
Revenue Burdens (%) Disc. Prod'n Operating Capital Cash Flow Operating Capital Cash FlowRate Revenue Income Invest. Income Invest.
Initial Average % M$ M$ M$ M$ $/boe M$ M$ M$ $/boe
Crown Royalty 5.5000 4.6130 0.0 63,334 68,004 0.0 68,004 18.45 68,004 0 68,004 18.45Non-crown Royalty 0.0000 0.0000 5.0 50,639 55,395 0.0 55,395 15.03 55,395 0 55,395 15.03Mineral Tax 0.0000 0.0000 8.0 45,033 49,612 0.0 49,612 13.46 49,612 0 49,612 13.46
10.0 41,898 46,325 0.0 46,325 12.57 46,325 0 46,325 12.5712.0 39,154 43,416 0.0 43,416 11.78 43,416 0 43,416 11.7815.0 35,634 39,645 0.0 39,645 10.76 39,645 0 39,645 10.7620.0 30,986 34,602 0.0 34,602 9.39 34,602 0 34,602 9.39
Evaluator: Werth, James P.Run Date: February 16, 2012 11:30:19
1121357 Proved Producing, GLJ (2012-01), pri February 16, 2012 12:53:04
Page: 82 of 102
Petroleum ConsultantsGLJ

Company: Corridor Resources Inc. Reserve Class: ProvedProperty: Corporate Development Class: UndevelopedDescription: After Tax Analysis Pricing: GLJ (2012-01)
Effective Date: December 31, 2011
Economic Forecast
PRODUCTION FORECAST
Light/Medium Oil Production Solution Gas Production Residue Gas Production
Company Wells Company Company Company Company Company CompanyDaily Yearly Net Yearly Price Daily Yearly Net Yearly Price Daily Yearly Net Yearly Price
Year Oil Gas bbl/d Mbbl Mbbl $/bbl Mcf/d MMcf MMcf $/Mcf Mcf/d MMcf MMcf $/Mcf
2012 0 0 0 0 0 0.00 0 0 0 0.00 0 0 0 0.002013 1 5 59 22 20 101.34 46 17 15 4.17 2,546 929 841 4.172014 1 8 65 24 21 98.28 51 19 17 4.70 7,063 2,578 2,333 4.702015 1 13 35 13 12 96.24 27 10 9 5.24 10,478 3,825 3,461 5.242016 1 15 22 8 7 96.24 17 6 6 5.77 11,456 4,181 3,784 5.772017 1 15 15 5 5 96.24 12 4 4 6.31 9,702 3,541 3,205 6.312018 1 15 11 4 4 97.62 9 3 3 6.59 7,788 2,842 2,572 6.592019 1 15 8 3 3 99.69 7 2 2 6.73 6,412 2,340 2,118 6.732020 1 15 7 2 2 101.80 5 2 2 6.88 5,399 1,971 1,783 6.882021 1 15 5 2 2 103.95 4 2 1 7.03 4,594 1,677 1,517 7.032022 1 15 4 2 1 106.15 3 1 1 7.17 3,972 1,450 1,312 7.172023 1 15 4 1 1 108.39 3 1 1 7.31 3,473 1,267 1,147 7.31Sub. 86 78 98.97 67 61 5.21 26,602 24,075 6.09Rem. 1 1 110.67 1 1 7.45 10,069 9,113 8.55Tot. 87 79 99.08 68 61 5.23 36,671 33,187 6.77
Total Gas Production Condensate Production Total Oil + NGL Production
Company Company Company Company Company CompanyDaily Yearly Net Yearly Price Daily Yearly Net Yearly Price Daily Yearly Net Yearly Price
Year Mcf/d MMcf MMcf $/Mcf bbl/d Mbbl Mbbl $/bbl bbl/d Mbbl Mbbl $/bbl
2012 0 0 0 0.00 0 0 0 0.00 0 0 0 0.002013 2,593 946 856 4.17 3 1 1 86.50 63 23 21 100.562014 7,113 2,596 2,350 4.70 9 3 3 83.44 74 27 24 96.462015 10,506 3,835 3,470 5.24 13 5 4 81.40 48 18 16 92.132016 11,473 4,188 3,790 5.77 15 5 5 81.40 37 13 12 90.312017 9,713 3,545 3,209 6.31 12 5 4 81.40 27 10 9 89.532018 7,796 2,846 2,575 6.59 10 4 3 82.78 21 8 7 90.552019 6,419 2,343 2,120 6.73 8 3 3 84.85 17 6 5 92.332020 5,404 1,973 1,785 6.88 7 3 2 86.96 13 5 4 94.192021 4,598 1,678 1,519 7.03 6 2 2 89.11 11 4 4 96.142022 3,975 1,451 1,313 7.17 5 2 2 91.31 9 3 3 98.162023 3,475 1,269 1,148 7.31 4 2 1 93.55 8 3 3 100.24Sub. 26,669 24,135 6.09 34 31 84.24 120 109 94.80Rem. 10,070 9,113 8.55 13 12 112.97 14 12 112.84Tot. 36,739 33,249 6.76 47 42 92.12 134 121 96.64
Total Oil Equiv. Production
Company CompanyDaily Yearly Net Yearly Price
Year boe/d Mboe Mboe $/boe
2012 0 0 0 0.002013 495 181 163 34.592014 1,260 460 416 32.232015 1,799 657 594 33.072016 1,949 711 644 35.692017 1,646 601 544 38.722018 1,320 482 436 40.322019 1,086 397 359 41.142020 914 334 302 42.032021 777 284 257 42.932022 672 245 222 43.772023 587 214 194 44.63Sub. 4,565 4,131 38.05Rem. 1,692 1,531 51.81Tot. 6,257 5,662 41.77
1121357 Proved Undeveloped, GLJ (2012-01), pri February 16, 2012 12:53:13
Page: 83 of 102
Petroleum ConsultantsGLJ

Page 2
REVENUE AND EXPENSE FORECAST
Revenue Before BurdensRoyalty Burdens Gas Processing Total Net
Working Interest Royalty Company Pre-Processing Allowance Royalty Revenue Operating ExpensesInterest Interest After After
Oil Gas NGL+Sul Total Total Total Crown Other Crown Other Process. Royalty Fixed Variable TotalYear M$ M$ M$ M$ M$ M$ M$ M$ M$ M$ M$ M$ M$ M$ M$
2012 0 0 0 0 0 0 0 0 0 0 0 0 0 0 02013 2,197 3,945 104 6,246 0 6,246 593 0 0 0 593 5,653 64 288 3522014 2,329 12,214 277 14,819 0 14,819 1,408 0 0 0 1,408 13,411 178 630 8092015 1,232 20,091 398 21,722 0 21,722 2,064 0 0 0 2,064 19,658 303 838 1,1402016 773 24,178 435 25,387 0 25,387 2,412 0 0 0 2,412 22,975 390 903 1,2922017 528 22,368 368 23,265 0 23,265 2,210 0 0 0 2,210 21,054 424 773 1,1962018 390 18,741 301 19,431 0 19,431 1,846 0 0 0 1,846 17,585 432 630 1,0632019 303 15,757 254 16,314 0 16,314 1,550 0 0 0 1,550 14,764 441 528 9692020 244 13,561 219 14,024 0 14,024 1,332 0 0 0 1,332 12,692 450 452 9022021 200 11,791 191 12,182 0 12,182 1,157 0 0 0 1,157 11,025 459 392 8512022 168 10,398 169 10,735 0 10,735 1,020 0 0 0 1,020 9,715 468 345 8132023 144 9,271 151 9,567 0 9,567 909 0 0 0 909 8,658 477 308 785Sub. 8,507 162,316 2,868 173,691 0 173,691 16,501 0 0 0 16,501 157,190 4,086 6,087 10,173Rem. 89 86,120 1,452 87,661 0 87,661 8,328 0 0 0 8,328 79,333 9,250 2,788 12,039Tot. 8,596 248,436 4,320 261,352 0 261,352 24,828 0 0 0 24,828 236,523 13,337 8,875 22,212Disc 6,122 106,937 1,919 114,978 0 114,978 10,923 0 0 0 10,923 104,055 3,412 4,065 7,476
Net Net Capital Investment Before Tax Cash FlowMineral Capital NPI Prod'n Other Aband. Oper.
Tax Tax Burden Revenue Income Costs Income Dev. Plant Tang. Total Annual Cum. 10.0% DcfYear M$ M$ M$ M$ M$ M$ M$ M$ M$ M$ M$ M$ M$ M$
2012 0 0 0 0 102 0 102 0 0 0 0 102 102 972013 0 0 0 5,301 325 0 5,626 13,306 0 0 13,306 -7,680 -7,578 -6,5602014 0 0 0 12,603 919 0 13,522 21,193 0 0 21,193 -7,671 -15,250 -12,6052015 0 0 0 18,518 1,785 0 20,303 21,882 0 0 21,882 -1,579 -16,829 -13,7362016 0 0 0 21,682 1,763 0 23,446 12,600 0 0 12,600 10,846 -5,983 -6,6732017 0 0 0 19,858 1,418 0 21,276 3,213 0 0 3,213 18,063 12,080 4,0212018 0 0 0 16,522 1,170 0 17,692 0 0 0 0 17,692 29,772 13,5432019 0 0 0 13,795 983 0 14,778 0 0 0 0 14,778 44,550 20,7732020 0 0 0 11,789 840 0 12,629 0 0 0 0 12,629 57,179 26,3912021 0 0 0 10,174 723 0 10,897 0 0 0 0 10,897 68,076 30,7972022 0 0 0 8,902 631 0 9,533 0 0 0 0 9,533 77,609 34,3012023 0 0 0 7,873 556 0 8,429 0 0 0 0 8,429 86,038 37,118Sub. 0 0 0 147,017 11,214 0 158,231 72,193 0 0 72,193 86,038 86,038 37,118Rem. 0 0 0 67,295 4,822 6,919 65,198 0 0 0 0 65,198 151,236 49,417Tot. 0 0 0 214,312 16,036 6,919 223,429 72,193 0 0 72,193 151,236 151,236 49,417Disc 0 0 0 96,578 7,412 558 103,433 54,016 0 0 54,016 49,417 49,417 49,417
AFTER TAX ANALYSIS
Tax Pool Balances Incl. Current Year Additions Depreciation & WriteoffsOper.
Income CCA COGPE CDE CEE Other CCA COGPE CDE CEE Other TotalYear M$ M$ M$ M$ M$ M$ M$ M$ M$ M$ M$ M$
2012 102 0 0 0 0 0 0 0 0 0 0 02013 5,626 0 0 13,306 0 0 0 0 3,992 0 0 3,9922014 13,522 0 0 30,507 0 0 0 0 9,152 0 0 9,1522015 20,303 0 0 43,237 0 0 0 0 12,971 2,781 626 16,3782016 23,446 0 0 42,865 -2,781 -626 0 0 12,860 9,101 0 21,9612017 21,276 0 0 33,219 -11,883 -626 0 0 9,966 11,425 -115 21,2762018 17,692 0 0 23,253 -23,308 -511 0 0 6,976 11,227 -511 17,6922019 14,778 0 0 16,277 -34,535 0 0 0 4,883 9,894 0 14,7782020 12,629 0 0 11,394 -44,429 0 0 0 3,418 9,211 0 12,6292021 10,897 0 0 7,976 -53,641 0 0 0 2,393 8,504 0 10,8972022 9,533 0 0 5,583 -62,145 0 0 0 1,675 5,499 0 7,1742023 8,429 0 0 3,908 -67,644 0 0 0 1,172 -676 0 497Sub. 158,231 0 0 3,908 -67,644 0 0 0 69,458 66,968 0 136,426Rem. 65,198 0 0 3,908 -67,644 0 5,698 465 2,922 -469 0 8,615Tot. 223,429 0 0 3,908 -67,644 0 5,698 465 72,379 66,499 0 145,040Disc 103,433 550 53 44,592 34,761 105 80,060
1121357 Proved Undeveloped, GLJ (2012-01), pri February 16, 2012 12:53:13
Page: 84 of 102
Petroleum ConsultantsGLJ

Page 3Federal Provincial Net Cash Flow Net Cash Flow
ARTD & Income Before Income Tax After Income TaxTaxable Tax Income Tax Income Investment TaxIncome Rate Tax Rate Tax Credits Payable Annual Cum. 10.0% Dcf Annual Cum. 10.0% Dcf
Year M$ % M$ % M$ M$ M$ M$ M$ M$ M$ M$ M$
2012 102 15.0 0 12.8 0 0 0 102 102 97 102 102 972013 1,634 15.0 0 12.8 0 0 0 -7,680 -7,578 -6,560 -7,680 -7,578 -6,5602014 4,370 15.0 0 12.8 0 0 0 -7,671 -15,250 -12,605 -7,671 -15,250 -12,6052015 3,924 15.0 0 12.8 0 0 0 -1,579 -16,829 -13,736 -1,579 -16,829 -13,7362016 1,485 15.0 0 12.8 0 0 0 10,846 -5,983 -6,673 10,846 -5,983 -6,6732017 0 15.0 0 12.8 0 0 0 18,063 12,080 4,021 18,063 12,080 4,0212018 0 15.0 0 12.8 0 0 0 17,692 29,772 13,543 17,692 29,772 13,5432019 0 15.0 0 12.8 0 0 0 14,778 44,550 20,773 14,778 44,550 20,7732020 0 15.0 0 12.8 0 0 0 12,629 57,179 26,391 12,629 57,179 26,3912021 0 15.0 0 12.8 0 0 0 10,897 68,076 30,797 10,897 68,076 30,7972022 2,359 15.0 0 12.8 0 0 0 9,533 77,609 34,301 9,533 77,609 34,3012023 7,932 15.0 0 12.8 0 0 0 8,429 86,038 37,118 8,429 86,038 37,118Sub. 21,806 0 0 0 0 86,038 86,038 37,118 86,038 86,038 37,118Rem. 56,583 4,357 3,703 0 8,060 65,198 151,236 49,417 57,138 143,176 48,392Tot. 78,389 4,357 3,703 0 8,060 151,236 151,236 49,417 143,176 143,176 48,392Disc 23,372 554 471 0 1,025 49,417 49,417 49,417 48,392 48,392 48,392
SUMMARY OF RESERVES
Remaining Reserves at Jan 01, 2012 Oil Equivalents Reserve Life Indic. (yr)
Working Roy/NPI Total Oil Eq. Company % of Reserve Life HalfProduct Units Interest Interest Company Net Factor Mboe Total Life Index Life
Light/Med Oil Mbbl 87 0 87 79 1.000 87 1 13.0 4.0 2.9Solution Gas MMcf 68 0 68 61 6.000 11 0 13.0 4.0 2.9Residue Gas MMcf 36,671 0 36,671 33,187 6.000 6,112 98 39.0 39.5 7.2Total: Gas MMcf 36,739 0 36,739 33,249 6.000 6,123 98 39.0 38.8 7.2Gas Heat Content BBtu 38,943 0 38,943 35,244 0.000 0 0 39.0 38.8 7.2Condensate Mbbl 47 0 47 42 1.000 47 1 39.0 38.8 7.2Total: Oil+NGL Mbbl 134 0 134 121 1.000 134 2 39.0 5.8 4.0Total: Oil Eq. Mboe 6,257 0 6,257 5,662 1.000 6,257 100 39.0 34.6 7.1
PRODUCT REVENUE AND EXPENSES
Average First Year Unit Values Net Revenue After Royalties
Wellhead Operating Other Prod'n Undisc % of 10% Disc % ofProduct Units Base Price Price Adjust. Price Net Burdens Expenses Expenses Revenue M$ Total M$ Total
Light/Med Oil $/bbl 0.00 0.00 0.00 0.00 0.00 0.00 0.00 7,779 3 5,540 5Solution Gas $/Mcf 0.00 0.00 0.00 0.00 0.00 0.00 0.00 321 0 220 0Residue Gas $/Mcf 0.00 0.00 0.00 0.00 0.00 0.00 0.00 224,514 95 96,558 93Total: Gas $/Mcf 0.00 0.00 0.00 0.00 0.00 0.00 0.00 224,835 95 96,778 93Condensate $/bbl 0.00 0.00 0.00 0.00 0.00 0.00 0.00 3,909 2 1,737 2Total: Oil+NGL $/bbl 0.00 0.00 0.00 0.00 0.00 0.00 0.00 11,688 5 7,277 7Total: Oil Eq. $/boe 0.00 0.00 0.00 0.00 0.00 0.00 0.00 236,523 100 104,055 100
REVENUE BURDENS AND NET PRESENT VALUE SUMMARY
Net Present Value Before Income Tax Net Present Value After Income Tax
Revenue Burdens (%) Disc. Prod'n Operating Capital Cash Flow Operating Capital Cash FlowRate Revenue Income Invest. Income Invest.
Initial Average % M$ M$ M$ M$ $/boe M$ M$ M$ $/boe
Crown Royalty 0.0000 9.5000 0.0 214,312 223,429 72,193 151,236 24.17 215,369 72,193 143,176 22.88Non-crown Royalty 0.0000 0.0000 5.0 136,932 145,507 62,146 83,361 13.32 142,740 62,146 80,594 12.88Mineral Tax 0.0000 0.0000 8.0 110,054 117,585 57,069 60,516 9.67 116,073 57,069 59,004 9.43
10.0 96,578 103,433 54,016 49,417 7.90 102,407 54,016 48,392 7.7312.0 85,584 91,817 51,196 40,621 6.49 91,115 51,196 39,919 6.3815.0 72,482 77,904 47,357 30,547 4.88 77,498 47,357 30,141 4.8220.0 56,715 61,074 41,843 19,232 3.07 60,904 41,843 19,062 3.05
Evaluator: Werth, James P.Run Date: February 16, 2012 11:30:21
1121357 Proved Undeveloped, GLJ (2012-01), pri February 16, 2012 12:53:13
Page: 85 of 102
Petroleum ConsultantsGLJ

Company: Corridor Resources Inc. Reserve Class: ProvedProperty: Corporate Development Class: TotalDescription: After Tax Analysis Pricing: GLJ (2012-01)
Effective Date: December 31, 2011
Economic Forecast
PRODUCTION FORECAST
Light/Medium Oil Production Solution Gas Production Residue Gas Production
Company Wells Company Company Company Company Company CompanyDaily Yearly Net Yearly Price Daily Yearly Net Yearly Price Daily Yearly Net Yearly Price
Year Oil Gas bbl/d Mbbl Mbbl $/bbl Mcf/d MMcf MMcf $/Mcf Mcf/d MMcf MMcf $/Mcf
2012 0 22 0 0 0 0.00 0 0 0 0.00 9,348 3,412 3,224 3.502013 1 26 59 22 20 101.34 46 17 15 4.17 10,279 3,752 3,531 4.172014 1 27 65 24 21 98.28 51 19 17 4.70 13,471 4,917 4,576 4.702015 1 30 35 13 12 96.24 27 10 9 5.24 15,609 5,697 5,267 5.242016 1 32 22 8 7 96.24 17 6 6 5.77 15,814 5,772 5,329 5.772017 1 32 15 5 5 96.24 12 4 4 6.31 13,538 4,941 4,573 6.312018 1 32 11 4 4 97.62 9 3 3 6.59 11,197 4,087 3,767 6.592019 1 32 8 3 3 99.69 7 2 2 6.73 9,476 3,459 3,168 6.732020 1 31 7 2 2 101.80 5 2 2 6.88 8,167 2,981 2,738 6.882021 1 31 5 2 2 103.95 4 2 1 7.03 7,083 2,585 2,382 7.032022 1 31 4 2 1 106.15 3 1 1 7.17 6,212 2,268 2,096 7.172023 1 30 4 1 1 108.39 3 1 1 7.31 5,470 1,997 1,853 7.31Sub. 86 78 98.97 67 61 5.21 45,868 42,504 5.77Rem. 1 1 110.67 1 1 7.45 12,752 11,627 8.38Tot. 87 79 99.08 68 61 5.23 58,620 54,131 6.34
Total Gas Production Condensate Production Total Oil + NGL Production
Company Company Company Company Company CompanyDaily Yearly Net Yearly Price Daily Yearly Net Yearly Price Daily Yearly Net Yearly Price
Year Mcf/d MMcf MMcf $/Mcf bbl/d Mbbl Mbbl $/bbl bbl/d Mbbl Mbbl $/bbl
2012 9,348 3,412 3,224 3.50 12 4 4 86.50 12 4 4 86.502013 10,326 3,769 3,546 4.17 13 5 5 86.50 73 26 24 98.652014 13,522 4,936 4,593 4.70 17 6 6 83.44 82 30 27 95.162015 15,637 5,707 5,276 5.24 20 7 7 81.40 55 20 18 90.862016 15,831 5,778 5,334 5.77 20 7 7 81.40 42 15 14 89.142017 13,550 4,946 4,577 6.31 17 6 6 81.40 32 12 11 88.302018 11,205 4,090 3,770 6.59 14 5 5 82.78 25 9 8 89.212019 9,483 3,461 3,170 6.73 12 4 4 84.85 20 7 7 90.892020 8,172 2,983 2,740 6.88 10 4 3 86.96 17 6 6 92.692021 7,088 2,587 2,383 7.03 9 3 3 89.11 14 5 5 94.582022 6,216 2,269 2,097 7.17 8 3 3 91.31 12 4 4 96.562023 5,473 1,998 1,854 7.31 7 3 2 93.55 11 4 4 98.64Sub. 45,936 42,565 5.77 59 54 84.61 145 132 93.15Rem. 12,752 11,627 8.38 16 15 110.27 17 16 110.28Tot. 58,688 54,192 6.34 75 69 90.19 162 148 94.96
Total Oil Equiv. Production
Company CompanyDaily Yearly Net Yearly Price
Year boe/d Mboe Mboe $/boe
2012 1,570 573 542 21.502013 1,794 655 615 27.992014 2,336 853 793 30.582015 2,661 971 898 32.672016 2,681 978 903 35.502017 2,291 836 774 38.572018 1,893 691 637 40.182019 1,601 584 535 41.002020 1,379 503 462 41.882021 1,196 436 402 42.782022 1,048 383 354 43.622023 923 337 313 44.48Sub. 7,801 7,226 35.71Rem. 2,142 1,953 50.75Tot. 9,943 9,180 38.95
1121357 Total Proved, GLJ (2012-01), pri February 16, 2012 12:53:20
Page: 86 of 102
Petroleum ConsultantsGLJ

Page 2
REVENUE AND EXPENSE FORECAST
Revenue Before BurdensRoyalty Burdens Gas Processing Total Net
Working Interest Royalty Company Pre-Processing Allowance Royalty Revenue Operating ExpensesInterest Interest After After
Oil Gas NGL+Sul Total Total Total Crown Other Crown Other Process. Royalty Fixed Variable TotalYear M$ M$ M$ M$ M$ M$ M$ M$ M$ M$ M$ M$ M$ M$ M$
2012 0 11,943 377 12,320 0 12,320 678 0 0 0 678 11,642 2,766 648 3,4142013 2,197 15,712 416 18,326 0 18,326 1,161 0 0 0 1,161 17,164 2,865 835 3,7012014 2,329 23,218 526 26,073 0 26,073 1,869 0 0 0 1,869 24,203 2,997 1,093 4,0902015 1,232 29,904 593 31,729 0 31,729 2,424 0 0 0 2,424 29,305 3,131 1,215 4,3472016 773 33,364 600 34,737 0 34,737 2,683 0 0 0 2,683 32,054 3,267 1,230 4,4972017 528 31,203 514 32,245 0 32,245 2,417 0 0 0 2,417 29,828 3,354 1,066 4,4202018 390 26,935 432 27,757 0 27,757 2,179 0 0 0 2,179 25,578 3,412 896 4,3092019 303 23,279 375 23,957 0 23,957 2,016 0 0 0 2,016 21,941 3,481 772 4,2522020 244 20,508 331 21,083 0 21,083 1,721 0 0 0 1,721 19,362 3,534 677 4,2112021 200 18,175 294 18,669 0 18,669 1,475 0 0 0 1,475 17,194 3,592 598 4,1912022 168 16,257 264 16,690 0 16,690 1,264 0 0 0 1,264 15,426 3,644 535 4,1782023 144 14,601 239 14,984 0 14,984 1,082 0 0 0 1,082 13,901 3,680 480 4,160Sub. 8,507 265,101 4,961 278,568 0 278,568 20,968 0 0 0 20,968 257,600 39,723 10,046 49,770Rem. 89 106,848 1,795 108,731 0 108,731 9,670 0 0 0 9,670 99,061 25,788 3,458 29,246Tot. 8,596 371,948 6,756 387,300 0 387,300 30,638 0 0 0 30,638 356,661 65,512 13,504 79,016Disc 6,122 178,468 3,452 188,041 0 188,041 14,158 0 0 0 14,158 173,883 28,481 6,925 35,406
Net Net Capital Investment Before Tax Cash FlowMineral Capital NPI Prod'n Other Aband. Oper.
Tax Tax Burden Revenue Income Costs Income Dev. Plant Tang. Total Annual Cum. 10.0% DcfYear M$ M$ M$ M$ M$ M$ M$ M$ M$ M$ M$ M$ M$ M$
2012 0 0 0 8,228 1,493 0 9,721 0 0 0 0 9,721 9,721 9,2682013 0 0 0 13,464 1,450 510 14,404 13,306 0 0 13,306 1,098 10,818 10,2202014 0 0 0 20,113 1,886 390 21,609 21,193 0 0 21,193 416 11,234 10,5472015 0 0 0 24,958 2,745 0 27,703 21,882 0 0 21,882 5,821 17,055 14,7172016 0 0 0 27,557 2,658 0 30,216 12,600 0 0 12,600 17,616 34,671 26,1892017 0 0 0 25,408 2,187 138 27,457 3,213 0 0 3,213 24,244 58,915 40,5422018 0 0 0 21,269 1,846 0 23,116 0 0 0 0 23,116 82,031 52,9832019 0 0 0 17,688 1,584 144 19,128 0 0 0 0 19,128 101,159 62,3422020 0 0 0 15,151 1,380 146 16,385 0 0 0 0 16,385 117,543 69,6302021 0 0 0 13,004 1,195 0 14,198 0 0 0 0 14,198 131,742 75,3712022 0 0 0 11,248 1,058 305 12,000 0 0 0 0 12,000 143,742 79,7832023 0 0 0 9,742 944 311 10,374 0 0 0 0 10,374 154,116 83,250Sub. 0 0 0 207,831 20,423 1,944 226,310 72,193 0 0 72,193 154,116 154,116 83,250Rem. 0 0 0 69,815 6,782 11,473 65,124 0 0 0 0 65,124 219,240 95,742Tot. 0 0 0 277,645 27,205 13,417 291,433 72,193 0 0 72,193 219,240 219,240 95,742Disc 0 0 0 138,477 14,056 2,775 149,758 54,016 0 0 54,016 95,742 95,742 95,742
AFTER TAX ANALYSIS
Tax Pool Balances Incl. Current Year Additions Depreciation & WriteoffsOper.
Income CCA COGPE CDE CEE Other CCA COGPE CDE CEE Other TotalYear M$ M$ M$ M$ M$ M$ M$ M$ M$ M$ M$ M$
2012 9,721 39,561 3,091 80,063 72,387 626 5,960 309 24,019 0 0 30,2882013 14,404 33,601 2,782 69,350 72,387 626 4,627 278 20,805 0 0 25,7102014 21,609 28,974 2,504 69,738 72,387 626 3,621 250 20,921 0 0 24,7932015 27,703 25,353 2,253 70,699 72,387 626 2,861 225 21,210 2,781 626 27,7032016 30,216 22,492 2,028 62,089 69,606 0 2,285 203 18,627 9,101 0 30,2162017 27,457 20,207 1,825 46,675 60,504 0 1,847 183 14,002 11,425 0 27,4572018 23,116 18,360 1,643 32,672 49,079 0 1,513 164 9,802 11,636 0 23,1162019 19,128 16,847 1,478 22,871 37,443 0 1,258 148 6,861 10,861 0 19,1282020 16,385 15,588 1,331 16,009 26,582 0 1,062 133 4,803 10,387 0 16,3852021 14,198 14,527 1,198 11,207 16,196 0 910 120 3,362 9,807 0 14,1982022 12,000 13,617 1,078 7,845 6,389 0 791 108 2,353 6,389 0 9,6412023 10,374 12,826 970 5,491 0 0 698 97 1,647 0 0 2,442Sub. 226,310 12,826 970 5,491 0 0 27,433 2,218 148,412 72,387 626 251,077Rem. 65,124 12,826 970 5,491 0 0 8,319 822 3,844 0 0 12,985Tot. 291,433 12,826 970 5,491 0 0 35,752 3,040 152,256 72,387 626 264,061Disc 149,758 21,197 1,620 107,541 37,194 448 168,000
1121357 Total Proved, GLJ (2012-01), pri February 16, 2012 12:53:20
Page: 87 of 102
Petroleum ConsultantsGLJ

Page 3Federal Provincial Net Cash Flow Net Cash Flow
ARTD & Income Before Income Tax After Income TaxTaxable Tax Income Tax Income Investment TaxIncome Rate Tax Rate Tax Credits Payable Annual Cum. 10.0% Dcf Annual Cum. 10.0% Dcf
Year M$ % M$ % M$ M$ M$ M$ M$ M$ M$ M$ M$
2012 -20,567 15.0 0 12.8 0 0 0 9,721 9,721 9,268 9,721 9,721 9,2682013 -11,307 15.0 0 12.8 0 0 0 1,098 10,818 10,220 1,098 10,818 10,2202014 -3,184 15.0 0 12.8 0 0 0 416 11,234 10,547 416 11,234 10,5472015 0 15.0 0 12.8 0 0 0 5,821 17,055 14,717 5,821 17,055 14,7172016 0 15.0 0 12.8 0 0 0 17,616 34,671 26,189 17,616 34,671 26,1892017 0 15.0 0 12.8 0 0 0 24,244 58,915 40,542 24,244 58,915 40,5422018 0 15.0 0 12.8 0 0 0 23,116 82,031 52,983 23,116 82,031 52,9832019 0 15.0 0 12.8 0 0 0 19,128 101,159 62,342 19,128 101,159 62,3422020 0 15.0 0 12.8 0 0 0 16,385 117,543 69,630 16,385 117,543 69,6302021 0 15.0 0 12.8 0 0 0 14,198 131,742 75,371 14,198 131,742 75,3712022 2,359 15.0 0 12.8 0 0 0 12,000 143,742 79,783 12,000 143,742 79,7832023 7,932 15.0 0 12.8 0 0 0 10,374 154,116 83,250 10,374 154,116 83,250Sub. -24,767 0 0 0 0 154,116 154,116 83,250 154,116 154,116 83,250Rem. 52,139 4,357 3,703 0 8,060 65,124 219,240 95,742 57,063 211,180 94,717Tot. 27,372 4,357 3,703 0 8,060 219,240 219,240 95,742 211,180 211,180 94,717Disc -18,243 554 471 0 1,025 95,742 95,742 95,742 94,717 94,717 94,717
SUMMARY OF RESERVES
Remaining Reserves at Jan 01, 2012 Oil Equivalents Reserve Life Indic. (yr)
Working Roy/NPI Total Oil Eq. Company % of Reserve Life HalfProduct Units Interest Interest Company Net Factor Mboe Total Life Index Life
Light/Med Oil Mbbl 87 0 87 79 1.000 87 1 13.0 4.0 2.9Solution Gas MMcf 68 0 68 61 6.000 11 0 13.0 4.0 2.9Residue Gas MMcf 58,620 0 58,620 54,131 6.000 9,770 98 39.0 17.2 6.2Total: Gas MMcf 58,688 0 58,688 54,192 6.000 9,781 98 39.0 17.2 6.2Gas Heat Content BBtu 62,209 0 62,209 57,444 0.000 0 0 39.0 17.2 6.2Condensate Mbbl 75 0 75 69 1.000 75 1 39.0 17.2 6.2Total: Oil+NGL Mbbl 162 0 162 148 1.000 162 2 39.0 37.1 4.0Total: Oil Eq. Mboe 9,943 0 9,943 9,180 1.000 9,943 100 39.0 17.4 6.2
PRODUCT REVENUE AND EXPENSES
Average First Year Unit Values Net Revenue After Royalties
Wellhead Operating Other Prod'n Undisc % of 10% Disc % ofProduct Units Base Price Price Adjust. Price Net Burdens Expenses Expenses Revenue M$ Total M$ Total
Light/Med Oil $/bbl 0.00 0.00 0.00 0.00 0.00 0.00 0.00 7,779 2 5,540 3Solution Gas $/Mcf 0.00 0.00 0.00 0.00 0.00 0.00 0.00 321 0 220 0Residue Gas $/Mcf 3.29 0.21 3.50 0.19 1.00 0.00 2.31 342,329 96 164,923 95Total: Gas $/Mcf 3.29 0.21 3.50 0.19 1.00 0.00 2.31 342,650 96 165,143 95Condensate $/bbl 107.14 -20.64 86.50 4.76 0.00 0.00 81.75 6,232 2 3,200 2Total: Oil+NGL $/bbl 107.14 -20.64 86.50 4.76 0.00 0.00 81.75 14,011 4 8,740 5Total: Oil Eq. $/boe 20.42 1.08 21.50 1.18 5.96 0.00 14.36 356,661 100 173,883 100
REVENUE BURDENS AND NET PRESENT VALUE SUMMARY
Net Present Value Before Income Tax Net Present Value After Income Tax
Revenue Burdens (%) Disc. Prod'n Operating Capital Cash Flow Operating Capital Cash FlowRate Revenue Income Invest. Income Invest.
Initial Average % M$ M$ M$ M$ $/boe M$ M$ M$ $/boe
Crown Royalty 5.5000 7.9108 0.0 277,645 291,433 72,193 219,240 22.05 283,373 72,193 211,180 21.24Non-crown Royalty 0.0000 0.0000 5.0 187,571 200,901 62,146 138,756 13.96 198,134 62,146 135,989 13.68Mineral Tax 0.0000 0.0000 8.0 155,087 167,198 57,069 110,128 11.08 165,685 57,069 108,616 10.92
10.0 138,477 149,758 54,016 95,742 9.63 148,732 54,016 94,717 9.5312.0 124,738 135,233 51,196 84,037 8.45 134,530 51,196 83,334 8.3815.0 108,116 117,549 47,357 70,192 7.06 117,143 47,357 69,786 7.0220.0 87,701 95,676 41,843 53,834 5.41 95,506 41,843 53,664 5.40
Evaluator: Werth, James P.Run Date: February 16, 2012 11:30:20
1121357 Total Proved, GLJ (2012-01), pri February 16, 2012 12:53:20
Page: 88 of 102
Petroleum ConsultantsGLJ

Company: Corridor Resources Inc. Reserve Class: ProbableProperty: Corporate Development Class: TotalDescription: After Tax Analysis Pricing: GLJ (2012-01)
Effective Date: December 31, 2011
Economic Forecast
PRODUCTION FORECAST
Light/Medium Oil Production Solution Gas Production Residue Gas Production
Company Wells Company Company Company Company Company CompanyDaily Yearly Net Yearly Price Daily Yearly Net Yearly Price Daily Yearly Net Yearly Price
Year Oil Gas bbl/d Mbbl Mbbl $/bbl Mcf/d MMcf MMcf $/Mcf Mcf/d MMcf MMcf $/Mcf
2012 0 0 0 0 0 0.00 0 0 0 0.00 204 75 70 3.502013 0 0 114 41 38 101.34 89 32 29 4.17 837 306 286 4.172014 2 3 273 100 90 98.28 213 78 70 4.70 2,171 792 728 4.702015 2 4 265 97 88 96.24 208 76 69 5.24 4,618 1,686 1,539 5.242016 2 7 156 57 52 96.24 122 45 40 5.77 10,111 3,691 3,356 5.772017 2 8 97 35 32 96.24 76 28 25 6.31 10,546 3,849 3,501 6.312018 2 8 67 24 22 97.62 52 19 17 6.59 8,925 3,258 2,962 6.592019 2 8 49 18 16 99.69 38 14 13 6.73 7,642 2,789 2,532 6.732020 2 8 37 14 12 101.80 29 11 10 6.88 6,670 2,435 2,213 6.882021 2 9 29 11 10 103.96 23 8 8 7.03 5,868 2,142 1,949 7.032022 2 8 24 9 8 106.15 18 7 6 7.17 5,238 1,912 1,743 7.172023 2 9 20 7 6 108.39 15 6 5 7.31 4,727 1,725 1,577 7.31Sub. 412 373 98.27 323 292 5.49 24,659 22,457 6.41Rem. 21 19 113.83 17 15 7.66 18,969 17,191 8.96Tot. 434 393 99.04 339 307 5.59 43,627 39,648 7.52
Total Gas Production Condensate Production Total Oil + NGL Production
Company Company Company Company Company CompanyDaily Yearly Net Yearly Price Daily Yearly Net Yearly Price Daily Yearly Net Yearly Price
Year Mcf/d MMcf MMcf $/Mcf bbl/d Mbbl Mbbl $/bbl bbl/d Mbbl Mbbl $/bbl
2012 204 75 70 3.50 0 0 0 86.50 0 0 0 86.502013 926 338 315 4.17 1 0 0 86.50 115 42 38 101.192014 2,384 870 799 4.70 3 1 1 83.44 276 101 91 98.122015 4,826 1,762 1,608 5.24 6 2 2 81.40 272 99 90 95.902016 10,233 3,735 3,396 5.77 13 5 4 81.40 169 62 56 95.102017 10,622 3,877 3,526 6.31 14 5 5 81.40 111 40 37 94.422018 8,977 3,277 2,979 6.59 11 4 4 82.78 78 28 26 95.442019 7,680 2,803 2,545 6.73 10 4 3 84.85 58 21 19 97.202020 6,699 2,445 2,222 6.88 9 3 3 86.96 46 17 15 99.032021 5,891 2,150 1,957 7.03 8 3 2 89.12 37 13 12 100.922022 5,256 1,919 1,749 7.17 7 2 2 91.31 30 11 10 102.872023 4,742 1,731 1,582 7.31 6 2 2 93.55 26 9 8 104.88Sub. 24,981 22,749 6.40 32 29 84.93 444 402 97.32Rem. 18,985 17,206 8.96 24 22 119.29 46 41 116.73Tot. 43,967 39,955 7.50 56 51 99.77 490 444 99.12
Total Oil Equiv. Production
Company CompanyDaily Yearly Net Yearly Price
Year boe/d Mboe Mboe $/boe
2012 34 13 12 21.502013 269 98 90 57.512014 673 246 224 56.862015 1,076 393 358 47.712016 1,875 684 622 40.102017 1,881 687 624 41.182018 1,574 575 522 42.292019 1,338 488 443 42.832020 1,162 424 386 43.522021 1,019 372 338 44.272022 906 331 302 45.002023 816 298 272 45.76Sub. 4,608 4,194 44.06Rem. 3,210 2,909 54.63Tot. 7,818 7,103 48.40
1121357 Total Probable, GLJ (2012-01), pri February 16, 2012 12:53:26
Page: 89 of 102
Petroleum ConsultantsGLJ

Page 2
REVENUE AND EXPENSE FORECAST
Revenue Before BurdensRoyalty Burdens Gas Processing Total Net
Working Interest Royalty Company Pre-Processing Allowance Royalty Revenue Operating ExpensesInterest Interest After After
Oil Gas NGL+Sul Total Total Total Crown Other Crown Other Process. Royalty Fixed Variable TotalYear M$ M$ M$ M$ M$ M$ M$ M$ M$ M$ M$ M$ M$ M$ M$
2012 0 261 8 269 0 269 15 0 0 0 15 254 0 14 142013 4,204 1,409 37 5,650 0 5,650 498 0 0 0 498 5,152 20 267 2862014 9,786 4,094 93 13,972 0 13,972 1,273 0 0 0 1,273 12,700 47 664 7112015 9,324 9,230 183 18,737 0 18,737 1,708 0 0 0 1,708 17,029 119 844 9632016 5,491 21,566 388 27,445 0 27,445 2,515 0 0 0 2,515 24,930 195 1,062 1,2572017 3,410 24,460 403 28,272 0 28,272 2,572 0 0 0 2,572 25,700 257 999 1,2562018 2,372 21,580 346 24,298 0 24,298 2,216 0 0 0 2,216 22,082 270 831 1,1012019 1,768 18,853 304 20,924 0 20,924 1,932 0 0 0 1,932 18,992 264 709 9722020 1,381 16,811 271 18,463 0 18,463 1,688 0 0 0 1,688 16,775 283 620 9032021 1,108 15,107 245 16,460 0 16,460 1,486 0 0 0 1,486 14,975 301 549 8502022 916 13,747 224 14,886 0 14,886 1,319 0 0 0 1,319 13,567 313 494 8072023 772 12,651 207 13,630 0 13,630 1,179 0 0 0 1,179 12,450 345 451 796Sub. 40,531 159,768 2,708 203,008 0 203,008 18,401 0 0 0 18,401 184,607 2,414 7,502 9,917Rem. 2,429 170,045 2,891 175,365 0 175,365 16,487 0 0 0 16,487 158,878 26,981 5,628 32,609Tot. 42,960 329,813 5,599 378,373 0 378,373 34,888 0 0 0 34,888 343,485 29,395 13,130 42,526Disc 28,079 108,969 1,867 138,916 0 138,916 12,657 0 0 0 12,657 126,259 4,790 5,136 9,927
Net Net Capital Investment Before Tax Cash FlowMineral Capital NPI Prod'n Other Aband. Oper.
Tax Tax Burden Revenue Income Costs Income Dev. Plant Tang. Total Annual Cum. 10.0% DcfYear M$ M$ M$ M$ M$ M$ M$ M$ M$ M$ M$ M$ M$ M$
2012 0 0 0 240 145 0 385 0 0 0 0 385 385 3672013 0 0 0 4,866 331 -510 5,707 5,936 0 0 5,936 -229 156 1682014 0 0 0 11,989 590 130 12,448 18,165 0 0 18,165 -5,717 -5,561 -4,3372015 0 0 0 16,066 690 398 16,358 9,264 0 0 9,264 7,094 1,533 7452016 0 0 0 23,674 727 0 24,401 25,199 0 0 25,199 -798 734 2252017 0 0 0 24,444 749 -138 25,331 6,426 0 0 6,426 18,905 19,639 11,4172018 0 0 0 20,980 726 0 21,706 0 0 0 0 21,706 41,346 23,1002019 0 0 0 18,020 692 0 18,712 0 0 0 0 18,712 60,058 32,2552020 0 0 0 15,872 657 -146 16,675 0 0 0 0 16,675 76,733 39,6722021 0 0 0 14,125 630 149 14,606 0 0 0 0 14,606 91,338 45,5782022 0 0 0 12,760 595 -305 13,659 0 0 0 0 13,659 104,997 50,5992023 0 0 0 11,655 545 -155 12,355 0 0 0 0 12,355 117,352 54,728Sub. 0 0 0 174,691 7,076 -577 182,343 64,991 0 0 64,991 117,352 117,352 54,728Rem. 0 0 0 126,268 7,759 6,526 127,501 0 0 0 0 127,501 244,854 75,405Tot. 0 0 0 300,959 14,835 5,949 309,845 64,991 0 0 64,991 244,854 244,854 75,405Disc 0 0 0 116,333 5,047 -336 121,716 46,311 0 0 46,311 75,405 75,405 75,405
AFTER TAX ANALYSIS
Tax Pool Balances Incl. Current Year Additions Depreciation & WriteoffsOper.
Income CCA COGPE CDE CEE Other CCA COGPE CDE CEE Other TotalYear M$ M$ M$ M$ M$ M$ M$ M$ M$ M$ M$ M$
2012 385 0 0 0 0 0 0 0 0 0 0 02013 5,707 0 0 5,936 0 0 0 0 1,781 0 0 1,7812014 12,448 0 0 22,321 0 0 0 0 6,696 1,942 626 9,2642015 16,358 0 0 24,889 -1,942 -626 0 0 7,467 9,518 -626 16,3582016 24,401 0 0 42,621 -11,459 0 0 0 12,786 11,614 0 24,4012017 25,331 0 0 36,261 -23,074 0 0 0 10,878 14,452 0 25,3312018 21,706 0 0 25,382 -37,526 0 0 0 7,615 -83 0 7,5322019 18,712 0 0 17,768 -37,443 0 0 0 5,330 -10,861 0 -5,5312020 16,675 0 0 12,437 -26,582 0 0 0 3,731 -10,387 0 -6,6562021 14,606 0 0 8,706 -16,196 0 0 0 2,612 -9,807 0 -7,1952022 13,659 0 0 6,094 -6,389 0 0 0 1,828 -6,389 0 -4,5612023 12,355 0 0 4,266 0 0 0 0 1,280 0 0 1,280Sub. 182,343 0 0 4,266 0 0 0 0 62,005 0 0 62,005Rem. 127,501 0 0 4,266 0 0 574 17 2,986 0 0 3,578Tot. 309,845 0 0 4,266 0 0 574 17 64,991 0 0 65,583Disc 121,716 12 0 38,206 8,175 45 46,438
1121357 Total Probable, GLJ (2012-01), pri February 16, 2012 12:53:26
Page: 90 of 102
Petroleum ConsultantsGLJ

Page 3Federal Provincial Net Cash Flow Net Cash Flow
ARTD & Income Before Income Tax After Income TaxTaxable Tax Income Tax Income Investment TaxIncome Rate Tax Rate Tax Credits Payable Annual Cum. 10.0% Dcf Annual Cum. 10.0% Dcf
Year M$ % M$ % M$ M$ M$ M$ M$ M$ M$ M$ M$
2012 385 15.0 0 12.8 0 0 0 385 385 367 385 385 3672013 3,926 15.0 0 12.8 0 0 0 -229 156 168 -229 156 1682014 3,184 15.0 0 12.8 0 0 0 -5,717 -5,561 -4,337 -5,717 -5,561 -4,3372015 0 15.0 0 12.8 0 0 0 7,094 1,533 745 7,094 1,533 7452016 0 15.0 0 12.8 0 0 0 -798 734 225 -798 734 2252017 0 15.0 0 12.8 0 0 0 18,905 19,639 11,417 18,905 19,639 11,4172018 14,174 15.0 0 12.8 0 0 0 21,706 41,346 23,100 21,706 41,346 23,1002019 24,243 15.0 1,628 12.8 1,384 0 3,012 18,712 60,058 32,255 15,700 57,045 30,7812020 23,331 15.0 3,500 12.8 2,975 0 6,474 16,675 76,733 39,672 10,201 67,246 35,3192021 21,800 15.0 3,270 12.8 2,780 0 6,050 14,606 91,338 45,578 8,556 75,802 38,7792022 18,219 15.0 3,087 12.8 2,624 0 5,711 13,659 104,997 50,599 7,948 83,751 41,7002023 11,075 15.0 2,851 12.8 2,423 0 5,275 12,355 117,352 54,728 7,081 90,831 44,067Sub. 120,339 14,336 12,185 0 26,521 117,352 117,352 54,728 90,831 90,831 44,067Rem. 123,923 22,506 19,130 0 41,635 127,501 244,854 75,405 85,866 176,697 57,408Tot. 244,262 36,841 31,315 0 68,156 244,854 244,854 75,405 176,697 176,697 57,408Disc 75,278 9,729 8,269 0 17,998 75,405 75,405 75,405 57,408 57,408 57,408
SUMMARY OF RESERVES
Remaining Reserves at Jan 01, 2012 Oil Equivalents Reserve Life Indic. (yr)
Working Roy/NPI Total Oil Eq. Company % of Reserve Life HalfProduct Units Interest Interest Company Net Factor Mboe Total Life Index Life
Light/Med Oil Mbbl 434 0 434 393 1.000 434 6 17.0 10.5 3.8Solution Gas MMcf 339 0 339 307 6.000 57 1 17.0 10.5 3.8Residue Gas MMcf 43,627 0 43,627 39,648 6.000 7,271 93 43.0 585.1 10.4Total: Gas MMcf 43,967 0 43,967 39,955 6.000 7,328 94 43.0 589.6 10.3Gas Heat Content BBtu 46,605 0 46,605 42,352 0.000 0 0 43.0 589.6 10.3Condensate Mbbl 56 0 56 51 1.000 56 1 43.0 589.6 10.3Total: Oil+NGL Mbbl 490 0 490 444 1.000 490 6 43.0 999.9 4.1Total: Oil Eq. Mboe 7,818 0 7,818 7,103 1.000 7,818 100 43.0 624.3 9.8
PRODUCT REVENUE AND EXPENSES
Average First Year Unit Values Net Revenue After Royalties
Wellhead Operating Other Prod'n Undisc % of 10% Disc % ofProduct Units Base Price Price Adjust. Price Net Burdens Expenses Expenses Revenue M$ Total M$ Total
Light/Med Oil $/bbl 0.00 0.00 0.00 0.00 0.00 0.00 0.00 38,879 11 25,412 20Solution Gas $/Mcf 0.00 0.00 0.00 0.00 0.00 0.00 0.00 1,718 1 1,083 1Residue Gas $/Mcf 3.29 0.21 3.50 0.19 0.19 0.00 3.12 297,803 87 98,065 78Total: Gas $/Mcf 3.29 0.21 3.50 0.19 0.19 0.00 3.12 299,520 87 99,148 79Condensate $/bbl 107.14 -20.64 86.50 4.76 0.00 0.00 81.75 5,085 1 1,700 1Total: Oil+NGL $/bbl 107.14 -20.64 86.50 4.76 0.00 0.00 81.75 43,964 13 27,112 21Total: Oil Eq. $/boe 20.42 1.08 21.50 1.18 1.13 0.00 19.18 343,485 100 126,259 100
REVENUE BURDENS AND NET PRESENT VALUE SUMMARY
Net Present Value Before Income Tax Net Present Value After Income Tax
Revenue Burdens (%) Disc. Prod'n Operating Capital Cash Flow Operating Capital Cash FlowRate Revenue Income Invest. Income Invest.
Initial Average % M$ M$ M$ M$ $/boe M$ M$ M$ $/boe
Crown Royalty 5.5000 9.2205 0.0 300,959 309,845 64,991 244,854 31.32 241,688 64,991 176,697 22.60Non-crown Royalty 0.0000 0.0000 5.0 174,186 181,690 54,552 127,138 16.26 148,699 54,552 94,147 12.04Mineral Tax 0.0000 0.0000 8.0 135,059 141,205 49,383 91,823 11.75 118,520 49,383 69,137 8.84
10.0 116,333 121,716 46,311 75,405 9.65 103,718 46,311 57,408 7.3412.0 101,477 106,218 43,500 62,717 8.02 91,769 43,500 48,269 6.1715.0 84,255 88,225 39,717 48,508 6.21 77,638 39,717 37,922 4.8520.0 64,220 67,281 34,377 32,905 4.21 60,722 34,377 26,345 3.37
Evaluator: Werth, James P.Run Date: February 16, 2012 11:30:20
1121357 Total Probable, GLJ (2012-01), pri February 16, 2012 12:53:26
Page: 91 of 102
Petroleum ConsultantsGLJ

Company: Corridor Resources Inc. Reserve Class: Proved Plus ProbableProperty: Corporate Development Class: TotalDescription: After Tax Analysis Pricing: GLJ (2012-01)
Effective Date: December 31, 2011
Economic Forecast
PRODUCTION FORECAST
Light/Medium Oil Production Solution Gas Production Residue Gas Production
Company Wells Company Company Company Company Company CompanyDaily Yearly Net Yearly Price Daily Yearly Net Yearly Price Daily Yearly Net Yearly Price
Year Oil Gas bbl/d Mbbl Mbbl $/bbl Mcf/d MMcf MMcf $/Mcf Mcf/d MMcf MMcf $/Mcf
2012 0 22 0 0 0 0.00 0 0 0 0.00 9,553 3,487 3,295 3.502013 1 26 173 63 57 101.34 135 49 45 4.17 11,117 4,058 3,817 4.172014 3 31 338 123 112 98.28 264 96 87 4.70 15,642 5,709 5,305 4.702015 3 34 301 110 99 96.24 235 86 78 5.24 20,228 7,383 6,806 5.242016 3 38 178 65 59 96.24 139 51 46 5.77 25,925 9,463 8,684 5.772017 3 40 112 41 37 96.24 88 32 29 6.31 24,084 8,791 8,074 6.312018 3 40 78 28 26 97.62 61 22 20 6.59 20,122 7,345 6,729 6.592019 3 40 57 21 19 99.69 45 16 15 6.73 17,118 6,248 5,701 6.732020 3 39 44 16 14 101.80 34 12 11 6.88 14,837 5,416 4,951 6.882021 3 39 34 13 11 103.95 27 10 9 7.03 12,952 4,727 4,331 7.032022 3 39 28 10 9 106.15 22 8 7 7.17 11,450 4,179 3,839 7.172023 3 39 23 8 8 108.39 18 7 6 7.31 10,198 3,722 3,430 7.31Sub. 498 451 98.40 390 353 5.44 70,527 64,962 5.99Rem. 22 20 113.71 17 16 7.65 31,720 28,817 8.73Tot. 521 471 99.05 407 368 5.53 102,247 93,779 6.84
Total Gas Production Condensate Production Total Oil + NGL Production
Company Company Company Company Company CompanyDaily Yearly Net Yearly Price Daily Yearly Net Yearly Price Daily Yearly Net Yearly Price
Year Mcf/d MMcf MMcf $/Mcf bbl/d Mbbl Mbbl $/bbl bbl/d Mbbl Mbbl $/bbl
2012 9,553 3,487 3,295 3.50 12 4 4 86.50 12 4 4 86.502013 11,252 4,107 3,861 4.17 14 5 5 86.50 187 68 62 100.202014 15,906 5,806 5,392 4.70 20 7 7 83.44 358 131 118 97.442015 20,463 7,469 6,883 5.24 26 10 9 81.40 327 119 108 95.052016 26,065 9,514 8,730 5.77 33 12 11 81.40 212 77 70 93.912017 24,172 8,823 8,103 6.31 31 11 10 81.40 143 52 47 93.042018 20,183 7,367 6,749 6.59 26 9 9 82.78 103 38 34 93.922019 17,162 6,264 5,715 6.73 22 8 7 84.85 79 29 26 95.562020 14,871 5,428 4,962 6.88 19 7 6 86.96 63 23 21 97.312021 12,979 4,737 4,340 7.03 17 6 6 89.12 51 19 17 99.142022 11,472 4,187 3,847 7.17 15 5 5 91.31 43 16 14 101.052023 10,216 3,729 3,436 7.31 13 5 4 93.55 36 13 12 103.04Sub. 70,917 65,314 5.99 91 83 84.73 589 534 96.29Rem. 31,738 28,833 8.72 41 37 115.67 63 57 114.98Tot. 102,654 94,147 6.84 131 120 94.29 652 591 98.09
Total Oil Equiv. Production
Company CompanyDaily Yearly Net Yearly Price
Year boe/d Mboe Mboe $/boe
2012 1,604 586 553 21.502013 2,063 753 706 31.852014 3,009 1,098 1,017 36.462015 3,737 1,364 1,255 37.002016 4,556 1,663 1,525 37.402017 4,172 1,523 1,398 39.752018 3,467 1,265 1,159 41.142019 2,939 1,073 979 41.832020 2,541 928 848 42.632021 2,214 808 740 43.472022 1,955 713 655 44.262023 1,739 635 585 45.08Sub. 12,408 11,420 38.81Rem. 5,352 4,862 53.08Tot. 17,761 16,282 43.11
1121357 Total Proved Plus Probable, GLJ (2012-01), pri February 16, 2012 12:53:33
Page: 92 of 102
Petroleum ConsultantsGLJ

Page 2
REVENUE AND EXPENSE FORECAST
Revenue Before BurdensRoyalty Burdens Gas Processing Total Net
Working Interest Royalty Company Pre-Processing Allowance Royalty Revenue Operating ExpensesInterest Interest After After
Oil Gas NGL+Sul Total Total Total Crown Other Crown Other Process. Royalty Fixed Variable TotalYear M$ M$ M$ M$ M$ M$ M$ M$ M$ M$ M$ M$ M$ M$ M$
2012 0 12,204 385 12,589 0 12,589 692 0 0 0 692 11,897 2,766 662 3,4282013 6,401 17,122 453 23,976 0 23,976 1,659 0 0 0 1,659 22,317 2,885 1,102 3,9872014 12,115 27,312 618 40,045 0 40,045 3,142 0 0 0 3,142 36,903 3,044 1,757 4,8012015 10,556 39,134 776 50,466 0 50,466 4,132 0 0 0 4,132 46,334 3,251 2,059 5,3102016 6,264 54,930 988 62,182 0 62,182 5,198 0 0 0 5,198 56,984 3,462 2,291 5,7532017 3,937 55,663 917 60,517 0 60,517 4,989 0 0 0 4,989 55,528 3,610 2,065 5,6762018 2,762 48,515 778 52,055 0 52,055 4,395 0 0 0 4,395 47,660 3,683 1,728 5,4102019 2,071 42,132 678 44,881 0 44,881 3,948 0 0 0 3,948 40,933 3,744 1,481 5,2252020 1,624 37,319 602 39,546 0 39,546 3,408 0 0 0 3,408 36,137 3,817 1,297 5,1142021 1,308 33,282 539 35,130 0 35,130 2,961 0 0 0 2,961 32,169 3,894 1,147 5,0412022 1,084 30,005 488 31,577 0 31,577 2,583 0 0 0 2,583 28,993 3,957 1,029 4,9862023 916 27,252 445 28,613 0 28,613 2,262 0 0 0 2,262 26,352 4,025 931 4,956Sub. 49,038 424,869 7,669 481,576 0 481,576 39,369 0 0 0 39,369 442,207 42,137 17,549 59,686Rem. 2,518 276,893 4,686 284,096 0 284,096 26,157 0 0 0 26,157 257,939 52,770 9,086 61,856Tot. 51,556 701,762 12,355 765,672 0 765,672 65,526 0 0 0 65,526 700,146 94,907 26,635 121,542Disc 34,201 287,437 5,319 326,957 0 326,957 26,815 0 0 0 26,815 300,142 33,272 12,061 45,333
Net Net Capital Investment Before Tax Cash FlowMineral Capital NPI Prod'n Other Aband. Oper.
Tax Tax Burden Revenue Income Costs Income Dev. Plant Tang. Total Annual Cum. 10.0% DcfYear M$ M$ M$ M$ M$ M$ M$ M$ M$ M$ M$ M$ M$ M$
2012 0 0 0 8,468 1,638 0 10,106 0 0 0 0 10,106 10,106 9,6352013 0 0 0 18,330 1,781 0 20,111 19,242 0 0 19,242 869 10,974 10,3882014 0 0 0 32,102 2,475 520 34,057 39,358 0 0 39,358 -5,301 5,673 6,2112015 0 0 0 41,025 3,435 398 44,061 31,146 0 0 31,146 12,915 18,588 15,4622016 0 0 0 51,231 3,385 0 54,616 37,799 0 0 37,799 16,818 35,405 26,4142017 0 0 0 49,852 2,935 0 52,788 9,639 0 0 9,639 43,149 78,554 51,9602018 0 0 0 42,250 2,572 0 44,822 0 0 0 0 44,822 123,376 76,0832019 0 0 0 35,708 2,276 144 37,840 0 0 0 0 37,840 161,216 94,5972020 0 0 0 31,023 2,037 0 33,060 0 0 0 0 33,060 194,276 109,3022021 0 0 0 27,128 1,825 149 28,804 0 0 0 0 28,804 223,080 120,9502022 0 0 0 24,007 1,652 0 25,659 0 0 0 0 25,659 248,739 130,3822023 0 0 0 21,396 1,489 155 22,729 0 0 0 0 22,729 271,469 137,978Sub. 0 0 0 382,521 27,498 1,367 408,653 137,184 0 0 137,184 271,469 271,469 137,978Rem. 0 0 0 196,083 14,541 17,999 192,625 0 0 0 0 192,625 464,094 171,147Tot. 0 0 0 578,604 42,039 19,366 601,278 137,184 0 0 137,184 464,094 464,094 171,147Disc 0 0 0 254,810 19,103 2,439 271,474 100,326 0 0 100,326 171,147 171,147 171,147
AFTER TAX ANALYSIS
Tax Pool Balances Incl. Current Year Additions Depreciation & WriteoffsOper.
Income CCA COGPE CDE CEE Other CCA COGPE CDE CEE Other TotalYear M$ M$ M$ M$ M$ M$ M$ M$ M$ M$ M$ M$
2012 10,106 39,561 3,091 80,063 72,387 626 5,960 309 24,019 0 0 30,2882013 20,111 33,601 2,782 75,286 72,387 626 4,627 278 22,586 0 0 27,4912014 34,057 28,974 2,504 92,059 72,387 626 3,621 250 27,618 1,942 626 34,0572015 44,061 25,353 2,253 95,588 70,445 0 2,861 225 28,676 12,299 0 44,0612016 54,616 22,492 2,028 104,710 58,146 0 2,285 203 31,413 20,716 0 54,6162017 52,788 20,207 1,825 82,936 37,431 0 1,847 183 24,881 25,877 0 52,7882018 44,822 18,360 1,643 58,055 11,554 0 1,513 164 17,416 11,554 0 30,6482019 37,840 16,847 1,478 40,638 0 0 1,258 148 12,192 0 0 13,5982020 33,060 15,588 1,331 28,447 0 0 1,062 133 8,534 0 0 9,7292021 28,804 14,527 1,198 19,913 0 0 910 120 5,974 0 0 7,0032022 25,659 13,617 1,078 13,939 0 0 791 108 4,182 0 0 5,0812023 22,729 12,826 970 9,757 0 0 698 97 2,927 0 0 3,722Sub. 408,653 12,826 970 9,757 0 0 27,433 2,218 210,417 72,387 626 313,081Rem. 192,625 12,826 970 9,757 0 0 8,893 840 6,830 0 0 16,562Tot. 601,278 12,826 970 9,757 0 0 36,326 3,058 217,247 72,387 626 329,644Disc 271,474 21,208 1,621 145,747 45,369 493 214,439
1121357 Total Proved Plus Probable, GLJ (2012-01), pri February 16, 2012 12:53:33
Page: 93 of 102
Petroleum ConsultantsGLJ

Page 3Federal Provincial Net Cash Flow Net Cash Flow
ARTD & Income Before Income Tax After Income TaxTaxable Tax Income Tax Income Investment TaxIncome Rate Tax Rate Tax Credits Payable Annual Cum. 10.0% Dcf Annual Cum. 10.0% Dcf
Year M$ % M$ % M$ M$ M$ M$ M$ M$ M$ M$ M$
2012 -20,182 15.0 0 12.8 0 0 0 10,106 10,106 9,635 10,106 10,106 9,6352013 -7,380 15.0 0 12.8 0 0 0 869 10,974 10,388 869 10,974 10,3882014 0 15.0 0 12.8 0 0 0 -5,301 5,673 6,211 -5,301 5,673 6,2112015 0 15.0 0 12.8 0 0 0 12,915 18,588 15,462 12,915 18,588 15,4622016 0 15.0 0 12.8 0 0 0 16,818 35,405 26,414 16,818 35,405 26,4142017 0 15.0 0 12.8 0 0 0 43,149 78,554 51,960 43,149 78,554 51,9602018 14,174 15.0 0 12.8 0 0 0 44,822 123,376 76,083 44,822 123,376 76,0832019 24,243 15.0 1,628 12.8 1,384 0 3,012 37,840 161,216 94,597 34,828 158,204 93,1242020 23,331 15.0 3,500 12.8 2,975 0 6,474 33,060 194,276 109,302 26,585 184,790 104,9492021 21,800 15.0 3,270 12.8 2,780 0 6,050 28,804 223,080 120,950 22,754 207,544 114,1502022 20,579 15.0 3,087 12.8 2,624 0 5,711 25,659 248,739 130,382 19,949 227,493 121,4832023 19,007 15.0 2,851 12.8 2,423 0 5,275 22,729 271,469 137,978 17,455 244,948 127,316Sub. 95,572 14,336 12,185 0 26,521 271,469 271,469 137,978 244,948 244,948 127,316Rem. 176,062 26,862 22,833 0 49,695 192,625 464,094 171,147 142,929 387,877 152,124Tot. 271,634 41,198 35,018 0 76,216 464,094 464,094 171,147 387,877 387,877 152,124Disc 57,035 10,283 8,740 0 19,023 171,147 171,147 171,147 152,124 152,124 152,124
SUMMARY OF RESERVES
Remaining Reserves at Jan 01, 2012 Oil Equivalents Reserve Life Indic. (yr)
Working Roy/NPI Total Oil Eq. Company % of Reserve Life HalfProduct Units Interest Interest Company Net Factor Mboe Total Life Index Life
Light/Med Oil Mbbl 521 0 521 471 1.000 521 3 17.0 8.2 3.7Solution Gas MMcf 407 0 407 368 6.000 68 0 17.0 8.2 3.7Residue Gas MMcf 102,247 0 102,247 93,779 6.000 17,041 96 43.0 29.3 7.8Total: Gas MMcf 102,654 0 102,654 94,147 6.000 17,109 96 43.0 29.4 7.8Gas Heat Content BBtu 108,814 0 108,814 99,796 0.000 0 0 43.0 29.4 7.8Condensate Mbbl 131 0 131 120 1.000 131 1 43.0 29.4 7.8Total: Oil+NGL Mbbl 652 0 652 591 1.000 652 4 43.0 146.4 4.0Total: Oil Eq. Mboe 17,761 0 17,761 16,282 1.000 17,761 100 43.0 30.3 7.6
PRODUCT REVENUE AND EXPENSES
Average First Year Unit Values Net Revenue After Royalties
Wellhead Operating Other Prod'n Undisc % of 10% Disc % ofProduct Units Base Price Price Adjust. Price Net Burdens Expenses Expenses Revenue M$ Total M$ Total
Light/Med Oil $/bbl 0.00 0.00 0.00 0.00 0.00 0.00 0.00 46,658 7 30,952 10Solution Gas $/Mcf 0.00 0.00 0.00 0.00 0.00 0.00 0.00 2,039 0 1,303 0Residue Gas $/Mcf 3.29 0.21 3.50 0.19 0.98 0.00 2.32 640,132 91 262,988 88Total: Gas $/Mcf 3.29 0.21 3.50 0.19 0.98 0.00 2.32 642,170 92 264,290 88Condensate $/bbl 107.14 -20.64 86.50 4.76 0.00 0.00 81.75 11,317 2 4,900 2Total: Oil+NGL $/bbl 107.14 -20.64 86.50 4.76 0.00 0.00 81.75 57,976 8 35,852 12Total: Oil Eq. $/boe 20.42 1.08 21.50 1.18 5.85 0.00 14.46 700,146 100 300,142 100
REVENUE BURDENS AND NET PRESENT VALUE SUMMARY
Net Present Value Before Income Tax Net Present Value After Income Tax
Revenue Burdens (%) Disc. Prod'n Operating Capital Cash Flow Operating Capital Cash FlowRate Revenue Income Invest. Income Invest.
Initial Average % M$ M$ M$ M$ $/boe M$ M$ M$ $/boe
Crown Royalty 5.5000 8.5580 0.0 578,604 601,278 137,184 464,094 26.13 525,061 137,184 387,877 21.84Non-crown Royalty 0.0000 0.0000 5.0 361,757 382,591 116,698 265,894 14.97 346,833 116,698 230,136 12.96Mineral Tax 0.0000 0.0000 8.0 290,146 308,403 106,452 201,951 11.37 284,205 106,452 177,753 10.01
10.0 254,810 271,474 100,326 171,147 9.64 252,450 100,326 152,124 8.5712.0 226,215 241,451 94,696 146,754 8.26 226,300 94,696 131,603 7.4115.0 192,371 205,774 87,073 118,701 6.68 194,781 87,073 107,708 6.0620.0 151,920 162,958 76,219 86,738 4.88 156,228 76,219 80,009 4.50
Evaluator: Werth, James P.Run Date: February 16, 2012 11:30:20
1121357 Total Proved Plus Probable, GLJ (2012-01), pri February 16, 2012 12:53:33
Page: 94 of 102
Petroleum ConsultantsGLJ

Company: Corridor Resources Inc. Reserve Class: PPPProperty: Corporate Development Class: TotalDescription: After Tax Analysis Pricing: GLJ (2012-01)
Effective Date: December 31, 2011
Economic Forecast
PRODUCTION FORECAST
Light/Medium Oil Production Solution Gas Production Residue Gas Production
Company Wells Company Company Company Company Company CompanyDaily Yearly Net Yearly Price Daily Yearly Net Yearly Price Daily Yearly Net Yearly Price
Year Oil Gas bbl/d Mbbl Mbbl $/bbl Mcf/d MMcf MMcf $/Mcf Mcf/d MMcf MMcf $/Mcf
2012 0 22 0 0 0 0.00 0 0 0 0.00 9,743 3,556 3,361 3.502013 2 27 184 67 61 101.34 144 52 47 4.17 12,826 4,682 4,390 4.172014 4 32 385 140 127 98.28 301 110 99 4.70 20,999 7,665 7,087 4.702015 4 38 365 133 121 96.24 286 104 94 5.24 28,404 10,367 9,520 5.242016 4 43 237 87 78 96.24 186 68 61 5.77 36,503 13,323 12,197 5.772017 4 47 159 58 52 96.24 124 45 41 6.31 39,415 14,387 13,158 6.312018 4 49 114 42 38 97.62 89 33 29 6.59 39,870 14,553 13,268 6.592019 4 51 86 31 28 99.69 67 25 22 6.73 36,765 13,419 12,200 6.732020 4 51 67 25 22 101.80 53 19 17 6.88 32,029 11,691 10,641 6.882021 4 51 54 20 18 103.96 42 15 14 7.03 28,065 10,244 9,336 7.032022 4 51 44 16 15 106.15 35 13 11 7.17 24,974 9,115 8,322 7.172023 4 51 37 14 12 108.39 29 11 10 7.31 22,437 8,190 7,491 7.31Sub. 632 572 98.47 494 447 5.55 121,191 110,971 6.22Rem. 62 56 117.93 48 44 7.92 94,999 86,096 9.40Tot. 694 628 100.20 543 491 5.76 216,189 197,067 7.62
Total Gas Production Condensate Production Total Oil + NGL Production
Company Company Company Company Company CompanyDaily Yearly Net Yearly Price Daily Yearly Net Yearly Price Daily Yearly Net Yearly Price
Year Mcf/d MMcf MMcf $/Mcf bbl/d Mbbl Mbbl $/bbl bbl/d Mbbl Mbbl $/bbl
2012 9,743 3,556 3,361 3.50 12 5 4 86.50 12 5 4 86.502013 12,970 4,734 4,437 4.17 17 6 6 86.50 200 73 66 100.122014 21,300 7,774 7,186 4.70 27 10 9 83.44 412 150 136 97.302015 28,689 10,472 9,615 5.24 37 13 12 81.40 402 147 133 94.892016 36,688 13,391 12,259 5.77 47 17 16 81.40 284 104 94 93.802017 39,539 14,432 13,199 6.31 50 18 17 81.40 209 76 69 92.662018 39,959 14,585 13,297 6.59 51 19 17 82.78 165 60 55 93.032019 36,832 13,444 12,222 6.73 47 17 16 84.85 133 49 44 94.442020 32,082 11,710 10,659 6.88 41 15 14 86.96 108 40 36 96.192021 28,107 10,259 9,350 7.03 36 13 12 89.11 90 33 30 98.032022 25,008 9,128 8,333 7.17 32 12 11 91.31 76 28 25 99.942023 22,466 8,200 7,500 7.31 29 10 10 93.55 66 24 22 101.92Sub. 121,685 111,419 6.22 155 142 85.17 788 714 95.84Rem. 95,047 86,140 9.40 121 110 126.28 183 166 123.46Tot. 216,732 197,558 7.61 277 252 103.20 971 880 101.05
Total Oil Equiv. Production
Company CompanyDaily Yearly Net Yearly Price
Year boe/d Mboe Mboe $/boe
2012 1,636 597 564 21.502013 2,362 862 806 31.382014 3,962 1,446 1,334 35.412015 5,184 1,892 1,735 36.362016 6,399 2,336 2,137 37.272017 6,799 2,482 2,269 39.542018 6,825 2,491 2,271 40.812019 6,272 2,289 2,081 41.502020 5,455 1,991 1,812 42.342021 4,774 1,743 1,588 43.212022 4,244 1,549 1,414 44.022023 3,810 1,391 1,272 44.85Sub. 21,068 19,284 39.48Rem. 16,024 14,522 57.19Tot. 37,093 33,807 47.13
1121357 Total PPP, GLJ (2012-01), pri February 16, 2012 12:53:41
Page: 95 of 102
Petroleum ConsultantsGLJ

Page 2
REVENUE AND EXPENSE FORECAST
Revenue Before BurdensRoyalty Burdens Gas Processing Total Net
Working Interest Royalty Company Pre-Processing Allowance Royalty Revenue Operating ExpensesInterest Interest After After
Oil Gas NGL+Sul Total Total Total Crown Other Crown Other Process. Royalty Fixed Variable TotalYear M$ M$ M$ M$ M$ M$ M$ M$ M$ M$ M$ M$ M$ M$ M$
2012 0 12,447 393 12,839 0 12,839 706 0 0 0 706 12,133 2,766 676 3,4422013 6,797 19,736 523 27,055 0 27,055 1,916 0 0 0 1,916 25,139 2,909 1,242 4,1522014 13,797 36,573 828 51,198 0 51,198 4,141 0 0 0 4,141 47,057 3,143 2,231 5,3732015 12,834 54,867 1,088 68,789 0 68,789 5,797 0 0 0 5,797 62,992 3,366 2,784 6,1502016 8,342 77,319 1,391 87,052 0 87,052 7,449 0 0 0 7,449 79,602 3,598 3,200 6,7982017 5,568 91,052 1,499 98,120 0 98,120 8,433 0 0 0 8,433 89,687 3,802 3,331 7,1332018 4,059 96,055 1,541 101,654 0 101,654 9,005 0 0 0 9,005 92,649 3,943 3,343 7,2862019 3,127 90,418 1,456 95,001 0 95,001 8,643 0 0 0 8,643 86,358 4,084 3,105 7,1892020 2,502 80,507 1,300 84,309 0 84,309 7,580 0 0 0 7,580 76,729 4,169 2,744 6,9122021 2,047 72,077 1,167 75,292 0 75,292 6,683 0 0 0 6,683 68,609 4,252 2,441 6,6932022 1,717 65,408 1,064 68,189 0 68,189 5,951 0 0 0 5,951 62,238 4,337 2,208 6,5452023 1,467 59,932 979 62,378 0 62,378 5,337 0 0 0 5,337 57,041 4,424 2,017 6,441Sub. 62,257 756,390 13,229 831,875 0 831,875 71,643 0 0 0 71,643 760,233 44,794 29,321 74,115Rem. 7,284 893,802 15,320 916,405 0 916,405 86,184 0 0 0 86,184 830,221 110,815 29,285 140,100Tot. 69,541 1,650,192 28,548 1,748,281 0 1,748,281 157,827 0 0 0 157,827 1,590,454 155,608 58,606 214,214Disc 43,149 522,986 9,321 575,456 0 575,456 49,831 0 0 0 49,831 525,625 39,096 20,403 59,499
Net Net Capital Investment Before Tax Cash FlowMineral Capital NPI Prod'n Other Aband. Oper.
Tax Tax Burden Revenue Income Costs Income Dev. Plant Tang. Total Annual Cum. 10.0% DcfYear M$ M$ M$ M$ M$ M$ M$ M$ M$ M$ M$ M$ M$ M$
2012 0 0 0 8,692 1,971 0 10,663 0 0 0 0 10,663 10,663 10,1672013 0 0 0 20,987 2,136 0 23,123 19,548 0 0 19,548 3,575 14,238 13,2652014 0 0 0 41,683 2,929 0 44,612 45,413 0 0 45,413 -801 13,437 12,6342015 0 0 0 56,842 4,078 531 60,389 37,323 0 0 37,323 23,066 36,503 29,1582016 0 0 0 72,804 5,267 0 78,071 52,757 0 0 52,757 25,314 61,816 45,6422017 0 0 0 82,554 5,757 414 87,897 25,703 0 0 25,703 62,194 124,010 82,4632018 0 0 0 85,363 5,583 0 90,946 19,663 0 0 19,663 71,283 195,293 120,8272019 0 0 0 79,169 4,792 0 83,960 10,028 0 0 10,028 73,932 269,225 157,0012020 0 0 0 69,817 4,162 0 73,979 0 0 0 0 73,979 343,204 189,9062021 0 0 0 61,915 3,650 0 65,565 0 0 0 0 65,565 408,769 216,4182022 0 0 0 55,693 3,261 0 58,954 0 0 0 0 58,954 467,723 238,0902023 0 0 0 50,600 2,942 0 53,541 0 0 0 0 53,541 521,265 255,983Sub. 0 0 0 686,118 46,526 945 731,700 210,435 0 0 210,435 521,265 521,265 255,983Rem. 0 0 0 690,121 34,449 28,828 695,743 0 0 0 0 695,743 1,217,007 351,488Tot. 0 0 0 1,376,240 80,976 29,773 1,427,443 210,435 0 0 210,435 1,217,007 1,217,007 351,488Disc 0 0 0 466,126 31,785 1,894 496,016 144,528 0 0 144,528 351,488 351,488 351,488
AFTER TAX ANALYSIS
Tax Pool Balances Incl. Current Year Additions Depreciation & WriteoffsOper.
Income CCA COGPE CDE CEE Other CCA COGPE CDE CEE Other TotalYear M$ M$ M$ M$ M$ M$ M$ M$ M$ M$ M$ M$
2012 10,663 39,561 3,091 80,063 72,387 626 5,960 309 24,019 0 0 30,2882013 23,123 33,601 2,782 75,592 72,387 626 4,627 278 22,678 0 0 27,5832014 44,612 28,974 2,504 98,328 72,387 626 3,621 250 29,498 10,616 626 44,6122015 60,389 25,353 2,253 106,152 61,771 0 2,861 225 31,846 25,457 0 60,3892016 78,071 22,492 2,028 127,064 36,314 0 2,285 203 38,119 36,314 0 76,9212017 87,897 20,207 1,825 114,648 0 0 1,847 183 34,394 0 0 36,4242018 90,946 18,360 1,643 99,916 0 0 1,513 164 29,975 0 0 31,6532019 83,960 16,847 1,478 79,969 0 0 1,258 148 23,991 0 0 25,3972020 73,979 15,588 1,331 55,979 0 0 1,062 133 16,794 0 0 17,9882021 65,565 14,527 1,198 39,185 0 0 910 120 11,755 0 0 12,7852022 58,954 13,617 1,078 27,429 0 0 791 108 8,229 0 0 9,1282023 53,541 12,826 970 19,201 0 0 698 97 5,760 0 0 6,555Sub. 731,700 12,826 970 19,201 0 0 27,433 2,218 277,058 72,387 626 379,722Rem. 695,743 12,826 970 19,201 0 0 9,697 857 13,440 0 0 23,994Tot. 1,427,443 12,826 970 19,201 0 0 37,130 3,075 290,498 72,387 626 403,716Disc 496,016 21,218 1,621 182,214 50,250 493 255,796
1121357 Total PPP, GLJ (2012-01), pri February 16, 2012 12:53:41
Page: 96 of 102
Petroleum ConsultantsGLJ

Page 3Federal Provincial Net Cash Flow Net Cash Flow
ARTD & Income Before Income Tax After Income TaxTaxable Tax Income Tax Income Investment TaxIncome Rate Tax Rate Tax Credits Payable Annual Cum. 10.0% Dcf Annual Cum. 10.0% Dcf
Year M$ % M$ % M$ M$ M$ M$ M$ M$ M$ M$ M$
2012 -19,625 15.0 0 12.8 0 0 0 10,663 10,663 10,167 10,663 10,663 10,1672013 -4,460 15.0 0 12.8 0 0 0 3,575 14,238 13,265 3,575 14,238 13,2652014 0 15.0 0 12.8 0 0 0 -801 13,437 12,634 -801 13,437 12,6342015 0 15.0 0 12.8 0 0 0 23,066 36,503 29,158 23,066 36,503 29,1582016 1,150 15.0 0 12.8 0 0 0 25,314 61,816 45,642 25,314 61,816 45,6422017 51,473 15.0 4,281 12.8 3,639 0 7,919 62,194 124,010 82,463 54,274 116,091 77,7742018 59,293 15.0 8,894 12.8 7,560 0 16,454 71,283 195,293 120,827 54,829 170,920 107,2832019 58,564 15.0 8,785 12.8 7,467 0 16,251 73,932 269,225 157,001 57,681 228,601 135,5052020 55,990 15.0 8,399 12.8 7,139 0 15,537 73,979 343,204 189,906 58,441 287,042 161,5002021 52,780 15.0 7,917 12.8 6,730 0 14,647 65,565 408,769 216,418 50,919 337,961 182,0902022 49,826 15.0 7,474 12.8 6,353 0 13,827 58,954 467,723 238,090 45,127 383,088 198,6782023 46,986 15.0 7,048 12.8 5,991 0 13,039 53,541 521,265 255,983 40,503 423,591 212,214Sub. 351,978 52,797 44,877 0 97,674 521,265 521,265 255,983 423,591 423,591 212,214Rem. 671,748 102,078 86,766 0 188,844 695,743 1,217,007 351,488 506,899 930,490 282,516Tot. 1,023,726 154,874 131,643 0 286,517 1,217,007 1,217,007 351,488 930,490 930,490 282,516Disc 240,220 37,282 31,690 0 68,972 351,488 351,488 351,488 282,516 282,516 282,516
SUMMARY OF RESERVES
Remaining Reserves at Jan 01, 2012 Oil Equivalents Reserve Life Indic. (yr)
Working Roy/NPI Total Oil Eq. Company % of Reserve Life HalfProduct Units Interest Interest Company Net Factor Mboe Total Life Index Life
Light/Med Oil Mbbl 694 0 694 628 1.000 694 2 22.0 10.3 4.1Solution Gas MMcf 543 0 543 491 6.000 90 0 22.0 10.3 4.1Residue Gas MMcf 216,189 0 216,189 197,067 6.000 36,032 97 50.0 60.8 10.5Total: Gas MMcf 216,732 0 216,732 197,558 6.000 36,122 97 50.0 60.9 10.4Gas Heat Content BBtu 229,736 0 229,736 209,412 0.000 0 0 50.0 60.9 10.4Condensate Mbbl 277 0 277 252 1.000 277 1 50.0 60.9 10.4Total: Oil+NGL Mbbl 971 0 971 880 1.000 971 3 50.0 213.9 5.1Total: Oil Eq. Mboe 37,093 0 37,093 33,807 1.000 37,093 100 50.0 62.1 10.3
PRODUCT REVENUE AND EXPENSES
Average First Year Unit Values Net Revenue After Royalties
Wellhead Operating Other Prod'n Undisc % of 10% Disc % ofProduct Units Base Price Price Adjust. Price Net Burdens Expenses Expenses Revenue M$ Total M$ Total
Light/Med Oil $/bbl 0.00 0.00 0.00 0.00 0.00 0.00 0.00 62,934 4 39,050 7Solution Gas $/Mcf 0.00 0.00 0.00 0.00 0.00 0.00 0.00 2,831 0 1,682 0Residue Gas $/Mcf 3.29 0.21 3.50 0.19 0.97 0.00 2.34 1,498,698 94 476,361 91Total: Gas $/Mcf 3.29 0.21 3.50 0.19 0.97 0.00 2.34 1,501,529 94 478,043 91Condensate $/bbl 107.14 -20.64 86.50 4.76 0.00 0.00 81.75 25,991 2 8,532 2Total: Oil+NGL $/bbl 107.14 -20.64 86.50 4.76 0.00 0.00 81.75 88,925 6 47,582 9Total: Oil Eq. $/boe 20.42 1.08 21.50 1.18 5.76 0.00 14.55 1,590,454 100 525,625 100
REVENUE BURDENS AND NET PRESENT VALUE SUMMARY
Net Present Value Before Income Tax Net Present Value After Income Tax
Revenue Burdens (%) Disc. Prod'n Operating Capital Cash Flow Operating Capital Cash FlowRate Revenue Income Invest. Income Invest.
Initial Average % M$ M$ M$ M$ $/boe M$ M$ M$ $/boe
Crown Royalty 5.5000 9.0276 0.0 1,376,240 1,427,443 210,435 1,217,007 32.81 1,140,925 210,435 930,490 25.09Non-crown Royalty 0.0000 0.0000 5.0 725,658 766,830 173,116 593,714 16.01 639,896 173,116 466,780 12.58Mineral Tax 0.0000 0.0000 8.0 547,735 581,604 155,092 426,512 11.50 495,070 155,092 339,978 9.17
10.0 466,126 496,016 144,528 351,488 9.48 427,044 144,528 282,516 7.6212.0 402,912 429,477 134,965 294,512 7.94 373,534 134,965 238,570 6.4315.0 331,245 353,809 122,243 231,566 6.24 311,876 122,243 189,632 5.1120.0 249,991 267,750 104,598 163,152 4.40 240,441 104,598 135,843 3.66
Evaluator: Werth, James P.Run Date: February 16, 2012 11:30:22
1121357 Total PPP, GLJ (2012-01), pri February 16, 2012 12:53:41
Page: 97 of 102
Petroleum ConsultantsGLJ

APPENDIX I
CERTIFICATES OF QUALIFICATION
Jodi L. Anhorn
T. Mark Jobin
James P. Werth
Roger J. Mahoney
Page: 98 of 102
Petroleum ConsultantsGLJ

CERTIFICATION OF QUALIFICATION
I, Jodi L. Anhorn, Professional Engineer, 4100, 400 - 3rd Avenue S.W., Calgary, Alberta, Canada
hereby certify:
1. That I am an employee of GLJ Petroleum Consultants Ltd., which company did prepare a
detailed analysis of Canadian oil and gas properties of Corridor Resources Inc (the
“Company”). The effective date of this evaluation is December 31, 2011.
2. That I do not have, nor do I expect to receive any direct or indirect interest in the securities of
the Company or its affiliated companies.
3. That I attended the University of Calgary and that I graduated with a Master of Science
Degree in Chemical and Petroleum Engineering in 1992; that I am a Registered Professional
Engineer in the Province of Alberta; and that I have in excess of nineteen years experience in
engineering studies relating to Canadian and International oil and gas fields.
4. That a personal field inspection of the properties was not made; however, such an inspection
was not considered necessary in view of the information available from public information
and records, the files of the Company, and the appropriate provincial regulatory authorities.
ORIGINALLY SIGNED BY
Jodi L. Anhorn, M.Sc., P. Eng.
Page: 99 of 102
Petroleum ConsultantsGLJ

CERTIFICATION OF QUALIFICATION
I, T. Mark Jobin, Professional Geologist, 4100, 400 - 3rd Avenue S.W., Calgary, Alberta, Canada
hereby certify:
1. That I am an employee of GLJ Petroleum Consultants Ltd., which company did prepare a
detailed analysis of Canadian oil and gas properties of Corridor Resources Inc. (the
“Company”). The effective date of this evaluation is December 31, 2011.
2. That I do not have, nor do I expect to receive any direct or indirect interest in the securities of
the Company or its affiliated companies.
3. That I attended the University of Calgary and that I graduated in 1984 with a Bachelor of
Science Degree in Geology; that I am a Registered Professional Geologist in the Province of
Alberta; and, that I have in excess of twenty-seven years experience in geological studies
relating to Canadian and International oil and gas fields.
4. That a personal field inspection of the properties was not made; however, such an inspection
was not considered necessary in view of the information available from public information
and records, the files of the Company, and the appropriate provincial regulatory authorities.
ORIGINALLY SIGNED BY
T. Mark Jobin, P. Geol.
Page: 100 of 102
Petroleum ConsultantsGLJ

CERTIFICATION OF QUALIFICATION
I, James P. Werth, Professional Engineer, 4100, 400 - 3rd Avenue S.W., Calgary, Alberta, Canada
hereby certify:
1. That I am an employee of GLJ Petroleum Consultants Ltd., which company did prepare a
detailed analysis of Canadian oil and gas properties of Corridor Resources Inc. (the
“Company”). The effective date of this evaluation is December 31, 2011.
2. That I do not have, nor do I expect to receive any direct or indirect interest in the securities of
the Company or its affiliated companies.
3. That I attended the University of Manitoba and that I graduated with a Bachelor of Science
Degree in Civil Engineering in 1979; that I am a Registered Professional Engineer in the
Province of Alberta; and, that I have in excess of thirty-two years experience in engineering
studies relating to Canadian and International oil and gas fields.
4. That a personal field inspection of the properties was not made; however, such an inspection
was not considered necessary in view of the information available from public information
and records, the files of the Company, and the appropriate provincial regulatory authorities.
ORIGINALLY SIGNED BY
James P. Werth, P. Eng.
Page: 101 of 102
Petroleum ConsultantsGLJ
CERTIFICATION OF QUALIFICATION
I, Roger J. Mahoney, Professional Geophysicist, 230 - 38th Avenue S.W., Calgary, Alberta, Canada
hereby certify:
1. That I have been retained by GLJ Petroleum Consultants Ltd., which company did prepare a
detailed analysis of Canadian oil and gas properties of Corridor Resources Inc. (the
“Company”). The effective date of this evaluation is December 31, 2011.
2. That I do not have, nor do I expect to receive any direct or indirect interest in the securities of
the Company or its affiliated companies.
3. That I attended the University of Manchester and that I graduated with a Bachelor of Science
Degree in Physics with Honours in 1964; that I am a Registered Professional Geophysicist in
the Province of Alberta; and, that I have in excess of forty-five years experience in
geophysical studies relating to Canadian and International oil and gas fields.
4. That a personal field inspection of the properties was not made; however, such an inspection
was not considered necessary in view of the information available from public information
and records, the files of the Company, and the appropriate provincial regulatory authorities.
ORIGINALLY SIGNED BY
Roger J. Mahoney, P. Geoph.
Page: 102 of 102
Petroleum ConsultantsGLJ