correlation of fe-based superconductivity and electron-phonon coupling ... · correlation of...
TRANSCRIPT

Correlation of Fe-Based Superconductivity and Electron-Phonon Couplingin an FeAs=Oxide Heterostructure
Seokhwan Choi,1 Steven Johnston,2 Won-Jun Jang,1,3,† Klaus Koepernik,4 Ken Nakatsukasa,2 Jong Mok Ok,5
Hyun-Jung Lee,5 Hyun Woo Choi,1 Alex Taekyung Lee,6 Alireza Akbari,5,7 Yannis K. Semertzidis,1,3
Yunkyu Bang,8 Jun Sung Kim,5 and Jhinhwan Lee1,*1Department of Physics, Korea Advanced Institute of Science and Technology, Daejeon 34141, Korea2Department of Physics and Astronomy, University of Tennessee, Knoxville, Tennessee 37996, USA
3Center for Axion and Precision Physics Research, Institute for Basic Science (IBS),Daejeon 34051, Korea
4IFW Dresden, P.O. Box 270116 Dresden, Germany5Department of Physics, Pohang University of Science and Technology, Pohang 37673, Korea
6Department of Applied Physics and Applied Mathematics, Columbia University, New York, New York 10027, USA7Asia Pacific Center for Theoretical Physics, Pohang 37673, Korea
8Department of Physics, Chonnam National University, Gwangju 61186, Korea(Received 10 May 2017; published 8 September 2017)
Interfacial phonons between iron-based superconductors (FeSCs) and perovskite substrates havereceived considerable attention due to the possibility of enhancing preexisting superconductivity. Usingscanning tunneling spectroscopy, we studied the correlation between superconductivity and e-phinteraction with interfacial phonons in an iron-based superconductor Sr2VO3FeAs (Tc ≈ 33 K) madeof alternating FeSC and oxide layers. The quasiparticle interference measurement over regions withsystematically different average superconducting gaps due to the e-ph coupling locally modulated by Ovacancies in the VO2 layer, and supporting self-consistent momentum-dependent Eliashberg calculationsprovide a unique real-space evidence of the forward-scattering interfacial phonon contribution to the totalsuperconducting pairing.
DOI: 10.1103/PhysRevLett.119.107003
The discovery of high temperature superconductivity inmonolayer iron-based superconductors (FeSC) on perov-skite substrates [1–7] has attracted broad attention due tothe possibility of achieving Tc in the FeSCs comparable tothe cuprate superconductors. Importantly, these interfacesystems suggest an entirely new mechanism for enhancingsuperconductivity, applicable to a broad range of layeredsuperconducting heterostructures: forward-scattering inter-facial phonons [2,4,6,7]. This principle is evidenced by anangle-resolved photoemission spectroscopy (ARPES)study [2], which revealed that the increased Tc inFeSe=SrTiO3 coincides with the appearance of the replicabands as the thickness of the FeSe layers is varied. Forwardscattering by interfacial phonons is believed to producethese replicas, and this interaction has been proposed as ageneral means to enhance Tc in heterostructures [6].However, (i) a definitive example of this principle in abulk heterostructure suitable for practical application and(ii) a direct real-space evidence of interfacial-phononenhanced superconductivity are currently lacking.To solve these issues, a bulk heterostructure made of
alternating FeSC monolayers and perovskite layers hasbeen suggested [4,6]. Interestingly, an iron-based super-conductor Sr2VO3FeAs with highest Tc ≈ 33 K among allthe 21311 family [8–11] has a structure nearly equivalent to
the suggestions and, therefore, is a unique bulk candidatesuitable for investigating the effect of interfacial phononson superconductivity. Sr2VO3FeAs also exhibits self-doping by interlayer charge transfer between the perovskiteSr2VO3 layers and the FeAs layer [12], and shows apreferred and reproducible symmetric cleavage at theSrO-SrO interface. These properties make it an idealsystem for surface spectroscopic study using a real-spaceprobe, i.e., scanning tunneling microscopy and spectros-copy (STM-STS). STM-STS has been used to map thespatial inhomogeneity of the superconducting gap in manyunconventional superconductors, and the correlationsbetween the gap and the locations of dopant atoms,magnetic vortices, or the supermodulation of lattices havebeen widely studied [13–19].In this Letter, we report quasiparticle interference (QPI)
measurements on the bulk heterostructured superconductorSr2VO3FeAs grown using the self-flux technique [10]. Weobserve both the filled and empty state replica bands in theQPI data, which is spectroscopic evidence of e-ph couplingwith forward-scattering phonons. We notice variouschanges in the renormalized bands in regions with sys-tematically different superconducting gaps due to locallyvarying e-ph coupling near particular defects. These wouldconstitute a unique demonstration of enhancement of
PRL 119, 107003 (2017) P HY S I CA L R EV I EW LE T T ER Sweek ending
8 SEPTEMBER 2017
0031-9007=17=119(10)=107003(6) 107003-1 © 2017 American Physical Society

superconductivity by forward-scattering phonons in a bulkheterostructured Fe-based superconductor system where apeak-hump analysis is not allowed.Figure 1(a) shows a SrO-terminated topograph with
randomly oriented C2 domains. These domains are attrib-uted to surface reconstructions since all bulk measurementsconsistently reported no orthorhombic distortion from roomtemperature down to 4.6 K [9–11]. The temperaturedependence of a typical dI=dV spectrum is shown as theinset of Fig. 1(c). The normal state spectrum at T ¼ 140 Kdisplays an asymmetric shape common to many FeSCs[20,21]. At lower temperatures, we further observe theopening of a spectroscopic gap at T ∼ 30 K, which isevident in both the temperature dependent averaged spectra[Fig. 1(d)] and the QPI intensity [Figs. 2(c) and S2 in theSupplemental Material [22]] near the Fermi level (EF).Overall it is consistent with the Tc observed in bulkmagnetic susceptibility measurements [inset of Fig. 1(a)].The electron density plot obtained from band structurecalculations integrated near the Fermi level shows that theelectron tunneling of STM primarily probes the FeAs layerfor bias voltages near EF and is thus sensitive to the bulk
FeAs bands [22]. We therefore ascribe the gap near EF tothe bulk superconducting gap. We also observe an addi-tional temperature dependent peak around −18 meV andthe finite zero-bias dI=dV not often found in other FeSCswith simpler structures [35–38]. At this time theirorigins are not clear; however, they are not significant inreaching the main conclusion of this Letter. At least they arevirtually independent of the topmost SrO layer surfacereconstruction (see the Supplemental Material [22], Sec. X,Refs. [39,40]). The −18 meV peak may be related to (i) theholelike β band located below the α band [resulting in bluedashed curve in Fig. 2(c) with m� ≈ 4.2me], (ii) spin-density-wave (SDW) gap edges associated with the Femagnetic order experimentally observed in 75As NMRexperiment below 45 K [10,20], and/or (iii) many bodyeffects related to doping the strongly correlated V-derivedHubbard bands [22].To image the renormalized band structure for both filled
and empty states with sufficiently high resolution suitablefor mask-based QPI analysis, we performed spectroscopicimaging STM (SI-STM) measurements with higher spatialand energy resolutions than typically required: Fig. 2(c)shows a Fourier-transformed (q-space) image of QPI basedon a ð300 nmÞ2, 512 × 512 pixel dI=dV map taken over anenergy range [−40 meV, þ40 meV] with 201 energylayers. There we see a dominant parabolic band that crossesEF with a band minimum near −12 meV, consistent withthe shallow electronlike Fe dxz=dyz-derived α band at the Γpoint observed marginally by ARPES in Sr2VO3FeAs[41,42] and clearly in other FeSC under certain dopingconditions [43,44]. From its intraband QPI dispersion(denoted α-α) in Fig. 2(c), we extract a light effectivemassm� ≈ 0.47me, implying a large in-plane overlap of theFe orbitals making up this band. The possibility that thisband originates from the M electron pocket is ruled outbecause of its small pocket size and light effective masscompared with the M bands observed in ARPES [41–44].The superconducting gap observed in our dI=dV spectra isvisible as reduced intensity at EF in the cross section of theα-αQPI dispersion [Fig. 2(c)]. The gap is also weakened byapplication of a magnetic field and suppressed at temper-atures above the bulk Tc [Fig. S2], which show that it isrelated to bulk superconductivity and that the α bandelectrons participate in superconducting pairing.The signatures of e-ph coupling are clear in the QPI data,
as shown in Fig. 2(c). For example, the filled-state portionof the α-α QPI dispersion has a replica band (α00-α00) shifteddown by about 14 meV (≈ phonon energy Ωph), whichpersists well above Tc (see Fig. S2 in the SupplementalMaterial [22]). This is reminiscent of the replica bands ofthe M electron pockets persisting well above Tc in ARPESexperiments on the FeSe=SrTiO3 system [2,7,45,46]. Theempty-state portion of the α-α band also has a replica band(α0-α0) shifted up by ∼Ωph. Self-consistent high-order e-phcalculations [45] explain these replica features reasonably
dI/d
V (
a.u.
)
0.0
0.1
0.2
-0.1
-0.2
20 40-40 -20 0Vbias (meV)
Ave
rage
ddI
/dV
(a.
u.)
4.6 K
10 K15 K20 K25 K
30 K40 K
60 K100 K
140 K
160 K
Vbias (meV)-40 -20 20 400
0.3
dI/d
V (
a.u.
)
20-20 0Vbias (meV)
4.6 K140 K4.6 K 140 K
(d)
(c)
8.5
5.5
(meV
)0 10 20 30 40
T (K)
(10-3
em
u/g) 0
-2
-4
FC
ZFC
TC ~ 33 K
ab
Pro
babi
lity
0.1
0.2
0.05 7 9
(meV)
(b)
(a)
10 nm
10 nm
5 nm
FIG. 1. (a) Topograph of the SrO-terminated surface ofSr2VO3FeAs showing quasi-C2-symmetric surface reconstruc-tions. The lower right inset shows the magnetic susceptibility vstemperature, showing bulk superconductivity near 33 K.(b) Superconducting gap (Δ) map taken over the same areashown in the topograph of (a). (c) Averaged spectra (inset) takenat 4.6 and 140 K and their difference showing the superconduct-ing gap near the Fermi level marked with arrows. (d) Temperaturedependence of spatially averaged tunneling spectra. The errorbars in (c) and (d) correspond to 0.5 times the standard deviationtaken over 256 different locations.
PRL 119, 107003 (2017) P HY S I CA L R EV I EW LE T T ER Sweek ending
8 SEPTEMBER 2017
107003-2
(b)
(c)
-
40
Vbi
as (
meV
)
-
0
40
20
20
high
low
Ene
rgy
(meV
)
0
40
0
-40
ky
/a0
0kx
(a)
20 meV
14 meV
6 meV
0 meV
-6 meV
-12 meV
-18 meV
-24 meV
30 meV
26 meV
34 meV
high
low
b (0, )
a( ,0)
k ( /a0)
q (2 /a0)
(g)
(d)Phonon Dispersion andSimulated SF
0.125 0.125
(e)Experiment Symmetric breathing optical modeSimulated QPI
0.125 0.1250 0.125 0.1250
40
Vbi
as (
meV
)
-
0
40
20
20
40
Vbi
as (
meV
)
-
0
40
20
20
SrO
FeAs
= 13.1 (meV)
V
(f) 80
60
40
20
0
Ene
rgy
(meV
)
high
low
high
low
q (2 /a0)
/a0- /a0
- /a0
( )
a
40 meV
0
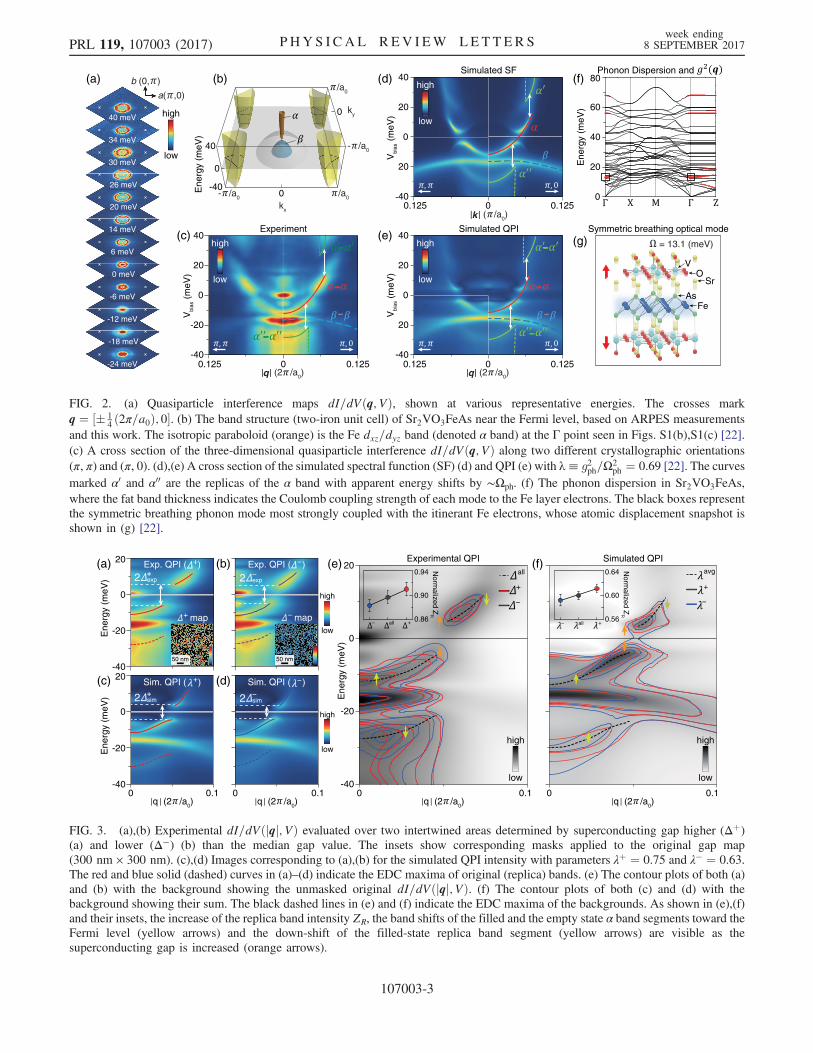
FIG. 2. (a) Quasiparticle interference maps dI=dVðq; VÞ, shown at various representative energies. The crosses markq ¼ ½� 1
4ð2π=a0Þ; 0�. (b) The band structure (two-iron unit cell) of Sr2VO3FeAs near the Fermi level, based on ARPES measurements
and this work. The isotropic paraboloid (orange) is the Fe dxz=dyz band (denoted α band) at the Γ point seen in Figs. S1(b),S1(c) [22].(c) A cross section of the three-dimensional quasiparticle interference dI=dVðq; VÞ along two different crystallographic orientations(π, π) and (π, 0). (d),(e) A cross section of the simulated spectral function (SF) (d) and QPI (e) with λ≡ g2ph=Ω2
ph ¼ 0.69 [22]. The curvesmarked α0 and α00 are the replicas of the α band with apparent energy shifts by ∼Ωph. (f) The phonon dispersion in Sr2VO3FeAs,where the fat band thickness indicates the Coulomb coupling strength of each mode to the Fe layer electrons. The black boxes representthe symmetric breathing phonon mode most strongly coupled with the itinerant Fe electrons, whose atomic displacement snapshot isshown in (g) [22].
(a) (b)
high
low
2 exp
Exp. QPI ( )+
map
50 nm
20
0
-20Ene
rgy
(meV
)
-40
Experimental QPI
(c) +Sim. QPI ( )20
0
-20Ene
rgy
(meV
)
-400.1
(d)
high
low
Sim. QPI ( )
0 0.1 0.1q (2 /a0)q (2 /a0)q (2 /a0)
0 0
(e)
Ene
rgy
(meV
)
20
0
-40
-20
all
+
high
low
0q (2 /a0)
0.1
Simulated QPI(f)avg
+
high
low
Exp. QPI ( )
map
50 nm
2 exp
2 sim 2 sim
Norm
alized ZR
0.64
0.60
0.56all
0.86
0.90
all
Norm
alized ZR
0.94
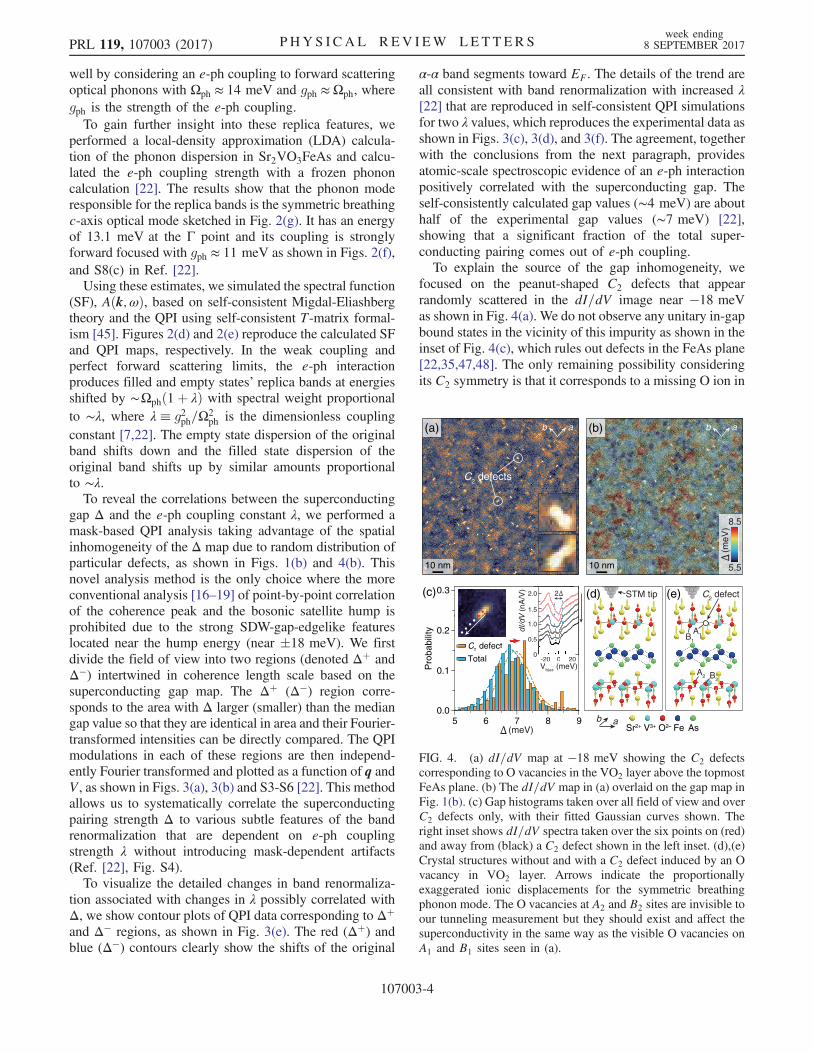
FIG. 3. (a),(b) Experimental dI=dVðjqj; VÞ evaluated over two intertwined areas determined by superconducting gap higher (Δþ)(a) and lower (Δ−) (b) than the median gap value. The insets show corresponding masks applied to the original gap map(300 nm × 300 nm). (c),(d) Images corresponding to (a),(b) for the simulated QPI intensity with parameters λþ ¼ 0.75 and λ− ¼ 0.63.The red and blue solid (dashed) curves in (a)–(d) indicate the EDC maxima of original (replica) bands. (e) The contour plots of both (a)and (b) with the background showing the unmasked original dI=dVðjqj; VÞ. (f) The contour plots of both (c) and (d) with thebackground showing their sum. The black dashed lines in (e) and (f) indicate the EDC maxima of the backgrounds. As shown in (e),(f)and their insets, the increase of the replica band intensity ZR, the band shifts of the filled and the empty state α band segments toward theFermi level (yellow arrows) and the down-shift of the filled-state replica band segment (yellow arrows) are visible as thesuperconducting gap is increased (orange arrows).
PRL 119, 107003 (2017) P HY S I CA L R EV I EW LE T T ER Sweek ending
8 SEPTEMBER 2017
107003-3
well by considering an e-ph coupling to forward scatteringoptical phonons with Ωph ≈ 14 meV and gph ≈ Ωph, wheregph is the strength of the e-ph coupling.To gain further insight into these replica features, we
performed a local-density approximation (LDA) calcula-tion of the phonon dispersion in Sr2VO3FeAs and calcu-lated the e-ph coupling strength with a frozen phononcalculation [22]. The results show that the phonon moderesponsible for the replica bands is the symmetric breathingc-axis optical mode sketched in Fig. 2(g). It has an energyof 13.1 meV at the Γ point and its coupling is stronglyforward focused with gph ≈ 11 meV as shown in Figs. 2(f),and S8(c) in Ref. [22].Using these estimates, we simulated the spectral function
(SF), Aðk;ωÞ, based on self-consistent Migdal-Eliashbergtheory and the QPI using self-consistent T-matrix formal-ism [45]. Figures 2(d) and 2(e) reproduce the calculated SFand QPI maps, respectively. In the weak coupling andperfect forward scattering limits, the e-ph interactionproduces filled and empty states’ replica bands at energiesshifted by ∼Ωphð1þ λÞ with spectral weight proportionalto ∼λ, where λ≡ g2ph=Ω2
ph is the dimensionless couplingconstant [7,22]. The empty state dispersion of the originalband shifts down and the filled state dispersion of theoriginal band shifts up by similar amounts proportionalto ∼λ.To reveal the correlations between the superconducting
gap Δ and the e-ph coupling constant λ, we performed amask-based QPI analysis taking advantage of the spatialinhomogeneity of the Δ map due to random distribution ofparticular defects, as shown in Figs. 1(b) and 4(b). Thisnovel analysis method is the only choice where the moreconventional analysis [16–19] of point-by-point correlationof the coherence peak and the bosonic satellite hump isprohibited due to the strong SDW-gap-edgelike featureslocated near the hump energy (near �18 meV). We firstdivide the field of view into two regions (denoted Δþ andΔ−) intertwined in coherence length scale based on thesuperconducting gap map. The Δþ (Δ−) region corre-sponds to the area with Δ larger (smaller) than the mediangap value so that they are identical in area and their Fourier-transformed intensities can be directly compared. The QPImodulations in each of these regions are then independ-ently Fourier transformed and plotted as a function of q andV, as shown in Figs. 3(a), 3(b) and S3-S6 [22]. This methodallows us to systematically correlate the superconductingpairing strength Δ to various subtle features of the bandrenormalization that are dependent on e-ph couplingstrength λ without introducing mask-dependent artifacts(Ref. [22], Fig. S4).To visualize the detailed changes in band renormaliza-
tion associated with changes in λ possibly correlated withΔ, we show contour plots of QPI data corresponding to Δþand Δ− regions, as shown in Fig. 3(e). The red (Δþ) andblue (Δ−) contours clearly show the shifts of the original
α-α band segments toward EF. The details of the trend areall consistent with band renormalization with increased λ[22] that are reproduced in self-consistent QPI simulationsfor two λ values, which reproduces the experimental data asshown in Figs. 3(c), 3(d), and 3(f). The agreement, togetherwith the conclusions from the next paragraph, providesatomic-scale spectroscopic evidence of an e-ph interactionpositively correlated with the superconducting gap. Theself-consistently calculated gap values (∼4 meV) are abouthalf of the experimental gap values (∼7 meV) [22],showing that a significant fraction of the total super-conducting pairing comes out of e-ph coupling.To explain the source of the gap inhomogeneity, we
focused on the peanut-shaped C2 defects that appearrandomly scattered in the dI=dV image near −18 meVas shown in Fig. 4(a). We do not observe any unitary in-gapbound states in the vicinity of this impurity as shown in theinset of Fig. 4(c), which rules out defects in the FeAs plane[22,35,47,48]. The only remaining possibility consideringits C2 symmetry is that it corresponds to a missing O ion in
(a)
10 nm
(b)
10 nm
Pro
babi
lity
5 7 96 8
Total
C2 defect
(c)
Sr2+ V3+ O2- Fe As
C2 defect(d) (e)STM tip
ab ab
ab
A1B1
A2 B2
0.1
0.2
0.3
0.0
dI/d
V (
nA/V
)
00
0.5
1.0
1.5
2.0
-20 20Vbias (meV)
C2 defects
8.5
5.5
(meV
)
2
(meV)
Total
C2CC defect
00
0.5
-20 20Vbias (meV)
FIG. 4. (a) dI=dV map at −18 meV showing the C2 defectscorresponding to O vacancies in the VO2 layer above the topmostFeAs plane. (b) The dI=dV map in (a) overlaid on the gap map inFig. 1(b). (c) Gap histograms taken over all field of view and overC2 defects only, with their fitted Gaussian curves shown. Theright inset shows dI=dV spectra taken over the six points on (red)and away from (black) a C2 defect shown in the left inset. (d),(e)Crystal structures without and with a C2 defect induced by an Ovacancy in VO2 layer. Arrows indicate the proportionallyexaggerated ionic displacements for the symmetric breathingphonon mode. The O vacancies at A2 and B2 sites are invisible toour tunneling measurement but they should exist and affect thesuperconductivity in the same way as the visible O vacancies onA1 and B1 sites seen in (a).
PRL 119, 107003 (2017) P HY S I CA L R EV I EW LE T T ER Sweek ending
8 SEPTEMBER 2017
107003-4
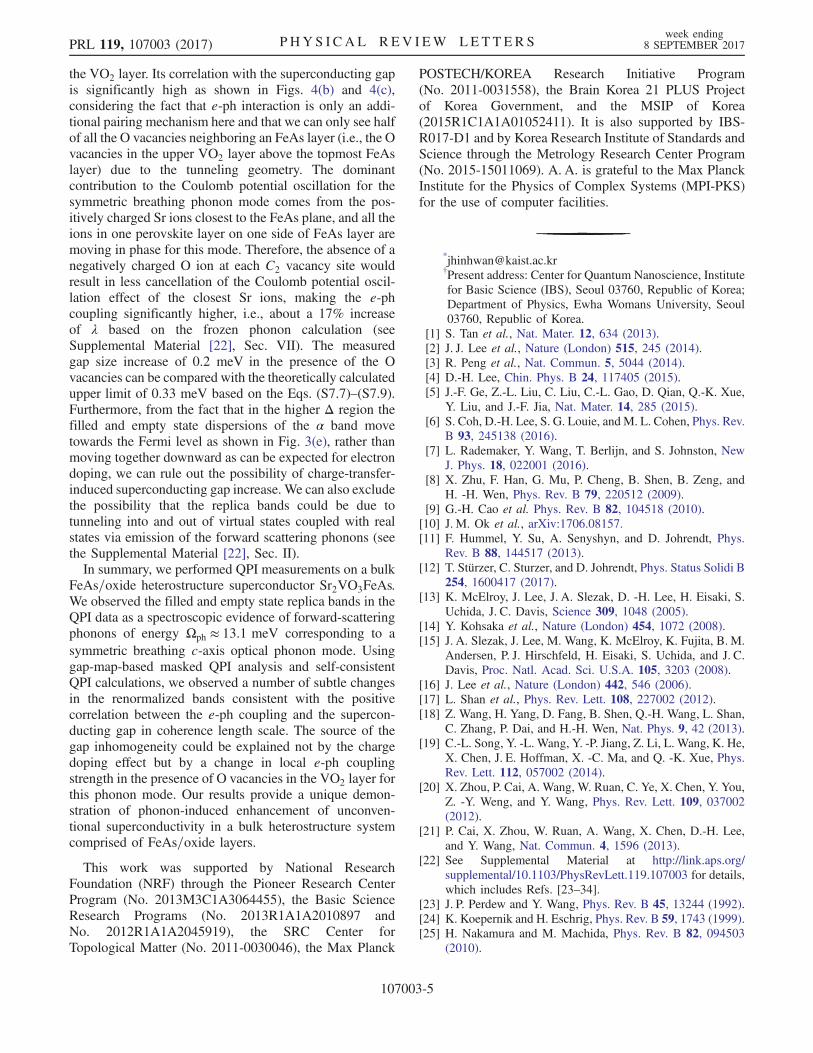
the VO2 layer. Its correlation with the superconducting gapis significantly high as shown in Figs. 4(b) and 4(c),considering the fact that e-ph interaction is only an addi-tional pairing mechanism here and that we can only see halfof all the O vacancies neighboring an FeAs layer (i.e., the Ovacancies in the upper VO2 layer above the topmost FeAslayer) due to the tunneling geometry. The dominantcontribution to the Coulomb potential oscillation for thesymmetric breathing phonon mode comes from the pos-itively charged Sr ions closest to the FeAs plane, and all theions in one perovskite layer on one side of FeAs layer aremoving in phase for this mode. Therefore, the absence of anegatively charged O ion at each C2 vacancy site wouldresult in less cancellation of the Coulomb potential oscil-lation effect of the closest Sr ions, making the e-phcoupling significantly higher, i.e., about a 17% increaseof λ based on the frozen phonon calculation (seeSupplemental Material [22], Sec. VII). The measuredgap size increase of 0.2 meV in the presence of the Ovacancies can be compared with the theoretically calculatedupper limit of 0.33 meV based on the Eqs. (S7.7)–(S7.9).Furthermore, from the fact that in the higher Δ region thefilled and empty state dispersions of the α band movetowards the Fermi level as shown in Fig. 3(e), rather thanmoving together downward as can be expected for electrondoping, we can rule out the possibility of charge-transfer-induced superconducting gap increase. We can also excludethe possibility that the replica bands could be due totunneling into and out of virtual states coupled with realstates via emission of the forward scattering phonons (seethe Supplemental Material [22], Sec. II).In summary, we performed QPI measurements on a bulk
FeAs=oxide heterostructure superconductor Sr2VO3FeAs.We observed the filled and empty state replica bands in theQPI data as a spectroscopic evidence of forward-scatteringphonons of energy Ωph ≈ 13.1 meV corresponding to asymmetric breathing c-axis optical phonon mode. Usinggap-map-based masked QPI analysis and self-consistentQPI calculations, we observed a number of subtle changesin the renormalized bands consistent with the positivecorrelation between the e-ph coupling and the supercon-ducting gap in coherence length scale. The source of thegap inhomogeneity could be explained not by the chargedoping effect but by a change in local e-ph couplingstrength in the presence of O vacancies in the VO2 layer forthis phonon mode. Our results provide a unique demon-stration of phonon-induced enhancement of unconven-tional superconductivity in a bulk heterostructure systemcomprised of FeAs=oxide layers.
This work was supported by National ResearchFoundation (NRF) through the Pioneer Research CenterProgram (No. 2013M3C1A3064455), the Basic ScienceResearch Programs (No. 2013R1A1A2010897 andNo. 2012R1A1A2045919), the SRC Center forTopological Matter (No. 2011-0030046), the Max Planck
POSTECH/KOREA Research Initiative Program(No. 2011-0031558), the Brain Korea 21 PLUS Projectof Korea Government, and the MSIP of Korea(2015R1C1A1A01052411). It is also supported by IBS-R017-D1 and by Korea Research Institute of Standards andScience through the Metrology Research Center Program(No. 2015-15011069). A. A. is grateful to the Max PlanckInstitute for the Physics of Complex Systems (MPI-PKS)for the use of computer facilities.
*[email protected]†Present address: Center for Quantum Nanoscience, Institutefor Basic Science (IBS), Seoul 03760, Republic of Korea;Department of Physics, Ewha Womans University, Seoul03760, Republic of Korea.
[1] S. Tan et al., Nat. Mater. 12, 634 (2013).[2] J. J. Lee et al., Nature (London) 515, 245 (2014).[3] R. Peng et al., Nat. Commun. 5, 5044 (2014).[4] D.-H. Lee, Chin. Phys. B 24, 117405 (2015).[5] J.-F. Ge, Z.-L. Liu, C. Liu, C.-L. Gao, D. Qian, Q.-K. Xue,
Y. Liu, and J.-F. Jia, Nat. Mater. 14, 285 (2015).[6] S. Coh, D.-H. Lee, S. G. Louie, and M. L. Cohen, Phys. Rev.
B 93, 245138 (2016).[7] L. Rademaker, Y. Wang, T. Berlijn, and S. Johnston, New
J. Phys. 18, 022001 (2016).[8] X. Zhu, F. Han, G. Mu, P. Cheng, B. Shen, B. Zeng, and
H. -H. Wen, Phys. Rev. B 79, 220512 (2009).[9] G.-H. Cao et al. Phys. Rev. B 82, 104518 (2010).
[10] J. M. Ok et al., arXiv:1706.08157.[11] F. Hummel, Y. Su, A. Senyshyn, and D. Johrendt, Phys.
Rev. B 88, 144517 (2013).[12] T. Stürzer, C. Sturzer, and D. Johrendt, Phys. Status Solidi B
254, 1600417 (2017).[13] K. McElroy, J. Lee, J. A. Slezak, D. -H. Lee, H. Eisaki, S.
Uchida, J. C. Davis, Science 309, 1048 (2005).[14] Y. Kohsaka et al., Nature (London) 454, 1072 (2008).[15] J. A. Slezak, J. Lee, M. Wang, K. McElroy, K. Fujita, B. M.
Andersen, P. J. Hirschfeld, H. Eisaki, S. Uchida, and J. C.Davis, Proc. Natl. Acad. Sci. U.S.A. 105, 3203 (2008).
[16] J. Lee et al., Nature (London) 442, 546 (2006).[17] L. Shan et al., Phys. Rev. Lett. 108, 227002 (2012).[18] Z. Wang, H. Yang, D. Fang, B. Shen, Q.-H. Wang, L. Shan,
C. Zhang, P. Dai, and H.-H. Wen, Nat. Phys. 9, 42 (2013).[19] C.-L. Song, Y. -L. Wang, Y. -P. Jiang, Z. Li, L. Wang, K. He,
X. Chen, J. E. Hoffman, X. -C. Ma, and Q. -K. Xue, Phys.Rev. Lett. 112, 057002 (2014).
[20] X. Zhou, P. Cai, A. Wang, W. Ruan, C. Ye, X. Chen, Y. You,Z. -Y. Weng, and Y. Wang, Phys. Rev. Lett. 109, 037002(2012).
[21] P. Cai, X. Zhou, W. Ruan, A. Wang, X. Chen, D.-H. Lee,and Y. Wang, Nat. Commun. 4, 1596 (2013).
[22] See Supplemental Material at http://link.aps.org/supplemental/10.1103/PhysRevLett.119.107003 for details,which includes Refs. [23–34].
[23] J. P. Perdew and Y. Wang, Phys. Rev. B 45, 13244 (1992).[24] K. Koepernik and H. Eschrig, Phys. Rev. B 59, 1743 (1999).[25] H. Nakamura and M. Machida, Phys. Rev. B 82, 094503
(2010).
PRL 119, 107003 (2017) P HY S I CA L R EV I EW LE T T ER Sweek ending
8 SEPTEMBER 2017
107003-5

[26] S. Tatematsu, E. Satomi, Y. Kobayashi, and M. Sato, J. Phys.Soc. Jpn. 79, 123712 (2010).
[27] I. I. Mazin, Phys. Rev. B 81, 020507 (2010).[28] K.-W. Lee and W. E. Pickett, Europhys. Lett. 89, 57008
(2010).[29] G. Kresse and D. Joubert, Phys. Rev. B 59, 1758 (1999).[30] P. E. Blöchl, Phys. Rev. B 50, 17953 (1994).[31] J. P. Perdew, A. Ruzsinszky, G. I. Csonka, O. A. Vydrov,
G. E. Scuseria, L. A. Constantin, X. Zhou, and K. Burke,Phys. Rev. Lett. 100, 136406 (2008).
[32] A. Togo and I. Tanaka, Scr. Mater. 108, 1 (2015).[33] J. Teyssier, R. Viennois, E. Giannini, R. M. Eremina, A.
Günther, J. Deisenhofer,M. V. Eremin, andD. van derMarel,Phys. Rev. B 84, 205130 (2011).
[34] S. Choi et al., arXiv:1707.01191.[35] C.-L. Song et al., Science 332, 1410 (2011).[36] M. P. Allan, A.W. Rost, A. P. Mackenzie, Y. Xie, J. C.
Davis, K. Kihou, C. H. Lee, A. Iyo, H. Eisaki, and T.-M.Chuang, Science 336, 563 (2012).
[37] S. Kasahara et al., Proc. Natl. Acad. Sci. U.S.A. 111, 16309(2014).
[38] D. Huang, C. -L. Song, T. A. Webb, S. Fang, C. -Z. Chang,J. S. Moodera, E. Kaxiras, and J. E. Hoffman, Phys. Rev.Lett. 115, 017002 (2015).
[39] Y. Kohsaka et al., Science 315, 1380 (2007).[40] J. Kim, H. Nam, G. Li, A. B. Karki, Z. Wang, Y. Zhu, C.-K.
Shih, J. Zhang, R. Jin, and E.W. Plummer, Sci. Rep. 6,35365 (2016).
[41] T. Qian et al., Phys. Rev. B 83, 140513 (2011).[42] Y. K. Kim et al. Phys. Rev. B 92, 041116(R) (2015).[43] F. Chen et al., Phys. Rev. X 1, 021020 (2011).[44] X. P. Shen et al., Phys. Rev. B 88, 115124 (2013).[45] Y. Wang, K. Nakatsukasa, L. Rademaker, T. Berlijn, and
S. Johnston, Supercond. Sci. Technol. 29, 054009 (2016).[46] S. N. Rebec, T. Jia, C. Zhang, M. Hashimoto, D. -H. Lu,
R. G. Moore, and Z. -X. Shen, Phys. Rev. Lett. 118, 067002(2017).
[47] S. Chi et al., Nat. Commun. 8, 15996 (2017).[48] E.W. Hudson, K. M. Lang, V. Madhavan, S. H. Pan, H.
Eisaki, S. Uchida, and J. C. Davis, Nature (London) 411,920 (2001).
PRL 119, 107003 (2017) P HY S I CA L R EV I EW LE T T ER Sweek ending
8 SEPTEMBER 2017
107003-6