correlation between viscoelastic and mechanical properties
TRANSCRIPT
CORRELATION BETWEEN VISCOELASTIC AND MECHANICAL PROPERTIES FOR AN OUT-OF-AUTOCLAVE
POLYMER COMPOSITE
C. Gernaat, S. Alavi-Soltani, M. Guzman, A. Rodriguez, B. Minaie* Department of Mechanical Engineering
Wichita State University Wichita, KS 67260
*Corresponding author: [email protected], (316) 978-5613
J. Welch Spirit AeroSystems Wichita, KS 67210
ABSTRACT
This paper presents correlation between viscoelastic and mechanical properties for an out-of-autoclave polymer composite (Cycom 5215 PW) which is mainly used for repair applications. The viscoelastic properties of the prepreg were obtained using an Encapsulated Sample Rheometer (ESR). The viscoelastic properties that were used for correlation include glass transition temperature (Tg), and storage modulus. The mechanical properties of interest were compressive strength, compressive modulus and compressive Poisson’s ratio obtained using the combined loading compression (CLC) test. It was found that the highly resin dominated compressive strength showed a very strong relationship to the nearly constant portion of the storage modulus after curing is complete. Compressive strength showed a weaker relationship with Tg.
1. INTRODUCTION
With an ever growing fleet of commercial airplanes utilizing composite structures, it is increasingly important to develop cost-effective and robust repair procedures. Issues invariably occur during on-site repair which casts doubt on the structural suitability of the part. This makes the ability to quantify the relationship between dwell temperature, cure state, and mechanical properties extremely important. Current method states that cure must be very precise to ensure structural integrity. As such, any repair with thermocouple readings outside a very narrow band must be reworked at substantial cost. Often, when rejected repair materials are tested, they are found to be structurally sound. The search for a solution to this problem has been the motivation for this study. Rheometer testing quantifies the viscoelastic properties of the composite material as it cures. This ex-situ approach allows a very detailed and accurate view of cure state properties. These properties include glass transition temperature (Tg), gel time, vitrification time, G' (storage modulus), G'' (loss modulus), and Tanδ (G''/G'). To measure resin dominated properties of the cured prepreg, combined loading compression (CLC) test was performed. CLC is rapidly becoming the standard among industry composite testing experts. The simple and inexpensive

coupon preparation along with the ability to adjust the percent end loading to reduce unacceptable end crushing failures make it a very reliable test [1]. CLC also allows modulus, strength, and Poisson’s ratio values to be determined using strain gauges. This study showed a strong correlation between viscoelastic properties and resin-dominated mechanical properties of the prepreg. As such, the rheometer has a potential to be used for evaluating the quality of the prepregs. The viscoelastic behavior can be mathematically modeled using theoretical and experimental means [2-3]. A typical viscoelastic behavior is followed by irreversible degradation reactions, which is exhibited by the increasing storage modulus and loss modulus peak [4-6]. Storage modulus is very similar to the shear modulus (G), but due to its dynamic nature will not have the same value. The loss modulus signifies losses due to the heat and viscous losses during the stress/strain cycle. These terms can also be combined to form a complex dynamic modulus G* as shown in the following equation [7]: G*= G'+i G'' [1]
where G* is the complex dynamic modulus, G' is the storage modulus and G'' is the loss modulus. These properties are related to the dynamic viscosity by the following equation [7]: (G'+i G'')/(2iπf)=η'-iη'' [2]
where f is the frequency of rheometer oscillation in Hz, 1−=i , η' is the dynamic viscosity and η'' is the imaginary part of the viscosity.
2. EXPERIMENTAL STUDIES 2.1. Material A commercial prepreg manufactured by Cytec was used in this study. Cycom 5215 PW is a 127oC curing toughened epoxy resin reinforced by plain weave (PW) carbon fiber and design for out-of-autoclave curing. This prepreg is mainly used for repair, tooling and structural applications. 2.2. Mechanical Testing In order to obtain mechanical properties, combined loading compression (CLC) test was performed on specimens from five panels cured at 11˚C dwell temperature increments from 82˚C to 127˚C. Table 1 shows the cure profile for each panel. Panel lay-up placed all plies at 0 degree orientation. Lay-up order of the vacuum bagging materials turned out to be of critical importance in producing an acceptable panel. The panel lay-up is shown in Figure 1. This lay-up is known as a no-bleed system as it fully encapsulates the laminate with non-porous release film which prevents resin from bleeding out of the panel and causing excessive voids. It is similar to the lay-up suggested in ASTM standard D5687 with the exception that a separate resin dam for further prevention of resin bleed was not used [8]. This lay-up proved to be highly successful and produced panels with a glass-like finish and no visible surface voids. The panels were then cut into coupons and tested according to ASTM D6641 for CLC test. Industry experience and

ASTM guidance suggest that CLC test which combines shear and compression loading is more appropriate for stranded fiber material than a pure compression test such as ASTM D695 which is more appropriate for testing unreinforced plastics and adhesives [9-11].
Table 1. Cure cycles for 5215 PW panels.
Panel Number Ramp Up (oC/min)
Dwell Temperature
(C)
Dwell Time (min)
Ramp Down
(oC/min) 1 2.2 127 120 0.6 2 2.2 116 120 0.6 3 2.2 104 120 0.6 4 2.2 93 120 0.6 5 2.2 82 120 0.6
Figure 1. Layup for 5215 PW Panels.
2.3. Shear Rheometery Testing To obtain viscoelastic properties of 5215 PW, rheometer samples were cured using the same temperature profiles that were used for curing the panels. Each cure profile was followed by the glass transition temperature test recommended by the Suppliers of Advanced Composite Materials Association (SACMA) [12]. Rheology experiments were carried out using the ATD CSS 2000 rheometer with 41.3 mm diameter parallel plates. The ATD’s plates are designed with grooves to prevent slippage of the sample at high torque. There are a total of 20 ridges on each side of the sample with the height of 0.25 mm which are equally spaced and arranged in a radial fashion. The width of the ridges is 1.5 mm, and the length is 15 mm. The thickness of samples used in this study is 2.5 mm. Because of high pressure (2000-4000 KPa) that can be provided by the ATD on the sample, the rheometer is capable of producing consistent laminates with high quality similar to the autoclave or vacuum bag manufactured parts. The rheometer experiments
Vacuum Bag
Aluminum Mold
Vacuum Attachment
Vacuum Seal
2 Mil FEP Release Film
Caul Plate
Laminate
Cloth Bleeder

were conducted at 1 Hz frequency to obtain the rheological properties. A constant strain of 0.05 degrees was used. For rheometer tests, the samples of the prepreg were prepared using 16 plies with a constant weight of 5.6 gr. In order to achieve consistent results, the volume of the samples was kept constant for all the laminates.
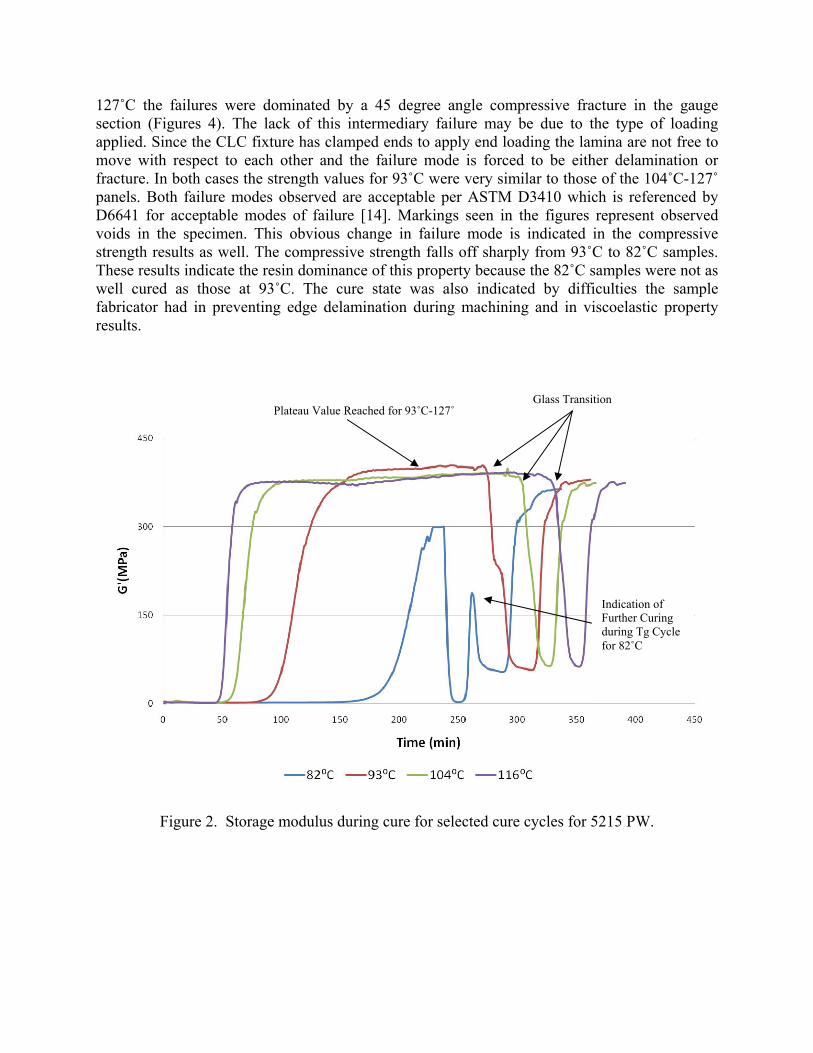
3. RESULTS 3.1. Experimental Results 3.1.1. Storage Modulus (G') G' gives an indication of state of cure and the final stiffness of the cured sample. When G' from multiple cure cycles are graphed together observations can be made relating to possible values to use for correlation. While the plateau value indicating completion of cure was relatively stable, it was not achieved for all specimens and therefore was not ideal for correlation. Instead, the final G' of the cured sample was chosen for correlation with mechanical properties. A peak during the Tg portion of the cure cycle in 82˚C specimen data indicates that further curing occurs. The final G' of the cured samples for different cure cycles is summarized in Table 2 and Figure 2. As it can be seen, G' value shows a drop off at 82˚C. 3.1.2. Glass Transition Temperature (Tg) Tg represents the temperature at which the material state changes from a brittle, glassy solid to either a rubbery elastomeric or a viscous fluid. Glass transition temperature is a good candidate for correlation with mechanical properties as it is highly dependent on the cure cycle and corresponds to an important physical property used in structural design. Tg was determined using G' data according to SACMA SRM18R-94. Table 3 and Figure 4 show the glass transition temperature data for different cure cycles. As the figure shows, Tg has a gradual increase in value as the dwell temperature increases. 3.1.3. Combined Loading Compression (CLC) Properties
Table 4 and Figure 5 show the compressive strength for different cure cycles. There was no statistically significant difference between the strength values for 93˚C-127˚C and a highly significant difference for 82˚C as seen in Table 4. CLC test results show the same type of drop off in properties at 82˚C. As such, CLC strength is an excellent candidate for correlation with final cured G'. The magnitude of compressive strength approaches the Cytec published value of 703 MPa [13] as seen in Table 4. The largest coefficient of variation (CV) occurred in the least cured samples. Compressive modulus data for different cure cycles is shown in Table 5 and Figure 6. Poisson’s ratio data is summarized in Table 6 and Figure 7. The values for compressive modulus and Poisson’s ratio showed no statistically significant difference from 82˚C-127˚C and therefore, cannot be used for correlation with final cured G' and Tg. CLC samples showed a definite change in failure mode based on cure temperature. At 82˚C all samples exhibited edge delamination failure (Figure 3). This indicates that the bond between lamina layers was insufficient to allow the force to be transferred to the fibers. From 93˚C to
127˚C the failures were dominated by a 45 degree angle compressive fracture in the gauge section (Figures 4). The lack of this intermediary failure may be due to the type of loading applied. Since the CLC fixture has clamped ends to apply end loading the lamina are not free to move with respect to each other and the failure mode is forced to be either delamination or fracture. In both cases the strength values for 93˚C were very similar to those of the 104˚C-127˚ panels. Both failure modes observed are acceptable per ASTM D3410 which is referenced by D6641 for acceptable modes of failure [14]. Markings seen in the figures represent observed voids in the specimen. This obvious change in failure mode is indicated in the compressive strength results as well. The compressive strength falls off sharply from 93˚C to 82˚C samples. These results indicate the resin dominance of this property because the 82˚C samples were not as well cured as those at 93˚C. The cure state was also indicated by difficulties the sample fabricator had in preventing edge delamination during machining and in viscoelastic property results.
Figure 2. Storage modulus during cure for selected cure cycles for 5215 PW.
Glass Transition Plateau Value Reached for 93˚C-127˚
Indication of Further Curing during Tg Cycle for 82˚C

Table 2. Final G' and normalized values for different cure cycles for 5215 PW.
Curing Temperature (oC)
Final G' (MPa) Normalized Final G'
127 373.1 0.926 116 388.3 0.963 104 403.0 1.000 93 402.0 0.998 82 299.7 0.744
Table 3. Tg and normalized values for different cure cycles for 5215 PW.
Curing Temperature (oC)
Tg (oC) Normalized Tg
127 130.9 1.000 116 126.3 0.965 104 111.3 0.851 93 90.9 0.695 82 38.5 0.294
Figure 3. Final G' of the cured samples for different cure cycles for 5215 PW.

Figure 4. Tg for different cure cycles for 5215 PW.
3.2. Correlation Results Correlation for all parameters followed the same procedure. First the average parameter data was found for each dwell temperature. Then the data was normalized using the highest average value of the parameter. Finally the normalized data for each viscoelastic parameter was graphed together with each mechanical property to get a qualitative visualization of similarities and trends. Compressive strength data showed a very similar trend to final G' of the cured sample. This was expected as both these properties are resin-dominated (see Figure 10). As such, the trends seen in their relationship to cure properties are similar. Once again G' showed the highest potential for direct correlation due to its very similar shape and magnitude. Glass transition temperature data did not exhibit the sharp drop off in properties (see Figure 11) and Tg values followed the cure temperature quite closely. This explains its more gradual drop in value. There was no acceptable correlation found for compressive modulus or Poisson’s ratio [3]. Since G' has close ties to shear modulus, it is the primary rheological parameter which is likely to show good predictive ability for mechanical properties. The portion of the G' value chosen was the value seen after the completion of the cure cycle and before the Tg determination cycle began. These values of G' represent the real part of the dynamic shear modulus for the cured solid sample. The agreement between G' and the resin-dominated properties of compression were excellent. There was no appropriate comparison for compressive modulus or compressive Poisson’s ratio. Compressive strength is a resin-dominated property. Compressive strength, showed a considerable percent reduction in value at 82˚C. The failure mode for all 82˚C samples was long edge delamination in the gauge area. This confirms the prediction from the rheometer

data that the laminate was not fully cured. Failure in all the remaining samples exhibited compressive fracture in the gauge section. The compressive modulus did not exhibit the same reduction at 82˚C seen in compressive strength. This has been reported in literature, but there is not a sufficient theoretical basis for this phenomenon (1). Compressive Poisson’s ratio also did not show a significant change in value with decrease in cure temperature. It did, however, show a sharp increase in variation at the 82˚C. Compressive modulus and compressive Poisson’s ratio do not show resin dependence akin to compressive strength. Glass transition temperature showed a gradual increase in value as the dwell temperature increased. The values of Tg produced from the three viscoelastic parameters (G', G'', and Tanδ) exhibit the range of temperatures over which the value of G' drops off sharply. These three values characterize the range of temperatures which define glass transition. Because of its gradual increase across the full range of dwell temperatures Tg is likely to be only moderately successful in predicting resin-dominated mechanical properties with Tg from tanδ showing most promise. Tg is not likely to be successful in predicting fiber-dominated properties.
Table 4. Compressive strength and normalized values for different cure cycles for 5215 PW.
Curing Temperature (oC)
compressive Strength (MPa)
Normalized compressive
Strength
Coefficient of Variation
(CV) 127 664.0 0.940 5.52 116 697.6 0.987 5.69 104 691.9 0.979 3.39 93 706.4 1.000 1.22 82 191.0 0.270 18.97

Figure 5. Compressive strength for different cure cycles for 5215 PW.
Figure 6. Compressive modulus for different cure cycles for 5215 PW.

Figure 7. Compressive Poisson’s Ratio for different cure cycles for 5215 PW.
Table 5. Compressive modulus and normalized values for different cure cycles for 5215 PW.
Curing Temperature (oC)
Compressive Modulus (GPa)
Normalized Compressive
Modulus
Coefficient of Variation
(CV) 127 59.8 0.972 2.01 116 61.6 1.000 1.61 104 61.1 0.992 0.47 93 60.8 0.988 1.24 82 60.0 0.975 0.74
Table 6. Compressive Poisson’s Ratio and normalized values for different cure cycles for 5215 PW.
Curing Temperature (oC)
Compressive Poisson’s Ratio
Normalized Compressive
Poisson’s Ratio
Coefficient of Variation
(CV) 127 0.056 0.875 5.55 116 0.054 0.844 8.42 104 0.064 1.000 11.03 93 0.060 0.938 4.17 82 0.048 0.750 27.36

Figure 8. Compressive failure modes for specimens cured at 82˚C for 5215 PW.
Figure 9. Compressive failure modes for specimens cured at 127˚C for 5215 PW.

Figure 10. Normalized compressive properties and final G' for 5215 PW.
Figure 11. Normalized Compressive properties and Tg for 5215 PW.

4. CONCLUSIONS
The work presented herein represents a step forward in understanding the relationship between viscoelastic and mechanical properties of a thermoset prepreg composite. The viscoelastic properties of the prepreg, final storage modulus and glass transition temperature of the cured sample, were obtained using an Encapsulated Sample Rheometer (ESR). Combined loading compression (CLC) test which is rapidly becoming the standard among composite testing experts was performed to obtain compressive strength, compressive modulus and compressive Poisson’s ratio of the cured specimens. It was found that the highly resin dominated compressive strength showed a very strong relationship to the storage modulus after curing is complete. Compressive strength showed a weaker relationship with Tg. Overall, this study showed that for a relatively wide temperature range of dwell temperatures (45˚C) the mechanical and rheological properties showed no statistically significant difference. This lends credibility to the anecdotal evidence gathered in composite repairs showing that material rejected due to temperature variations still show acceptable mechanical properties.
5. REFERENCES
1. Adams, D., "Current compression test methods." High Performance Composites, May
2005. 2. Alavi-Soltani, S., Sabzevari, S., Mousavi, A. and Minaie, B., "Modeling of Gelation and
Vitrification Points for Polymer Composites Using Shear Rheometry," International SAMPE Symposium and Exhibition (Proceedings), (2009).
3. Gernaat, C., "Correlation between Rheological and Mechanical Properties in a Low-Temperature Cure Prepreg Composite," M.S. Thesis, Department of Mechanical Engineering, Wichita State University, (2008).
4. Menard, K. Dynamic Mechanical Analysis: A Practical Introduction. CRC Press, (1997). 5. Sia. T.F., Liu, X.L, Chiu, W.K., and Pato, R. "Glass Transition and Viscoelastic Behavior
of Partially Cured Composites," Composite Structures 57 (2002): 489-493. 6. Bosze, E.J., Alawar, A., Bertscher, O., Tsai, Yun-i., and Nutt, S.R., "High Temperature
Strength and Storage Modulus in Unidirectional Hybrid Composites," University of Southern California Composites Center, 2006.
7. Ferry, J.D. Viscoelastic Properties of Polymers. John Wiley & Sons, (1980). 8. "Standard Guide for Preparation of Flat Composite Panels with Processing Guidelines for
Specimen Preparation," ASTM Standard: D5687/D5687M-95. 9. Lackey, E., Vaughan, J., Gupta, S., Rawls, S., and Wimbrow, W., "Comparison of
Compression Test Methods for Pultruded Composites," Composites and Polycon American Composites Manufacturers Association, 2007.
10. "Standard Test Method for Determining the Compressive Properties of Polymer Matrix Composite Laminates Using a Combined Loading Compression (CLC) Test Fixture," ASTM Standard: D6641/D6641M-01.
11. "Standard Guide for Testing Polymer Matrix Composite Materials," ASTM Standard: D4762-04.
12. "Glass Transition Temperature (Tg) Determination by DMA of Oriented Fiber-Resin Composites" SACMA Test Standard: SRM 18R-94.
13. Cytec Corporation, CYCOM 5215 Technical Datasheet, 2002.

14. "Standard Test Method for Compressive Properties of Polymer Matrix Composite Materials with Unsupported Gage Section by Shear Loading," ASTM Standard: D3410/D3410M-03.